Embed Size (px)
Citation preview

Rapid Assessment of Knowledge Attitude
and Practice (KABP) on Continuum of Care
For
UNICEF
By:
State Institute of Health and Family Welfare, Jaipur
(An ISO 9001: 2008 Certified Institution)

SIHFW: an ISO:9001:2008certif ied institution
KABP on continuum of care: Rapid Assessment: Oct 2009
Contents
Sl. No. Contents Page No.
1. Acronyms i
2. Definitions iii
3. Introduction 1
4. The Study
a. Scope of Work 6
b. Objectives 6
5. The Approach
a. Approach 8
b. Study Tools 9
c. Sample Size 9
6. Review of Literature 11
7. Observations 20
8. Recommendations 87
SIHFW: an ISO:9001:2008certif ied institution
KABP on continuum of care: Rapid Assessment: Oct 2009
i
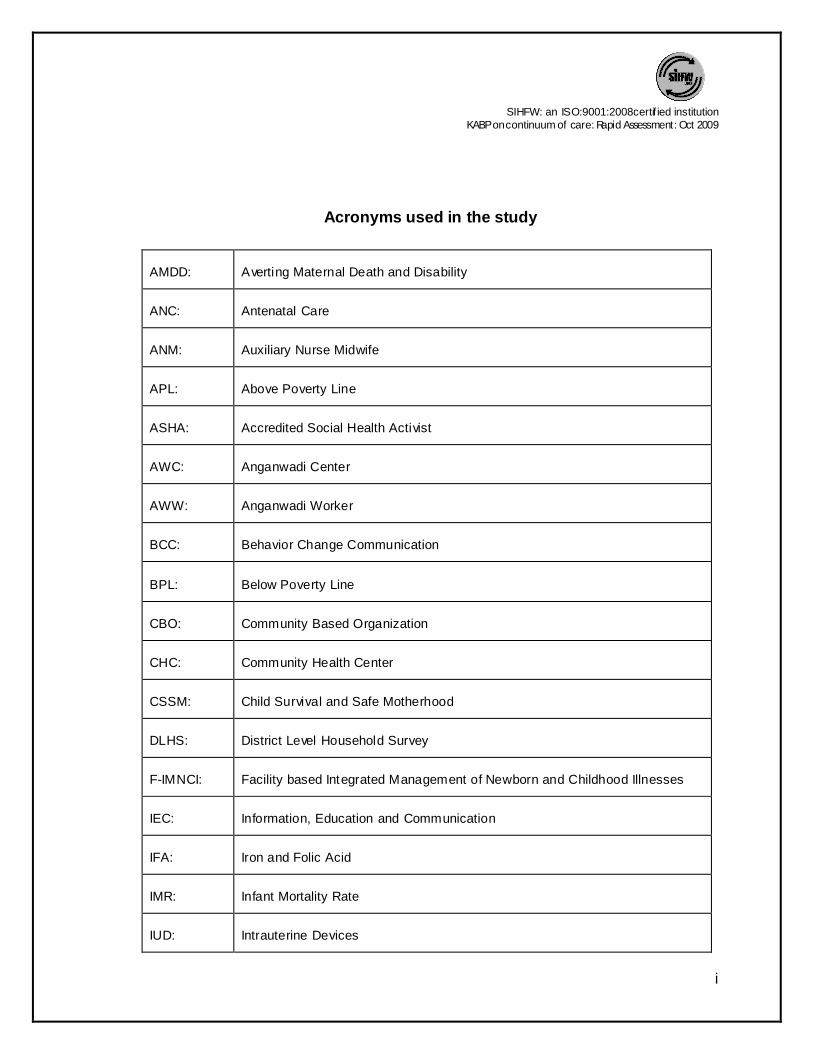
Acronyms used in the study
AMDD: Averting Maternal Death and Disability
ANC: Antenatal Care
ANM: Auxiliary Nurse Midwife
APL: Above Poverty Line
ASHA: Accredited Social Health Activist
AWC: Anganwadi Center
AWW: Anganwadi Worker
BCC: Behavior Change Communication
BPL: Below Poverty Line
CBO: Community Based Organization
CHC: Community Health Center
CSSM: Child Survival and Safe Motherhood
DLHS: District Level Household Survey
F-IMNCI: Facility based Integrated Management of Newborn and Childhood Illnesses
IEC: Information, Education and Communication
IFA: Iron and Folic Acid
IMR: Infant Mortality Rate
IUD: Intrauterine Devices

SIHFW: an ISO:9001:2008certif ied institution
KABP on continuum of care: Rapid Assessment: Oct 2009
ii
IUGR: Intrauterine Growth Retardation
JSY: Janani Suraksha Yojana
LBW: Low Birth Weight
LM: Lactating Mother
MGP: Multi Gravida Pregnant
MIL: Mothers-in-law
MMR: Maternal Mortality Ratio
NFHS: National Family Health Survey
OBC: Other Backward Class
PGP: Primi Gravida Pregnant
PHC: Primary Health Center
PMNCH: Partnership for Maternal, Newborn, and Child Health
PNC: Post Natal Care
PPH: Post-Partum Hemorrhage
PW: Pregnant Woman
SC: Scheduled Caste
SRS: Sample Registration Survey
ST: Scheduled Tribe
TT: Tetanus Toxoid

SIHFW: an ISO:9001:2008certif ied institution
KABP on continuum of care: Rapid Assessment: Oct 2009
iii
Definitions
ASHA: are community health workers instituted by the Government of India's Ministry of Health
and Family Welfare (MoHFW) as part of the National Rural Health Mission (NRHM)
BCC: is the process by which information and skills are shared and disseminated to people in
the specific target audience with the intention of influencing them to adopt sustained
changes in sexual behavior or attitude or to engage in other health seeking behavior.
Behavior Change Communication is a process of working with individuals, communities
and societies to develop communication strategies to promote positive behaviors which
are appropriate to their settings and provide a supportive environment which will enable
people to initiate and sustain positive behaviors.
CBO: a local organization within a community that provides various services to people
DLHS: District Level Household Survey is one of largest ever demographic & Health surveys
covering all the districts of the country. It was initiated in 1997 and provide district level
estimates on health indicators to assist policy makers program administrators in
decentralized planning, monitoring and evaluation. DLHS conducted in DLHS-3 (2007-
08), DLHS-2 (2002-04), DLHS-1 (1998-99)
IEC: Information, education and communication (IEC) combines strategies, approaches and
methods that enable individuals, families, groups, organizations and communities to play
active roles in achieving, protecting and sustaining their own health. It is a process of
working with individuals, communities and societies to develop communication strategies
to promote positive behaviors which are appropriate to their settings.
IMR: The ratio of the number of deaths among children less than one year old during a given
year to the number of live births during the same year.
IUD: An Intrauterine Device (IUD) is a small object that is inserted through the cervix and
placed in the uterus to prevent pregnancy. A small string hangs down from the IUD into
the upper part of the vagina.
JSY: is a centrally sponsored scheme aimed at reducing maternal and infant mortality rates
and increasing institutional deliveries in below poverty line (BPL) families.

SIHFW: an ISO:9001:2008certif ied institution
KABP on continuum of care: Rapid Assessment: Oct 2009
iv
LM: Lactation is the medical term for breast feeding, natural methods of feeding an infant from
birth to the time he or she can eat solid food. Lactation period refers to the duration when
the mother breastfeeds her child
MGP: Multigravida` is a woman who has been pregnant more than one time. The births may
have been interrupted by abortion, fetal death, or may have resulted in a live birth.
MMR: Is the ratio of maternal deaths per 100,000 live births
NFHS: The National Family Health Survey (NFHS) is a large-scale, multi-round survey
conducted in a representative sample of households throughout India. Three rounds of
the survey have been conducted since the first survey in 1992-93.
PGW: A woman in her first pregnancy.
Poverty Line: poverty line, is the minimum level of income deemed necessary to achieve an
adequate standard of living in a given country
PPH: excessive vaginal bleeding (blood loss greater than 500 ml) within 24 hours after delivery.
SC/ST/OBC: The Central Government of India classifies some of its citizens based on their social
and economic condition as Scheduled Caste, Scheduled Tribe and Other Backward
Class
SRS: Sample Registration Survey is a dual reporting system which provides the annual
estimates of birth, death rate, Infant mortality rate, total fertility rate, maternal mortality
rate & other measures of fertility and mortality. It is one of the largest continuous
demographic household sample survey in the world and initiated in 1964-65.

SIHFW: an ISO:9001:2008certif ied institution
KABP on continuum of care: Rapid Assessment: Oct 2009
1
Introduction

SIHFW: an ISO:9001:2008certif ied institution
KABP on continuum of care: Rapid Assessment: Oct 2009
2
Introduction
The global community declared a commitment to “create an environment—at the country and
global levels alike—which is conducive to development and to the elimination of poverty”. This
declaration led to an agreement on eight goals in key areas of global concern: the Millennium
Development Goals.
Goal No. 4 and 5 aims to reduce maternal and child mortality. Investment in maternal,
newborn, and child health is not only a priority for saving lives, but is also critical to advancing
other goals related to human welfare, equity, and poverty reduction. The Universal Declaration of
Human Rights, ratified on December 10, 1948, states that “motherhood and childhood are entitled
to special care and assistance”. The Convention on the Rights of the Child, rati fied in 1989,
guarantees right to children for the highest attainable standard of health. Other conventions and
international consensus documents focus on redressing the gender-based discrimination that
might undermine good health, particularly that of girls and women.
Over the years the health care delivery system of Rajasthan got strengthened in terms of
availability of infrastructure which has created easy access to health care facilities down to the
village level. The efforts are visible in the data related to maternal mortality, infant mortality,
exclusive breast-feeding and immunization, but the progress has been relatively slow. Rajasthan
has trailed in many health care indicators such as, maternal mortality (388 per 100,000 live births,
SRS, 2006), infant mortality rate (63 per 1000 live births in 2008, SRS). Even the exclusive
breast-feeding practices and full immunization figures are not very encouraging. Only 65.5% of
women exclusively breast feed their children between 0-5 months of age (DLHS-3) and 48.8% of
the children are fully immunized (DLHS-3).
Besides the government efforts, much can be done at the family and community level to save the
lives of children and help them to lead a healthy life. That could happen only when people are in
knowledge of and practice also the interventions that have a positive effect on life particularly in
formative years and during the physiological processes.
The continuum of care has become a rallying call to reduce the yearly toll of half a million
maternal deaths, 4 million neonatal deaths, and 6 million child deaths. The continuum for
maternal, newborn, and child health usually refers to continuity of individual care and is critical
throughout the lifecycle (adolescence, pregnancy, childbirth, the postnatal period, and childhood)
and also between places of care giving (including households and communities, outpatient and
outreach services, and clinical-care settings).

SIHFW: an ISO:9001:2008certif ied institution
KABP on continuum of care: Rapid Assessment: Oct 2009
3
The term continuum of care was initially applied in the 1970s to the integration of research and
practice for provision of a continuum of care for elderly people. Historically, maternal, newborn,
and child health policies and programs have generally functioned in isolation—targeting
interventions to only one group at a time and ignoring linking between ages and groups. But, the
whole equals more than the sum of its parts. Linking interventions in packages could save millions
of lives at a lower cost than compartmentalized initiatives by allowing for greater efficiency in
training, monitoring and supervision, and use of resources.
“Continuum” can be de ned over the dimension of time (throughout the lifecycle), and over the
dimension of place or level of care. This expression has two meanings. First it means care has to
be provided as a continuum throughout the li fecycle, including adolescence, pregnancy, childbirth
and childhood. Second it indicates that care has to be provided in a seamless continuum that
spans the home, the community, the health center and the hospital
"The maternal-newborn-child health continuum of care is an approach to healthcare that has great
potential to save thousands of lives each year by catching those who used to fall through the gaps
and by more effectively using scarce resources," says Erin Sines, a policy analyst at the
Population Reference Bureau and lead author of a Saving Newborn Lives policy brief entitled The
Maternal-Newborn-Child Health Continuum of Care: A Collective Effort to Save Lives.
The approach is based on the assumption that the health care of mothers, newborns, and
children are tightly linked. In developing countries, if a mother dies at childbirth, her newborn will
almost certainly die as well. And her older children are more likely to suffer from disease.
The continuum of care over time includes care before pregnancy (including family-planning
services, education, and empowerment for adolescent girls) and during pregnancy. During
childbirth and the days immediately afterwards, mothers and babies are at highest risk of death;
over half of all maternal and neonatal deaths occur during this period. Of the estimated 3.2 million
stillbirths every year, 30% occur during childbirth, yet even now, every year 50 million women
deliver at home.
The continuum of care approach is based on the assumption that the health care of mothers,
newborns, and children are tightly linked. In developing countries, if a mother dies in childbirth,
her newborn will almost certainly die as well. And her older children are more likely to suffer from
disease.
Universal coverage of 16 proven newborn health interventions could avert up to 72 percent of all
newborn deaths, according to the Bellagio Study Group on Child Survival. These interventions
include skilled attendants at birth; access to emergency obstetric care; immediate and exclusive
breastfeeding; keeping the newborn warm, and if needed, resuscitated; care of low birth-weight

SIHFW: an ISO:9001:2008certif ied institution
KABP on continuum of care: Rapid Assessment: Oct 2009
4
infants; and treatment of infection. An estimated 63 percent of child mortality would be prevented
with 99 percent coverage of effective and available interventions.
Mothers could also potentially fare much better. The World Bank has estimated that 74 percent of
maternal deaths could be averted if all women had access to interventions that address
complications of pregnancy and childbirth, especially emergency obstetric care.
The Continuum of Care recognizes that safe childbirth is critical to the health of both the woman
and the newborn child—and that a healthy start in life is an essential step towards a sound
childhood and a productive li fe.
Dimensions and importance of the Continuum of Care
1. Time - pre-pregnancy, through pregnancy, childbirth, and the early days and years of life
2. Place - linking the various levels of home, community, and health facilities
Linking interventions in this way is important because it can reduce costs by allowing greater
efficiency, increase uptake and provide opportunities for promoting related healthcare elements
(e.g. postpartum/postnatal and newborn care).
Gaps in the Continuum of Care
1. Family planning services: Only one third of women in the 68 priority countries are using
a modern contraceptive method.
2. Skilled care during childbirth and the postnatal period: Only around half of women
benefit from a skilled birth attendant at the time of birth, though this is the riskiest period for
mother and infant. Care during the critical postnatal period is even lower, an important
missing link in the continuum of care.
3. Clinical care for sick children: Only about one-third of children with pneumonia – the
biggest single killer of children – receive the right treatment.
To develop a better local understanding of the process of care and the inherent punctuations on
account of unawareness resulting in non-t ranslation of knowledge into palpable behavior at the
level of the community; Rajasthan State Office of UNICEF conceived the idea and SIHFW,
Rajasthan was assigned to deliver.
The present study, as a result of the aforesaid, was undertaken by SIHFW in 5 UNICEF identified
districts of Rajasthan with a reasonable representation from desert, tribal and plains.

SIHFW: an ISO:9001:2008certif ied institution
KABP on continuum of care: Rapid Assessment: Oct 2009
5
The Study
SIHFW: an ISO:9001:2008certif ied institution
KABP on continuum of care: Rapid Assessment: Oct 2009
6
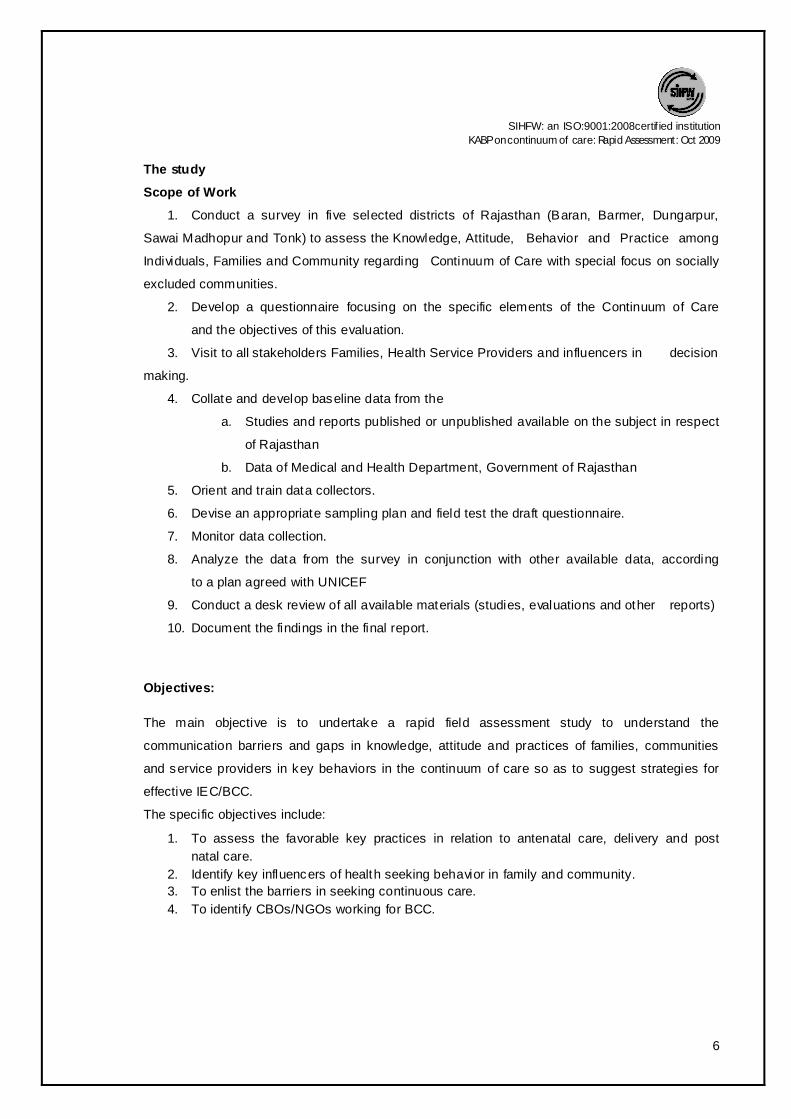
The study
Scope of Work
1. Conduct a survey in five selected districts of Rajasthan (Baran, Barmer, Dungarpur,
Sawai Madhopur and Tonk) to assess the Knowledge, Attitude, Behavior and Practice among
Individuals, Families and Community regarding Continuum of Care with special focus on socially
excluded communities.
2. Develop a questionnaire focusing on the specific elements of the Continuum of Care
and the objectives of this evaluation.
3. Visit to all stakeholders Families, Health Service Providers and influencers in decision
making.
4. Collate and develop baseline data from the
a. Studies and reports published or unpublished available on the subject in respect
of Rajasthan
b. Data of Medical and Health Department, Government of Rajasthan
5. Orient and train data collectors.
6. Devise an appropriate sampling plan and field test the draft questionnaire.
7. Monitor data collection.
8. Analyze the data from the survey in conjunction with other available data, according
to a plan agreed with UNICEF
9. Conduct a desk review of all available materials (studies, evaluations and other reports)
10. Document the findings in the final report.
Objectives:
The main objective is to undertake a rapid field assessment study to understand the
communication barriers and gaps in knowledge, attitude and practices of families, communities
and service providers in key behaviors in the continuum of care so as to suggest strategies for
effective IEC/BCC.
The specific objectives include:
1. To assess the favorable key practices in relation to antenatal care, delivery and post
natal care.
2. Identify key influencers of health seeking behavior in family and community.
3. To enlist the barriers in seeking continuous care.
4. To identify CBOs/NGOs working for BCC.

SIHFW: an ISO:9001:2008certif ied institution
KABP on continuum of care: Rapid Assessment: Oct 2009
7
The Approach
SIHFW: an ISO:9001:2008certif ied institution
KABP on continuum of care: Rapid Assessment: Oct 2009
8
The Approach:
With regard to the scope of work, a dialogue was initiated with UNICEF Representatives to
discuss & develop the mutual understanding on sample size, methodology to be adopted and
deliverables.
The approach was engineered around the following areas-
a. Desk review of the dossier, including ‘State of World Children 2009’, studies on
Continuum Care and BCC, or KABP on Maternal and Child Health.
b. Development of study tools in consultation with client organization and referring to
scope of work and deliverables.
c. Empanelment of Resource persons.
d. Enlistment of investigators.
e. Initiating dialogue with State and District officer.
f. Getting the relevant information dossier from UNICEF and Medical Directorate.
g. Orientation of Resource and Investigators.
h. Primary data collection.
i. Accessing and evaluating secondary data.
In consonance to the adopted approach a method mix was adhered for accomplishment of
objectives within the scope of work ascribed.
Based on documents received, reports obtained and available literature; study findings and
reports from various organizations were reviewed. Data from both published literature and a
number of unpublished studies, conference papers, annual reports were reviewed, particularly
State of World Children, Report on Averting Maternal Death and Disability (AMDD), study
conducted by Population Council- in Alwar district of Rajasthan titled -Making Pregnancy Safe for
Women in Rajasthan: Targeting the most vulnerable- and an study by S.K. Jain, Uma Chawla,
Neeru Gupta, R.S. Gupta, S.Venkatesh and Shiv Lal on Child Survival and Safe Motherhood
Program in Rajasthan National Institute of Communicable Diseases; and Division of Reproductive
Health and Nutrition, Indian Council of Medical Research, India were reviewed for reference.
Recent studies on Maternal Health: A Case Study of Rajasthan by Sharad D. Iyengar, Kirti
Iyengar, and Vikram Gupta by ARTH and a paper on Promoting Institutional Deliveries In Rural
India: The Role of Antenatal-Care Services K. S. Sugathan, Vinod Mishra, and Robert D.
Retherford was also consulted for the purpose.

SIHFW: an ISO:9001:2008certif ied institution
KABP on continuum of care: Rapid Assessment: Oct 2009
9
Report on National Family Health Survey (NFHS-3) for Rajasthan 2002-03; Census of India
Reports, DLHS-3, Rapid Household Survey under Reproductive and Child Health (RCH) Project
for Rajasthan 2004-05. Apart from these reports, various state government
publications/documents, i.e., Economic Review and annual reports of various years of
Department of Medical, Health and Family Welfare were also reviewed.
Online paper at www.the lancet.com vol.370 October 2007- Continuum of care for maternal,
newborn, and child health: from slogan to service delivery-Kate J Kerber, Joseph E de Graft-
Johnson, Zulfi qar A Bhutta, Pius Okong, Ann Starrs, Joy E Lawn, and a paper by Sandra Yin
Source: www.prb.com- A Continuum of Care to Catch Those Who Fall through the Cracks.
Study Tools
1. Questionnaire - In-depth interviews based on structured pre-tested questionnaire
Respondents
a. At Community level
· Pregnant Mothers
· Lactating Mothers
· Mothers-in-law
b. At institutional level
· ASHA
· AWW
· ANM
2. Desk Review of Data, studies and Documents
a. Review of secondary Data at Institutions –Sub center level and validation with primary
data
b. Behavior analysis based on primary information
Sample:
Following a strati fied sampling technique, five districts were covered for assessment – Baran,
Barmer, Dungarpur, Sawai Madhopur and Tonk.
From each district two CHCs were selected on the basis of performance (best and worst) in
relation to institutional deliveries.
From each CHC, two PHCs were selected and from each PHC two sub centers were selected,
one near the PHC and one far off from the PHC.
From each sub center 2 villages were selected. Selection of villages was based on the population
size, one with a population of less than 500 and the other Sub Center village. The village

SIHFW: an ISO:9001:2008certif ied institution
KABP on continuum of care: Rapid Assessment: Oct 2009
10
selection was done after team reached the concerned Sub Center. From each village in-depth
interviews with all the pregnant women, all lactating mothers with children less than one year and
their mothers-in-law were conducted. Influencers, such as the ANM of all the study sub centers,
ASHA and AWW of all the study villages were interviewed. The final sample details are as
follows:
Districts
Tonk Barmer Baran Dungarpur Sawai Madhopur
CHC (Worst)
CHC (Best)
gbE
PHC (Best)
gbE
PHC (Worst)
gbE
SC (Nearest)
gbE
SC (Farthest)
gbE
Sub center Village
Village Pop. <500

SIHFW: an ISO:9001:2008certif ied institution
KABP on continuum of care: Rapid Assessment: Oct 2009
11
Review of Literature

SIHFW: an ISO:9001:2008certif ied institution
KABP on continuum of care: Rapid Assessment: Oct 2009
12
Review of literature
According to Tinker A, more than 40% of pregnancies
in developing countries result in
complications, illness, or
permanent disability for the mother or child (Tinker A, Koblinsky MA.
Making motherhood safe. Washington, DC: World Bank, 1994. (World Bank discussion paper
202). More than 7 million newborn deaths are associated with maternal health- and nutrition-
related problems resulting from poorly managed pregnancies and deliveries or inadequate care of
the neonate soon after birth (World Health Organization. Coverage of maternity care: a listing of
available information. Geneva: World Health Organization, 1997. (WHO/RHT/MSM/96.28.)
Malnourished women (i.e., women who are short, are underweight, do not gain sufficient
weight
during pregnancy, or are anemic) are more likely to have miscarriages or stillbirths or to deliver
babies with intrauterine growth retardation (IUGR) or low birth weight (LBW; 18–20),
which are
linked, in turn, to increased risk of perinatal and infant mortality. Globally, 15.3% of all babies
are
born with LBW, >2.5 times more so in developing (16.4%) than in developed (6.2%) countries.
Severe anemia in pregnancy is believed to increase the risk of maternal mortality in childbirth
and
about half of the infants whose mothers have died do not survive to celebrate their fi fth birthday.
New approach that focuses on offering a "continuum of care" to reach those mothers, newborns,
and children in need is gaining momentum. Just as the household-to-hospital continuum of care is
designed to ensure a seamless arc that spans the home, community, health center, and hospital,
the maternal-newborn-child health continuum of care would manage the care of all in a more
unified way than in the past.
"The maternal-newborn-child health continuum of care is an approach to healthcare that has great
potential to save thousands of lives each year by catching those who used to fall through the gaps
and by more effectively using scarce resources," says Erin Sines, a policy analyst at the
Population Reference Bureau and lead author of a Saving Newborn Lives policy brief entitled The
Maternal-Newborn-Child Health Continuum of Care: A Collective Effort to Save Lives.
Historically, maternal, newborn, and child health policies and programs have generally functioned
in isolation—targeting interventions to only one group at a time and ignoring important
connections between groups. But the whole equals more than the sum of its parts. Linking
interventions in packages could save millions of lives at a lower cost than separate initiatives by
allowing for greater efficiency in training, monitoring and supervision, and use of resources.
Grouping interventions will also help families more easily access and take advantage of them.
The continuum of care approach is based on the assumption that the health care of mothers,
newborns, and children are tightly linked. In developing countries, if a mother dies in childbirth,
SIHFW: an ISO:9001:2008certif ied institution
KABP on continuum of care: Rapid Assessment: Oct 2009
13
her newborn will almost certainly die as well. And her older children are more likely to suffer from
disease.
In addition, when mothers are malnourished, ill, or receive inadequate care, their newborns face a
higher risk of disease and premature death. Nearly one in every four newborns in developing
countries is born with low birth weight—largely due to their mothers' poor health and nutritional
status, which makes infants more vulnerable to infection and puts them at higher risk of
developmental problems.
The new global Partnership for Maternal, Newborn, and Child Health (PMNCH) has adopted the
continuum of care approach as one of its guiding principles to improve the health and survival of
mothers, newborns, and children. Members include donor agencies, professional associations,
and academic institutions.
The government in India has added a newborn component to its existing integrated management
of childhood illness program. As part of the program, health workers and community nutrition and
child development workers visit newborns at home three times within the first 10 days. Workers
promote exclusive breastfeeding, early recognition of illness, and management of complications.
The continuum of care has become a rallying call to reduce the yearly toll of half a million
maternal deaths, 4 million neonatal deaths, and 6 million child deaths. The continuum for
maternal, newborn, and child health usually refers to continuity of individual care. Continuity of
care is necessary throughout the lifecycle (adolescence, pregnancy, childbirth, the postnatal
period, and childhood) and also between places of care giving (including households and
communities, outpatient and outreach services, and clinical-care settings).
The packages encompass three which are delivered through clinical care (reproductive health,
obstetric care, and care of sick newborn babies and children); four through outpatient and
outreach services (reproductive health, antenatal care, postnatal care and child health services);
and one through integrated family and community care throughout the li fecycle.
Mothers and babies are at high risk in the rst days after birth, and the lack of a de ned postnatal
care package is an important gap, which also contributes to discontinuity between maternal and
child health programs. Similarly, because the family and community package tends not to be
regarded as part of the health system, few countries have made systematic e orts to scale it up
or integrate it with other levels of care.
Building the continuum of care for maternal, newborn, and child health with these packages
will need e ectiveness trials in various settings; policy support for integration; investment to

SIHFW: an ISO:9001:2008certif ied institution
KABP on continuum of care: Rapid Assessment: Oct 2009
14
strengthen health systems; and results-based operational management, especially at district
level. Continuum of care for maternal, newborn, and child health: from slogan to
service delivery Kate J Kerber, Joseph E de Graft-Johnson, Zul qar A Bhutta, Pius Okong,
Ann Starrs, Joy E Lawn
As recently as in 2005–2006, almost two in three (66%) women in Rajasthan were married before
age 18 (of those aged 20–24, IIPS and Macro International 2008). Moreover, half (51%) of
currently married girls aged 15–19 years in the state had already begun childbearing.
Study Data are drawn from a cross-sectional study, comprising a survey and in-depth interviews,
conducted in 100 villages of four blocks, Bansur, Kishangarh, Rajgarh and Tijara, in Alwar district.
Respondents for the survey included:
(a) young women who had experienced a recent delivery, that is, during the two-and-a-half years
preceding the survey, and were aged below 20 years or between 25–29 years at the time of the
index delivery; and
(b) family members of young women who had died during delivery or within six weeks following
delivery due to maternal complications in the two-and-a-half years preceding the survey and were
aged below 20 years or between 25–29 years at the time of death.
(c) The study was conducted during May-October 2007. A total of 1,935 women or family
members of women who died of maternal complications were successfully interviewed. In
addition, a total 104 women or a family member in case of maternal death were interviewed in-
depth.
Findings indicate that pregnancy-related complications were common; indeed, almost three-
quarters of women had experienced at least one pregnancy-related complication. Specifically,
less than 1 percent of women had experienced death due to pregnancy-related complications;
half had experienced one or more severe complications; and almost three-fi fths had experienced
one or more non-severe complications.
39 percent of young adolescent mothers compared to 30 percent of adult mothers experienced
one or more severe complications during pregnancy; 11 percent compared to 7 percent
experienced severe complications during delivery; and 22 percent compared to 13 percent
experienced severe complications during the postpartum period.
Findings suggest that women belonging to scheduled tribes (predominantly Meena) were least
likely and Meo Muslim women were most likely to have experienced pregnancy-related
complications, particularly during pregnancy and the postpartum period. For example, while 28

SIHFW: an ISO:9001:2008certif ied institution
KABP on continuum of care: Rapid Assessment: Oct 2009
15
percent of scheduled tribe women reported at least one severe complication during pregnancy,
many more—50 percent—of Meo Muslim women so reported.
Pregnancy-related care was limited the study findings also underscore that maternal health care
seeking was limited among women in the study setting. Just half of women had received three or
more antenatal check-ups for the most recent birth, only about two-fifths (38%) had their most
recent delivery in a health facility and about one-quarter (24%) had received a postpartum check-
up.
Findings, moreover, indicate that outreach services tended to be weak, for example, as in the
case of postpartum services. Young adolescent mothers were more constrained than adult
mothers with regard to maternal health care seeking. They were less likely than adult mothers to
have had the recommended number of antenatal check-ups (43% versus 63%),
Experienced institutional delivery (31% versus 55%) or received a postpartum check-up (19%
versus 32%). Findings show that institutional deliveries did indeed increase following the
introduction of the Janani Suraksha Yojana scheme; however, young adolescent mothers were
much less likely to have benefited from the JSY scheme than other women.
Findings also indicate that maternal health care seeking was far more limited among Meo Muslim
women than others. For example, just 11 percent of Meo Muslim women compared to 41–54% of
others reported an institutional delivery. Making Pregnancy Safe for Women in Rajasthan:
Targeting the most vulnerable- study conducted by Population Council- in Alwar district of
Rajasthan
Less than one third (28.9%) of children, aged 12-23 months, were fully immunized with BCG, 3
DPT, 3 OPV and Measles vaccines; around a quarter (26.5%) had not received even a single
vaccine (non immunized), and little less than half (44.5%) were found partially immunized. Around
half of the eligible children were vaccinated for BCG (55.9%) and Measles (43.6%).
Though nearly two-third (66.8%) were covered with first dose of DPT and OPV, but about one
third of these children dropped out of third dose of DPT and OPV for various reasons. National
Family Health Survey (NFHS) data also had revealed that BCG coverage was 64.3%; measles
was 36.2%; and coverage by DPT 1, 2, 3 and Polio 1,2 and 3 were 64.4%, 57.0%, 46.6% and
77.5%, 71.1% and 54.4% respectively in rural areas.
The main reasons for drop-out or non immunization were “lack of information about the
immunization program” (41.3%). Though nearly all (more than 96%) of the children were
immunized through Government established centers, but immunization cards/documents were
made available only to 27.6% of children.

SIHFW: an ISO:9001:2008certif ied institution
KABP on continuum of care: Rapid Assessment: Oct 2009
16
The problem of low coverage and high drop-out rate of immunization could be overcome by
creating awareness of the program and relevance of 2nd and 3rd doses of DPT and polio
vaccines. Increasing community participation through intensive and extensive health education
campaign should also be undertaken. Since most of the deliveries were done at home under the
supervision of untrained midwives, training program as well as involving them in IEC activities
should be contemplated. (Indian J Pediatr 2006; 73 (1): 43-47) E-mail: [email protected]
This case study has used the results of a review of literature to understand the persistence of
poor maternal health in Rajasthan. The rate of reduction in Rajasthan’s maternal mortality ratio
(MMR) has been slow, and it has remained at 445 per 1000 live births in 2003.
Seventy-six percent of women (n=3,075) in the age-group of 20-49 years were married by the age
of 18 years, according to the National Family Health Survey. The literacy rate among currently
married rural women was 36.2% in 2005-2006.
Women’s autonomy has direct bearing on health care-seeking behaviour and healthcare-use. The
National Family Health Survey (NFHS) 2005-2006 revealed that 67% of women (n=3,892) did not
have access to money, and 52% of women had no say in whether they themselves could seek
healthcare. These indicators were more adverse in rural areas.
In another study on Maternal Health: A Case Study of Rajasthan by Sharad D. Iyengar et al.
referring to the period 2005-06 it was revealed that majority (66%) of women started receiving
ANC after the first trimester. The NFHS 3 showed that rural women were far less likely to receive
three ANC contacts (32%) compared to their urban counterparts (75%). Women with 10 or more
years of education were more likely to have had three antenatal care contacts (88%) compared to
illiterate women (29%) Government services were the major source of ANC, and nurse-midwives
or other health professionals were the primary care providers (39%). The proportion of women
receiving two or more tetanus injec tions has been increasing consistently over the last 15 years—
from 29% in 1992-1993 (NFHS 1) to 65% in 2005-2006 (NFHS 3). Supplements of iron and folic
acid (IFA) tablets reached 58% of women; however, only 13% consumed IFA tablets for 90 days
or more.
The proportion of women delivering in an institution rose steadily, reaching nearly one-third by
2005-2006 (NFHS 3) However, wide urban-rural differences remained, with nearly 70% of urban
women delivering in an institution while only 23% of rural women did so.
In 2005-2006, only 43% of births were attended by a health professional; urban women were
more than twice as likely to seek such assistance. Besides residence, determinants of use of
skilled attendance included younger age of women, a birth order of one, and the greater number
of ANC visits. 70 percent of women with more than four ANC visits were served by skilled
attendants during childbirth. More institutional deliveries were conducted in government facilities

SIHFW: an ISO:9001:2008certif ied institution
KABP on continuum of care: Rapid Assessment: Oct 2009
17
than in private facilities, although incremental growth in deliveries in the private sector was
greater. The proportion of women delivering in institutions changed rapidly following the national
introduction of a maternity benefit scheme called Janani Suraksha Yojana (literally meaning
“mothers’ protection plan”) or JSY.
Less than one-third of women received postnatal care within two days of birth (NFHS 3). Only
7.5% of women who delivered in the home received a postnatal check-up. 71 percent of those
who delivered in public-health facilities and 82% of those who delivered in private health facilities
had a postnatal check-up. Evidence from a qualitative study revealed that several women were
discharged very early from facilities after delivery, often within 2-3 hours, without any advice about
postnatal care or initiation of breastfeeding.
In 2005-2006, 47% of currently-married women in Rajasthan used a method of contraception—
seven percentage points more than in 1998 (NFHS 2). The increase was greater in urban areas
where 66% used contraception compared to only 41% in rural areas. Modern methods were used
by 44% of women. Female sterilization was the most widely-used method, accounting for 76% of
total current contraceptive-use only 10.2% of married women used reversible contraceptive
methods in 2005-2006, with the condom being the most widely-used (5.8%). Only 1.6% and 2%
of women used intrauterine devices (IUDs) and oral pills respectively.
While the majority of people use private health services in India, use of the private sector for
maternal health services has been low in Rajasthan. Only 18% of women used the private sector
for antenatal care and 25% for delivery care the private sector was used more often for abortion
services and for the treatment of reproductive health problems
Promoting Institutional Deliveries in Rural India: The Role of Antenatal-Care Services K. S.
Sugathan, Vinod Mishra, and Robert D. Retherford National Family Health Survey Subject Reports
Number 20 • December 2001
Data for this study are from India’s two National Family Health Surveys conducted in 1992–93
and 1998–99, respectively.
The analysis here is based on births during the three-year period before each survey to ever-
married women in the four states of Andhra Pradesh, Gujarat, Bihar, and Rajasthan. The NFHS-1
and NFHS-2 samples include, respectively, 1,412 and 1,129 such births in Andhra Pradesh;
1,499 and 1,324 births in Gujarat; 2,660 and 2,912 births in Bihar; and 2,197 and 3,076 births in
Rajasthan.
Place of delivery for births in the three years preceding NFHS-1 and NFHS-2 in the four states by
urban/rural residence. In all four states, the majority of deliveries take place at home (either own
home or parents’ home). In NFHS-2, the proportion delivering in medical institutions is highest in

SIHFW: an ISO:9001:2008certif ied institution
KABP on continuum of care: Rapid Assessment: Oct 2009
18
Andhra Pradesh (50 percent), followed by Gujarat (46 percent), Rajasthan (22 percent), and Bihar
(15 percent). In Andhra Pradesh, Gujarat, and Bihar, about three out of four deliveries in health
facili ties take place in private-sector health facilities. But the situation is reversed in Rajasthan,
where about three out of four deliveries in health facilities take place in public-sector health
facilities.
The likelihood of giving birth in a medical institution depends on many factors, including
urban/rural residence, mother’s demographic and socioeconomic characteristics, and availability
and quality of health services. The older mothers are somewhat less likely to give birth in a
medical institution than younger mothers. It also shows that first-order births to rural mothers are
much more likely to take place in a medical institution than second or higher-order births. In
NFHS-2 in Andhra Pradesh, for example, 53 percent of first-order births but only 24 percent of
fourth or higher-order births took place in medical institutions. In NFHS-2, Hindu mothers are
somewhat more likely than Muslim mothers to deliver in a medical institution in Bihar and
Rajasthan, but somewhat less likely to do so in Andhra Pradesh and Gujarat. In all four states,
rural mothers belonging to scheduled castes or scheduled t ribes are much less likely to give birth
in a medical institution than mothers not belonging to a scheduled caste or scheduled tribe.
In all four states, rural mothers who received antenatal care are several times more likely to
deliver in a medical institution than mothers who did not receive such care. Rural mothers who
received at least one antenatal check-up are six to nine times as likely to give birth in a medical
institution as mothers who did not receive an antenatal check-up in NFHS-1 and three to seven
times as likely in NFHS-2. Similarly, rural mothers who received two or more tetanus toxoid
injections are three to four times as likely to give birth in a medical institution as mothers who
received only one or no tetanus injection in NFHS-1 and two to three times as likely in NFHS-2.
As in the case of rural mothers, antenatal care is strongly associated with institutional delivery for
urban mothers. In all four states and in both surveys, urban mothers who received an antenatal
check-up are several times more likely to deliver in a medical institution than those who did not.
Mothers who received two or more tetanus toxoid injections are also more likely to deliver in a
medical institution than mothers who received one or no injection. Having received two or more
tetanus toxoid injections during pregnancy also has a positive effect on institutional delivery, but
this effect is much smaller than the effect of having had an antenatal check-up and, in NFHS-2,
not statistically significant in the full model.
The analysis indicates that, among rural mothers in Andhra Pradesh, Gujarat, Bihar, and
Rajasthan who gave birth during the 3-year periods before NFHS-1 and NFHS-2, the odds of
giving birth in a medical institution are two to five times higher for mothers who received at least
one antenatal check-up than for mothers who did not receive any antenatal check-up, after a
number of potentially confounding variables are controlled by holding them constant. The effect of

SIHFW: an ISO:9001:2008certif ied institution
KABP on continuum of care: Rapid Assessment: Oct 2009
19
tetanus toxoid vaccination on institutional delivery is usually positive but smaller and not always
be statistically significant when other variables are controlled.
Overall, the analysis indicates that receiving one or more antenatal check-ups is the strongest
predictor of institutional delivery. This finding has important program implications. It suggests that
it is possible to promote institutional delivery by expanding antenatal-care coverage and
associated counseling. Given that distance to a hospital does not have a significant effect on
institutional delivery, it may not be necessary to c reate new hospitals (at least not for the purpose
of encouraging institutional delivery), but rather to focus on expanding the availability and quality
of services at existing facilities, in addition to counseling and educating mothers about the
importance of giving birth in a medical institution under the supervision of trained professionals.
Since half or more of deliveries in all four states still occur at home, efforts to train traditional birth
attendants, increase the availability of trained midwives, promote home visits by paramedics for
antenatal check-ups, distribute iron and folic acid tablets, and vaccinate against tetanus should
continue.

SIHFW: an ISO:9001:2008certif ied institution
KABP on continuum of care: Rapid Assessment: Oct 2009
20
Observations

SIHFW: an ISO:9001:2008certif ied institution
KABP on continuum of care: Rapid Assessment: Oct 2009
21
General Information
Pursuant to the objectives, study was carried out to understand the communication barriers and
gaps in knowledge, attitude and practices of families, communities and service providers in key
behaviors in the continuum of care.
Table 1: Distribution of respondents
District
HH
surveyed Population
surveyed
Pregnant
Lactating
Mothers-
in-law
Service Provider
ANM ASHA AWW
Baran 465 15,352 136 274 266 9 13 16
Barmer 424 18,966 121 276 233 7 6 7
Dungarpur 458 19,359 117 310 174 8 10 4
S. Madhopur 355 22,673 155 209 159 8 10 11
Tonk 367 17,842 142 225 257 6 7 10
Total
2069 94,192 671 1294 1089
38 46 48
132
671 pregnant women, 1294 lactating mothers, 1089 mothers-in-law of pregnant & lactating
mothers and 132 service providers were interviewed in the field during the study period. The total
number of mothers-in-law does not match with the number of pregnant women and lactating
mothers as few of them were common to a pregnant woman as well as lactating mother in the
same family and some of the subjects did not have any mother-in-law.
Service providers as AWW, ASHA and ANM were contacted. As per the sample plan, it was
supposed to interview the same number of service providers from each district but could not be
adhered to for reasons including vacant positions, staff on leave and/or out of the station.
Table 2: Distribution of pregnant women according to period of pregnancy
Districts Responden
ts
Primi Gravida (trimester) Multi Gravida (trimester)
I II III Total I II III Total
Baran 136 7
(13.4)
14
(26.9)
31
(59.6)
52
(38.9)
7
(8.4)
31
(36.9)
46
(54.7)
83
(61.0)
Barmer 121 3
(12.0)
11
(44.0)
11
(44.0)
25
(20.6)
5
(5.2)
30
(31.5)
61
(63.5)
96
(79.3)
Dungarpur 117 3 (14.3)
6 (28.6)
12 (57.1)
21 17.9)
8 (8.3)
38 (39.6)
50 (52.0)
96 (82.1)
S. Madhopur 155 4
(8.9)
10
(22.3)
31
(68.8)
45
(29.0)
13
(11.8)
35
(31.8)
62
(56.3)
110
(70.9)
Tonk 142 4
(7.6)
13
(25.0)
35
(67.3)
52
(36.6)
11
(12.2)
29
( 32.2)
50
(55.5)
90
(62.7)
Total 671 21
(10.7)
54
(27.6)
120
(61.5)
195
(29.1)
44
(9.1)
163
(34.2)
269
(56.5)
476
(70.9)

SIHFW: an ISO:9001:2008certif ied institution
KABP on continuum of care: Rapid Assessment: Oct 2009
22
Out of the 195 (29.1% of 671)
women who were pregnant for the
first time 10.7% were in the first
trimester, 27.6% in the second and
61.5% in the third trimester at the
time of survey. From the 476 (70.9%)
multi gravida women 9.1% were in
the first trimester of pregnancy,
34.2% and 56.5% in the second and
third trimester respectively.
Table 3: Socio economic profile of pregnant women
Districts Respondents
Family Type Caste Category
Joint Nuclear SC ST OBC GEN. APL BPL Baran 136 103
(75.7) 33
(24.3) 25
(18.4) 45
(33.1) 62
(45.6) 4 (2.9) 100
(73.5) 36
(26.5) Barmer 121 97
(80.2) 24
(19.8) 17
(14.0) 3
(2.5) 101
(83.5) 0 (0.0) 78
(64.5) 43
(35.5) Dungarpur 117 79
(67.5) 38
(32.5) 4
(3.4) 83
(70.9) 22
(18.8) 8 (6.8) 37
(31.6) 80
(68.4) S. Madhopur
155 114 (73.5)
41 (26.5)
33 (21.3)
64 (41.3)
39 (25.2)
19 (12.3)
113 (72.9)
42 (27.1)
Tonk 142 119 (83.8)
23 (16.2)
41 (28.9)
22 (15.5)
68 (47.9)
11 (7.7)
87 (61.3)
55 (38.7)
Total 671 512 (76.3)
159 (23.7)
120 (17.9)
217 (32.3)
292 (43.5)
42 (6.3)
415 (61.8)
256 (38.2)
Table 4: Socio economic profile of lactating mothers
Districts Respondents
Family Type Caste Category
Joint Nuclear SC ST OBC GEN. APL BPL Baran 274 197
(71.9) 77
(28.1) 49
(17.9) 77
(28.1) 140
(51.1) 8
(2.9) 189
(69.0) 85
(31.0) Barmer 276 213
(77.2) 63
(22.8) 29
(10.5) 1
(0.4) 244
(88.4) 2
(0.7) 193
(69.9) 83
(30.1) Dungarpur 310 196
(63.2) 114
(36.8) 9
(2.9) 217
(70.0) 57
(18.4) 27
(8.7) 130
(41.9) 180
(58.1) S. Madhopur
209 155 (74.2)
54 (25.8)
41 (19.6)
80 (38.3)
67 (32.1)
21 (10.0)
154 (73.7)
55 (26.3)
Tonk 255 184 (81.8)
41 (18.2)
56 (24.9)
29 (12.9)
127 (56.4)
13 (5.8)
157 (69.8)
68 (30.2)
Total 1294 945 (73.0)
349 (27.0)
184 (14.2)
404 (31.2)
635 (49.1)
71 (5.5)
823 (63.6)
471 (36.4)
Of all the women interviewed, pregnant OBC women (43.5%) and lactating OBC mothers (49.1%)
constituted the major part of study universe; whereas general caste pregnant women and
lactating were 6.3% and 5.5% respectively.
0
10
20
30
40
50
60
70
I Trimester II Trimester III Trimester
11
28.5
60.5
9.1
33.9
56.9
Distribution of Pregnant women according to period of Pregnancy
Primi
Multi

SIHFW: an ISO:9001:2008certif ied institution
KABP on continuum of care: Rapid Assessment: Oct 2009
23
Maximum pregnant women from OBC category were found in Barmer (83.5%), Tonk (47.9%) and
Baran (45.6%), while ST category had maximum representation from Dungarpur (70.9%) & Sawai
Madhopur (41.3%).
There was no study subject in general category from Barmer.
APL respondents (61.8% PW and 63.6% LM) were far more than BPL (38.2% PW and 36.4%
lactating).
76.3% and 73% of pregnant women and Lactating mothers respectively were from joint families
while 23.7% of PW and 27% of lactating mothers belonged to nuclear family.
The maximum percentage of both pregnant & lactating living in joint families was found in Tonk
district and maximum percentage of the same living in nuclear families was found in Dungarpur.
Table 5: Distribution of pregnant women according to their current age and age at
marriage
District Responde
nts
Current Age Age at marriage
<20 20-30 30+ <20 20+
Baran 136 14 (10.3) 120 (88.2) 2 (1.5) 133 (97.8) 3 (2.2)
Barmer 121 19 (15.7) 92 (76.0) 10 (8.3) 114 (94.2) 7 (5.8)
Dungarpur 117 7 (6.0) 87 (74.4) 23 (19.7) 99 (84.6) 18 (15.3)
S. Madhopur 155 14 (9.0) 134 (86.5) 7 (4.5) 144 (92.9) 11 (7.1)
Tonk 142 24 (16.9) 103 (72.5) 15 (10.6) 137 (96.5) 5 (3.5)
Total 671 78 (11.6) 536 (79.9) 57 (8.5) 627 (93.4) 44 (6.6)
Table 6: Distribution of lactating mothers according to their current age and age at
marriage
District
Responde
nts
Current Age Age at marriage
<20 20-30 30+ <20 20+
Baran 274 13 (4.7) 246 (89.8) 15 (5.5) 262 (95.6) 12 (4.4)
Barmer 276 41 (14.9) 200 (72.5) 35 (12.7) 258 (93.4) 18 (6.5)
Dungarpur 310 18 (5.8) 222 (71.6) 70 (22.6) 256 (82.5) 54 (17.4)
S. Madhopur 209 12 (5.7) 181 (86.6) 16 (7.7) 191 (91.4) 18 (8.6)
Tonk 225 20 (8.9) 192 (85.3) 13 (5.8) 221 (98.2) 4 (1.8)
Total 1294 104 (8.0) 1041 (80.4) 149(11.5) 1188(91.8) 106 (8.2)
Overall 92.3% pregnant and lactating women got married below the age of 20. In all the districts,
except Dungarpur (84.6%-PW & 82.5%-LM) more than 90% women belonged to this group.

SIHFW: an ISO:9001:2008certif ied institution
KABP on continuum of care: Rapid Assessment: Oct 2009
24
Table 7: Education status of pregnant women & their spouse
District Respondents
Education status
Self Husband
Illiterate VIII VIII + Illiterate VIII VIII +
Baran 136 76 (55.9) 52 (38.2) 8 (5.9) 19 (14.0) 57 (41.9) 60 (44.1)
Barmer 121 99 (81.8) 21 (17.4) 1 (0.8) 58 (47.9) 47 (38.8) 16 (13.3)
Dungarpur 117 87 (74.4) 20 (17.1) 10 (8.5) 48 (41.0) 42 (35.9) 27 (23.1)
S. Madhopur
155 102 (65.8) 29 (18.7) 24 (15.5) 17 (11.0) 41 (26.5) 97 (62.6)
Tonk 142 94 (66.2) 43 (30.3) 5 (3.5) 41 (28.9) 47 (33.1) 54 (38.0)
Total 671 458 (68.3) 165 (24.6) 48 (7.2) 183(27.3) 234 (34.9) 254(37.8)
Table 8: Education status of lactating women & their spouse
District Respondents
Education status
Self Husband
Illiterate VIII VIII + Illiterate VIII VIII +
Baran 274 166(60.6) 92 (33.6) 16 (5.8) 45 (16.4) 128 (46.7) 101(36.9)
Barmer 276 213 (77.2) 51 (18.5) 12 (4.3) 103(37.3) 112 (40.6) 61 (22.1)
Dungarpur 310 214 (69.0) 64 (20.6) 32 (10.3) 122(39.4) 102 (32.9) 86 (27.7)
S. Madhopur 209 136 (65.1) 56 (26.8) 17 (8.1) 28 (13.4) 74 (35.4) 107(51.2)
Tonk 225 157 (69.8) 62 (27.6) 6 (2.7) 50 (22.2) 114 (50.7) 61 (27.1)
Total 1294 886 (68.5) 325 (25.1) 83 (6.4) 348(26.9) 530 (41.0) 416(32.1)
68.3% respondents (PW) were illiterate while 31.7% were literate; highest illiteracy prevailed in
Barmer (81.8%), Dungarpur (74.4%) where as minimum was in Baran (55.9%).
The DLHS 3 however, reports the literacy level amongst female population (age 7+) as 36.5% in
Barmer and 46.7% in Baran.
Among the lactating women also illiteracy prevailed (68.5%).
The illiteracy level among the spouses of PW was 27.3% while 72.7% were literate. Similarly,
26.9% spouses of lactating mothers were illiterate and 73.1% were literate. The spouse illiteracy
of both the PW and the lactating women was highest in Barmer (47.9% & 37.3% respectively) and
Dungarpur (41.0% & 39.4% respectively).

SIHFW: an ISO:9001:2008certif ied institution
KABP on continuum of care: Rapid Assessment: Oct 2009
25
Table 9: Distribution of primi gravida women in relation to the age at marriage
Districts Age at Marriage
Present Age of Pregnant women
<20 20-30 30+ Total
Baran
<20 9 (18.4) 40 (81.6) 0 (0.0) 49
20+ 0 (0.0) 3 (100.0) 0 (0.0) 3
Barmer
<20 13 (54.2) 11 (45.8) 0 (0.0) 24
20+ 0 (0.0) 1 (100.0) 0 (0.0) 1
Dungarpur
<20 5 (31.3) 11 (68.8) 0 (0.0) 16
20+ 0 (0.0) 5 (100.0) 0 (0.0) 5
S. Madhopur
<20 14 (34.1) 27 (65.9) 0 (0.0) 41
20+ 0 (0.0) 4 (100.0) 0 (0.0) 4
Tonk
<20 17 (34.7) 29 (59.2) 3 (6.1) 49
20+ 0 (0.0) 3 (100.0) 0 (0.0) 3
Total
<20 58 (32.4) 118 (65.9) 3 (1.7) 179 (91.8)
20+ 0 (0.0) 16 (100.0) 0 (0.0) 16 (8.2)
Total 58 (29.7) 134 (68.7) 3 (1.5) 195
Overall 91.8% women got married below the age of 20 years. 65.9% of this group was pregnant
for the first time between the ages of 20 to 30 years, whereas 32.4% women who got married
below the age of 20 also conceived before the age of 20.
Age at marriage and time of first pregnancy shows a strong association (chi square (7.93) at 95%
confidence level).
Table 10: Distribution of mothers with history of infant death in past (Pregnant Women &
Lactating Mothers)
District Household
surveyed Population surveyed Number of infants lost
One Two Three +
Baran 465 15,352 25 (6.1) 6 (1.5) 1 (0.2)
Barmer 424 18,966 42 (10.6) 17 (4.3) 2 (0.5)
Dungarpur 458 19,359 29 (27.2) 3 (0.7) 0 (0.0)
S. Madhopur 355 22,673 19 (5.2) 5 (1.4) 1 (0.3)
Tonk 367 17,842 32 (8.7) 4 (1.1) 0 (0.0)
Total 2069 94,192 147 (7.5) 35 (1.8) 4 (0.2)
Of the total 1965 surveyed women (PW & lactating) who reported the history of loss of an infant
any time in past; 7.5% lost one, 1.8% lost two and 0.2% lost three of their children. In all 9.5% of
the women lost one or the other child in the past. Dungarpur women were the most unfortunate
where 27.2% of the pregnant and lactating women had a history of child loss in the recent past.

SIHFW: an ISO:9001:2008certif ied institution
KABP on continuum of care: Rapid Assessment: Oct 2009
26
“Continuum”, de ned over the dimension of time and place or level of care, has two meanings.
Firstly, care has to be provided as a continuum throughout the li fecycle, including adolescence,
pregnancy, childbirth and childhood. Secondly, care has to be provided in a seamless continuum
at the level of home, the community, the health center and the hospital; but that requires people to
know what is good so that the same can be translated into practices.
Among the pregnant respondents both primi and multi-gravida were contacted to understand the
behavior pattern associated to barriers in continuing seeking care.
The knowledge of beneficiaries was assessed on various dimensions related to child bearing &
rearing practices.
Table 11: Awareness about ANC: responses of Pregnant Women
Districts Respondents
Awareness about number of ANC visits
One Two Three Four Don’t know
Baran 136 9 (6.6) 31 (22.8) 44 (32.4) 10 (7.4) 42 (30.9)
Barmer 121 3 (2.5) 19 (15.7) 15 (12.4) 2 (1.7) 82 (67.8)
Dungarpur 117 19 (16.2) 20 (17.1) 33 (28.2) 12 (10.3) 33 (28.2)
S. Madhopur 155 8 (5.2) 27 (17.4) 57 (36.8) 28 (18.1) 35 (22.5)
Tonk 142 13 (9.2) 13 (9.2) 38 (26.8) 19 (13.4) 59 (41.5)
Total 671 52 (7.7) 110 (16.4) 187 (27.9) 71 (10.6) 251 (37.4)
Overall 62.6% PW were aware of antenatal visits though the number of ideal visits (three) was
known only to 27.9%, rest were at least aware irrespective of the frequency of visits. This
awareness level was at its maximum in Sawai Madhopur (36.8%) as compared to 12.4% of
Barmer.
Table 12: Awareness about ANC: responses of Lactating Mothers
District
Respondents
Awareness about number of ANC visits
One Two Three Four Don’t Know
Baran 274 23 (8.4) 58 (21.2) 88 (32.1) 26 (9.5) 79 (28.8)
Barmer 276 7 (2.5) 34 (12.3) 45 (16.3) 9 (3.3) 181 (65.6)
Dungarpur 310 29 (9.4) 65 (21.0) 90 (29.0) 37 (11.9) 89 (28.7)
Sawai Madhopur 209 0 (0.0) 41 (19.6) 94 (45.0) 41 (19.6) 33 (15.8)
Tonk 225 8 (3.6) 57 (25.3) 67 (29.8) 28 (12.4) 65 (28.9)
Total 1294 67 (5.2) 255 (19.7) 384 (29.7) 141 (10.9) 447(34.5)

SIHFW: an ISO:9001:2008certif ied institution
KABP on continuum of care: Rapid Assessment: Oct 2009
27
Of the 1294 women who
delivered earlier, 65.5% were
aware and did go for antenatal
visits, though only 29.7% had
three antenatal visits. DLHS-3
reported percentage of mothers
who had three ANC visits during
last pregnancy as 37.5% for
Baran, 38.6% for Tonk, 30% for
Dungarpur, 18.1% for Sawai
Madhopur and 19.8% for Barmer
as against 32.1%. 29.8%, 29%, 45.0% and 16.3% respectively; only the findings for Sawai
Madhopur are not in consonance to DLHS-3 findings but for all other districts the study findings
hover around the DLHS data, with the maximum deviation of 10 percentage points.
Table 13: Awareness about ANC: responses of Mothers-in-law
Districts Respondents Awareness about number of ANC visits
Don’t know One Two Three Four
Baran 266 15 (7.9) 65 (34.4) 82 (43.4) 25 (13.2) 79 (29.7)
Barmer 233 7 (12.3) 24 (42.1) 25 (43.9) 1 (1.8) 176 (75.5)
Dungarpur 174 20 (13.7) 40 (27.4) 59 (40.4) 17 (11.6) 38 (21.8)
S. Madhopur 159 6 (4.8) 37 (29.4) 45 (35.7) 31 (24.6) 40 (25.2)
Tonk 257 9 (5.4) 34 (20.4) 88 (52.7) 32 (19.2) 94 (36.6)
Total 1089 57 (8.3) 200 (29.2) 299 (43.6) 106 (15.5) 427 (39.2)
In the patriarchal society with joint family system, the decisions regarding child bearing and
rearing are often dictated by mothers-in-law and their awareness levels are critical to seeking
services for pregnant women. Close to 60% of the mothers-in-law were aware about the antenatal
visits for the expectant daughter-in-laws, though only 43.6% were aware of the ideal number
(three) of antenatal visits. Substantial evidence exists that antenatal visits irrespective of the
number increase chances of institutional delivery.
The awareness levels were highest (63.4%) amongst the mothers-in-law of Tonk while the least
aware were from Barmer (24.5%) which can be attributed to the low levels of IEC, on account of
distance and difficult terrain.
0
10
20
30
40
50
Two Three Four Don’t Know
16.4
27.9
10.6
37.4
19.7
29.7
10.9
34.5
29.2
43.6
15.5
39.2
Pe
rce
nta
geNo. of visits
Awareness about number of ANC visits
PWLWMIL

SIHFW: an ISO:9001:2008certif ied institution
KABP on continuum of care: Rapid Assessment: Oct 2009
28
Table 14: Pregnancy stage and registration time: responses of Pregnant Women
District(Total registered) Pregnancy stage Registration time
I Trimester II Trimester III Trimester
Baran(130)
I Trimester (11) 11 (100.0) 0 (0.0) 0 (0.0)
II Trimester(42) 29 (69.0) 13 (30.6) 0 (0.0)
III Trimester(77) 43 (55.8) 28 (36.3) 6 (7.8)
Barmer(68)
I Trimester(2) 2 (100.0) 0 (0.0) 0 (0.0)
II Trimester(18) 10 (55.5) 8 (44.4) 0 (0.0)
III Trimester(48) 20 (41.6) 19 (39.5) 9 (18.7)
Dungarpur(102)
I Trimester(5) 5 (100.0) 0 (0.0) 0 (0.0)
II Trimester(36) 17 (47.2) 19 (52.7) 0 (0.0)
III Trimester(61) 16 (26.2) 37 (60.6) 8 (13.1)
Sawai Madhopur(135)
I Trimester(9) 9 (100.0) 0 (0.0) 0 (0.0)
II Trimester(36) 18 (50.0) 18 (50.0) 0 (0.0)
III Trimester(90) 35 (38.8) 41 (45.5) 14 (15.5)
Tonk(131)
I Trimester(11) 11 (100.0) 0 (0.0) 0 (0.0)
II Trimester(36) 24 (66.6) 12 (33.3) 0 (0.0)
III Trimester(84) 43 (51.2) 33 (39.3) 8 (9.5)
Total(566)
I Trimester(38) 38 (100.0) 0 (0.0) 0 (0.0)
II Trimester(168) 98 (58.3) 70 (41.6) 0 (0.0)
III Trimester(360) 157 (43.6) 158 (43.8) 45 (12.5)
Of the 671 pregnant women, 9.6% were in the first trimester pregnancy at the time of survey,
32.3% in second trimester and 57.9% were negotiating with the last trimester of pregnancy.
566 (84.3%) pregnant women out of 671 were registered at one or the other time during the
course of pregnancy. Of these, 449 did avail antenatal care services. There were 14 pregnant
women who despite not being registered did avail ANC at some point in time during their current
pregnancy.
Ideally, a positive knowledge should have changed the attitude subsequently to be reflected in the
behavior. The study subjects were probed through the pre tested structured questionnaire in order
to identify attitudinal bottlenecks that have been holding them for utilizing the services in relation
to pregnancy, post natal period and child health. Following few tables give an idea of the reasons
why the actions could not be taken by the pregnant, lactating women and their mothers-in-law.

SIHFW: an ISO:9001:2008certif ied institution
KABP on continuum of care: Rapid Assessment: Oct 2009
29
Table15: Reasons for not registering for antenatal care: responses of Pregnant Women
Districts Respondents
Reasons
Will do now
Don’t know
Distance
No information
Not necessary
Lack of time
No one to accompany
Fear
Baran 6 6(100.0) 0 (0.0) 0 (0.0) 0 (0.0) 0 (0.0) 0 (0.0) 0 (0.0) 0(0.0)
Barmer 53 10(18.9) 22(41.5) 9(17.0) 7(13.2) 4 (7.5) 0 (0.0) 1 (1.9) 0(0.0)
Dungarpur 15 11(73.3) 1 (6.7) 1 (6.7) 1 (6.7) 0 (0.0) 1 (6.7) 0 (0.0) 0(0.0)
S. Madhopur 20 15(75.0) 2 (10.0) 1 (5.0) 0 (0.0) 0 (0.0) 1 (5.0) 0 (0.0) 1(5.0)
Tonk 11 2 (18.2) 3 (27.3) 2(18.2) 0(0.0) 2(18.2) 2(18.2) 0 (0.0) 0(0.0)
Total 105 44(41.9) 28(26.7) 13(12.4) 8(7.6) 6 (5.7) 4 (3.8) 1 (1.0) 1(1.0)
Of the 671 pregnant women involved in the study 105 were not registered with any health facility
for various reasons. Distance from health facility, lack of time and “not necessary” was the
reasons extended by 21.9% of the non registered pregnant women. However, 41.9% said they
would get registered themselves with the facility now; 40.9% of these 44 were in first trimester,
45.4% in second trimester and 13.6% in the third trimester.
Table 16: Reasons for not registering for antenatal care: responses of Lactating Mothers
Districts
Resp
onden
ts
Reasons Don’t know
Not necessary
Distance No one available at health facility
Family pressure
Expensive
No information
Baran 1 0 (0.0) 0 (0.0) 0 (0.0) 0 (0.0) 0 (0.0) 1(100.0) 0 (0.0)
Barmer 124 60 (48.4) 20(16.1) 25(20.2) 2 (1.6) 2 (1.6) 0 (0.0) 15(12.1)
Dungarpur 2 2 (100.0) 0 (0.0) 0 (0.0) 0 (0.0) 0 (0.0) 0 (0.0) 0 (0.0)
S. Madhopur 3 1 (33.3) 2 (66.7) 0 (0.0) 0 (0.0) 0(0.0) 0 (0.0) 0 (0.0)
Tonk 9 5 (55.6) 2 (22.2) 0 (0.0) 1(11.1 1(11.1) 0 (0.0) 0 (0.0)
Total 139 68 (48.9) 24(17.3) 25(20.2) 3 (2.2) 3 (2.2) 1 (0.7) 15(10.8)
However when it came to the responses from lactating mothers regarding reasons for non-
registration in last pregnancy 48.9% said that they did not know about it.

SIHFW: an ISO:9001:2008certif ied institution
KABP on continuum of care: Rapid Assessment: Oct 2009
30
Table 17: Reasons for daughter-in-laws not registered for antenatal care: responses of
Mothers-In-Law
Districts
Respondents
Now she will do
Don’t know
Not considered it important
Distance from health facility
Lack of time
SC/AWC doesn’t give any information
Baran 8 3 (37.5) 5 (62.5) 0 (0.0) 0 (0.0) 0 (0.0) 0 (0.0)
Barmer 91 9 (9.9) 34 (37.4) 11 (12.1) 18 (19.8) 0 (0.0) 19 (20.9)
Dungarpur 9 4 (44.4) 2 (22.2) 1 (11.1) 0 (0.0) 1 (11.1) 1 (11.1)
S. Madhopur 10 6 (60.0) 2 (20.0) 1 (10.0) 0 (0.0) 1 (10.0) 0 (0.0)
Tonk 13 2 (15.4) 4 (30.8) 2 (15.4) 2 (15.4) 2 (15.4) 1 (7.7)
Total 131 24 (18.3) 47 (35.9) 15 (11.5) 20 (15.2) 4 (3.1) 21 (16.0)
On being probed as to why the daughter-in-law is not registered for antenatal care, out of the 131,
35.9% expressed their ignorance about the need and importance of registration for ANC, the most
ignorant on this issue were from district Baran (62.5%).
Table 18: Reasons for not availing ANC services: responses of Pregnant Women District Res
pondents
Reasons for No Antenatal Visits Not important
Distance
Lack of time
No one to accompany
Family Restrictions
Cost involved
Not informed by health workers
Other reasons
Baran 21
3 (14.2)
1 (5.0)
4 (20.0)
1 (5.0)
0 (0.0)
0 (0.0)
2 (10.0)
10 (50.0)
Barmer 65
24 (36.9)
27 (41.5)
1 (1.5)
1 (1.5)
1 (1.5)
2 (3.1)
6 (9.2)
3 (4.6)
Dungarpur 48
34 (70.1)
3 (6.7)
5 (11.1)
1 (2.2)
1 (2.2)
0 (0.0)
4 (8.8)
0 (0.0)
S. Madhopur 33
16 (48.4)
2 (5.6)
9 (25.0)
1 (2.8)
0 (0.0)
1 (2.8)
0 (0.0)
4 (11.1)
Tonk 43
25 (58.1)
4 (9.5)
2 (4.8)
5 (11.9)
4 (9.5)
0 (0.0)
1 (2.4)
2 (4.8)
Total 210
102 (48.5)
37 (17.8)
21 (10.1)
9 (4.3)
6 (2.9)
3 (1.4)
13 (6.3)
19 (9.1)

SIHFW: an ISO:9001:2008certif ied institution
KABP on continuum of care: Rapid Assessment: Oct 2009
31
Table 19: Reasons for not availing ANC services: responses of Lactating Mothers District Res
pondents
Reasons for No Antenatal Visits Not important
Distance
Lack of time
No one to accompany
Family Restrictions
Cost involved
Not informed by health workers
Other reasons
Baran 1 0 (0.0) 0(0.0) 0 (0.0) 0 (0.0) 0 (0.0) 1(100.0) 0(0.0) 0 (0.0)
Barmer 155 84(54.2) 34(21.9) 2 (1.3) 3 (1.9) 4 (2.6) 1(0.6) 21(13.5) 6 (3.9)
Dungarpur 82 72 (87.8) 1(1.2) 4 (4.9) 0 (0.0) 3 (3.7) 2(2.4) 0(0.0) 0 (0.0)
S. Madhopur 14 12 (85.7) 0(0.0) 0 (0.0) 0 (0.0) 0 (0.0) 0(0.0) 2(14.3) 0 (0.0)
Tonk 38 26 (68.4) 0(0.0) 3 (7.9) 4(10.5) 2 (5.3) 1(2.6) 1(2.6) 1 (2.6)
Total 290 194(66.9) 35(12.1) 9 (3.1) 7 (2.4) 9(3.1) 5(1.7) 24(8.3) 7 (2.4)
48.5% of the pregnant and 66.9% of the lactating mothers did not consider it important when
questioned about why they have not gone for antenatal checkups. The other major reason
propounded by the respondents was distance (17.8%–PW & 12.1%- LM). Contrary to the
common belief a meager 3.1% were denied the opportunity for ANC by family members.
Table 20: Reasons for not availing ANC services: responses from Mothers-in-law
Districts Respondents
Not important
Distance
Lack of time
No one to accompany
Family Restrictions
Cost involved
Not informed by health workers
Don’t know
Other Reason
Baran
27 12(44.4) 0(0.0) 8(29.6) 3(11.1) 1(3.7) 1(3.7) 0(0.0) 1(3.7) 1(3.7)
Barmer
125 52(41.6) 44(35.2) 0(0.0) 1(0.8) 2(1.6) 1(0.8) 21(16.8) 4(3.2) 0(0.0)
Dungarpur
37 31(83.8) 1(2.7) 1(2.7) 0(0.0) 2(5.4) 0(0.0) 1(2.7) 1(2.7) 0(0.0)
S.Madhopur
15 7(46.7) 2(13.3) 5(33.3) 0(0.0) 0(0.0) 0(0.0) 0(0.0) 0(0.0) 1(6.7)
Tonk
41 14(34.1) 1(2.4) 5(12.2) 1(2.4) 3(7.3) 0(0.0) 6(14.6) 11(26
.8) 0(0.0)
Total
245 116(47.3) 48(19.6) 19(7.8) 5(2.0) 8(3.3) 2(0.8) 28(11.4) 17(6.
9) 2(0.8)
The commonest reason extended by mothers-in-law was that it is not important (47.3%) and the
health facility is at a distance (19.6%). 83.8% mothers-in-law at Dungarpur did not consider
antenatal care as important.
This is one of the areas which besides continuum of care, punctuates the initiation of an
interaction with health care delivery system by the pregnant women; and that calls for an
extensive BCC effort involving the family with focus on mother-in-law as decision maker.

SIHFW: an ISO:9001:2008certif ied institution
KABP on continuum of care: Rapid Assessment: Oct 2009
32
Of the 248 who had themselves registered in first trimester (55.2%), 38.7% had two antenatal
visits and 29.8% had only one antenatal visit. Maximum number (43%) of pregnant women who
had two antenatal visits had themselves registered in the second trimester.
Table 21: Time of registration and number of ANC visits: responses of Pregnant Women
Districts
(No.)
Respondents
who
had
gone
for ANC
Registration
Time Once Twice Thrice Three+ Total
Baran
(136) 115
I Trimester 26(34.7) 34(45.3) 11(14.7) 4(5.3) 75
II Trimester 11(33.3) 18(54.5) 2(6.1) 2(6.1) 33
III Trimester 4(57.1) 2(28.6) 0(0.0) 1(14.3) 7
Barmer (121)
56
No Reg. 4(66.7) 1(16.7) 1(16.7) 0(0.0) 6
I Trimester 9(37.5) 6(25.0) 8(33.3) 1(4.2) 24
II Trimester 5(26.3) 9(47.4) 4 (21.1) 1(5.3) 19
III Trimester 4(57.1) 2(28.6) 1(14.3) 0(0.0) 7
Dungarpur
(117) 71
No Reg. 1(100.0) 0(0.0) 0(0.0) 0(0.0) 1
I Trimester 8(25.0) 14(43.8) 7(21.9) 3(9.4) 32
II Trimester 12(38.7) 10(32.3) 6(19.4) 3(9.7) 31
III Trimester 3(42.9) 2(28.6) 2 (28.6) 0(0.0) 7
Sawai Madhopur
(155)
123
No Reg. 3(60.0) 1(20.0) 1(20.0) 0(0.0) 5
I Trimester 10(18.5) 19(35.2) 17(31.5) 8(14.8) 54
II Trimester 8(15.1) 27(50.9) 12(22.6) 6(11.3) 53
III Trimester 0(0.0) 4(36.4) 5(45.5) 2(18.2) 11
Tonk
(142) 98
No Reg. 1(50.0) 0(0.0) 1(50.0) 0(0.0) 2
I Trimester 21(33.3) 23(36.5) 14(22.2) 5(7.2) 63
II Trimester 11(37.9) 7(24.1) 7(24.1) 4(13.5) 29
III Trimester 3(75.0) 1(25.0) 0(0.0) 0(0.0) 4
Total
(671) 463
No Reg. 9(65.0) 2(15.0) 3(20.0) 0(0.0) 14
I Trimester 74(29.8) 96(38.7) 57(23.0) 21(8.5) 248
II Trimester 47(28.5) 71(43.0) 31(18.8) 16(9.7) 165
III Trimester 14(38.9) 11(30.6) 8(22.2) 3(8.3) 36
A good correlation (r=0.635) is seen between the pregnant women registered in the I trimester
and availing three ANC visits. Good correlation (r=0.683) also exists between II trimester
registration and three ANC visits. With the ‘t’ value of 17.65 and 20.07, the correlation coefficient
is significant at both 5% and 1% level of significance; whereas a weak correlation (r=0.1437) is
seen for women registered in the third trimester and three ANC visits, and this holds significant at
95% and 99% confidence level (t=3.1175).

SIHFW: an ISO:9001:2008certif ied institution
KABP on continuum of care: Rapid Assessment: Oct 2009
33
Table 22: Registration status and no. of ANC visits in last pregnancy of currently lactating
mothers
District(Respondents)
Registration
Number of visits
None Once Twice Thrice Four SOS* Every Month
Baran (274)
Yes
1 (0.4) 56 (20.4) 154(56.2) 50(18.2) 6 (2.2) 3(1.1) 3(1.1)
No
0 (0.0) 1 (0.4) 0 (0.0) 0 (0.0) 0(0.0) 0(0.0) 0(0.0)
Barmer (276)
Yes 47 (17.0) 17 (6.2) 40 (14.5) 39(14.1) 9(3.3) 0(0.0) 0(0.0)
No
108(39.1) 4 (1.4) 9 (3.3) 3 (1.1) 0(0.0) 0 (0.0) 0(0.0)
Dungarpur (310)
Yes
82 (26.5) 33 (10.6) 68 (21.9) 83 26.8) 24(7.7) 17(5.5) 1(0.3)
No 0 (0.0) 0 (0.0) 2 (0.6) 0 (0.0) 0(0.0) 0(0.0) 0(0.0)
Sawai Madhopur (209)
Yes
13 (6.2) 16 (7.7) 58 (27.8) 82(39.2) 25(12.0) 11(5.3) 1(0.5)
No
1 (0.5) 0 (0.0) 1 (0.5) 0(0.0) 1(0.5) 0(0.0) 0(0.0)
Tonk (225)
Yes
34 (15.1) 30 (13.3) 90 (40.0) 48(21.3) 12 (5.3) 2 (0.9) 0(0.0)
No
4 (1.8) 1(0.4) 2 (0.9) 2(0.9) 0(0.0) 0(0.0) 0(0.0)
Total (1294)
Yes 177(15.3) 152(13.2) 410(35.5) 302(26.1) 76(6.6) 33(2.9) 5(0.4) No 113(81.3) 6 (4.3) 14 (10.1) 5(3.6) 1(0.7) 0(0.0) 0(0.0)
* SOS – As and when required/suggested by service provider
Of the 1294 lactating mothers 1155 (89.2%) did register themselves with a health facility. 35.5%
of these registered lactating mothers had two antenatal visits.
0
5
10
15
20
25
30
35
40
45
I trimester II trimester III trimester
29.8 28.5
38.938.7
43
30.6
23
18.822.2
8.5 9.7 8.3
ANC visits and time of registration: Pregnant Women
Once
Twice
Thrice
Three+

SIHFW: an ISO:9001:2008certif ied institution
KABP on continuum of care: Rapid Assessment: Oct 2009
34
Surprisingly, 15.3% of the registered did not go for any ANC visit leaving the question
unanswered as to how come they stand registered as ideally the registration is done at the time of
first visit itself. This can only be explained that either the women did not understand the difference
between registration and ANC visit or the investigator could not apply himself/herself or the
worker concerned simply enrolled her during a home visit without examining and offering the
desired interventions during the first visit.
Table 23: Time of registration and number of ANC visi ts in last pregnancy: responses of
Lactating Mothers
District
(Responde
nts)
Registration No. of ANC Visits
None Once Twice Thrice Three + SOS
Baran
(274)
No (1) 0 (0.0) 1 (100) 0 (0.0) 0 (0.0) 0 (0.0) 0 (0.0)
I trimester (111) 0 (0.0) 18(16.2) 56(50.4) 31(27.9) 4 (3.6) 2 (1.8)
II trimester(137) 1 (0.7) 31(22.6) 81(59.1) 18 (13.1) 4 (2.9) 1 (0.7)
III trimester (26) 0 (0.0) 7 (26.9) 17 (65.3) 1 (3.8) 1 (3.8) 0 (0.0)
Barmer
(276)
No (124) 108(87.1) 4 (3.2) 9 (7.2) 3 (2.4) 0 (0.0) 0 (0.0)
I trimester (71) 19 (26.7) 4 (5.6) 17 (23.9) 25 (35.2) 6 (8.4) 0 (0.0)
II trimester (46) 15 (32.6) 3 (6.5) 14 (30.4) 12 (26.1) 2 (4.3) 0 (0.0)
III trimester (35) 13 (37.1) 10(28.5) 9 (25.7) 2 (5.7) 1 (2.8) 0 (0.0)
Dungarpur
(310)
No(2) 0 (0.0) 0 (0.0) 2 (100) 0 (0.0) 0 (0.0) 0 (0.0)
I trimester (122) 14 (11.4) 18(14.7) 30 (24.5) 42(34.4) 11(9.0) 7 (5.7)
II trimester(147) 55 (37.4) 14 (9.5) 27 (18.3) 31(21.1) 14(9.5) 6 (4.1)
III trimester (39) 13 (33.3) 1 (2.5) 11 (28.2) 10 (25.6) 0 (0.0) 4(10.2)
Sawai
Madhopur
(209)
No (3) 1 (33.3) 0 (0.0) 1 (33.3) 0 (0.0) 1(33.3) 0 (0.0)
I trimester (73) 5 (6.8) 4 (5.4) 16 (21.9) 31(42.4) 13(17.8) 4 (5.4)
II trimester (99) 5 (5.1) 10(10.1) 34(34.3) 38 (38.3) 7 (7.1) 5 (5.1)
III trimester (33) 3 (9.1) 2 (6.1) 8 (24.2) 13 (39.3) 5(15.1) 2 (6.1)
Tonk
(225)
No (9) 4 (44.4) 1 (11.1) 2 (22.2) 2 (22.2) 0 (0.0) 0 (0.0)
I trimester (104) 17 (16.3) 11(10.5) 36 (34.6) 30 (28.8) 8 (7.6) 2 (1.9)
II trimester (97) 11 (11.3) 17(17.5) 52(53.6) 13 (13.4) 4 (4.1) 0 (0.0)
III trimester (15) 6 (40.0) 2 (13.3) 2 (13.3) 5 (33.3) 0 (0.0) 0 (0.0)
Total
(1294)
No (139) 113(81.3) 6 (4.3) 14 (10.1) 5 (3.6) 1 (0.7) 0 (0.0)
I trimester (481) 55 (11.4) 55(11.4) 155(32.2) 159(33.1) 42(8.7) 15(3.1)
II trimester(526) 87 (16.5) 75(14.3) 208(39.5) 112(21.3) 32(6.1) 12(2.3)
III trimester(148) 35 (23.6) 22(14.9) 47 (31.8) 31 (20.9) 7 (4.7) 6 (4.1)

SIHFW: an ISO:9001:2008certif ied institution
KABP on continuum of care: Rapid Assessment: Oct 2009
35
Of the total 1294 lactating women, 139 (10.7%) never got themselves “registered”, 481 were
registered in first trimester; 526 in the second trimester and 148 in the third trimester. Of the 481,
with registration in first trimester during their last pregnancy, 33.1% and 32.2% had sufficient time
to go for three and two antenatal visits respectively. However, those registered in second (39.5%)
and third trimester (31.8%) could only have two antenatal visits.
An association is seen between the time of registration and number of ANC visits with the value of
chi square as 346.937. Moderate correlation (r=0.4470) is seen between lactating mothers
registering in second trimester of the previous pregnancy and two ANC visits which is significant
at both 5% and 1% level of significance (t=17.96). Very weak correlation (r=0.0147) exists
between registration during third trimester and availing two ANC visits.
Table 24: Reasons for not receiving TT Vaccination: responses of Pregnant Women
Districts Respondents
Scared Not important
Distance
Lack of time
No one available at health
facility
Don’t know
Will do it now
Was out of the
village Baran 15 0(0.0) 2(13.3) 0(0.0) 3(20.0) 2(13.3) 0(0.0) 6(40.0) 2(13.3)
Barmer 56 8(14.3) 17(30.4) 16(28.6) 0(0.0) 6(10.7) 8(14.3) 1(1.8) 0(0.0)
Dungarpur 18 0(0.0) 6(33.3) 4(22.2) 4(22.2) 2(11.1) 1(5.6) 1(5.6) 0(0.0)
S. Madhopur 21 0(0.0) 4(19.0) 1(4.8) 11(52.4) 0(0.0) 1(4.8) 2(9.5) 2(9.5)
Tonk 22 2(9.1) 3(13.6) 3(13.6) 4(18.2) 4(18.2) 0(0.0) 6(27.3) 0(0.0)
Total 132 10(7.6) 32(24.2) 24(18.2) 22(16.7) 14(10.6) 10(7.6) 16(12.1) 4(3.0)
Amongst 132 currently pregnant women who had not received tetanus toxoid, the reason put
forward by the pregnant women is that they do not “consider it important” (24.2%) whereas
another 18.2% cited distance of health facility from their dwellings as a reason.
The responses from currently lactating mothers (42.7%) in the study and the mothers-in-law
(50.6%) also indicated the same.
Table 25: Reasons for not receiving TT Vaccination: responses of Lactating Mothers
Districts Responden
ts
Scared Not important
Distance Lack of time
No one available at health
facility
Will do it now
Due to supersti
tion
Baran 1 1(100.0) 0 (0.0) 0 (0.0) 0(0.0) 0 (0.0) 0 (0.0) 0 (0.0)
Barmer 101 2 (2.0) 42 (41.6) 17(16.8) 1(1.0) 17(16.8) 19(18.8) 1 (2.0)
Dungarpur 5 1 (20.0) 2 (40.0) 0 (0.0) 2(40.0) 0 (0.0) 0 (0.0) 0 (0.0)
S. Madhopur 4 2 (50.0) 2 (50.0) 0 (0.0) 0 (0.0) 0 (0.0) 0 (0.0) 0 (0.0)
Tonk 6 0 (0.0) 4 (66.7) 0 (0.0) 0 (0.0) 1 (16.7) 1 (16.7) 0 (0.0)
Total 117 6 (5.1) 50 (42.7) 17(14.5) 3 (2.6) 18(15.4) 20(17.1) 2 (1.7)

SIHFW: an ISO:9001:2008certif ied institution
KABP on continuum of care: Rapid Assessment: Oct 2009
36
Table 26: Reasons for not receiving TT Vaccination: responses of Mothers-In-Law
Districts Respondents
Scared Not important
Distance Lack of time
Superstition
Will do it now
Out of village
Baran 14 4 (28.6) 3 (21.4) 0 (0.0) 5(35.7) 0 (0.0) 1(7.1) 1(7.1)
Barmer 92 4 (4.3) 51 (55.5) 36(39.1) 0(0.0) 1 (1.1) 0(0.0) 0(0.0)
Dungarpur 12 2 (16.7) 5 (41.7) 1 (8.3) 3(25.0) 1 (8.3) 0(0.0) 0(0.0)
S. Madhopur 9 2 (22.2) 3 (33.3) 0 (0.0) 4(44.4) 0 (0.0) 0(0.0) 0(0.0)
Tonk 29 3 (10.3) 17 (58.6) 4 (13.8) 5(17.2) 0 (0.0) 0(0.0) 0(0.0)
Total 156 15 (9.6) 79 (50.6) 41(26.3) 17(10.9) 2 (1.3) 1(0.6) 1(0.6)
Table 27: ANC registration and TT vaccination: responses of Pregnant Women
District Respondents
Registered
TT Injections received
Pregnant Women
Yes No
Once Twice
Baran 136 Yes 46 (33.8) 75 (55.1) 9 (6.6)
No 0 (0.0) 0 (0.0) 6 (4.4)
Barmer 121 Yes 31 (25.6) 28 (23.1) 9 (7.4)
No 3 (2.4) 3 (2.4) 47(38.8)
Dungarpur 117 Yes 32 (27.3) 66 (56.4) 3(2.5)
No 1 (0.8) 0 (0.0) 15 (12.8)
S. Madhopur 155 Yes 30 (19.3) 103(66.4) 2 (1.3)
No 0 (0.0) 1 (0.6) 19 (12.2)
Tonk 142 Yes 39 (27.4) 78 (54.9) 12 (8.4)
No 2 (1.4) 2 (1.4) 9 (6.3)
Total 671 Yes 178(26.5) 350(52.1) 35 (5.2)
No 6 (0.8) 6 (0.8) 96 (14.3)
Grand Total
184(27.4) 356(53.1) 131(19.5)
Of the 671 pregnant women 84.3% were registered with the health facility of which 52.1% had two
TT doses of and another 26.5% received only one TT. It is interesting that 11.4% of the 105 who
were not registered with the facility still had one or two doses of TT. Subjected to the statistical
analysis, the value of χ2
= 394.9 proves an association between ANC registration and TT
vaccination for pregnant women by setting the hypothesis. The correlation coefficient of 0.767
gives a good positive correlation between the two and this is significant at 0.05 and 0.01 levels of
significance, checked through “t” test.

SIHFW: an ISO:9001:2008certif ied institution
KABP on continuum of care: Rapid Assessment: Oct 2009
37
Table 28: ANC registration and TT vaccination: responses of Lactating Mothers
District Respondents
Registered
TT Injections received
Lactating Women
Yes No
Once Twice
Baran 274 Yes 56(20.4) 216(78.8) 1 (0.3)
No 1 (0.3) 0(0.0) 0 (0.0)
Barmer 276 Yes 20 (7.2) 115(41.6) 17(6.1)
No 12 (4.3) 28(10.1) 84(30.4)
Dungarpur 310 Yes 17 (5.4) 286(92.2) 5 (1.6)
No 0 (0.0) 2(0.6) 0 (0.0)
S. Madhopur 209 Yes 11 (5.2) 193(92.3) 2 (0.9)
No 0 (0.0) 1(0.4) 2 (0.9)
Tonk 225 Yes 35(15.6) 177(78.6) 4 (1.7)
No 1(0.4) 6(2.6) 2 (0.8)
Total 1294 Yes 139(10.7) 987(76.2) 29 (2.2)
No 14 (1.1) 37 (2.8) 88 (6.8)
Grand Total
153(11.8) 1024(79.1) 117(9.0)
For the lactating mothers also a relationship is seen between ANC registration and TT vaccination
(r=0.656) and this again is significant at both the levels of significance (5% and 1%); which in
other terms means that there is a strong association between ANC registration and subsequent
utilization of services by the beneficiaries.
Though the study does not answer where they got it from, it is assumed that this was received
from a health facility.
Table 29: Reasons for not receiving IFA Tablets: responses of Pregnant Women Districts Respo
ndents Non Receiving/Obtaining of IFA Tablets
Did not go to health facility/ no time
Health worker did not visit
Not important
Family Restrictions
Didn’t know
Will take now
Was out of the village
Baran 43 8 (18.6) 17(39.5) 13 (30.2) 0 (0.0) 1(2.3) 2(4.7) 2(4.7)
Barmer 80 3 (3.8) 52(65.0) 21 (26.3) 0 (0.0) 4(5.0) 0(0.0) 0 0.0)
Dungarpur 23 4 (17.4) 5 (21.7) 13 (56.5) 0 (0.0) 1(4.3) 0(0.0) 0(0.0)
S. Madhopur 39 8 (20.5) 8 (20.5) 17 (43.6) 2 (5.1) 0(0.0) 2(5.1) 2(5.1)
Tonk 50 1 (2.0) 32(64.0) 14 (28.0) 1 (2.0) 1(2.0) 1(2.0) 0(0.0)
Total 235 24 (10.2) 114(48.5) 78 (33.2) 3 (1.3) 7(3.0) 5(2.1) 4(1.7)

SIHFW: an ISO:9001:2008certif ied institution
KABP on continuum of care: Rapid Assessment: Oct 2009
38
Expectation from the service provider to provide services at their doorstep seems to be the major
reason behind 48.5% respondents for not obtaining IFA tablets. This expectation was highest in
Barmer (65%) followed by Tonk (64%) and Baran (39.5%), while 33.2% of the respondents did
not consider it important.
Table 30: Reasons for not receiving IFA Tablets: responses of Lactating Mothers District
Responden
ts
Reasons
Did not go to health
facility
Health worker did
not visit
Not important
Family Restricti
ons
Don’t know
Out of Village
Under Medicat
ion
Baran 52 8(15.4) 16 (30.8) 25(48.1) 0 (0.0) 2 (3.8) 0(0.0) 1 (1.9)
Barmer 160 9 (5.6) 93 (58.1) 47(29.4) 4 (2.5) 6 (3.7) 1(0.6) 0 (0.0)
Dungarpur 25 1 (4.0) 3 (12.0) 16(64.0) 1 (4.0) 3(12.0) 0(0.0) 1 (4.0)
S. Madhopur 29 5(17.2) 3 (10.3) 18(62.1) 1 (3.4) 1 (3.4) 1(3.4) 0 (0.0)
Tonk 75 0 (0.0) 29 (38.7) 38(50.7) 3 (4.0) 5 (6.7) 0 0.0) 0 (0.0)
Total 341 23(6.7) 144(42.2) 144(42.2) 9 (2.6) 17(4.9) 2(0.6) 2 (0.6)
Lactating mothers (42.2%) also expected the service providers to provide them with the IFA
tablets at their doorstep. Similar number did not consider it important to obtain them. Expectations
from the system, on this account were highest in Barmer (58.1%) and Tonk (38.7%). The reasons
may be distance in Barmer. 12% of Dungarpur subjects did not know from where to obtain while
17.2% in Sawai Madhopur did not go to Sub center or AWC for IFA tablets.
Table 31: Reasons for not receiving IFA Tablets: responses of Mothers-in-law
Districts Respondents
Reasons
Did not go to health facility
Health worker did not come
Not important
Family Restrictions
Don’t know
Baran 41 3 (7.3) 23 (56.1) 13 (31.7) 0 (0.0) 2 (4.9)
Barmer 118 3 (2.5) 84 (71.2) 25 (21.2) 3 (2.5) 3 (2.5)
Dungarpur 16 0 (0.0) 3 (18.8) 13 (81.3) 0 (0.0) 0 (0.0)
S. Madhopur 17 2 (11.8) 2 (11.8) 13 (76.5) 0 (0.0) 0 (0.0)
Tonk 43 1 (2.3) 19 (44.2) 14 (32.6) 2 (4.7) 7 (16.3)
Total 235 9 (3.8) 131 (55.7) 78 (33.2) 5 (2.1) 12 (5.1)
The responses from mothers-in-law were no different.

SIHFW: an ISO:9001:2008certif ied institution
KABP on continuum of care: Rapid Assessment: Oct 2009
39
Table 32: Reasons for not consuming IFA Tablets: responses of Pregnant Women
Districts Respondents
Reasons
Not important
Nausea Constipation/Loose Motion/itching
Causes heat in the body
Family Restrictions
Taking other Medicine
Baran 34 4 (11.8) 28 (82.4) 1 (2.9) 1 (2.9) 0 (0.0) 0 (0.0)
Barmer 9 3 (33.3) 6 (66.7) 0 (0.0) 0 (0.0) 0 (0.0) 0 (0.0)
Dungarpur 8 2 (25.0) 6 (75.0) 0 (0.0) 0 (0.0) 0 (0.0) 0 (0.0)
S. Madhopur 50 24 (48.0) 22 (44.0) 3 (6.0) 0 (0.0) 1 (2.0) 0 (0.0)
Tonk 34 6 (17.6) 20 (58.8) 1 (2.9) 6 (17.6) 0 (0.0) 1 (2.9)
Total 135 39 (28.9) 82 (60.7) 5 (3.7) 7 (5.2) 1 (0.7) 1 (0.7)
Table 33: Reasons for not consuming IFA Tablets: responses of Lactating Mothers
Districts Respondents
Reasons
Not important
Nausea Constipation/Loose Motion/itching
Causes heat in the body
Family Restrictions
Taking other Medicine
Baran 113 30 (26.5) 73 (64.6) 2 (1.7) 7 (6.2) 0 (0.0) 1 (0.9)
Barmer 42 14 (33.3) 27 (64.3) 0 (0.0) 0 (0.0) 0 (0.0) 1 (2.4)
Dungarpur 43 10 (23.3) 24 (55.8) 1 (2.3) 6 (14.0) 0 (0.0) 2 (4.7)
S. Madhopur 67 37 (55.2) 28 (41.8) 0 (0.0) 2 (3.0) 0 (0.0) 0 (0.0)
Tonk 64 15 (23.4) 38 (59.4) 0 (0.0) 8 (12.5) 3 (4.7) 0 (0.0)
Total 329 106 (32.2) 190 (57.8) 3 (0.9) 23 (7.0) 3 (0.9) 4 (1.2)
In an attempt to explore the reason for not consuming a full course of IFA tablets, nausea was put
as the prime reason by the subjects (60.7%-PW & 57.8%-LM). Now that is an area in continuum
of care which could have been handled with a little counseling and advise on when and how to
take IFA tablets.
On the contrary, the common side effects (constipation/loose motion) for which iron is notoriously
known for; did not appear on the list of reasons for non-compliance with the regime.
62.7% of the mothers-in-law also did support their daughter-in-laws on this account.

SIHFW: an ISO:9001:2008certif ied institution
KABP on continuum of care: Rapid Assessment: Oct 2009
40
Table 34: Reasons for not consuming IFA Tablets: responses of Mothers-in-law
Districts Responde
nts
Reasons Not important
Nausea Constipation/Loose Motion
Causes heat in the body
Out of village
Doctor asked to stop it
Baran 47 9 (19.1) 37(78.7) 0 (0.0) 0 (0.0) 1(2.1) 0 (0.0)
Barmer 33 15 (45.5) 18(54.5) 0 (0.0) 0 (0.0) 0 (0.0) 0 (0.0)
Dungarpur 8 3 (37.5) 5(62.5) 0 (0.0) 0 (0.0) 0 (0.0) 0 (0.0)
S. Madhopur 28 12 (42.9) 14(50.0) 1 (3.6) 0 (0.0) 0 (0.0) 1 (3.6)
Tonk 50 12 (24.0) 30(60.0) 2 (4.0) 6 (12.0) 0 (0.0) 0 (0.0)
Total 166 51 (30.7) 104(62.7) 3 (1.8) 6 (4.0) 1 (0.6) 1 (0.6)
Table 35: Number of IFA tablets received: responses of Pregnant Women
Districts Responde
nts
No. of IFA tablets Total no IFA
beneficiari
es
Not received
Less
than 30
30 60 90 More
than
90
Not
remem
bered
Baran 136
4
(4.3)
19
(20.4)
35
(37.6)
15
(16.1)
20
(21.5)
0
(0.0)
93
(68.4)
43
(31.6)
Barmer 121
6
(14.6)
12
(29.3)
13
(31.7)
3
(7.3)
7
(17.1)
0
(0.0)
41
(33.9)
80
(66.1)
Dungarpur 117
10
(10.6)
45
(47.9)
23
(24.5)
10
(10.6)
4
(4.3)
2
(2.1)
94
(80.3)
23
(19.7)
S. Madhopur 155
19
(16.4)
30
(25.9)
44
(37.9)
8
(6.9)
15
(12.9)
0
(0.0)
116
(74.8)
39
(25.2)
Tonk 142
20
(21.7)
25
(27.2)
25
(27.2)
11
(12.0)
10
(10.9)
1
(1.1)
92
(64.8)
50
(35.2)
Total 671
59
(13.5)
131
(30.0)
140
(32.1)
47
(10.8)
56
(12.8)
3
(0.7)
436
(65.0)
235
(35.0)
Ideally as part of total antenatal care a pregnant woman should consume a total 100 IFA tablets.
Out of the total 436 pregnant women who received the IFA tablets, only 12.8% got more than 90
tablets while 14.8% of 953 lactating mothers had received the IFA tablets during their last
pregnancy. 12.4% mothers-in-law expressed that their pregnant/ lactating daughter-in-laws
received 90+ tablets.
On being probed about how the tablets were given and what was the time of their taking the
tablets it was found that majority of respondents (93.0%) got the IFA tablets in strips.
26.3% did not receive the IFA tablets with 57.9% cases reported it from Barmer. Only 14.8%
received more than 90 tablets otherwise rest settled with 60 or less tablets.
45.4% of the pregnant women and 46.9% of lactating mothers, who consumed IFA, had it after
meals. Their respective mothers-in-law (43.9%) also were in knowledge of IFA to be consumed

SIHFW: an ISO:9001:2008certif ied institution
KABP on continuum of care: Rapid Assessment: Oct 2009
41
after meals. 60.3% of the pregnant women had full course of IFA tablets, maximum being from
Dungarpur (90.4%), whereas for lactating women 65.2% had consumed all the IFA tablets given.
61.2% of the mothers-in-law also vouched that their currently pregnant and/or lactating daughter-
in-law during the last pregnancy had taken the full course of IFA tablets.
Overall 73.6% of lactating women consumed IFA tablets during their last pregnancy irrespective
of the number and duration of the consumption. The consumption percentage was best in
Dungarpur (91.9%) and worst was in Barmer (42.0%).
Table 36: Time of registration and services utilized: responses of Pregnant Women
District Time of
Registration
TT Vaccination IFA Tablets
Yes No Total Yes No Total
Baran
I Trimester 74(90.0) 8(9.7) 82 55(67.0) 27(32.9) 82
II Trimester 40(97.5) 1(2.4) 41 34(82.9) 7(17.0) 41
III Trimester 7(100.0) 0(0.0) 7 4(57.1) 3(42.8) 7
Barmer
I Trimester 74(90.0) 8(9.7) 82 18(58.0) 13(41.9) 31
II Trimester 40(97.5) 1(2.4) 41 15(55.5) 12(44.4) 27
III Trimester 7(100.0) 0(0.0) 7 6(60.0) 4(40.0) 10
Dungarpur
I Trimester 25(80.6) 6(19.3) 37 35(97.2) 1(2.7) 36
II Trimester 24(88.8) 3(11.1) 27 51(92.7) 4(7.2) 55
III Trimester 10(36.0) 0(0.0) 10 8(72.7) 3(27.2) 11
Sawai
Madhopur
I Trimester 36(100.0) 0(0.0) 36 52(86.6) 8(13.3) 60
II Trimester 53(96.3) 2(3.6) 55 49(81.6) 11(18.3) 60
III Trimester 10(90.9) 1(9.0) 11 14(93.3) 1(6.6) 15
Tonk
I Trimester 59(98.3) 1(1.6) 60 56(72.7) 21(27.2) 77
II Trimester 59(98.3) 1(1.6) 60 29(67.4) 14(32.5) 43
III Trimester 15(100.0) 0(0.0) 15 7(63.6) 4(36.4) 11
Total
I Trimester 260(90.9) 26(9.0) 286 216(75.5) 70(24.4) 286
II Trimester 217(96.0) 9(3.9) 226 178(78.7) 48(21.2) 226
III Trimester 52(96.2) 2(3.9) 54 39(72.2) 15(27.7) 54
It is expected that early registration would give the beneficiaries enough time to avail services and
health worker to offer preventive and promotive interventions during pregnancy. Contrary to the
expected, irrespective of the time of registration more than 90% of the pregnant women got one
or more TT doses and more than 75% received IFA tablets. And almost the same was observed
for lactating women enrolled in the study.
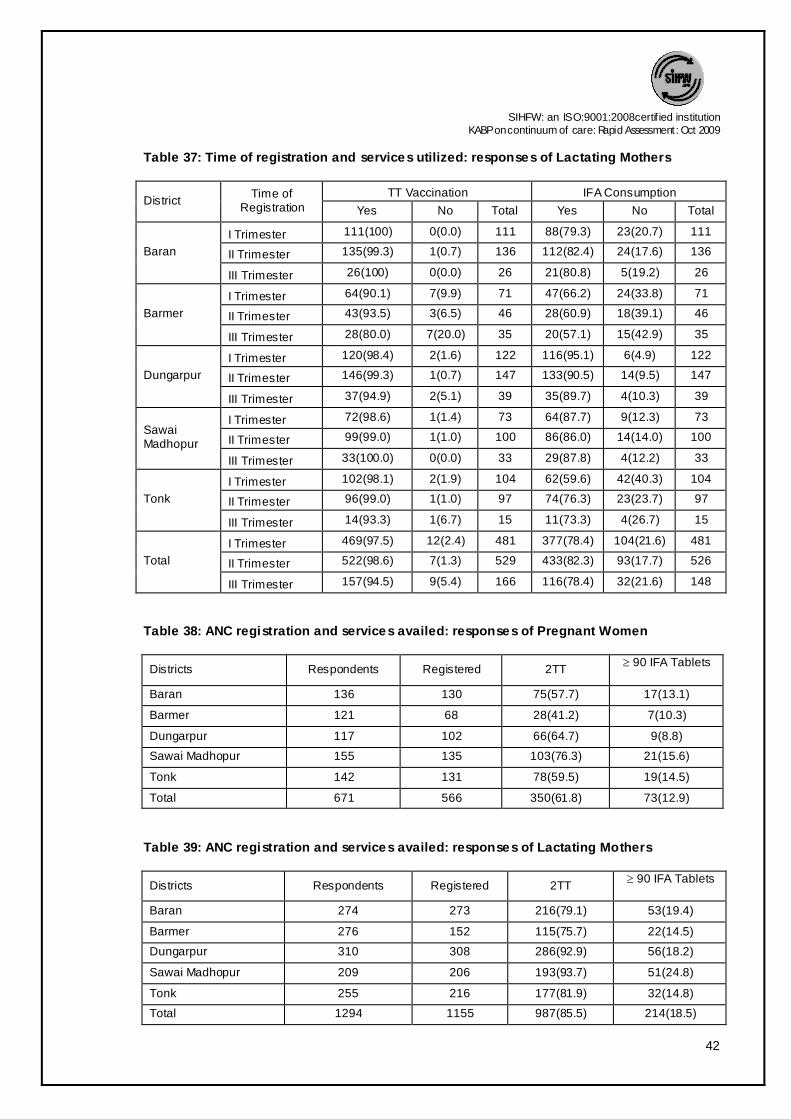
SIHFW: an ISO:9001:2008certif ied institution
KABP on continuum of care: Rapid Assessment: Oct 2009
42
Table 37: Time of registration and services utilized: responses of Lactating Mothers
District Time of
Registration TT Vaccination IFA Consumption
Yes No Total Yes No Total
Baran
I Trimester 111(100) 0(0.0) 111 88(79.3) 23(20.7) 111
II Trimester 135(99.3) 1(0.7) 136 112(82.4) 24(17.6) 136
III Trimester 26(100) 0(0.0) 26 21(80.8) 5(19.2) 26
Barmer
I Trimester 64(90.1) 7(9.9) 71 47(66.2) 24(33.8) 71
II Trimester 43(93.5) 3(6.5) 46 28(60.9) 18(39.1) 46
III Trimester 28(80.0) 7(20.0) 35 20(57.1) 15(42.9) 35
Dungarpur
I Trimester 120(98.4) 2(1.6) 122 116(95.1) 6(4.9) 122
II Trimester 146(99.3) 1(0.7) 147 133(90.5) 14(9.5) 147
III Trimester 37(94.9) 2(5.1) 39 35(89.7) 4(10.3) 39
Sawai Madhopur
I Trimester 72(98.6) 1(1.4) 73 64(87.7) 9(12.3) 73
II Trimester 99(99.0) 1(1.0) 100 86(86.0) 14(14.0) 100
III Trimester 33(100.0) 0(0.0) 33 29(87.8) 4(12.2) 33
Tonk
I Trimester 102(98.1) 2(1.9) 104 62(59.6) 42(40.3) 104
II Trimester 96(99.0) 1(1.0) 97 74(76.3) 23(23.7) 97
III Trimester 14(93.3) 1(6.7) 15 11(73.3) 4(26.7) 15
Total
I Trimester 469(97.5) 12(2.4) 481 377(78.4) 104(21.6) 481
II Trimester 522(98.6) 7(1.3) 529 433(82.3) 93(17.7) 526
III Trimester 157(94.5) 9(5.4) 166 116(78.4) 32(21.6) 148
Table 38: ANC registration and services availed: responses of Pregnant Women
Districts Respondents Registered 2TT ³ 90 IFA Tablets
Baran 136 130 75(57.7) 17(13.1)
Barmer 121 68 28(41.2) 7(10.3)
Dungarpur 117 102 66(64.7) 9(8.8)
Sawai Madhopur 155 135 103(76.3) 21(15.6)
Tonk 142 131 78(59.5) 19(14.5)
Total 671 566 350(61.8) 73(12.9)
Table 39: ANC registration and services availed: responses of Lactating Mothers
Districts Respondents Registered 2TT ³ 90 IFA Tablets
Baran 274 273 216(79.1) 53(19.4)
Barmer 276 152 115(75.7) 22(14.5)
Dungarpur 310 308 286(92.9) 56(18.2)
Sawai Madhopur 209 206 193(93.7) 51(24.8)
Tonk 255 216 177(81.9) 32(14.8)
Total 1294 1155 987(85.5) 214(18.5)

SIHFW: an ISO:9001:2008certif ied institution
KABP on continuum of care: Rapid Assessment: Oct 2009
43
Of the 566 registered pregnant
women 61.8% had two shots of
tetanus toxoid but only 12.9% had
90 or more than 90 IFA tablets.
Whereas for lactating women this
percentage was 85.5% and 18.5%
respectively.
Table 40: Food fads and Pregnancy: responses of Pregnant Women
Districts Respondent
s
Food Prohibited During Pregnancy
Milk Products Spicy Foods Multiple Choice* No Specific Foods
Baran 136 11( 8.1) 5 (3.7) 25 (34) 95 (69.9)
Barmer 121 1 (0.8) 0 (0.0) 7(5.7) 113 (93.4)
Dungarpur 117 7 (6.0) 9 (7.7) 22 (18.8) 79 (67.5)
S. Madhopur 155 2 (1.3) 6 (3.9) 115 (74.2) 32 (20.6)
Tonk 142 18 (12.7) 1 (0.7) 42 (29.5) 81 (57.0)
Total 671 39 (5.8) 21 (3.1) 211 (31.4) 400 (59.6)
Table 41: Food fads and Pregnancy: responses of Lactating Mothers
Districts Responden
ts
Food Prohibited During Pregnancy
Milk Products Spicy Foods Multiple Choice* No Specific Foods
Baran 274 14 (5.1) 22 (8.0) 43 (15.6) 195 (71.2)
Barmer 276 1 (0.4) 7 (2.5) 7 (2.5) 261 (94.6)
Dungarpur 310 37 (11.9) 17 (5.5) 44 (14.2) 212 (68.4)
S. Madhopur 209 1 (0.5) 6 (2.9) 163(77.9) 39 (18.7)
Tonk 225 29 (12.9) 1 (0.4) 68 (30.2) 127 (56.4)
Total 1294 82 (6.3) 53 (4.1) 325 (25.1) 834 (64.5)
Table 42: Food fads and Pregnancy: responses of Mothers-in-law
Districts Respondent
s
Food Prohibited During Pregnancy
Milk Products Spicy Foods Multiple Choice* No Specific Foods
Baran 266 28 (10.5) 10 (3.8) 59 (22.2) 169 (63.5)
Barmer 233 0 (0.0) 0 (0.0) 3 (1.3) 230 (98.7)
Dungarpur 174 18 (10.3) 27 (15.5) 13 (7.4) 116 (66.7)
S. Madhopur 159 2 (1.3) 2 (1.3) 112 (70.4) 43 (27.0)
Tonk 257 34 (13.2) 3 (1.2) 90 (35.1) 130 (50.6)
Total 1089 82 (7.5) 42 (3.9) 277 (25.4) 688 (63.2)
0
20
40
60
80
100
2TT =90 IFA Tablets
61.8
12.9
85.5
18.5Perc
en
tag
e
ANC registration & Services availed
Pregnant(566)
Lactating(1155)

SIHFW: an ISO:9001:2008certif ied institution
KABP on continuum of care: Rapid Assessment: Oct 2009
44
The cultural inheritance has laid down certain norms regarding food fads which at times are lucid
but often are unreasoned. Once again a positive finding is that 60% of the subjects from each of
the category were against any food restriction during pregnancy and/or lactation. As anticipated
the common food items that are not recommended during the physiological phase were Jaggery,
papaya, spicy food, rice, besan, banana, groundnut and tomato and they have their own reasons
like these foods would complicate delivery or may facilitate unwanted abortion.
Table 43: Extra Diet taken during pregnancy: responses of Pregnant Women
Districts
Res
pond
ents
Extra Diet Taken during pregnancy
Ghee Fruits Green
Vegetables
Milk All Normal
Diet Others
* Multiple Choice**
Baran 136 1(0.7) 1(0.7) 5(3.7) 1(0.7) 37(27.2) 62(45.6) 2(1.5) 27(19.9)
Barmer 121 4(3.3) 2(1.7) 0(0.0) 0(0.0) 1(0.8) 81(66.9) 0(0.0) 33(27.3)
Dungarpur 117 1(0.9) 0(0.0) 11(9.4) 5(4.3) 18(15.4) 58(49.6) 0(0.0) 24(20.5)
S. Madhopur 155 0(0.0) 3(1.9) 0(0.0) 12(7.7) 11(7.1) 10(6.5) 1(0.6) 118(76.1)
Tonk 142 0(0.0) 0(0.0) 15(10.6) 1(0.7) 14(9.9) 41(28.9) 0(0.0) 71(50.0)
Total 671 6(0.9) 6(0.9) 31(4.6) 19(2.8) 81(12.1) 252(37.6) 3(0.4) 273(40.7)
* Buttermilk, Dry Fruits, Rabri
** Ghee, Fruits, Green vegetables, Jaggery, Milk, Buttermilk, Juice, Rice, Halw a, Dry Fruits, Gram, Curd, Rabri
Table 44: Extra Diet taken during pregnancy: responses of Lactating Mothers
Districts
Res
pond
ents
Extra Diet Taken during pregnancy
Ghee Fruits Green
Vegetables
Milk All Normal
Diet Others
* Multiple Choice**
Baran 274 0(0.0) 1(0.4) 1(0.4) 2(0.7) 58(21.2) 123(44.9) 3(1.1) 86(31.4)
Barmer 276 21(7.6) 0(0.0) 1(0.4) 1(0.4) 0(0.0) 174(63.0) 0(0.0) 79(28.6)
Dungarpur 310 4(1.3) 2(0.6) 10(3.2) 4(1.3) 74(23.9) 131(42.3) 0(0.0) 85(27.4)
S. Madhopur 209 0(0.0) 7(3.3) 0(0.0) 11(5.3) 10(4.8) 12(5.7) 2(1.0) 167(79.9)
Tonk 225 4(1.8) 7(3.1) 18(8.0) 2(0.9) 43(19.1) 65(28.9) 0(0.0) 86(38.2)
Total 1294 29(2.2) 17(1.3) 30(2.3) 20(1.5) 185(14.3) 505(39.0) 5(0.4) 503(38.9)
* Buttermilk, Dry Fruits, Rabri
** Ghee, Fruits, Green vegetables, Jaggery, Milk, Buttermilk, Juice, Rice, Halw a, Dry Fruits, Gram, Curd, Rabri

SIHFW: an ISO:9001:2008certif ied institution
KABP on continuum of care: Rapid Assessment: Oct 2009
45
Table 45: Extra Diet taken during pregnancy: responses of Mothers-in-law
Districts
Res
pond
ents
Extra Diet Taken during pregnancy
Ghee Fruits Green
Vegetables
Milk All Normal
Diet Others
* Multiple Choice**
Baran 266 0(0.0) 0(0.0) 7(2.6) 4(1.5) 18(6.8) 131(49.2) 3(1.1) 103(38.7)
Barmer 233 12(5.2) 1(0.4) 0(0.0) 1(0.4) 1(0.4) 142(60.9) 0(0.0) 76(32.6)
Dungarpur 174 2(1.1) 0(0.0) 9(5.2) 6(3.4) 41(23.6) 68(39.1) 0(0.0) 48(27.6)
S. Madhopur 159 1(0.6) 1(0.6) 3(1.9) 6(3.8) 19(11.9) 8(5.0) 1(0.6) 120(75.5)
Tonk 257 0(0.0) 8(3.1) 15(5.8) 2(0.8) 52(20.2) 73(28.4) 0(0.0) 107(41.6)
Total 1089 15(1.4) 10(0.9) 34(3.1) 19(1.7) 131(12.0) 422(38.8) 4(0.4) 454(41.7)
* Buttermilk, Dry Fruits, Rabri
** Ghee, Fruits, Green vegetables, Jaggery, Milk, Buttermilk, Juice, Rice, Halw a, Dry Fruits, Gram, Curd, Rabri
37.6% pregnant and 39% lactating mothers restricted themselves to normal diet during
pregnancy. 38.8% mothers-in-law also advocated normal diet during pregnancy.
14.3% lactating respondents took Milk, Ghee, Fruits & Green vegetables during pregnancy and
this was maximally found in respondents of Dungarpur (23.9%).
Maximum respondents 40.7% pregnant, 38.9% lactating and 41.7% mother in law quoted multiple
things to be taken during pregnancy such as Ghee, Fruits, Green vegetables, Jaggery, Milk,
Buttermilk, Juice, Rice, Halwa, Dry Fruits, Gram, Curd, Rabri.
Table 46: Knowledge regarding warning signals during pregnancy: responses of
Pregnant Women
Districts
Res
pond
ents
Knowledge about warning signals
Bleeding/
discharge
Reduced
Foetal Movem
ents
High BP,Oedem
a
Sudden
Weight Increas
e
Pallor,Weakn
ess All High
Fever Don’t Know
Multiple Respon
ses*
Baran 136 6
(4.4) 0
(0.0) 18
(13.2) 0
(0.0) 3
(2.2) 0
(0.0) 1
(0.7) 65
(47.9) 44
(32.4)
Barmer 121 4
(3.3) 0
(0.0) 19
(15.7) 0
(0.0) 0
(0.0) 0
(0.0) 1
(0.8) 86
(71.1) 11
(9.1)
Dungarpur 117 2
(1.7) 3
(2.6) 14
(12.0) 2
(1.7) 7
(6.0) 1
(0.9) 0
(0.0) 74
(63.2) 14
(12.0) S. Madhopur
155 0
(0.0) 6
(3.9) 19
(12.3) 0
(0.0) 21
(13.5) 2
(1.3) 1
(0.6) 63
(40.6) 43
(27.7)
Tonk 142 1
(0.7) 2
(1.4) 3
(2.1) 0
(0.0) 0
(0.0) 5
(3.5) 0
(0.0) 117
(82.4) 14
(9.9)
Total 671 13
(1.9) 11
(1.6) 73
(10.9) 2
(0.3) 31
(4.6) 8
(1.2) 3
(0.4) 404
(60.2) 126
(18.8)
* Bleeding, No movement of child, High B.P., Sw elling on hands and feet , Sudden weight increase (more than 3 kg in a
month), Low hemoglobin, Convulsions, Constipation, Stomach ache, Insomnia, Leg pain, White discharge (Leucorrhoea),
Acidity, Headaches, Weakness, Fever, Pneumonia, Backache, Vomiting.
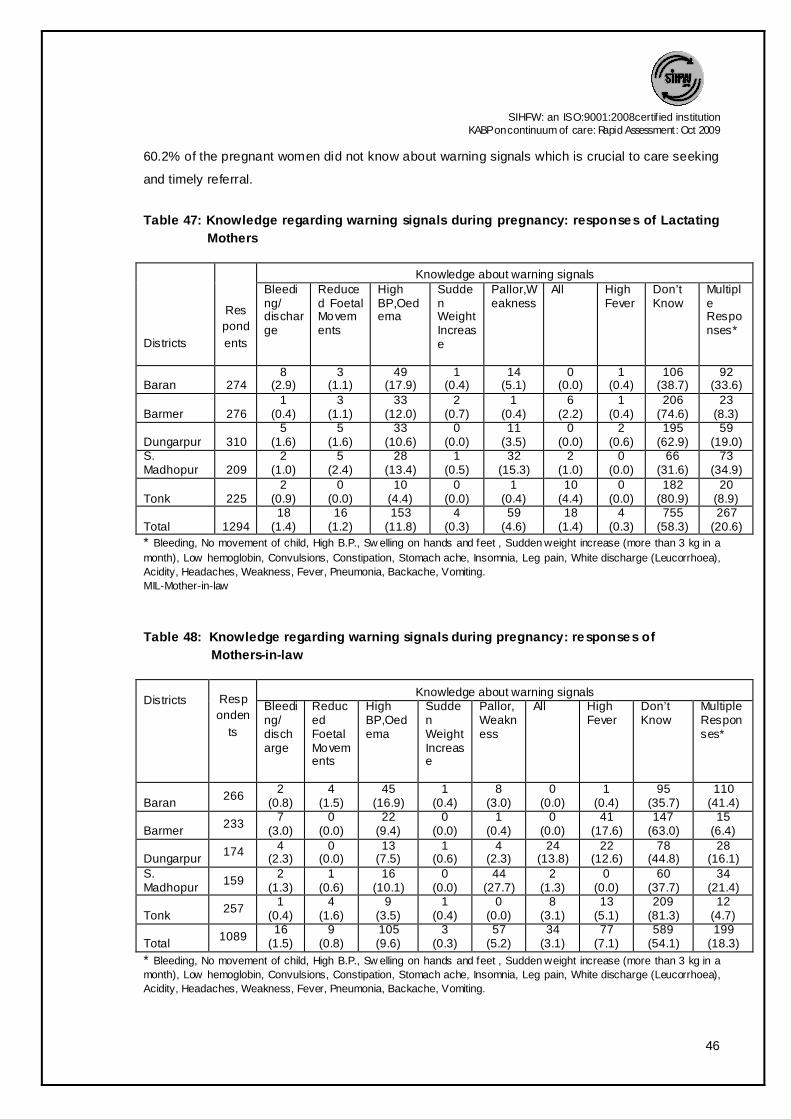
SIHFW: an ISO:9001:2008certif ied institution
KABP on continuum of care: Rapid Assessment: Oct 2009
46
60.2% of the pregnant women did not know about warning signals which is crucial to care seeking
and timely referral.
Table 47: Knowledge regarding warning signals during pregnancy: responses of Lactating
Mothers
Districts
Res
pond
ents
Knowledge about warning signals Bleeding/ discharge
Reduced Foetal Movements
High BP,Oedema
Sudden Weight Increase
Pallor,Weakness
All High Fever
Don’t Know
Multiple Responses*
Baran 274 8
(2.9) 3
(1.1) 49
(17.9) 1
(0.4) 14
(5.1) 0
(0.0) 1
(0.4) 106
(38.7) 92
(33.6)
Barmer 276 1
(0.4) 3
(1.1) 33
(12.0) 2
(0.7) 1
(0.4) 6
(2.2) 1
(0.4) 206
(74.6) 23
(8.3)
Dungarpur 310 5
(1.6) 5
(1.6) 33
(10.6) 0
(0.0) 11
(3.5) 0
(0.0) 2
(0.6) 195
(62.9) 59
(19.0) S. Madhopur 209
2 (1.0)
5 (2.4)
28 (13.4)
1 (0.5)
32 (15.3)
2 (1.0)
0 (0.0)
66 (31.6)
73 (34.9)
Tonk 225 2
(0.9) 0
(0.0) 10
(4.4) 0
(0.0) 1
(0.4) 10
(4.4) 0
(0.0) 182
(80.9) 20
(8.9)
Total 1294 18
(1.4) 16
(1.2) 153
(11.8) 4
(0.3) 59
(4.6) 18
(1.4) 4
(0.3) 755
(58.3) 267
(20.6)
* Bleeding, No movement of child, High B.P., Sw elling on hands and feet , Sudden weight increase (more than 3 kg in a
month), Low hemoglobin, Convulsions, Constipation, Stomach ache, Insomnia, Leg pain, White discharge (Leucorrhoea),
Acidity, Headaches, Weakness, Fever, Pneumonia, Backache, Vomiting.
MIL-Mother-in-law
Table 48: Knowledge regarding warning signals during pregnancy: responses of
Mothers-in-law
Districts
Resp
onden
ts
Knowledge about warning signals Bleeding/ discharge
Reduced Foetal Movements
High BP,Oedema
Sudden Weight Increase
Pallor,Weakness
All High Fever
Don’t Know
Multiple Responses*
Baran 266
2 (0.8)
4 (1.5)
45 (16.9)
1 (0.4)
8 (3.0)
0 (0.0)
1 (0.4)
95 (35.7)
110 (41.4)
Barmer 233
7 (3.0)
0 (0.0)
22 (9.4)
0 (0.0)
1 (0.4)
0 (0.0)
41 (17.6)
147 (63.0)
15 (6.4)
Dungarpur 174 4
(2.3) 0
(0.0) 13
(7.5) 1
(0.6) 4
(2.3) 24
(13.8) 22
(12.6) 78
(44.8) 28
(16.1) S. Madhopur
159 2
(1.3) 1
(0.6) 16
(10.1) 0
(0.0) 44
(27.7) 2
(1.3) 0
(0.0) 60
(37.7) 34
(21.4)
Tonk 257
1 (0.4)
4 (1.6)
9 (3.5)
1 (0.4)
0 (0.0)
8 (3.1)
13 (5.1)
209 (81.3)
12 (4.7)
Total 1089
16 (1.5)
9 (0.8)
105 (9.6)
3 (0.3)
57 (5.2)
34 (3.1)
77 (7.1)
589 (54.1)
199 (18.3)
* Bleeding, No movement of child, High B.P., Sw elling on hands and feet , Sudden weight increase (more than 3 kg in a
month), Low hemoglobin, Convulsions, Constipation, Stomach ache, Insomnia, Leg pain, White discharge (Leucorrhoea),
Acidity, Headaches, Weakness, Fever, Pneumonia, Backache, Vomiting.
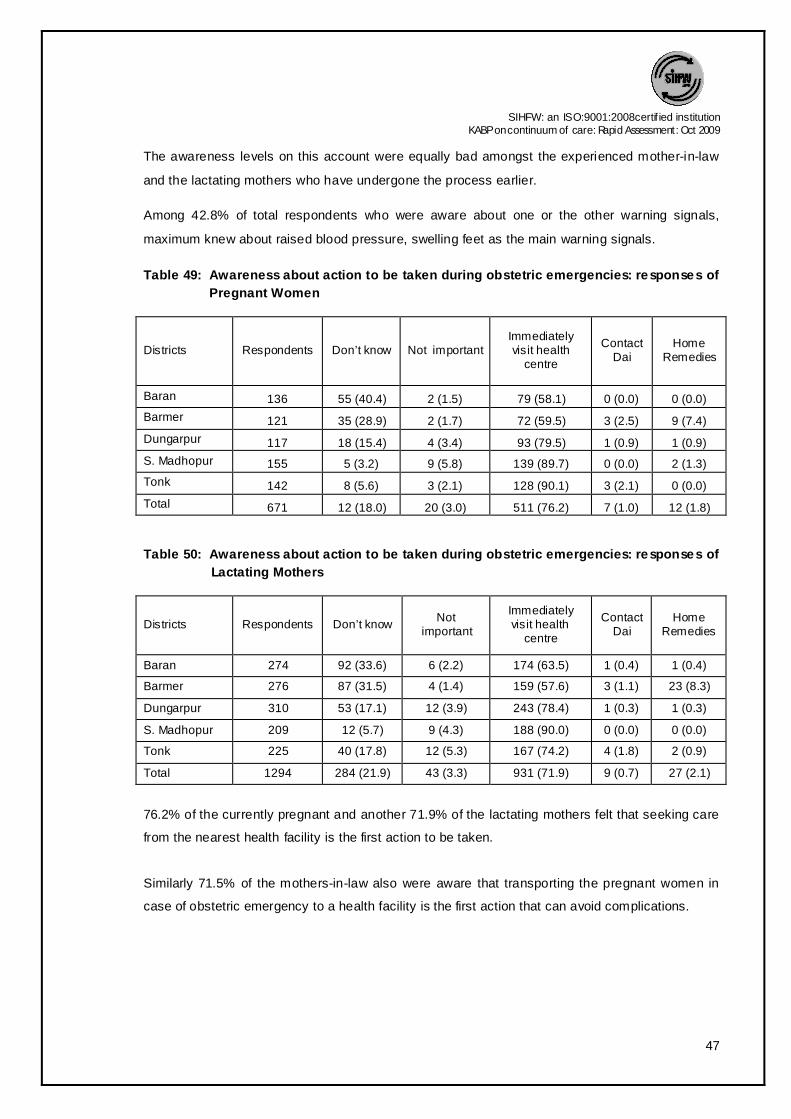
SIHFW: an ISO:9001:2008certif ied institution
KABP on continuum of care: Rapid Assessment: Oct 2009
47
The awareness levels on this account were equally bad amongst the experienced mother-in-law
and the lactating mothers who have undergone the process earlier.
Among 42.8% of total respondents who were aware about one or the other warning signals,
maximum knew about raised blood pressure, swelling feet as the main warning signals.
Table 49: Awareness about action to be taken during obstetric emergencies: responses of
Pregnant Women
Districts Respondents Don’t know Not important Immediately visit health
centre
Contact Dai
Home Remedies
Baran 136 55 (40.4) 2 (1.5) 79 (58.1) 0 (0.0) 0 (0.0)
Barmer 121 35 (28.9) 2 (1.7) 72 (59.5) 3 (2.5) 9 (7.4)
Dungarpur 117 18 (15.4) 4 (3.4) 93 (79.5) 1 (0.9) 1 (0.9)
S. Madhopur 155 5 (3.2) 9 (5.8) 139 (89.7) 0 (0.0) 2 (1.3)
Tonk 142 8 (5.6) 3 (2.1) 128 (90.1) 3 (2.1) 0 (0.0)
Total 671 12 (18.0) 20 (3.0) 511 (76.2) 7 (1.0) 12 (1.8)
Table 50: Awareness about action to be taken during obstetric emergencies: responses of
Lactating Mothers
Districts Respondents Don’t know Not
important
Immediately visit health
centre
Contact Dai
Home Remedies
Baran 274 92 (33.6) 6 (2.2) 174 (63.5) 1 (0.4) 1 (0.4)
Barmer 276 87 (31.5) 4 (1.4) 159 (57.6) 3 (1.1) 23 (8.3)
Dungarpur 310 53 (17.1) 12 (3.9) 243 (78.4) 1 (0.3) 1 (0.3)
S. Madhopur 209 12 (5.7) 9 (4.3) 188 (90.0) 0 (0.0) 0 (0.0)
Tonk 225 40 (17.8) 12 (5.3) 167 (74.2) 4 (1.8) 2 (0.9)
Total 1294 284 (21.9) 43 (3.3) 931 (71.9) 9 (0.7) 27 (2.1)
76.2% of the currently pregnant and another 71.9% of the lactating mothers felt that seeking care
from the nearest health facility is the first action to be taken.
Similarly 71.5% of the mothers-in-law also were aware that transporting the pregnant women in
case of obstetric emergency to a health facility is the first action that can avoid complications.

SIHFW: an ISO:9001:2008certif ied institution
KABP on continuum of care: Rapid Assessment: Oct 2009
48
Table 51: Awareness about action to be taken during obstetric emergencies: responses of
Mothers-in-law
Districts Respondents Don’t know
Not important Immediately visit
Health centre
Contact
Dai
Home
Remedies
Baran 266 80 (30.1) 8 (3.0) 174 (65.4) 2 (0.8) 2 (0.8)
Barmer 233 85 (36.5) 3 (1.3) 132 (56.7) 1 (0.4) 12 (5.2)
Dungarpur 174 34 (19.5) 8 (4.6) 131 (75.3) 0 (0.0) 1 (0.6)
S. Madhopur 159 17 (10.7) 7 (4.4) 134 (84.3) 0 (0.0) 1 (0.6)
Tonk 257 28 (10.9) 10 (3.9) 208 (80.9) 3 (1.2) 8 (3.1)
Total 1089 244 (22.4) 36 (3.3) 779 (71.5) 6 (0.6) 24 (2.2)
Table 52: Action taken for warning signals during pregnancy: responses of Pregnant
Women
District Respondents
Respondents with warning signals
Yes No No action taken
Immediately went to SC
Went to SC after few days
Went to Dai
Traditional remedies
Baran 136 20 (14.7) 2 (10.0) 16 (80.0) 2 (10.0) 0 (0.0) 0 (0.0) 116( 85.3)
Barmer 121 21 (17.4) 5 (23.8) 11 (52.4) 3 (14.3) 1 (4.8) 1 (4.8) 100 (82.6)
Dungarpur 117 22 (18.8) 1 (4.5) 17 (77.3) 4 (18.2) 0 (0.0) 0 (0.0) 95 (81.2)
S. Madhopur 155 65 (41.9) 28 (43.1) 21 (32.3) 15 (23.1) 0 (0.0) 1 (1.5) 90 (58.1)
Tonk 142 16 (11.3) 4 (25.0) 10 (62.5) 1 (6.3) 1 (6.3) 0 (0.0) 126 (88.7)
Total 671 144(21.5) 40 (27.8) 75 (52.1) 25 (17.4) 2 (1.4) 2 (1.4) 527 (78.5)
Almost 69.5% of the currently pregnant women and 78.4% of the lactating mothers did go to a
sub center or health facility immediately or after buying a little time.
86.9% of their mothers-in-law also resorted to the same practice.
Table 53: Action taken for warning signals during pregnancy: responses of Lactating
Mothers
District
Respondents
If yes what action did you take
Not any action
taken
Immediately
went to SC
Went to SC
after few
days
Go to
Dai
Traditional
remedies
Baran 54 9 (16.7) 35 (64.8) 10 (18.5) 0 (0.0) 0 (0.0)
Barmer 55 9 (16.4) 32 (58.2) 8 (14.5) 2 (3.6) 4 (7.3)
Dungarpur 59 1 (1.7) 51 (86.4) 7 (11.9) 0 (0.0) 0 (0.0)
S. Madhopur 113 38 (33.6) 49 (43.4) 25 (22.1) 0 (0.0) 1 (0.9)
Tonk 20 0 (0.0) 15 (75.0) 4 (20.0) 1 (5.0) 0 (0.0)
Total 301 57 (18.9) 182 (60.5) 54 (17.9) 3 (1.0) 5 (1.7)
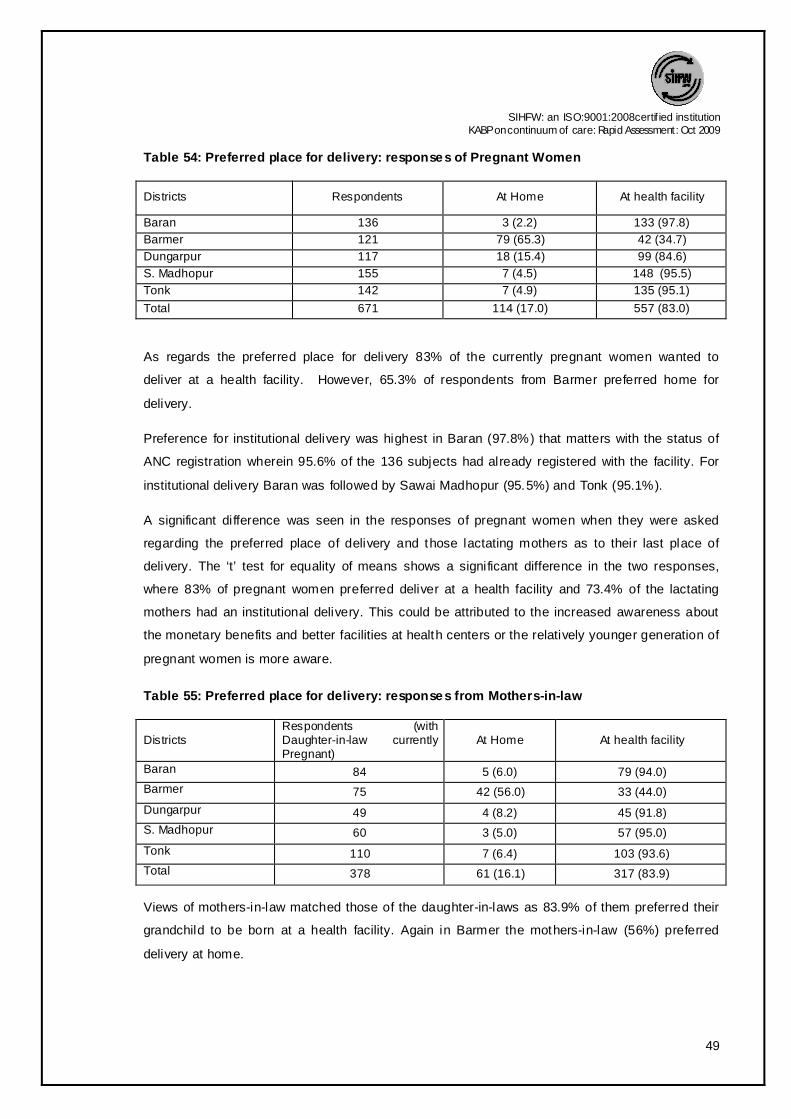
SIHFW: an ISO:9001:2008certif ied institution
KABP on continuum of care: Rapid Assessment: Oct 2009
49
Table 54: Preferred place for delivery: responses of Pregnant Women
Districts Respondents At Home At health facility
Baran 136 3 (2.2) 133 (97.8)
Barmer 121 79 (65.3) 42 (34.7)
Dungarpur 117 18 (15.4) 99 (84.6)
S. Madhopur 155 7 (4.5) 148 (95.5)
Tonk 142 7 (4.9) 135 (95.1)
Total 671 114 (17.0) 557 (83.0)
As regards the preferred place for delivery 83% of the currently pregnant women wanted to
deliver at a health facility. However, 65.3% of respondents from Barmer preferred home for
delivery.
Preference for institutional delivery was highest in Baran (97.8%) that matters with the status of
ANC registration wherein 95.6% of the 136 subjects had already registered with the facility. For
institutional delivery Baran was followed by Sawai Madhopur (95.5%) and Tonk (95.1%).
A significant difference was seen in the responses of pregnant women when they were asked
regarding the preferred place of delivery and those lactating mothers as to their last place of
delivery. The ‘t’ test for equality of means shows a significant difference in the two responses,
where 83% of pregnant women preferred deliver at a health facility and 73.4% of the lactating
mothers had an institutional delivery. This could be attributed to the increased awareness about
the monetary benefits and better facilities at health centers or the relatively younger generation of
pregnant women is more aware.
Table 55: Preferred place for delivery: responses from Mothers-in-law
Districts Respondents (with Daughter-in-law currently Pregnant)
At Home At health facility
Baran 84 5 (6.0) 79 (94.0)
Barmer 75 42 (56.0) 33 (44.0)
Dungarpur 49 4 (8.2) 45 (91.8)
S. Madhopur 60 3 (5.0) 57 (95.0)
Tonk 110 7 (6.4) 103 (93.6)
Total 378 61 (16.1) 317 (83.9)
Views of mothers-in-law matched those of the daughter-in-laws as 83.9% of them preferred their
grandchild to be born at a health facility. Again in Barmer the mothers-in-law (56%) preferred
delivery at home.

SIHFW: an ISO:9001:2008certif ied institution
KABP on continuum of care: Rapid Assessment: Oct 2009
50
Table 56: Reasons for home delivery: responses of Pregnant Women
Districts Respondents
Reasons Usually
deliveries are
conducted at home
Facility available at
home for delivery
Delivery at home is
inexpensive
Distant SC Family members want
Baran 3 1 (33.3) 1 (33.3) 1 (33.3) 0 (0.0) 0 (0.0)
Barmer 79 12 (15.2) 23 (29.1) 12 (15.2) 16 (20.3) 16 (20.3)
Dungarpur 18 7 (38.9) 0 (0.0) 6 (33.3) 2 (11.1) 3 (16.7)
S. Madhopur 7 4 (57.1) 2 (28.6) 0 (0.0) 0 (0.0) 1 (14.3)
Tonk 7 4 (57.1) 1 (14.3) 0 (0.0) 0 (0.0) 2 (28.6)
Total 114 28 (24.6) 27 (23.7) 19 (16.7) 18 (15.8) 22 (19.3)
The prime reason for preferring home for delivery was the fact that usually deliveries are
conducted at home (24.6%) followed by facilities available at home-23.7% (ANMs/Dai are called
at home to conduct the delivery).
The pressure from family members (19.3%), and the perception that home deliveries are
inexpensive (16.7%) turned out to be reasons for preferring delivery at home. 20.3% of Barmer
respondents preferred home for delivery because of distance of health facility.
Table 57: Reasons for home delivery: responses of Mothers-in-law
Districts Respondents.
Usually deliveries are conducted at
home
Facility available at home for delivery
Delivery at home is
inexpensive
Distant SC
Family members want
Baran 0 0 (0.0) 0 (0.0) 0 (0.0) 0 (0.0) 0 (0.0)
Barmer 41 11 (26.8) 12 (29.3) 5 (12.2) 6 (14.6) 7 (17.1)
Dungarpur 4 1 (25.0) 0 (0.0) 1 (25.0) 1 (25.0) 1 (25.0)
S. Madhopur 1 1 (100.0 0 (0.0) 0 (0.0) 0 (0.0) 0 (0.0)
Tonk 6 1 (16.7) 2 (33.3) 0 (0.0) 0 (0.0) 3 (50.0)
Total 52 14 (26.9) 14 (26.9) 6 (11.5) 7 (13.5) 11 (21.2)
Mothers-in-law favored home deliveries as customarily deliveries are conducted at home (26.9%)
and all facilities for home delivery are available (26.9%).
21.2% respondents stated family members preferred home delivery while 13.5% respondents
quoted distance problem as the reason and that was maximum in Dungarpur (25.0%) and Barmer
(14.6%) in the respective category of reasons.

SIHFW: an ISO:9001:2008certif ied institution
KABP on continuum of care: Rapid Assessment: Oct 2009
51
Table 58: Reasons for institutional delivery: responses of Pregnant Women
Districts Respondents JSY Benefits
Better facilities available
Experts available
Safe delivery
Motivated by health worker
Baran 133 30 (22.6) 64 (48.1) 3 (2.3) 33 (24.8) 3 (2.3) Barmer
42 7 (16.7) 29 (69.0) 0 (0.0) 3 (7.1) 3 (7.1) Dungarpur
99 12 (12.1) 34 (34.3) 8 (8.1) 40 (40.4) 5 (5.1) S. Madhopur
148 32 (21.6) 95 (64.2) 12 (8.1) 9 (6.1) 0 (0.0) Tonk 135 16 (11.9) 74 (54.8) 8 (5.9) 35 (25.9) 2 (1.5) Total 557 97 (17.4) 296 (53.1) 31 (5.6) 120 (21.5) 13 (2.3)
Table 59: Reasons for institutional delivery: responses of Mothers-in-law
Districts Respondents JSY Benefits
Better facilities available
Experts available
Safe delivery
Motivated by health worker
Baran 79 22 (27.8) 35 (44.3) 3 (3.8) 16 (20.3) 3 (3.8)
Barmer 33 9 (27.3) 18 (54.5) 1 (3.0) 3 (9.1) 2 (6.1)
Dungarpur 45 5 (11.1) 13 (28.9) 6 (13.3) 18 (40.0) 3 (6.7)
S. Madhopur 57 13 (22.8) 32 (56.1) 7 (12.3) 4 (7.0) 1 (1.8)
Tonk 103 4 (3.9) 65 (63.1) 7 (6.8) 26 (25.2) 1 (1.0)
Total 317 53 (16.7) 163(51.4) 24 (7.6) 67 (21.1) 10 (3.2)
Among all the respondents (PW & MIL) who were in favor of institutional delivery, the driving force
was better facilities at health centre (53.1%-PW & 51.4%-MIL). Monetary benefits under JSY,
contrary to the common understanding, motivated only 17.4% PW & 16.7% mothers-in-law to go
for institutional delivery.
Table 60: Reasons for institutional delivery: responses of Lactating Mothers
Districts Respond
ents
Reasons
JSY Benefits
Better facilities available
Experts available Safe delivery
Motivated by health worker
Baran 253 53 (20.9) 126 (49.8) 15 (5.9) 53 (20.9) 6 (2.4)
Barmer 84 17 (20.2) 49 (58.3) 5 (6.0) 12 (14.3) 1 (1.2)
Dungarpur 263 31 (11.8) 79 (30.0) 38 (14.4) 101 (38.4) 14 (5.3)
S. Madhopur 177 43 (24.3) 106 (59.9) 11 (6.2) 12 (6.8) 5 (2.8)
Tonk 173 12 (6.9) 91 (52.6) 7 (4.0) 54 (31.2) 9 (5.2)
Total 950 156 (16.4) 451 (47.5) 76 (8.0) 232 (24.4) 35 (3.7)

SIHFW: an ISO:9001:2008certif ied institution
KABP on continuum of care: Rapid Assessment: Oct 2009
52
Table 61: Reasons for institutional delivery: responses of Mothers-in-law
Districts Respondents
Reasons
JSY Benefits
Better facilities available
Experts available
Safe delivery Motivated by health worker
Baran 203 47 (23.2) 116 (57.1) 7 (3.4) 30 (14.8) 3 (1.5)
Barmer 64 9 (14.1) 39 (60.9) 2 (3.1) 11 (17.2) 3 (4.7)
Dungarpur 139 5 (3.6) 50 (36.0) 19 (13.7) 61 (43.9) 4 (2.9)
S. Madhopur 108 22 (20.4) 77 (71.3) 5 (4.6) 3 (2.8) 1 (0.9)
Tonk 146 10 (6.8) 74 (50.7) 18 (12.3) 35 (24.0) 9 (6.2)
Total 660 93 (14.1) 356 (53.9) 51 (7.7) 140 (21.2) 20 (3.0)
Reasons assigned for institutional delivery were availability of better facilities by 47.5% lactating
mothers and 53.9% mothers-in-law. Once again JSY benefits lured only 16.4% of lactating
mothers and 14.1% of their mothers-in-law.
Table 62: Place of last delivery: responses of Lactating Mothers
Districts Respondents At Home At health facility
Baran 274 21 (7.7) 253 (92.3)
Barmer 276 192 (69.6) 84 (30.4)
Dungarpur 310 47 (15.2) 263 (84.8)
S. Madhopur 209 32 (15.3) 177 (84.7)
Tonk 225 52 (23.1) 173 (76.9)
Total 1294 344 (26.6) 950 (73.4)
With the JSY scheme gaining popularity, institutional deliveries have been on an increase. The
lactating mothers were asked about the place where they had delivered their last baby and 73.4%
of them promptly replied “health facility”.
The highest home deliveries took place in Barmer, as responded by 69.6% of the lactating
mothers. This could be attributed to the inaccessible terrain of the area. Only 7.7% of the women
of Baran had their last child delivered at home.
The responses of the mothers-in-law also supported those of the lactating mothers as daughter-
in-laws, 73.5% of them delivered their last baby in a health center.

SIHFW: an ISO:9001:2008certif ied institution
KABP on continuum of care: Rapid Assessment: Oct 2009
53
Table 63: Place of last delivery: responses of Mothers-in-law
Districts Respondents At Home At health facility
Baran 216 13 (6.0) 203 (94.0)
Barmer 204 140 (68.6) 64 (31.4)
Dungarpur 166 27 (16.3) 139 (83.7)
S. Madhopur 126 18 (14.3) 108 (85.7)
Tonk 186 38 (21.5) 146 (78.5)
Total 898 233 (26.5) 660 (73.5)
Table 64: Reasons for last delivery at home: responses of Lactating Mothers
District
Respondents
Reasons Labor pains
No one to
accompany
Distance Family practice
Facility at home
Inexpensive
Family pressur
e
Baran 21 13 (61.9) 3(14.3) 0 (0.0) 3 (14.3) 0 (0.0) 0 (0.0) 2 (9.5)
Barmer 192 16 (8.3) 5 (2.6) 39(20.3) 39 (20.3) 45 (23.4) 15 (7.8) 33(17.2)
Dungarpur 47 22 (46.8) 1 (2.1) 3 (6.4) 11 (23.4) 1 (2.1) 2 (4.3) 7 (14.9)
S. Madhopur 32 22 (68.8) 2 (6.3) 3 (9.4) 2 (6.3) 0 (0.0) 2 (6.3) 1(3.1)
Tonk 52 27 (51.9) 3 (5.8) 2 (3.8) 2 (3.8) 2 (3.8) 3 (5.8) 13(25.0)
Total 344 100(29.1) 14(4.1) 47 (13.7) 57 (16.6) 48 (14.0) 22 (6.2) 56(16.3)
Lactating mothers who had their last delivery at home, ascribed reasons like labor pains (29.1%)
meaning thereby that they did not have enough time to go to a health facility.
Table 65: Reasons for last delivery made at home: responses of Mothers-In-Law
Districts Respondents
Reasons Labor pains
No one to
accompany
Distance Family practice
Facility at home
Inexpensive
Family pressure
Baran 11 6 (54.5) 2 (18.2) 0 (0.0) 1 (9.1) 0 (0.0) 0 (0.0) 2 (18.2)
Barmer 140 17 (12.1) 5 (3.6) 29 (20.7) 26(18.6) 39 (27.9) 6 (4.3) 18 (12.9)
Dungarpur 26 12 (46.2) 2(7.7) 1(3.8) 7 (26.9) 1 (3.8) 1 (3.8) 2 (7.7)
S. Madhopur 18 8 (44.4) 1(5.6) 4(22.2) 2 (11.1) 1 (5.6) 0 (0.0) 2 (11.1)
Tonk 38 14 (36.8) 3(7.9) 1(2.6) 3 (7.9) 2 (5.3) 5(13.2) 10 (26.3)
Total 233 57 (24.5) 13(5.6) 35(15.0) 39(16.7) 43(18.5) 12(5.2) 34 (14.6)
Once again, onset of labor pains (24.5%) was the prime reason assigned by mothers-in-law for
home delivery, supporting the views of lactating mothers. This suggests that more needs to be
done on birth preparedness plans by families.

SIHFW: an ISO:9001:2008certif ied institution
KABP on continuum of care: Rapid Assessment: Oct 2009
54
18.5% felt that when all the facilities were available at home there was no need to go for
institutional delivery. 27.9% of Barmer mothers-in-law supported this reason.
According to the mothers-in-law from Tonk (26.3%) the decision of family members did play an
important role in deciding the place of delivery.
Table 66: Distribution according to education status and their preferred/last place of
delivery: responses of Pregnant Women
Districts Education status
Place of delivery preferred by pregnant women
Grand Total
At Home At Health facility
Total
Baran IL 2 (2.6) 74(97.4) 76
136
L up to VIII 1 (1.9) 51 (98.1) 52
L above VIII 0 (0.0) 8 (100.0) 8
Barmer IL 67(67.7) 32(32.3) 99
121
L up to VIII 12 (57.1) 9 (42.9) 21
L above VIII 0 (0.0) 1(100.0) 1
Dungarpur IL 15 17.2) 72 (82.8) 87
117
L up to VIII 3 (15.0) 17 (85.0) 20
L above VIII 0 (0.0) 10(100.0) 10
S. Madhopur IL 6 (5.9) 96 (94.1) 102
155
L up to VIII 0 (0.0) 29(100.0) 29
L above VIII 1 (4.2) 23 (95.8) 24
Tonk IL 8 (8.5) 86 (91.5) 94
142
L up to VIII 1 (2.3) 42 (97.7) 43
L above VIII 0 (0.0) 5 (100.0) 5
Total IL 98(14.6) 360(53.7) 458(68.3)
671
L up to VIII 17(2.5) 148(22.1) 165(24.6)
L above VIII 1(0.1) 47(7.0) 48(7.2)

SIHFW: an ISO:9001:2008certif ied institution
KABP on continuum of care: Rapid Assessment: Oct 2009
55
Table 67: Distribution according to education status and their preferred/last place of
delivery: responses of Lactating Mothers
Districts Education status
Last delivery place of Lactating woman
Grand Total At Home
At Health facility Total
Baran IL 16 (9.6) 150(90.4) 166
274
L up to VIII 5 (5.4) 87 (94.6) 92
L above VIII 0 (0.0) 16(100.0) 16
Barmer IL 159(74.6) 54 (25.4) 213
276
L up to VIII 27 (52.9) 24 (47.1) 51
L above VIII 6 (50.0) 6 (50.0) 12
Dungarpur IL 38 (17.8) 176(82.2) 214
310
L up to VIII 9 (14.1) 55 (85.9) 64 L above VIII
0 (0.0) 32(100.0) 32 S. Madhopur IL 21 (15.4) 115(84.6) 136
209
L up to VIII 8 (14.3) 48 (85.7) 56 L above VIII
3 (17.6) 14 (82.4) 17 Tonk IL 35 (22.3) 122 77.7) 157
225
L up to VIII 15 (24.4) 47 (75.8) 62 L above VIII
2 (33.3) 4 (66.7) 6 Total IL 269(20.7) 617(47.7) 886(68.5)
1294
L up to VIII 64(4.9) 261(20.2) 316(24.4) L above VIII
11(0.9) 72(5.6) 83(6.4)
A sizeable number of illiterate
women, either currently
pregnant (53.7%) or lactating
(47.7%) have/had opted for
delivery at the facility as
compared to the educated
populace included in the study
and cannot be supported by any
kind of lucidity but for the
monetary benefits attached to
an Institutional Delivery.
0
20
40
60
80
Home Health facility
Home Health facility
Home Health facility
14.6
53.7
2.5
22.1
0.17
47.7
68.5
20.224.4
5.6 6.4Perc
en
tag
e
Distribution according to education status and
preferred/last place of delivery
Pregnant
Lactating

SIHFW: an ISO:9001:2008certif ied institution
KABP on continuum of care: Rapid Assessment: Oct 2009
56
Table 68: Distribution of Lactating Women who had Institutional Delivery in relation to their
parity and education District Education status Para I Para II Multi Para
Baran
IL 29(20.4) 64(33.9) 57(19.9)
L up to VIII 24(24.2) 32(34.8) 31(44.3)
L above VIII 9(22.5) 6(23.1) 1(16.7)
Barmer
IL 11(7.7) 12(6.3) 31(10.8)
L up to VIII 14(14.1) 7(7.6) 3(4.3)
L above VIII 3(7.5) 2(7.7) 1(16.7)
Dungarpur
IL 38(26.8) 35(18.5) 103(36.0)
L up to VIII 23(23.2) 18(19.6) 14(20.0)
L above VIII 21(52.5) 9(34.6) 2(33.3)
Sawai Madhopur
IL 24(16.9) 35(18.5) 56(19.6)
L up to VIII 16(16.2) 18(19.6) 14(20.0)
L above VIII 5(12.5) 8(30.8) 1(16.7)
Tonk
IL 40(28.2) 43(22.8) 39(13.6)
L up to VIII 22(22.2) 17(18.5) 8(11.4)
L above VIII 2(5.0) 1(3.8) 1(16.7)
Total
IL 142(14.9) 189(19.9) 286(30.1)
L up to VIII 99(10.4) 92(9.7) 70(7.4)
L above VIII 40(4.2) 26(2.7) 6(0.6)
Total 950 281(29.6) 307(32.3) 362(38.1)
It is interesting to note that though
there is a marginal increase, the
institutional deliveries have gradually
increased in para I, II and multi para
women from 29.6% to 38.1%; and
equally interesting is the fact that this
trend was relatively better in illiterate
women as compared to those with
educational standard of class 8 and
above. Increase in ID in relation to the
parity probably can be justified on
account of a better awareness of schemes including JSY benefits, improved health facilities
and/or their past experience with home delivery.
0
5
10
15
20
25
30
35
IL Up to VIII Above VIII
14.9
10.4
4.2
19.9
9.7
2.7
30.1
7.4
0.6
Pe
rce
nta
ge
Distribution of Lactating Women who had ID in relation to parity and Education
Para I
Para II
Multi Para

SIHFW: an ISO:9001:2008certif ied institution
KABP on continuum of care: Rapid Assessment: Oct 2009
57
Table 69: Relation between number of ANC visits and place of delivery: responses of
Lactating Mothers
District
Responden
ts
Place of delivery
Number of visits
None Once Twice Thrice Four SOS Every Month
Baran
274 Home
0 (0.0)
5 (1.8)
15 (5.4)
1 (0.3)
0 (0.0)
0 (0.0)
0 (0.0)
Health facility
1 (0.3)
52 (18.9)
139 (50.7)
49 (17.8)
6 (2.1)
3 (1.09)
3 (1.09)
Barmer
276
Home 126
(45.6) 13
(4.7) 25
(9.05) 22
(7.97) 6
(2.1) 0
(0.0) 0
(0.0)
Health facility
29 (10.5)
8 (2.8)
24 (9.05)
22 (7.9)
3 (1.0)
0 (0.0)
0 (0.0)
Dungarpur
310
Home 17
(5.4) 4
(1.2) 11
(3.5) 13
(4.1) 2
(0.6) 0
(0.0) 0
(0.0)
Health Facility
65 (20.9)
29 (9.3)
59 (19.0)
70 (22.5)
22 (7.0)
17 (5.4)
1 (0.3)
Sawai Madhopur
209
Home 8
(3.8) 4
(1.91) 7
(3.3) 7
(3.3) 5
(2.3) 1
(0.4) 0
(0.0)
Health Facility
6 (2.8)
12 (5.7)
52 (24.8)
75 (35.8)
21 (10.04)
10 (4.7)
1 (0.4)
Tonk
225
Home 10
(4.4) 9
(4.0) 20
(8.8) 10
(4.4) 3
(1.33) 0
(0.0) 0
(0.0)
Health facility
28 (12.4)
22 (9.7)
72 (32.0)
40 (17.7)
9 (4.0)
2 (0.88)
0 (0.0)
Total
1294
Home (344)
161 (12.4)
35 (2.70)
78 (6.02)
53 (4.0)
16 (1.2)
1 (.07)
0 (0.0)
Health facility (950)
129 (9.9)
123 (9.5)
346 (26.7)
254 (19.6)
61 (4.7)
32 (2.4)
5 (0.38)
Of the 1294 lactating mothers, 821 (63.4%) who had their last delivery in a health facility also had
gone for one or more antenatal visits during the pregnancy period. For the purpose of
convenience ANC visits, whether one, two, three or more have been pooled up. The basic
premise for which is whether the exposure to a health facility (invariable a positive interaction
between client and service provider) triggers and/or facilitates the decision to go for an
institutional delivery.
Place of delivery No. of ANC
One or >one None Total
Health facility 821 129 950
Home 183 161 344
Total 1004 290 1294
Further, in order to test the hypothesis (ANC visits facilitate decision for institutional delivery),
attempt was made to establish an association, i f any, between ANC visits and place of delivery
χ2=160.31 indicates that place of delivery is affected by ANC visits. There is a positive correlation

SIHFW: an ISO:9001:2008certif ied institution
KABP on continuum of care: Rapid Assessment: Oct 2009
58
between the two attributes (r=0.352) which is significant at 5% and 1% level of significance,
checked through “t” test. This explicitly brings out that probability of women going for institutional
delivery is more amongst those attending ANC.
Table 70: Awareness about child immunization: Need and Benefits: responses of Lactating Mothers
Districts Respondents Need for vaccination
Total
Immunization Prevents from
diseases
Yes No Yes No
Baran 274 260 (94.9) 14 (5.1) 274 257 (93.8) 17 (6.2)
Barmer 276 185 (67.0) 91 (33.0) 276 137 (49.6) 139 (50.4)
Dungarpur 310 301 (97.1) 9 (2.9) 310 284 (91.6) 26 (8.4)
S. Madhopur 209 205 (98.1) 4 (1.9) 209 193 (92.3) 16 (7.7)
Tonk 225 216 (96.0) 9 (4.0) 225 177 (78.7) 48 (21.3)
Total 1294 1167 (90.2) 127 (9.8) 1294 1048 (81.0) 246 (19.0)
90.2% of lactating mothers were aware of the need for vaccination and another 81% knew that it
can prevent diseases in young infants. This could be further corroborated by the findings at Table
no. 84 where in 84.2% children are covered by immunization. As the study by default did not
include questions on partial or full immunization, this figure sounds to be unreasonable
particularly so where the DLHS 3 data for different districts puts full immunization as 51%
(Barmer), 46.7% (Tonk), 87.4% (Dungarpur), 26.4% (Sawai Madhopur) and 48% (Baran).
Table 71: Awareness about child immunization: Need and Benefits: responses of Mothers-In-Law
Districts Respond
ents
Awareness about vaccination Awareness that it Prevents from
diseases
Yes No Don’t
know Yes No
Don’t
know
Baran 216 202(93.5) 11 (5.1) 3 (1.4) 197(91.2) 13 (6.0) 6 (2.7)
Barmer 204 138(67.6) 64 (31.4) 2 (0.9) 106(52.0) 97 (47.5) 1 (0.5)
Dungarpur 166 159(95.8) 6 (3.6) 1 (0.6) 138(83.1) 27 (16.3) 1 (0.6)
S. Madhopur 126 119(94.4) 6 (4.8) 1 (0.8) 118(93.7) 7 (5.6) 1 (0.8)
Tonk 186 171(91.9) 11 (5.9) 4 (2.2) 138(74.2) 42 (22.6) 6 (3.2)
Total 898 789(87.9) 98 (10.9) 11 (1.2) 697(77.6) 186 (20.7) 15 (1.6)
Efforts on part of the system and the exposure to media, has made mothers-in-law also familiar
with vaccination and the benefits of it. 87.9% of the total 898 mothers-in-law were found to be
aware of vaccination and another 77.6% knew that it can prevent diseases and these awareness
levels are close to 90%+ in all the districts but for Barmer.
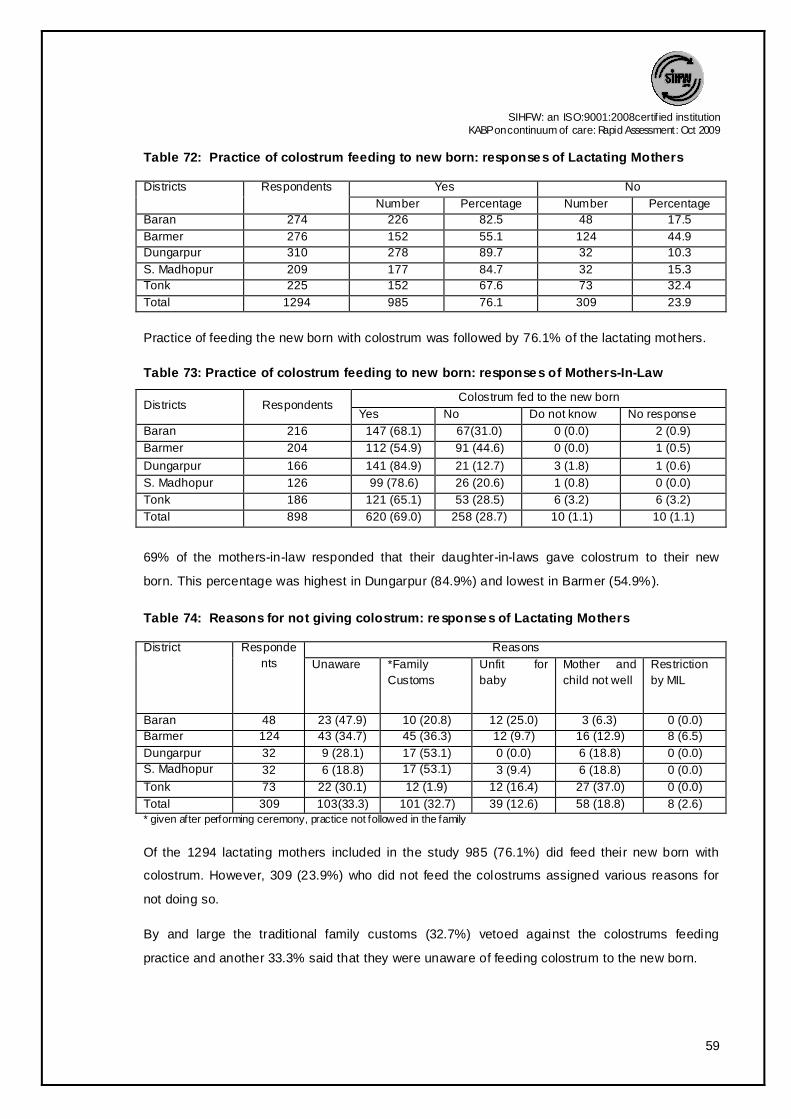
SIHFW: an ISO:9001:2008certif ied institution
KABP on continuum of care: Rapid Assessment: Oct 2009
59
Table 72: Practice of colostrum feeding to new born: responses of Lactating Mothers
Districts Respondents Yes No
Number Percentage Number Percentage
Baran 274 226 82.5 48 17.5
Barmer 276 152 55.1 124 44.9
Dungarpur 310 278 89.7 32 10.3
S. Madhopur 209 177 84.7 32 15.3
Tonk 225 152 67.6 73 32.4
Total 1294 985 76.1 309 23.9
Practice of feeding the new born with colostrum was followed by 76.1% of the lactating mothers.
Table 73: Practice of colostrum feeding to new born: responses of Mothers-In-Law
Districts Respondents Colostrum fed to the new born
Yes No Do not know No response
Baran 216 147 (68.1) 67(31.0) 0 (0.0) 2 (0.9)
Barmer 204 112 (54.9) 91 (44.6) 0 (0.0) 1 (0.5)
Dungarpur 166 141 (84.9) 21 (12.7) 3 (1.8) 1 (0.6)
S. Madhopur 126 99 (78.6) 26 (20.6) 1 (0.8) 0 (0.0)
Tonk 186 121 (65.1) 53 (28.5) 6 (3.2) 6 (3.2)
Total 898 620 (69.0) 258 (28.7) 10 (1.1) 10 (1.1)
69% of the mothers-in-law responded that their daughter-in-laws gave colostrum to their new
born. This percentage was highest in Dungarpur (84.9%) and lowest in Barmer (54.9%).
Table 74: Reasons for not giving colostrum: responses of Lactating Mothers
District Responde
nts
Reasons
Unaware *Family
Customs
Unfit for
baby
Mother and
child not well
Restriction
by MIL
Baran 48 23 (47.9) 10 (20.8) 12 (25.0) 3 (6.3) 0 (0.0)
Barmer 124 43 (34.7) 45 (36.3) 12 (9.7) 16 (12.9) 8 (6.5)
Dungarpur 32 9 (28.1) 17 (53.1) 0 (0.0) 6 (18.8) 0 (0.0)
S. Madhopur 32 6 (18.8) 17 (53.1) 3 (9.4) 6 (18.8) 0 (0.0)
Tonk 73 22 (30.1) 12 (1.9) 12 (16.4) 27 (37.0) 0 (0.0)
Total 309 103(33.3) 101 (32.7) 39 (12.6) 58 (18.8) 8 (2.6) * given after performing ceremony, practice not followed in the family
Of the 1294 lactating mothers included in the study 985 (76.1%) did feed their new born with
colostrum. However, 309 (23.9%) who did not feed the colostrums assigned various reasons for
not doing so.
By and large the traditional family customs (32.7%) vetoed against the colostrums feeding
practice and another 33.3% said that they were unaware of feeding colostrum to the new born.

SIHFW: an ISO:9001:2008certif ied institution
KABP on continuum of care: Rapid Assessment: Oct 2009
60
Table 75: Reasons of not giving colostrum: responses of Mothers-In-Law
District Respondents
Reasons
Unaware *Family Customs
Unfit for baby
Mother and child not well
Dirty Milk
Baran 67 13 (19.4) 23 (34.3) 18 (26.9) 1(1.5) 12(17.9)
Barmer 91 22 (24.2) 56 (61.5) 13(14.3) 0(0.0) 0(0.0)
Dungarpur 21 5 (23.8) 14 (66.7) 2 (9.5) 0(0.0) 0(0.0)
S. Madhopur 26 9 (34.6) 11(42.3) 3 (11.5) 3(11.5) 0(0.0)
Tonk 53 22 (41.5) 21 (39.6) 10 (18.9) 0(0.0) 0(0.0)
Total 258 71 (27.5) 125 (48.4) 46 (17.8) 4(1.6) 12(4.7)
* given after performing ceremony, practice not follow ed in the family
Out of 898 mothers-in-law of currently lactating women, 640 (71.3%) were supportive of feeding
the colostrum to new born, whereas 258 (28.7%) who rejected the idea of colostrum being fed to
new born, sustained their views for reasons like family customs (48.4%) and unawareness
(27.5%). 17.8% respondents felt that feeding colustrum to newborn was “unfit for baby”.
Table 76: Place of delivery and relation with practice of colostrums feeding: responses of
Lactating Mothers
District No of respondents Place of delivery Colostrums given Status
Yes No
Baran 274 Home 11 (4.0) 10 (3.4)
Health Facility 215 (78.4) 38 (13.8)
Barmer 276 Home 103 (37.3) 89 (32.2)
Health Facility 49 (17.7) 35 (12.6)
Dungarpur 310 Home
28 (9.0) 19 (6.1)
Health Facility 250 (80.6) 13 (4.1)
Sawai Madhopur 209 Home 23 (11.0) 9 (4.3)
Health Facility 154 (73.6) 23 (11.0)
Tonk 225 Home 35 (15.5) 17 (7.5)
Health Facility 117 (52.0) 56 (24.8)
Total 1294 Home
200 (15.4) 144 (11.1)
Health Facility 785 (60.6) 165 (12.7)
The practice of colostrums feeding was more in case of lactating mothers having an institutional
delivery. 60.6% lactating mothers who had delivered at a health facility fed their children with
colostrums, whereas only 15.4% practiced colostrums feeding in case of home delivery. This
practice was most practiced in Dungarpur (80.6%), Baran (78.4%) and Sawai Madhopur (73.6%).
The significant difference largely could be attributed to counseling and motivation by the health
staff and accompanying ASHA.

SIHFW: an ISO:9001:2008certif ied institution
KABP on continuum of care: Rapid Assessment: Oct 2009
61
Table 77: Time of initiation of breast feeding: responses of Lactating Mothers
District Respondents Yes
Within one hour
of delivery
Within 1-6 hrs. After 6 hrs. After 2-3
days
Baran 274 114 (41.6) 77 (28.1) 40 (14.6) 43 (15.7)
Barmer 276 45 (16.3) 60 (21.7) 45 (16.3) 126 (45.7)
Dungarpur 310 171 (55.2) 89 (28.7) 21 (6.8) 29 (9.4)
S. Madhopur 209 142 (67.9) 40 (19.1) 6 (2.9) 21 (10.0)
Tonk 225 72 (32.0) 95 (42.2) 34 (15.1) 24 (10.7)
Total 1294 544 (42.0) 361 (27.9) 146 (11.3) 243 (18.8)
42% of lactating mothers fed their new born within one hour of birth while another 27.9% did put
their child on breast within 1-6 hours of delivery.
Mothers in Sawai Madhopur (67.9%) had the best practice in this regard.
Table 78: Time of initiation of breast feeding: responses of Mothers-In-Law
District
Yes Don’t know
Total
Within one hour of delivery
Within 1-6 hrs.
After 6 hrs. After 2-3 days
Baran 62 (28.7) 78 (36.1) 58 (26.9) 16 (7.4) 2 (0.9) 216
Barmer 27 (13.2) 42 (20.6) 108 (52.9) 22 (10.8) 5 (2.5) 204
Dungarpur 100 (60.2) 42 (25.3) 18 (10.8) 4 (2.4) 2 (1.2) 166
S. Madhopur 80 (63.5) 27 (21.4) 13 (10.3) 3 (2.4) 3 (2.4) 126
Tonk 52 (28.0) 79 (42.5) 31 (16.7) 8 (4.3) 16 (8.6) 186
Total 321 (35.7) 268 (29.8) 228 (25.4) 53 (5.9) 28 (3.1) 898
Though for all other parameters pertaining to practice the responses of mothers-in-law matched
with lactating and/or pregnant women. This is an area where the mothers had an idea contrary to
the actual practices of their daughter-in-laws and only 35.7% said that their respective
granddaughter/son were put on
breast within one hour of birth.
While trying to establish the
correlation connect between
ANC, place of delivery and
child care focusing on initiation
of breast feed, it was observed
that mothers with home
delivery did not initiate early
breast feed.
0
5
10
15
20
25
30
35
40
45
50
Within one hour
Within 1-6 hrs.
After 6 hrs. After 2-3 days
2722.4
17.4
33.1
47.5
29.9
9.113.6
Place of delivery and initiation of breast feeding
Home
Health facility

SIHFW: an ISO:9001:2008certif ied institution
KABP on continuum of care: Rapid Assessment: Oct 2009
62
With care and advice provided by the trained staff at the health facilities 47.5% women initiated
breast feed within 1 hour of delivery while in the absence of such care at home only 27% women
gave their first feed within 1 hour of delivery.
The practice of delaying the initiation of breast feed after 2-3 days is seen more when delivery
was at home.
Table 79: Relation between place of delivery and initiation of breast feeding: responses of
Lactating Mothers
District Place of
delivery(No.)
Initiation of breast feeding
within 1hr 1-6hr after 6hr after2-3days
Baran Home(21) 7(33.3) 1(4.8) 6(28.6) 7(33.3)
Health facility(253) 107(42.3) 76(30.0) 34(13.4) 36(14.2)
Barmer Home(192) 33(17.2) 34(17.7) 36(18.8) 89(46.4)
Health facility(84) 12(14.3) 26(31.0) 9(10.7) 37(44.0)
Dungarpur Home(47) 17(36.2) 15(31.9) 10(21.3) 5(10.6)
Health facility(263) 154(58.6) 74(28.1) 11(4.2) 24(9.1)
Sawai
Madhopur
Home(32) 20(62.5) 4(12.5) 1(3.1) 7(21.9)
Health facility(177) 122(68.9) 36(20.3) 5(2.8) 14(7.9)
Tonk Home(52) 16(30.8) 23(44.2) 7(13.5) 6(11.5)
Health facility(173) 56(32.4) 72(41.6) 27(15.6) 18(10.4)
Total Home(344) 93(27.0) 77(22.4) 60(17.4) 114(33.1)
Health facility(950) 451(47.5) 284(29.9) 86(9.1) 129(13.6)
Even if we take into account only the home delivery, it is seen that ANC visits which includes
counseling by the service provider makes a difference in the breast feed initiation practice. 35.5%
of the lactating mothers who had received ANC did start feeding the baby within 1 hour of delivery
while those who did not avail the ANC checkup started as late as 2-3 days after delivery (45.3%).
An attempt was also made to find a correlation between place of delivery and colostrum feeding
and it was found that mothers who had institutional delivery fed their babies with colostrum which
shows a positive correlation (r=0.254) and is significant at 95% and 99% confidence interval.

SIHFW: an ISO:9001:2008certif ied institution
KABP on continuum of care: Rapid Assessment: Oct 2009
63
Table 80: Relation between status of ANC and the initiation time of breast feeding:
responses of Lactating Mothers
District ANC check
ups
Initiation of breast feeding
within 1 hr 1-6 hrs after 6 hrs after 2-3 days
Baran Yes (21) 7(33.3) 1(4.8) 6(28.6) 7(33.3)
No (0) 0(0.0) 0(0.0) 0(0.0) 0(0.0)
Barmer Yes (66) 16(24.2) 14(21.2) 13(19.7) 23(34.8)
No (126) 17(13.5) 20(15.9) 23(18.3) 66(52.4)
Dungarpur Yes (30) 14(46.7) 12(40.0) 2(6.7) 2(6.7)
No (126) 17(13.5) 20(15.9) 23(18.3) 66(52.4)
Sawai Madhopur Yes (24) 15(62.5) 4(16.7) 1(4.2) 4(16.7)
No (8) 5(62.5) 0(0.0) 0(0.0) 3(37.5)
Tonk Yes (42) 13(31.0) 18(42.9) 6(14.3) 5(11.9)
No (10) 3(30.0) 5(50.0) 1(10.0) 1(10.0)
Total Yes (183) 65(35.5) 49(26.8) 28(15.3) 41(22.4)
No (161) 28(17.4) 28(17.4) 32(19.9) 73(45.3)
There is an association between ANC checkups and initiation of breast feeding among the
lactating mothers (χ2=68.424) which is significant at 95% and 99% confidence interval.
Table 81: Relation between time of initiation of breast feeding and colostrum feeding:
responses of Lactating Mothers
District No. of respondents
Initiation of breastfeeding after delivery
Within 1 hr. After 1-6 hr. After 6 hr. After 2-3 days
Baran 226 112 (49.5) 71 (31.4) 31 (13.7) 12 (5.3)
Barmer 152 42 (27.6) 46 (30.2) 21 (13.8) 43 (28.2)
Dungarpur 278 167 (60.0) 82 (29.4) 11 (3.9) 18 (6.4)
Sawai Madhopur 177 139 (78.5) 32 (18.0) 2 (1.1) 4 (2.2)
Tonk 152 63 (41.4) 57 (37.5.) 23 (15.1) 9 (5.9)
Total 985 523 (53.0) 288 (29.2) 88 (8.9) 86 (8.7)
53% of those lactating mothers who fed their new born with colostrum had also initiated breast
feeding within one hour of delivery. This practice was best in Sawai Madhopur (78.5%).
Colostrum feeding being followed by breast feeding within one hour is simply one of the
indications of how the practices can cascade and continue and is an indirect reflection of
awareness, attitude and motivation.

SIHFW: an ISO:9001:2008certif ied institution
KABP on continuum of care: Rapid Assessment: Oct 2009
64
Table 82: Exclusive breast feeding practices: responses of Lactating Mothers
District Respondents Yes
No
Baran 274 156 (56.9) 118 (43.1)
Barmer 276 115 (41.7) 161 (58.3)
Dungarpur 310 238 (76.8) 72 (23.2)
S. Madhopur 209 138 (66.0) 71 (34.0)
Tonk 225 121 (53.8) 104 (46.2)
Total 1294 768 (59.4) 526 (40.6)
One of the universally accepted interventions for reducing infant mortality is exclusive breast
feeding for the first six months. It was seen that 59.4% of the now lactating mothers did adhere to
the practice. Yet 40.6% started complementary food along with breast feeding before six months.
54.3% of the mothers-in-law also were aware and supported the exclusive breast feeding. The
526 lactating mothers who offered complementary foods enumerated the commonest
supplementary foods as milk (34.2%), ghutti (35.6%) besides water (23.8%) and the commonly
held beliefs by mothers-in-law also favored the same supplements for new born.
Table 83: Exclusive breast feeding practices: responses of Mothers-In-Law
District
Yes
No Don’t know Total
Baran 100 (46.3) 114 (52.8) 2 (0.9) 216
Barmer 75 (36.8) 128 (62.7) 1 (0.5) 204
Dungarpur 128 (77.1) 36 (21.7) 2 (1.2) 166
S. Madhopur 83 (65.9) 41 (32.5) 2 (1.6) 126
Tonk 102 (54.8) 74 (39.8) 10 (5.4) 186
Total 488 (54.3) 393 (43.8) 17 (1.9) 898
Table 84: Reasons for not exclusively breast feeding: responses of Lactating Mothers
District Responden
ts
Reasons
Unaware Insufficient breast milk
Family practices*
Doctor suggested
Baby was not well
Baran 118 22 (18.6) 40 (33.9) 54 (45.8) 2 (1.7) 0 (0.0)
Barmer 161 39 (24.2) 23 (14.3) 98 (60.9) 1 (0.6) 0 (0.0)
Dungarpur 72 5 (6.9) 54 (75.0) 13 (18.1) 0 (0.0) 0 (0.0)
S. Madhopur 71 24 (33.8) 23 (32.4) 24 (33.8) 0 (0.0) 0 (0.0)
Tonk 104 20 (19.2) 15 (14.4) 66 (63.4) 1 (1.0) 2 (1.9)
Total 526 110 (20.9) 155 (29.5) 255 (48.4) 4 (0.8) 2 (0.4)
* ghutti/ honey
768 (59.4%) of the 1294 currently lactating women were found to be exclusively breast feeding
their baby and 526 (40.6%) for one or the other reason had supplemented breast feed with other

SIHFW: an ISO:9001:2008certif ied institution
KABP on continuum of care: Rapid Assessment: Oct 2009
65
feeds. Of the reasons voiced, family practices for feeding traditional feeds like honey and ghutti
(48.4%) and mother not being able to produce enough milk (29.5%); predominated the actuation.
The new born in Barmer and Tonk suffered most on account of family practices.
Table 85: Reasons for not exclusively breast feeding: responses of Mothers-In-Law
District
Respondents
Reasons
Unaware Insufficient
breast milk
Family
practices*
Absence of mother
(Hospitalized/Death)
Baran 114 32 (28.1) 43 (37.7) 38 (33.3) 1 (0.9)
Barmer 128 20 (15.6) 18 (14.1) 88 (68.8) 2 (1.6)
Dungarpur 36 0 (0.0) 28 (77.8) 7 (19.4) 1 (2.8)
S. Madhopur 41 20 (48.8) 16 (39.0) 5 (12.2) 0 (0.0)
Tonk 74 14 (18.9) 16 (21.6) 44 (59.5) 0 (0.0)
Total 393 86 (21.9) 121 (30.8) 182 (46.3) 4 (1.0)
* ghutti/ honey
43.8% of the 898 mothers-in-law also felt that exclusive breast feeding cannot support the child’s
nutritional needs and therefore supplementary feeds are required. In order to substantiate their
understanding multiple reasons were put on the floor in support of breast feed complemented by
top feed. These are, once again the family practices (46.3%), insufficient breast milk (30.8%) and
unawareness (21.9%) about the benefits of exclusive breast feeding.
Table 86: Place of delivery and its relation to status of exclusive breast feeding: responses
of Lactating Mothers
District No. of Respondents who exclusively breast fed
Place of Delivery
Home Health Facility
Baran 156 8 (5.1) 148 (94.8)
Barmer 115 76 (66.0) 39 (33.1)
Dungarpur 238 24 (10.0) 214 (89.9)
Sawai Madhopur 138 16 (11.5) 122 (88.4)
Tonk 121 27 (22.3) 94 (77.6)
Total 768 151 (19.6) 617 (80.3)
Considering the place of delivery, exclusive breast feeding was practiced more by those having
delivery at the health facility. Of the 768 lactating mothers who exclusively breast fed their new
born, 80.3% were those who had their delivery at a health facility. Baran (94.8%), Dungarpur
(89.9%) and Sawai Madhopur (88.4%) had the best practice in the regard.

SIHFW: an ISO:9001:2008certif ied institution
KABP on continuum of care: Rapid Assessment: Oct 2009
66
Table 87: Time of baby's first bath: responses of Lactating Mothers
Districts Respondents Time
After the cord dried
and separated
Immediate Within2-7 days After one
week
Baran 274 14 (5.1) 94 (34.3) 159 (58.0) 7 (2.6)
Barmer 276 24 (8.7) 210 (76.1) 36 (13.0) 6 (2.2)
Dungarpur 310 31 (10.0) 105 (33.9) 171 (55.2) 3 (1.0)
S. Madhopur 209 23 (11.0) 40 (19.1) 141 (67.5) 5 (2.4)
Tonk 225 65 (28.9) 67 (29.8) 73 (32.4) 20 (8.9)
Total 1294 157 (12.1) 516 (39.9) 580 (44.8) 41 (3.2)
The practices in relation to maintaining the body warmth were explored. 39.9% of the interviewed
lactating mothers did bathe the baby immediately after delivery; mothers in Barmer (76.1%) were
more “hygiene” conscious with poor understanding of body warmth maintenance. Only 12.1% of
the lactating mothers bathe their babies after the cord dried and fell off. Mothers-in-law were
relatively better informed as to when the baby should be given the first bath
Table 88: Time of baby's first bath: responses of Mothers-In-Law
Districts Responde
nts
Time After the cord dried and separated
Immediately Within 2-7 days
After one week
Don’t know
Baran 216 13 (6.0) 52 (24.0) 148 (68.5) 0(0.0) 3 (1.4)
Barmer 204 38 (18.6) 116 (56.8) 49 (24.0) 0(0.0) 1 (0.5)
Dungarpur 166 51 (30.7) 21 (12.7) 93 (56.0) 0 0.0) 1 (0.6)
S. Madhopur 126 0 (0.0) 6 (4.8 114 (90.5) 4 (3.2) 2 (1.6)
Tonk 186 91 (48.9) 4 (2.2) 65 (34.9) 3 (1.6) 23 (12.4)
Total 898 193 (21.5) 199 (22.2) 469 (52.2) 7 (0.8) 30 (3.3)
Table 89: Reasons of baby's bath before cord shedding: responses of Lactating Mothers
Districts Respondents Reasons
Unaware Family pressure Tradition Baran 260 100 (38.5) 160 (61.5) 0 (0.0) Barmer
252 170 (67.5) 33 (13.1) 49 (19.4) Dungarpur
279 227 (81.4) 52 (18.6) 0 (0.0) S. Madhopur
186 90 (48.4) 95 (51.1) 1 (0.5) Tonk
160 91 (56.9) 69 (43.1) 0 (0.0)
Total 1137 678 (59.6) 409 (36.0) 50 (4.4)

SIHFW: an ISO:9001:2008certif ied institution
KABP on continuum of care: Rapid Assessment: Oct 2009
67
Table 90: Reasons of baby's bath before cord shedding: responses of Mothers-In-Law
Districts Respondents Reasons
Unaware Family pressure Tradition
Baran 200 118 (59.0) 82 (41.0) 0 (0.0)
Barmer 165 125 (75.7) 27 (16.4) 13 (7.9)
Dungarpur 114 70 (61.4) 44 (38.6) 0 (0.0)
S. Madhopur 120 62 (51.7) 57 (47.5) 1 (0.8)
Tonk 69 15 (21.7) 51 (73.9) 3 (4.3)
Total 668 390 (58.4) 261 (39.1) 17 (2.5)
Of the 1294 lactating women, 1137 (87.9%) and 668 of 898 mothers-in-law, who did not wait for
the cord to dry and fall off had various reasons for bathing the baby with tradition (2.5%) and
family member’s whims (39.1%) besides the usual “unawareness” (58.4%), highest among the
lactating mothers in Dungarpur (81.4%).
Table 91: Problems faced by lactating mothers after delivery
District
Problems
faced
Problems faced
No problem
faced
Excessive
bleeding/dischar
ge
High Fever
Fits Pain
abdomen
Weakness
Other
Baran (274) 58 (21.2) 6 (10.3) 14(24.1) 0 (0.0) 18(31.0) 8(13.7) 12 20.6) 216(78.8)
Barmer (276) 37 (13.4) 4 (10.8) 5 (13.5) 3 (8.1) 5 (13.5) 18(48.6) 2 (5.4) 239(86.6)
Dungarpur (310)
14 (4.5) 0 (0.0) 2 (14.3) 0 (0.0) 9 (64.3) 0 (0.0) 3 (21.4) 296(95.5)
S Madhopur (209)
31 (14.8) 3 (9.6) 8 (25.8) 0 (0.0) 5 (16.1) 5(16.1) 10(32.2) 178(85.2)
Tonk (225) 19 (8.4) 1 (5.2) 0 (0.0) 0 (0.0) 7 (36.8) 6(31.6) 5 (26.3) 206(91.6)
Total (1294) 159 (12.3) 14 (8.8) 29(18.2) 3 (1.8) 44(27.6) 37(23.3) 32(20.1) 1135(87.7)
Of the 1294 lactating mothers, 159 (12.3%) had one or the other problem during post natal period;
the commonest being pain in abdomen (27.6%), weakness (23.3%) and high fever (18.2%). 8.8%
complained of excessive bleeding/discharge.
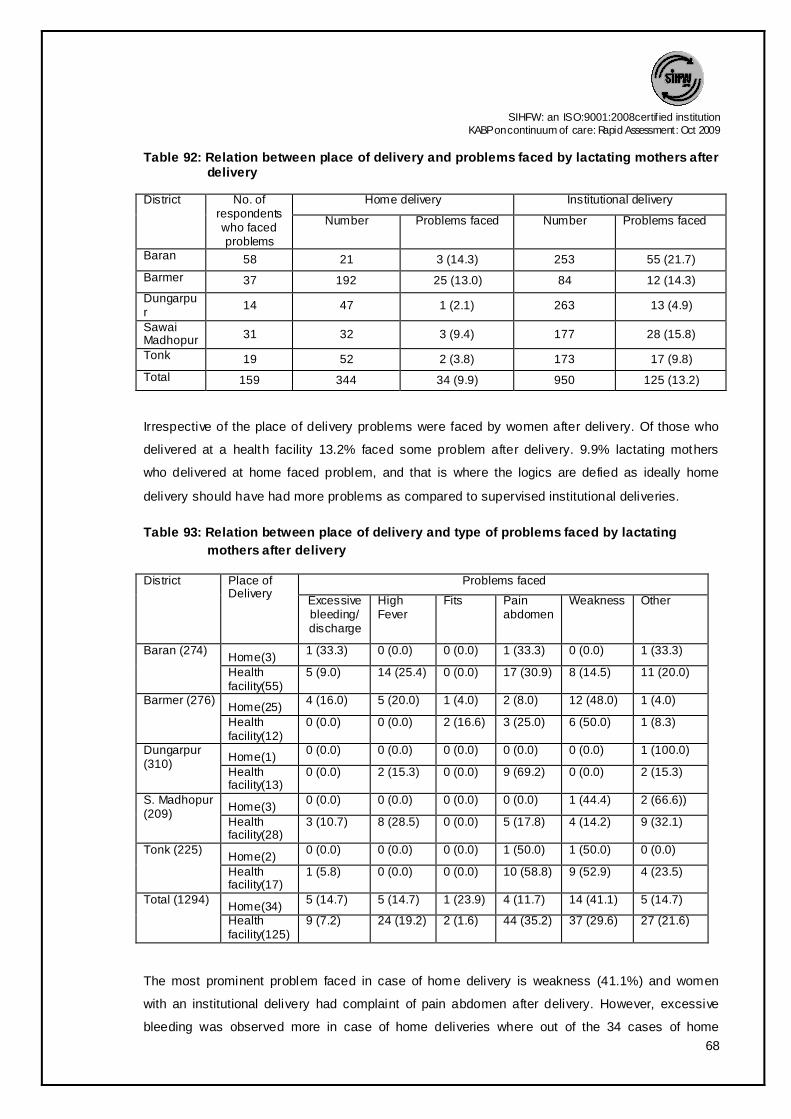
SIHFW: an ISO:9001:2008certif ied institution
KABP on continuum of care: Rapid Assessment: Oct 2009
68
Table 92: Relation between place of delivery and problems faced by lactating mothers after delivery
District
No. of respondents who faced problems
Home delivery Institutional delivery
Number Problems faced Number Problems faced
Baran 58 21 3 (14.3) 253 55 (21.7)
Barmer 37 192 25 (13.0) 84 12 (14.3)
Dungarpur
14 47 1 (2.1) 263 13 (4.9)
Sawai Madhopur 31 32 3 (9.4) 177 28 (15.8)
Tonk 19 52 2 (3.8) 173 17 (9.8)
Total 159 344 34 (9.9) 950 125 (13.2)
Irrespective of the place of delivery problems were faced by women after delivery. Of those who
delivered at a health facility 13.2% faced some problem after delivery. 9.9% lactating mothers
who delivered at home faced problem, and that is where the logics are defied as ideally home
delivery should have had more problems as compared to supervised institutional deliveries.
Table 93: Relation between place of delivery and type of problems faced by lactating
mothers after delivery
District Place of Delivery
Problems faced
Excessive bleeding/ discharge
High Fever
Fits Pain abdomen
Weakness Other
Baran (274) Home(3)
1 (33.3) 0 (0.0) 0 (0.0) 1 (33.3) 0 (0.0) 1 (33.3)
Health facility(55)
5 (9.0) 14 (25.4) 0 (0.0) 17 (30.9) 8 (14.5) 11 (20.0)
Barmer (276) Home(25)
4 (16.0) 5 (20.0) 1 (4.0) 2 (8.0) 12 (48.0) 1 (4.0)
Health facility(12)
0 (0.0) 0 (0.0) 2 (16.6) 3 (25.0) 6 (50.0) 1 (8.3)
Dungarpur (310)
Home(1) 0 (0.0) 0 (0.0) 0 (0.0) 0 (0.0) 0 (0.0) 1 (100.0)
Health facility(13)
0 (0.0) 2 (15.3) 0 (0.0) 9 (69.2) 0 (0.0) 2 (15.3)
S. Madhopur (209)
Home(3) 0 (0.0) 0 (0.0) 0 (0.0) 0 (0.0) 1 (44.4) 2 (66.6))
Health facility(28)
3 (10.7) 8 (28.5) 0 (0.0) 5 (17.8) 4 (14.2) 9 (32.1)
Tonk (225) Home(2)
0 (0.0) 0 (0.0) 0 (0.0) 1 (50.0) 1 (50.0) 0 (0.0)
Health facility(17)
1 (5.8) 0 (0.0) 0 (0.0) 10 (58.8) 9 (52.9) 4 (23.5)
Total (1294) Home(34)
5 (14.7) 5 (14.7) 1 (23.9) 4 (11.7) 14 (41.1) 5 (14.7)
Health facility(125)
9 (7.2) 24 (19.2) 2 (1.6) 44 (35.2) 37 (29.6) 27 (21.6)
The most prominent problem faced in case of home delivery is weakness (41.1%) and women
with an institutional delivery had complaint of pain abdomen after delivery. However, excessive
bleeding was observed more in case of home deliveries where out of the 34 cases of home

SIHFW: an ISO:9001:2008certif ied institution
KABP on continuum of care: Rapid Assessment: Oct 2009
69
deliveries 5 women (14.7%) complaint of the problem and only 9 women out of 125 who had
institutional delivery had excessive bleeding.
Table 94: Action taken in case of problem after delivery: responses of Lactating Mothers
District Respondents Action Taken
Nothing Immediately
went to hospital
Went to hospital after
2-3 days
Contacted Dai/Bengali
doctor
Home remedies
Baran 58 23 (39.7) 19 (32.8) 12 (20.7) 0 (0.0) 4 (6.9)
Barmer 37 6 (16.2) 18 (48.6) 4 (10.8) 2 (5.4) 7 (18.9)
Dungarpur 14 1 (7.1) 6 (42.9) 2 (14.3) 0 (0.0) 5 (35.7)
S. Madhopur 31 4 (12.9) 17 (54.8) 5 (16.1) 1 (3.2) 4 (12.9)
Tonk 19 2 (10.5) 13 (68.4) 4 (21.1) 0 (0.0) 0 (0.0)
Total 159 36 (22.6) 73 (45.9) 27 (17.0) 3 (1.9) 20 (12.6)
Among 159 respondents who faced any/some problem in the post delivery period, 45.9%
immediately sought medical advice from health centre and their mothers-in-law (44.3%) also
supported this practice. The practice was best found in Tonk (68.4%), Sawai Madhopur (54.8%)
and Barmer (48.6%) district.
17% respondents sought delayed medical care after 2-3 days whereas 22.6% respondents did
nothing or simply ignored the problem and 1.9% took treatment from Dai/Bengali Doctor (quacks).
Ignoring the problem was maximum in Baran (39.7%) in contrast to Dungarpur (7.1%)
respondents.
The subjects from tribal district (Dungarpur) sought solace in home remedies (35.7%).
Table 95: Action taken in case of problem after delivery: responses of Mothers-In-Law
District Respond
ents
Action Taken Nothing Immediately
went to hospital
Sometimes went hospital after 2-3 days
Went to Familiar
Dai/Bangali doctor
Home remedies followed
Baran 57 12 (21.1) 18 (31.6) 7 (12.3) 1 (1.8) 19 (33.3)
Barmer 14 1 (7.1) 8 (57.1) 1 (7.1) 0 (0.0) 4 (28.6)
Dungarpur 9 1 (11.1) 5 (55.6) 1 (11.1) 0 (0.0) 2 (22.2)
S. Madhopur 17 4 (23.5) 11 (64.7) 1 (5.9) 0 (0.0) 1 (5.9)
Tonk 9 0 (0.0) 5 (55.6) 3 (33.3) 1 (11.1) 0 (0.0)
Total 106 18 (17.0) 47 (44.3) 13 (12.3) 2 (1.9) 26 (24.5)
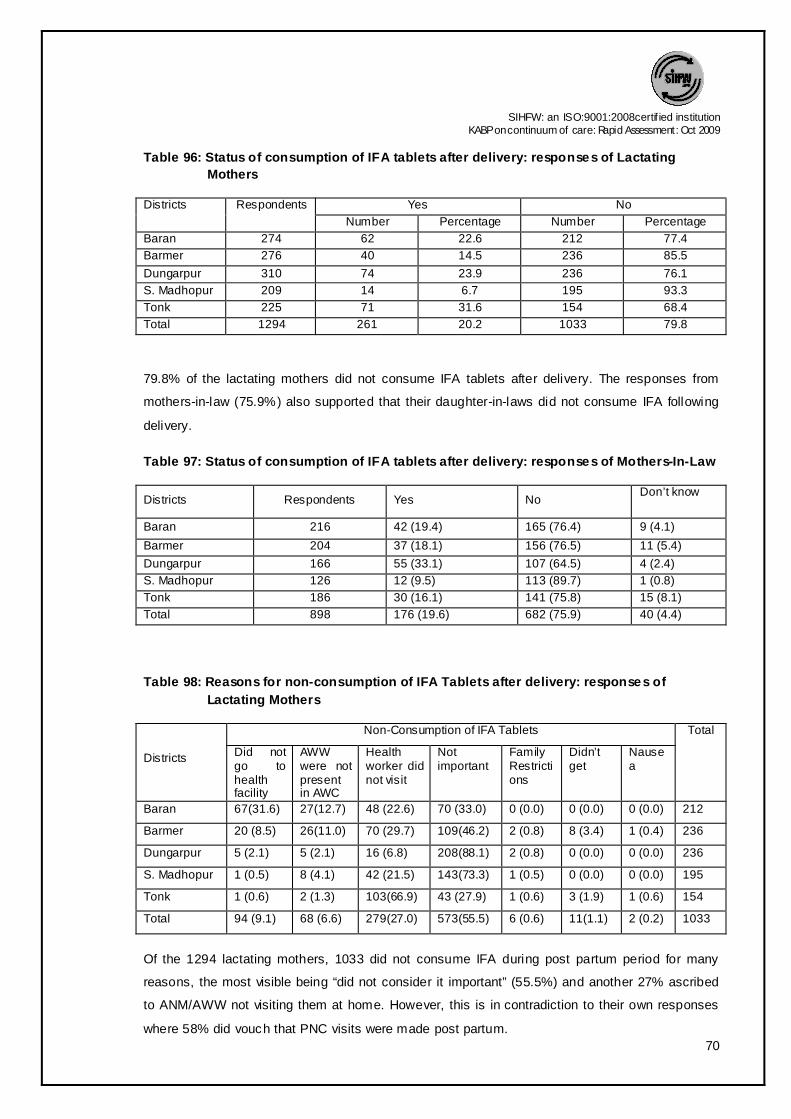
SIHFW: an ISO:9001:2008certif ied institution
KABP on continuum of care: Rapid Assessment: Oct 2009
70
Table 96: Status of consumption of IFA tablets after delivery: responses of Lactating
Mothers
Districts Respondents Yes No
Number Percentage Number Percentage
Baran 274 62 22.6 212 77.4
Barmer 276 40 14.5 236 85.5
Dungarpur 310 74 23.9 236 76.1
S. Madhopur 209 14 6.7 195 93.3
Tonk 225 71 31.6 154 68.4
Total 1294 261 20.2 1033 79.8
79.8% of the lactating mothers did not consume IFA tablets after delivery. The responses from
mothers-in-law (75.9%) also supported that their daughter-in-laws did not consume IFA following
delivery.
Table 97: Status of consumption of IFA tablets after delivery: responses of Mothers-In-Law
Districts Respondents Yes No Don’t know
Baran 216 42 (19.4) 165 (76.4) 9 (4.1)
Barmer 204 37 (18.1) 156 (76.5) 11 (5.4)
Dungarpur 166 55 (33.1) 107 (64.5) 4 (2.4)
S. Madhopur 126 12 (9.5) 113 (89.7) 1 (0.8)
Tonk 186 30 (16.1) 141 (75.8) 15 (8.1)
Total 898 176 (19.6) 682 (75.9) 40 (4.4)
Table 98: Reasons for non-consumption of IFA Tablets after delivery: responses of
Lactating Mothers
Districts
Non-Consumption of IFA Tablets Total
Did not go to health facility
AWW were not present in AWC
Health worker did not visit
Not important
Family Restrictions
Didn’t get
Nausea
Baran 67(31.6) 27(12.7) 48 (22.6) 70 (33.0) 0 (0.0) 0 (0.0) 0 (0.0) 212
Barmer 20 (8.5) 26(11.0) 70 (29.7) 109(46.2) 2 (0.8) 8 (3.4) 1 (0.4) 236
Dungarpur 5 (2.1) 5 (2.1) 16 (6.8) 208(88.1) 2 (0.8) 0 (0.0) 0 (0.0) 236
S. Madhopur 1 (0.5) 8 (4.1) 42 (21.5) 143(73.3) 1 (0.5) 0 (0.0) 0 (0.0) 195
Tonk 1 (0.6) 2 (1.3) 103(66.9) 43 (27.9) 1 (0.6) 3 (1.9) 1 (0.6) 154
Total 94 (9.1) 68 (6.6) 279(27.0) 573(55.5) 6 (0.6) 11(1.1) 2 (0.2) 1033
Of the 1294 lactating mothers, 1033 did not consume IFA during post partum period for many
reasons, the most visible being “did not consider it important” (55.5%) and another 27% ascribed
to ANM/AWW not visiting them at home. However, this is in contradiction to their own responses
where 58% did vouch that PNC visits were made post partum.

SIHFW: an ISO:9001:2008certif ied institution
KABP on continuum of care: Rapid Assessment: Oct 2009
71
An attempt was made to find out whether those women who went for ANC also availed PNC. For
this paired ‘t’ test was applied and the calculated value is t=1.838.Which commits the acceptance
of null hypothesis at 5% and 1% level of significance and shows that in all the districts all the
lactating mothers who had one or more ANC visits during pregnancy did go for post natal care.
Table 99: PNC visits: responses of Lactating Mothers
Districts Respondents Yes No Don’t know
Baran 274 186 (67.9) 88 (32.1) 0 (0.0)
Barmer 276 88 (31.9) 188 (68.1) 0 (0.0)
Dungarpur 310 173 (55.8) 137 (44.2) 0 (0.0)
S. Madhopur 209 140 (67.0) 69 (33.0) 0 (0.0)
Tonk 225 169 (75.1) 56 (24.9) 0 (0.0)
Total 1294 756 (58.4) 538 (41.6) 0 (0.0)
Table 100: PNC visits: responses of Mothers-In-Law
Districts Respondents Yes No Don’t know
Baran 216 135 (62.5) 76 (35.2) 5 (2.3)
Barmer 204 64 (31.4) 139 (68.1) 1 (0.5)
Dungarpur 166 109 (65.7) 54 (32.5) 3 (1.8)
S. Madhopur 126 88 (69.8) 37 (29.4) 1 (0.8)
Tonk 186 121 (65.1) 54 (29.0) 11 (5.9)
Total 898 517 (57.6) 360 (40.1) 21 (2.3)
Table 101: Type of diet taken after delivery: responses of Lactating Mothers
Districts Respondents Normal food Special diet*
Baran 274 82 (29.9) 192 (70.1)
Barmer 276 24 (8.7) 252 (91.3)
Dungarpur 310 77 (24.8) 233 (75.2)
S. Madhopur 209 21 (10.0) 188 (90.0)
Tonk 225 17 (7.6) 208 (92.4)
Total 1294 221 (17.1) 1073 (82.9)
* Ghee/ladoo

SIHFW: an ISO:9001:2008certif ied institution
KABP on continuum of care: Rapid Assessment: Oct 2009
72
Table 102: Type of diet taken after delivery: responses of Mothers-In-Law s
Districts Respondents Normal food Special diet*
Baran 216 67 (31.0) 149 (69.0)
Barmer 204 12 (5.9) 192 (94.1)
Dungarpur 166 40 (24.1) 126 (75.9)
S. Madhopur 126 8(6.3) 118 (93.7)
Tonk 186 25 (13.4) 161 (86.6)
Total 898 152 (16.9) 746 (83.1)
* Ghee/ladoo
The traditional practice of restraining certain foods during pregnancy but compensating it post
partum simply stands substantiated as 82.9% of lactating mothers were given energy rich foods;
irrespective of the terrain, tribes and districts. The mothers-in-law were supportive of this.
Table 103: Status of rest taken after delivery: responses of Lactating Mothers
Districts Respondents Less than a
week Around one to
two weeks Till one month
More than one month
Baran 274 20 (7.3) 32 (11.7) 12 1 (44.2) 101 (36.9)
Barmer 276 56 (20.3) 92 (33.3) 94 (34.1) 34 (12.3)
Dungarpur 310 25 (8.1) 74 (23.9) 12 8 (41.3) 83 (26.8)
S. Madhopur 209 13 (6.2) 50 (23.9) 89 (42.6) 57 (27.2)
Tonk 225 10 (4.4) 16 (7.1) 120 (53.3) 79 (35.1)
Total 1294 124 (9.6) 264 (20.4) 552 (42.7) 354 (27.3)
Traditional cultural inheritance and norms with respect to relatively isolating the women and
putting her to rest during post partum period has a strong scientific evidence based on the period
by which involution of uterus normally takes place. The practice transcends across all the sections
of society irrespective of the beliefs, practices and poverty levels. The practice also is conducive
to avoiding Post-Partum Haemorrhage (PPH).
42.7% of lactating mothers rested for a month and 27.3% were confined for more than a month.
9.6% had to resort to daily chores within a week. 45.3% of the mothers-in-law favored a rest for a
month and another 31.4% supported rest for lactating mothers for more than a month.

SIHFW: an ISO:9001:2008certif ied institution
KABP on continuum of care: Rapid Assessment: Oct 2009
73
Table 104: Status of rest taken after delivery: responses of Mothers-In-Law
Districts Respondents Less than a week
Around one to two weeks
Till one month
More than one month
Baran 216 12 (5.6) 12 (5.6) 104 (48.1) 88 (40.7)
Barmer 204 33 (16.2) 63 (30.9) 86 (42.2) 22 (10.7)
Dungarpur 166 11 (6.6) 23 (13.9) 77 (46.4) 55 (47.4)
S. Madhopur 126 4 (3.2) 27 (21.4) 66 (52.4) 29 (23.0)
Tonk 186 16 (8.6) 8 (4.3) 74 (39.8) 88 (47.3)
Total 898 76 (8.5) 133 (14.8) 407 (45.3) 282 (31.4)
Table 105: Child immunization: responses of Lactating Mothers Districts Respondent Status of Infant vaccination
Yes N o
Number Percentage Number Percentage
Baran 274 244 89.1 30 10.9
Barmer 276 146 52.9 130 47.1
Dungarpur 310 289 93.2 21 6.8
S. Madhopur 209 198 94.7 11 5.3
Tonk 225 213 94.7 12 5.3
Total 1294 1090 84.2 204 15.8
Though the design of the
protocols did not allow explicit
categorization of partially
immunized and fully immunized
children; still based on the
information collected 84.2% of
the lactating mothers expressed
that the child was immunized.
0
20
40
60
80
100
Baran Barmer Dungarpur S. Madhopur
Tonk
89.1
52.9
93.2 94.7 94.7
10.9
47.1
6.8 5.3 5.3
Perc
en
tag
e
Immunization status
Yes
No

SIHFW: an ISO:9001:2008certif ied institution
KABP on continuum of care: Rapid Assessment: Oct 2009
74
Table 106: Reason for non vaccination of new born child: responses of Lactating Mothers
Districts Respo
ndents
Reasons Unaware Health
worker did not come at home
Child was sick
Vaccination
causes fever
Family Restrictio
ns
Not importa
nt
Child is small right now
Baran 30 12 (40.0) 9 (30.0) 2 (6.7) 0 (0.0) 1 (3.3) 1 (3.3) 5(16.7)
Barmer 130 44(33.8) 53 (40.8) 3 (2.3) 5 (3.8) 19(14.6) 2 (1.5) 4 (3.1)
Dungarpur 21 10 (47.6) 6 (28.5) 1 (9.5) 1 (4.8) 0 (0.0) 1 (4.8) 1 (4.8)
S. Madhopur 11 5 (45.4) 6 (54.5) 0 (0.0) 0 (0.0) 0 (0.0) 0 (0.0) 0 (0.0)
Tonk 12 3 (25.0) 5 (41.7) 1 (8.3) 3 (25.0) 0 (0.0) 0 (0.0) 0 (0.0)
Total 204 74 (36.2) 79 (38.7) 8 (3.9) 9 (4.4) 20 (9.8) 4 (1.9) 10(4.9)
204 lactating women with unimmunized child came out with wide and varied reasons where once
again dependence – “no health worker came at home” (38.7%) and lack of knowledge and
unawareness (36.2%) were put as the main reason. Only mothers (25%) of Tonk attributed it to
consequent fever and therefore avoided vaccination.
Table 107: Reason for non vaccination of new born child: responses of Mothers-In-Law
Districts Respondents
Unaware Health worker did
not come at home
Child was sick
Vaccination causes
fever
Superstition Child is small right
now
Baran 21 5 (23.8) 5 (23.8) 2 (9.5) 1 (4.8) 0 (0.0) 8(38.1)
Barmer 86 25 (29.1) 43 (50.0) 1 (1.2) 4 (4.7) 10(11.6) 3(3.5)
Dungarpur 13 8 (61.5) 3 (23.0) 1 (7.7) 1 (7.7) 0 (0.0) 0(0.0)
S. Madhopur 9 5 (55.5) 3 (33.3) 1(11.1) 0 (0.0) 0 (0.0) 0(0.0)
Tonk 10 4 (40.0) 5 (50.0) 0 (0.0) 1 (10.0) 0 (0.0) 0(0.0)
Total 139 47 (33.8) 59 (42.4) 5 (3.6) 7 (5.0) 10 (7.2) 11(7.9)
The reasons posed by mothers-in-law were no different with 42.4% accusing health workers for
not turning up another 33.8% simply assigning it to their unawareness.

SIHFW: an ISO:9001:2008certif ied institution
KABP on continuum of care: Rapid Assessment: Oct 2009
75
Table 108: Place of delivery and relation with child immunization: responses of
Lactating Mothers
District No of respondents Place of delivery
Home Health Facility Baran 244 13 (5.3) 231 (94.6) Barmer
146 89 (60.9) 57 (39.0) Dungarpur 289 41 (14.1) 248 (85.8) Sawai Madhopur 198 27 (13.6) 171 (86.3) Tonk
213 50 (23.4) 163 (76.5) Total 1090 220 (20.1) 870 (79.8)
Practice of immunizing the child was more among those lactating women who had institutional
delivery (79.8%).
Table 109: Practice of taking child to health facility: responses of Lactating Mothers
Districts Responden
ts
Check up Total Growth Monitoring(weighing)
Yes No Yes No
Baran 274 81 (29.6) 193 (70.4) 274 207(75.5) 67 (24.5)
Barmer 276 82 (29.7) 194 (70.3) 276 65 (23.6) 211 (76.4)
Dungarpur 310 195 (62.9) 115 (37.1) 310 182 (58.7) 128 (41.3)
S. Madhopur 209 80 (38.3) 129 (61.7) 209 115 (55.0) 94 (45.0)
Tonk 225 118 (52.4) 107 (47.6) 225 161 (71.6) 64 (28.4)
Total 1294 556 (43.0) 738 (57.0) 1294 730 (56.4) 564 (43.6)
Overall 43.0% lactating mothers took their new born to the health centre for check up (maximum
in Dungarpur – 62.9). Practice of not having initial check up was 57.0% overall which was
considerably high in Baran (70.4%) and Barmer (70.3%) district.
Practice of regular growth monitoring was 56.4% and it was best found in Baran (75.5%) & Tonk
(71.6%).
The views of mothers-in-law also supported the same.

SIHFW: an ISO:9001:2008certif ied institution
KABP on continuum of care: Rapid Assessment: Oct 2009
76
Table 110: Status of utilization of health facility: responses of Mothers-In-Law
Districts Respo
ndent
Check up Growth Monitoring(weighing)
Yes No Don’t know
Will go
now
No response
Yes No Don’t know
No respon
se
Baran 216 58
(26.9) 150 (69.4)
5 (2.3)
1 (0.5)
2 (0.9)
170 (78.7)
42 19.4)
2 0.9)
2 0.9)
Barmer 204
57
(27.9)
145
(71.1)
1
(0.5)
0
(0.0)
1
(0.5)
44
(21.6)
157
(77.0)
2
(1.0)
1
(0.5)
Dungarpur 166
107
(64.5)
58
(34.9)
0
(0.0)
0
(0.0)
1
(0.6)
106
(63.9)
57
(34.3)
2
(1.2)
1
(0.6)
S. Madhopur 126
55 (43.7)
70 (55.6)
0 (0.0)
0 (0.0)
1 (0.8)
80 (63.5)
43 (34.1)
2 (1.6)
1 (0.8)
Tonk 186
109 (58.6)
51 (27.4)
21 (11.3)
0 (0.0)
5 (2.7)
128 (68.8)
46 (24.7)
8 (4.3)
4 (2.2)
Total 898
386
(43.0)
474
(52.8)
27
(3.0)
1
(0.1)
10
(1.1)
528
(58.8)
345
(38.4)
16
(1.8)
9
(1.0)
Table 111: Decision makers for pregnancy and PN period: responses of Pregnant Women
Districts Respondents Self Mother- In-Law
Any Elder in Family
Husband Service Provider
Combined Decision
Baran PGP (52) 4 (7.7) 20(38.5) 3 (5.8) 10 (19.2) 0 (0.0) 15 (28.8)
MGP (84) 6 (7.1) 23(27.4) 2 (2.4) 17 (20.2) 0 (0.0) 36 (42.9)
Barmer PGP (25) 5 (20.0) 14 56.0) 5 (20.0) 1 (4.0) 0 (0.0) 0 (0.0)
MGP (96) 42 (43.8) 44(45.8) 4 (4.2) 6 (6.3) 0 (0.0) 0 (0.0)
Dungarpur PGP (21) 4 (19.0) 11(52.4) 2 (9.5) 2 (9.5) 1 (4.8) 1 (4.8)
MGP (96) 24 (25.0) 36(37.5) 14 (14.6) 20 (20.8) 1 (1.0) 1 (1.0)
S.
Madhopur
PGP (45) 10 (22.2) 13(28.9) 6 (13.3) 2 (4.4) 1 (2.2) 13 (28.9)
MGP (110) 30 (27.3) 22(20.0) 10 (9.1) 2 (1.8) 1 (0.9) 45 (40.9)
Tonk PGP (52) 7 (13.5) 16(30.8) 5 (9.6) 5 (9.6) 2 (3.8) 17 (32.7)
MGP (90) 13 (14.4) 22(24.4) 14 (15.6) 11 (12.2) 0 (0.0) 30 (33.3)
Total PGP (195) 30 (15.4) 74(37.9) 21 (10.8) 20 (10.3) 4 (2.1) 46 (23.6)
MGP (476) 115(24.2) 147(30.9) 44 (9.2) 56 (11.8) 2 (0.4) 112 (23.5)
PGP-Primi Gravida Pregnant, MGP- Multi Gravida Pregnant
By and large the decision
regarding care during
pregnancy and post natal
period and service
seeking is dictated by the
mother-in-law. But there
was a change in trend in
decision making from
primi to multi gravid. With
increasing parity, the
0
10
20
30
40
Self Mother In Law
Any Elder in Family
Husband Service Provider
Combined Decision
15.4
37.9
10.8 10.3
2.1
23.624.2
30.9
9.211.8
0.4
23.5
Perc
en
tag
e
Decision maker for Pregnancy and PN Period
Primi
Multi

SIHFW: an ISO:9001:2008certif ied institution
KABP on continuum of care: Rapid Assessment: Oct 2009
77
decision taking power of the pregnant mother increased, corresponding to a decline in decision
making by mother-in-law. In case of primi gravida 37.9% of the pregnant women said that their
mothers-in-law decided but in case of multi gravida only 30.9% of the pregnant women endorsed
their decision. Similarly while only 15.4% of the primi gravida could decide about care, 24.2% of
the multi gravida were the decision makers. Though slight differences are seen in the decision
making of primi and multi gravid women, however, when “F” test is applied to check equality of
variances in the responses of primi and multi gravid women no marked variation was seen as
regards decision making about place of delivery. We are 95%confident about the result due to the
value of F (statistics) = 3.15.
Table 112: Decision makers for Pregnancy and PN period: responses of Lactating
Mothers
District
Decision maker
Self Mother In Law
Elder person of family
Husband Combined Decision
Total
Baran Para I 3(4.7) 28(43.8) 3(4.7) 12(18.8) 18(28.1) 64
Multi 14(6.7) 57(27.1) 13(6.2) 50(23.8) 76(36.2) 210
Barmer Para I 12(19.0) 42(66.7) 7(11.1) 2(3.2) 0(0.0) 63
Multi 83(39.0) 87(40.8) 13(6.1) 29(13.6) 1(0.5) 213
Dungarpur Para I 16(19.0) 40(47.6) 21(25.0) 7(8.3) 0(0.0) 84
Multi 57(25.2) 78(35.5) 42(18.6) 46(20.4) 3(1.3) 226
Sawai
Madhopur
Para I 9(17.6) 11(21.6) 5(9.8) 2(3.9) 24(47.1) 51
Multi 63(39.9) 32(20.3) 4 (2.5) 5(3.2) 54(34.1) 158
Tonk Para I 9(11.8) 21(27.6) 14(18.4) 15(19.7) 17(22.4) 76
Multi 28(18.8) 28(18.8) 12 (8.1) 38(25.5) 43(28.9) 149
Total Para I 49(14.5) 142(42.0) 50 (14.8) 38(11.2) 59(17.5) 338
Multi 245(25.6) 282(29.5) 84 (8.8) 168(17.6) 177(18.5) 956
Responses of the currently lactating mothers were no different as multi gravida (25.6%) stood out
to be a little more confident in deciding for themselves as compared to the primi gravida (14.5%).
“F” test to check the equality of variance of para I and multi para women. The value of F
(statistic) = 1.855, which cause the acceptance of null hypothesis at 5% level of significance and
shows no significant difference. Mothers-in-law stood as the most prominent decision makers for
both, para I and multi para women.

SIHFW: an ISO:9001:2008certif ied institution
KABP on continuum of care: Rapid Assessment: Oct 2009
78
Table 113: Decision makers for Pregnancy and PN period: responses of Mothers-In-Law
Districts Respondents Self Pregnant
women
Husband of
Pregnant
women
Anyone
Elder in
Family
Service
Provider
Baran PGP (41) 23 (56.1) 2 (4.9) 5 (12.2) 11 (26.8) 0 (0.0)
MGP (43) 33 (76.7) 0 (0.0) 4 (9.3) 5 (11.6) 1 (2.3)
Barmer PGP (10) 6 (60.0) 2 (20.0) 2 (20.0) 0 (0.0) 0 (0.0)
MGP (65) 48 (73.8) 10 (15.4) 5 (7.7) 1 (1.5) 1 (1.5)
Dungarpur PGP (8) 4 (50.0) 1 (12.5) 1 (12.5) 2 (25.0) 0 (0.0)
MGP (41) 27 (65.9) 1 (2.4) 1 (2.4) 12 (29.3) 0 (0.0)
S. Madhopur PGP (18) 10 (55.6) 0 (0.0) 1 (5.6) 6 (33.3) 1 (5.6)
MGP (42) 21 (50.0) 8 (19.0) 1 (2.4) 10 (23.8) 2 (4.8)
Tonk PGP (51) 30 (58.8) 1 (2.0) 3 (5.9) 16 (31.4) 1 (2.0)
MGP (59) 32 (54.2) 4 (6.8) 11 (18.6) 11 (18.6) 1 (1.7)
Total PGP (128) 73 (57.0) 6 (4.7) 12 (9.4) 35 (27.3) 2 (1.6)
MGP (250) 161 (64.4) 23 (9.2) 22 (8.8) 39 (15.6) 5 (2.0) PGP-Primi Gravida Pregnant, MGP- Multi Gravida Pregnant
Further, on being questioned regarding who takes the decision related to pregnancy, delivery and
child care, 378 mothers-in-law opined that the decision rests with them irrespective of the number
of times their daughter-in-laws have gone through the physiological process. The observations
are in contradiction to the expressions of pregnant and lactating women.
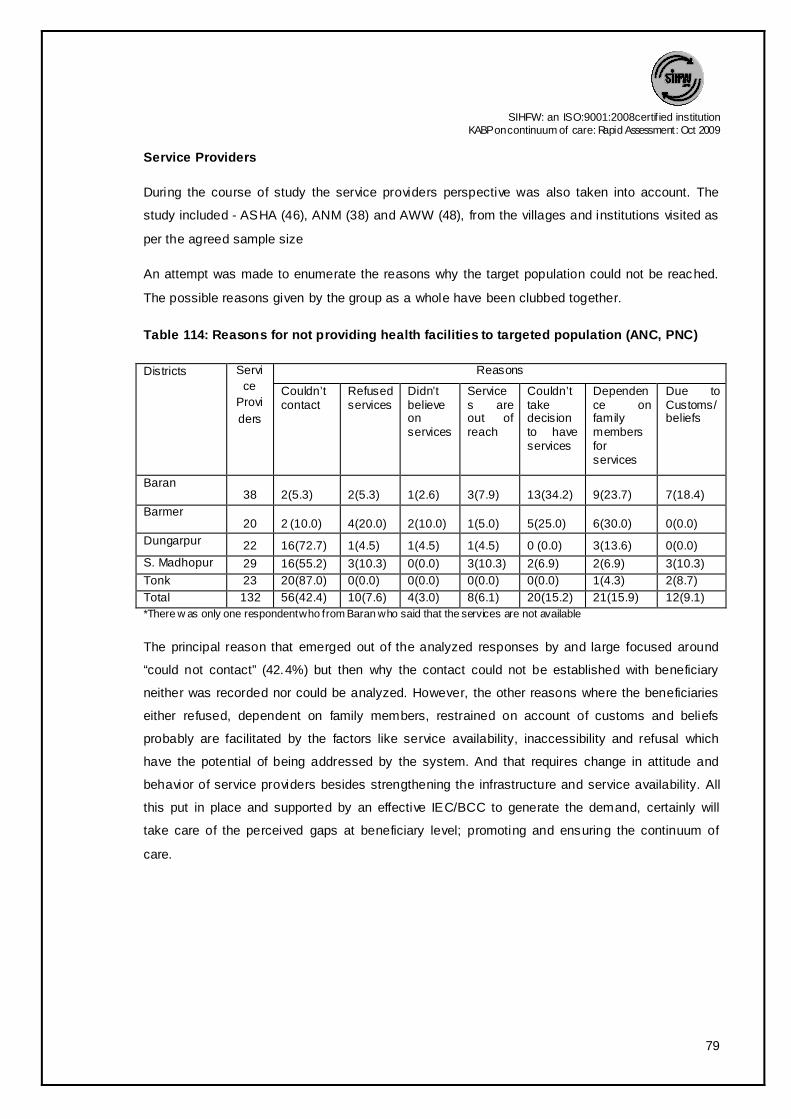
SIHFW: an ISO:9001:2008certif ied institution
KABP on continuum of care: Rapid Assessment: Oct 2009
79
Service Providers
During the course of study the service providers perspective was also taken into account. The
study included - ASHA (46), ANM (38) and AWW (48), from the villages and institutions visited as
per the agreed sample size
An attempt was made to enumerate the reasons why the target population could not be reached.
The possible reasons given by the group as a whole have been clubbed together.
Table 114: Reasons for not providing health facilities to targeted population (ANC, PNC)
Districts Servi
ce
Provi
ders
Reasons
Couldn’t contact
Refused services
Didn’t believe on services
Services are out of reach
Couldn’t take decision to have services
Dependence on family members for services
Due to Customs/beliefs
Baran 38 2(5.3) 2(5.3) 1(2.6) 3(7.9) 13(34.2) 9(23.7) 7(18.4)
Barmer 20 2 (10.0) 4(20.0) 2(10.0) 1(5.0) 5(25.0) 6(30.0) 0(0.0)
Dungarpur 22 16(72.7) 1(4.5) 1(4.5) 1(4.5) 0 (0.0) 3(13.6) 0(0.0)
S. Madhopur 29 16(55.2) 3(10.3) 0(0.0) 3(10.3) 2(6.9) 2(6.9) 3(10.3)
Tonk 23 20(87.0) 0(0.0) 0(0.0) 0(0.0) 0(0.0) 1(4.3) 2(8.7)
Total 132 56(42.4) 10(7.6) 4(3.0) 8(6.1) 20(15.2) 21(15.9) 12(9.1)
*There w as only one respondent who from Baran who said that the services are not available
The principal reason that emerged out of the analyzed responses by and large focused around
“could not contact” (42.4%) but then why the contact could not be established with beneficiary
neither was recorded nor could be analyzed. However, the other reasons where the beneficiaries
either refused, dependent on family members, restrained on account of customs and beliefs
probably are facilitated by the factors like service availability, inaccessibility and refusal which
have the potential of being addressed by the system. And that requires change in attitude and
behavior of service providers besides strengthening the infrastructure and service availability. All
this put in place and supported by an effective IEC/BCC to generate the demand, certainly will
take care of the perceived gaps at beneficiary level; promoting and ensuring the continuum of
care.

SIHFW: an ISO:9001:2008certif ied institution
KABP on continuum of care: Rapid Assessment: Oct 2009
80
Table 115: Reason of Non registration of pregnant females
Districts Service
Provider
Reasons Pregnant lady and her family members don’t consider it important
Pregnant lady couldn’t get in contact
All registered
Out of village
Baran 38 1(2.6) 27(71.1) 4(10.5) 6(15.8)
Barmer 20 17(85.0) 2(10.0) 1(5.0) 0(0.0) Dungarpur
22 4(18.2) 16(72.7) 2(9.1) 0(0.0) S. Madhopur 29 7(24.1) 21(72.4) 1(3.4) 0(0.0) Tonk 23 3(13.0) 3(13.0) 14(60.9) 3(13.0) Total 132 32(24.2) 69(52.3) 22(16.7) 9(6.8)
In order to ensure that services reach to every possible beneficiary for essential and emergency
obstetric care enumeration and early registration had been the agreed approach. When probed as
to why pregnant women are not registered, 52.3% of the service providers said that the expectant
mother could not be contacted and as usual another 24.2% held the beneficiary or her family for
not coming up for registration.
Further, when specifically questioned on why women do not turn up for ANC, the responses were
the same repetition, that women did not consider it important (28.8%), they are scared and
hesitant (13.6%) and service centers are not easily accessible (13.6%). Paradoxically, in Barmer,
where 90% of service providers blamed beneficiaries for not considering ANC as important;
interestingly none of them said that services are not within reach of beneficiary.
Table 116: Reasons for reluctance towards ANC check ups
Districts Service Provide
rs
Reasons
Not important
Service out of reach
Scared & hesitant
No one to accompany
Everyone come
Out of village
Don’t come due to work
Baran 38 3(7.9) 4(10.5) 4(10.5) 9(23.7) 15(39.5) 1(2.6) 2(5.3)
Barmer 20 18(90.0) 0(0.0) 1(5.0) 1(5.0) 0(0.0) 0(0.0) 0(0.0)
Dungarpur 22 4(18.2) 5(22.7) 10(45.5) 0(0.0) 3(13.6) 0(0.0) 0(0.0)
S. Madhopur 29 12(41.4) 8(27.6) 3(10.3) 1(3.4) 4(13.8) 1(3.4) 0(0.0)
Tonk 23 1(4.3) 1(4.3) 0(0.0) 0(0.0) 17(73.9) 2(8.7) 2(8.7)
Total 132 38(28.8) 18(13.6) 18(13.6) 11(8.3) 39(29.5) 4(3.0) 4(3.0)

SIHFW: an ISO:9001:2008certif ied institution
KABP on continuum of care: Rapid Assessment: Oct 2009
81
Table 117: Reasons of Non Compliance of TT Vaccination.
Districts Ser
vice
Pro
vide
rs
Reasons
Not important
Fear Relatives restrict for it
No one to accompany
Superstition
Never happened/ all occupied
Not able to contact
Baran 38 6(15.8) 6(15.8) 0(0.0) 4(10.5 2(5.3) 16(42.1) 4(10.5)
Barmer 20 14(70.0) 1(5.0) 3(15.0) 1(5.0) 1(5.0) 0(0.0) 0(0.0)
Dungarpur 22 10(45.5) 2(9.1) 2(9.1) 3(13.6) 5(22.7) 0(0.0) 0(0.0)
S. Madhopur 29 7(24.1) 5(17.2) 6(20.7) 1(3.4) 0(0.0) 8(27.6) 2(6.9)
Tonk 23 1(4.3) 0(0.0) 0(0.0) 0(0.0) 0(0.0) 17(73.9) 5(21.7)
Total 132 38(28.8) 14(10.6) 11(8.3) 9(6.8) 8(6.1) 41(31.1) 11(8.3)
According to the service providers (28.8%) beneficiaries did not consider it necessary to get
themselves vaccinated with TT shots during pregnancy. Another 10.6% of them attributed it to
fear of the beneficiaries. However, 31.1% reported that all the beneficiaries registered with them
did get the TT shots. Restriction from the family members (8.3%) and relatives also played a role
in non-compliance to TT vaccination.
Table 118: Delivery practices
Districts Service Provider
Home Hospital Dai Observing 5C’s
Complicated referred to hospital
Baran 38 0(0.0) 31(81.6) 0(0.0) 0(0.0) 6(15.8)
Barmer 20 6(30.0) 11(55.0) 2(10.0) 1(5.0) 0(0.0)
Dungarpur 22 0(0.0) 22(100.0) 0(0.0) 0(0.0) 0(0.0)
S. Madhopur 29 2(6.9) 14(48.3) 0(0.0) 13(44.8) 0(0.0)
Tonk 23 0(0.0) 22(95.7) 0(0.0) 0(0.0) 1(4.3)
Total 132 8(6.1) 100(75.8) 2(1.5) 14(10.6) 7(5.3)
Right from the days CSSM 5 cleans are being promoted as a measure to reduce infection during
delivery. Only 10.6% of the service providers could identify 5 cleans as an essential component of
delivery. 75.8% felt that the preferred place of delivery among the pregnant women is hospital
with 6.1% going for home delivery assisted by a dai (1.5%) or relatives.

SIHFW: an ISO:9001:2008certif ied institution
KABP on continuum of care: Rapid Assessment: Oct 2009
82
Table 119: Reasons for preferring home delivery
Districts Service Providers
Reasons
Customarily family practices
Distance Transportation
Poor care at facility
No one to accompany
Baran 38 18(47.4) 6(15.8) 12(31.6) 1(2.6) 1(2.6)
Barmer 20 8(40.0) 5(25.0) 5(25.0) 2(10.0) 0(0.0)
Dungarpur 22 10(45.5) 1(4.5) 3(13.6) 4(18.2) 4(18.2)
S. Madhopur 29 12(41.4) 3(10.3) 6(20.7) 4(13.8) 4(13.8)
Tonk 23 13(56.5) 1(4.3) 0(0.0) 9(39.1) 0(0.0)
Total 132 61(46.2) 16(12.1) 26(19.7) 20(15.1) 9(6.8)
In response to the question from the service providers as to why people prefer home delivery
46.2% attributed the reason to customs and family practice. Lack of proper transport was another
reason provided by the services providers (19.7%) for opting home delivery.
Table 120: Reasons for non consumption of IFA tablets
Districts Service
Providers
Forgetful
ness
Relatives
restrict for it
Side
effects
Non-
availability
Fear Quality Not
important
Baran 38 8(21.1) 1(2.6) 20(52.6) 2(5.3) 3(7.9) 4(10.5) 0(0.0)
Barmer 20 6(30.0) 1(5.0) 8(40.0) 0(0.0) 3(15.0) 0(0.0) 2(10.0)
Dungarpur 22 2(9.1) 0(0.0) 20(90.9) 0(0.0) 0(0.0) 0(0.0) 0(0.0)
S. Madhopur 29 2(6.9) 0(0.0) 24(82.7) 0(0.0) 0(0.0) 3(10.3) 0(0.0)
Tonk 23 2(0.0) 0(0.0) 22(95.6) 0(0.0) 1(4.3) 0(0.0) 0(0.0)
Total 132 18(13.6) 2(1.5) 94(71.2) 2(1.5) 7(5.3) 7(5.3) 2(1.5)
Over all reasons of non compliance of IFA tablets intake was mainly due to perceived side effects
(71.2%). Second important reason was forgetfulness (13.6%).
Table 121: Reasons of not taking extra diet & rest during pregnancy
Districts Service
Providers
Reasons
Not important Resources are not available
Household works
Complications in pregnancy due to overeating
Work would aid in easy delivery
Baran 38 11(28.9) 14(36.8) 12(31.6) 1(2.6) 0(0.0)
Barmer 20 4(20.0) 2(10.0) 7(35.0) 1(5.0) 6(30.0)
Dungarpur 22 0(0.0) 8(36.4) 13(59.1) 0(0.0) 1(4.5)
S. Madhopur 29 8(27.6) 8(27.6) 13(44.8) 0(0.0) 0(0.0)
Tonk 23 0(0.0) 0(0.0) 19(82.6) 2(8.7) 2(8.70
Total 132 23(17.4) 32(24.2) 64(48.5) 4(3.0) 9(6.8)

SIHFW: an ISO:9001:2008certif ied institution
KABP on continuum of care: Rapid Assessment: Oct 2009
83
Reasons of not taking extra diet & rest during pregnancy was mainly attributed to household work
(48.5%).
Table 122: Reasons of not availing child care facilities at health centre
Districts Service Providers
Reasons
Traditions & customs
Resources not available
Not important
Superstition Everyone goes to hospital/ Use home medication
Baran 38 9(23.7) 7(18.4) 7(18.4) 5(13.2) 10(26.3)
Barmer 20 8(40.0) 1(5.0) 3(15.0) 8(40.0) 0(0.0)
Dungarpur 22 2(9.1) 4(18.2) 7(31.8) 8(36.4) 1(4.5)
S. Madhopur 29 11(37.9) 0(0.0) 1(3.4) 16(55.2) 1(3.4)
Tonk 23 0(0.0) 0(0.0) 0(0.0) 13(56.5) 10(43.5)
Total 132 30(22.7) 12(9.1) 18(13.6) 50(37.9) 22(16.7)
Superstition (evil eye/nazar) restricts the family/mother from taking the child to health facility
according to 37.9% of the health workers. Another 22.7% attributed it to traditions and customs.
Table 123: Reasons for denying colostrum to new born baby
Districts Service
Providers
Reasons
Not suitable Mother & child not fit for colostrum feeding
Not important
Feeding only after ceremony
Now every mother give her first milk to their child
Baran 38 7(18.4) 2(5.3) 13(34.2) 4(10.5) 12(31.6)
Barmer 20 12(60.0) 2(10.0) 3(15.0) 3(15.0) 0(0.0)
Dungarpur 22 7(31.8) 7(31.8) 7(31.8) 0(0.0) 1(4.5)
S. Madhopur 29 22(75.9) 1(3.4) 6(20.7) 0(0.0) 0(0.0)
Tonk 23 0(0.0) 6(26.1) 6(26.1) 0(0.0) 11(47.8)
Total 132 48(36.4) 18(13.6) 35(26.5) 7(5.3) 24(18.2)
The prime reason propounded by service providers for not feeding the baby with colostrum was
the perception about unsuitability for the new born (36.4%) and another 26.5% of them said that it
is not considered important by the mothers to feed the child with colostrum.

SIHFW: an ISO:9001:2008certif ied institution
KABP on continuum of care: Rapid Assessment: Oct 2009
84
Table 124: Reasons of not practicing exclusive breast feeding
Districts Service
Providers
Reasons
Water necessary for quenching thirst
Janam Ghutti helps in digestion
Mother’s milk not enough
Mother busy with work
Tradition Now no one give these things
Baran 38 4(10.5) 5(13.2) 20(52.6) 0(0.0) 5(13.2) 4(10.5)
Barmer 20 5(25.0) 4(20.0) 9(45.0) 1(5.0) 1(5.0) 0(0.0)
Dungarpur 22 2(9.1) 7(31.8) 12(54.5) 0(0.0) 1(4.5) 0(0.0)
S. Madhopur 29 18(62.1) 1(3.4) 7(24.1) 3(10.3) 0(0.0) 0(0.0)
Tonk 23 6(26.1) 3(13.0) 8(34.8) 1(4.3) 0(0.0) 5(21.7)
Total 132 35(26.5) 20(15.2) 56(42.4) 5(3.8) 7(5.3) 9(6.8)
Variety of reasons were given on why exclusive breast feeding was not practiced. 42.4% of the
service providers were of the view that not enough mothers’ milk was produced and thus had to
be supplemented. Similarly, the thought that water is necessary to quench the child’s thirst was
given as the reason by 26.5% of service providers.
Table 125: Reasons of non compliance of vaccination in infants
Districts Service Provider
s
Reasons
Not important
Resources not available
No such facility in village
Fear Forgetfulness
Vaccination causes fever
Baran 38 10(26.3) 5(13.2) 2(5.3) 10(26.3) 11(28.9) 0(0.0)
Barmer 20 9(45.0) 1(5.0) 0(0.0) 2(10.0) 7(35.0) 1(5.0)
Dungarpur 22 3(13.6) 2(9.1) 1(4.5) 3(13.6) 5(50.0) 2(9.1)
S. Madhopur 29 5(17.2) 2(6.9) 8(27.6) 4(13.8) 7(17.2) 5(17.2)
Tonk 23 0(0.0) 14(60.9) 0(0.0) 1(4.3) 7(30.4) 1(4.3)
Total 132 27(20.5) 24(18.2) 11(8.3) 20(15.2) 41(31.1) 9(6.8)
31.1% of the service providers considered forgetfulness on part of family/mother for non
compliance of vaccination in infants, while 20.5% stated that they did not consider it important.

SIHFW: an ISO:9001:2008certif ied institution
KABP on continuum of care: Rapid Assessment: Oct 2009
85
Table 126: Barriers in low utilization of birth spacing practices
Districts Service
Providers
Barriers
Lack of Awareness
Hesitation Misconception about birth spacing methods
Fear Desire for more children
Now everyone aware
Baran 38 7(18.4) 13(34.2) 2(5.3) 8(21.1) 7(18.4) 1(2.6)
Barmer 20 9(45.0) 1(5.0) 0(0.0) 2(10.0) 7(35.0) 1(5.0)
Dungarpur 22 5(22.7) 1(4.5) 10(45.5) 3(13.6) 2(9.1) 1(4.5)
S. Madhopur 29 5(17.2) 2(6.9) 20(69.0) 2(6.9) 0(0.0) 0(0.0)
Tonk 23 2(8.7) 0(0.0) 11(47.8) 2(8.7) 2(8.7) 6(26.1)
Total 132 28(21.2) 17(12.9) 43(32.6) 17(12.9) 18(13.6) 9(6.8)
Misconception about the birth spacing methods is one of the reasons given by service providers
(32.6%) as a barrier in the utilization of birth spacing methods. 21.2% of the service providers said
that lack of awareness is still a contributing factor in the non utilization of family planning methods
besides fear and hesitation.
Table 127: Major challenges in achieving targets (Health Care Delivery)
Districts Service Providers Challenges
Resistance to change
Lack of education facility
Lack of transport and time
Economic condition
No problem faced
Baran 38 15(39.5) 5(13.2) 15(39.5) 2(5.3) 1(2.6)
Barmer 20 16(80.0) 1(5.0) 3(15.0) 0(0.0) 0(0.0)
Dungarpur 22 13(59.1) 1(4.5) 8(36.4) 0(0.0) 0(0.0)
S. Madhopur 29 15(51.7) 6(20.7) 5(17.2) 0(0.0) 3(10.3)
Tonk 23 11(47.8) 5(21.7) 1(4.3) 0(0.0) 6(26.1)
Total 132 70(53.0) 18(13.6) 32(24.2) 2(1.5) 10(7.6)
Major challenges in achieving targets (Health Care Delivery) were mainly due to the stubborn
attitude and lack of understanding among people (53.0%).

SIHFW: an ISO:9001:2008certif ied institution
KABP on continuum of care: Rapid Assessment: Oct 2009
86
Table 128: Advocated media options for BCC/IEC by service provider
Districts Service Provider
Teacher/students/religious leaders/women group
Local artist Camps Sarpanch Mass Media
Baran 38 28(73.7) 4(10.5) 2(95.3) 3(7.9) 1(2.6)
Barmer 20 18(80.0) 2(10.0) 0(0.0) 0(0.0) 0(0.0)
Dungarpur 22 16(72.7) 0(0.0) 5(22.7) 0(0.0) 1(4.5)
S. Madhopur
29 19(65.4) 3(10.3) 1(3.4) 4(13.8) 2(6.9)
Tonk 23 22(95.6) 1(4.3) 0(0.0) 0(0.0) 0(0.0)
Total 132 103(78.1) 10(7.6) 8(6.1) 7(5.3) 4(3.0)
40.2% of the service providers advocated women group as the best medium for BCC/IEC as
female problems can be best understood and addressed by females themselves.

SIHFW: an ISO:9001:2008certif ied institution
KABP on continuum of care: Rapid Assessment: Oct 2009
87
Recommendations
SIHFW: an ISO:9001:2008certif ied institution
KABP on continuum of care: Rapid Assessment: Oct 2009
88
Recommendations
· Communitization of health services need to be ensured for which multipronged approach for
addressing the communication gaps to be adopted and community empowerment is to be
ensured by giving the responsibility in planning execution and monitoring of health services at
villages’ level. Transferring the untied fund is not the solution of the problem.
· In Rajasthan, discontinuity and dropping out from the services at various stages from
registration of pregnancy, ANC visits, PNC and Neonatal care is visible. Therefore strategies
for ensuring the continuity in services need to be framed.
· Study observation revealed more case of ANC registration in second trimester. Those
registered in second (39.5%) and third t rimester (31.8%) could only have two antenatal visits.
Community perception on disclosure of pregnancy needs to be changed and addressed in
communication strategies.
· The practice of delaying the initiation of breast feed after 2-3 days is seen more when delivery
was at home. ASHA needs to subscribe to a proactive role in educating mothers and their
mothers-in-law.
· BCC strategy should be evolved based on the observation of this study and the experiences
of field level services providers and program managers.
· As decision related to pregnancy, delivery and child care, rests with mothers-in-law so need is
to enhance the knowledge of MIL, wherein specific strategies in relation to communication
and counseling need to be forged.
· Introduction of JSY has changed the scenario of institutional deliveries but some of the
districts still lag behind in this regard. District specific BCC strategies are needed to be
developed for these districts for promoting JSY and ID. Barmer is one of those districts where
all the parameters are not in favor of desired goals.
· Status of fully immunized child could not be derived from the current study but there is history
of dropouts from routine immunization schedule. The unimmunized child came out with wide
and varied reasons where dependence – “no health worker came at home” and lack of
knowledge and unawareness were put as the main reason. To ensure the 100% coverage
issues need to be addressed in BCC strategies.

SIHFW: an ISO:9001:2008certif ied institution
KABP on continuum of care: Rapid Assessment: Oct 2009
89
· To address the communication gaps only production of material is not the appropriate
strategy, piloting the TIPS approach in which counseling and follow up is the key instrument
for improving the practices. Department has resource of manpower in the field to be used for
such activity only orientation and training needs to be provided as input for such activity.
· Counseling skills of service provider specially the doctors can make difference in utilization of
services. Counseling is the best medicine for sustainable cure of preventable diseases.
· To obtain the specific observation on different issue like utilization of PNC services, care of
neonates and feeding practices, exclusive breast feeding more studies need to be planned.
Appreciative enquiry on Maternal and Child death should be initiated in block approach.
· VHSC members may be instrumental in improving the over all status of health in the villages.
Services of VHSC members in BCC should be obtained for which enhancing the capacities of
VHSC members in BCC is one of the core strategies.
· VHSCs members should be targeted to have active roles in propagating messages related to
reproductive health.

SIHFW: an ISO:9001:2008certif ied institution
KABP on continuum of care: Rapid Assessment: Oct 2009
90
Limitations
1. The age at marriage could not be segregated as per legal cut off since the design had by
default grouped women in > 20 , 20-30 and 30-45 yrs. Of age
2. The exclusivity of breast feeding for the entire period of 6 months cannot be ascertained
as the question did not specify the period
3. The experiences of previous home delivery prompting a attitudinal change to go for
Institutional delivery for the present pregnancy again cannot be correlated
4. The no. of TT injections received in present or past pregnancy, which would have helped
in assessing of right practices on part of provider; again fall short of a correlation.
5. The practice of Immunization on part of family / mother and subsequent assessment of
partial or full immunization could not be carried out again for defective design of
questionnaire.
In view of the aforesaid limitations, it would be apt to explore the area with further field studies
which should possibly answer to questions like
a. What is the quality of PNC visits by ANM/ ASHA and does it build up a positive attitude
facilitating care continuum
b. Whether full Immunization has a relation to place of delivery
c. Quality of ANC and PNC and its relation to mortality and reproductive morbidities
d. The relation between education of mother in law and parity of women to Institutional
delivery, exclusive breast feeding and child Immunization
e. The scientific basis of rest with a direct correlation to involution period for uterus could
avert a lot of reproductive morbidities, assessment of which requires detailed studies in
the community.