Embed Size (px)
Citation preview
Rapeseed (Canola) and Products Tables

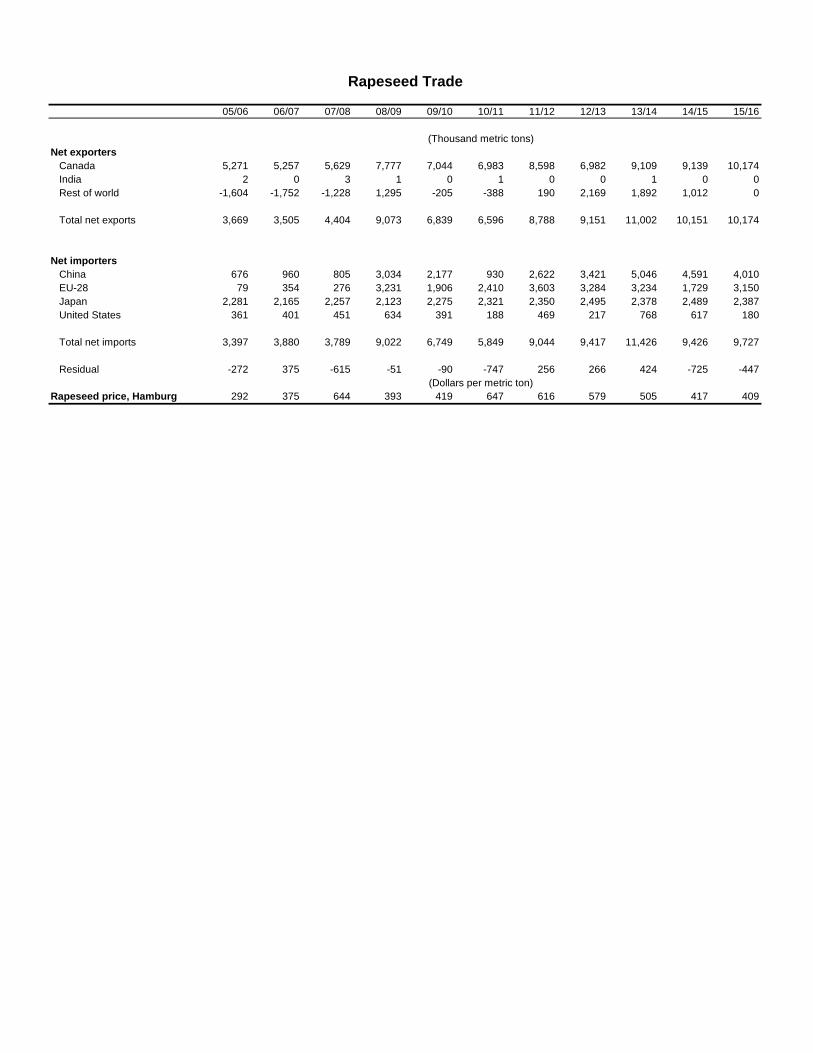
Rapeseed Trade Rapeseed Trade
05/06 06/07 07/08 08/09 09/10 10/11 11/12 12/13 13/14 14/15 15/16
(Thousand metric tons) (Thousand metric tons)
Net exporters
Canada 5,271 5,257 5,629 7,777 7,044 6,983 8,598 6,982 9,109 9,139 10,174
India 2 0 3 1 0 1 0 0 1 0 0
Rest of world -1,604 -1,752 -1,228 1,295 -205 -388 190 2,169 1,892 1,012 0
Total net exports 3,669 3,505 4,404 9,073 6,839 6,596 8,788 9,151 11,002 10,151 10,174
Net importers
China 676 960 805 3,034 2,177 930 2,622 3,421 5,046 4,591 4,010
EU-28 79 354 276 3,231 1,906 2,410 3,603 3,284 3,234 1,729 3,150
Japan 2,281 2,165 2,257 2,123 2,275 2,321 2,350 2,495 2,378 2,489 2,387
United States 361 401 451 634 391 188 469 217 768 617 180
Total net imports 3,397 3,880 3,789 9,022 6,749 5,849 9,044 9,417 11,426 9,426 9,727
Residual -272 375 -615 -51 -90 -747 256 266 424 -725 -447
(Dollars per metric ton) (Dollars per metric ton)
Rapeseed price, Hamburg 292 375 644 393 419 647 616 579 505 417 409
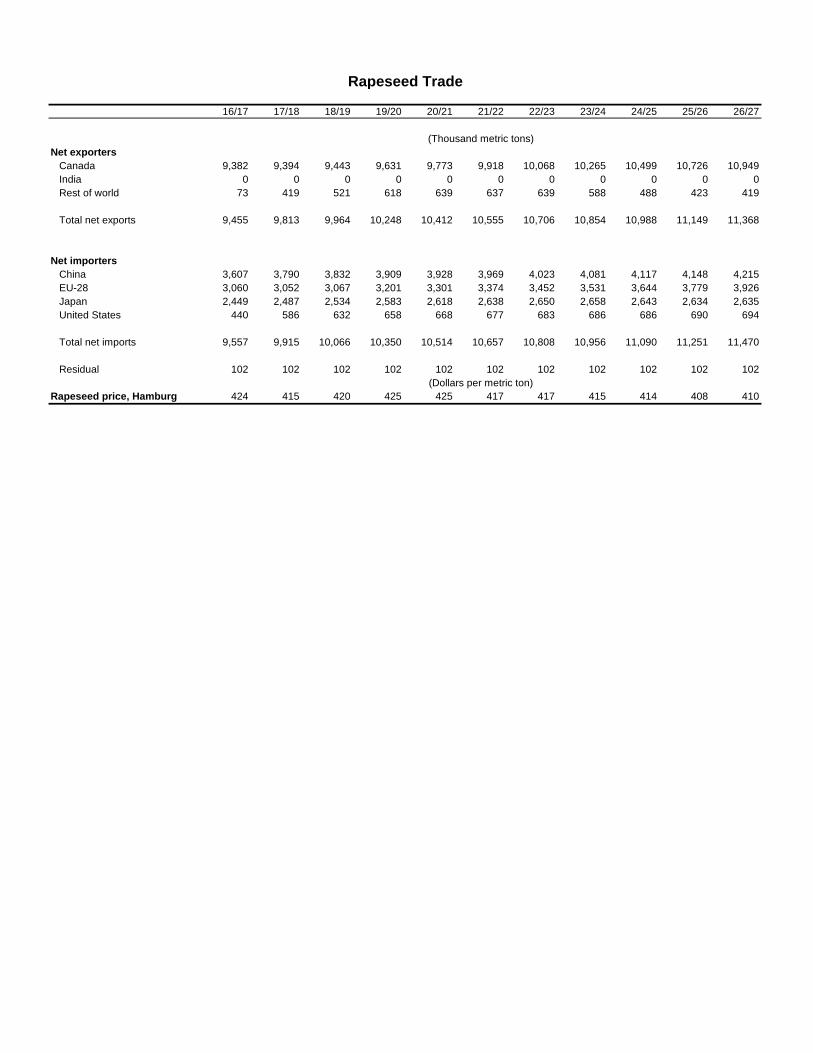
Rapeseed Trade
16/17 17/18 18/19 19/20 20/21 21/22 22/23 23/24 24/25 25/26 26/27
(Thousand metric tons)
Net exporters
Canada 9,382 9,394 9,443 9,631 9,773 9,918 10,068 10,265 10,499 10,726 10,949
India 0 0 0 0 0 0 0 0 0 0 0
Rest of world 73 419 521 618 639 637 639 588 488 423 419
Total net exports 9,455 9,813 9,964 10,248 10,412 10,555 10,706 10,854 10,988 11,149 11,368
Net importers
China 3,607 3,790 3,832 3,909 3,928 3,969 4,023 4,081 4,117 4,148 4,215
EU-28 3,060 3,052 3,067 3,201 3,301 3,374 3,452 3,531 3,644 3,779 3,926
Japan 2,449 2,487 2,534 2,583 2,618 2,638 2,650 2,658 2,643 2,634 2,635
United States 440 586 632 658 668 677 683 686 686 690 694
Total net imports 9,557 9,915 10,066 10,350 10,514 10,657 10,808 10,956 11,090 11,251 11,470
Residual 102 102 102 102 102 102 102 102 102 102 102
(Dollars per metric ton)
Rapeseed price, Hamburg 424 415 420 425 425 417 417 415 414 408 410
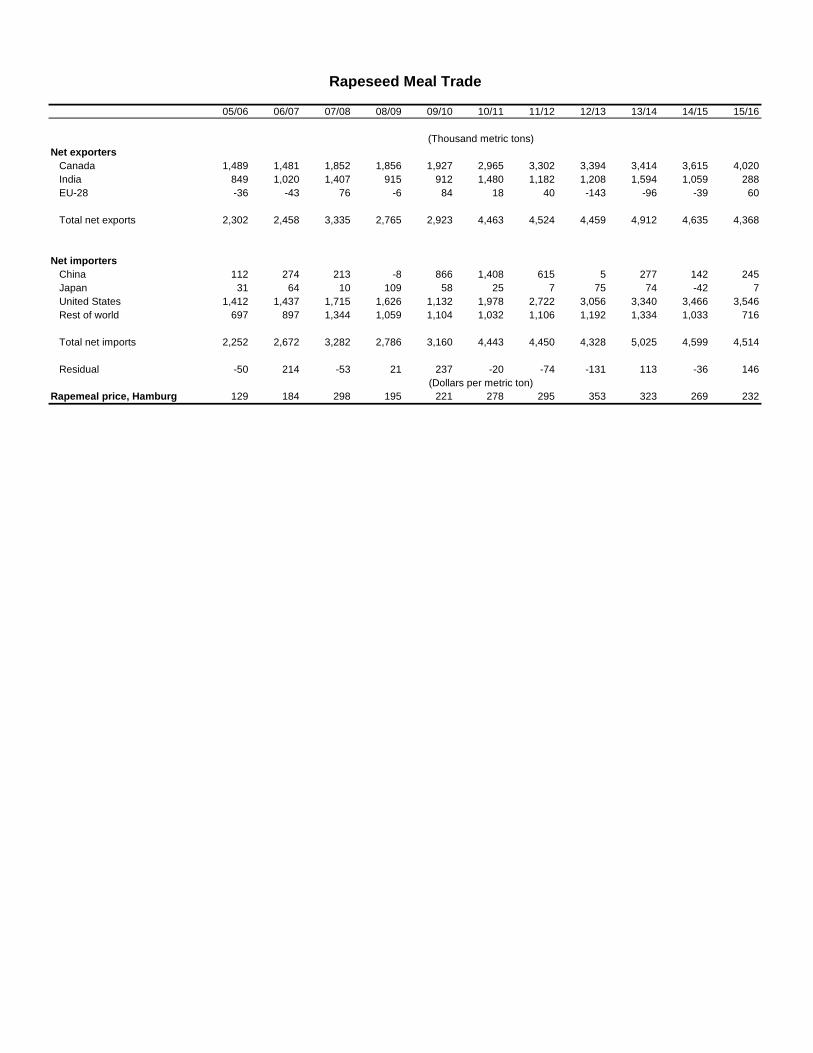
Rapeseed Meal Trade Rapeseed Meal Trade
05/06 06/07 07/08 08/09 09/10 10/11 11/12 12/13 13/14 14/15 15/16
(Thousand metric tons) (Thousand metric tons)
Net exporters
Canada 1,489 1,481 1,852 1,856 1,927 2,965 3,302 3,394 3,414 3,615 4,020
India 849 1,020 1,407 915 912 1,480 1,182 1,208 1,594 1,059 288
EU-28 -36 -43 76 -6 84 18 40 -143 -96 -39 60
Total net exports 2,302 2,458 3,335 2,765 2,923 4,463 4,524 4,459 4,912 4,635 4,368
Net importers
China 112 274 213 -8 866 1,408 615 5 277 142 245
Japan 31 64 10 109 58 25 7 75 74 -42 7
United States 1,412 1,437 1,715 1,626 1,132 1,978 2,722 3,056 3,340 3,466 3,546
Rest of world 697 897 1,344 1,059 1,104 1,032 1,106 1,192 1,334 1,033 716
Total net imports 2,252 2,672 3,282 2,786 3,160 4,443 4,450 4,328 5,025 4,599 4,514
Residual -50 214 -53 21 237 -20 -74 -131 113 -36 146
(Dollars per metric ton) (Dollars per metric ton)
Rapemeal price, Hamburg 129 184 298 195 221 278 295 353 323 269 232
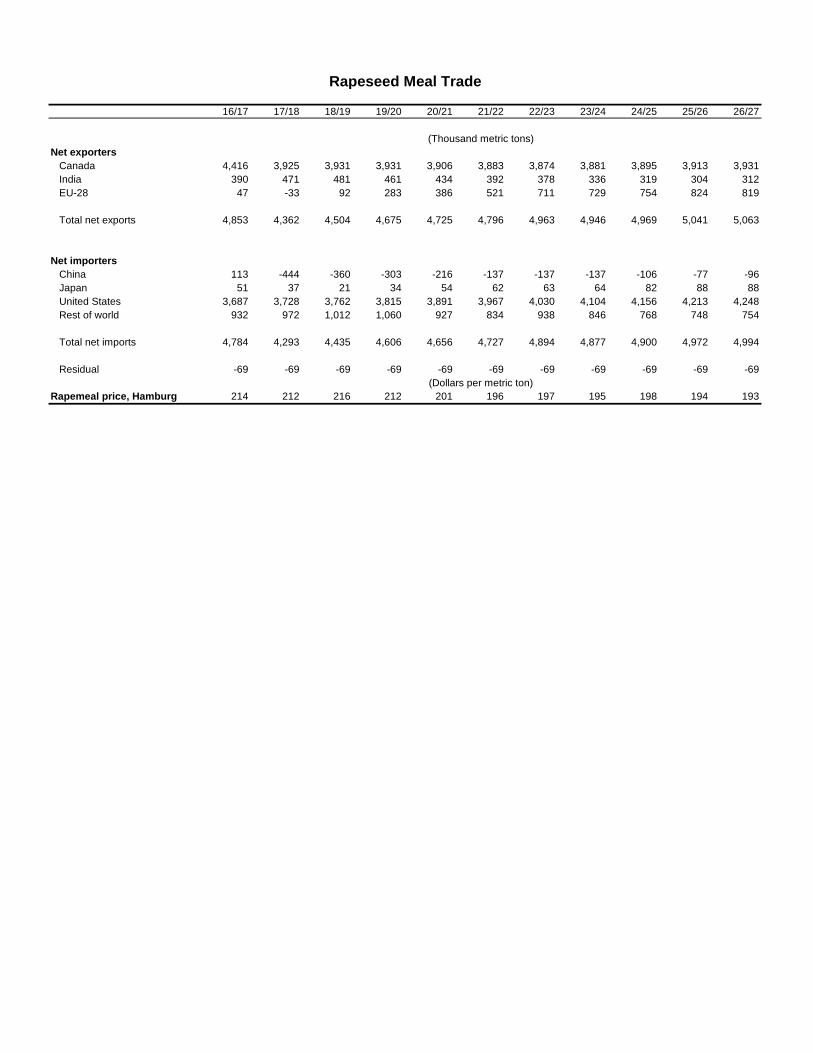
Rapeseed Meal Trade
16/17 17/18 18/19 19/20 20/21 21/22 22/23 23/24 24/25 25/26 26/27
(Thousand metric tons)
Net exporters
Canada 4,416 3,925 3,931 3,931 3,906 3,883 3,874 3,881 3,895 3,913 3,931
India 390 471 481 461 434 392 378 336 319 304 312
EU-28 47 -33 92 283 386 521 711 729 754 824 819
Total net exports 4,853 4,362 4,504 4,675 4,725 4,796 4,963 4,946 4,969 5,041 5,063
Net importers
China 113 -444 -360 -303 -216 -137 -137 -137 -106 -77 -96
Japan 51 37 21 34 54 62 63 64 82 88 88
United States 3,687 3,728 3,762 3,815 3,891 3,967 4,030 4,104 4,156 4,213 4,248
Rest of world 932 972 1,012 1,060 927 834 938 846 768 748 754
Total net imports 4,784 4,293 4,435 4,606 4,656 4,727 4,894 4,877 4,900 4,972 4,994
Residual -69 -69 -69 -69 -69 -69 -69 -69 -69 -69 -69
(Dollars per metric ton)
Rapemeal price, Hamburg 214 212 216 212 201 196 197 195 198 194 193
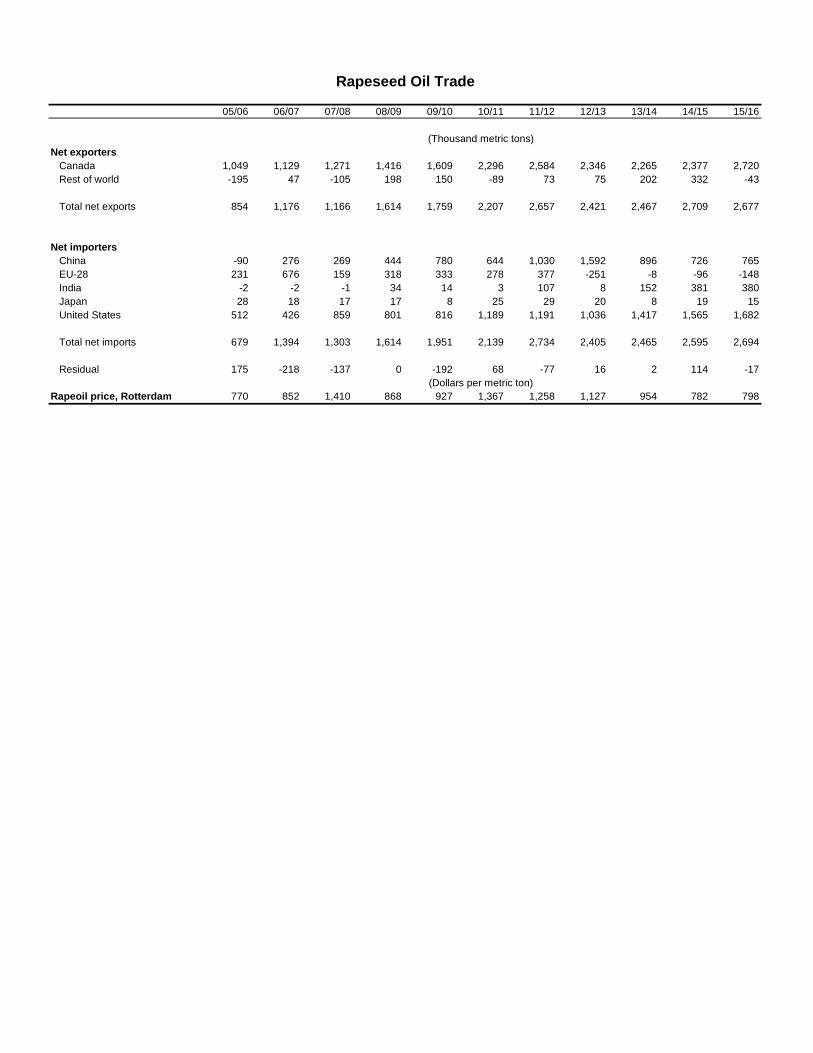
Rapeseed Oil Trade Rapeseed Oil Trade
05/06 06/07 07/08 08/09 09/10 10/11 11/12 12/13 13/14 14/15 15/16
(Thousand metric tons) (Thousand metric tons)
Net exporters
Canada 1,049 1,129 1,271 1,416 1,609 2,296 2,584 2,346 2,265 2,377 2,720
Rest of world -195 47 -105 198 150 -89 73 75 202 332 -43
Total net exports 854 1,176 1,166 1,614 1,759 2,207 2,657 2,421 2,467 2,709 2,677
Net importers
China -90 276 269 444 780 644 1,030 1,592 896 726 765
EU-28 231 676 159 318 333 278 377 -251 -8 -96 -148
India -2 -2 -1 34 14 3 107 8 152 381 380
Japan 28 18 17 17 8 25 29 20 8 19 15
United States 512 426 859 801 816 1,189 1,191 1,036 1,417 1,565 1,682
Total net imports 679 1,394 1,303 1,614 1,951 2,139 2,734 2,405 2,465 2,595 2,694
Residual 175 -218 -137 0 -192 68 -77 16 2 114 -17
(Dollars per metric ton) (Dollars per metric ton)
Rapeoil price, Rotterdam 770 852 1,410 868 927 1,367 1,258 1,127 954 782 798
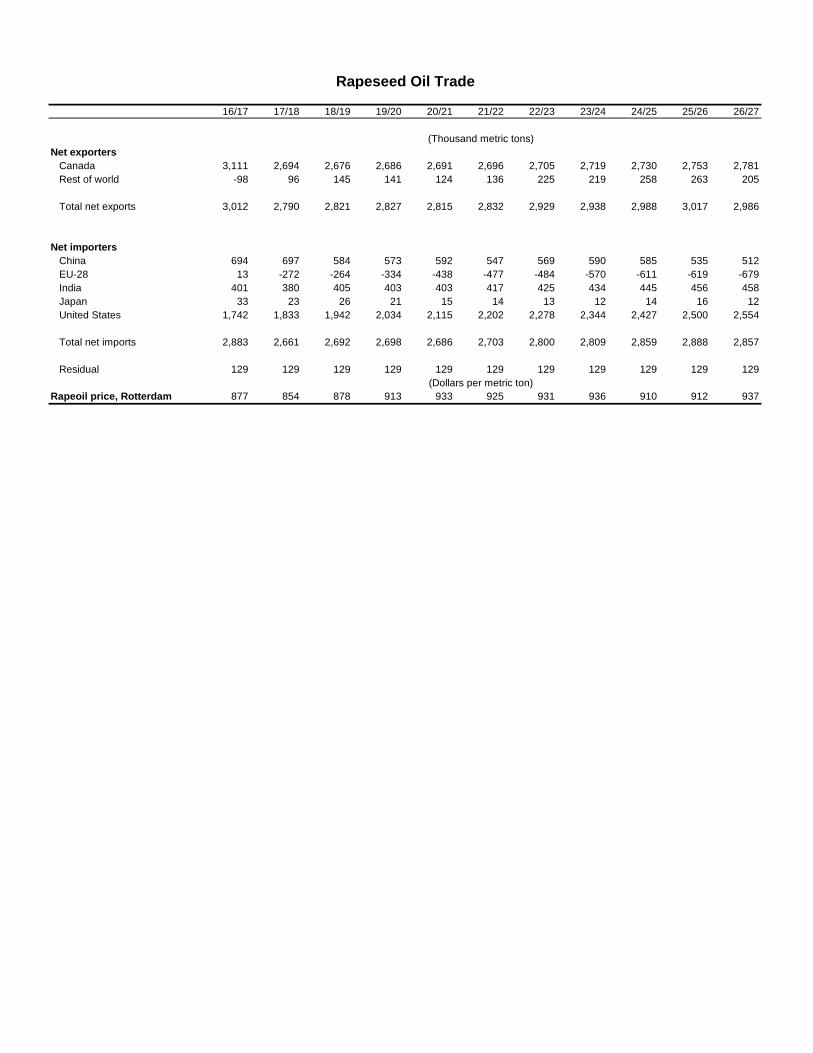
Rapeseed Oil Trade
16/17 17/18 18/19 19/20 20/21 21/22 22/23 23/24 24/25 25/26 26/27
(Thousand metric tons)
Net exporters
Canada 3,111 2,694 2,676 2,686 2,691 2,696 2,705 2,719 2,730 2,753 2,781
Rest of world -98 96 145 141 124 136 225 219 258 263 205
Total net exports 3,012 2,790 2,821 2,827 2,815 2,832 2,929 2,938 2,988 3,017 2,986
Net importers
China 694 697 584 573 592 547 569 590 585 535 512
EU-28 13 -272 -264 -334 -438 -477 -484 -570 -611 -619 -679
India 401 380 405 403 403 417 425 434 445 456 458
Japan 33 23 26 21 15 14 13 12 14 16 12
United States 1,742 1,833 1,942 2,034 2,115 2,202 2,278 2,344 2,427 2,500 2,554
Total net imports 2,883 2,661 2,692 2,698 2,686 2,703 2,800 2,809 2,859 2,888 2,857
Residual 129 129 129 129 129 129 129 129 129 129 129
(Dollars per metric ton)
Rapeoil price, Rotterdam 877 854 878 913 933 925 931 936 910 912 937
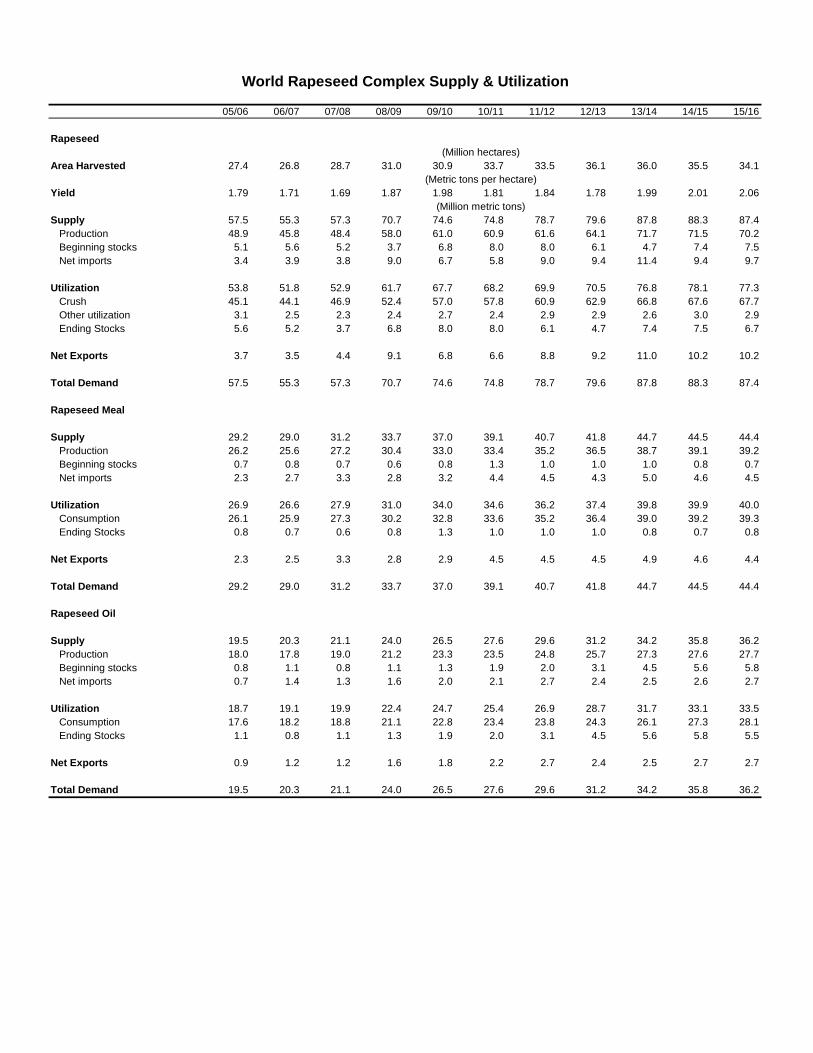
World Rapeseed Complex Supply & Utilization World Rapeseed Complex Supply & Utilization
05/06 06/07 07/08 08/09 09/10 10/11 11/12 12/13 13/14 14/15 15/16
Rapeseed
(Million hectares) (Million hectares)
Area Harvested 27.4 26.8 28.7 31.0 30.9 33.7 33.5 36.1 36.0 35.5 34.1
(Metric tons per hectare) (Metric tons per hectare)
Yield 1.79 1.71 1.69 1.87 1.98 1.81 1.84 1.78 1.99 2.01 2.06
(Million metric tons) (Million metric tons)
Supply 57.5 55.3 57.3 70.7 74.6 74.8 78.7 79.6 87.8 88.3 87.4
Production 48.9 45.8 48.4 58.0 61.0 60.9 61.6 64.1 71.7 71.5 70.2
Beginning stocks 5.1 5.6 5.2 3.7 6.8 8.0 8.0 6.1 4.7 7.4 7.5
Net imports 3.4 3.9 3.8 9.0 6.7 5.8 9.0 9.4 11.4 9.4 9.7
Utilization 53.8 51.8 52.9 61.7 67.7 68.2 69.9 70.5 76.8 78.1 77.3
Crush 45.1 44.1 46.9 52.4 57.0 57.8 60.9 62.9 66.8 67.6 67.7
Other utilization 3.1 2.5 2.3 2.4 2.7 2.4 2.9 2.9 2.6 3.0 2.9
Ending Stocks 5.6 5.2 3.7 6.8 8.0 8.0 6.1 4.7 7.4 7.5 6.7
Net Exports 3.7 3.5 4.4 9.1 6.8 6.6 8.8 9.2 11.0 10.2 10.2
Total Demand 57.5 55.3 57.3 70.7 74.6 74.8 78.7 79.6 87.8 88.3 87.4
Rapeseed Meal
Supply 29.2 29.0 31.2 33.7 37.0 39.1 40.7 41.8 44.7 44.5 44.4
Production 26.2 25.6 27.2 30.4 33.0 33.4 35.2 36.5 38.7 39.1 39.2
Beginning stocks 0.7 0.8 0.7 0.6 0.8 1.3 1.0 1.0 1.0 0.8 0.7
Net imports 2.3 2.7 3.3 2.8 3.2 4.4 4.5 4.3 5.0 4.6 4.5
Utilization 26.9 26.6 27.9 31.0 34.0 34.6 36.2 37.4 39.8 39.9 40.0
Consumption 26.1 25.9 27.3 30.2 32.8 33.6 35.2 36.4 39.0 39.2 39.3
Ending Stocks 0.8 0.7 0.6 0.8 1.3 1.0 1.0 1.0 0.8 0.7 0.8
Net Exports 2.3 2.5 3.3 2.8 2.9 4.5 4.5 4.5 4.9 4.6 4.4
Total Demand 29.2 29.0 31.2 33.7 37.0 39.1 40.7 41.8 44.7 44.5 44.4
Rapeseed Oil
Supply 19.5 20.3 21.1 24.0 26.5 27.6 29.6 31.2 34.2 35.8 36.2
Production 18.0 17.8 19.0 21.2 23.3 23.5 24.8 25.7 27.3 27.6 27.7
Beginning stocks 0.8 1.1 0.8 1.1 1.3 1.9 2.0 3.1 4.5 5.6 5.8
Net imports 0.7 1.4 1.3 1.6 2.0 2.1 2.7 2.4 2.5 2.6 2.7
Utilization 18.7 19.1 19.9 22.4 24.7 25.4 26.9 28.7 31.7 33.1 33.5
Consumption 17.6 18.2 18.8 21.1 22.8 23.4 23.8 24.3 26.1 27.3 28.1
Ending Stocks 1.1 0.8 1.1 1.3 1.9 2.0 3.1 4.5 5.6 5.8 5.5
Net Exports 0.9 1.2 1.2 1.6 1.8 2.2 2.7 2.4 2.5 2.7 2.7
Total Demand 19.5 20.3 21.1 24.0 26.5 27.6 29.6 31.2 34.2 35.8 36.2
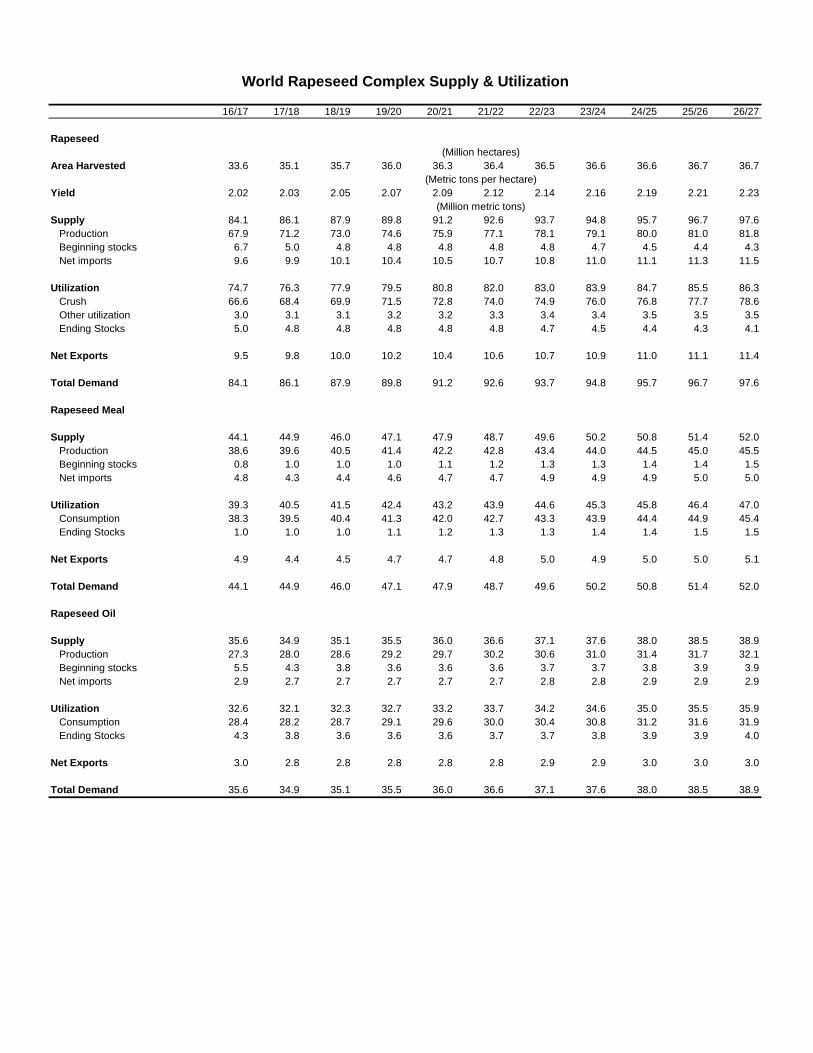
World Rapeseed Complex Supply & Utilization
16/17 17/18 18/19 19/20 20/21 21/22 22/23 23/24 24/25 25/26 26/27
Rapeseed
(Million hectares)
Area Harvested 33.6 35.1 35.7 36.0 36.3 36.4 36.5 36.6 36.6 36.7 36.7
(Metric tons per hectare)
Yield 2.02 2.03 2.05 2.07 2.09 2.12 2.14 2.16 2.19 2.21 2.23
(Million metric tons)
Supply 84.1 86.1 87.9 89.8 91.2 92.6 93.7 94.8 95.7 96.7 97.6
Production 67.9 71.2 73.0 74.6 75.9 77.1 78.1 79.1 80.0 81.0 81.8
Beginning stocks 6.7 5.0 4.8 4.8 4.8 4.8 4.8 4.7 4.5 4.4 4.3
Net imports 9.6 9.9 10.1 10.4 10.5 10.7 10.8 11.0 11.1 11.3 11.5
Utilization 74.7 76.3 77.9 79.5 80.8 82.0 83.0 83.9 84.7 85.5 86.3
Crush 66.6 68.4 69.9 71.5 72.8 74.0 74.9 76.0 76.8 77.7 78.6
Other utilization 3.0 3.1 3.1 3.2 3.2 3.3 3.4 3.4 3.5 3.5 3.5
Ending Stocks 5.0 4.8 4.8 4.8 4.8 4.8 4.7 4.5 4.4 4.3 4.1
Net Exports 9.5 9.8 10.0 10.2 10.4 10.6 10.7 10.9 11.0 11.1 11.4
Total Demand 84.1 86.1 87.9 89.8 91.2 92.6 93.7 94.8 95.7 96.7 97.6
Rapeseed Meal
Supply 44.1 44.9 46.0 47.1 47.9 48.7 49.6 50.2 50.8 51.4 52.0
Production 38.6 39.6 40.5 41.4 42.2 42.8 43.4 44.0 44.5 45.0 45.5
Beginning stocks 0.8 1.0 1.0 1.0 1.1 1.2 1.3 1.3 1.4 1.4 1.5
Net imports 4.8 4.3 4.4 4.6 4.7 4.7 4.9 4.9 4.9 5.0 5.0
Utilization 39.3 40.5 41.5 42.4 43.2 43.9 44.6 45.3 45.8 46.4 47.0
Consumption 38.3 39.5 40.4 41.3 42.0 42.7 43.3 43.9 44.4 44.9 45.4
Ending Stocks 1.0 1.0 1.0 1.1 1.2 1.3 1.3 1.4 1.4 1.5 1.5
Net Exports 4.9 4.4 4.5 4.7 4.7 4.8 5.0 4.9 5.0 5.0 5.1
Total Demand 44.1 44.9 46.0 47.1 47.9 48.7 49.6 50.2 50.8 51.4 52.0
Rapeseed Oil
Supply 35.6 34.9 35.1 35.5 36.0 36.6 37.1 37.6 38.0 38.5 38.9
Production 27.3 28.0 28.6 29.2 29.7 30.2 30.6 31.0 31.4 31.7 32.1
Beginning stocks 5.5 4.3 3.8 3.6 3.6 3.6 3.7 3.7 3.8 3.9 3.9
Net imports 2.9 2.7 2.7 2.7 2.7 2.7 2.8 2.8 2.9 2.9 2.9
Utilization 32.6 32.1 32.3 32.7 33.2 33.7 34.2 34.6 35.0 35.5 35.9
Consumption 28.4 28.2 28.7 29.1 29.6 30.0 30.4 30.8 31.2 31.6 31.9
Ending Stocks 4.3 3.8 3.6 3.6 3.6 3.7 3.7 3.8 3.9 3.9 4.0
Net Exports 3.0 2.8 2.8 2.8 2.8 2.8 2.9 2.9 3.0 3.0 3.0
Total Demand 35.6 34.9 35.1 35.5 36.0 36.6 37.1 37.6 38.0 38.5 38.9
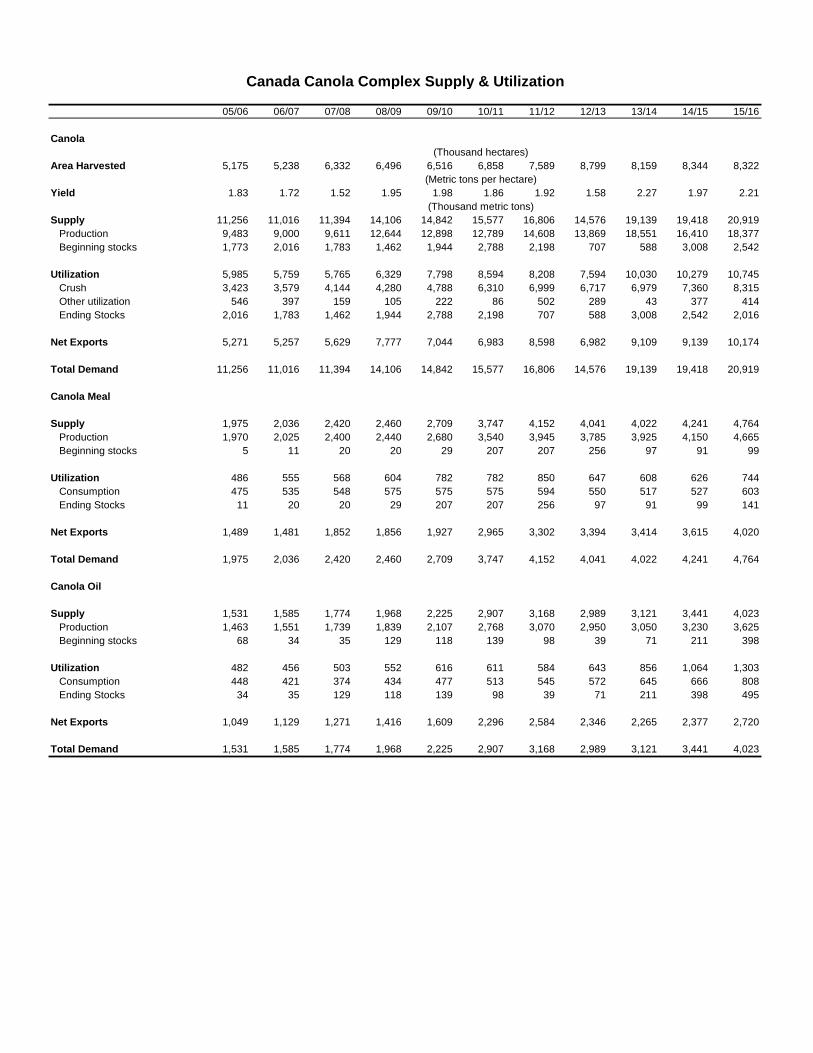
Canada Canola Complex Supply & Utilization Canada Canola Complex Supply & Utilization
05/06 06/07 07/08 08/09 09/10 10/11 11/12 12/13 13/14 14/15 15/16
Canola
(Thousand hectares) (Thousand hectares)
Area Harvested 5,175 5,238 6,332 6,496 6,516 6,858 7,589 8,799 8,159 8,344 8,322
(Metric tons per hectare) (Metric tons per hectare)
Yield 1.83 1.72 1.52 1.95 1.98 1.86 1.92 1.58 2.27 1.97 2.21
(Thousand metric tons) (Thousand metric tons)
Supply 11,256 11,016 11,394 14,106 14,842 15,577 16,806 14,576 19,139 19,418 20,919
Production 9,483 9,000 9,611 12,644 12,898 12,789 14,608 13,869 18,551 16,410 18,377
Beginning stocks 1,773 2,016 1,783 1,462 1,944 2,788 2,198 707 588 3,008 2,542
Utilization 5,985 5,759 5,765 6,329 7,798 8,594 8,208 7,594 10,030 10,279 10,745
Crush 3,423 3,579 4,144 4,280 4,788 6,310 6,999 6,717 6,979 7,360 8,315
Other utilization 546 397 159 105 222 86 502 289 43 377 414
Ending Stocks 2,016 1,783 1,462 1,944 2,788 2,198 707 588 3,008 2,542 2,016
Net Exports 5,271 5,257 5,629 7,777 7,044 6,983 8,598 6,982 9,109 9,139 10,174
Total Demand 11,256 11,016 11,394 14,106 14,842 15,577 16,806 14,576 19,139 19,418 20,919
Canola Meal
Supply 1,975 2,036 2,420 2,460 2,709 3,747 4,152 4,041 4,022 4,241 4,764
Production 1,970 2,025 2,400 2,440 2,680 3,540 3,945 3,785 3,925 4,150 4,665
Beginning stocks 5 11 20 20 29 207 207 256 97 91 99
Utilization 486 555 568 604 782 782 850 647 608 626 744
Consumption 475 535 548 575 575 575 594 550 517 527 603
Ending Stocks 11 20 20 29 207 207 256 97 91 99 141
Net Exports 1,489 1,481 1,852 1,856 1,927 2,965 3,302 3,394 3,414 3,615 4,020
Total Demand 1,975 2,036 2,420 2,460 2,709 3,747 4,152 4,041 4,022 4,241 4,764
Canola Oil
Supply 1,531 1,585 1,774 1,968 2,225 2,907 3,168 2,989 3,121 3,441 4,023
Production 1,463 1,551 1,739 1,839 2,107 2,768 3,070 2,950 3,050 3,230 3,625
Beginning stocks 68 34 35 129 118 139 98 39 71 211 398
Utilization 482 456 503 552 616 611 584 643 856 1,064 1,303
Consumption 448 421 374 434 477 513 545 572 645 666 808
Ending Stocks 34 35 129 118 139 98 39 71 211 398 495
Net Exports 1,049 1,129 1,271 1,416 1,609 2,296 2,584 2,346 2,265 2,377 2,720
Total Demand 1,531 1,585 1,774 1,968 2,225 2,907 3,168 2,989 3,121 3,441 4,023
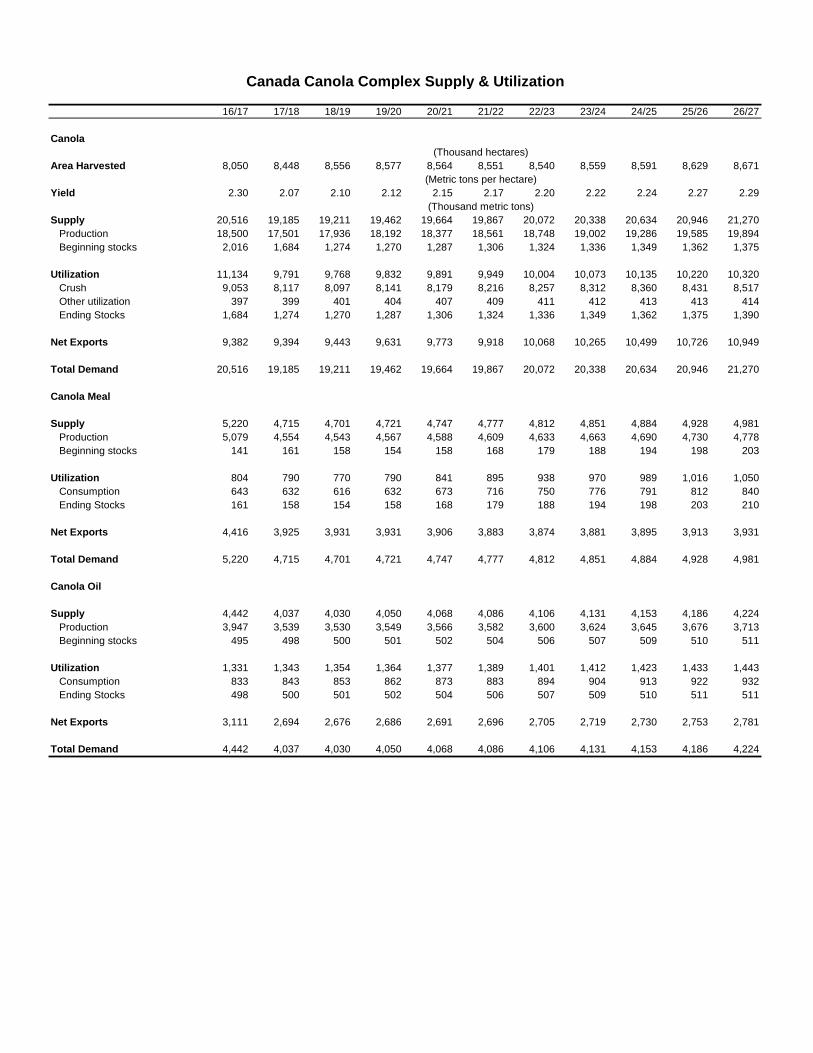
Canada Canola Complex Supply & Utilization
16/17 17/18 18/19 19/20 20/21 21/22 22/23 23/24 24/25 25/26 26/27
Canola
(Thousand hectares)
Area Harvested 8,050 8,448 8,556 8,577 8,564 8,551 8,540 8,559 8,591 8,629 8,671
(Metric tons per hectare)
Yield 2.30 2.07 2.10 2.12 2.15 2.17 2.20 2.22 2.24 2.27 2.29
(Thousand metric tons)
Supply 20,516 19,185 19,211 19,462 19,664 19,867 20,072 20,338 20,634 20,946 21,270
Production 18,500 17,501 17,936 18,192 18,377 18,561 18,748 19,002 19,286 19,585 19,894
Beginning stocks 2,016 1,684 1,274 1,270 1,287 1,306 1,324 1,336 1,349 1,362 1,375
Utilization 11,134 9,791 9,768 9,832 9,891 9,949 10,004 10,073 10,135 10,220 10,320
Crush 9,053 8,117 8,097 8,141 8,179 8,216 8,257 8,312 8,360 8,431 8,517
Other utilization 397 399 401 404 407 409 411 412 413 413 414
Ending Stocks 1,684 1,274 1,270 1,287 1,306 1,324 1,336 1,349 1,362 1,375 1,390
Net Exports 9,382 9,394 9,443 9,631 9,773 9,918 10,068 10,265 10,499 10,726 10,949
Total Demand 20,516 19,185 19,211 19,462 19,664 19,867 20,072 20,338 20,634 20,946 21,270
Canola Meal
Supply 5,220 4,715 4,701 4,721 4,747 4,777 4,812 4,851 4,884 4,928 4,981
Production 5,079 4,554 4,543 4,567 4,588 4,609 4,633 4,663 4,690 4,730 4,778
Beginning stocks 141 161 158 154 158 168 179 188 194 198 203
Utilization 804 790 770 790 841 895 938 970 989 1,016 1,050
Consumption 643 632 616 632 673 716 750 776 791 812 840
Ending Stocks 161 158 154 158 168 179 188 194 198 203 210
Net Exports 4,416 3,925 3,931 3,931 3,906 3,883 3,874 3,881 3,895 3,913 3,931
Total Demand 5,220 4,715 4,701 4,721 4,747 4,777 4,812 4,851 4,884 4,928 4,981
Canola Oil
Supply 4,442 4,037 4,030 4,050 4,068 4,086 4,106 4,131 4,153 4,186 4,224
Production 3,947 3,539 3,530 3,549 3,566 3,582 3,600 3,624 3,645 3,676 3,713
Beginning stocks 495 498 500 501 502 504 506 507 509 510 511
Utilization 1,331 1,343 1,354 1,364 1,377 1,389 1,401 1,412 1,423 1,433 1,443
Consumption 833 843 853 862 873 883 894 904 913 922 932
Ending Stocks 498 500 501 502 504 506 507 509 510 511 511
Net Exports 3,111 2,694 2,676 2,686 2,691 2,696 2,705 2,719 2,730 2,753 2,781
Total Demand 4,442 4,037 4,030 4,050 4,068 4,086 4,106 4,131 4,153 4,186 4,224
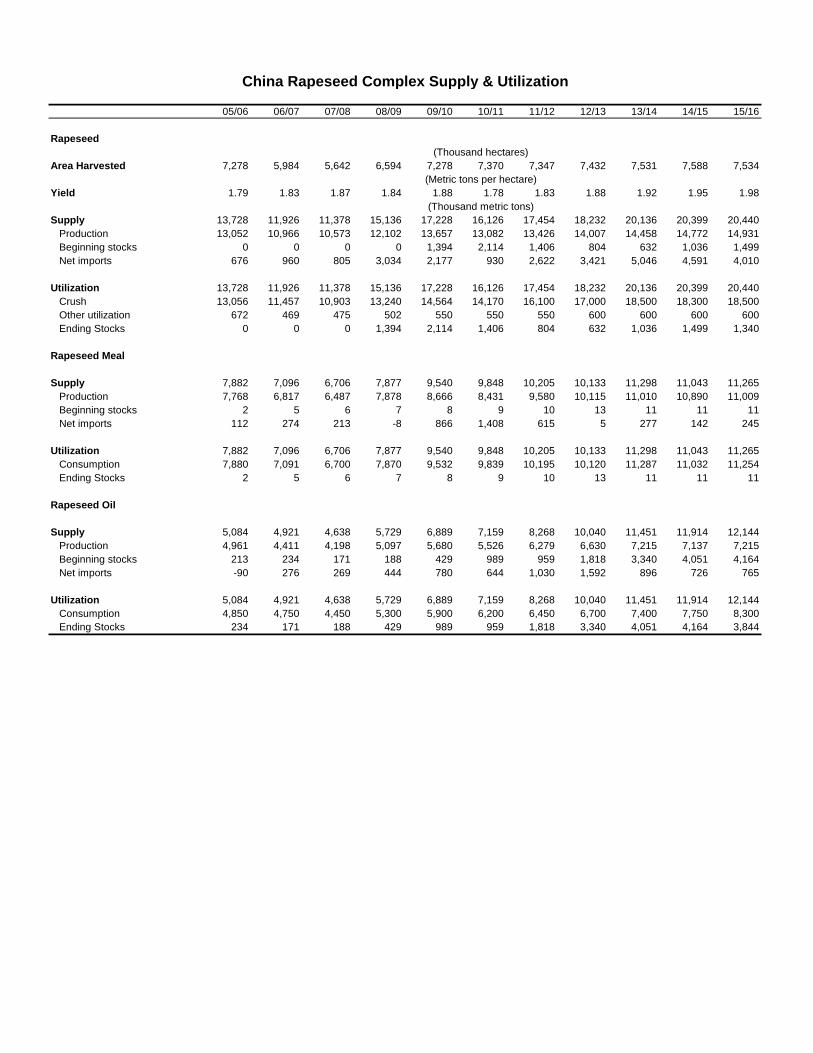
China Rapeseed Complex Supply & Utilization China Rapeseed Complex Supply & Utilization
05/06 06/07 07/08 08/09 09/10 10/11 11/12 12/13 13/14 14/15 15/16
Rapeseed
(Thousand hectares) (Thousand hectares)
Area Harvested 7,278 5,984 5,642 6,594 7,278 7,370 7,347 7,432 7,531 7,588 7,534
(Metric tons per hectare) (Metric tons per hectare)
Yield 1.79 1.83 1.87 1.84 1.88 1.78 1.83 1.88 1.92 1.95 1.98
(Thousand metric tons) (Thousand metric tons)
Supply 13,728 11,926 11,378 15,136 17,228 16,126 17,454 18,232 20,136 20,399 20,440
Production 13,052 10,966 10,573 12,102 13,657 13,082 13,426 14,007 14,458 14,772 14,931
Beginning stocks 0 0 0 0 1,394 2,114 1,406 804 632 1,036 1,499
Net imports 676 960 805 3,034 2,177 930 2,622 3,421 5,046 4,591 4,010
Utilization 13,728 11,926 11,378 15,136 17,228 16,126 17,454 18,232 20,136 20,399 20,440
Crush 13,056 11,457 10,903 13,240 14,564 14,170 16,100 17,000 18,500 18,300 18,500
Other utilization 672 469 475 502 550 550 550 600 600 600 600
Ending Stocks 0 0 0 1,394 2,114 1,406 804 632 1,036 1,499 1,340
Rapeseed Meal
Supply 7,882 7,096 6,706 7,877 9,540 9,848 10,205 10,133 11,298 11,043 11,265
Production 7,768 6,817 6,487 7,878 8,666 8,431 9,580 10,115 11,010 10,890 11,009
Beginning stocks 2 5 6 7 8 9 10 13 11 11 11
Net imports 112 274 213 -8 866 1,408 615 5 277 142 245
Utilization 7,882 7,096 6,706 7,877 9,540 9,848 10,205 10,133 11,298 11,043 11,265
Consumption 7,880 7,091 6,700 7,870 9,532 9,839 10,195 10,120 11,287 11,032 11,254
Ending Stocks 2 5 6 7 8 9 10 13 11 11 11
Rapeseed Oil
Supply 5,084 4,921 4,638 5,729 6,889 7,159 8,268 10,040 11,451 11,914 12,144
Production 4,961 4,411 4,198 5,097 5,680 5,526 6,279 6,630 7,215 7,137 7,215
Beginning stocks 213 234 171 188 429 989 959 1,818 3,340 4,051 4,164
Net imports -90 276 269 444 780 644 1,030 1,592 896 726 765
Utilization 5,084 4,921 4,638 5,729 6,889 7,159 8,268 10,040 11,451 11,914 12,144
Consumption 4,850 4,750 4,450 5,300 5,900 6,200 6,450 6,700 7,400 7,750 8,300
Ending Stocks 234 171 188 429 989 959 1,818 3,340 4,051 4,164 3,844
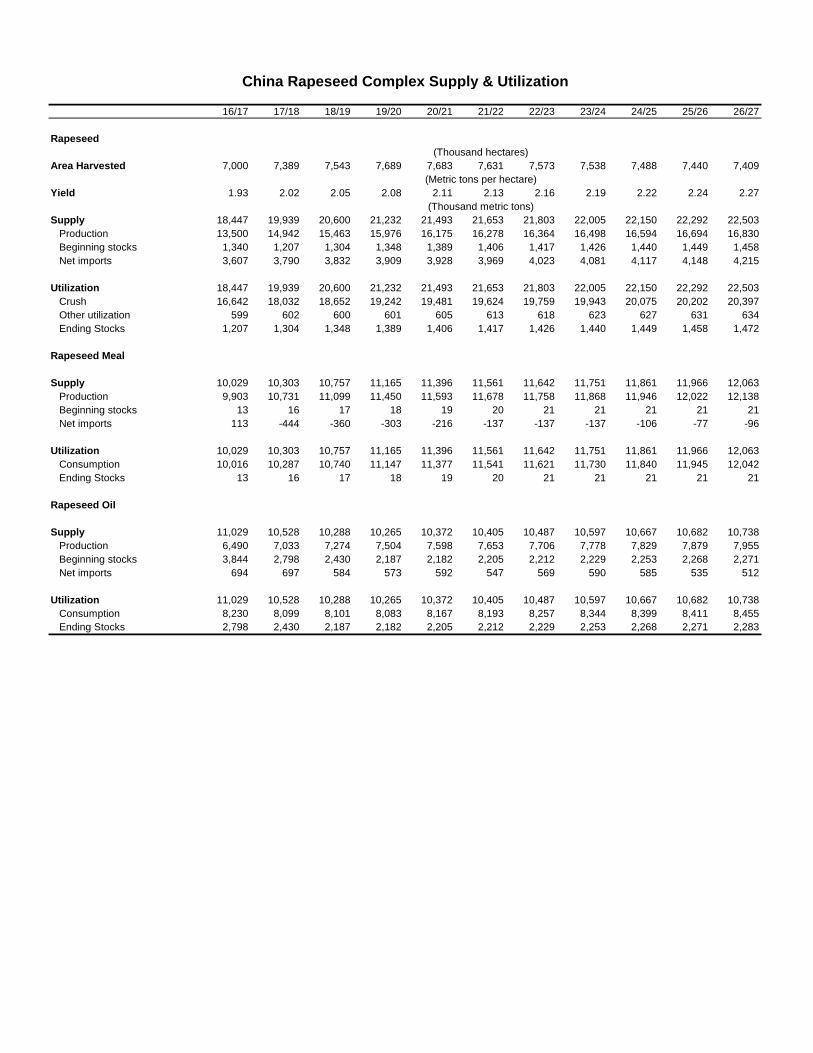
China Rapeseed Complex Supply & Utilization
16/17 17/18 18/19 19/20 20/21 21/22 22/23 23/24 24/25 25/26 26/27
Rapeseed
(Thousand hectares)
Area Harvested 7,000 7,389 7,543 7,689 7,683 7,631 7,573 7,538 7,488 7,440 7,409
(Metric tons per hectare)
Yield 1.93 2.02 2.05 2.08 2.11 2.13 2.16 2.19 2.22 2.24 2.27
(Thousand metric tons)
Supply 18,447 19,939 20,600 21,232 21,493 21,653 21,803 22,005 22,150 22,292 22,503
Production 13,500 14,942 15,463 15,976 16,175 16,278 16,364 16,498 16,594 16,694 16,830
Beginning stocks 1,340 1,207 1,304 1,348 1,389 1,406 1,417 1,426 1,440 1,449 1,458
Net imports 3,607 3,790 3,832 3,909 3,928 3,969 4,023 4,081 4,117 4,148 4,215
Utilization 18,447 19,939 20,600 21,232 21,493 21,653 21,803 22,005 22,150 22,292 22,503
Crush 16,642 18,032 18,652 19,242 19,481 19,624 19,759 19,943 20,075 20,202 20,397
Other utilization 599 602 600 601 605 613 618 623 627 631 634
Ending Stocks 1,207 1,304 1,348 1,389 1,406 1,417 1,426 1,440 1,449 1,458 1,472
Rapeseed Meal
Supply 10,029 10,303 10,757 11,165 11,396 11,561 11,642 11,751 11,861 11,966 12,063
Production 9,903 10,731 11,099 11,450 11,593 11,678 11,758 11,868 11,946 12,022 12,138
Beginning stocks 13 16 17 18 19 20 21 21 21 21 21
Net imports 113 -444 -360 -303 -216 -137 -137 -137 -106 -77 -96
Utilization 10,029 10,303 10,757 11,165 11,396 11,561 11,642 11,751 11,861 11,966 12,063
Consumption 10,016 10,287 10,740 11,147 11,377 11,541 11,621 11,730 11,840 11,945 12,042
Ending Stocks 13 16 17 18 19 20 21 21 21 21 21
Rapeseed Oil
Supply 11,029 10,528 10,288 10,265 10,372 10,405 10,487 10,597 10,667 10,682 10,738
Production 6,490 7,033 7,274 7,504 7,598 7,653 7,706 7,778 7,829 7,879 7,955
Beginning stocks 3,844 2,798 2,430 2,187 2,182 2,205 2,212 2,229 2,253 2,268 2,271
Net imports 694 697 584 573 592 547 569 590 585 535 512
Utilization 11,029 10,528 10,288 10,265 10,372 10,405 10,487 10,597 10,667 10,682 10,738
Consumption 8,230 8,099 8,101 8,083 8,167 8,193 8,257 8,344 8,399 8,411 8,455
Ending Stocks 2,798 2,430 2,187 2,182 2,205 2,212 2,229 2,253 2,268 2,271 2,283
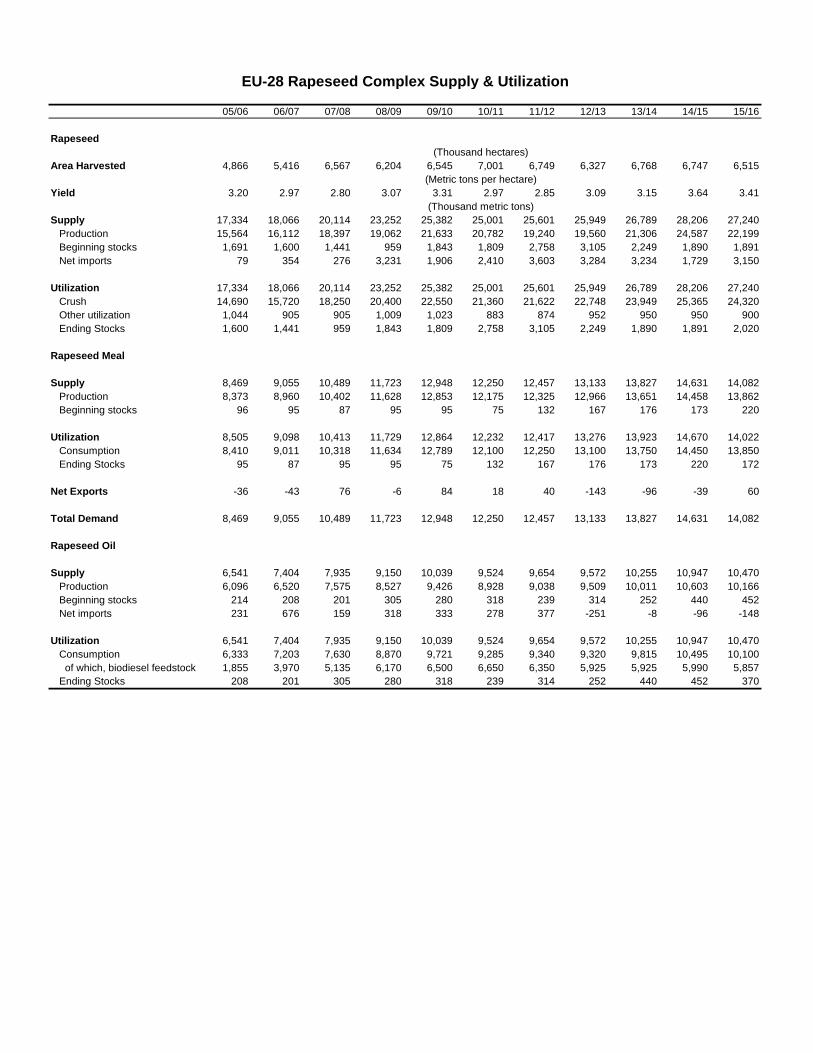
EU-28 Rapeseed Complex Supply & Utilization EU-28 Rapeseed Complex Supply & Utilization
05/06 06/07 07/08 08/09 09/10 10/11 11/12 12/13 13/14 14/15 15/16
Rapeseed
(Thousand hectares) (Thousand hectares)
Area Harvested 4,866 5,416 6,567 6,204 6,545 7,001 6,749 6,327 6,768 6,747 6,515
(Metric tons per hectare) (Metric tons per hectare)
Yield 3.20 2.97 2.80 3.07 3.31 2.97 2.85 3.09 3.15 3.64 3.41
(Thousand metric tons) (Thousand metric tons)
Supply 17,334 18,066 20,114 23,252 25,382 25,001 25,601 25,949 26,789 28,206 27,240
Production 15,564 16,112 18,397 19,062 21,633 20,782 19,240 19,560 21,306 24,587 22,199
Beginning stocks 1,691 1,600 1,441 959 1,843 1,809 2,758 3,105 2,249 1,890 1,891
Net imports 79 354 276 3,231 1,906 2,410 3,603 3,284 3,234 1,729 3,150
Utilization 17,334 18,066 20,114 23,252 25,382 25,001 25,601 25,949 26,789 28,206 27,240
Crush 14,690 15,720 18,250 20,400 22,550 21,360 21,622 22,748 23,949 25,365 24,320
Other utilization 1,044 905 905 1,009 1,023 883 874 952 950 950 900
Ending Stocks 1,600 1,441 959 1,843 1,809 2,758 3,105 2,249 1,890 1,891 2,020
Rapeseed Meal
Supply 8,469 9,055 10,489 11,723 12,948 12,250 12,457 13,133 13,827 14,631 14,082
Production 8,373 8,960 10,402 11,628 12,853 12,175 12,325 12,966 13,651 14,458 13,862
Beginning stocks 96 95 87 95 95 75 132 167 176 173 220
Utilization 8,505 9,098 10,413 11,729 12,864 12,232 12,417 13,276 13,923 14,670 14,022
Consumption 8,410 9,011 10,318 11,634 12,789 12,100 12,250 13,100 13,750 14,450 13,850
Ending Stocks 95 87 95 95 75 132 167 176 173 220 172
Net Exports -36 -43 76 -6 84 18 40 -143 -96 -39 60
Total Demand 8,469 9,055 10,489 11,723 12,948 12,250 12,457 13,133 13,827 14,631 14,082
Rapeseed Oil
Supply 6,541 7,404 7,935 9,150 10,039 9,524 9,654 9,572 10,255 10,947 10,470
Production 6,096 6,520 7,575 8,527 9,426 8,928 9,038 9,509 10,011 10,603 10,166
Beginning stocks 214 208 201 305 280 318 239 314 252 440 452
Net imports 231 676 159 318 333 278 377 -251 -8 -96 -148
Utilization 6,541 7,404 7,935 9,150 10,039 9,524 9,654 9,572 10,255 10,947 10,470
Consumption 6,333 7,203 7,630 8,870 9,721 9,285 9,340 9,320 9,815 10,495 10,100
of which, biodiesel feedstock 1,855 3,970 5,135 6,170 6,500 6,650 6,350 5,925 5,925 5,990 5,857
Ending Stocks 208 201 305 280 318 239 314 252 440 452 370
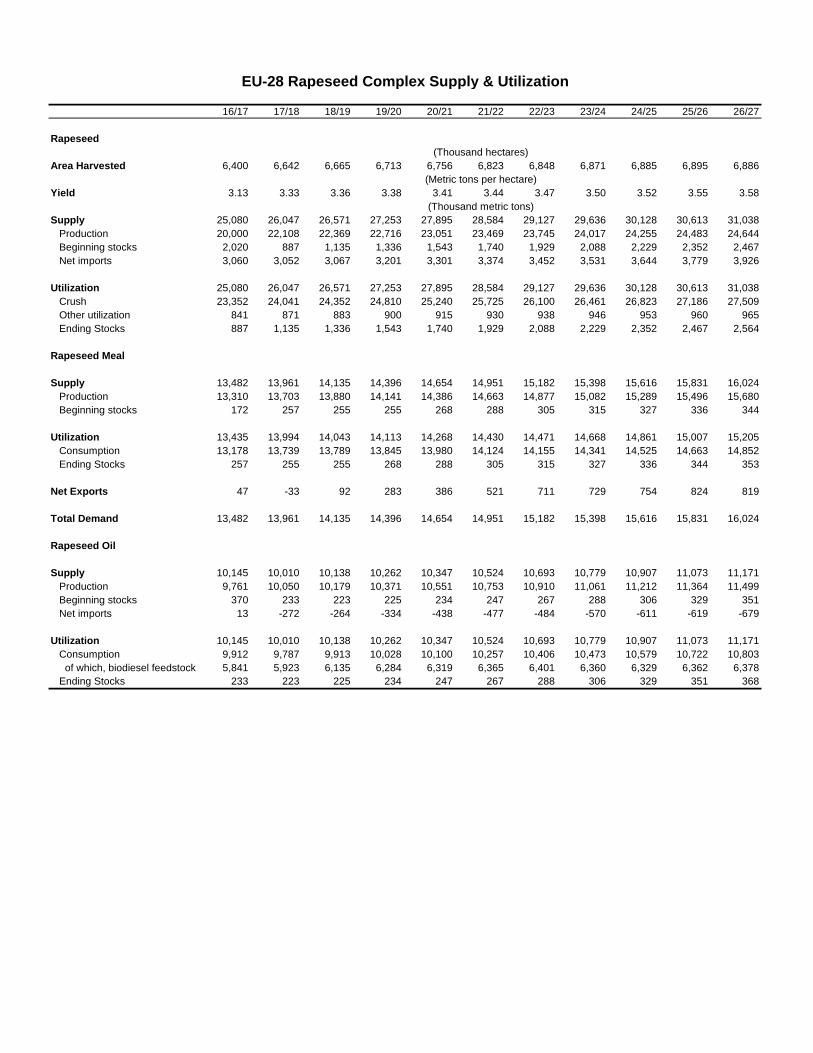
EU-28 Rapeseed Complex Supply & Utilization
16/17 17/18 18/19 19/20 20/21 21/22 22/23 23/24 24/25 25/26 26/27
Rapeseed
(Thousand hectares)
Area Harvested 6,400 6,642 6,665 6,713 6,756 6,823 6,848 6,871 6,885 6,895 6,886
(Metric tons per hectare)
Yield 3.13 3.33 3.36 3.38 3.41 3.44 3.47 3.50 3.52 3.55 3.58
(Thousand metric tons)
Supply 25,080 26,047 26,571 27,253 27,895 28,584 29,127 29,636 30,128 30,613 31,038
Production 20,000 22,108 22,369 22,716 23,051 23,469 23,745 24,017 24,255 24,483 24,644
Beginning stocks 2,020 887 1,135 1,336 1,543 1,740 1,929 2,088 2,229 2,352 2,467
Net imports 3,060 3,052 3,067 3,201 3,301 3,374 3,452 3,531 3,644 3,779 3,926
Utilization 25,080 26,047 26,571 27,253 27,895 28,584 29,127 29,636 30,128 30,613 31,038
Crush 23,352 24,041 24,352 24,810 25,240 25,725 26,100 26,461 26,823 27,186 27,509
Other utilization 841 871 883 900 915 930 938 946 953 960 965
Ending Stocks 887 1,135 1,336 1,543 1,740 1,929 2,088 2,229 2,352 2,467 2,564
Rapeseed Meal
Supply 13,482 13,961 14,135 14,396 14,654 14,951 15,182 15,398 15,616 15,831 16,024
Production 13,310 13,703 13,880 14,141 14,386 14,663 14,877 15,082 15,289 15,496 15,680
Beginning stocks 172 257 255 255 268 288 305 315 327 336 344
Utilization 13,435 13,994 14,043 14,113 14,268 14,430 14,471 14,668 14,861 15,007 15,205
Consumption 13,178 13,739 13,789 13,845 13,980 14,124 14,155 14,341 14,525 14,663 14,852
Ending Stocks 257 255 255 268 288 305 315 327 336 344 353
Net Exports 47 -33 92 283 386 521 711 729 754 824 819
Total Demand 13,482 13,961 14,135 14,396 14,654 14,951 15,182 15,398 15,616 15,831 16,024
Rapeseed Oil
Supply 10,145 10,010 10,138 10,262 10,347 10,524 10,693 10,779 10,907 11,073 11,171
Production 9,761 10,050 10,179 10,371 10,551 10,753 10,910 11,061 11,212 11,364 11,499
Beginning stocks 370 233 223 225 234 247 267 288 306 329 351
Net imports 13 -272 -264 -334 -438 -477 -484 -570 -611 -619 -679
Utilization 10,145 10,010 10,138 10,262 10,347 10,524 10,693 10,779 10,907 11,073 11,171
Consumption 9,912 9,787 9,913 10,028 10,100 10,257 10,406 10,473 10,579 10,722 10,803
of which, biodiesel feedstock 5,841 5,923 6,135 6,284 6,319 6,365 6,401 6,360 6,329 6,362 6,378
Ending Stocks 233 223 225 234 247 267 288 306 329 351 368
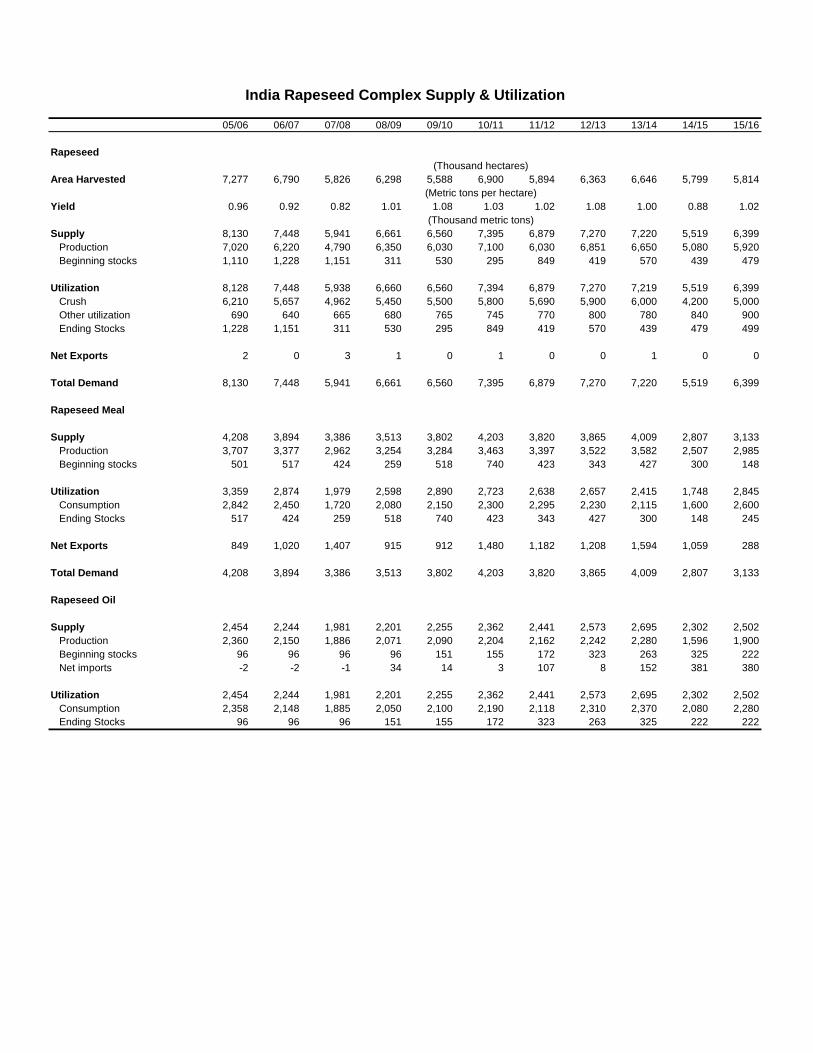
India Rapeseed Complex Supply & Utilization India Rapeseed Complex Supply & Utilization
05/06 06/07 07/08 08/09 09/10 10/11 11/12 12/13 13/14 14/15 15/16
Rapeseed
(Thousand hectares) (Thousand hectares)
Area Harvested 7,277 6,790 5,826 6,298 5,588 6,900 5,894 6,363 6,646 5,799 5,814
(Metric tons per hectare) (Metric tons per hectare)
Yield 0.96 0.92 0.82 1.01 1.08 1.03 1.02 1.08 1.00 0.88 1.02
(Thousand metric tons) (Thousand metric tons)
Supply 8,130 7,448 5,941 6,661 6,560 7,395 6,879 7,270 7,220 5,519 6,399
Production 7,020 6,220 4,790 6,350 6,030 7,100 6,030 6,851 6,650 5,080 5,920
Beginning stocks 1,110 1,228 1,151 311 530 295 849 419 570 439 479
Utilization 8,128 7,448 5,938 6,660 6,560 7,394 6,879 7,270 7,219 5,519 6,399
Crush 6,210 5,657 4,962 5,450 5,500 5,800 5,690 5,900 6,000 4,200 5,000
Other utilization 690 640 665 680 765 745 770 800 780 840 900
Ending Stocks 1,228 1,151 311 530 295 849 419 570 439 479 499
Net Exports 2 0 3 1 0 1 0 0 1 0 0
Total Demand 8,130 7,448 5,941 6,661 6,560 7,395 6,879 7,270 7,220 5,519 6,399
Rapeseed Meal
Supply 4,208 3,894 3,386 3,513 3,802 4,203 3,820 3,865 4,009 2,807 3,133
Production 3,707 3,377 2,962 3,254 3,284 3,463 3,397 3,522 3,582 2,507 2,985
Beginning stocks 501 517 424 259 518 740 423 343 427 300 148
Utilization 3,359 2,874 1,979 2,598 2,890 2,723 2,638 2,657 2,415 1,748 2,845
Consumption 2,842 2,450 1,720 2,080 2,150 2,300 2,295 2,230 2,115 1,600 2,600
Ending Stocks 517 424 259 518 740 423 343 427 300 148 245
Net Exports 849 1,020 1,407 915 912 1,480 1,182 1,208 1,594 1,059 288
Total Demand 4,208 3,894 3,386 3,513 3,802 4,203 3,820 3,865 4,009 2,807 3,133
Rapeseed Oil
Supply 2,454 2,244 1,981 2,201 2,255 2,362 2,441 2,573 2,695 2,302 2,502
Production 2,360 2,150 1,886 2,071 2,090 2,204 2,162 2,242 2,280 1,596 1,900
Beginning stocks 96 96 96 96 151 155 172 323 263 325 222
Net imports -2 -2 -1 34 14 3 107 8 152 381 380
Utilization 2,454 2,244 1,981 2,201 2,255 2,362 2,441 2,573 2,695 2,302 2,502
Consumption 2,358 2,148 1,885 2,050 2,100 2,190 2,118 2,310 2,370 2,080 2,280
Ending Stocks 96 96 96 151 155 172 323 263 325 222 222
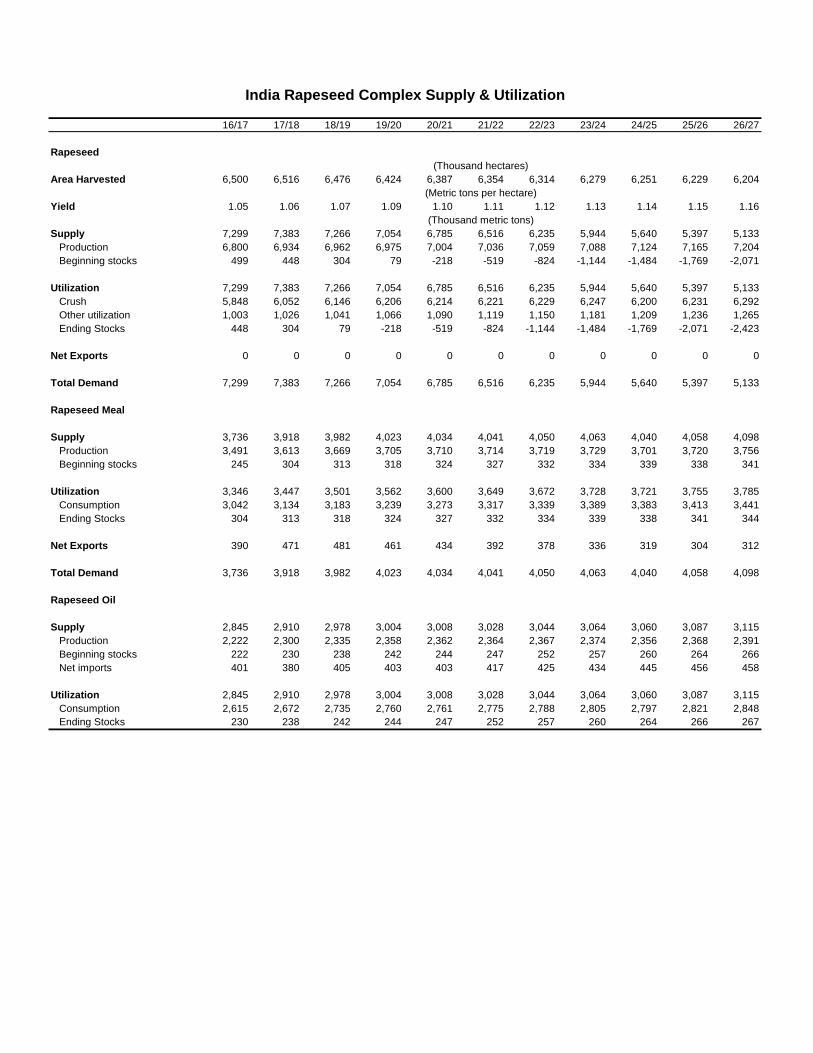
India Rapeseed Complex Supply & Utilization
16/17 17/18 18/19 19/20 20/21 21/22 22/23 23/24 24/25 25/26 26/27
Rapeseed
(Thousand hectares)
Area Harvested 6,500 6,516 6,476 6,424 6,387 6,354 6,314 6,279 6,251 6,229 6,204
(Metric tons per hectare)
Yield 1.05 1.06 1.07 1.09 1.10 1.11 1.12 1.13 1.14 1.15 1.16
(Thousand metric tons)
Supply 7,299 7,383 7,266 7,054 6,785 6,516 6,235 5,944 5,640 5,397 5,133
Production 6,800 6,934 6,962 6,975 7,004 7,036 7,059 7,088 7,124 7,165 7,204
Beginning stocks 499 448 304 79 -218 -519 -824 -1,144 -1,484 -1,769 -2,071
Utilization 7,299 7,383 7,266 7,054 6,785 6,516 6,235 5,944 5,640 5,397 5,133
Crush 5,848 6,052 6,146 6,206 6,214 6,221 6,229 6,247 6,200 6,231 6,292
Other utilization 1,003 1,026 1,041 1,066 1,090 1,119 1,150 1,181 1,209 1,236 1,265
Ending Stocks 448 304 79 -218 -519 -824 -1,144 -1,484 -1,769 -2,071 -2,423
Net Exports 0 0 0 0 0 0 0 0 0 0 0
Total Demand 7,299 7,383 7,266 7,054 6,785 6,516 6,235 5,944 5,640 5,397 5,133
Rapeseed Meal
Supply 3,736 3,918 3,982 4,023 4,034 4,041 4,050 4,063 4,040 4,058 4,098
Production 3,491 3,613 3,669 3,705 3,710 3,714 3,719 3,729 3,701 3,720 3,756
Beginning stocks 245 304 313 318 324 327 332 334 339 338 341
Utilization 3,346 3,447 3,501 3,562 3,600 3,649 3,672 3,728 3,721 3,755 3,785
Consumption 3,042 3,134 3,183 3,239 3,273 3,317 3,339 3,389 3,383 3,413 3,441
Ending Stocks 304 313 318 324 327 332 334 339 338 341 344
Net Exports 390 471 481 461 434 392 378 336 319 304 312
Total Demand 3,736 3,918 3,982 4,023 4,034 4,041 4,050 4,063 4,040 4,058 4,098
Rapeseed Oil
Supply 2,845 2,910 2,978 3,004 3,008 3,028 3,044 3,064 3,060 3,087 3,115
Production 2,222 2,300 2,335 2,358 2,362 2,364 2,367 2,374 2,356 2,368 2,391
Beginning stocks 222 230 238 242 244 247 252 257 260 264 266
Net imports 401 380 405 403 403 417 425 434 445 456 458
Utilization 2,845 2,910 2,978 3,004 3,008 3,028 3,044 3,064 3,060 3,087 3,115
Consumption 2,615 2,672 2,735 2,760 2,761 2,775 2,788 2,805 2,797 2,821 2,848
Ending Stocks 230 238 242 244 247 252 257 260 264 266 267
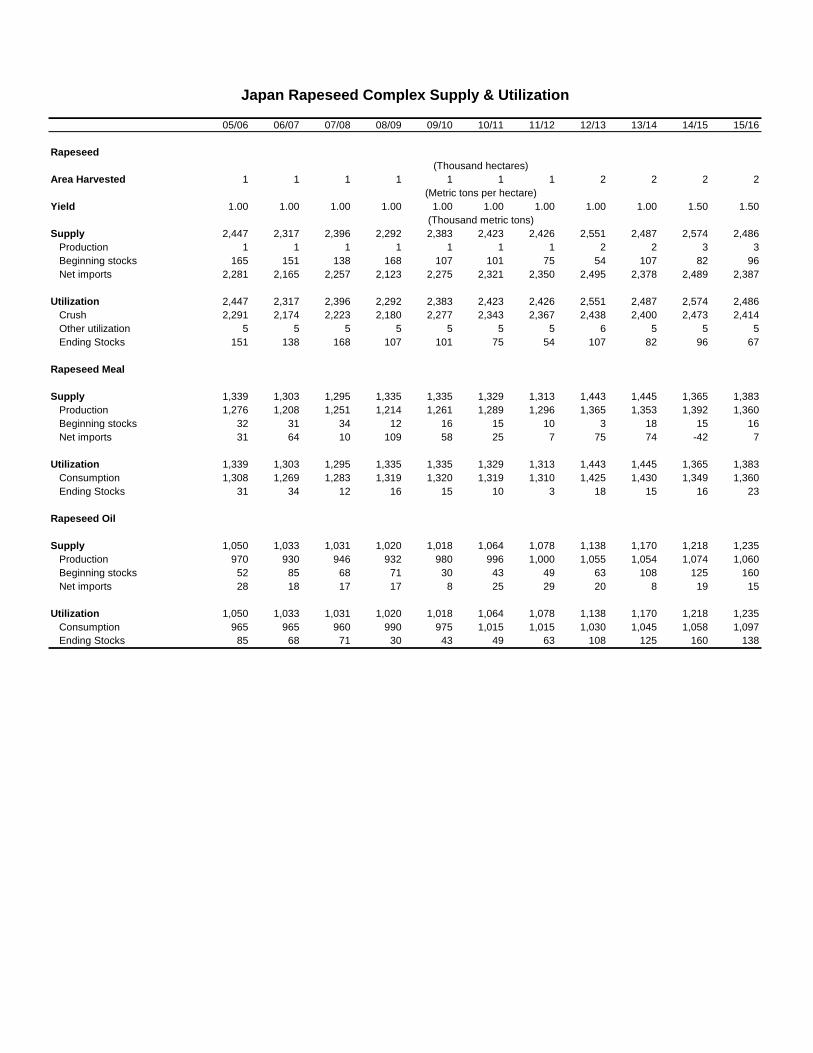
Japan Rapeseed Complex Supply & Utilization Japan Rapeseed Complex Supply & Utilization
05/06 06/07 07/08 08/09 09/10 10/11 11/12 12/13 13/14 14/15 15/16
Rapeseed
(Thousand hectares) (Thousand hectares)
Area Harvested 1 1 1 1 1 1 1 2 2 2 2
(Metric tons per hectare) (Metric tons per hectare)
Yield 1.00 1.00 1.00 1.00 1.00 1.00 1.00 1.00 1.00 1.50 1.50
(Thousand metric tons) (Thousand metric tons)
Supply 2,447 2,317 2,396 2,292 2,383 2,423 2,426 2,551 2,487 2,574 2,486
Production 1 1 1 1 1 1 1 2 2 3 3
Beginning stocks 165 151 138 168 107 101 75 54 107 82 96
Net imports 2,281 2,165 2,257 2,123 2,275 2,321 2,350 2,495 2,378 2,489 2,387
Utilization 2,447 2,317 2,396 2,292 2,383 2,423 2,426 2,551 2,487 2,574 2,486
Crush 2,291 2,174 2,223 2,180 2,277 2,343 2,367 2,438 2,400 2,473 2,414
Other utilization 5 5 5 5 5 5 5 6 5 5 5
Ending Stocks 151 138 168 107 101 75 54 107 82 96 67
Rapeseed Meal
Supply 1,339 1,303 1,295 1,335 1,335 1,329 1,313 1,443 1,445 1,365 1,383
Production 1,276 1,208 1,251 1,214 1,261 1,289 1,296 1,365 1,353 1,392 1,360
Beginning stocks 32 31 34 12 16 15 10 3 18 15 16
Net imports 31 64 10 109 58 25 7 75 74 -42 7
Utilization 1,339 1,303 1,295 1,335 1,335 1,329 1,313 1,443 1,445 1,365 1,383
Consumption 1,308 1,269 1,283 1,319 1,320 1,319 1,310 1,425 1,430 1,349 1,360
Ending Stocks 31 34 12 16 15 10 3 18 15 16 23
Rapeseed Oil
Supply 1,050 1,033 1,031 1,020 1,018 1,064 1,078 1,138 1,170 1,218 1,235
Production 970 930 946 932 980 996 1,000 1,055 1,054 1,074 1,060
Beginning stocks 52 85 68 71 30 43 49 63 108 125 160
Net imports 28 18 17 17 8 25 29 20 8 19 15
Utilization 1,050 1,033 1,031 1,020 1,018 1,064 1,078 1,138 1,170 1,218 1,235
Consumption 965 965 960 990 975 1,015 1,015 1,030 1,045 1,058 1,097
Ending Stocks 85 68 71 30 43 49 63 108 125 160 138
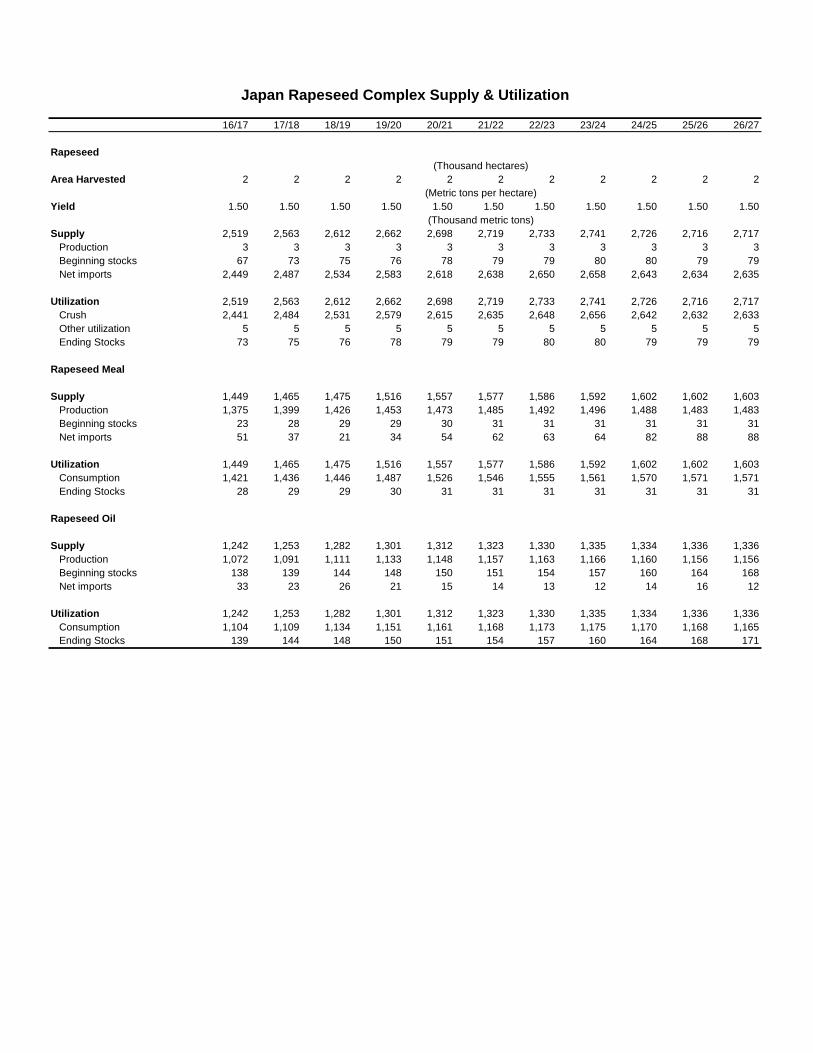
Japan Rapeseed Complex Supply & Utilization
16/17 17/18 18/19 19/20 20/21 21/22 22/23 23/24 24/25 25/26 26/27
Rapeseed
(Thousand hectares)
Area Harvested 2 2 2 2 2 2 2 2 2 2 2
(Metric tons per hectare)
Yield 1.50 1.50 1.50 1.50 1.50 1.50 1.50 1.50 1.50 1.50 1.50
(Thousand metric tons)
Supply 2,519 2,563 2,612 2,662 2,698 2,719 2,733 2,741 2,726 2,716 2,717
Production 3 3 3 3 3 3 3 3 3 3 3
Beginning stocks 67 73 75 76 78 79 79 80 80 79 79
Net imports 2,449 2,487 2,534 2,583 2,618 2,638 2,650 2,658 2,643 2,634 2,635
Utilization 2,519 2,563 2,612 2,662 2,698 2,719 2,733 2,741 2,726 2,716 2,717
Crush 2,441 2,484 2,531 2,579 2,615 2,635 2,648 2,656 2,642 2,632 2,633
Other utilization 5 5 5 5 5 5 5 5 5 5 5
Ending Stocks 73 75 76 78 79 79 80 80 79 79 79
Rapeseed Meal
Supply 1,449 1,465 1,475 1,516 1,557 1,577 1,586 1,592 1,602 1,602 1,603
Production 1,375 1,399 1,426 1,453 1,473 1,485 1,492 1,496 1,488 1,483 1,483
Beginning stocks 23 28 29 29 30 31 31 31 31 31 31
Net imports 51 37 21 34 54 62 63 64 82 88 88
Utilization 1,449 1,465 1,475 1,516 1,557 1,577 1,586 1,592 1,602 1,602 1,603
Consumption 1,421 1,436 1,446 1,487 1,526 1,546 1,555 1,561 1,570 1,571 1,571
Ending Stocks 28 29 29 30 31 31 31 31 31 31 31
Rapeseed Oil
Supply 1,242 1,253 1,282 1,301 1,312 1,323 1,330 1,335 1,334 1,336 1,336
Production 1,072 1,091 1,111 1,133 1,148 1,157 1,163 1,166 1,160 1,156 1,156
Beginning stocks 138 139 144 148 150 151 154 157 160 164 168
Net imports 33 23 26 21 15 14 13 12 14 16 12
Utilization 1,242 1,253 1,282 1,301 1,312 1,323 1,330 1,335 1,334 1,336 1,336
Consumption 1,104 1,109 1,134 1,151 1,161 1,168 1,173 1,175 1,170 1,168 1,165
Ending Stocks 139 144 148 150 151 154 157 160 164 168 171
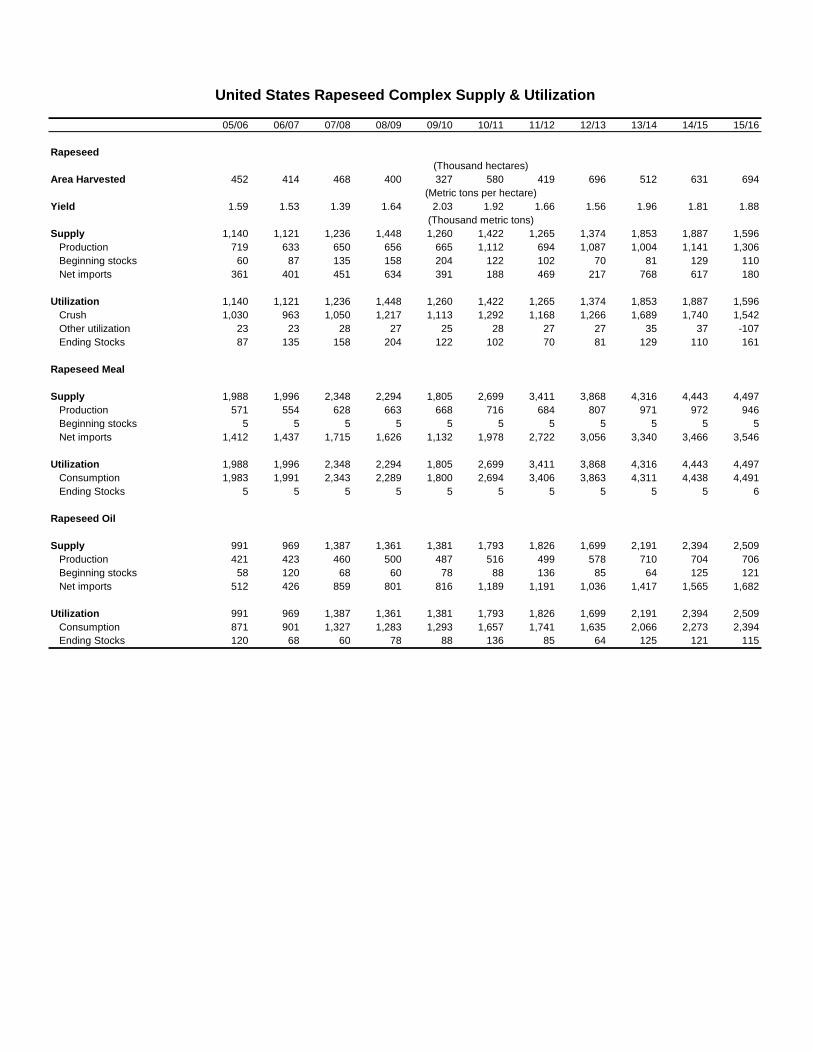
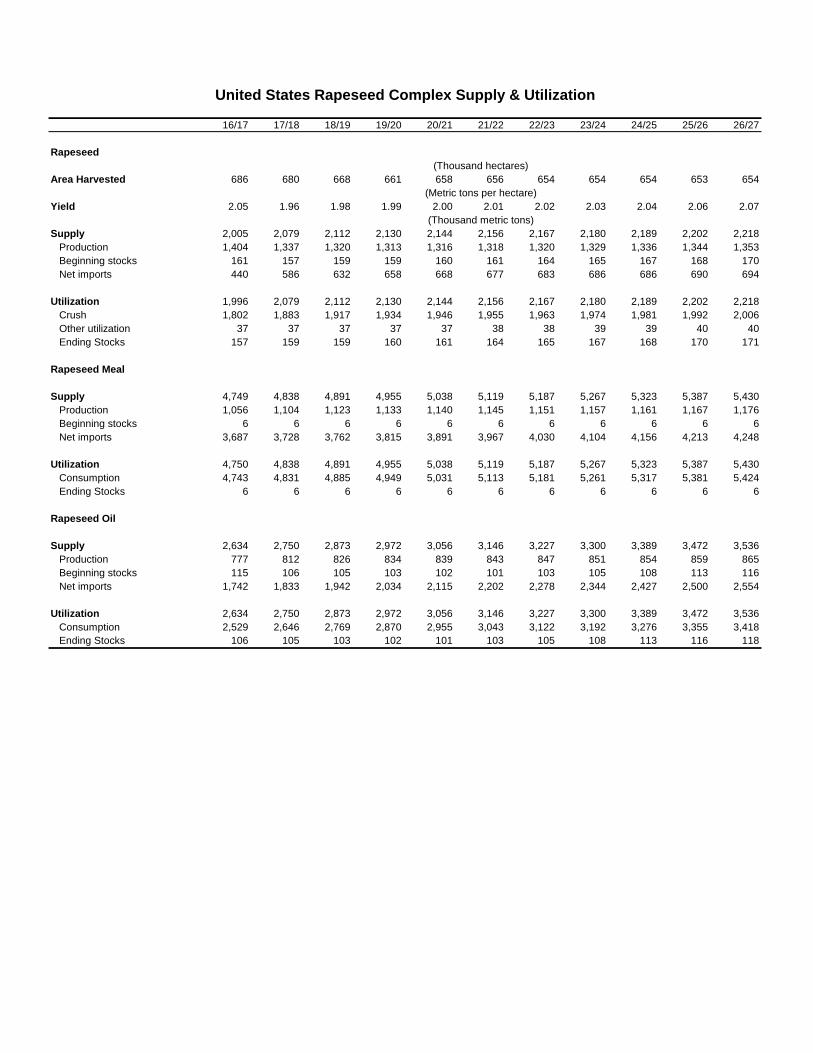
United States Rapeseed Complex Supply & Utilization United States Rapeseed Complex Supply & Utilization
05/06 06/07 07/08 08/09 09/10 10/11 11/12 12/13 13/14 14/15 15/16
Rapeseed
(Thousand hectares) (Thousand hectares)
Area Harvested 452 414 468 400 327 580 419 696 512 631 694
(Metric tons per hectare) (Metric tons per hectare)
Yield 1.59 1.53 1.39 1.64 2.03 1.92 1.66 1.56 1.96 1.81 1.88
(Thousand metric tons) (Thousand metric tons)
Supply 1,140 1,121 1,236 1,448 1,260 1,422 1,265 1,374 1,853 1,887 1,596
Production 719 633 650 656 665 1,112 694 1,087 1,004 1,141 1,306
Beginning stocks 60 87 135 158 204 122 102 70 81 129 110
Net imports 361 401 451 634 391 188 469 217 768 617 180
Utilization 1,140 1,121 1,236 1,448 1,260 1,422 1,265 1,374 1,853 1,887 1,596
Crush 1,030 963 1,050 1,217 1,113 1,292 1,168 1,266 1,689 1,740 1,542
Other utilization 23 23 28 27 25 28 27 27 35 37 -107
Ending Stocks 87 135 158 204 122 102 70 81 129 110 161
Rapeseed Meal
Supply 1,988 1,996 2,348 2,294 1,805 2,699 3,411 3,868 4,316 4,443 4,497
Production 571 554 628 663 668 716 684 807 971 972 946
Beginning stocks 5 5 5 5 5 5 5 5 5 5 5
Net imports 1,412 1,437 1,715 1,626 1,132 1,978 2,722 3,056 3,340 3,466 3,546
Utilization 1,988 1,996 2,348 2,294 1,805 2,699 3,411 3,868 4,316 4,443 4,497
Consumption 1,983 1,991 2,343 2,289 1,800 2,694 3,406 3,863 4,311 4,438 4,491
Ending Stocks 5 5 5 5 5 5 5 5 5 5 6
Rapeseed Oil
Supply 991 969 1,387 1,361 1,381 1,793 1,826 1,699 2,191 2,394 2,509
Production 421 423 460 500 487 516 499 578 710 704 706
Beginning stocks 58 120 68 60 78 88 136 85 64 125 121
Net imports 512 426 859 801 816 1,189 1,191 1,036 1,417 1,565 1,682
Utilization 991 969 1,387 1,361 1,381 1,793 1,826 1,699 2,191 2,394 2,509
Consumption 871 901 1,327 1,283 1,293 1,657 1,741 1,635 2,066 2,273 2,394
Ending Stocks 120 68 60 78 88 136 85 64 125 121 115
United States Rapeseed Complex Supply & Utilization
16/17 17/18 18/19 19/20 20/21 21/22 22/23 23/24 24/25 25/26 26/27
Rapeseed
(Thousand hectares)
Area Harvested 686 680 668 661 658 656 654 654 654 653 654
(Metric tons per hectare)
Yield 2.05 1.96 1.98 1.99 2.00 2.01 2.02 2.03 2.04 2.06 2.07
(Thousand metric tons)
Supply 2,005 2,079 2,112 2,130 2,144 2,156 2,167 2,180 2,189 2,202 2,218
Production 1,404 1,337 1,320 1,313 1,316 1,318 1,320 1,329 1,336 1,344 1,353
Beginning stocks 161 157 159 159 160 161 164 165 167 168 170
Net imports 440 586 632 658 668 677 683 686 686 690 694
Utilization 1,996 2,079 2,112 2,130 2,144 2,156 2,167 2,180 2,189 2,202 2,218
Crush 1,802 1,883 1,917 1,934 1,946 1,955 1,963 1,974 1,981 1,992 2,006
Other utilization 37 37 37 37 37 38 38 39 39 40 40
Ending Stocks 157 159 159 160 161 164 165 167 168 170 171
Rapeseed Meal
Supply 4,749 4,838 4,891 4,955 5,038 5,119 5,187 5,267 5,323 5,387 5,430
Production 1,056 1,104 1,123 1,133 1,140 1,145 1,151 1,157 1,161 1,167 1,176
Beginning stocks 6 6 6 6 6 6 6 6 6 6 6
Net imports 3,687 3,728 3,762 3,815 3,891 3,967 4,030 4,104 4,156 4,213 4,248
Utilization 4,750 4,838 4,891 4,955 5,038 5,119 5,187 5,267 5,323 5,387 5,430
Consumption 4,743 4,831 4,885 4,949 5,031 5,113 5,181 5,261 5,317 5,381 5,424
Ending Stocks 6 6 6 6 6 6 6 6 6 6 6
Rapeseed Oil
Supply 2,634 2,750 2,873 2,972 3,056 3,146 3,227 3,300 3,389 3,472 3,536
Production 777 812 826 834 839 843 847 851 854 859 865
Beginning stocks 115 106 105 103 102 101 103 105 108 113 116
Net imports 1,742 1,833 1,942 2,034 2,115 2,202 2,278 2,344 2,427 2,500 2,554
Utilization 2,634 2,750 2,873 2,972 3,056 3,146 3,227 3,300 3,389 3,472 3,536
Consumption 2,529 2,646 2,769 2,870 2,955 3,043 3,122 3,192 3,276 3,355 3,418
Ending Stocks 106 105 103 102 101 103 105 108 113 116 118
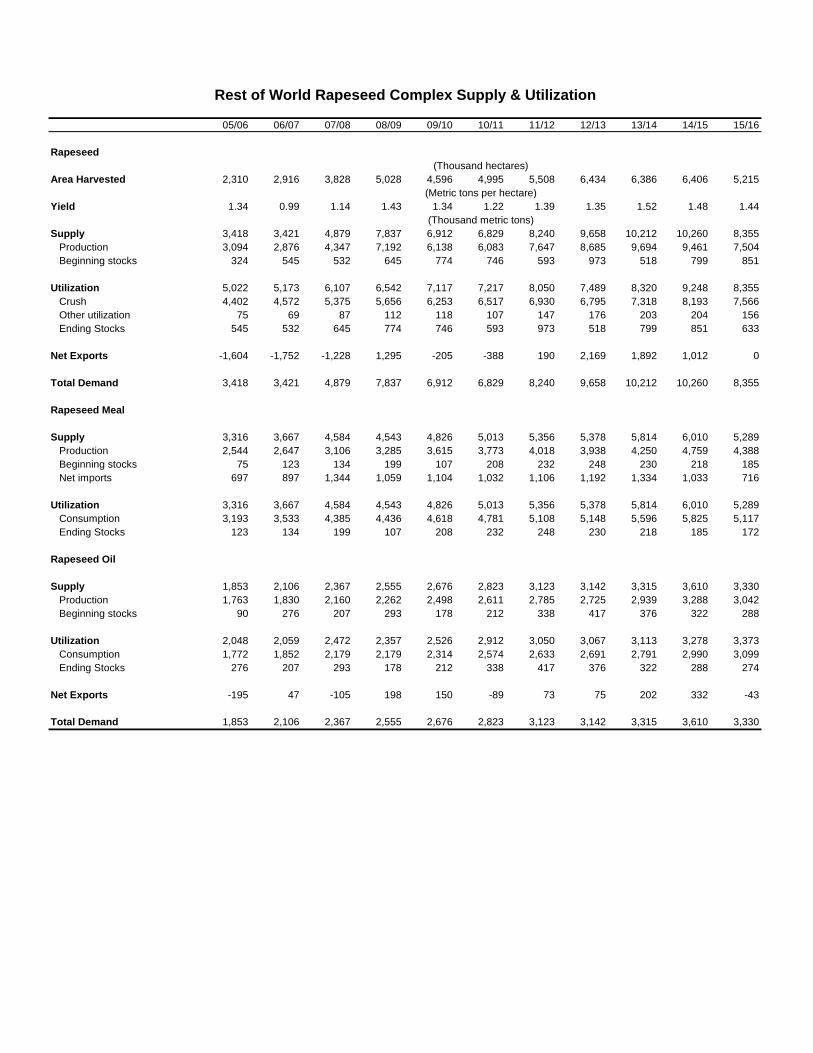
Rest of World Rapeseed Complex Supply & Utilization Rest of World Rapeseed Complex Supply & Utilization
05/06 06/07 07/08 08/09 09/10 10/11 11/12 12/13 13/14 14/15 15/16
Rapeseed
(Thousand hectares) (Thousand hectares)
Area Harvested 2,310 2,916 3,828 5,028 4,596 4,995 5,508 6,434 6,386 6,406 5,215
(Metric tons per hectare) (Metric tons per hectare)
Yield 1.34 0.99 1.14 1.43 1.34 1.22 1.39 1.35 1.52 1.48 1.44
(Thousand metric tons) (Thousand metric tons)
Supply 3,418 3,421 4,879 7,837 6,912 6,829 8,240 9,658 10,212 10,260 8,355
Production 3,094 2,876 4,347 7,192 6,138 6,083 7,647 8,685 9,694 9,461 7,504
Beginning stocks 324 545 532 645 774 746 593 973 518 799 851
Utilization 5,022 5,173 6,107 6,542 7,117 7,217 8,050 7,489 8,320 9,248 8,355
Crush 4,402 4,572 5,375 5,656 6,253 6,517 6,930 6,795 7,318 8,193 7,566
Other utilization 75 69 87 112 118 107 147 176 203 204 156
Ending Stocks 545 532 645 774 746 593 973 518 799 851 633
Net Exports -1,604 -1,752 -1,228 1,295 -205 -388 190 2,169 1,892 1,012 0
Total Demand 3,418 3,421 4,879 7,837 6,912 6,829 8,240 9,658 10,212 10,260 8,355
Rapeseed Meal
Supply 3,316 3,667 4,584 4,543 4,826 5,013 5,356 5,378 5,814 6,010 5,289
Production 2,544 2,647 3,106 3,285 3,615 3,773 4,018 3,938 4,250 4,759 4,388
Beginning stocks 75 123 134 199 107 208 232 248 230 218 185
Net imports 697 897 1,344 1,059 1,104 1,032 1,106 1,192 1,334 1,033 716
Utilization 3,316 3,667 4,584 4,543 4,826 5,013 5,356 5,378 5,814 6,010 5,289
Consumption 3,193 3,533 4,385 4,436 4,618 4,781 5,108 5,148 5,596 5,825 5,117
Ending Stocks 123 134 199 107 208 232 248 230 218 185 172
Rapeseed Oil
Supply 1,853 2,106 2,367 2,555 2,676 2,823 3,123 3,142 3,315 3,610 3,330
Production 1,763 1,830 2,160 2,262 2,498 2,611 2,785 2,725 2,939 3,288 3,042
Beginning stocks 90 276 207 293 178 212 338 417 376 322 288
Utilization 2,048 2,059 2,472 2,357 2,526 2,912 3,050 3,067 3,113 3,278 3,373
Consumption 1,772 1,852 2,179 2,179 2,314 2,574 2,633 2,691 2,791 2,990 3,099
Ending Stocks 276 207 293 178 212 338 417 376 322 288 274
Net Exports -195 47 -105 198 150 -89 73 75 202 332 -43
Total Demand 1,853 2,106 2,367 2,555 2,676 2,823 3,123 3,142 3,315 3,610 3,330
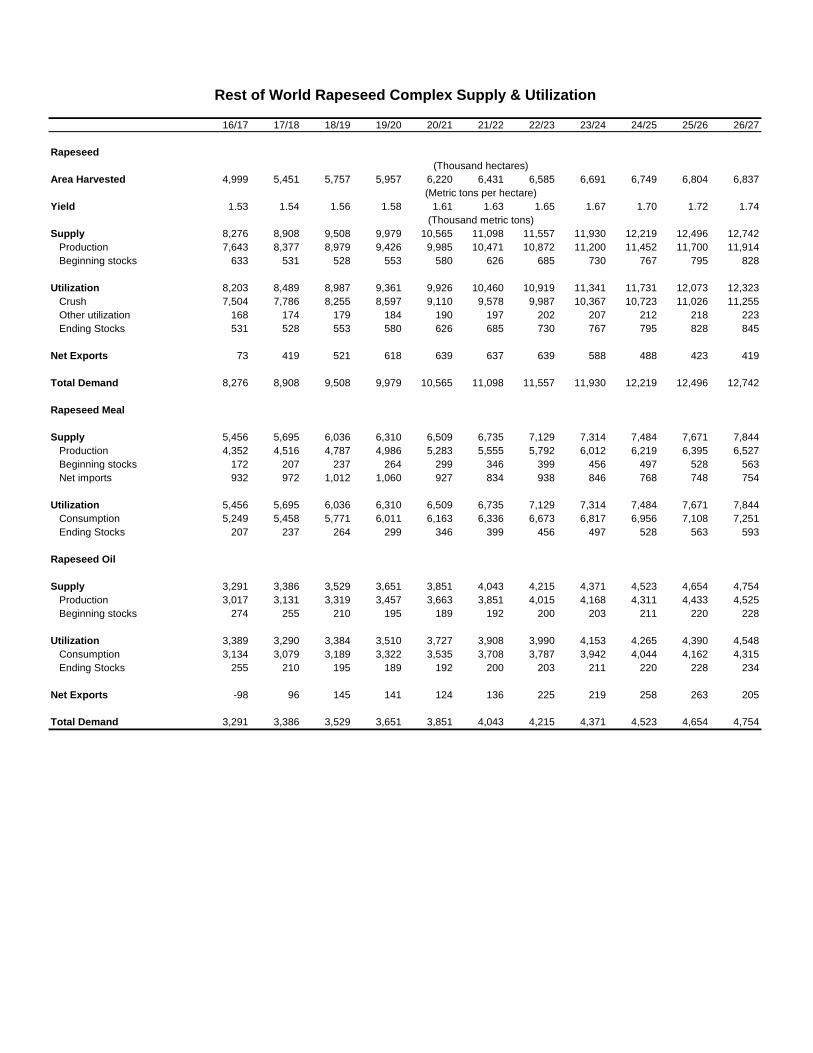
Rest of World Rapeseed Complex Supply & Utilization
16/17 17/18 18/19 19/20 20/21 21/22 22/23 23/24 24/25 25/26 26/27
Rapeseed
(Thousand hectares)
Area Harvested 4,999 5,451 5,757 5,957 6,220 6,431 6,585 6,691 6,749 6,804 6,837
(Metric tons per hectare)
Yield 1.53 1.54 1.56 1.58 1.61 1.63 1.65 1.67 1.70 1.72 1.74
(Thousand metric tons)
Supply 8,276 8,908 9,508 9,979 10,565 11,098 11,557 11,930 12,219 12,496 12,742
Production 7,643 8,377 8,979 9,426 9,985 10,471 10,872 11,200 11,452 11,700 11,914
Beginning stocks 633 531 528 553 580 626 685 730 767 795 828
Utilization 8,203 8,489 8,987 9,361 9,926 10,460 10,919 11,341 11,731 12,073 12,323
Crush 7,504 7,786 8,255 8,597 9,110 9,578 9,987 10,367 10,723 11,026 11,255
Other utilization 168 174 179 184 190 197 202 207 212 218 223
Ending Stocks 531 528 553 580 626 685 730 767 795 828 845
Net Exports 73 419 521 618 639 637 639 588 488 423 419
Total Demand 8,276 8,908 9,508 9,979 10,565 11,098 11,557 11,930 12,219 12,496 12,742
Rapeseed Meal
Supply 5,456 5,695 6,036 6,310 6,509 6,735 7,129 7,314 7,484 7,671 7,844
Production 4,352 4,516 4,787 4,986 5,283 5,555 5,792 6,012 6,219 6,395 6,527
Beginning stocks 172 207 237 264 299 346 399 456 497 528 563
Net imports 932 972 1,012 1,060 927 834 938 846 768 748 754
Utilization 5,456 5,695 6,036 6,310 6,509 6,735 7,129 7,314 7,484 7,671 7,844
Consumption 5,249 5,458 5,771 6,011 6,163 6,336 6,673 6,817 6,956 7,108 7,251
Ending Stocks 207 237 264 299 346 399 456 497 528 563 593
Rapeseed Oil
Supply 3,291 3,386 3,529 3,651 3,851 4,043 4,215 4,371 4,523 4,654 4,754
Production 3,017 3,131 3,319 3,457 3,663 3,851 4,015 4,168 4,311 4,433 4,525
Beginning stocks 274 255 210 195 189 192 200 203 211 220 228
Utilization 3,389 3,290 3,384 3,510 3,727 3,908 3,990 4,153 4,265 4,390 4,548
Consumption 3,134 3,079 3,189 3,322 3,535 3,708 3,787 3,942 4,044 4,162 4,315
Ending Stocks 255 210 195 189 192 200 203 211 220 228 234
Net Exports -98 96 145 141 124 136 225 219 258 263 205
Total Demand 3,291 3,386 3,529 3,651 3,851 4,043 4,215 4,371 4,523 4,654 4,754