Embed Size (px)
Citation preview
RAP PUBLICATION 2004/ 20
SELECTED INDICATORS OF FOOD AND AGRICULTURE DEVELOPMENT
IN ASIA-PACIFIC REGION
1993-2003
FOOD AND AGRICULTURE ORGANIZATION OF THE UNITED NATIONS REGIONAL OFFICE FOR ASIA AND THE PACIFIC, BANGKOK
OCTOBER 2004
The designations employed and the presentation of material in this publication do not imply the expression of any opinion whatsoever on the part of the Food and Agriculture Organization of the United Nations concerning the legal status of any country, territory, city or area of its authorities, or concerning the delimitation of its territories or boundaries.
All rights reserved. Reproduction and dissemination of material in this information product for educational or other non-commercial purposes are authorized without any prior written permission from the copyright holders provided the source is fully acknowledged. Reproduction of material in this information product for sale or other commercial purposes is prohibited without written permission of the copyright holders. Applications for such permission should be addressed to Dr. Frederick Baker, Senior Statistician, FAO Regional Office for Asia and the Pacific, Maliwan Mansion, 39 Phra Atit Road, Bangkok 10200, Thailand or by e-mail to [email protected].
© FAO, 2004
Map of Asia and the Pacific is used courtesy of The General Libraries, The University of Texas at Austin. The pictures on the cover were taken by P. Johnson. Tables were prepared by the FAO Regional Office for Asia and the Pacific, on the basis of information available as of August 2004. Please note that growth rates take into consideration data that are not printed. Inquiries about the technical contents and comments about the profiles should be addressed to:
Senior Statistician FAO Regional Office for Asia and the Pacific Maliwan Mansion, 39 Phra Atit Road Bangkok, 10200 Thailand Tel : (662) 697-4000 Fax : (662) 697-4445
FAO food and agriculture statistics are available on the internet at:
http://www.fao.org
ii
FOREWORD This is the twenty first issue of the publication Selected indicators of food and agriculture development in Asia-Pacific region. It presents data on selected items for the years 1993-2003, except some tables that provide information for the period 1992-2002. Most tables show two types of information: annual figures for 1993, 2000, 2001, 2002 and 2003 and the annual growth rate for the period 1993-2003. The indicators are grouped under the following headings: Agricultural land and population, Agricultural inputs, Production indices, Staple food crops, Edible oil crops, Horticultural crops, Fibre crops, Other crops, Livestock, Agricultural trade, Fisheries, Forestry, Nutrition and Other indicators including a table reporting the status of organic farming in the region. A section on country profiles has been added; your comments about the content and scope of the profiles would be appreciated. Countries of the region are shown under two groups: "Developing countries", including the “Transition market” countries, and "Developed countries". For comparison purposes, figures relating to "Rest of world" and "World" are also presented. Data for new member countries in the region have been included in this year's publication and a new format has been adopted. Please note that country data for Timor-Leste were reported as provincial data for Indonesia before 2000 and no country data were reported for the Federated States of Micronesia, the Marshall Islands and Palau before1995. For almost all commodity tables, data are retrieved from the FAO computerized data base, especially FAOSTAT, or from the FAO Yearbooks. These, in turn, are based on information supplied by member countries. The growth rates shown in the present publication have been worked out using the exponential growth method to indicate the overall regional performance and also to highlight inter-country differences. Various units of FAO including the Statistics Division and the Information Systems and Technology Division have cooperated with the FAO Regional Office for Asia and the Pacific in the preparation of this publication, providing computer programs and data bases for the production of tables. This collaboration is duly acknowledged. He Changchui
Assistant Director-General and FAO Regional Representative for Asia and the Pacific
Bangkok, October 2004
SYMBOLS USED IN THE TABLES
* Unofficial figure F FAO estimate T Trend calculation - Data not available MT Metric ton
Ha Hectare Kg Kilogram kg/ha Kilogram per hectare CUM Cubic meter In most tables a blank space has the same meaning as the symbol (-) defined above. For crop yields and all sub-regional totals no (F) or (*) symbol is used as these are derived data. To divide decimals from whole numbers, a full stop (.) is used. Please note that Asia-Pacific* refers to countries in the table.
iv
CONTENTS
Table Page
AGRICULTURAL LAND AND POPULATION
1 Land use 3 2 Agricultural land 4 3 Agricultural population 5 4 Agricultural land and population 6
AGRICULTURAL INPUTS
5 Irrigation 9 6 Irrigated land as proportion of agricultural land 10 7 Mineral fertilizers: consumption 11 8 Mineral fertilizers: consumption per ha of agricultural land 12 9 Agricultural tractors: number in use 13
PRODUCTION INDICES
10 Agricultural production indices 17 11 Food production indices 18
STAPLE FOOD CROPS
A. Cereal Crops
12 Rice paddy: production 21 13 Rice paddy: yield 22 14 Rice paddy: area harvested 23 15 Wheat: production 24 16 Wheat: yield 25 17 Wheat: area harvested 26 18 Maize: production 27 19 Maize: yield 28 20 Maize: area harvested 29 21 Millet: production 30 22 Millet: yield 31 23 Millet: area harvested 32 24 Cereals: production 33 25 Cereals: yield 34 26 Cereals: area harvested 35
B. Roots and Tubers
27 Cassava: production 39 28 Cassava: yield 40 29 Cassava: area harvested 41
30 Sweet potatoes: production 42 31 Sweet potatoes: yield 43 32 Sweet potatoes: area harvested 44 33 Potatoes: production 45 34 Potatoes: yield 46 35 Potatoes: area harvested 47 36 Taro: production 48 37 Taro: yield 49 38 Taro: area harvested 50 39 Roots and tubers: production 51 40 Roots and tubers: yield 52 41 Roots and tubers: area harvested 53
C. Pulses 42 Pulses: production 57 43 Pulses: yield 58 44 Pulses: area harvested 59
EDIBLE OIL CROPS
45 Groundnuts in shell: production 63 46 Groundnuts in shell: yield 64 47 Groundnuts in shell: area harvested 65 48 Soybean: production 66 49 Soybean: yield 67 50 Soybean: area harvested 68 51 Coconut: production 69 52 Palm oil: production 70 53 Oil crops (oil equivalent): production 71
HORTICULTURE CROPS
54 Fruits total (excluding melon): production 75 55 Bananas: production 76 56 Citrus fruit total: production 77 57 Mangoes: production 78 58 Vegetables total (incl. melons): production 79 59 Cabbages: production 80 60 Cabbages: yield 81 61 Cabbages: area harvested 82 62 Tomatoes: production 83 63 Tomatoes: yield 84 64 Tomatoes: area harvested 85 65 Onions (dry): production 86 66 Onions (dry): yield 87 67 Onions (dry): area harvested 88
FIBRE CROPS
68 Jute and jute-like fibres: production 91 69 Jute and jute-like fibres: yield 92 70 Jute and jute-like fibres: area harvested 93 71 Seed cotton: production 94 72 Seed cotton: yield 95 73 Seed cotton: area harvested 96 74 Raw silk: production (including waste) 97
OTHER CROPS
75 Natural rubber: production 101 76 Sugar cane: production 102 77 Sugar cane: yield 103 78 Sugar cane: area harvested 104 79 Coffee (green): production 105 80 Coffee (green): yield 106 81 Coffee (green): area harvested 107 82 Tea: production 108 83 Tea: yield 109 84 Tea: area harvested 110 85 Cocoa bean: production 111 86 Cocoa bean: yield 112 87 Cocoa bean: area harvested 113 88 Chillies and peppers: production 114 89 Chillies and peppers: yield 115 90 Chillies and peppers: area harvested 116
LIVESTOCK
91 Livestock production indices: total 119 92 Livestock production indices: per caput 120 93 Cattle: population 121 94 Buffalo: population 122 95 Pig: population 123 96 Sheep: population 124 97 Goat: population 125 98 Chicken: population 126 99 Duck: population 127
100 Meat total: production 128 101 Beef and veal: production 129 102 Buffalo meat: production 130 103 Pig meat: production 131 104 Mutton and lamb: production 132 105 Goat meat: production 133 106 Poultry meat: production 134 107 Milk total: production 135 108 Cow milk: production 136 109 Buffalo milk: production 137 110 Hen eggs: production 138
AGRICULTURAL TRADE
111 Agricultural products: imports in value 141 112 Agricultural products: exports in value 142 113 Cereals: imports in volume 143 114 Cereals: exports in volume 144 115 Rice: imports in volume 145 116 Rice: exports in volume 146 117 Wheat + flour, wheat equiv.: imports in volume 147 118 Wheat + flour, wheat equiv.: exports in volume 148 119 Palm oil: imports in volume 149 120 Palm oil: exports in volume 150 121 Natural rubber: imports in volume 151 122 Natural rubber: exports in volume 152 123 Coffee (green + roast): imports in volume 153 124 Coffee (green + roast): exports in volume 154 125 Tea: imports in volume 155 126 Tea: exports in volume 156 127 Cotton lint: imports in volume 157 128 Cotton lint: exports in volume 158 129 Jute: imports in volume 159 130 Jute: exports in volume 160 131 Silk: imports in volume 161 132 Silk: exports in volume 162
FISHERIES 133 Inland capture fisheries: production 165 134 Marine capture fisheries: production 166 135 Total capture fisheries: production 167 136 Aquaculture: production 168 137 Fish and fish products: imports and exports in volume 169 138 Fish and fish products: imports and exports in value 170
FORESTRY 139 Roundwood: production 173 140 Fuelwood and charcoal: production 174 141 Industrial roundwood: production 175 142 Sawlogs and veneer logs: production 176 143 Sawnwood and sleepers: production 177 144 Wood-based panels: production 178 145 Wood pulp: production 179 146 Paper and paperboard: production 180 147 Forestry products: imports in value 181 148 Forestry products: exports in value 182
NUTRITION 149 Per capita dietary energy supply (DES) and proportion of
population with DES below minimum energy requirement 185 150 Daily per capita energy availability from major food groups:
total vegetable and animal products 186 151 Daily per capita energy availability from major food groups:
cereals, rootcrops and pulses 187 152 Daily per capita energy availability from major food groups:
treenuts, oilcrops, fruits and vegetables 188 153 Daily per capita energy availability from major food groups:
sugar and sweeteners, alcoholic beverage, vegetable oil and animal fats 189
154 Availability from major food groups as percentage of total Dietary energy supply: vegetable and animal products 190
155 Availability from major food groups as percentage of total Dietary energy supply: cereals, rootcrops and pulses 191
156 Availability from major food groups as percentage of total Dietary energy supply: treenuts, oilcrops, fruits and vegetables 192
157 Availability from major food groups as percentage of total dietary energy supply: sugar and sweeteners, alcoholic beverage, vegetable oil and animal fats 193
158 Desirable dietary patterns (DDP) 194 159 Percentage of protein and fats from animal sources in total
dietary energy supply 195 160 Yearly per capita availability in kilogrammes from major food groups,
1998 196 161 Some population indicators affecting nutritional status 197
OTHER INDICATORS 162 Number and area of agricultural holdings 201 163 Organic agriculture 202 164 Population and agricultural labour force 203 165 Growth of GDP and agricultural GDP 204 166 Agriculture’s share in GDP, growth rate of value added in agriculture
and in industry 205 167 GNP per caput, its growth, inflation and ODA receipts 206 168 Food consumption, food imports and food aid 207
COUNTRY PROFILES
Developing Countries
Southeast Asia 211 South Asia 216 Central Asia 220 Other Asia 222 Pacific Islands 225
Developed Countries 232
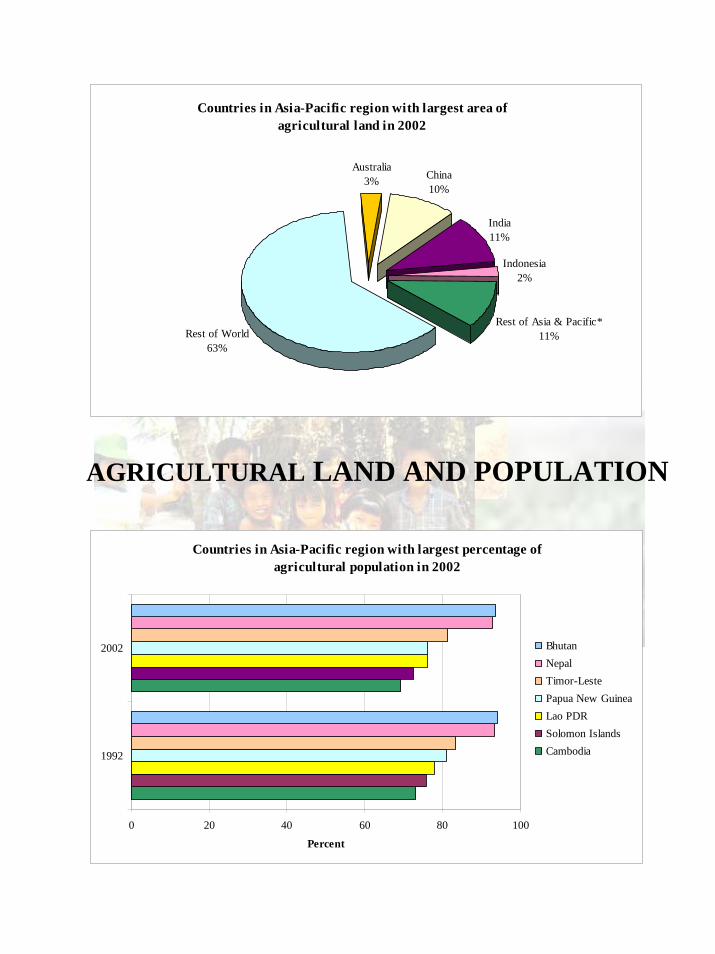
AGRICULTURAL LAND AND POPULATION
Countries in Asia-Pacific region with largest area of agricultural land in 2002
Rest of Asia & Pacific*11%
Indonesia2%
India11%
China10%
Australia3%
Rest of World63%
Countries in Asia-Pacific region with largest percentage of agricultural population in 2002
0 20 40 60 80 100
1992
2002
Percent
BhutanNepalTimor-LestePapua New GuineaLao PDRSolomon IslandsCambodia
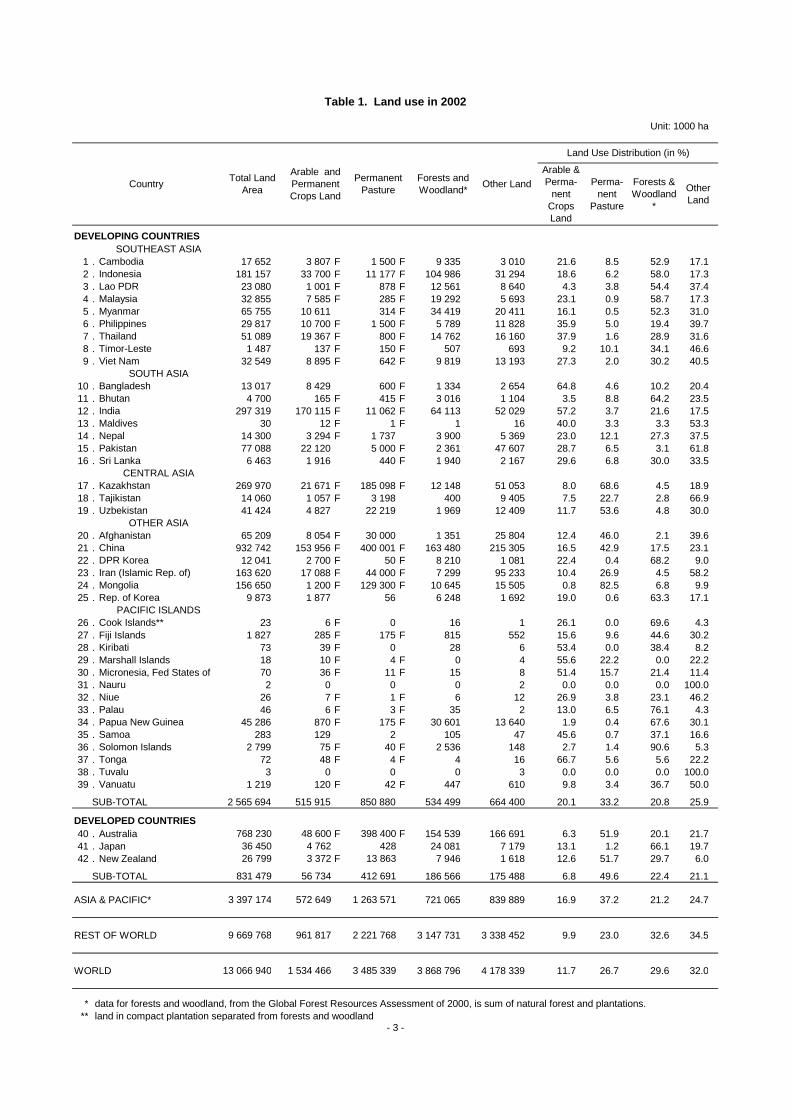
Unit: 1000 ha
DEVELOPING COUNTRIESSOUTHEAST ASIA
1 . Cambodia 17 652 3 807 F 1 500 F 9 335 3 010 21.6 8.5 52.9 17.12 . Indonesia 181 157 33 700 F 11 177 F 104 986 31 294 18.6 6.2 58.0 17.33 . Lao PDR 23 080 1 001 F 878 F 12 561 8 640 4.3 3.8 54.4 37.44 . Malaysia 32 855 7 585 F 285 F 19 292 5 693 23.1 0.9 58.7 17.35 . Myanmar 65 755 10 611 314 F 34 419 20 411 16.1 0.5 52.3 31.06 . Philippines 29 817 10 700 F 1 500 F 5 789 11 828 35.9 5.0 19.4 39.77 . Thailand 51 089 19 367 F 800 F 14 762 16 160 37.9 1.6 28.9 31.68 . Timor-Leste 1 487 137 F 150 F 507 693 9.2 10.1 34.1 46.69 . Viet Nam 32 549 8 895 F 642 F 9 819 13 193 27.3 2.0 30.2 40.5
SOUTH ASIA10 . Bangladesh 13 017 8 429 600 F 1 334 2 654 64.8 4.6 10.2 20.411 . Bhutan 4 700 165 F 415 F 3 016 1 104 3.5 8.8 64.2 23.512 . India 297 319 170 115 F 11 062 F 64 113 52 029 57.2 3.7 21.6 17.513 . Maldives 30 12 F 1 F 1 16 40.0 3.3 3.3 53.314 . Nepal 14 300 3 294 F 1 737 3 900 5 369 23.0 12.1 27.3 37.515 . Pakistan 77 088 22 120 5 000 F 2 361 47 607 28.7 6.5 3.1 61.816 . Sri Lanka 6 463 1 916 440 F 1 940 2 167 29.6 6.8 30.0 33.5
CENTRAL ASIA17 . Kazakhstan 269 970 21 671 F 185 098 F 12 148 51 053 8.0 68.6 4.5 18.918 . Tajikistan 14 060 1 057 F 3 198 400 9 405 7.5 22.7 2.8 66.919 . Uzbekistan 41 424 4 827 22 219 1 969 12 409 11.7 53.6 4.8 30.0
OTHER ASIA20 . Afghanistan 65 209 8 054 F 30 000 1 351 25 804 12.4 46.0 2.1 39.621 . China 932 742 153 956 F 400 001 F 163 480 215 305 16.5 42.9 17.5 23.122 . DPR Korea 12 041 2 700 F 50 F 8 210 1 081 22.4 0.4 68.2 9.023 . Iran (Islamic Rep. of) 163 620 17 088 F 44 000 F 7 299 95 233 10.4 26.9 4.5 58.224 . Mongolia 156 650 1 200 F 129 300 F 10 645 15 505 0.8 82.5 6.8 9.925 . Rep. of Korea 9 873 1 877 56 6 248 1 692 19.0 0.6 63.3 17.1
PACIFIC ISLANDS26 . Cook Islands** 23 6 F 0 16 1 26.1 0.0 69.6 4.327 . Fiji Islands 1 827 285 F 175 F 815 552 15.6 9.6 44.6 30.228 . Kiribati 73 39 F 0 28 6 53.4 0.0 38.4 8.229 . Marshall Islands 18 10 F 4 F 0 4 55.6 22.2 0.0 22.230 . Micronesia, Fed States of 70 36 F 11 F 15 8 51.4 15.7 21.4 11.431 . Nauru 2 0 0 0 2 0.0 0.0 0.0 100.032 . Niue 26 7 F 1 F 6 12 26.9 3.8 23.1 46.233 . Palau 46 6 F 3 F 35 2 13.0 6.5 76.1 4.334 . Papua New Guinea 45 286 870 F 175 F 30 601 13 640 1.9 0.4 67.6 30.135 . Samoa 283 129 2 105 47 45.6 0.7 37.1 16.636 . Solomon Islands 2 799 75 F 40 F 2 536 148 2.7 1.4 90.6 5.337 . Tonga 72 48 F 4 F 4 16 66.7 5.6 5.6 22.238 . Tuvalu 3 0 0 0 3 0.0 0.0 0.0 100.039 . Vanuatu 1 219 120 F 42 F 447 610 9.8 3.4 36.7 50.0
SUB-TOTAL 2 565 694 515 915 850 880 534 499 664 400 20.1 33.2 20.8 25.9
DEVELOPED COUNTRIES 40 . Australia 768 230 48 600 F 398 400 F 154 539 166 691 6.3 51.9 20.1 21.741 . Japan 36 450 4 762 428 24 081 7 179 13.1 1.2 66.1 19.742 . New Zealand 26 799 3 372 F 13 863 7 946 1 618 12.6 51.7 29.7 6.0
SUB-TOTAL 831 479 56 734 412 691 186 566 175 488 6.8 49.6 22.4 21.1
ASIA & PACIFIC* 3 397 174 572 649 1 263 571 721 065 839 889 16.9 37.2 21.2 24.7
REST OF WORLD 9 669 768 961 817 2 221 768 3 147 731 3 338 452 9.9 23.0 32.6 34.5
WORLD 13 066 940 1 534 466 3 485 339 3 868 796 4 178 339 11.7 26.7 29.6 32.0
* data for forests and woodland, from the Global Forest Resources Assessment of 2000, is sum of natural forest and plantations.** land in compact plantation separated from forests and woodland
Table 1. Land use in 2002
CountryTotal Land
Area
Arable and Permanent Crops Land
Permanent Pasture
Forests and Woodland*
Other Land
Land Use Distribution (in %)
Arable & Perma-
nent Crops Land
Perma-nent
Pasture
- 3 -
Forests & Woodland
*
Other Land
Unit: 1000 ha
DEVELOPING COUNTRIESSOUTHEAST ASIA
1 . Cambodia 17 652 3 800 F 3 807 F 21.5 21.62 . Indonesia 181 157 29 551 F 33 700 F 16.3 18.63 . Lao PDR 23 080 864 F 1 001 F 3.7 4.34 . Malaysia 32 855 7 395 F 7 585 F 22.5 23.15 . Myanmar 65 755 10 039 10 611 15.3 16.16 . Philippines 29 817 9 900 F 10 700 F 33.2 35.97 . Thailand 51 089 20 574 19 367 F 40.3 37.98 . Timor-Leste 1 487 130 F 137 F 8.7 9.29 . Viet Nam 32 549 6 697 8 895 F 20.6 27.3
SOUTH ASIA10 . Bangladesh 13 017 8 328 8 429 64.0 64.811 . Bhutan 4 700 135 F 165 F 2.9 3.512 . India 297 319 169 270 F 170 115 F 56.9 57.213 . Maldives 30 8 F 12 F 26.7 40.014 . Nepal 14 300 2 423 F 3 294 F 16.9 23.015 . Pakistan 77 088 21 060 22 120 27.3 28.716 . Sri Lanka 6 463 1 905 F 1 916 29.5 29.6
CENTRAL ASIA17 . Kazakhstan 269 970 35 201 21 671 F 13.0 8.018 . Tajikistan 14 060 985 F 1 057 F 7.0 7.519 . Uzbekistan 41 424 4 854 4 827 11.7 11.7
OTHER ASIA20 . Afghanistan 65 209 8 054 F 8 054 F 12.4 12.421 . China 932 742 131 783 F 153 956 F 14.1 16.522 . DPR Korea 12 041 2 480 F 2 700 F 20.6 22.423 . Iran (Islamic Rep. of) 163 620 18 500 17 088 F 11.3 10.424 . Mongolia 156 650 1 363 1 200 F 0.9 0.825 . Rep. of Korea 9 873 2 070 1 877 21.0 19.0
PACIFIC ISLANDS26 . Cook Islands 23 5 6 F 21.7 26.127 . Fiji Islands 1 827 260 F 285 F 14.2 15.628 . Kiribati 73 39 F 39 F 53.4 53.429 . Marshall Islands 18 - 10 F - 55.630 . Micronesia, Fed States of 70 - 36 F 0.0 51.431 . Nauru 2 0 0 0.0 0.032 . Niue 26 7 F 7 F 26.9 26.933 . Palau 46 - 6 F - 13.034 . Papua New Guinea 45 286 782 F 870 F 1.7 1.935 . Samoa 283 122 F 129 43.1 45.636 . Solomon Islands 2 799 72 F 75 F 2.6 2.737 . Tonga 72 48 F 48 F 66.7 66.738 . Tuvalu 3 0 0 0.0 0.039 . Vanuatu 1 219 120 F 120 F 9.8 9.8
SUB-TOTAL 2 565 694 498 824 515 915 19.4 20.1
DEVELOPED COUNTRIES40 . Australia 768 230 47 378 F 48 600 F 6.2 6.341 . Japan 36 450 5 165 F 4 762 14.2 13.142 . New Zealand 26 799 3 460 3 372 F 12.9 12.6
SUB-TOTAL 831 479 56 003 56 734 6.7 6.8
ASIA & PACIFIC* 3 397 174 554 827 572 649 16.3 16.9
REST OF WORLD 9 669 768 951 075 961 817 9.8 9.9
WORLD 13 066 940 1 505 902 1 534 466 11.5 11.7
**
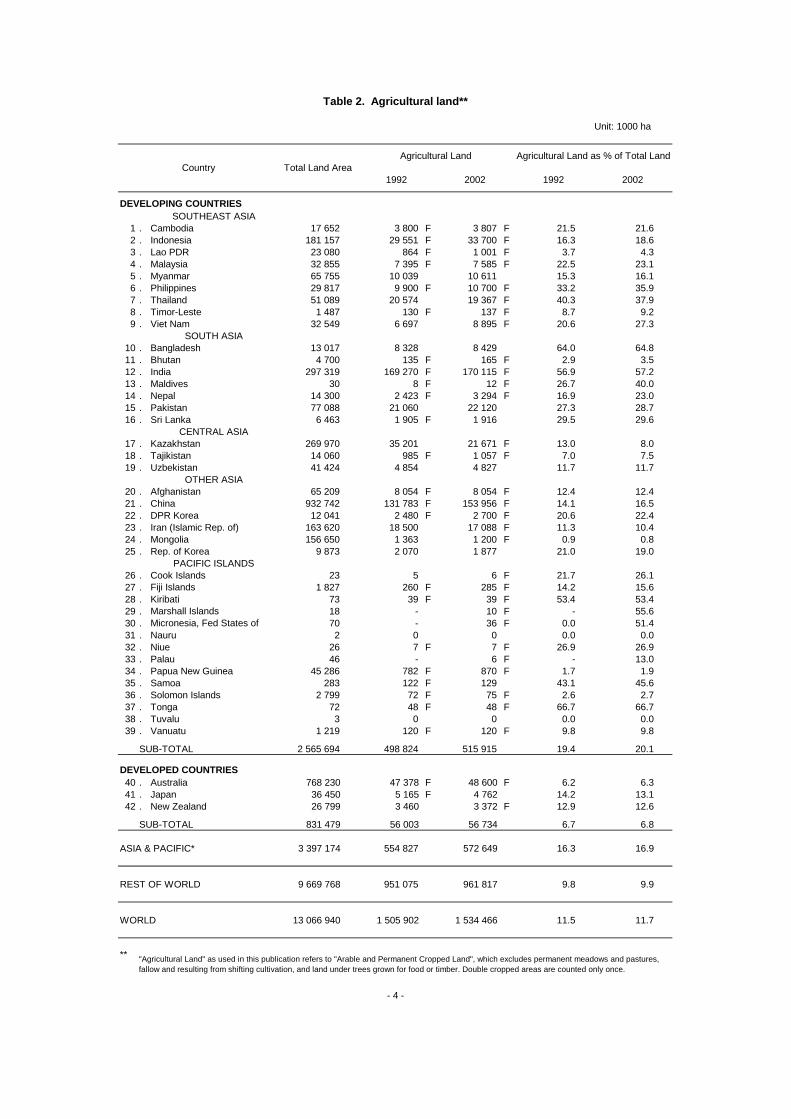
Table 2. Agricultural land**
1992 2002 1992 2002
- 4 -
CountryAgricultural Land as % of Total LandAgricultural Land
Total Land Area
"Agricultural Land" as used in this publication refers to "Arable and Permanent Cropped Land", which excludes permanent meadows and pastures, fallow and resulting from shifting cultivation, and land under trees grown for food or timber. Double cropped areas are counted only once.
Unit: 1000
DEVELOPING COUNTRIESSOUTHEAST ASIA
1 . Cambodia 10 437 13 810 7 633 9 572 73.1 69.32 . Indonesia 188 260 217 131 93 263 92 877 49.5 42.83 . Lao PDR 4 350 5 529 3 384 4 209 77.8 76.14 . Malaysia 18 817 23 965 4 549 3 909 24.2 16.35 . Myanmar 41 927 48 852 30 467 33 995 72.7 69.66 . Philippines 63 989 78 580 28 361 29 972 44.3 38.17 . Thailand 55 806 62 193 30 872 29 465 55.3 47.48 . Timor-Leste 795 739 663 601 83.4 81.39 . Viet Nam 68 901 80 278 48 565 53 401 70.5 66.5
SOUTH ASIA10 . Bangladesh 114 885 143 809 72 812 77 262 63.4 53.711 . Bhutan 1 745 2 190 1 640 2 052 94.0 93.712 . India 880 166 1 049 549 504 747 553 281 57.3 52.713 . Maldives 229 309 82 78 35.8 25.214 . Nepal 19 518 24 609 18 238 22 864 93.4 92.915 . Pakistan 116 545 149 911 63 853 74 841 54.8 49.916 . Sri Lanka 17 242 18 910 8 379 8 641 48.6 45.7
CENTRAL ASIA17 . Kazakhstan 16 849 15 469 3 969 2 908 23.6 18.818 . Tajikistan 5 509 6 195 2 163 2 010 39.3 32.419 . Uzbekistan 21 438 25 705 7 161 6 765 33.4 26.3
OTHER ASIA20 . Afghanistan 15 780 22 930 10 993 15 201 69.7 66.321 . China 1 189 560 1 302 307 842 890 852 330 70.9 65.422 . DPR Korea 20 554 22 541 7 469 6 460 36.3 28.723 . Iran (Islamic Rep. of) 59 275 68 070 18 315 17 357 30.9 25.524 . Mongolia 2 303 2 559 699 586 30.4 22.925 . Rep. of Korea 43 739 47 430 6 276 3 663 14.3 7.7
PACIFIC ISLANDS26 . Cook Islands 19 18 8 6 42.1 33.327 . Fiji Islands 738 831 325 324 44.0 39.028 . Kiribati 74 87 23 23 31.1 26.429 . Marshall Islands 46 52 14 14 30.4 26.930 . Micronesia, Fed States of 101 108 30 28 29.7 25.931 . Nauru 10 13 3 3 30.0 23.132 . Niue 2 2 1 1 50.0 50.033 . Palau 16 20 5 5 31.3 25.034 . Papua New Guinea 4 336 5 586 3 506 4 258 80.9 76.235 . Samoa 162 176 66 58 40.7 33.036 . Solomon Islands 340 463 258 336 75.9 72.637 . Tonga 99 103 41 34 41.4 33.038 . Tuvalu 9 10 4 3 44.4 30.039 . Vanuatu 158 207 67 73 42.4 35.3
SUB-TOTAL 2 984 729 3 441 246 1 821 794 1 909 466 61.0 55.5
DEVELOPED COUNTRIES40 . Australia 17 374 19 544 921 865 5.3 4.441 . Japan 124 373 127 478 7 722 4 381 6.2 3.442 . New Zealand 3 450 3 846 337 329 9.8 8.6
SUB-TOTAL 145 197 150 868 8 980 5 575 6.2 3.7
ASIA & PACIFIC* 3 129 928 3 592 116 1 830 775 1 915 042 58.5 53.3
REST OF WORLD 2 301 043 2 632 862 647 025 673 383 28.1 25.6
WORLD 5 430 971 6 224 978 2 477 800 2 588 425 45.6 41.6
1992 2002
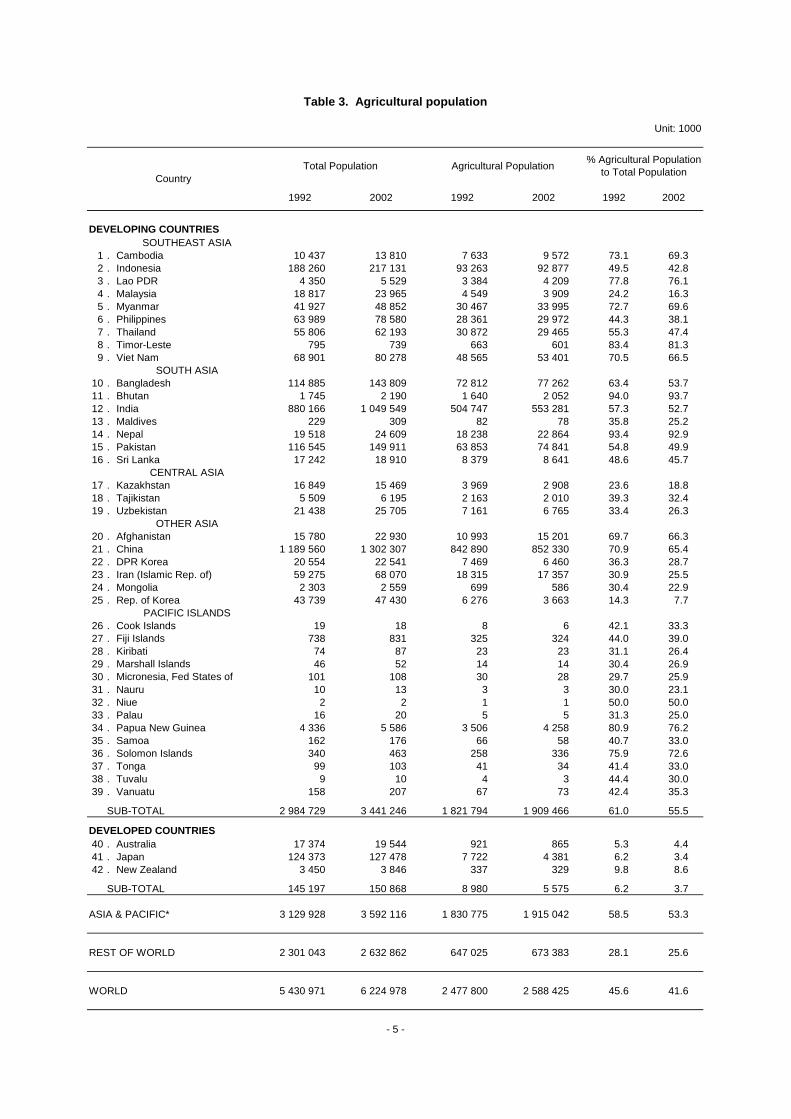
Table 3. Agricultural population
- 5 -
Country
% Agricultural Population to Total Population
Agricultural PopulationTotal Population
1992 2002 1992 2002
DEVELOPING COUNTRIESSOUTHEAST ASIA
1 . Cambodia 0.50 0.40 0.0 2.32 . Indonesia 0.32 0.36 1.3 0.03 . Lao PDR 0.26 0.24 1.5 2.24 . Malaysia 1.63 1.94 0.3 -1.55 . Myanmar 0.33 0.31 0.6 1.16 . Philippines 0.35 0.36 0.8 0.67 . Thailand 0.67 0.66 -0.6 -0.58 . Timor-Leste 0.20 0.23 0.5 -0.99 . Viet Nam 0.14 0.17 2.9 1.0
SOUTH ASIA10 . Bangladesh 0.11 0.11 0.1 0.611 . Bhutan 0.08 0.08 2.1 2.312 . India 0.34 0.31 0.1 0.913 . Maldives 0.10 0.15 4.4 -0.514 . Nepal 0.13 0.14 3.2 2.315 . Pakistan 0.33 0.30 0.5 1.616 . Sri Lanka 0.23 0.22 0.1 0.3
CENTRAL ASIA17 . Kazakhstan 8.87 7.45 -4.7 -3.118 . Tajikistan 0.46 0.53 0.7 -0.719 . Uzbekistan 0.68 0.71 -0.1 -0.6
OTHER ASIA20 . Afghanistan 0.73 0.53 0.0 3.321 . China 0.16 0.18 1.6 0.122 . DPR Korea 0.33 0.42 0.9 -1.423 . Iran (Islamic Rep. of) 1.01 0.98 -0.7 -0.524 . Mongolia 1.95 2.05 -1.2 -1.825 . Rep. of Korea 0.33 0.51 -1.0 -5.2
PACIFIC ISLANDS26 . Cook Islands 0.63 1.00 2.6 -2.727 . Fiji Islands 0.80 0.88 1.0 0.028 . Kiribati 1.70 1.70 0.0 0.029 . Marshall Islands - 0.71 - 0.030 . Micronesia, Fed States of - 1.29 - -0.731 . Nauru 0.00 0.00 0.0 0.032 . Niue 7.00 7.00 0.0 0.033 . Palau - 1.20 1.1 0.034 . Papua New Guinea 0.22 0.20 0.0 2.035 . Samoa 1.85 2.22 1.1 -1.336 . Solomon Islands 0.28 0.22 0.4 2.737 . Tonga 1.17 1.41 0.0 -1.938 . Tuvalu 0.00 0.00 0.0 -2.539 . Vanuatu 1.79 1.64 0.0 0.9
SUB-TOTAL 0.27 0.27 0.1 0.1
DEVELOPED COUNTRIES40 . Australia 51.44 56.18 0.6 -0.641 . Japan 0.67 1.09 -0.8 -5.542 . New Zealand 10.27 10.25 -0.2 -0.2
AVERAGE 6.24 10.18 -9.5 0.2
ASIA & PACIFIC* 0.30 0.30 0.3 0.5
REST OF WORLD 1.47 1.43 0.1 0.4
WORLD 0.61 0.59 0.2 0.4
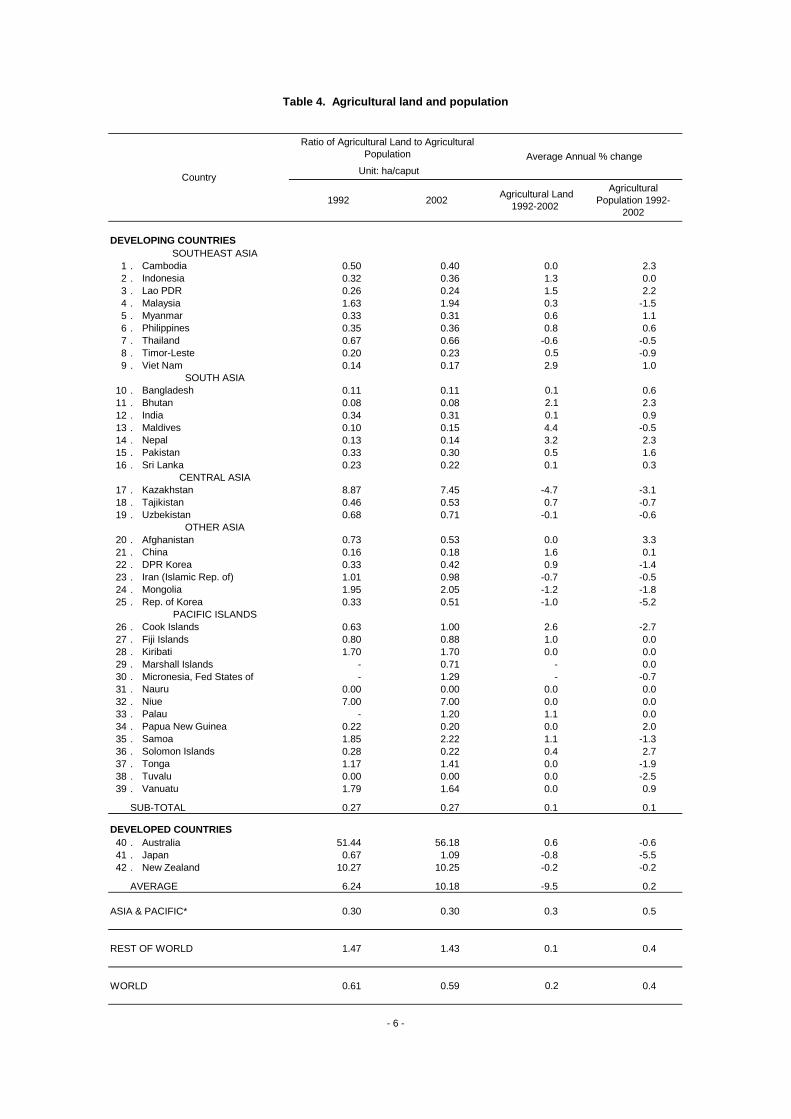
Table 4. Agricultural land and population
Country
Agricultural Land 1992-2002
Ratio of Agricultural Land to Agricultural Population
Unit: ha/caput
1992 2002Agricultural
Population 1992-2002
- 6 -
Average Annual % change
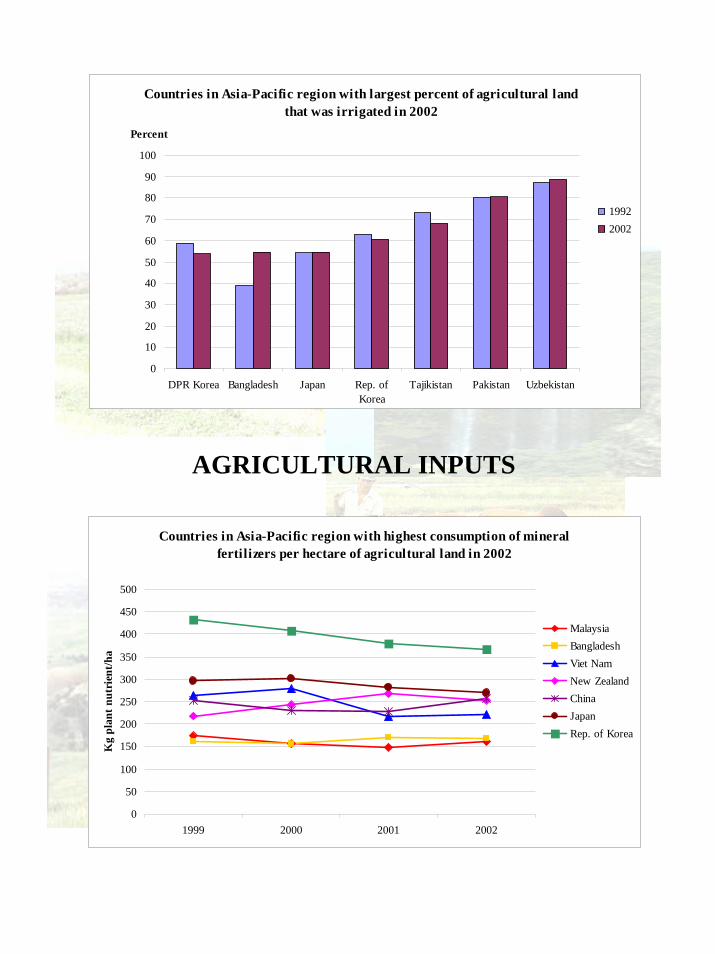
AGRICULTURAL INPUTS
Countries in Asia-Pacific region with largest percent of agricultural land that was irrigated in 2002
0
10
20
30
40
50
60
70
80
90
100
DPR Korea Bangladesh Japan Rep. ofKorea
Tajikistan Pakistan Uzbekistan
Percent
19922002
Countries in Asia-Pacific region with highest consumption of mineral fertilizers per hectare of agricultural land in 2002
0
50
100
150
200
250
300
350
400
450
500
1999 2000 2001 2002
Kg
plan
t nut
rien
t/ha
MalaysiaBangladeshViet NamNew ZealandChinaJapanRep. of Korea
Unit: 1000 ha
DEVELOPING COUNTRIESSOUTHEAST ASIA
1 . Cambodia 260 F 270 F 270 F 270 F 270 F 0.2 %2 . Indonesia 4 500 4 800 F 4 815 F 4 815 F 4 815 F 0.7 %3 . Lao PDR 145 F 172 F 175 F 175 F 175 F 2.0 %4 . Malaysia 350 F 365 F 365 F 365 F 365 F 0.4 %5 . Myanmar 998 1 841 1 910 1 985 1 996 7.0 %6 . Philippines 1 550 F 1 550 F 1 550 F 1 550 F 1 550 F 0.0 %7 . Thailand 4 433 4 948 4 998 4 924 4 957 F 1.2 %8 . Timor-Leste - - - - -9 . Viet Nam 2 900 F 3 000 F 3 000 F 3 000 F 3 000 F 0.2 %
SOUTH ASIA10 . Bangladesh 3 229 3 985 4 187 4 421 4 597 3.8 %11 . Bhutan 39 F 40 F 40 F 40 F 40 F 0.3 %12 . India 48 500 F 57 077 57 238 57 158 F 57 198 F 1.7 %13 . Maldives - - - - -14 . Nepal 1 020 F 1 135 F 1 135 F 1 135 F 1 135 F 0.9 %15 . Pakistan 16 850 17 950 18 090 17 820 17 800 F 0.6 %16 . Sri Lanka 550 F 662 665 597 638 1.9 %
CENTRAL ASIA17 . Kazakhstan 2 250 F 2 350 F 2 350 F 2 350 F 2 350 F 0.4 %18 . Tajikistan 718 * 719 F 719 F 719 F 719 F 0.0 %19 . Uzbekistan 4 239 4 281 F 4 281 F 4 281 F 4 281 F 0.1 %
OTHER ASIA20 . Afghanistan 2 400 F 2 386 F 2 386 F 2 386 F 2 386 F -0.1 %21 . China 49 152 53 740 54 402 54 831 54 937 1.3 %22 . DPR Korea 1 460 F 1 460 F 1 460 F 1 460 F 1 460 F 0.0 %23 . Iran (Islamic Rep. of) 7 000 F 7 562 F 7 500 F 7 500 F 7 500 F 0.6 %24 . Mongolia 82 F 84 F 84 F 84 F 84 F 0.2 %25 . Rep. of Korea 1 300 F 1 153 1 149 1 146 1 138 -1.3 %
PACIFIC ISLANDS26 . Cook Islands - - - - -27 . Fiji Islands 3 3 F 3 F 3 F 3 F 0.0 %28 . Kiribati - - - - -29 . Marshall Islands - - - - -30 . Micronesia, Fed States of - - - - -31 . Nauru - - - - -32 . Niue - - - - -33 . Palau - - - - -34 . Papua New Guinea - - - - -35 . Samoa - - - - -36 . Solomon Islands - - - - -37 . Tonga - - - - -38 . Tuvalu - - - - -39 . Vanuatu - - - - -
SUB-TOTAL 153 928 171 533 172 772 173 015 173 394 1.3 %
DEVELOPED COUNTRIES40 . Australia 2 069 2 251 2 385 2 465 F 2 545 1.4 %41 . Japan 2 802 2 659 2 641 2 624 2 607 -0.7 %42 . New Zealand 285 F 285 F 285 F 285 F 285 F 0.0 %
SUB-TOTAL 5 156 5 195 5 311 5 374 5 437 0.2 %
ASIA & PACIFIC* 159 084 176 728 178 083 178 389 178 831 1.2 %
REST OF WORLD 93 296 96 590 97 105 97 492 97 888 0.4 %
WORLD 252 380 273 318 275 188 275 881 276 719 1.0 %
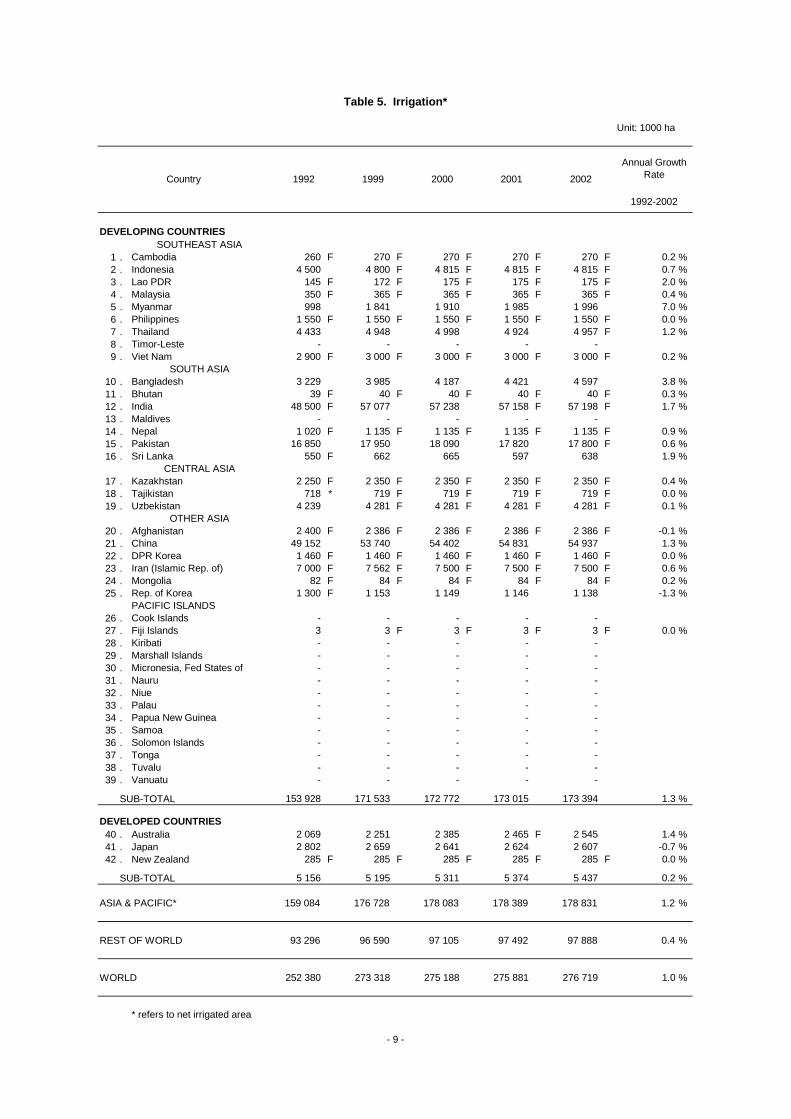
* refers to net irrigated area
- 9 -
Table 5. Irrigation*
Country 1992 1999 2000 2001 2002
Annual Growth Rate
1992-2002
Unit: 1000 ha
DEVELOPING COUNTRIESSOUTHEAST ASIA
1 . Cambodia 3 800 F 3 807 F 260 F 270 F 6.8 7.12 . Indonesia 29 551 F 33 700 F 4 500 4 815 F 15.2 14.33 . Lao PDR 864 F 1 001 F 145 F 175 F 16.8 17.54 . Malaysia 7 395 F 7 585 F 350 F 365 F 4.7 4.85 . Myanmar 10 039 10 611 998 1 996 9.9 18.86 . Philippines 9 900 F 10 700 F 1 550 F 1 550 F 15.7 14.57 . Thailand 20 574 19 367 F 4 433 4 957 F 21.5 25.68 . Timor-Leste 130 F 137 F - - 0.0 0.09 . Viet Nam 6 697 8 895 F 2 900 F 3 000 F 43.3 33.7
SOUTH ASIA10 . Bangladesh 8 328 8 429 3 229 4 597 38.8 54.511 . Bhutan 135 F 165 F 39 F 40 F 28.9 24.212 . India 169 270 F 170 115 F 48 500 F 57 198 F 28.7 33.613 . Maldives 8 F 12 F - - 0.0 0.014 . Nepal 2 423 F 3 294 F 1 020 F 1 135 F 42.1 34.515 . Pakistan 21 060 22 120 16 850 17 800 F 80.0 80.516 . Sri Lanka 1 905 F 1 916 550 F 638 28.9 33.3
CENTRAL ASIA17 . Kazakhstan 35 201 21 671 F 2 250 F 2 350 F 6.4 10.818 . Tajikistan 985 F 1 057 F 718 * 719 F 72.9 68.019 . Uzbekistan 4 854 4 827 4 239 4 281 F 87.3 88.7
OTHER ASIA20 . Afghanistan 8 054 F 8 054 F 2 400 F 2 386 F 29.8 29.621 . China 131 783 F 153 956 F 49 152 54 937 37.3 35.722 . DPR Korea 2 480 F 2 700 F 1 460 F 1 460 F 58.9 54.123 . Iran (Islamic Rep. of) 18 500 17 088 F 7 000 F 7 500 F 37.8 43.924 . Mongolia 1 363 1 200 F 82 F 84 F 6.0 7.025 . Rep. of Korea 2 070 1 877 1 300 F 1 138 62.8 60.6
PACIFIC ISLANDS26 . Cook Islands 5 6 F - - - -27 . Fiji Islands 260 F 285 F 3 3 F 1.2 1.128 . Kiribati 39 F 39 F - - - -29 . Marshall Islands - 10 F - - - -30 . Micronesia, Fed States of - 36 F - - - -31 . Nauru 0 0 - - - -32 . Niue 7 F 7 F - - - -33 . Palau - 6 F - - - -34 . Papua New Guinea 782 F 870 F - - - -35 . Samoa 122 F 129 - - - -36 . Solomon Islands 72 F 75 F - - - -37 . Tonga 48 F 48 F - - - -38 . Tuvalu 0 0 - - - -39 . Vanuatu 120 F 120 F - - - -
SUB-TOTAL 498 824 515 915 153 928 173 394 30.9 33.6
DEVELOPED COUNTRIES40 . Australia 47 378 F 48 600 F 2 069 2 545 4.4 5.241 . Japan 5 165 F 4 762 2 802 2 607 54.2 54.742 . New Zealand 3 460 3 372 F 285 F 285 F 8.2 8.5
SUB-TOTAL 56 003 56 734 5 156 5 437 9.2 9.6
ASIA & PACIFIC* 554 827 572 649 159 084 178 831 28.7 31.2
REST OF WORLD 951 075 961 817 93 296 97 888 9.8 10.2
WORLD 1 505 902 1 534 466 252 380 276 719 16.8 18.0
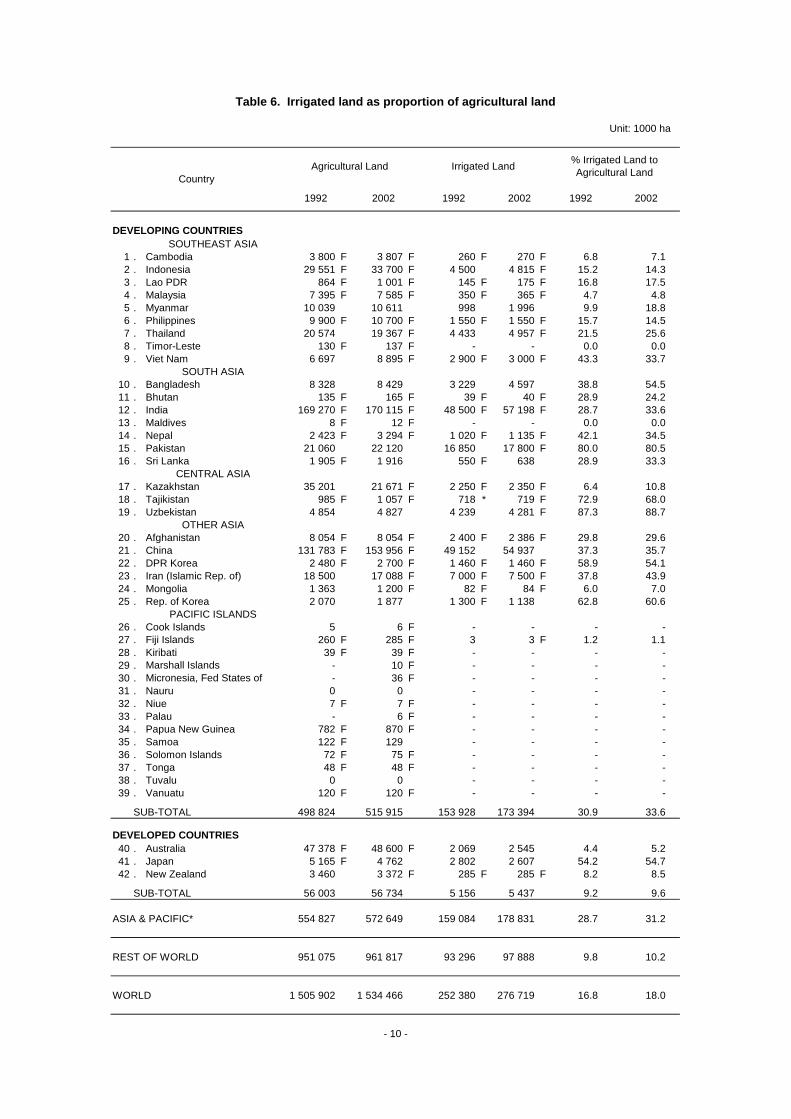
199220021992
- 10 -
Table 6. Irrigated land as proportion of agricultural land
Country
% Irrigated Land to Agricultural Land
Irrigated LandAgricultural Land
200219922002
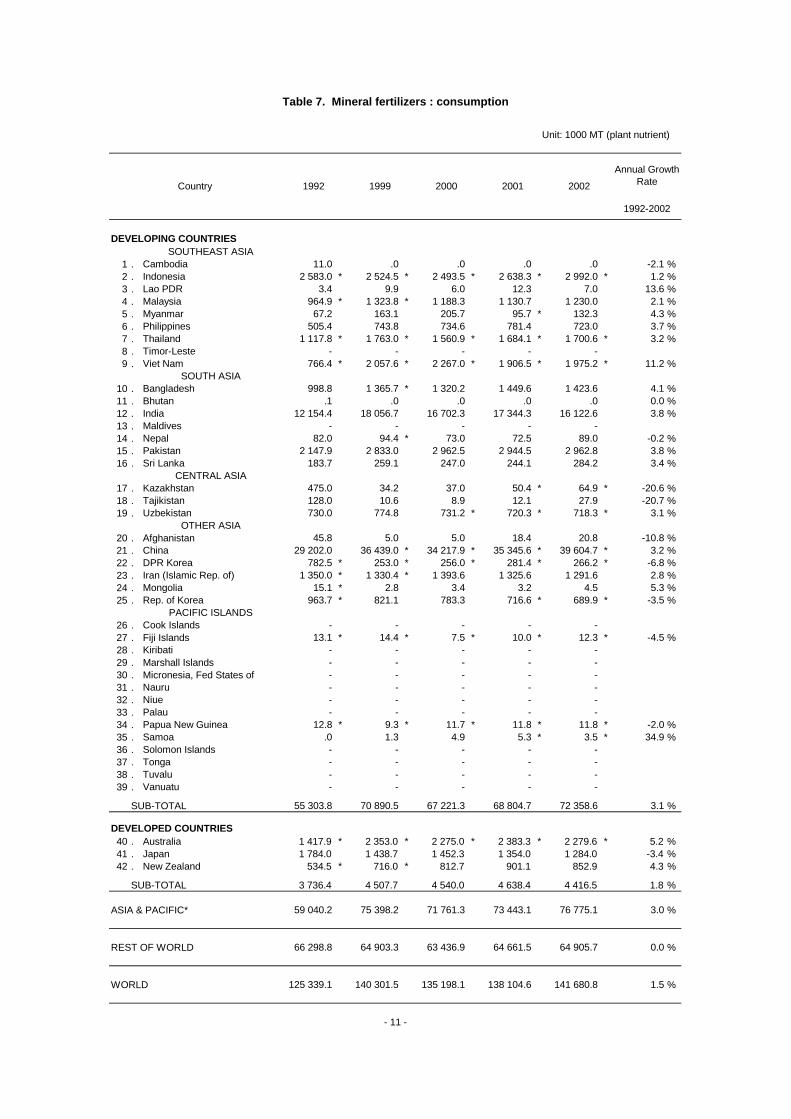
Unit: 1000 MT (plant nutrient)
DEVELOPING COUNTRIESSOUTHEAST ASIA
1 . Cambodia 11.0 .0 .0 .0 .0 -2.1 %2 . Indonesia 2 583.0 * 2 524.5 * 2 493.5 * 2 638.3 * 2 992.0 * 1.2 %3 . Lao PDR 3.4 9.9 6.0 12.3 7.0 13.6 %4 . Malaysia 964.9 * 1 323.8 * 1 188.3 1 130.7 1 230.0 2.1 %5 . Myanmar 67.2 163.1 205.7 95.7 * 132.3 4.3 %6 . Philippines 505.4 743.8 734.6 781.4 723.0 3.7 %7 . Thailand 1 117.8 * 1 763.0 * 1 560.9 * 1 684.1 * 1 700.6 * 3.2 %8 . Timor-Leste - - - - -9 . Viet Nam 766.4 * 2 057.6 * 2 267.0 * 1 906.5 * 1 975.2 * 11.2 %
SOUTH ASIA10 . Bangladesh 998.8 1 365.7 * 1 320.2 1 449.6 1 423.6 4.1 %11 . Bhutan .1 .0 .0 .0 .0 0.0 %12 . India 12 154.4 18 056.7 16 702.3 17 344.3 16 122.6 3.8 %13 . Maldives - - - - -14 . Nepal 82.0 94.4 * 73.0 72.5 89.0 -0.2 %15 . Pakistan 2 147.9 2 833.0 2 962.5 2 944.5 2 962.8 3.8 %16 . Sri Lanka 183.7 259.1 247.0 244.1 284.2 3.4 %
CENTRAL ASIA17 . Kazakhstan 475.0 34.2 37.0 50.4 * 64.9 * -20.6 %18 . Tajikistan 128.0 10.6 8.9 12.1 27.9 -20.7 %19 . Uzbekistan 730.0 774.8 731.2 * 720.3 * 718.3 * 3.1 %
OTHER ASIA20 . Afghanistan 45.8 5.0 5.0 18.4 20.8 -10.8 %21 . China 29 202.0 36 439.0 * 34 217.9 * 35 345.6 * 39 604.7 * 3.2 %22 . DPR Korea 782.5 * 253.0 * 256.0 * 281.4 * 266.2 * -6.8 %23 . Iran (Islamic Rep. of) 1 350.0 * 1 330.4 * 1 393.6 1 325.6 1 291.6 2.8 %24 . Mongolia 15.1 * 2.8 3.4 3.2 4.5 5.3 %25 . Rep. of Korea 963.7 * 821.1 783.3 716.6 * 689.9 * -3.5 %
PACIFIC ISLANDS26 . Cook Islands - - - - -27 . Fiji Islands 13.1 * 14.4 * 7.5 * 10.0 * 12.3 * -4.5 %28 . Kiribati - - - - -29 . Marshall Islands - - - - -30 . Micronesia, Fed States of - - - - -31 . Nauru - - - - -32 . Niue - - - - -33 . Palau - - - - -34 . Papua New Guinea 12.8 * 9.3 * 11.7 * 11.8 * 11.8 * -2.0 %35 . Samoa .0 1.3 4.9 5.3 * 3.5 * 34.9 %36 . Solomon Islands - - - - -37 . Tonga - - - - -38 . Tuvalu - - - - -39 . Vanuatu - - - - -
SUB-TOTAL 55 303.8 70 890.5 67 221.3 68 804.7 72 358.6 3.1 %
DEVELOPED COUNTRIES40 . Australia 1 417.9 * 2 353.0 * 2 275.0 * 2 383.3 * 2 279.6 * 5.2 %41 . Japan 1 784.0 1 438.7 1 452.3 1 354.0 1 284.0 -3.4 %42 . New Zealand 534.5 * 716.0 * 812.7 901.1 852.9 4.3 %
SUB-TOTAL 3 736.4 4 507.7 4 540.0 4 638.4 4 416.5 1.8 %
ASIA & PACIFIC* 59 040.2 75 398.2 71 761.3 73 443.1 76 775.1 3.0 %
REST OF WORLD 66 298.8 64 903.3 63 436.9 64 661.5 64 905.7 0.0 %
WORLD 125 339.1 140 301.5 135 198.1 138 104.6 141 680.8 1.5 %
- 11 -
Country
Table 7. Mineral fertilizers : consumption
1992 1999 2000 2001 2002
Annual Growth Rate
1992-2002
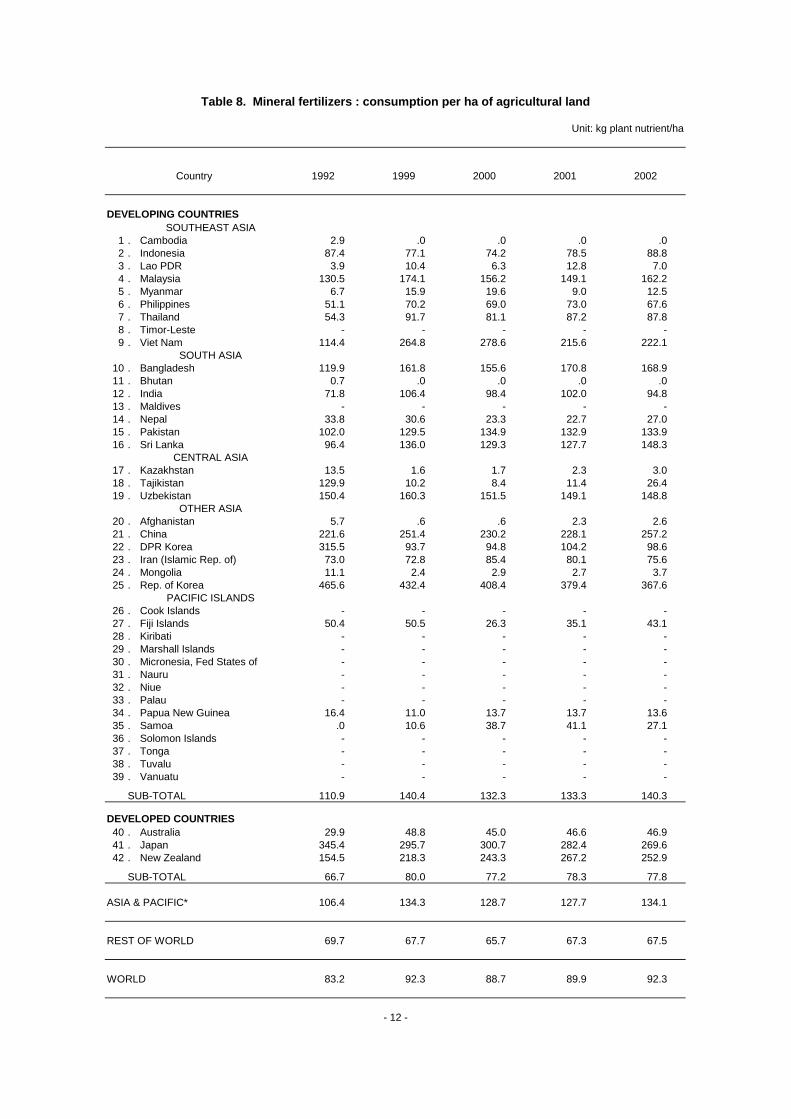
Unit: kg plant nutrient/ha
Country 1992 1999 2000 2001 2002
DEVELOPING COUNTRIESSOUTHEAST ASIA
1 . Cambodia 2.9 .0 .0 .0 .02 . Indonesia 87.4 77.1 74.2 78.5 88.83 . Lao PDR 3.9 10.4 6.3 12.8 7.04 . Malaysia 130.5 174.1 156.2 149.1 162.25 . Myanmar 6.7 15.9 19.6 9.0 12.56 . Philippines 51.1 70.2 69.0 73.0 67.67 . Thailand 54.3 91.7 81.1 87.2 87.88 . Timor-Leste - - - - -9 . Viet Nam 114.4 264.8 278.6 215.6 222.1
SOUTH ASIA10 . Bangladesh 119.9 161.8 155.6 170.8 168.911 . Bhutan 0.7 .0 .0 .0 .012 . India 71.8 106.4 98.4 102.0 94.813 . Maldives - - - - -14 . Nepal 33.8 30.6 23.3 22.7 27.015 . Pakistan 102.0 129.5 134.9 132.9 133.916 . Sri Lanka 96.4 136.0 129.3 127.7 148.3
CENTRAL ASIA17 . Kazakhstan 13.5 1.6 1.7 2.3 3.018 . Tajikistan 129.9 10.2 8.4 11.4 26.419 . Uzbekistan 150.4 160.3 151.5 149.1 148.8
OTHER ASIA20 . Afghanistan 5.7 .6 .6 2.3 2.621 . China 221.6 251.4 230.2 228.1 257.222 . DPR Korea 315.5 93.7 94.8 104.2 98.623 . Iran (Islamic Rep. of) 73.0 72.8 85.4 80.1 75.624 . Mongolia 11.1 2.4 2.9 2.7 3.725 . Rep. of Korea 465.6 432.4 408.4 379.4 367.6
PACIFIC ISLANDS26 . Cook Islands - - - - -27 . Fiji Islands 50.4 50.5 26.3 35.1 43.128 . Kiribati - - - - -29 . Marshall Islands - - - - -30 . Micronesia, Fed States of - - - - -31 . Nauru - - - - -32 . Niue - - - - -33 . Palau - - - - -34 . Papua New Guinea 16.4 11.0 13.7 13.7 13.635 . Samoa .0 10.6 38.7 41.1 27.136 . Solomon Islands - - - - -37 . Tonga - - - - -38 . Tuvalu - - - - -39 . Vanuatu - - - - -
SUB-TOTAL 110.9 140.4 132.3 133.3 140.3
DEVELOPED COUNTRIES40 . Australia 29.9 48.8 45.0 46.6 46.941 . Japan 345.4 295.7 300.7 282.4 269.642 . New Zealand 154.5 218.3 243.3 267.2 252.9
SUB-TOTAL 66.7 80.0 77.2 78.3 77.8
ASIA & PACIFIC* 106.4 134.3 128.7 127.7 134.1
REST OF WORLD 69.7 67.7 65.7 67.3 67.5
WORLD 83.2 92.3 88.7 89.9 92.3
Table 8. Mineral fertilizers : consumption per ha of agricultural land
- 12 -
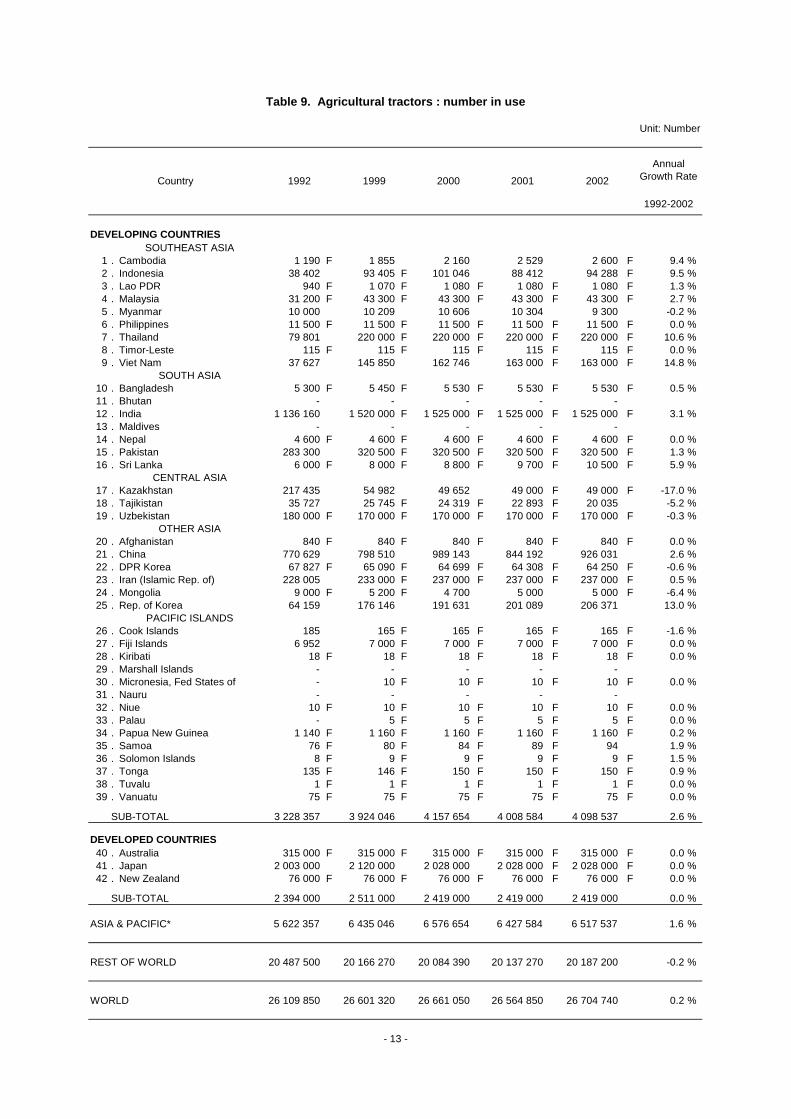
Unit: Number
DEVELOPING COUNTRIESSOUTHEAST ASIA
1 . Cambodia 1 190 F 1 855 2 160 2 529 2 600 F 9.4 %2 . Indonesia 38 402 93 405 F 101 046 88 412 94 288 F 9.5 %3 . Lao PDR 940 F 1 070 F 1 080 F 1 080 F 1 080 F 1.3 %4 . Malaysia 31 200 F 43 300 F 43 300 F 43 300 F 43 300 F 2.7 %5 . Myanmar 10 000 10 209 10 606 10 304 9 300 -0.2 %6 . Philippines 11 500 F 11 500 F 11 500 F 11 500 F 11 500 F 0.0 %7 . Thailand 79 801 220 000 F 220 000 F 220 000 F 220 000 F 10.6 %8 . Timor-Leste 115 F 115 F 115 F 115 F 115 F 0.0 %9 . Viet Nam 37 627 145 850 162 746 163 000 F 163 000 F 14.8 %
SOUTH ASIA10 . Bangladesh 5 300 F 5 450 F 5 530 F 5 530 F 5 530 F 0.5 %11 . Bhutan - - - - -12 . India 1 136 160 1 520 000 F 1 525 000 F 1 525 000 F 1 525 000 F 3.1 %13 . Maldives - - - - -14 . Nepal 4 600 F 4 600 F 4 600 F 4 600 F 4 600 F 0.0 %15 . Pakistan 283 300 320 500 F 320 500 F 320 500 F 320 500 F 1.3 %16 . Sri Lanka 6 000 F 8 000 F 8 800 F 9 700 F 10 500 F 5.9 %
CENTRAL ASIA17 . Kazakhstan 217 435 54 982 49 652 49 000 F 49 000 F -17.0 %18 . Tajikistan 35 727 25 745 F 24 319 F 22 893 F 20 035 -5.2 %19 . Uzbekistan 180 000 F 170 000 F 170 000 F 170 000 F 170 000 F -0.3 %
OTHER ASIA20 . Afghanistan 840 F 840 F 840 F 840 F 840 F 0.0 %21 . China 770 629 798 510 989 143 844 192 926 031 2.6 %22 . DPR Korea 67 827 F 65 090 F 64 699 F 64 308 F 64 250 F -0.6 %23 . Iran (Islamic Rep. of) 228 005 233 000 F 237 000 F 237 000 F 237 000 F 0.5 %24 . Mongolia 9 000 F 5 200 F 4 700 5 000 5 000 F -6.4 %25 . Rep. of Korea 64 159 176 146 191 631 201 089 206 371 13.0 %
PACIFIC ISLANDS26 . Cook Islands 185 165 F 165 F 165 F 165 F -1.6 %27 . Fiji Islands 6 952 7 000 F 7 000 F 7 000 F 7 000 F 0.0 %28 . Kiribati 18 F 18 F 18 F 18 F 18 F 0.0 %29 . Marshall Islands - - - - -30 . Micronesia, Fed States of - 10 F 10 F 10 F 10 F 0.0 %31 . Nauru - - - - -32 . Niue 10 F 10 F 10 F 10 F 10 F 0.0 %33 . Palau - 5 F 5 F 5 F 5 F 0.0 %34 . Papua New Guinea 1 140 F 1 160 F 1 160 F 1 160 F 1 160 F 0.2 %35 . Samoa 76 F 80 F 84 F 89 F 94 1.9 %36 . Solomon Islands 8 F 9 F 9 F 9 F 9 F 1.5 %37 . Tonga 135 F 146 F 150 F 150 F 150 F 0.9 %38 . Tuvalu 1 F 1 F 1 F 1 F 1 F 0.0 %39 . Vanuatu 75 F 75 F 75 F 75 F 75 F 0.0 %
SUB-TOTAL 3 228 357 3 924 046 4 157 654 4 008 584 4 098 537 2.6 %
DEVELOPED COUNTRIES40 . Australia 315 000 F 315 000 F 315 000 F 315 000 F 315 000 F 0.0 %41 . Japan 2 003 000 2 120 000 2 028 000 2 028 000 F 2 028 000 F 0.0 %42 . New Zealand 76 000 F 76 000 F 76 000 F 76 000 F 76 000 F 0.0 %
SUB-TOTAL 2 394 000 2 511 000 2 419 000 2 419 000 2 419 000 0.0 %
ASIA & PACIFIC* 5 622 357 6 435 046 6 576 654 6 427 584 6 517 537 1.6 %
REST OF WORLD 20 487 500 20 166 270 20 084 390 20 137 270 20 187 200 -0.2 %
WORLD 26 109 850 26 601 320 26 661 050 26 564 850 26 704 740 0.2 %
- 13 -
Country
Table 9. Agricultural tractors : number in use
1992 1999 2000 2001 2002
Annual Growth Rate
1992-2002
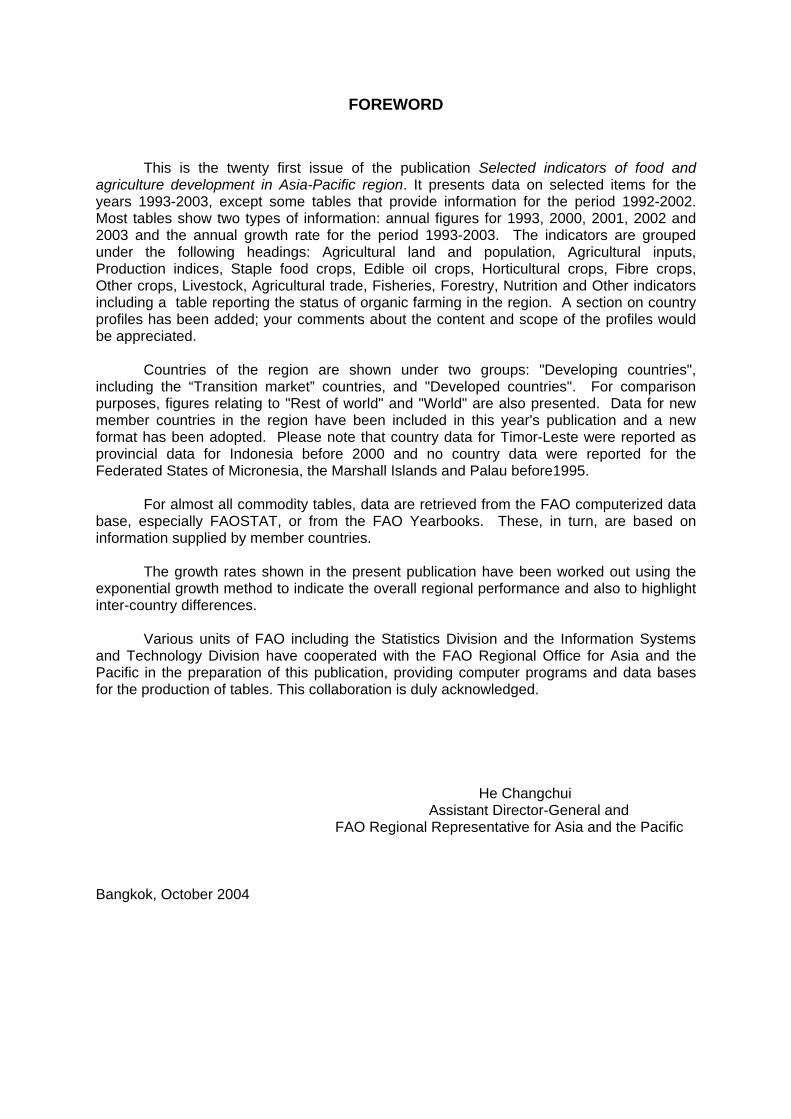
West Java
-
500
1,000
1,500
2,000
2,500
3,000
Jan
Mar
May Ju
l
Sep
Nov Ja
n
Mar
May Ju
l
Sep
Month
Hec
tare
New Planting
Actual Harvest Area
Forecast Harvest Area
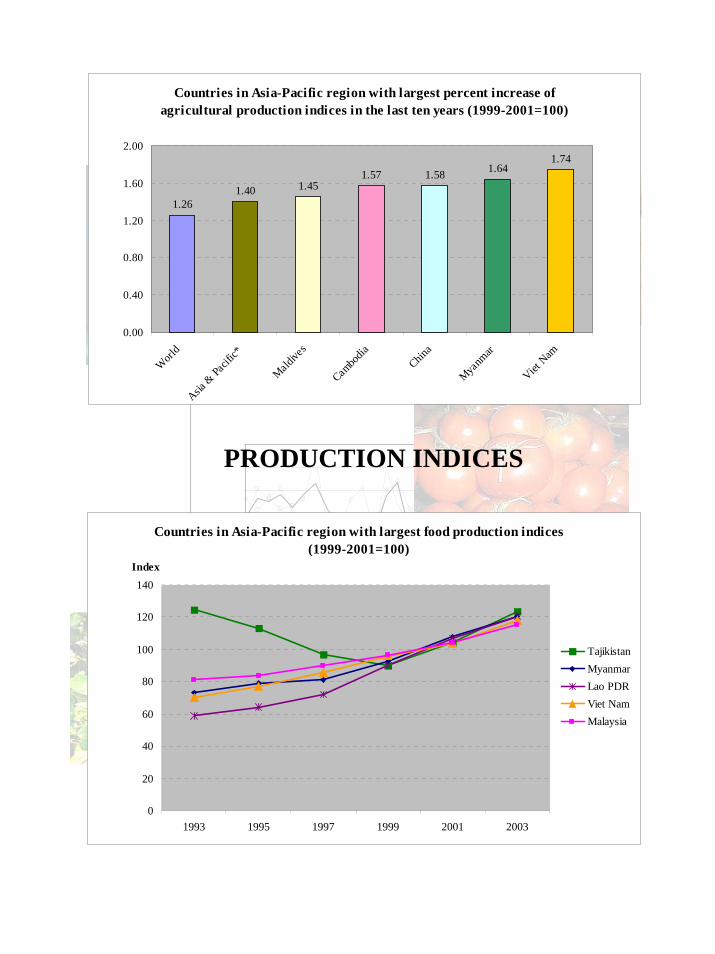
PRODUCTION INDICES
Countries in Asia-Pacific region with largest percent increase of agricultural production indices in the last ten years (1999-2001=100)
1.261.40 1.45
1.57 1.58 1.641.74
0.00
0.40
0.80
1.20
1.60
2.00
Worl
d
Asia &
Pacif
ic*
Maldive
s
Cambo
diaChin
a
Myanm
ar
Viet N
am
Countries in Asia-Pacific region with largest food production indices (1999-2001=100)
0
20
40
60
80
100
120
140
1993 1995 1997 1999 2001 2003
Index
TajikistanMyanmarLao PDRViet NamMalaysia
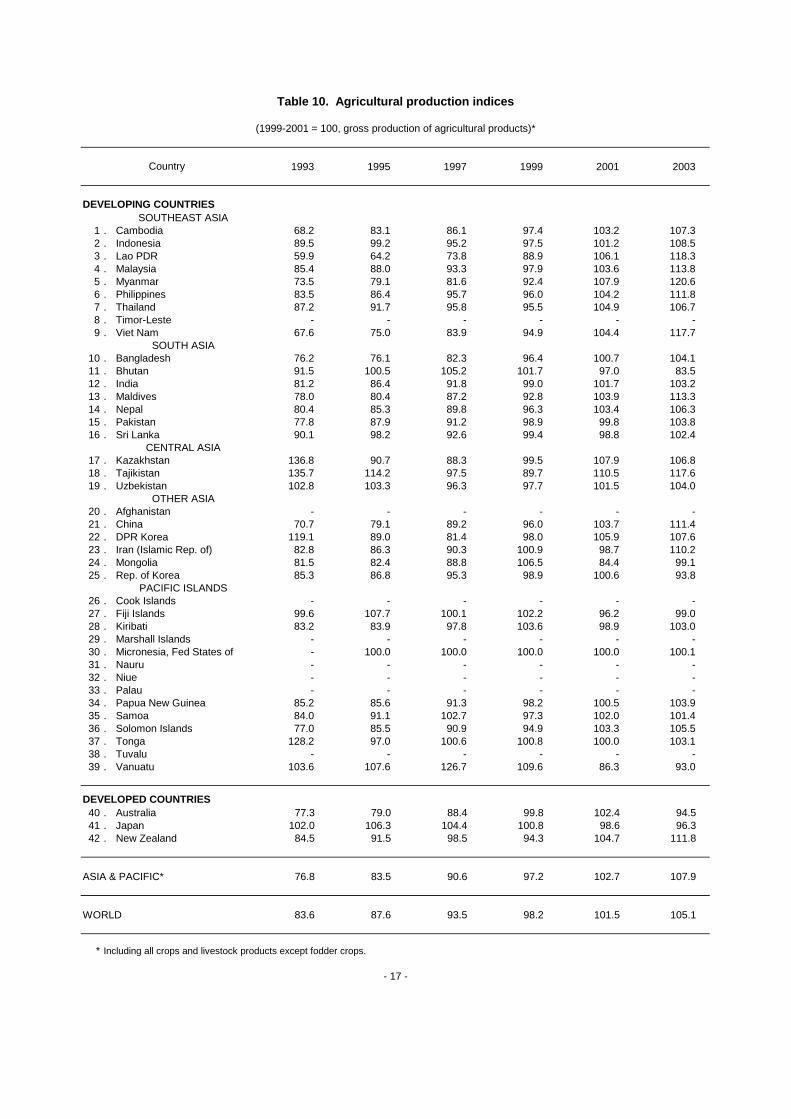
Table 10. Agricultural production indices
(1999-2001 = 100, gross production of agricultural products)*
1993 1995 1997 1999 2001 2003
DEVELOPING COUNTRIESSOUTHEAST ASIA
1 . Cambodia 68.2 83.1 86.1 97.4 103.2 107.32 . Indonesia 89.5 99.2 95.2 97.5 101.2 108.53 . Lao PDR 59.9 64.2 73.8 88.9 106.1 118.34 . Malaysia 85.4 88.0 93.3 97.9 103.6 113.85 . Myanmar 73.5 79.1 81.6 92.4 107.9 120.66 . Philippines 83.5 86.4 95.7 96.0 104.2 111.87 . Thailand 87.2 91.7 95.8 95.5 104.9 106.78 . Timor-Leste - - - - - -9 . Viet Nam 67.6 75.0 83.9 94.9 104.4 117.7
SOUTH ASIA10 . Bangladesh 76.2 76.1 82.3 96.4 100.7 104.111 . Bhutan 91.5 100.5 105.2 101.7 97.0 83.512 . India 81.2 86.4 91.8 99.0 101.7 103.213 . Maldives 78.0 80.4 87.2 92.8 103.9 113.314 . Nepal 80.4 85.3 89.8 96.3 103.4 106.315 . Pakistan 77.8 87.9 91.2 98.9 99.8 103.816 . Sri Lanka 90.1 98.2 92.6 99.4 98.8 102.4
CENTRAL ASIA17 . Kazakhstan 136.8 90.7 88.3 99.5 107.9 106.818 . Tajikistan 135.7 114.2 97.5 89.7 110.5 117.619 . Uzbekistan 102.8 103.3 96.3 97.7 101.5 104.0
OTHER ASIA20 . Afghanistan - - - - - -21 . China 70.7 79.1 89.2 96.0 103.7 111.422 . DPR Korea 119.1 89.0 81.4 98.0 105.9 107.623 . Iran (Islamic Rep. of) 82.8 86.3 90.3 100.9 98.7 110.224 . Mongolia 81.5 82.4 88.8 106.5 84.4 99.125 . Rep. of Korea 85.3 86.8 95.3 98.9 100.6 93.8
PACIFIC ISLANDS26 . Cook Islands - - - - - -27 . Fiji Islands 99.6 107.7 100.1 102.2 96.2 99.028 . Kiribati 83.2 83.9 97.8 103.6 98.9 103.029 . Marshall Islands - - - - - -30 . Micronesia, Fed States of - 100.0 100.0 100.0 100.0 100.131 . Nauru - - - - - -32 . Niue - - - - - -33 . Palau - - - - - -34 . Papua New Guinea 85.2 85.6 91.3 98.2 100.5 103.935 . Samoa 84.0 91.1 102.7 97.3 102.0 101.436 . Solomon Islands 77.0 85.5 90.9 94.9 103.3 105.537 . Tonga 128.2 97.0 100.6 100.8 100.0 103.138 . Tuvalu - - - - - -39 . Vanuatu 103.6 107.6 126.7 109.6 86.3 93.0
DEVELOPED COUNTRIES40 . Australia 77.3 79.0 88.4 99.8 102.4 94.541 . Japan 102.0 106.3 104.4 100.8 98.6 96.342 . New Zealand 84.5 91.5 98.5 94.3 104.7 111.8
ASIA & PACIFIC* 76.8 83.5 90.6 97.2 102.7 107.9
WORLD 83.6 87.6 93.5 98.2 101.5 105.1
* Including all crops and livestock products except fodder crops.
Country
- 17 -
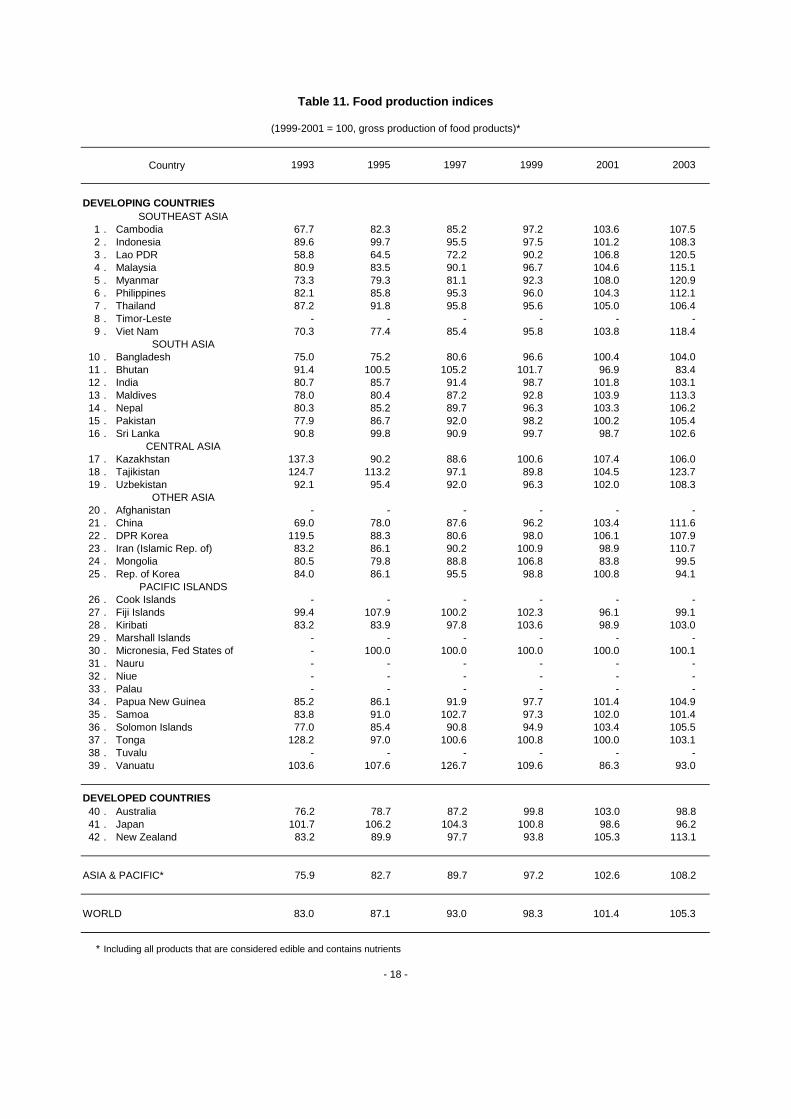
Table 11. Food production indices
(1999-2001 = 100, gross production of food products)*
1993 1995 1997 1999 2001 2003
DEVELOPING COUNTRIESSOUTHEAST ASIA
1 . Cambodia 67.7 82.3 85.2 97.2 103.6 107.52 . Indonesia 89.6 99.7 95.5 97.5 101.2 108.33 . Lao PDR 58.8 64.5 72.2 90.2 106.8 120.54 . Malaysia 80.9 83.5 90.1 96.7 104.6 115.15 . Myanmar 73.3 79.3 81.1 92.3 108.0 120.96 . Philippines 82.1 85.8 95.3 96.0 104.3 112.17 . Thailand 87.2 91.8 95.8 95.6 105.0 106.48 . Timor-Leste - - - - - -9 . Viet Nam 70.3 77.4 85.4 95.8 103.8 118.4
SOUTH ASIA10 . Bangladesh 75.0 75.2 80.6 96.6 100.4 104.011 . Bhutan 91.4 100.5 105.2 101.7 96.9 83.412 . India 80.7 85.7 91.4 98.7 101.8 103.113 . Maldives 78.0 80.4 87.2 92.8 103.9 113.314 . Nepal 80.3 85.2 89.7 96.3 103.3 106.215 . Pakistan 77.9 86.7 92.0 98.2 100.2 105.416 . Sri Lanka 90.8 99.8 90.9 99.7 98.7 102.6
CENTRAL ASIA17 . Kazakhstan 137.3 90.2 88.6 100.6 107.4 106.018 . Tajikistan 124.7 113.2 97.1 89.8 104.5 123.719 . Uzbekistan 92.1 95.4 92.0 96.3 102.0 108.3
OTHER ASIA20 . Afghanistan - - - - - -21 . China 69.0 78.0 87.6 96.2 103.4 111.622 . DPR Korea 119.5 88.3 80.6 98.0 106.1 107.923 . Iran (Islamic Rep. of) 83.2 86.1 90.2 100.9 98.9 110.724 . Mongolia 80.5 79.8 88.8 106.8 83.8 99.525 . Rep. of Korea 84.0 86.1 95.5 98.8 100.8 94.1
PACIFIC ISLANDS26 . Cook Islands - - - - - -27 . Fiji Islands 99.4 107.9 100.2 102.3 96.1 99.128 . Kiribati 83.2 83.9 97.8 103.6 98.9 103.029 . Marshall Islands - - - - - -30 . Micronesia, Fed States of - 100.0 100.0 100.0 100.0 100.131 . Nauru - - - - - -32 . Niue - - - - - -33 . Palau - - - - - -34 . Papua New Guinea 85.2 86.1 91.9 97.7 101.4 104.935 . Samoa 83.8 91.0 102.7 97.3 102.0 101.436 . Solomon Islands 77.0 85.4 90.8 94.9 103.4 105.537 . Tonga 128.2 97.0 100.6 100.8 100.0 103.138 . Tuvalu - - - - - -39 . Vanuatu 103.6 107.6 126.7 109.6 86.3 93.0
DEVELOPED COUNTRIES40 . Australia 76.2 78.7 87.2 99.8 103.0 98.841 . Japan 101.7 106.2 104.3 100.8 98.6 96.242 . New Zealand 83.2 89.9 97.7 93.8 105.3 113.1
ASIA & PACIFIC* 75.9 82.7 89.7 97.2 102.6 108.2
WORLD 83.0 87.1 93.0 98.3 101.4 105.3
* Including all products that are considered edible and contains nutrients
- 18 -
Country
STAPLE FOOD CROPS
A. Cereals
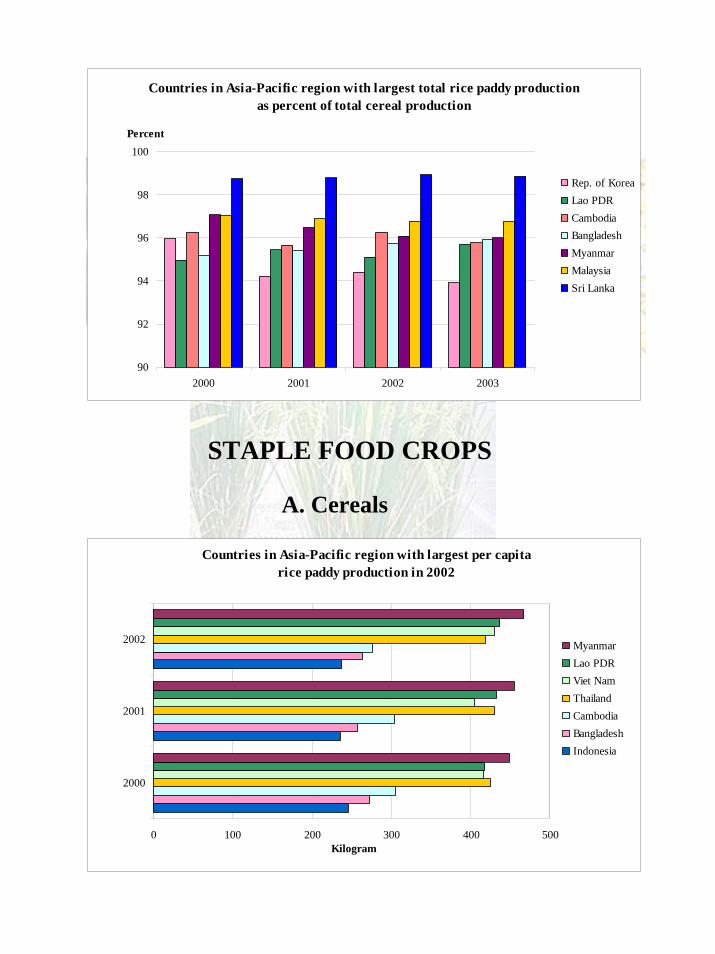
Countries in Asia-Pacific region with largest per capita rice paddy production in 2002
0 100 200 300 400 500
2000
2001
2002
Kilogram
MyanmarLao PDRViet NamThailandCambodiaBangladeshIndonesia
Countries in Asia-Pacific region with largest total rice paddy production as percent of total cereal production
90
92
94
96
98
100
2000 2001 2002 2003
Percent
Rep. of KoreaLao PDRCambodiaBangladeshMyanmarMalaysiaSri Lanka
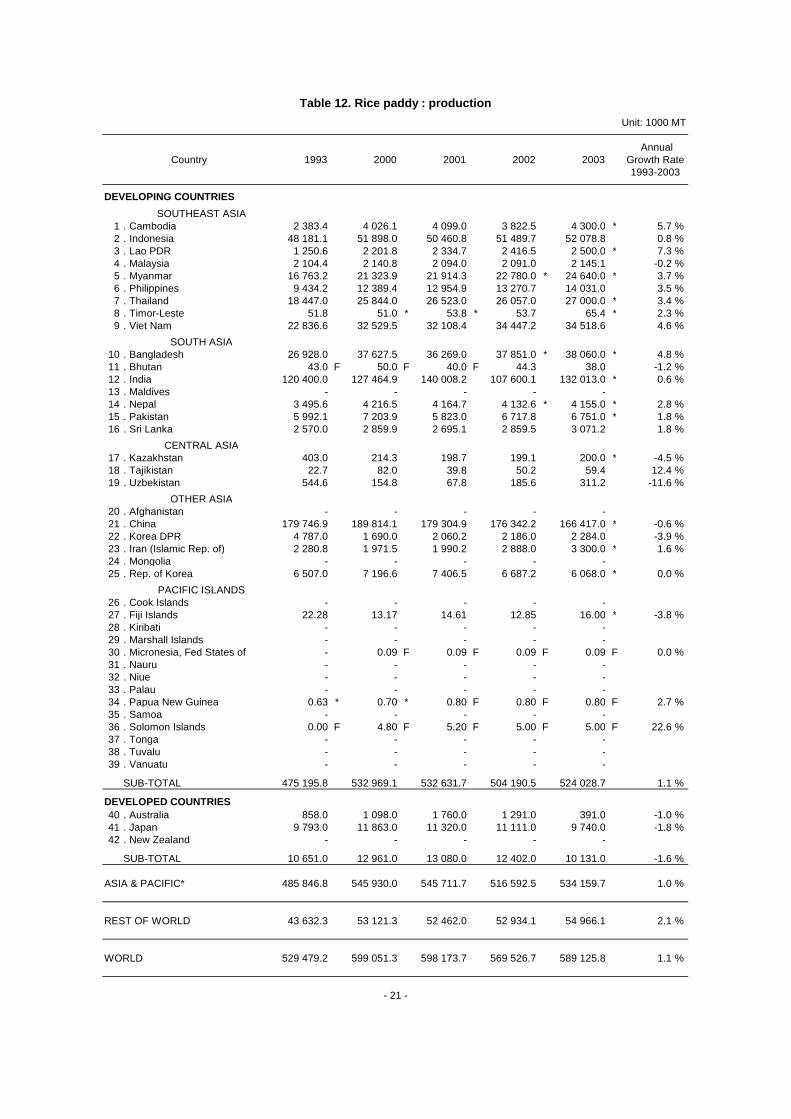
Unit: 1000 MT
AnnualCountry 1993 2000 2001 2002 2003 Growth Rate
1993-2003
DEVELOPING COUNTRIES
SOUTHEAST ASIA1 . Cambodia 2 383.4 4 026.1 4 099.0 3 822.5 4 300.0 * 5.7 %2 . Indonesia 48 181.1 51 898.0 50 460.8 51 489.7 52 078.8 0.8 %3 . Lao PDR 1 250.6 2 201.8 2 334.7 2 416.5 2 500.0 * 7.3 %4 . Malaysia 2 104.4 2 140.8 2 094.0 2 091.0 2 145.1 -0.2 %5 . Myanmar 16 763.2 21 323.9 21 914.3 22 780.0 * 24 640.0 * 3.7 %6 . Philippines 9 434.2 12 389.4 12 954.9 13 270.7 14 031.0 3.5 %7 . Thailand 18 447.0 25 844.0 26 523.0 26 057.0 27 000.0 * 3.4 %8 . Timor-Leste 51.8 51.0 * 53.8 * 53.7 65.4 * 2.3 %9 . Viet Nam 22 836.6 32 529.5 32 108.4 34 447.2 34 518.6 4.6 %
SOUTH ASIA10 . Bangladesh 26 928.0 37 627.5 36 269.0 37 851.0 * 38 060.0 * 4.8 %11 . Bhutan 43.0 F 50.0 F 40.0 F 44.3 38.0 -1.2 %12 . India 120 400.0 127 464.9 140 008.2 107 600.1 132 013.0 * 0.6 %13 . Maldives - - - - -14 . Nepal 3 495.6 4 216.5 4 164.7 4 132.6 * 4 155.0 * 2.8 %15 . Pakistan 5 992.1 7 203.9 5 823.0 6 717.8 6 751.0 * 1.8 %16 . Sri Lanka 2 570.0 2 859.9 2 695.1 2 859.5 3 071.2 1.8 %
CENTRAL ASIA17 . Kazakhstan 403.0 214.3 198.7 199.1 200.0 * -4.5 %18 . Tajikistan 22.7 82.0 39.8 50.2 59.4 12.4 %19 . Uzbekistan 544.6 154.8 67.8 185.6 311.2 -11.6 %
OTHER ASIA20 . Afghanistan - - - - -21 . China 179 746.9 189 814.1 179 304.9 176 342.2 166 417.0 * -0.6 %22 . Korea DPR 4 787.0 1 690.0 2 060.2 2 186.0 2 284.0 -3.9 %23 . Iran (Islamic Rep. of) 2 280.8 1 971.5 1 990.2 2 888.0 3 300.0 * 1.6 %24 . Mongolia - - - - -25 . Rep. of Korea 6 507.0 7 196.6 7 406.5 6 687.2 6 068.0 * 0.0 %
PACIFIC ISLANDS26 . Cook Islands - - - - -27 . Fiji Islands 22.28 13.17 14.61 12.85 16.00 * -3.8 %28 . Kiribati - - - - -29 . Marshall Islands - - - - -30 . Micronesia, Fed States of - 0.09 F 0.09 F 0.09 F 0.09 F 0.0 %31 . Nauru - - - - -32 . Niue - - - - -33 . Palau - - - - -34 . Papua New Guinea 0.63 * 0.70 * 0.80 F 0.80 F 0.80 F 2.7 %35 . Samoa - - - - -36 . Solomon Islands 0.00 F 4.80 F 5.20 F 5.00 F 5.00 F 22.6 %37 . Tonga - - - - -38 . Tuvalu - - - - -39 . Vanuatu - - - - -
SUB-TOTAL 475 195.8 532 969.1 532 631.7 504 190.5 524 028.7 1.1 %
DEVELOPED COUNTRIES40 . Australia 858.0 1 098.0 1 760.0 1 291.0 391.0 -1.0 %41 . Japan 9 793.0 11 863.0 11 320.0 11 111.0 9 740.0 -1.8 %42 . New Zealand - - - - -
SUB-TOTAL 10 651.0 12 961.0 13 080.0 12 402.0 10 131.0 -1.6 %
ASIA & PACIFIC* 485 846.8 545 930.0 545 711.7 516 592.5 534 159.7 1.0 %
REST OF WORLD 43 632.3 53 121.3 52 462.0 52 934.1 54 966.1 2.1 %
WORLD 529 479.2 599 051.3 598 173.7 569 526.7 589 125.8 1.1 %
- 21 -
Table 12. Rice paddy : production

Unit: kg/ha
AnnualCountry 1993 2000 2001 2002 2003 Growth Rate
1993-2003
DEVELOPING COUNTRIES
SOUTHEAST ASIA1 . Cambodia 1 307 2 115 2 070 1 916 2 150 4.0 %2 . Indonesia 4 375 4 401 4 388 4 469 4 538 0.3 %3 . Lao PDR 2 322 3 047 3 126 3 086 3 316 3.3 %4 . Malaysia 3 035 3 062 3 139 3 090 3 178 0.1 %5 . Myanmar 3 055 3 383 3 417 3 674 3 705 2.0 %6 . Philippines 2 874 3 068 3 187 3 280 3 427 1.8 %7 . Thailand 2 175 2 613 2 619 2 609 2 455 1.3 %8 . Timor-Leste 2 745 3 000 3 167 3 396 3 272 2.6 %9 . Viet Nam 3 482 4 243 4 285 4 590 4 634 2.9 %
SOUTH ASIA10 . Bangladesh 2 718 3 484 3 402 3 423 3 429 3.5 %11 . Bhutan 1 654 1 667 2 000 2 332 2 111 3.0 %12 . India 2 830 2 851 3 138 2 683 3 000 0.6 %13 . Maldives - - - - -14 . Nepal 2 410 2 703 2 745 2 675 2 681 1.9 %15 . Pakistan 2 740 3 031 2 754 3 018 3 055 1.5 %16 . Sri Lanka 3 135 3 437 3 523 3 489 3 370 1.4 %
CENTRAL ASIA17 . Kazakhstan 3 687 2 972 2 871 3 029 2 500 -0.5 %18 . Tajikistan 1 831 4 115 2 796 4 180 5 215 11.4 %19 . Uzbekistan 3 014 1 239 1 233 3 099 2 615 -2.8 %
OTHER ASIA20 . Afghanistan - - - - -21 . China 5 846 6 264 6 152 6 186 6 074 0.5 %22 . Korea DPR 8 127 3 159 3 602 3 750 3 849 -3.7 %23 . Iran (Islamic Rep. of) 3 876 3 690 3 866 4 727 5 893 2.0 %24 . Mongolia - - - - -25 . Rep. of Korea 5 733 6 711 6 838 6 350 5 990 0.5 %
PACIFIC ISLANDS26 . Cook Islands - - - - -27 . Fiji Islands 2 356 2 498 2 435 2 570 2 462 1.0 %28 . Kiribati - - - - -29 . Marshall Islands - - - - -30 . Micronesia, Fed States of - 1 125 1 125 1 125 1 125 0.0 %31 . Nauru - - - - -32 . Niue - - - - -33 . Palau - - - - -34 . Papua New Guinea 1 800 2 000 2 000 2 286 2 000 1.7 %35 . Samoa - - - - -36 . Solomon Islands - 4 000 4 000 3 846 3 846 -0.7 %37 . Tonga - - - - -38 . Tuvalu - - - - -39 . Vanuatu - - - - -
AVERAGE 3 707 3 919 3 970 3 896 3 920 0.7 %
DEVELOPED COUNTRIES40 . Australia 8 060 8 237 9 462 8 607 10 289 2.0 %41 . Japan 4 578 6 702 6 635 6 582 5 850 1.2 %42 . New Zealand - - - - -
AVERAGE 4 743 6 810 6 913 6 748 5 949 1.2 %
ASIA & PACIFIC* 3 725 3 958 4 011 3 936 3 945 0.7 %
REST OF WORLD 2 837 3 278 3 359 3 245 3 032 1.2 %
WORLD 3 631 3 887 3 944 3 860 3 837 0.7 %
- 22 -
Table 13. Rice paddy : yield
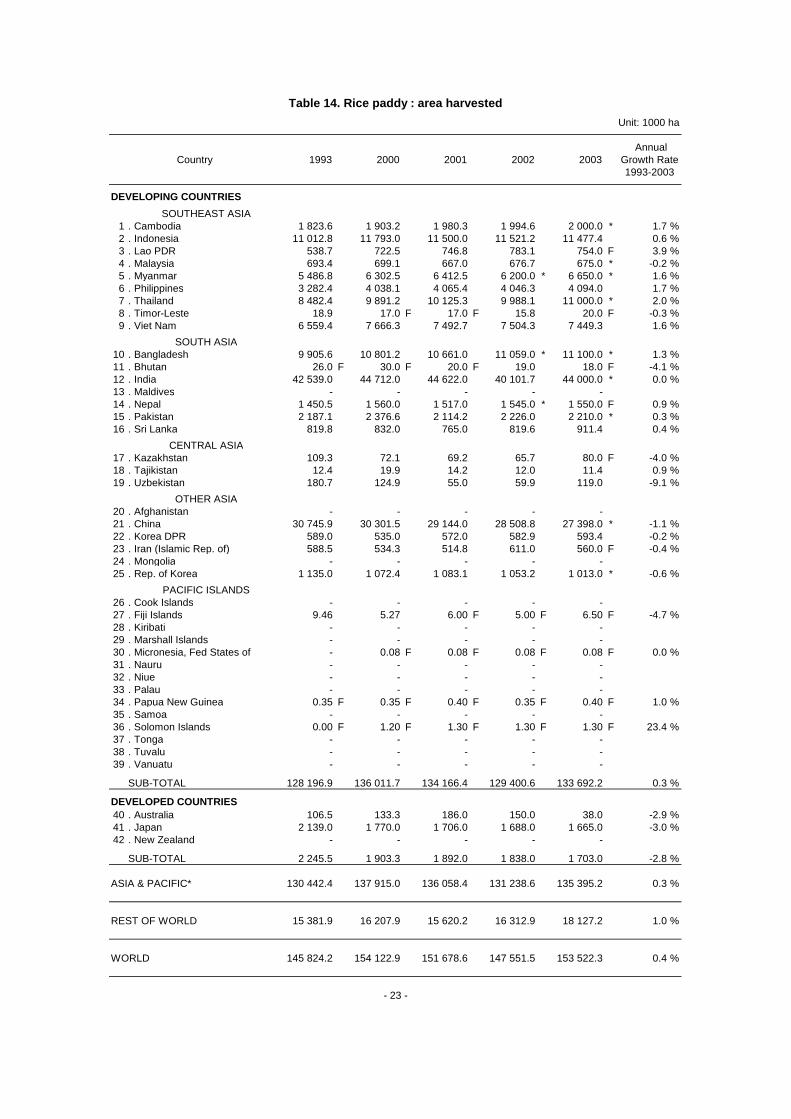
Unit: 1000 ha
AnnualCountry 1993 2000 2001 2002 2003 Growth Rate
1993-2003
DEVELOPING COUNTRIES
SOUTHEAST ASIA1 . Cambodia 1 823.6 1 903.2 1 980.3 1 994.6 2 000.0 * 1.7 %2 . Indonesia 11 012.8 11 793.0 11 500.0 11 521.2 11 477.4 0.6 %3 . Lao PDR 538.7 722.5 746.8 783.1 754.0 F 3.9 %4 . Malaysia 693.4 699.1 667.0 676.7 675.0 * -0.2 %5 . Myanmar 5 486.8 6 302.5 6 412.5 6 200.0 * 6 650.0 * 1.6 %6 . Philippines 3 282.4 4 038.1 4 065.4 4 046.3 4 094.0 1.7 %7 . Thailand 8 482.4 9 891.2 10 125.3 9 988.1 11 000.0 * 2.0 %8 . Timor-Leste 18.9 17.0 F 17.0 F 15.8 20.0 F -0.3 %9 . Viet Nam 6 559.4 7 666.3 7 492.7 7 504.3 7 449.3 1.6 %
SOUTH ASIA10 . Bangladesh 9 905.6 10 801.2 10 661.0 11 059.0 * 11 100.0 * 1.3 %11 . Bhutan 26.0 F 30.0 F 20.0 F 19.0 18.0 F -4.1 %12 . India 42 539.0 44 712.0 44 622.0 40 101.7 44 000.0 * 0.0 %13 . Maldives - - - - -14 . Nepal 1 450.5 1 560.0 1 517.0 1 545.0 * 1 550.0 F 0.9 %15 . Pakistan 2 187.1 2 376.6 2 114.2 2 226.0 2 210.0 * 0.3 %16 . Sri Lanka 819.8 832.0 765.0 819.6 911.4 0.4 %
CENTRAL ASIA17 . Kazakhstan 109.3 72.1 69.2 65.7 80.0 F -4.0 %18 . Tajikistan 12.4 19.9 14.2 12.0 11.4 0.9 %19 . Uzbekistan 180.7 124.9 55.0 59.9 119.0 -9.1 %
OTHER ASIA20 . Afghanistan - - - - -21 . China 30 745.9 30 301.5 29 144.0 28 508.8 27 398.0 * -1.1 %22 . Korea DPR 589.0 535.0 572.0 582.9 593.4 -0.2 %23 . Iran (Islamic Rep. of) 588.5 534.3 514.8 611.0 560.0 F -0.4 %24 . Mongolia - - - - -25 . Rep. of Korea 1 135.0 1 072.4 1 083.1 1 053.2 1 013.0 * -0.6 %
PACIFIC ISLANDS26 . Cook Islands - - - - -27 . Fiji Islands 9.46 5.27 6.00 F 5.00 F 6.50 F -4.7 %28 . Kiribati - - - - -29 . Marshall Islands - - - - -30 . Micronesia, Fed States of - 0.08 F 0.08 F 0.08 F 0.08 F 0.0 %31 . Nauru - - - - -32 . Niue - - - - -33 . Palau - - - - -34 . Papua New Guinea 0.35 F 0.35 F 0.40 F 0.35 F 0.40 F 1.0 %35 . Samoa - - - - -36 . Solomon Islands 0.00 F 1.20 F 1.30 F 1.30 F 1.30 F 23.4 %37 . Tonga - - - - -38 . Tuvalu - - - - -39 . Vanuatu - - - - -
SUB-TOTAL 128 196.9 136 011.7 134 166.4 129 400.6 133 692.2 0.3 %
DEVELOPED COUNTRIES40 . Australia 106.5 133.3 186.0 150.0 38.0 -2.9 %41 . Japan 2 139.0 1 770.0 1 706.0 1 688.0 1 665.0 -3.0 %42 . New Zealand - - - - -
SUB-TOTAL 2 245.5 1 903.3 1 892.0 1 838.0 1 703.0 -2.8 %
ASIA & PACIFIC* 130 442.4 137 915.0 136 058.4 131 238.6 135 395.2 0.3 %
REST OF WORLD 15 381.9 16 207.9 15 620.2 16 312.9 18 127.2 1.0 %
WORLD 145 824.2 154 122.9 151 678.6 147 551.5 153 522.3 0.4 %
- 23 -
Table 14. Rice paddy : area harvested
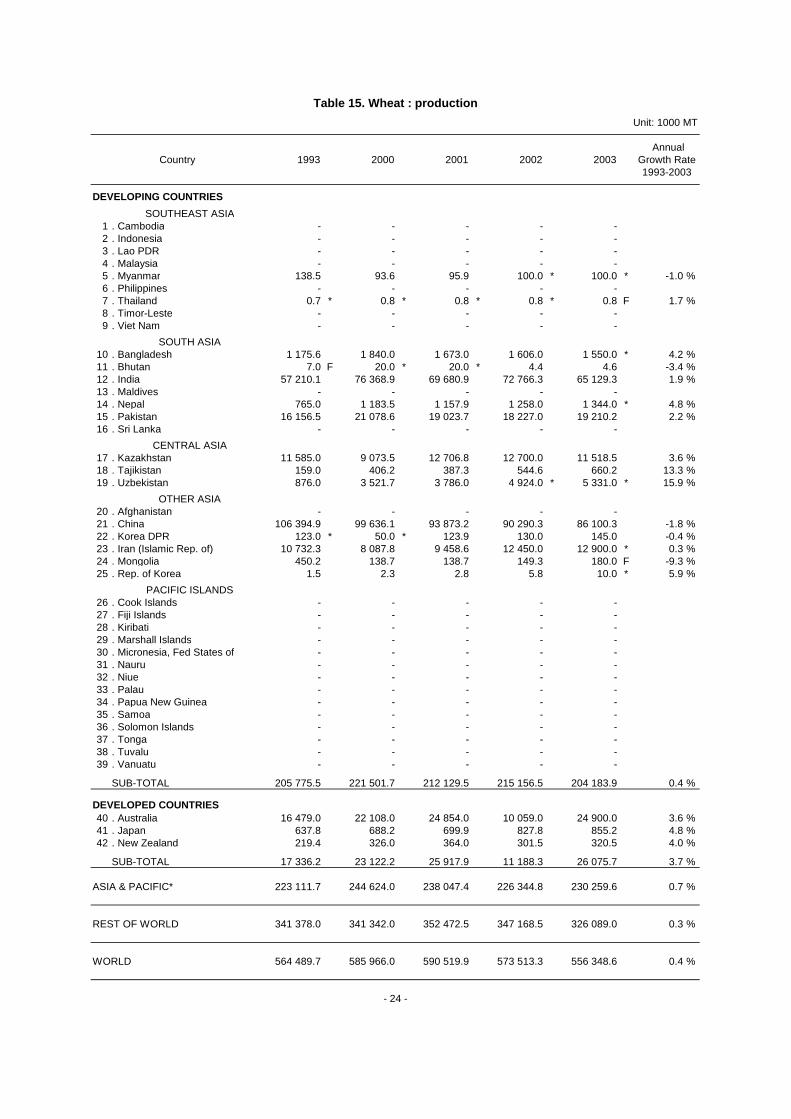
Unit: 1000 MT
AnnualCountry 1993 2000 2001 2002 2003 Growth Rate
1993-2003
DEVELOPING COUNTRIES
SOUTHEAST ASIA1 . Cambodia - - - - -2 . Indonesia - - - - -3 . Lao PDR - - - - -4 . Malaysia - - - - -5 . Myanmar 138.5 93.6 95.9 100.0 * 100.0 * -1.0 %6 . Philippines - - - - -7 . Thailand 0.7 * 0.8 * 0.8 * 0.8 * 0.8 F 1.7 %8 . Timor-Leste - - - - -9 . Viet Nam - - - - -
SOUTH ASIA10 . Bangladesh 1 175.6 1 840.0 1 673.0 1 606.0 1 550.0 * 4.2 %11 . Bhutan 7.0 F 20.0 * 20.0 * 4.4 4.6 -3.4 %12 . India 57 210.1 76 368.9 69 680.9 72 766.3 65 129.3 1.9 %13 . Maldives - - - - -14 . Nepal 765.0 1 183.5 1 157.9 1 258.0 1 344.0 * 4.8 %15 . Pakistan 16 156.5 21 078.6 19 023.7 18 227.0 19 210.2 2.2 %16 . Sri Lanka - - - - -
CENTRAL ASIA17 . Kazakhstan 11 585.0 9 073.5 12 706.8 12 700.0 11 518.5 3.6 %18 . Tajikistan 159.0 406.2 387.3 544.6 660.2 13.3 %19 . Uzbekistan 876.0 3 521.7 3 786.0 4 924.0 * 5 331.0 * 15.9 %
OTHER ASIA20 . Afghanistan - - - - -21 . China 106 394.9 99 636.1 93 873.2 90 290.3 86 100.3 -1.8 %22 . Korea DPR 123.0 * 50.0 * 123.9 130.0 145.0 -0.4 %23 . Iran (Islamic Rep. of) 10 732.3 8 087.8 9 458.6 12 450.0 12 900.0 * 0.3 %24 . Mongolia 450.2 138.7 138.7 149.3 180.0 F -9.3 %25 . Rep. of Korea 1.5 2.3 2.8 5.8 10.0 * 5.9 %
PACIFIC ISLANDS26 . Cook Islands - - - - -27 . Fiji Islands - - - - -28 . Kiribati - - - - -29 . Marshall Islands - - - - -30 . Micronesia, Fed States of - - - - -31 . Nauru - - - - -32 . Niue - - - - -33 . Palau - - - - -34 . Papua New Guinea - - - - -35 . Samoa - - - - -36 . Solomon Islands - - - - -37 . Tonga - - - - -38 . Tuvalu - - - - -39 . Vanuatu - - - - -
SUB-TOTAL 205 775.5 221 501.7 212 129.5 215 156.5 204 183.9 0.4 %
DEVELOPED COUNTRIES40 . Australia 16 479.0 22 108.0 24 854.0 10 059.0 24 900.0 3.6 %41 . Japan 637.8 688.2 699.9 827.8 855.2 4.8 %42 . New Zealand 219.4 326.0 364.0 301.5 320.5 4.0 %
SUB-TOTAL 17 336.2 23 122.2 25 917.9 11 188.3 26 075.7 3.7 %
ASIA & PACIFIC* 223 111.7 244 624.0 238 047.4 226 344.8 230 259.6 0.7 %
REST OF WORLD 341 378.0 341 342.0 352 472.5 347 168.5 326 089.0 0.3 %
WORLD 564 489.7 585 966.0 590 519.9 573 513.3 556 348.6 0.4 %
- 24 -
Table 15. Wheat : production
Unit: kg/ha
AnnualCountry 1993 2000 2001 2002 2003 Growth Rate
1993-2003
DEVELOPING COUNTRIES
SOUTHEAST ASIA1 . Cambodia - - - - -2 . Indonesia - - - - -3 . Lao PDR - - - - -4 . Malaysia - - - - -5 . Myanmar 953 1 167 1 210 1 111 1 111 3.1 %6 . Philippines - - - - -7 . Thailand 617 667 667 615 615 -0.4 %8 . Timor-Leste - - - - -9 . Viet Nam - - - - -
SOUTH ASIA10 . Bangladesh 1 846 2 210 2 164 2 164 1 992 1.5 %11 . Bhutan 1 167 1 538 1 538 946 1 136 -0.5 %12 . India 2 327 2 778 2 708 2 762 2 617 1.4 %13 . Maldives - - - - -14 . Nepal 1 246 1 793 1 806 1 886 1 976 4.0 %15 . Pakistan 1 947 2 491 2 325 2 262 2 381 2.3 %16 . Sri Lanka - - - - -
CENTRAL ASIA17 . Kazakhstan 918 903 1 180 1 090 1 023 4.8 %18 . Tajikistan 800 1 184 1 187 1 790 1 972 6.4 %19 . Uzbekistan 1 256 2 642 3 000 4 385 3 537 11.1 %
OTHER ASIA20 . Afghanistan - - - - -21 . China 3 519 3 738 3 806 3 777 3 907 1.0 %22 . Korea DPR 1 367 847 2 163 2 063 2 500 5.1 %23 . Iran (Islamic Rep. of) 1 493 1 586 1 703 1 995 1 985 2.2 %24 . Mongolia 904 777 749 684 818 -0.7 %25 . Rep. of Korea 2 711 2 545 3 105 3 227 3 048 -1.8 %
PACIFIC ISLANDS26 . Cook Islands - - - - -27 . Fiji Islands - - - - -28 . Kiribati - - - - -29 . Marshall Islands - - - - -30 . Micronesia, Fed States of - - - - -31 . Nauru - - - - -32 . Niue - - - - -33 . Palau - - - - -34 . Papua New Guinea - - - - -35 . Samoa - - - - -36 . Solomon Islands - - - - -37 . Tonga - - - - -38 . Tuvalu - - - - -39 . Vanuatu - - - - -
AVERAGE 2 398 2 726 2 711 2 709 2 671 1.4 %
DEVELOPED COUNTRIES40 . Australia 1 966 1 821 2 143 911 1 999 -0.5 %41 . Japan 3 474 3 761 3 555 4 001 4 030 1.8 %42 . New Zealand 5 626 6 210 7 429 7 152 7 419 3.4 %
AVERAGE 2 015 1 868 2 188 991 2 051 -0.4 %
ASIA & PACIFIC* 2 363 2 613 2 643 2 495 2 583 1.1 %
REST OF WORLD 2 656 2 800 2 829 2 823 2 726 0.8 %
WORLD 2 532 2 719 2 751 2 684 2 665 0.9 %
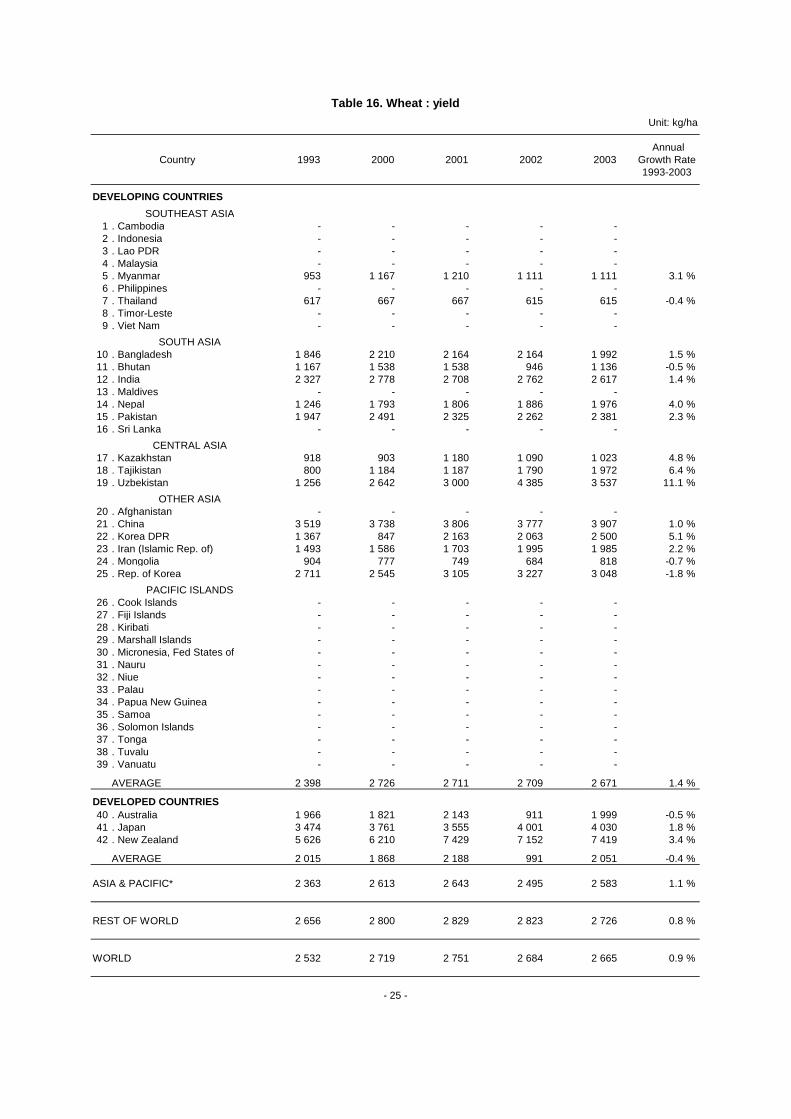
- 25 -
Table 16. Wheat : yield
Unit: 1000 ha
AnnualCountry 1993 2000 2001 2002 2003 Growth Rate
1993-2003
DEVELOPING COUNTRIES
SOUTHEAST ASIA1 . Cambodia - - - - -2 . Indonesia - - - - -3 . Lao PDR - - - - -4 . Malaysia - - - - -5 . Myanmar 145.4 80.2 79.3 90.0 * 90.0 * -3.9 %6 . Philippines - - - - -7 . Thailand 1.2 F 1.2 F 1.2 F 1.3 F 1.3 F 2.1 %8 . Timor-Leste - - - - -9 . Viet Nam - - - - -
SOUTH ASIA10 . Bangladesh 636.9 832.4 773.0 742.0 778.0 * 2.7 %11 . Bhutan 6.0 F 13.0 * 13.0 * 4.6 4.0 -2.9 %12 . India 24 588.9 27 486.0 25 730.6 26 344.7 24 886.2 0.5 %13 . Maldives - - - - -14 . Nepal 614.0 660.0 641.0 667.1 680.0 F 0.8 %15 . Pakistan 8 299.7 8 463.0 8 180.8 8 057.5 8 069.0 -0.1 %16 . Sri Lanka - - - - -
CENTRAL ASIA17 . Kazakhstan 12 622.0 10 050.1 10 766.1 11 656.5 11 262.3 -1.2 %18 . Tajikistan 198.8 343.1 326.4 304.3 334.9 6.4 %19 . Uzbekistan 697.4 1 333.1 1 262.0 1 123.0 * 1 507.0 4.4 %
OTHER ASIA20 . Afghanistan - - - - -21 . China 30 236.4 26 653.3 24 664.1 23 908.1 22 040.1 * -2.8 %22 . Korea DPR 90.0 F 59.0 * 57.3 63.0 58.0 -5.2 %23 . Iran (Islamic Rep. of) 7 190.1 5 100.7 5 553.1 6 241.0 6 500.0 * -1.9 %24 . Mongolia 498.1 178.6 185.1 218.2 220.0 F -8.7 %25 . Rep. of Korea .5 .9 .9 1.8 3.3 * 7.9 %
PACIFIC ISLANDS26 . Cook Islands - - - - -27 . Fiji Islands - - - - -28 . Kiribati - - - - -29 . Marshall Islands - - - - -30 . Micronesia, Fed States of - - - - -31 . Nauru - - - - -32 . Niue - - - - -33 . Palau - - - - -34 . Papua New Guinea - - - - -35 . Samoa - - - - -36 . Solomon Islands - - - - -37 . Tonga - - - - -38 . Tuvalu - - - - -39 . Vanuatu - - - - -
SUB-TOTAL 85 825.4 81 254.7 78 233.8 79 423.1 76 434.1 -1.0 %
DEVELOPED COUNTRIES40 . Australia 8 383.0 12 141.0 11 597.0 11 045.0 12 456.0 4.1 %41 . Japan 183.6 183.0 196.9 206.9 212.2 2.9 %42 . New Zealand 39.0 F 52.5 49.0 42.2 43.2 0.5 %
SUB-TOTAL 8 605.6 12 376.5 11 842.9 11 294.1 12 711.4 4.0 %
ASIA & PACIFIC* 94 431.0 93 631.2 90 076.7 90 717.1 89 145.5 -0.5 %
REST OF WORLD 128 522.5 121 887.4 124 612.8 122 999.2 119 619.5 -0.5 %
WORLD 222 953.5 215 518.7 214 689.5 213 716.4 208 765.0 -0.5 %
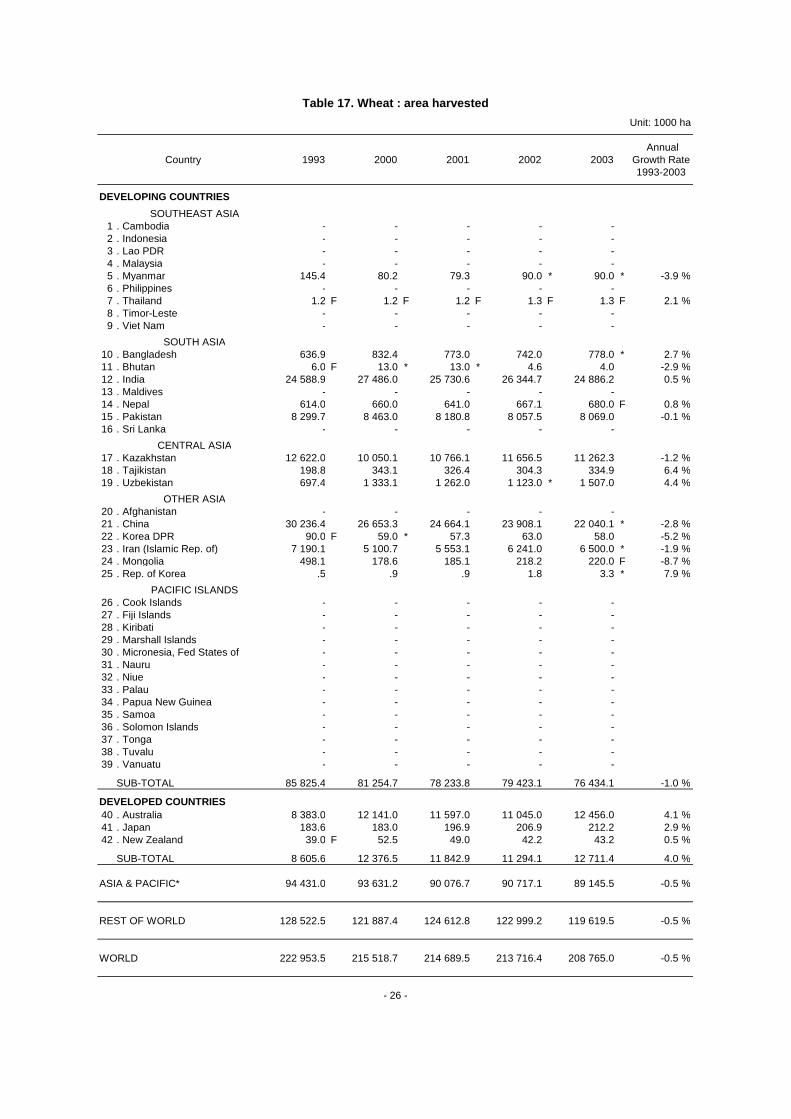
- 26 -
Table 17. Wheat : area harvested
Unit: 1000 MT
AnnualCountry 1993 2000 2001 2002 2003 Growth Rate
1993-2003
DEVELOPING COUNTRIES
SOUTHEAST ASIA1 . Cambodia 45.4 157.0 185.6 148.9 190.0 * 18.0 %2 . Indonesia 6 459.7 9 677.0 9 347.2 9 654.1 10 910.1 4.2 %3 . Lao PDR 47.6 117.0 111.9 124.1 112.0 * 10.6 %4 . Malaysia 38.0 * 65.0 * 67.0 * 70.0 * 72.0 * 7.2 %5 . Myanmar 204.6 362.7 532.4 660.0 * 750.0 * 12.0 %6 . Philippines 4 798.0 4 511.1 4 525.0 4 319.3 4 478.2 0.2 %7 . Thailand 3 328.0 4 462.0 4 466.0 4 230.0 4 500.0 * 1.9 %8 . Timor-Leste 104.5 88.4 * 69.0 * 93.7 70.2 * -3.8 %9 . Viet Nam 882.2 2 005.9 2 161.7 2 511.2 2 933.7 11.1 %
SOUTH ASIA10 . Bangladesh 2.7 10.0 10.0 F 10.0 F 10.0 F 19.3 %11 . Bhutan 50.0 F 70.0 * 60.0 F 48.5 42.0 * -2.4 %12 . India 9 601.0 12 043.2 13 160.2 11 166.9 14 800.0 * 4.0 %13 . Maldives .0 * .0 F .0 F .0 F .0 F -29.3 %14 . Nepal 1 210.0 1 414.9 1 484.1 1 510.8 1 441.0 * 2.1 %15 . Pakistan 1 213.0 1 643.2 1 664.4 1 737.1 1 275.0 * 1.8 %16 . Sri Lanka 31.7 31.1 28.8 26.4 29.9 -1.4 %
CENTRAL ASIA17 . Kazakhstan 355.0 248.8 320.4 435.2 438.0 * 7.6 %18 . Tajikistan 33.5 37.8 34.3 55.4 94.9 9.4 %19 . Uzbekistan 403.6 131.4 100.0 * 140.0 * 136.0 * -8.6 %
OTHER ASIA20 . Afghanistan - - - - -21 . China 103 110.0 106 178.3 114 254.0 121 498.9 114 175.0 1.1 %22 . Korea DPR 3 937.0 1 041.0 1 483.0 1 651.0 1 725.0 -5.6 %23 . Iran (Islamic Rep. of) 210.0 1 119.7 1 064.2 1 450.0 F 1 800.0 F 18.1 %24 . Mongolia - - - - -25 . Rep. of Korea 82.1 64.2 57.0 73.2 70.0 * -2.4 %
PACIFIC ISLANDS26 . Cook Islands - - - - -27 . Fiji Islands 0.52 0.98 1.00 F 1.10 F 1.30 F -0.9 %28 . Kiribati - - - - -29 . Marshall Islands - - - - -30 . Micronesia, Fed States of - 0.05 F 0.05 F 0.05 F 0.05 F 0.0 %31 . Nauru - - - - -32 . Niue - - - - -33 . Palau - - - - -34 . Papua New Guinea 4.00 F 7.20 F 8.30 F 8.50 F 6.00 * 6.3 %35 . Samoa - - - - -36 . Solomon Islands - - - - -37 . Tonga - - - - -38 . Tuvalu - - - - -39 . Vanuatu 0.67 F 0.70 F 0.70 F 0.70 F 0.70 F 0.2 %
SUB-TOTAL 136 152.9 145 488.5 155 196.2 161 625.1 160 060.9 1.6 %
DEVELOPED COUNTRIES40 . Australia 198.8 406.0 345.0 457.0 316.0 6.5 %41 . Japan .5 F .2 F .2 F .2 F .2 F -10.6 %42 . New Zealand 133.1 181.0 176.8 148.8 158.0 0.9 %
SUB-TOTAL 332.4 587.2 522.0 606.0 474.2 4.5 %
ASIA & PACIFIC* 136 485.2 146 075.8 155 718.1 162 231.1 160 535.1 1.6 %
REST OF WORLD 340 226.4 446 667.8 459 379.5 441 931.3 477 508.4 2.3 %
WORLD 476 711.6 592 743.6 615 097.7 604 162.4 638 043.5 2.1 %
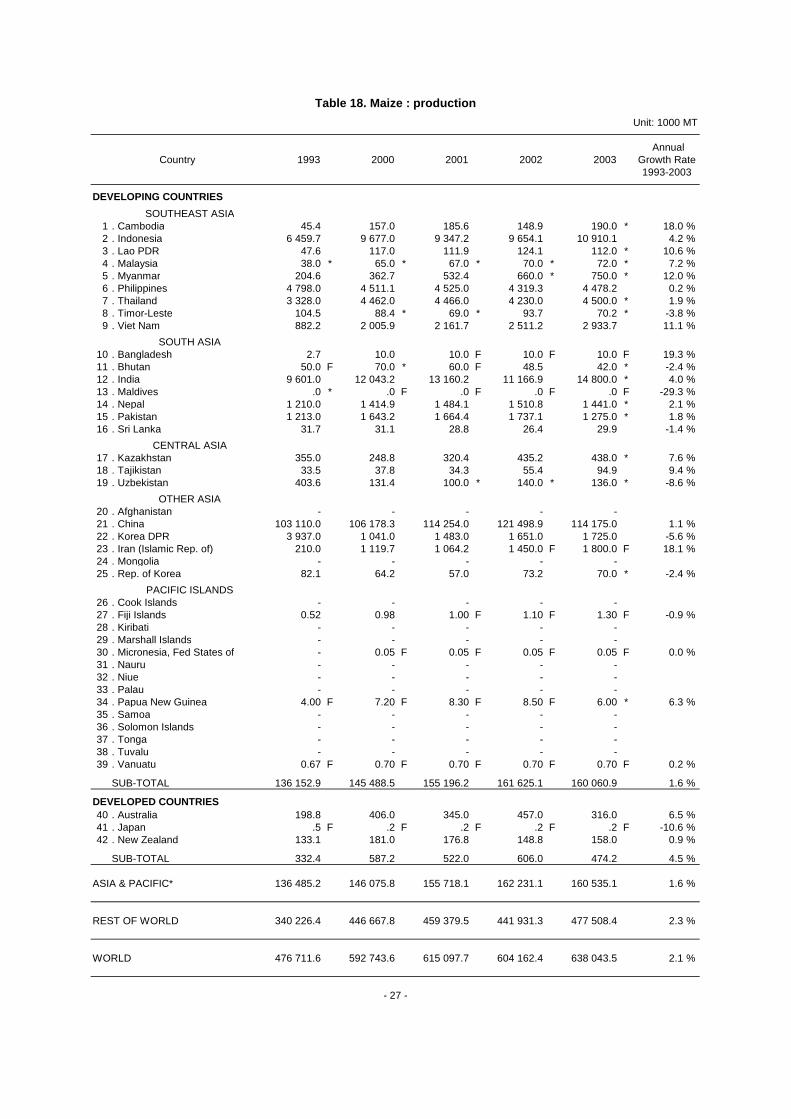
- 27 -
Table 18. Maize : production
Unit: kg/ha
AnnualCountry 1993 2000 2001 2002 2003 Growth Rate
1993-2003
DEVELOPING COUNTRIES
SOUTHEAST ASIA1 . Cambodia 1 058 2 735 2 761 2 080 2 111 9.2 %2 . Indonesia 2 198 2 765 2 845 3 088 3 252 3.9 %3 . Lao PDR 1 754 2 388 2 550 2 761 2 333 4.1 %4 . Malaysia 1 900 2 407 3 045 3 043 3 000 5.7 %5 . Myanmar 1 534 1 724 2 124 2 136 2 500 3.6 %6 . Philippines 1 524 1 797 1 820 1 803 1 802 2.2 %7 . Thailand 2 733 3 672 3 735 3 729 3 913 3.1 %8 . Timor-Leste 1 800 1 608 1 216 1 755 1 392 -2.5 %9 . Viet Nam 1 777 2 747 2 963 3 076 3 225 5.3 %
SOUTH ASIA10 . Bangladesh 935 2 060 2 000 2 000 2 000 10.7 %11 . Bhutan 1 111 1 556 1 579 1 565 1 591 2.1 %12 . India 1 602 1 822 2 000 1 676 2 114 2.6 %13 . Maldives 1 000 14 . Nepal 1 598 1 728 1 800 1 829 1 729 1.3 %15 . Pakistan 1 381 1 741 1 768 1 791 1 457 1.4 %16 . Sri Lanka 971 1 084 1 118 1 128 1 098 1.5 %
CENTRAL ASIA17 . Kazakhstan 3 266 3 335 3 713 4 135 4 380 7.3 %18 . Tajikistan 3 045 3 163 3 809 5 836 11 400 12.4 %19 . Uzbekistan 3 844 2 556 4 149 6 512 4 000 2.5 %
OTHER ASIA20 . Afghanistan - - - - -21 . China 4 964 4 599 4 700 4 927 4 854 -0.2 %22 . Korea DPR 6 269 2 099 2 988 3 326 3 485 -2.5 %23 . Iran (Islamic Rep. of) 3 908 6 166 6 161 7 250 8 571 4.9 %24 . Mongolia - - - - -25 . Rep. of Korea 4 184 4 062 4 012 4 222 4 118 -0.1 %
PACIFIC ISLANDS26 . Cook Islands - - - - -27 . Fiji Islands 922 2 448 2 222 2 444 2 549 3.8 %28 . Kiribati - - - - -29 . Marshall Islands - - - - -30 . Micronesia, Fed States of - 1 200 1 200 1 200 1 200 0.0 %31 . Nauru - - - - -32 . Niue - - - - -33 . Palau - - - - -34 . Papua New Guinea 3 077 5 538 5 533 5 667 4 615 5.5 %35 . Samoa - - - - -36 . Solomon Islands - - - - -37 . Tonga - - - - -38 . Tuvalu - - - - -39 . Vanuatu 515 538 538 538 538 0.2 %
AVERAGE 3 631 3 572 3 724 3 848 3 851 0.7 %
DEVELOPED COUNTRIES40 . Australia 4 426 4 936 4 662 5 506 5 267 0.9 %41 . Japan 2 500 2 466 2 500 2 462 2 462 -0.1 %42 . New Zealand 8 358 10 226 10 400 10 498 10 535 1.4 %
AVERAGE 5 446 5 870 5 732 6 232 6 317 0.3 %
ASIA & PACIFIC* 3 634 3 578 3 729 3 853 3 855 0.7 %
REST OF WORLD 3 619 4 586 4 723 4 595 4 726 2.1 %
WORLD 3 623 4 288 4 424 4 369 4 472 1.7 %
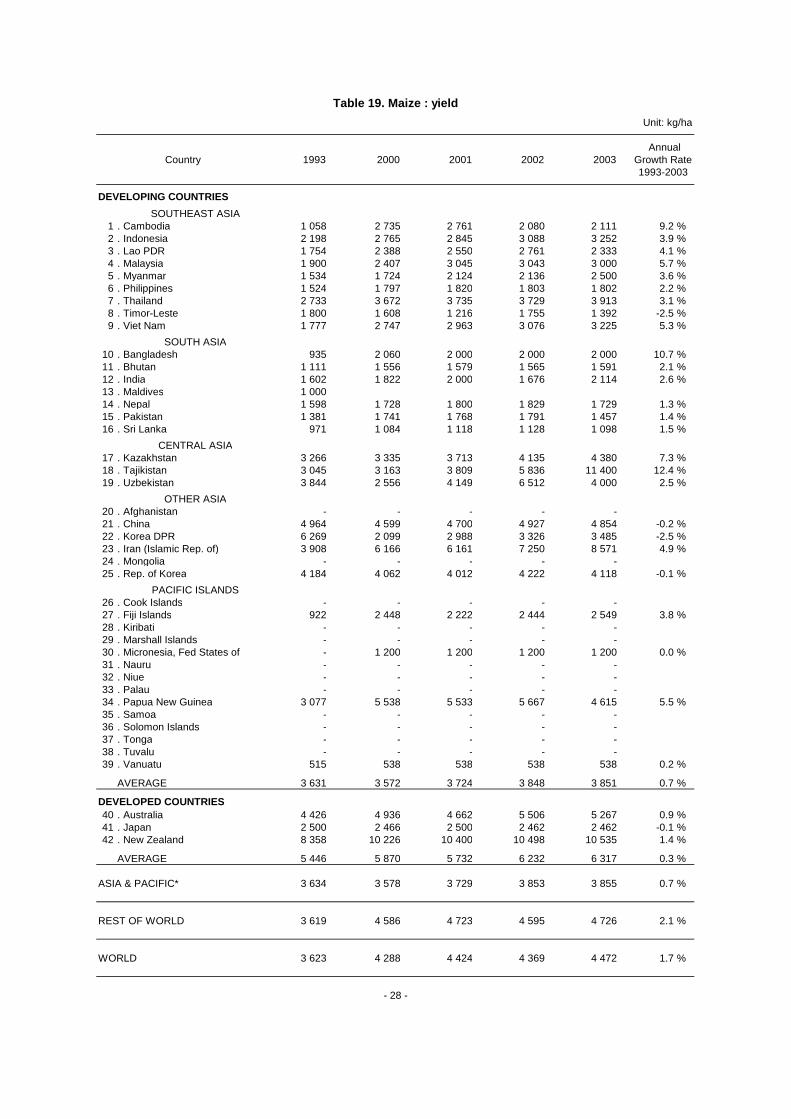
- 28 -
Table 19. Maize : yield
Unit: 1000 ha
AnnualCountry 1993 2000 2001 2002 2003 Growth Rate
1993-2003
DEVELOPING COUNTRIES
SOUTHEAST ASIA1 . Cambodia 42.9 57.4 67.2 71.6 90.0 F 8.0 %2 . Indonesia 2 939.5 3 500.0 3 285.9 3 126.8 3 354.7 0.2 %3 . Lao PDR 27.2 49.0 43.9 45.0 48.0 F 6.2 %4 . Malaysia 20.0 * 27.0 * 22.0 * 23.0 * 24.0 * 1.4 %5 . Myanmar 133.4 210.4 250.7 309.0 * 300.0 * 8.1 %6 . Philippines 3 149.2 2 510.3 2 486.6 2 395.5 2 485.0 * -1.9 %7 . Thailand 1 217.7 1 215.0 1 195.8 1 134.4 1 150.0 * -1.2 %8 . Timor-Leste 58.1 55.0 F 56.8 53.4 50.4 * -1.4 %9 . Viet Nam 496.5 730.2 729.5 816.4 909.8 5.5 %
SOUTH ASIA10 . Bangladesh 2.9 4.9 5.0 F 5.0 F 5.0 F 7.8 %11 . Bhutan 45.0 F 45.0 * 38.0 F 31.0 26.4 -4.4 %12 . India 5 995.0 6 611.3 6 581.5 6 662.3 7 000.0 * 1.4 %13 . Maldives .0 F .0 F .0 F .0 F .0 F -29.3 %14 . Nepal 757.0 819.0 824.5 826.0 833.3 * 0.9 %15 . Pakistan 878.5 944.0 941.6 970.0 875.0 * 0.4 %16 . Sri Lanka 32.6 28.6 25.7 23.4 27.2 -2.8 %
CENTRAL ASIA17 . Kazakhstan 108.7 74.6 86.3 105.2 100.0 F 0.3 %18 . Tajikistan 11.0 11.9 9.0 9.5 8.3 -2.7 %19 . Uzbekistan 105.0 51.4 24.1 * 21.5 * 34.0 -10.9 %
OTHER ASIA20 . Afghanistan - - - - -21 . China 20 770.8 23 086.4 24 310.7 24 661.0 23 520.0 * 1.3 %22 . Korea DPR 628.0 496.0 496.3 496.4 495.0 -3.1 %23 . Iran (Islamic Rep. of) 53.7 181.6 172.7 200.0 F 210.0 F 12.6 %24 . Mongolia - - - - -25 . Rep. of Korea 19.6 15.8 14.2 17.3 17.0 * -2.3 %
PACIFIC ISLANDS26 . Cook Islands - - - - -27 . Fiji Islands 0.57 0.40 F 0.45 F 0.45 F 0.51 F -4.5 %28 . Kiribati - - - - -29 . Marshall Islands - - - - -30 . Micronesia, Fed States of - 0.04 F 0.04 F 0.04 F 0.04 F 0.0 %31 . Nauru - - - - -32 . Niue - - - - -33 . Palau - - - - -34 . Papua New Guinea 1.30 F 1.30 F 1.50 F 1.50 F 1.30 F 0.7 %35 . Samoa - - - - -36 . Solomon Islands - - - - -37 . Tonga - - - - -38 . Tuvalu - - - - -39 . Vanuatu 1.30 F 1.30 F 1.30 F 1.30 F 1.30 F 0.0 %
SUB-TOTAL 37 495.5 40 728.0 41 671.3 42 006.9 41 566.3 0.9 %
DEVELOPED COUNTRIES40 . Australia 44.9 82.3 74.0 83.0 60.0 5.5 %41 . Japan .2 .1 .1 .1 F .1 F -10.5 %42 . New Zealand 15.9 17.7 17.0 14.2 15.0 -0.4 %
SUB-TOTAL 61.0 100.0 91.1 97.2 75.1 4.2 %
ASIA & PACIFIC* 37 556.6 40 828.0 41 762.3 42 104.2 41 641.3 0.9 %
REST OF WORLD 94 011.4 97 404.4 97 271.1 96 167.2 101 044.0 0.2 %
WORLD 131 568.0 138 232.4 139 033.5 138 271.4 142 685.3 0.4 %
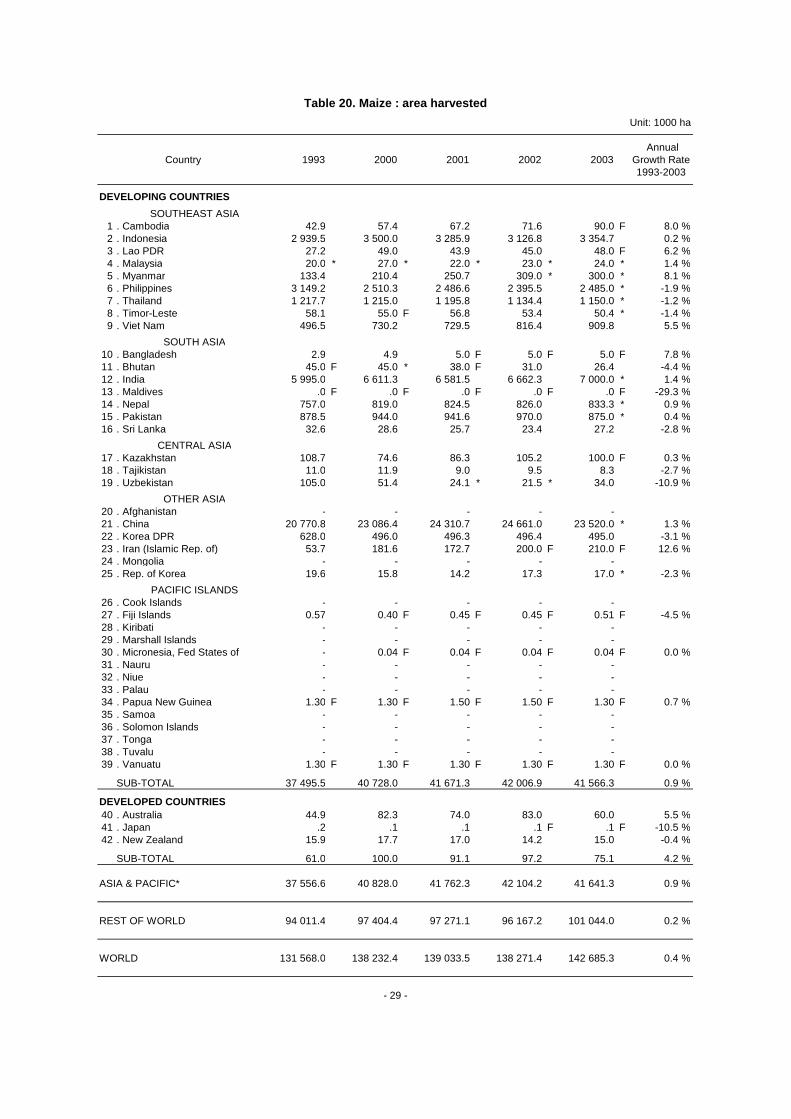
- 29 -
Table 20. Maize : area harvested
Unit: 1000 MT
AnnualCountry 1993 2000 2001 2002 2003 Growth Rate
1993-2003
DEVELOPING COUNTRIES
SOUTHEAST ASIA1 . Cambodia - - - - -2 . Indonesia - - - - -3 . Lao PDR - - - - -4 . Malaysia - - - - -5 . Myanmar 144.2 168.9 158.5 160.0 * 162.0 * 2.0 %6 . Philippines - - - - -7 . Thailand - - - - -8 . Timor-Leste - - - - -9 . Viet Nam - - - - -
SOUTH ASIA10 . Bangladesh 63.0 55.0 57.0 F 57.0 F 57.0 F -0.6 %11 . Bhutan 7.0 F 7.0 F 4.5 F 3.8 3.0 -7.0 %12 . India 8 488.4 10 077.8 11 235.3 6 508.9 10 700.0 * -0.2 %13 . Maldives .0 * .0 .0 F .0 F .0 F -2.3 %14 . Nepal 274.4 269.9 282.9 282.6 288.0 * 0.7 %15 . Pakistan 137.5 199.0 216.4 189.0 180.0 * 1.6 %16 . Sri Lanka 7.6 5.0 4.3 4.1 5.4 -3.3 %
CENTRAL ASIA17 . Kazakhstan 233.0 62.3 65.3 39.2 40.0 * -9.5 %18 . Tajikistan - - - - -19 . Uzbekistan .3 2.7 * 1.6 * 1.0 * .5 * 2.9 %
OTHER ASIA20 . Afghanistan - - - - -21 . China 3 999.7 2 125.7 1 966.8 2 176.8 1 950.8 * -7.0 %22 . Korea DPR 40.0 F 45.0 F 50.0 * 65.0 * 38.0 * 10.3 %23 . Iran (Islamic Rep. of) 6.0 F 9.0 F 9.0 F 8.0 F 10.0 F 4.1 %24 . Mongolia - - - - -25 . Rep. of Korea 2.2 1.8 1.9 1.8 2.0 F 0.1 %
PACIFIC ISLANDS26 . Cook Islands - - - - -27 . Fiji Islands - - - - -28 . Kiribati - - - - -29 . Marshall Islands - - - - -30 . Micronesia, Fed States of - - - - -31 . Nauru - - - - -32 . Niue - - - - -33 . Palau - - - - -34 . Papua New Guinea - - - - -35 . Samoa - - - - -36 . Solomon Islands - - - - -37 . Tonga - - - - -38 . Tuvalu - - - - -39 . Vanuatu - - - - -
SUB-TOTAL 13 403.2 13 029.1 14 053.4 9 497.2 13 436.7 -1.7 %
DEVELOPED COUNTRIES40 . Australia 14.2 56.8 F 55.0 55.0 F 54.0 F 10.1 %41 . Japan .7 F .3 .3 F .3 F .3 F -10.2 %42 . New Zealand - - - - -
SUB-TOTAL 14.9 57.1 55.3 55.3 54.3 9.8 %
ASIA & PACIFIC* 13 418.2 13 086.2 14 108.7 9 552.5 13 491.0 -1.6 %
REST OF WORLD 12 613.8 14 668.3 14 915.4 14 589.8 16 314.9 2.1 %
WORLD 26 031.9 27 754.4 29 024.1 24 142.3 29 805.9 0.3 %
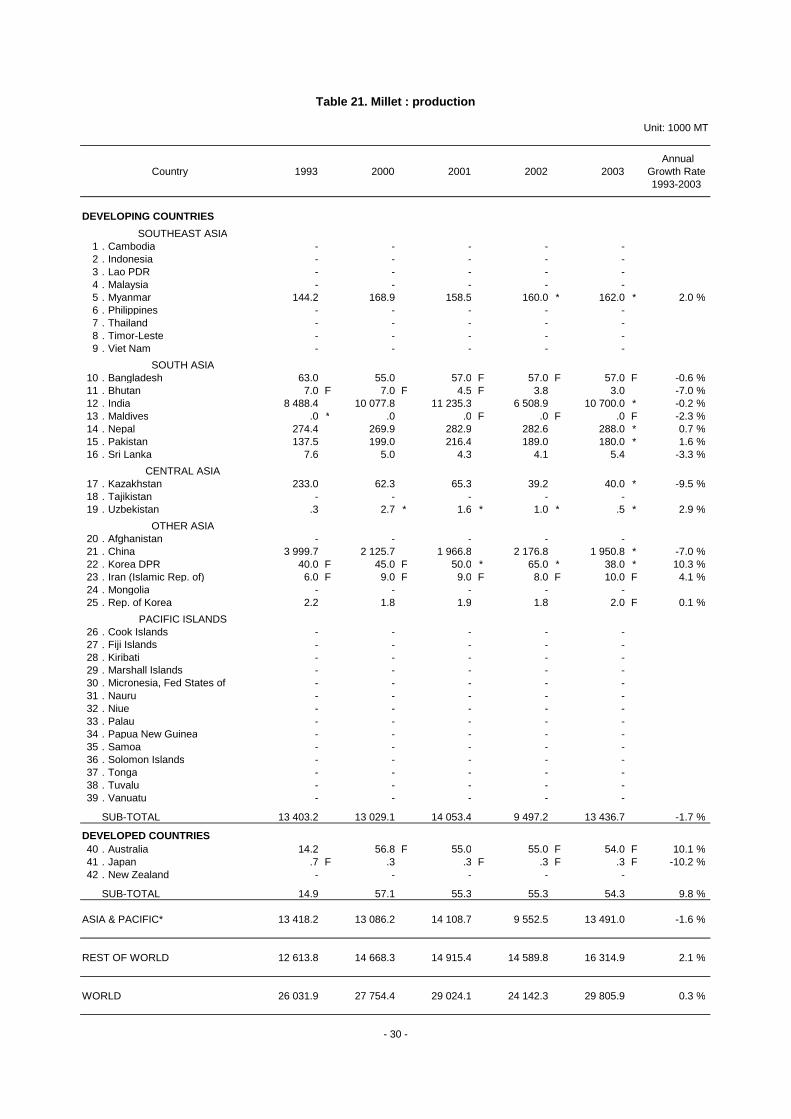
- 30 -
Table 21. Millet : production
Unit: kg/ha
AnnualCountry 1993 2000 2001 2002 2003 Growth Rate
1993-2003
DEVELOPING COUNTRIES
SOUTHEAST ASIA1 . Cambodia - - - - -2 . Indonesia - - - - -3 . Lao PDR - - - - -4 . Malaysia - - - - -5 . Myanmar 703 676 690 696 698 0.6 %6 . Philippines - - - - -7 . Thailand - - - - -8 . Timor-Leste - - - - -9 . Viet Nam - - - - -
SOUTH ASIA10 . Bangladesh 752 751 713 713 713 0.1 %11 . Bhutan 875 875 643 613 768 -2.7 %12 . India 637 774 900 641 892 1.6 %13 . Maldives 1 000 800 1 000 1 000 1 000 -4.0 %14 . Nepal 1 079 1 025 1 088 1 095 1 108 0.4 %15 . Pakistan 454 511 519 604 450 2.0 %16 . Sri Lanka 734 737 742 743 715 0.8 %
CENTRAL ASIA17 . Kazakhstan 526 478 629 735 750 6.2 %18 . Tajikistan - - - - -19 . Uzbekistan 375 2 700 3 200 2 222 1 250 7.1 %
OTHER ASIA20 . Afghanistan - - - - -21 . China 2 183 1 700 1 712 1 909 1 822 -2.3 %22 . Korea DPR 1 000 1 000 1 111 1 182 927 1.6 %23 . Iran (Islamic Rep. of) 1 200 818 818 800 1 000 -4.3 %24 . Mongolia - - - - -25 . Rep. of Korea 1 190 1 232 1 452 1 030 1 174 -0.3 %
PACIFIC ISLANDS26 . Cook Islands - - - - -27 . Fiji Islands - - - - -28 . Kiribati - - - - -29 . Marshall Islands - - - - -30 . Micronesia, Fed States of - - - - -31 . Nauru - - - - -32 . Niue - - - - -33 . Palau - - - - -34 . Papua New Guinea - - - - -35 . Samoa - - - - -36 . Solomon Islands - - - - -37 . Tonga - - - - -38 . Tuvalu - - - - -39 . Vanuatu - - - - -
AVERAGE 812 844 950 772 949 0.4 %
DEVELOPED COUNTRIES40 . Australia 653 1 457 1 528 1 528 1 543 7.1 %41 . Japan 1 750 1 000 1 000 1 000 1 000 -6.9 %42 . New Zealand - - - - -
AVERAGE 673 1 454 1 523 1 523 1 538 6.9 %
ASIA & PACIFIC* 812 845 951 774 950 0.4 %
REST OF WORLD 657 677 684 674 738 1.1 %
WORLD 729 747 792 711 821 0.6 %
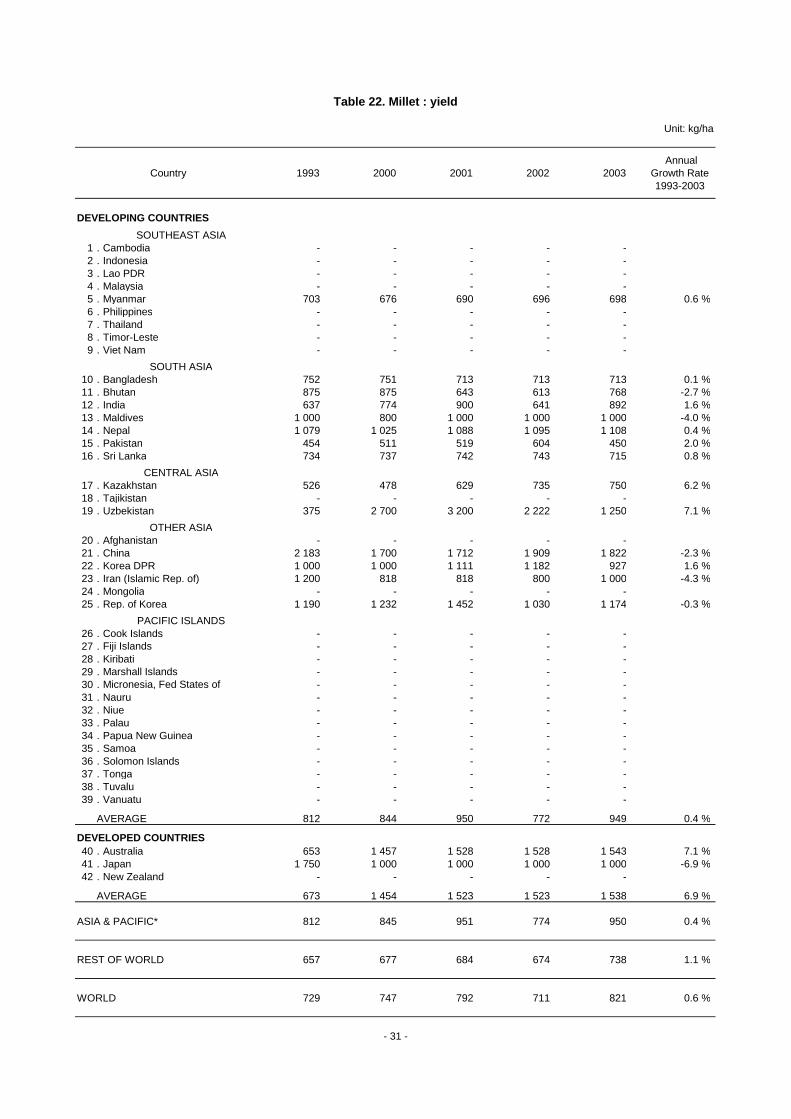
- 31 -
Table 22. Millet : yield
Unit: 1000 ha
AnnualCountry 1993 2000 2001 2002 2003 Growth Rate
1993-2003
DEVELOPING COUNTRIES
SOUTHEAST ASIA1 . Cambodia - - - - -2 . Indonesia - - - - -3 . Lao PDR - - - - -4 . Malaysia - - - - -5 . Myanmar 205.2 250.0 229.8 230.0 F 232.0 F 1.3 %6 . Philippines - - - - -7 . Thailand - - - - -8 . Timor-Leste - - - - -9 . Viet Nam - - - - -
SOUTH ASIA10 . Bangladesh 83.8 73.2 80.0 F 80.0 F 80.0 F -0.7 %11 . Bhutan 8.0 F 8.0 F 7.0 F 6.2 3.9 -4.5 %12 . India 13 318.0 13 012.2 12 486.3 10 147.8 12 000.0 * -1.7 %13 . Maldives .0 F .0 F .0 F .0 F .0 F 1.8 %14 . Nepal 254.4 263.5 259.9 258.1 260.0 F 0.3 %15 . Pakistan 302.9 389.6 417.1 313.0 400.0 * -0.3 %16 . Sri Lanka 10.3 6.7 5.7 5.6 7.5 -4.1 %
CENTRAL ASIA17 . Kazakhstan 443.0 130.4 103.8 53.3 53.3 F -14.7 %18 . Tajikistan - - - - -19 . Uzbekistan .8 1.0 * .5 * .5 * .4 * -4.0 %
OTHER ASIA20 . Afghanistan - - - - -21 . China 1 832.4 1 250.3 1 148.6 1 140.1 1 070.4 * -4.9 %22 . Korea DPR 40.0 F 45.0 * 45.0 F 55.0 F 41.0 F 8.6 %23 . Iran (Islamic Rep. of) 5.0 F 11.0 F 11.0 F 10.0 F 10.0 F 8.8 %24 . Mongolia - - - - -25 . Rep. of Korea 1.8 1.4 1.3 1.7 1.7 F 0.3 %
PACIFIC ISLANDS26 . Cook Islands - - - - -27 . Fiji Islands - - - - -28 . Kiribati - - - - -29 . Marshall Islands - - - - -30 . Micronesia, Fed States of - - - - -31 . Nauru - - - - -32 . Niue - - - - -33 . Palau - - - - -34 . Papua New Guinea - - - - -35 . Samoa - - - - -36 . Solomon Islands - - - - -37 . Tonga - - - - -38 . Tuvalu - - - - -39 . Vanuatu - - - - -
SUB-TOTAL 16 505.6 15 442.3 14 796.0 12 301.3 14 160.2 -2.1 %
DEVELOPED COUNTRIES40 . Australia 21.8 39.0 F 36.0 36.0 F 35.0 F 2.8 %41 . Japan .4 F .3 .3 F .3 F .3 F -3.6 %42 . New Zealand - - - - -
SUB-TOTAL 22.2 39.3 36.3 36.3 35.3 2.7 %
ASIA & PACIFIC* 16 527.8 15 481.6 14 832.3 12 337.6 14 195.5 -2.0 %
REST OF WORLD 19 189.1 21 655.8 21 805.1 21 634.0 22 092.6 1.0 %
WORLD 35 717.0 37 137.4 36 637.4 33 971.6 36 288.1 -0.3 %
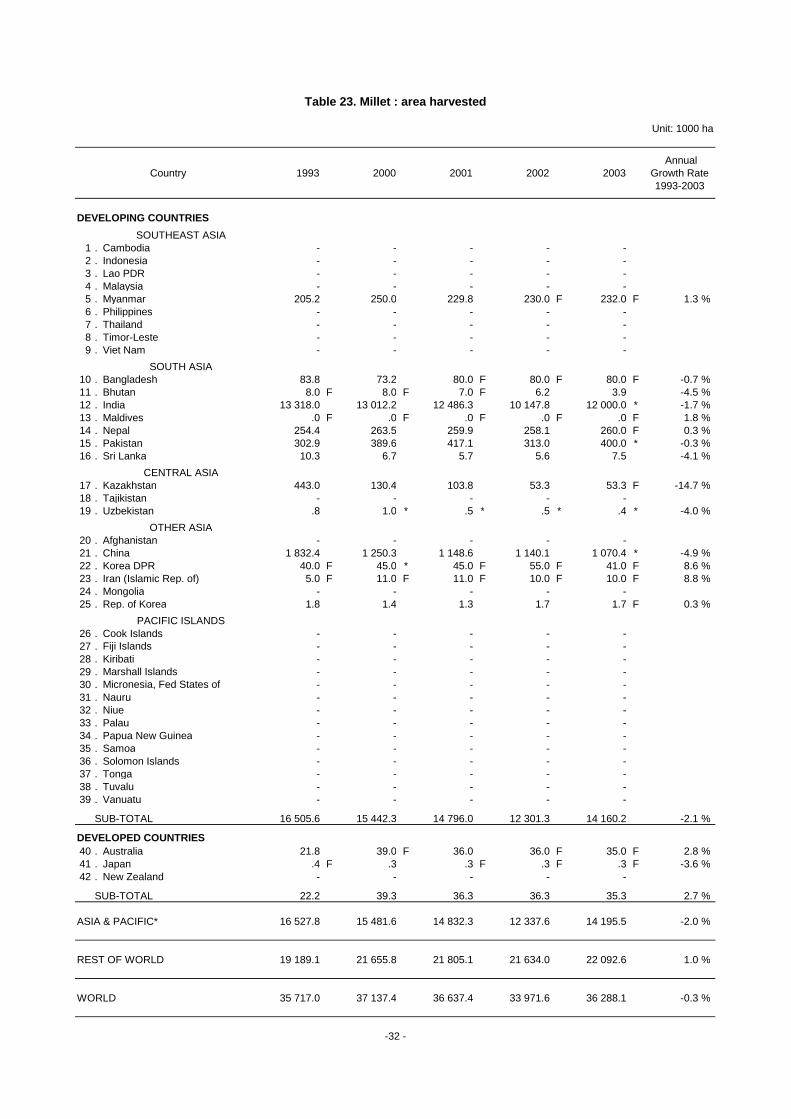
-32 -
Table 23. Millet : area harvested
Unit: 1000 MT
AnnualCountry 1993 2000 2001 2002 2003 Growth Rate
1993-2003
DEVELOPING COUNTRIES
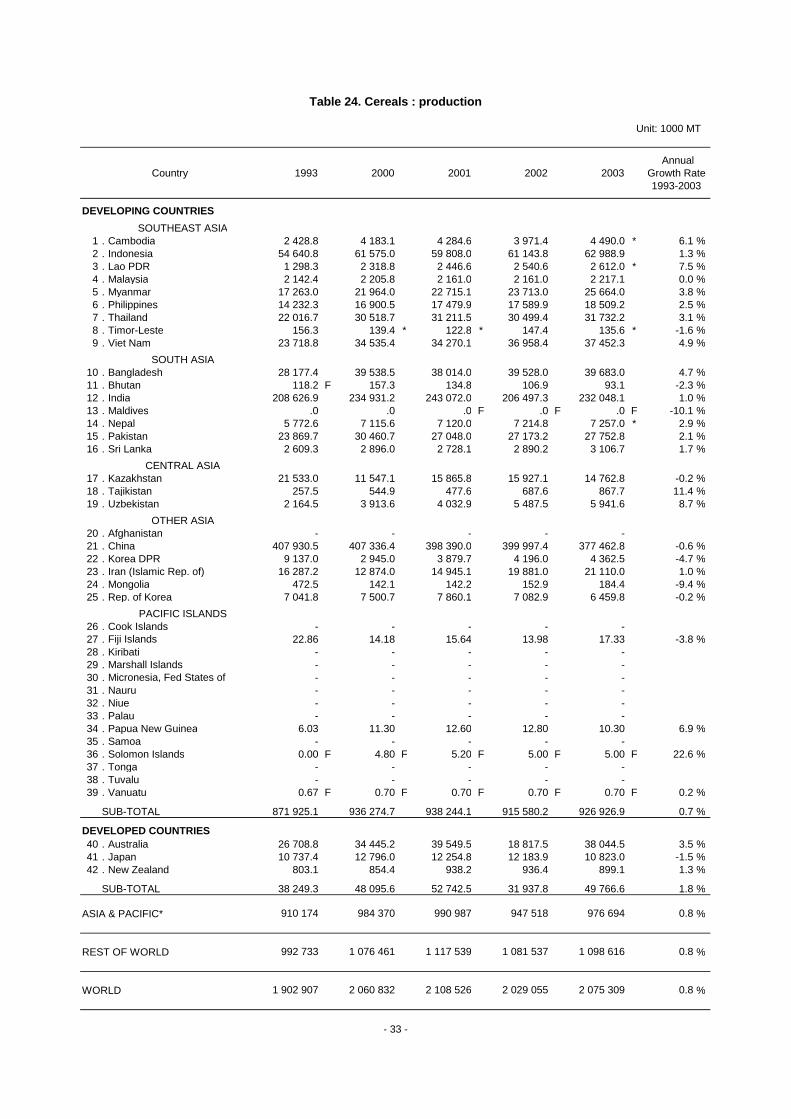
SOUTHEAST ASIA1 . Cambodia 2 428.8 4 183.1 4 284.6 3 971.4 4 490.0 * 6.1 %2 . Indonesia 54 640.8 61 575.0 59 808.0 61 143.8 62 988.9 1.3 %3 . Lao PDR 1 298.3 2 318.8 2 446.6 2 540.6 2 612.0 * 7.5 %4 . Malaysia 2 142.4 2 205.8 2 161.0 2 161.0 2 217.1 0.0 %5 . Myanmar 17 263.0 21 964.0 22 715.1 23 713.0 25 664.0 3.8 %6 . Philippines 14 232.3 16 900.5 17 479.9 17 589.9 18 509.2 2.5 %7 . Thailand 22 016.7 30 518.7 31 211.5 30 499.4 31 732.2 3.1 %8 . Timor-Leste 156.3 139.4 * 122.8 * 147.4 135.6 * -1.6 %9 . Viet Nam 23 718.8 34 535.4 34 270.1 36 958.4 37 452.3 4.9 %
SOUTH ASIA10 . Bangladesh 28 177.4 39 538.5 38 014.0 39 528.0 39 683.0 4.7 %11 . Bhutan 118.2 F 157.3 134.8 106.9 93.1 -2.3 %12 . India 208 626.9 234 931.2 243 072.0 206 497.3 232 048.1 1.0 %13 . Maldives .0 .0 .0 F .0 F .0 F -10.1 %14 . Nepal 5 772.6 7 115.6 7 120.0 7 214.8 7 257.0 * 2.9 %15 . Pakistan 23 869.7 30 460.7 27 048.0 27 173.2 27 752.8 2.1 %16 . Sri Lanka 2 609.3 2 896.0 2 728.1 2 890.2 3 106.7 1.7 %
CENTRAL ASIA17 . Kazakhstan 21 533.0 11 547.1 15 865.8 15 927.1 14 762.8 -0.2 %18 . Tajikistan 257.5 544.9 477.6 687.6 867.7 11.4 %19 . Uzbekistan 2 164.5 3 913.6 4 032.9 5 487.5 5 941.6 8.7 %
OTHER ASIA20 . Afghanistan - - - - -21 . China 407 930.5 407 336.4 398 390.0 399 997.4 377 462.8 -0.6 %22 . Korea DPR 9 137.0 2 945.0 3 879.7 4 196.0 4 362.5 -4.7 %23 . Iran (Islamic Rep. of) 16 287.2 12 874.0 14 945.1 19 881.0 21 110.0 1.0 %24 . Mongolia 472.5 142.1 142.2 152.9 184.4 -9.4 %25 . Rep. of Korea 7 041.8 7 500.7 7 860.1 7 082.9 6 459.8 -0.2 %
PACIFIC ISLANDS26 . Cook Islands - - - - -27 . Fiji Islands 22.86 14.18 15.64 13.98 17.33 -3.8 %28 . Kiribati - - - - -29 . Marshall Islands - - - - -30 . Micronesia, Fed States of - - - - -31 . Nauru - - - - -32 . Niue - - - - -33 . Palau - - - - -34 . Papua New Guinea 6.03 11.30 12.60 12.80 10.30 6.9 %35 . Samoa - - - - -36 . Solomon Islands 0.00 F 4.80 F 5.20 F 5.00 F 5.00 F 22.6 %37 . Tonga - - - - -38 . Tuvalu - - - - -39 . Vanuatu 0.67 F 0.70 F 0.70 F 0.70 F 0.70 F 0.2 %
SUB-TOTAL 871 925.1 936 274.7 938 244.1 915 580.2 926 926.9 0.7 %
DEVELOPED COUNTRIES40 . Australia 26 708.8 34 445.2 39 549.5 18 817.5 38 044.5 3.5 %41 . Japan 10 737.4 12 796.0 12 254.8 12 183.9 10 823.0 -1.5 %42 . New Zealand 803.1 854.4 938.2 936.4 899.1 1.3 %
SUB-TOTAL 38 249.3 48 095.6 52 742.5 31 937.8 49 766.6 1.8 %
ASIA & PACIFIC* 910 174 984 370 990 987 947 518 976 694 0.8 %
REST OF WORLD 992 733 1 076 461 1 117 539 1 081 537 1 098 616 0.8 %
WORLD 1 902 907 2 060 832 2 108 526 2 029 055 2 075 309 0.8 %
- 33 -
Table 24. Cereals : production
Unit: kg/ha
AnnualCountry 1993 2000 2001 2002 2003 Growth Rate
1993-2003
DEVELOPING COUNTRIES
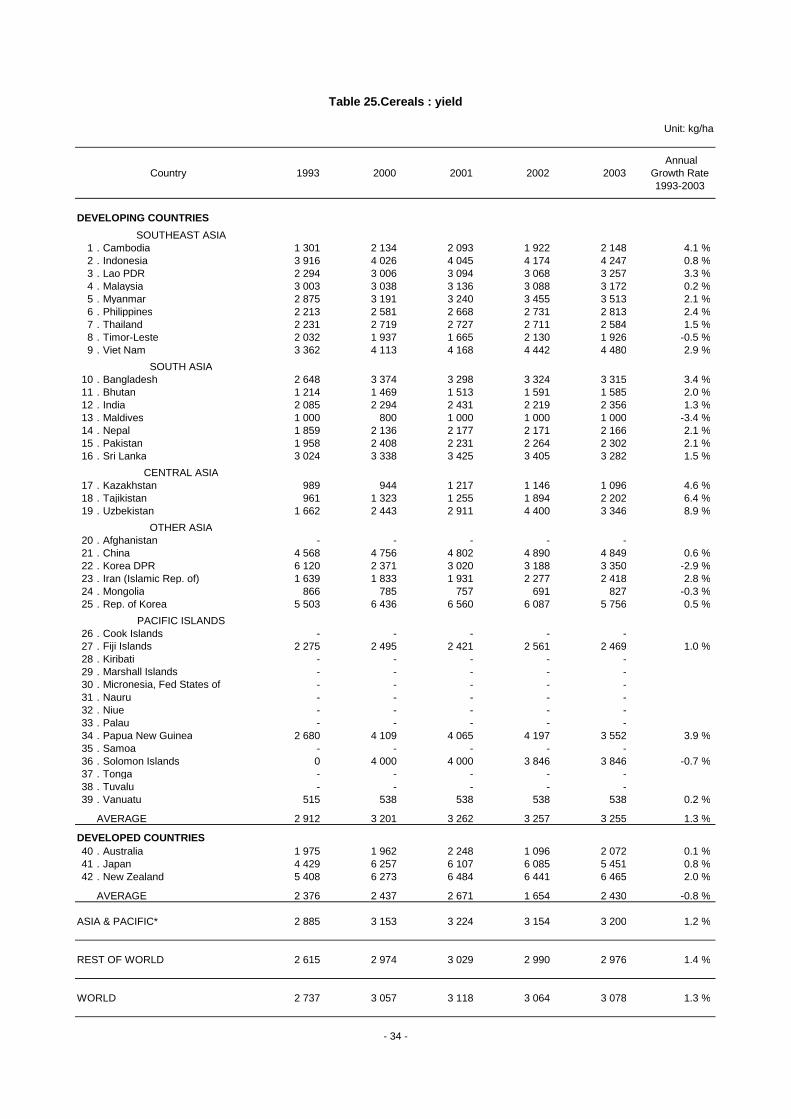
SOUTHEAST ASIA1 . Cambodia 1 301 2 134 2 093 1 922 2 148 4.1 %2 . Indonesia 3 916 4 026 4 045 4 174 4 247 0.8 %3 . Lao PDR 2 294 3 006 3 094 3 068 3 257 3.3 %4 . Malaysia 3 003 3 038 3 136 3 088 3 172 0.2 %5 . Myanmar 2 875 3 191 3 240 3 455 3 513 2.1 %6 . Philippines 2 213 2 581 2 668 2 731 2 813 2.4 %7 . Thailand 2 231 2 719 2 727 2 711 2 584 1.5 %8 . Timor-Leste 2 032 1 937 1 665 2 130 1 926 -0.5 %9 . Viet Nam 3 362 4 113 4 168 4 442 4 480 2.9 %
SOUTH ASIA10 . Bangladesh 2 648 3 374 3 298 3 324 3 315 3.4 %11 . Bhutan 1 214 1 469 1 513 1 591 1 585 2.0 %12 . India 2 085 2 294 2 431 2 219 2 356 1.3 %13 . Maldives 1 000 800 1 000 1 000 1 000 -3.4 %14 . Nepal 1 859 2 136 2 177 2 171 2 166 2.1 %15 . Pakistan 1 958 2 408 2 231 2 264 2 302 2.1 %16 . Sri Lanka 3 024 3 338 3 425 3 405 3 282 1.5 %
CENTRAL ASIA17 . Kazakhstan 989 944 1 217 1 146 1 096 4.6 %18 . Tajikistan 961 1 323 1 255 1 894 2 202 6.4 %19 . Uzbekistan 1 662 2 443 2 911 4 400 3 346 8.9 %
OTHER ASIA20 . Afghanistan - - - - -21 . China 4 568 4 756 4 802 4 890 4 849 0.6 %22 . Korea DPR 6 120 2 371 3 020 3 188 3 350 -2.9 %23 . Iran (Islamic Rep. of) 1 639 1 833 1 931 2 277 2 418 2.8 %24 . Mongolia 866 785 757 691 827 -0.3 %25 . Rep. of Korea 5 503 6 436 6 560 6 087 5 756 0.5 %
PACIFIC ISLANDS26 . Cook Islands - - - - -27 . Fiji Islands 2 275 2 495 2 421 2 561 2 469 1.0 %28 . Kiribati - - - - -29 . Marshall Islands - - - - -30 . Micronesia, Fed States of - - - - -31 . Nauru - - - - -32 . Niue - - - - -33 . Palau - - - - -34 . Papua New Guinea 2 680 4 109 4 065 4 197 3 552 3.9 %35 . Samoa - - - - -36 . Solomon Islands 0 4 000 4 000 3 846 3 846 -0.7 %37 . Tonga - - - - -38 . Tuvalu - - - - -39 . Vanuatu 515 538 538 538 538 0.2 %
AVERAGE 2 912 3 201 3 262 3 257 3 255 1.3 %
DEVELOPED COUNTRIES40 . Australia 1 975 1 962 2 248 1 096 2 072 0.1 %41 . Japan 4 429 6 257 6 107 6 085 5 451 0.8 %42 . New Zealand 5 408 6 273 6 484 6 441 6 465 2.0 %
AVERAGE 2 376 2 437 2 671 1 654 2 430 -0.8 %
ASIA & PACIFIC* 2 885 3 153 3 224 3 154 3 200 1.2 %
REST OF WORLD 2 615 2 974 3 029 2 990 2 976 1.4 %
WORLD 2 737 3 057 3 118 3 064 3 078 1.3 %
- 34 -
Table 25.Cereals : yield
Unit: 1000 ha
AnnualCountry 1993 2000 2001 2002 2003 Growth Rate
1993-2003
DEVELOPING COUNTRIES
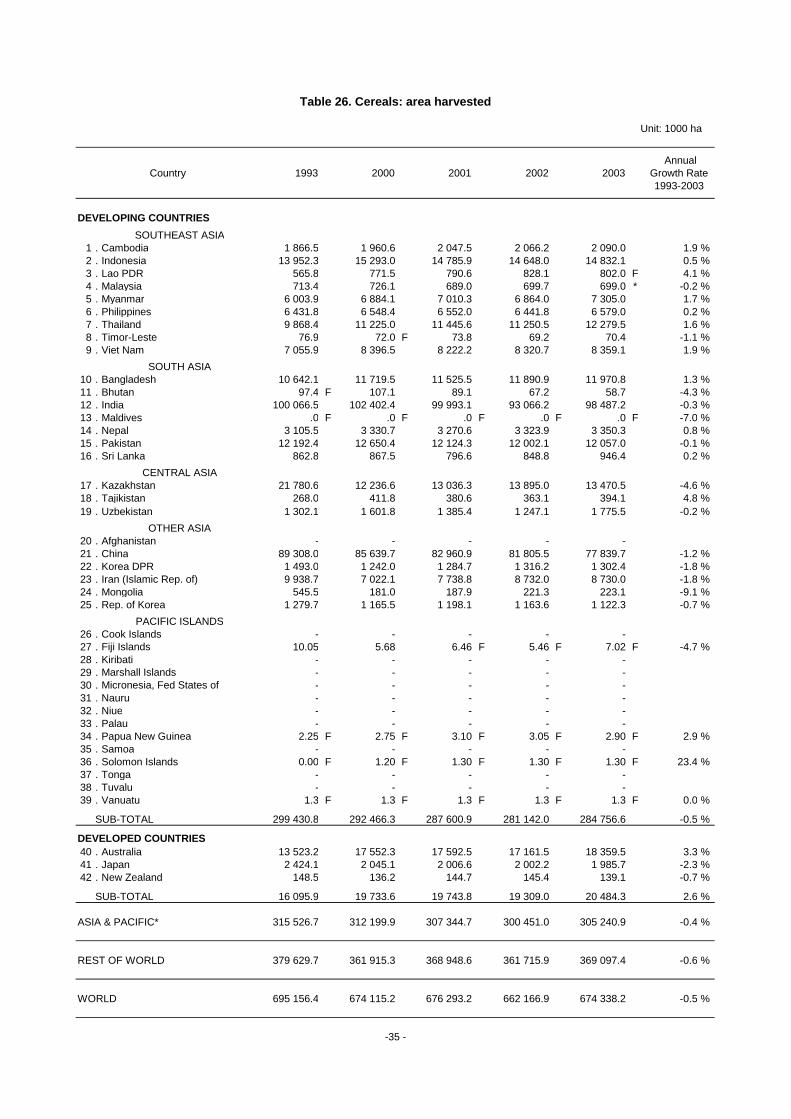
SOUTHEAST ASIA1 . Cambodia 1 866.5 1 960.6 2 047.5 2 066.2 2 090.0 1.9 %2 . Indonesia 13 952.3 15 293.0 14 785.9 14 648.0 14 832.1 0.5 %3 . Lao PDR 565.8 771.5 790.6 828.1 802.0 F 4.1 %4 . Malaysia 713.4 726.1 689.0 699.7 699.0 * -0.2 %5 . Myanmar 6 003.9 6 884.1 7 010.3 6 864.0 7 305.0 1.7 %6 . Philippines 6 431.8 6 548.4 6 552.0 6 441.8 6 579.0 0.2 %7 . Thailand 9 868.4 11 225.0 11 445.6 11 250.5 12 279.5 1.6 %8 . Timor-Leste 76.9 72.0 F 73.8 69.2 70.4 -1.1 %9 . Viet Nam 7 055.9 8 396.5 8 222.2 8 320.7 8 359.1 1.9 %
SOUTH ASIA10 . Bangladesh 10 642.1 11 719.5 11 525.5 11 890.9 11 970.8 1.3 %11 . Bhutan 97.4 F 107.1 89.1 67.2 58.7 -4.3 %12 . India 100 066.5 102 402.4 99 993.1 93 066.2 98 487.2 -0.3 %13 . Maldives .0 F .0 F .0 F .0 F .0 F -7.0 %14 . Nepal 3 105.5 3 330.7 3 270.6 3 323.9 3 350.3 0.8 %15 . Pakistan 12 192.4 12 650.4 12 124.3 12 002.1 12 057.0 -0.1 %16 . Sri Lanka 862.8 867.5 796.6 848.8 946.4 0.2 %
CENTRAL ASIA17 . Kazakhstan 21 780.6 12 236.6 13 036.3 13 895.0 13 470.5 -4.6 %18 . Tajikistan 268.0 411.8 380.6 363.1 394.1 4.8 %19 . Uzbekistan 1 302.1 1 601.8 1 385.4 1 247.1 1 775.5 -0.2 %
OTHER ASIA20 . Afghanistan - - - - -21 . China 89 308.0 85 639.7 82 960.9 81 805.5 77 839.7 -1.2 %22 . Korea DPR 1 493.0 1 242.0 1 284.7 1 316.2 1 302.4 -1.8 %23 . Iran (Islamic Rep. of) 9 938.7 7 022.1 7 738.8 8 732.0 8 730.0 -1.8 %24 . Mongolia 545.5 181.0 187.9 221.3 223.1 -9.1 %25 . Rep. of Korea 1 279.7 1 165.5 1 198.1 1 163.6 1 122.3 -0.7 %
PACIFIC ISLANDS26 . Cook Islands - - - - -27 . Fiji Islands 10.05 5.68 6.46 F 5.46 F 7.02 F -4.7 %28 . Kiribati - - - - -29 . Marshall Islands - - - - -30 . Micronesia, Fed States of - - - - -31 . Nauru - - - - -32 . Niue - - - - -33 . Palau - - - - -34 . Papua New Guinea 2.25 F 2.75 F 3.10 F 3.05 F 2.90 F 2.9 %35 . Samoa - - - - -36 . Solomon Islands 0.00 F 1.20 F 1.30 F 1.30 F 1.30 F 23.4 %37 . Tonga - - - - -38 . Tuvalu - - - - -39 . Vanuatu 1.3 F 1.3 F 1.3 F 1.3 F 1.3 F 0.0 %
SUB-TOTAL 299 430.8 292 466.3 287 600.9 281 142.0 284 756.6 -0.5 %
DEVELOPED COUNTRIES40 . Australia 13 523.2 17 552.3 17 592.5 17 161.5 18 359.5 3.3 %41 . Japan 2 424.1 2 045.1 2 006.6 2 002.2 1 985.7 -2.3 %42 . New Zealand 148.5 136.2 144.7 145.4 139.1 -0.7 %
SUB-TOTAL 16 095.9 19 733.6 19 743.8 19 309.0 20 484.3 2.6 %
ASIA & PACIFIC* 315 526.7 312 199.9 307 344.7 300 451.0 305 240.9 -0.4 %
REST OF WORLD 379 629.7 361 915.3 368 948.6 361 715.9 369 097.4 -0.6 %
WORLD 695 156.4 674 115.2 676 293.2 662 166.9 674 338.2 -0.5 %
-35 -
Table 26. Cereals: area harvested