Embed Size (px)
Citation preview
i
LIVESTOCK-CROP PRODUCTION SYSTEMS
ANALYSIS FOR SUSTAINABLE
PRODUCTION (SUB PROJECT IN HIMACHAL PRADESH)
(NATP MISSION MODE PROJECT) Lead Centre: National Dairy Research Institute, KarnalLead Centre: National Dairy Research Institute, KarnalLead Centre: National Dairy Research Institute, KarnalLead Centre: National Dairy Research Institute, Karnal
RANVEER SINGH
ANSHUMAN KAROL
PRATAP SINGH
AGRO-ECONOMIC RESEARCH CENTRE HIMACHAL PRADESH UNIVERSITY
SHIMLA-171005 (INDIA)
2005
ii
CONTENTS
Chapter Title Page
Executive summary i-ix
1 Introduction 1
1.1 Introduction 1
1.2 Need for the study 3
1.3 Objectives 4
2 Agro-climatic & socio-economic description of the zones in Himachal
Pradesh
5
2.1 Agro- Climatic zones in Himachal Pradesh 5
2.2 Agro- climatic description 7
2.3 Land use pattern 8
2.4 Demographic profile 9
2.5 Operational holdings 9
2.6 Cropping pattern 9
2.7 Livestock economy 10
3 Methodology 19
3.1 Sampling Plan 19
3.2
3.3
Tabulation and Analysis
Reference period
19
21
4 Resource structure and socio-economic profile of sampled farmers 22
4.1 Demographic profile 22
4.2 Educational status 22
4.3 Occupational distribution 22
4.4 Operational holdings 23
4.5 Cropping pattern and Productivity 24
4.6 Livestock composition 27
4.7 Fixed investment in Crop farming 28
4.8 Fixed investment in Bovine enterprises & Other Livestock 28
4.9 Livestock- Crop production System 30
4.10 Family composition 33
4.11 Educational status 34
4.12 Occupational distribution 34
4.13 Operational holdings 36
4.14 Cropping pattern and Productivity 36
4.15 Livestock composition 39
4.16 Fixed investment in Crop farming 40
4.17 Fixed investment in Bovine enterprises & Other Livestock 41
iii
5 Breeding, feeding and management practices on sampled farm
households
43
5.1 Feeding practices 43
5.2 Breeding practices 47
5.3 Management practices 51
6 Economic characteristics and productivity of various livestock and
crops
57
6.1 Production traits 57
6.2 Production of Milk on Sampled Farms 59
6.3 Production, consumption and marketed surplus of milk 60
6.4 Marketing of milk 60
7 Input-output relationship for various LCPS in Himachal Pradesh 63
7.1 Economics of milk, meat and wool production 63
7.2 Economics of crop production 63
7.3 Input- output relation in milk, meat and wool production 64
7.4 Input- output relation in crop production 65
7.5 Income and Employment Generation from Livestock 77
7.6 Income & Employment Generation from Crop Production 78
8 Increasing income and employment through adoption of improved technology in LCPS
80
8.1 Income and employment generation from different LCPS 80
8.2
8.3
Potential income and employment generation from different LCPS
Gaps in potential and existing income and employment
81
82
9 Constraints in marketing of crops and livestock products 84
9.1 Production and Financial constraints in crop production 84
9.2 Marketing constraints in crop production 85
9.3 Production and Financial constraints in livestock farming 86
9.4 Marketing constraints in livestock farming 86
10
10.1
10.2
Conclusion and Recommendations
Conclusion
Recommendations
Appendix
88
88
89
1 Input-Output Levels in Milk/ Meat Production in Different Agro-Climate Zones 92
2 Prices of Inputs, Outputs and Animals in Different Agro- Climatic Zones 93
i
EXECUTIVE SUMMARY
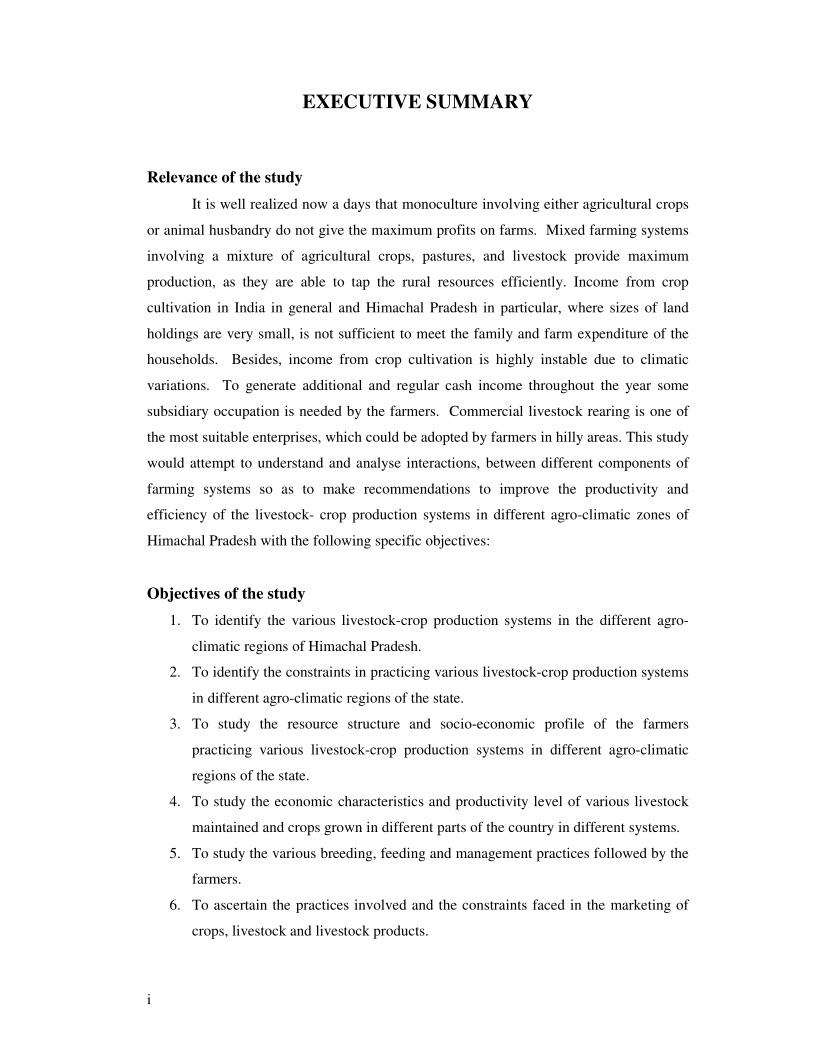
Relevance of the study
It is well realized now a days that monoculture involving either agricultural crops
or animal husbandry do not give the maximum profits on farms. Mixed farming systems
involving a mixture of agricultural crops, pastures, and livestock provide maximum
production, as they are able to tap the rural resources efficiently. Income from crop
cultivation in India in general and Himachal Pradesh in particular, where sizes of land
holdings are very small, is not sufficient to meet the family and farm expenditure of the
households. Besides, income from crop cultivation is highly instable due to climatic
variations. To generate additional and regular cash income throughout the year some
subsidiary occupation is needed by the farmers. Commercial livestock rearing is one of
the most suitable enterprises, which could be adopted by farmers in hilly areas. This study
would attempt to understand and analyse interactions, between different components of
farming systems so as to make recommendations to improve the productivity and
efficiency of the livestock- crop production systems in different agro-climatic zones of
Himachal Pradesh with the following specific objectives:
Objectives of the study
1. To identify the various livestock-crop production systems in the different agro-
climatic regions of Himachal Pradesh.
2. To identify the constraints in practicing various livestock-crop production systems
in different agro-climatic regions of the state.
3. To study the resource structure and socio-economic profile of the farmers
practicing various livestock-crop production systems in different agro-climatic
regions of the state.
4. To study the economic characteristics and productivity level of various livestock
maintained and crops grown in different parts of the country in different systems.
5. To study the various breeding, feeding and management practices followed by the
farmers.
6. To ascertain the practices involved and the constraints faced in the marketing of
crops, livestock and livestock products.
ii
7. To ascertain the input-output relationship for the various livestock-crop
production systems in the different agro-climatic regions of the state.
8. To ascertain the potential for increasing the income and employment through
adoption of improved technology in various livestock-production systems.
Methodology
In order to achieve above mentioned objectives, four districts were selected
purposively from each NARP zone in Himachal Pradesh i.e. district Hamirpur from low
hill sub- tropical zone, district Solan from Mid hill sub- humid zone, district Shimla from
High hill temperate wet zone and district Kinnaur from high hill temperate dry zone. In
each district a typical representative village cluster was selected purposively for the
detailed investigation for the project. The sample village clusters were surveyed and
information obtained on village schedule. In the low hill zone Bhota block of Hamirpur,
in the mid hill zone Solan block of Solan district, in high hill wet zone Tikker block of
Shimla district, and in high hill dry zone, Sangla block of Kinnaur district were selected
for the study. In each block 150 households were surveyed. Thus, the study based on total
sample of 600 households in Himachal Pradesh.
In order to examine the socio-economic structure and livestock crop production
analysis, simple tabular analysis consisting of averages, percentages etc. were extensively
used. In order to study the cost and returns of various crops, Cost A1 was used.
To obtain input-output relationship for various livestock and crops log-linear form of
production function was used.
In order to study the various livestock-crop production systems (LCPS), various
combinations of LCPS were identified from each zone and analysis was done accordingly
for the two major LCPS in each zone.
Main findings
Resource structure and socio-economic profile of sampled farmers
Average family size in Kinnaur is 7.07 persons with the sex ratio of 994, being
highest in the districts under study followed by Hamirpur (6.39), Solan (6.20) and Shimla
(5.65). Occupational distribution of households reveals that, crop farming is the main
occupation of sampled households in all the four zones, followed by dairying. Kinnaur,
iii
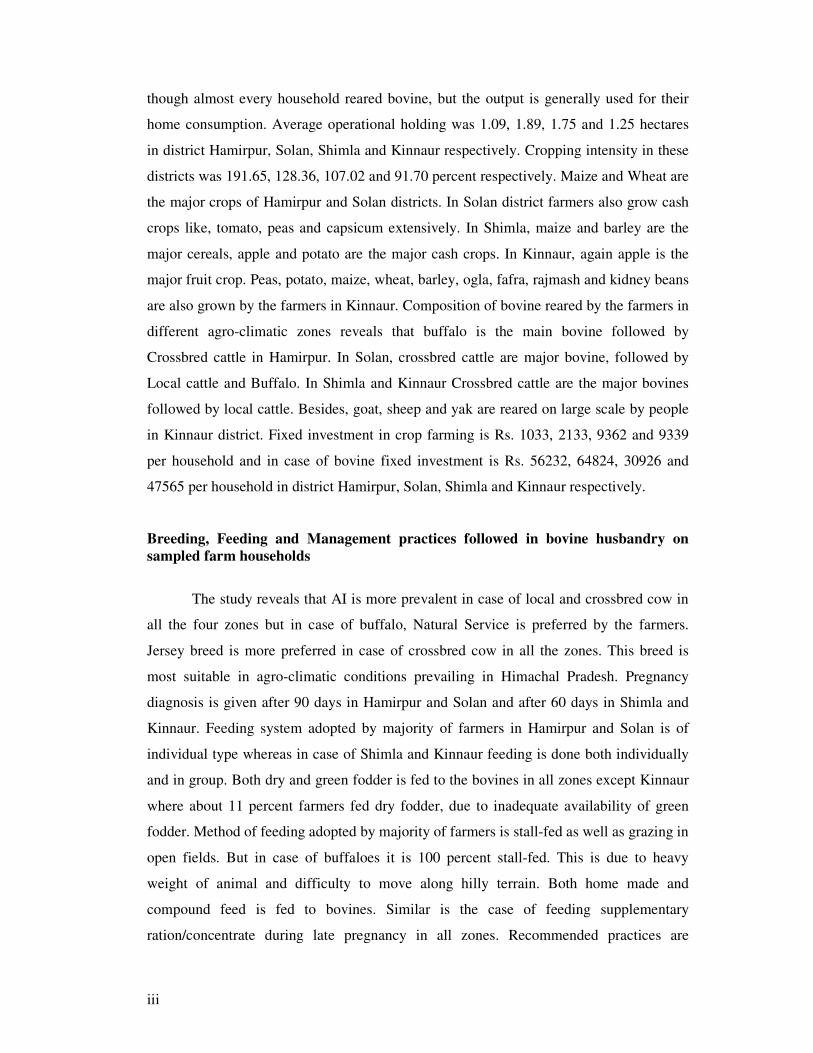
though almost every household reared bovine, but the output is generally used for their
home consumption. Average operational holding was 1.09, 1.89, 1.75 and 1.25 hectares
in district Hamirpur, Solan, Shimla and Kinnaur respectively. Cropping intensity in these
districts was 191.65, 128.36, 107.02 and 91.70 percent respectively. Maize and Wheat are
the major crops of Hamirpur and Solan districts. In Solan district farmers also grow cash
crops like, tomato, peas and capsicum extensively. In Shimla, maize and barley are the
major cereals, apple and potato are the major cash crops. In Kinnaur, again apple is the
major fruit crop. Peas, potato, maize, wheat, barley, ogla, fafra, rajmash and kidney beans
are also grown by the farmers in Kinnaur. Composition of bovine reared by the farmers in
different agro-climatic zones reveals that buffalo is the main bovine followed by
Crossbred cattle in Hamirpur. In Solan, crossbred cattle are major bovine, followed by
Local cattle and Buffalo. In Shimla and Kinnaur Crossbred cattle are the major bovines
followed by local cattle. Besides, goat, sheep and yak are reared on large scale by people
in Kinnaur district. Fixed investment in crop farming is Rs. 1033, 2133, 9362 and 9339
per household and in case of bovine fixed investment is Rs. 56232, 64824, 30926 and
47565 per household in district Hamirpur, Solan, Shimla and Kinnaur respectively.
Breeding, Feeding and Management practices followed in bovine husbandry on
sampled farm households
The study reveals that AI is more prevalent in case of local and crossbred cow in
all the four zones but in case of buffalo, Natural Service is preferred by the farmers.
Jersey breed is more preferred in case of crossbred cow in all the zones. This breed is
most suitable in agro-climatic conditions prevailing in Himachal Pradesh. Pregnancy
diagnosis is given after 90 days in Hamirpur and Solan and after 60 days in Shimla and
Kinnaur. Feeding system adopted by majority of farmers in Hamirpur and Solan is of
individual type whereas in case of Shimla and Kinnaur feeding is done both individually
and in group. Both dry and green fodder is fed to the bovines in all zones except Kinnaur
where about 11 percent farmers fed dry fodder, due to inadequate availability of green
fodder. Method of feeding adopted by majority of farmers is stall-fed as well as grazing in
open fields. But in case of buffaloes it is 100 percent stall-fed. This is due to heavy
weight of animal and difficulty to move along hilly terrain. Both home made and
compound feed is fed to bovines. Similar is the case of feeding supplementary
ration/concentrate during late pregnancy in all zones. Recommended practices are
iv
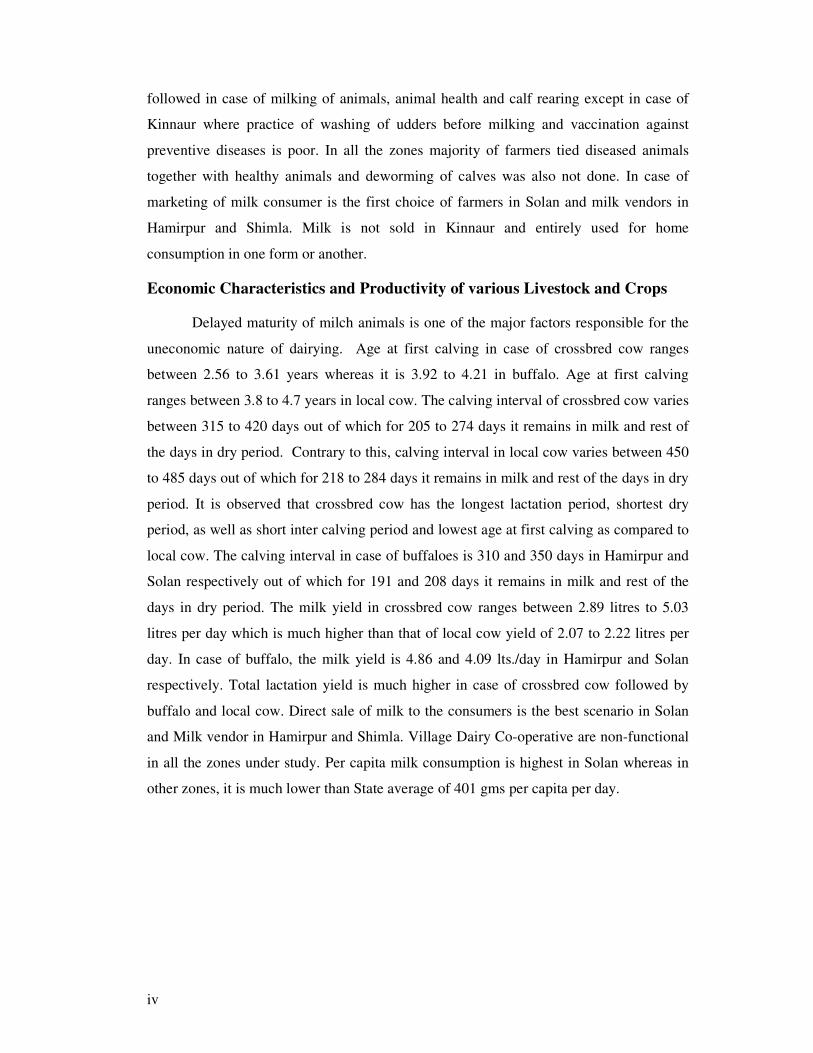
followed in case of milking of animals, animal health and calf rearing except in case of
Kinnaur where practice of washing of udders before milking and vaccination against
preventive diseases is poor. In all the zones majority of farmers tied diseased animals
together with healthy animals and deworming of calves was also not done. In case of
marketing of milk consumer is the first choice of farmers in Solan and milk vendors in
Hamirpur and Shimla. Milk is not sold in Kinnaur and entirely used for home
consumption in one form or another.
Economic Characteristics and Productivity of various Livestock and Crops
Delayed maturity of milch animals is one of the major factors responsible for the
uneconomic nature of dairying. Age at first calving in case of crossbred cow ranges
between 2.56 to 3.61 years whereas it is 3.92 to 4.21 in buffalo. Age at first calving
ranges between 3.8 to 4.7 years in local cow. The calving interval of crossbred cow varies
between 315 to 420 days out of which for 205 to 274 days it remains in milk and rest of
the days in dry period. Contrary to this, calving interval in local cow varies between 450
to 485 days out of which for 218 to 284 days it remains in milk and rest of the days in dry
period. It is observed that crossbred cow has the longest lactation period, shortest dry
period, as well as short inter calving period and lowest age at first calving as compared to
local cow. The calving interval in case of buffaloes is 310 and 350 days in Hamirpur and
Solan respectively out of which for 191 and 208 days it remains in milk and rest of the
days in dry period. The milk yield in crossbred cow ranges between 2.89 litres to 5.03
litres per day which is much higher than that of local cow yield of 2.07 to 2.22 litres per
day. In case of buffalo, the milk yield is 4.86 and 4.09 lts./day in Hamirpur and Solan
respectively. Total lactation yield is much higher in case of crossbred cow followed by
buffalo and local cow. Direct sale of milk to the consumers is the best scenario in Solan
and Milk vendor in Hamirpur and Shimla. Village Dairy Co-operative are non-functional
in all the zones under study. Per capita milk consumption is highest in Solan whereas in
other zones, it is much lower than State average of 401 gms per capita per day.
v
Input-output Relationship for various Livestock-Crop Production Systems in
Himachal Pradesh
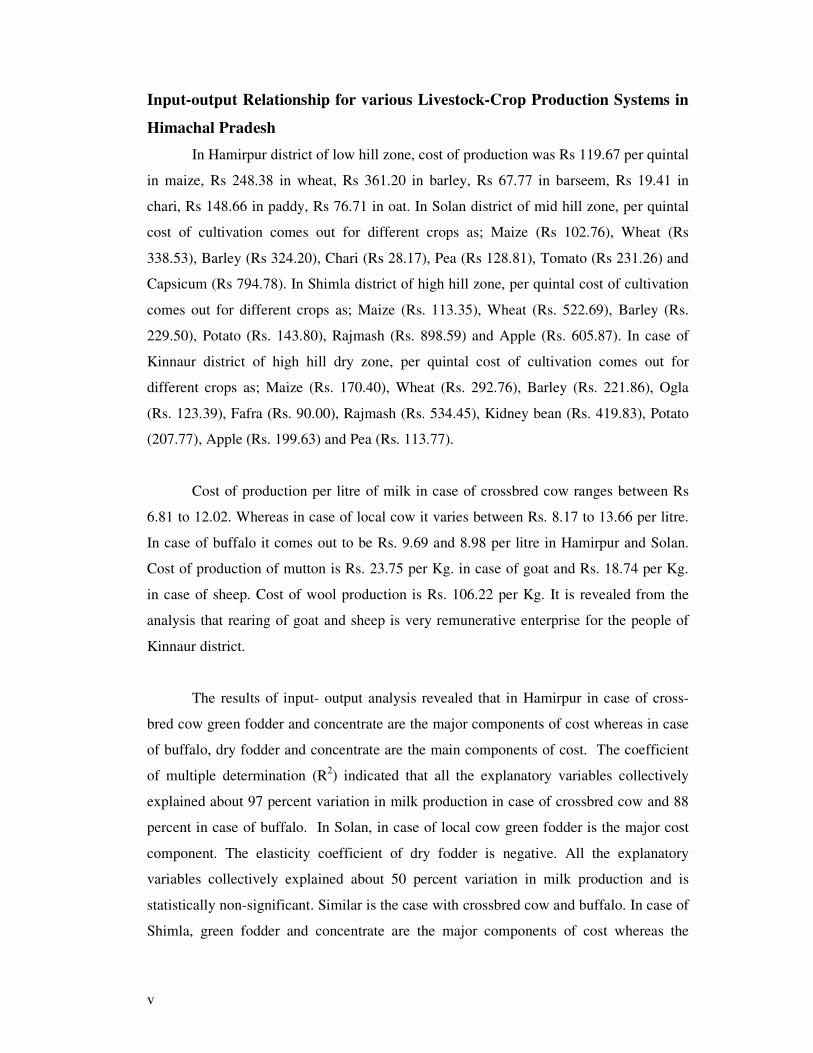
In Hamirpur district of low hill zone, cost of production was Rs 119.67 per quintal
in maize, Rs 248.38 in wheat, Rs 361.20 in barley, Rs 67.77 in barseem, Rs 19.41 in
chari, Rs 148.66 in paddy, Rs 76.71 in oat. In Solan district of mid hill zone, per quintal
cost of cultivation comes out for different crops as; Maize (Rs 102.76), Wheat (Rs
338.53), Barley (Rs 324.20), Chari (Rs 28.17), Pea (Rs 128.81), Tomato (Rs 231.26) and
Capsicum (Rs 794.78). In Shimla district of high hill zone, per quintal cost of cultivation
comes out for different crops as; Maize (Rs. 113.35), Wheat (Rs. 522.69), Barley (Rs.
229.50), Potato (Rs. 143.80), Rajmash (Rs. 898.59) and Apple (Rs. 605.87). In case of
Kinnaur district of high hill dry zone, per quintal cost of cultivation comes out for
different crops as; Maize (Rs. 170.40), Wheat (Rs. 292.76), Barley (Rs. 221.86), Ogla
(Rs. 123.39), Fafra (Rs. 90.00), Rajmash (Rs. 534.45), Kidney bean (Rs. 419.83), Potato
(207.77), Apple (Rs. 199.63) and Pea (Rs. 113.77).
Cost of production per litre of milk in case of crossbred cow ranges between Rs
6.81 to 12.02. Whereas in case of local cow it varies between Rs. 8.17 to 13.66 per litre.
In case of buffalo it comes out to be Rs. 9.69 and 8.98 per litre in Hamirpur and Solan.
Cost of production of mutton is Rs. 23.75 per Kg. in case of goat and Rs. 18.74 per Kg.
in case of sheep. Cost of wool production is Rs. 106.22 per Kg. It is revealed from the
analysis that rearing of goat and sheep is very remunerative enterprise for the people of
Kinnaur district.
The results of input- output analysis revealed that in Hamirpur in case of cross-
bred cow green fodder and concentrate are the major components of cost whereas in case
of buffalo, dry fodder and concentrate are the main components of cost. The coefficient
of multiple determination (R2) indicated that all the explanatory variables collectively
explained about 97 percent variation in milk production in case of crossbred cow and 88
percent in case of buffalo. In Solan, in case of local cow green fodder is the major cost
component. The elasticity coefficient of dry fodder is negative. All the explanatory
variables collectively explained about 50 percent variation in milk production and is
statistically non-significant. Similar is the case with crossbred cow and buffalo. In case of
Shimla, green fodder and concentrate are the major components of cost whereas the
vi
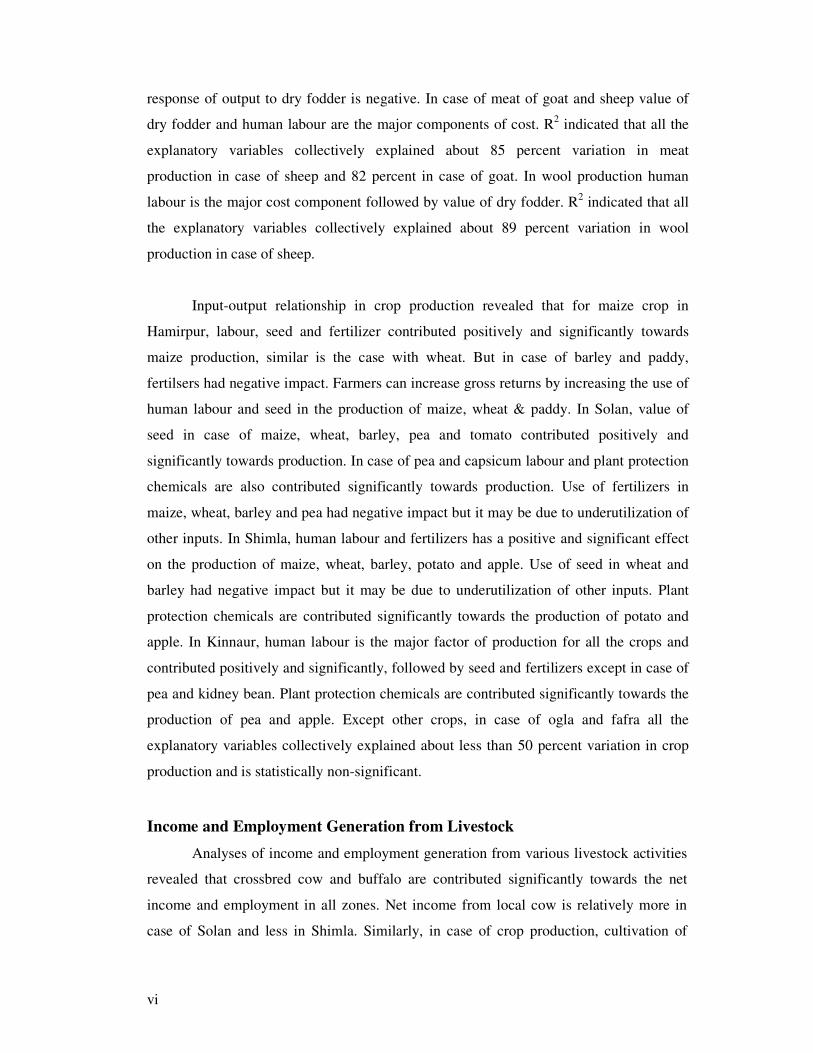
response of output to dry fodder is negative. In case of meat of goat and sheep value of
dry fodder and human labour are the major components of cost. R2 indicated that all the
explanatory variables collectively explained about 85 percent variation in meat
production in case of sheep and 82 percent in case of goat. In wool production human
labour is the major cost component followed by value of dry fodder. R2 indicated that all
the explanatory variables collectively explained about 89 percent variation in wool
production in case of sheep.
Input-output relationship in crop production revealed that for maize crop in
Hamirpur, labour, seed and fertilizer contributed positively and significantly towards
maize production, similar is the case with wheat. But in case of barley and paddy,
fertilsers had negative impact. Farmers can increase gross returns by increasing the use of
human labour and seed in the production of maize, wheat & paddy. In Solan, value of
seed in case of maize, wheat, barley, pea and tomato contributed positively and
significantly towards production. In case of pea and capsicum labour and plant protection
chemicals are also contributed significantly towards production. Use of fertilizers in
maize, wheat, barley and pea had negative impact but it may be due to underutilization of
other inputs. In Shimla, human labour and fertilizers has a positive and significant effect
on the production of maize, wheat, barley, potato and apple. Use of seed in wheat and
barley had negative impact but it may be due to underutilization of other inputs. Plant
protection chemicals are contributed significantly towards the production of potato and
apple. In Kinnaur, human labour is the major factor of production for all the crops and
contributed positively and significantly, followed by seed and fertilizers except in case of
pea and kidney bean. Plant protection chemicals are contributed significantly towards the
production of pea and apple. Except other crops, in case of ogla and fafra all the
explanatory variables collectively explained about less than 50 percent variation in crop
production and is statistically non-significant.
Income and Employment Generation from Livestock
Analyses of income and employment generation from various livestock activities
revealed that crossbred cow and buffalo are contributed significantly towards the net
income and employment in all zones. Net income from local cow is relatively more in
case of Solan and less in Shimla. Similarly, in case of crop production, cultivation of
vii
maize, paddy, pea, tomato, capsicum, potato, rajmash, ogla, fafra, kidney bean and apple
offered remunerative returns and employment to the farmers.
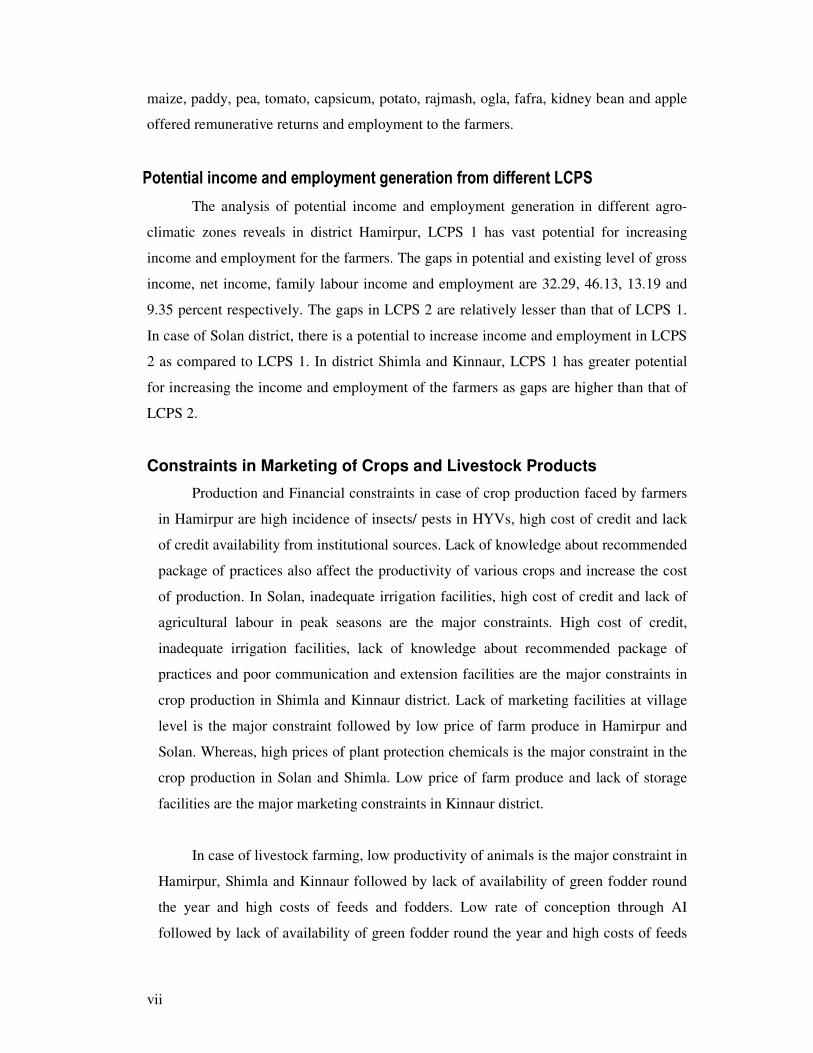
Potential income and employment generation from different LCPS
The analysis of potential income and employment generation in different agro-
climatic zones reveals in district Hamirpur, LCPS 1 has vast potential for increasing
income and employment for the farmers. The gaps in potential and existing level of gross
income, net income, family labour income and employment are 32.29, 46.13, 13.19 and
9.35 percent respectively. The gaps in LCPS 2 are relatively lesser than that of LCPS 1.
In case of Solan district, there is a potential to increase income and employment in LCPS
2 as compared to LCPS 1. In district Shimla and Kinnaur, LCPS 1 has greater potential
for increasing the income and employment of the farmers as gaps are higher than that of
LCPS 2.
Constraints in Marketing of Crops and Livestock Products
Production and Financial constraints in case of crop production faced by farmers
in Hamirpur are high incidence of insects/ pests in HYVs, high cost of credit and lack
of credit availability from institutional sources. Lack of knowledge about recommended
package of practices also affect the productivity of various crops and increase the cost
of production. In Solan, inadequate irrigation facilities, high cost of credit and lack of
agricultural labour in peak seasons are the major constraints. High cost of credit,
inadequate irrigation facilities, lack of knowledge about recommended package of
practices and poor communication and extension facilities are the major constraints in
crop production in Shimla and Kinnaur district. Lack of marketing facilities at village
level is the major constraint followed by low price of farm produce in Hamirpur and
Solan. Whereas, high prices of plant protection chemicals is the major constraint in the
crop production in Solan and Shimla. Low price of farm produce and lack of storage
facilities are the major marketing constraints in Kinnaur district.
In case of livestock farming, low productivity of animals is the major constraint in
Hamirpur, Shimla and Kinnaur followed by lack of availability of green fodder round
the year and high costs of feeds and fodders. Low rate of conception through AI
followed by lack of availability of green fodder round the year and high costs of feeds
viii
and fodders are the major production and financial constraint in Solan. Lack of
organized market and low price for crossbred milk are the major constraints in all the
four zones in the State.
For promotion of livestock- crop production system following approach is suggested:
Sustainable increase in food grain production through extension of improved crop
varieties, particularly in agro- pastoral areas, improving marginal croplands and
improving water use and irrigation system – including promotion of water harvesting and
efficient use technologies. The croplands should also provide more opportunities for
livestock development through processing of feed from agricultural by- products and
production of more forage and hay. The crop- livestock production system cannot
progress unless a productive crop farming system is established. Ensuring sufficient food
grain means developing a potential supply of concentrated feed with a high quality grain
base. Increasing the productivity of major cropland also means that more marginal areas
can be devoted to developing artificial grassland and cultivating perennial forage
integrated with crops.
ix
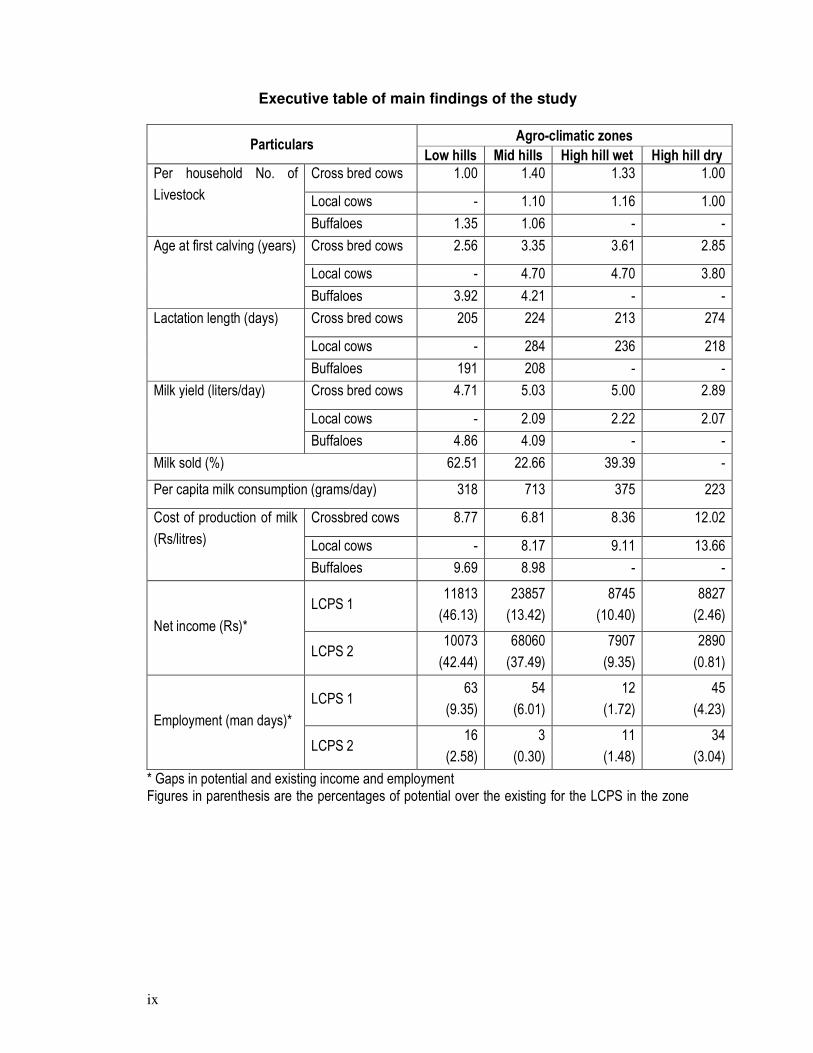
Executive table of main findings of the study
Particulars Agro-climatic zones
Low hills Mid hills High hill wet High hill dry
Per household No. of
Livestock
Cross bred cows 1.00 1.40 1.33 1.00
Local cows - 1.10 1.16 1.00
Buffaloes 1.35 1.06 - -
Age at first calving (years) Cross bred cows 2.56 3.35 3.61 2.85
Local cows - 4.70 4.70 3.80
Buffaloes 3.92 4.21 - -
Lactation length (days) Cross bred cows 205 224 213 274
Local cows - 284 236 218
Buffaloes 191 208 - -
Milk yield (liters/day) Cross bred cows 4.71 5.03 5.00 2.89
Local cows - 2.09 2.22 2.07
Buffaloes 4.86 4.09 - -
Milk sold (%) 62.51 22.66 39.39 -
Per capita milk consumption (grams/day) 318 713 375 223
Cost of production of milk
(Rs/litres)
Crossbred cows 8.77 6.81 8.36 12.02
Local cows - 8.17 9.11 13.66
Buffaloes 9.69 8.98 - -
Net income (Rs)*
LCPS 1 11813
(46.13)
23857
(13.42)
8745
(10.40)
8827
(2.46)
LCPS 2 10073
(42.44)
68060
(37.49)
7907
(9.35)
2890
(0.81)
Employment (man days)*
LCPS 1 63
(9.35)
54
(6.01)
12
(1.72)
45
(4.23)
LCPS 2 16
(2.58)
3
(0.30)
11
(1.48)
34
(3.04)
* Gaps in potential and existing income and employment Figures in parenthesis are the percentages of potential over the existing for the LCPS in the zone
1
Chapter-1
INTRODUCTION
1.1 Introduction
India is an agricultural country with very large livestock population. Animal
husbandry in India is closely interwoven with agriculture and obviously plays an
important role in the rural economy. Livestock are the main source of draught power in
agricultural operations and rural transportation. They provide essential food items like
milk and meat. Several other animal products obtained are hides and skins, bones, blood,
wool, etc. Animal husbandry and dairying so far have been treated as rural occupations
and only ancillary to crop farming. Little emphasis has been laid on developing them as
commercial ventures. The major problem being faced by this sector includes lack of
adequate feed and near absence of processing and marketing infrastructure in rural areas.
In Himachal Pradesh livestock are largely raised on pastures. Cattle of this area
are non-descript, short statured and of low productivity. Sheep and goats are as important
as cattle. The sheep reared in this state yield good quality wool. Temperate hilly regions,
of the Pradesh are ideally suited for the exotic high yielding milch cattle and Merino
sheep.
The rearing of livestock is an integral part of the State’s economy, providing
source of livelihood to most of people. Livestock rearing is practiced generally within the
framework of mixed farming. The livestock provide wool, mutton, milk, hides, skins,
motive power for agricultural operations and transport, manure, etc. and is of immense
economical value to the framers of the State, besides gainful employment to a large
section of population all the year round. The mechanized system of cultivation is
prevalent in the state, because of terraced fields and smallholdings. Thus, the bulk of
draft power requirements are provided by the bullocks. In most of the villages vehicular
traffic is not possible, therefore, most of the commodities are still transported by the pack
animals like ponies, yaks, mules, sheep, goats, etc.
2
Mixed farming systems involving a mixture of agricultural crops, pastures, and
livestock provide maximum production, as they are able to tap the rural resources
efficiently. In different agro-climatic zones of the country a number of combinations of
livestock and agricultural crops have been developed by the farmers through their past
experiences under the influence of resource constraints. However, very few investigations
were undertaken to study the structure and dynamics of these systems and to quantify
their contribution to food security and agricultural development.
Income from crop cultivation in India in general and Himachal Pradesh in
particular, where sizes of land holdings are very small, is not sufficient to meet the family
and farm expenditure of the households. Besides, income from crop cultivation is highly
instable due to climatic variations. To generate additional and regular cash income
throughout the year some subsidiary occupation is needed by the farmers. Commercial
livestock rearing is one of the most suitable enterprises which could be adopted by
farmers in hilly areas. Animal husbandry not only provides regular income and
employment to the households but also make tiny unviable farms economically viable by
diversifying and integrating farm activities.
Livestock provide draught power for agriculture, rural transport, food in the form
of milk and meat, raw materials in the form of wool, hair, hides, skins, bones etc., and
animal dung for use as crop manure as well as fuel for cooking and heating. Thus,
livestock play a vital role in providing employment and income in a predominantly
agrarian economy like India. Household member including children and women are
found to be involved in this labour intensive activity, whose work is evenly spread over
all days of the year.
Unfortunately livestock sector has received very little attention in the development
plans. The vital role of livestock in rural economy and the problem of improving their
productivity have not been properly recognized. Although reasonable success has been
achieved in providing veterinary cover and crossbreeding of indigenous livestock has
achieved limited success, but nothing has been achieved in the case of fodder
development. There is, thus an imperative need for larger investment in livestock
development, particularly in those programmes which improve animal nutrition and
management.
3
1.2 Need for the Study
The livestock sector information research has not received adequate attention as there
is no provision for regular collection and analysis of data on livestock except their
number enumerated through the Livestock Census. Efforts were limited to a few small
scale and ad-hoc surveys here and there. Only for the purposes of estimating production
of milk and other products. As a result very little is reliably known about many aspects of
livestock economy in different agro-climatic zones of the country, particularly about the
milk yield, meat output, feed consumption by various categories of animals, work output
of working animals, availability of various type of feed, morbidity and mortality of
animals, etc. Neither is the information available on income and employment generated
by various livestock activities. In short, absence of statistics on several aspects operates
as a constraint on a comprehensive analysis and understanding of the livestock economy.
The present study will try to fill-up this research and information gap in the livestock
sector of Himachal Pradesh.
The complex roles of trees, pastures, and other components in the household
farming systems have not yet been quantitatively analysed from the livestock rearing
point of view. In the absence of applied scientific investigations, so far no serious efforts
have been made for livestock policy recommendations, and to provide institutional and
policy support for strengthening and improving the existing livestock management
systems, and to draw lessons from indigenous knowledge. The proposed project is
intended to bridge this research gap.
In this study an attempt has been made to understand and analyse interactions,
between different components of farming systems so as to make recommendations to
improve the productivity and efficiency of the livestock- crop production systems in
different agro-climatic zones of Himachal Pradesh with the following specific objectives:
4
1.3 Objectives
9. To identify the various livestock-crop production systems in the different agro-
climatic regions of the country.
10. To identify the constraints in practicing various livestock-crop production
systems in different agro-climatic regions of the country.
11. To study the source structure and socio-economic profile of the farmers
practicing various livestock-crop production systems in different agro-climatic
regions of the country.
12. To study the economic characteristics and productivity level of various livestock’s
maintained and crops grown in different parts of the country in different systems.
13. To study the various breeding, feeding and management practices followed by the
farmers.
14. To ascertain the practices involved and the constraints faced in the marketing of
crops, livestock and livestock products.
15. To ascertain the input-output relationship for the various livestock-crop
production systems in the different agro-climatic regions of the country.
16. To ascertain the potential for increasing the income and employment through
adoption of improved technology in various livestock-production systems.
5
Chapter-2
AGRO-CLIMATIC AND SOCIO-ECONOMIC
DESCRIPTION OF THE ZONES IN HIMACHAL PRADESH
Himachal Pradesh is situated in the western Himalayan region in north-west of
India. The State is bordered by Jammu- Kashmir in the north, Punjab in the west and
south-west, Haryana in the south, Uttranchal in the south-east and Tibet in the east.
Himachal Pradesh is situated between 32° 12
/ 40
// north latitude and 75° 47
/ 55
// to 79
° 4
/
22// east longitude. Its altitude ranges from 450 mts. to 6500 mts above mean sea level.
There is a general increase in elevation from west to east and from south to north. There
is a great variation in the climatic conditions of the State due to variation in elevation and
aspect. The State is divided into four agro-climatic zones.
2.1 Agro- Climatic zones in Himachal Pradesh
The NARP has divided the state into the following four agro-climatic zones on the
basis of altitude, temperature, topography, rainfall and humidity: (a) Sub-mountain and
Low Hills sub-Tropical Zone, (b) Mid hills Sub-Humid Zone, (c) High Hills Temperate
Wet Zone, and (d) High Hills Temperate Dry Zone
(a) Sub-Mountain and Low Hills Sub-Tropical Zone
The area in this zone is situated up to 650 meters above mean sea level with an average
rainfall of 1000 mm. This zone is located in the Shiwalik belts of Himachal Pradesh and
occupies approximately 25 per cent of the geographical area and 38 per cent of the
cultivated area of the state. The population pressure is the highest in this zone. The main
crops cultivated in this zone are wheat, paddy, maize, soyabean, pulses, oilseeds and
barley. Citrus, mango and litchi are important fruit crops. Cattle dominate in the total
livestock population of 2.63 million. Out of total livestock population 41 per cent are
cattle and 25 per cent are buffaloes. Buffaloes are the main dairy animals reared in this
zone.
6
(b) Mid Hills Sub-Humid Zone
The elevation of this zone varies from 651 meters to 1800 meters above mean sea level.
The annual precipitation in this area varies from 1500 mm to 3000 mm, 70 per cent of
which is received during monsoon season. This zone comprises 41 per cent of the total
cultivated area. The texture of soils of this zone varies from loam to clay loam. These
are deficient in nitrogen and phosphorus with poor water and nutrient holding capacity.
Soils are acidic in reaction and respond to liming. Soil conservation and water
management are the main problems in this zone. Although this zone receives the
maximum rainfall, the agriculture still suffers from losses every now and then due to low
water holding capacity of the soils and erratic distribution of rainfall. The main crops
cultivated in this zone are wheat, paddy, maize, seed potato, sugarcane, pulses and
oilseeds. Stone and citrus fruits also occupy considerable area. Forestry and pastures
constitute an important component in this zone. This zone is milk shed area wherein a
number of chilling plants and milk processing plants have been installed. Out of total
livestock population of 1.26 million 50.7 per cent are cattle and 6.1 per cent are buffaloes.
(c) High Hills Temperate Wet Zone
The altitude of this zone ranges from 1801 meters to 2200 meters above mean sea level
and covers 18.4 per cent of the total cropped area of the State. The soils are shallow in
depth, acidic in reaction and silt loam to loam in texture. The soils are deficient in
nitrogen and phosphorus. Terraced farming is practised in this zone. The main crops are
wheat, maize, paddy, barley, pulses and oilseeds. Mostly rain fed farming is practised.
Soil erosion, low fertility and inadequate water management are the main problems. The
average rainfall is about 1000 mm which is mainly received during monsoon months.
This zone is suitable for raising off-season vegetables and seed production of temperate
vegetables. Apples, other temperate fruits and nuts are important horticultural crops
grown in this zone. Sheep and milch cattle dairying also supplement the income of the
farmers in this zone. Cattle are the main milch animals accounting for 50 per cent of total
livestock. Sheep and goats constituted about 47 per cent of total livestock population of
4.39 million.
7
(d) High Hills Temperate Dry Zone
The area in this zone is situated above 2201 meters above mean sea level. This zone
remains covered with snow for nearly 5-6 months a year i.e. from December to April.
The rainfall is very low (about 25 cm) and the temperature remains low throughout the
year. The soils are sandy loam in texture and neutral to alkaline in reaction and low in
fertility. Practically no crop can be raised without irrigation. Gravitational channels
(kuhls) are the only source of irrigation in this zone. The soil erosion and water
management are the main problems in this zone. Potato, barley, wheat, buck wheat, peas,
minor millets, temperate vegetables and dry fruits are the main crops. Sheep and goat
rearing is the main source of income. The flocks migrate to low hills in winter due to
snowfall in this zone. About 66 percent of total livestock population of 0.76 million are
sheep and goats.
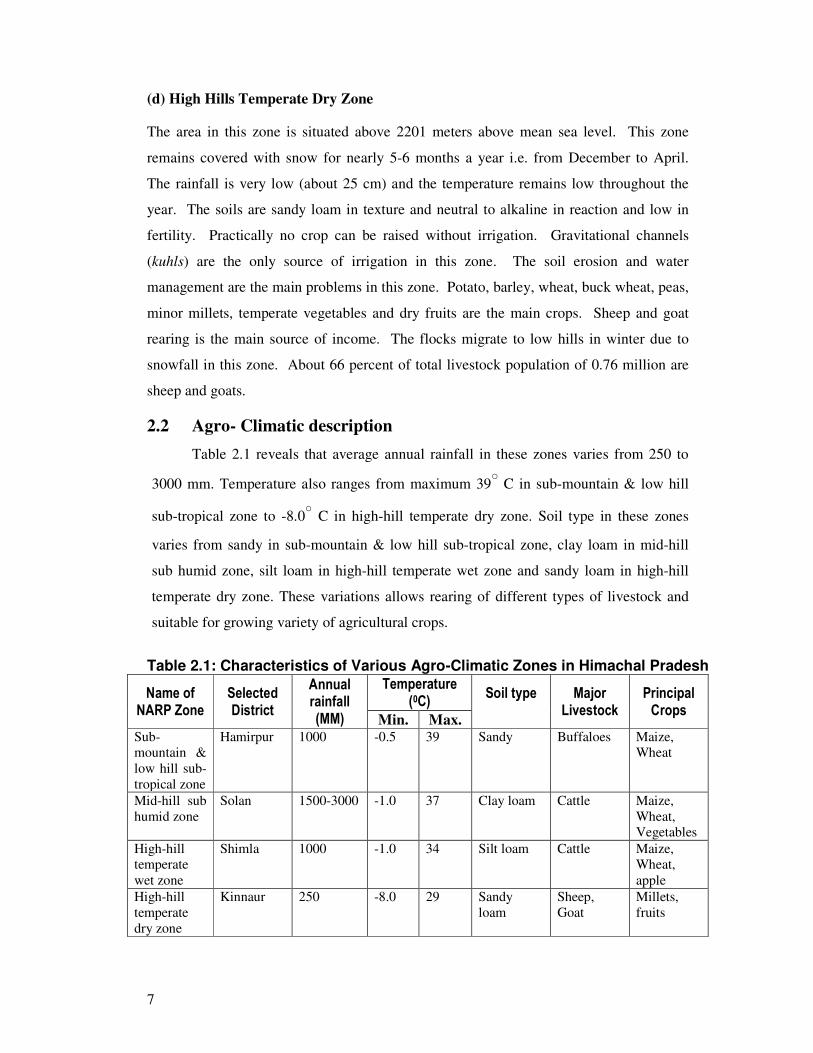
2.2 Agro- Climatic description
Table 2.1 reveals that average annual rainfall in these zones varies from 250 to
3000 mm. Temperature also ranges from maximum 39○ C in sub-mountain & low hill
sub-tropical zone to -8.0○ C in high-hill temperate dry zone. Soil type in these zones
varies from sandy in sub-mountain & low hill sub-tropical zone, clay loam in mid-hill
sub humid zone, silt loam in high-hill temperate wet zone and sandy loam in high-hill
temperate dry zone. These variations allows rearing of different types of livestock and
suitable for growing variety of agricultural crops.
Table 2.1: Characteristics of Various Agro-Climatic Zones in Himachal Pradesh
Name of NARP Zone
Selected District
Annual rainfall (MM)
Temperature (0C)
Soil type
Major Livestock
Principal Crops
Min. Max. Sub-
mountain &
low hill sub-
tropical zone
Hamirpur 1000 -0.5 39 Sandy Buffaloes Maize,
Wheat
Mid-hill sub
humid zone
Solan 1500-3000 -1.0 37 Clay loam Cattle Maize,
Wheat,
Vegetables
High-hill
temperate
wet zone
Shimla 1000 -1.0 34 Silt loam Cattle Maize,
Wheat,
apple
High-hill
temperate
dry zone
Kinnaur 250 -8.0 29 Sandy
loam
Sheep,
Goat
Millets,
fruits
8
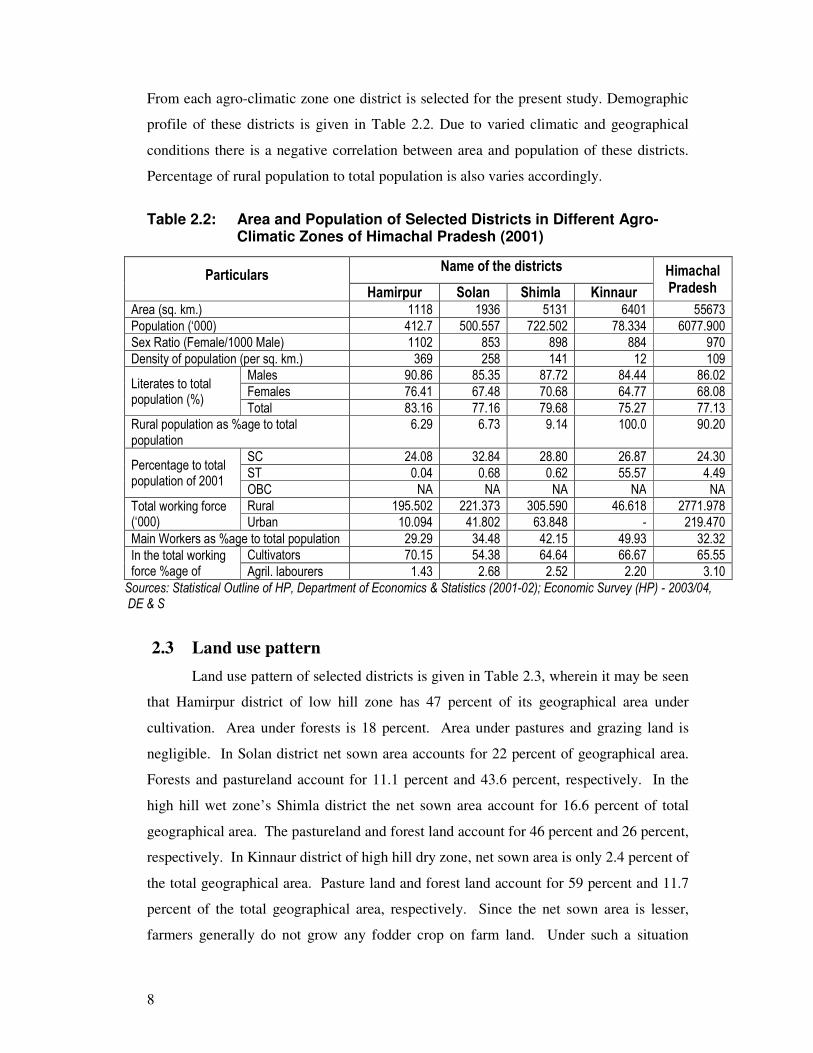
From each agro-climatic zone one district is selected for the present study. Demographic
profile of these districts is given in Table 2.2. Due to varied climatic and geographical
conditions there is a negative correlation between area and population of these districts.
Percentage of rural population to total population is also varies accordingly.
Table 2.2: Area and Population of Selected Districts in Different Agro-
Climatic Zones of Himachal Pradesh (2001)
Particulars Name of the districts Himachal
Pradesh Hamirpur Solan Shimla Kinnaur Area (sq. km.) 1118 1936 5131 6401 55673
Population (‘000) 412.7 500.557 722.502 78.334 6077.900
Sex Ratio (Female/1000 Male) 1102 853 898 884 970
Density of population (per sq. km.) 369 258 141 12 109
Literates to total population (%)
Males 90.86 85.35 87.72 84.44 86.02
Females 76.41 67.48 70.68 64.77 68.08
Total 83.16 77.16 79.68 75.27 77.13
Rural population as %age to total population
6.29 6.73 9.14 100.0 90.20
Percentage to total population of 2001
SC 24.08 32.84 28.80 26.87 24.30
ST 0.04 0.68 0.62 55.57 4.49
OBC NA NA NA NA NA
Total working force (‘000)
Rural 195.502 221.373 305.590 46.618 2771.978
Urban 10.094 41.802 63.848 - 219.470
Main Workers as %age to total population 29.29 34.48 42.15 49.93 32.32
In the total working force %age of
Cultivators 70.15 54.38 64.64 66.67 65.55
Agril. labourers 1.43 2.68 2.52 2.20 3.10
Sources: Statistical Outline of HP, Department of Economics & Statistics (2001-02); Economic Survey (HP) - 2003/04, DE & S
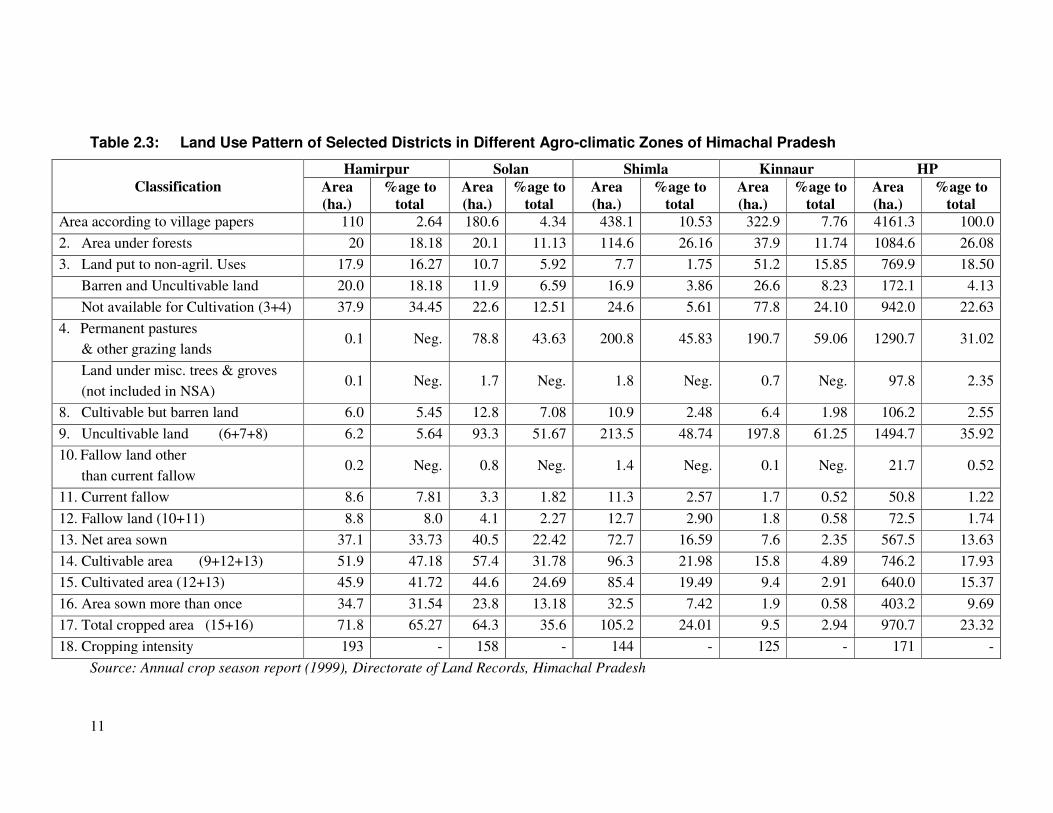
2.3 Land use pattern
Land use pattern of selected districts is given in Table 2.3, wherein it may be seen
that Hamirpur district of low hill zone has 47 percent of its geographical area under
cultivation. Area under forests is 18 percent. Area under pastures and grazing land is
negligible. In Solan district net sown area accounts for 22 percent of geographical area.
Forests and pastureland account for 11.1 percent and 43.6 percent, respectively. In the
high hill wet zone’s Shimla district the net sown area account for 16.6 percent of total
geographical area. The pastureland and forest land account for 46 percent and 26 percent,
respectively. In Kinnaur district of high hill dry zone, net sown area is only 2.4 percent of
the total geographical area. Pasture land and forest land account for 59 percent and 11.7
percent of the total geographical area, respectively. Since the net sown area is lesser,
farmers generally do not grow any fodder crop on farm land. Under such a situation
9
pasture land and forest land assume added importance from the animal husbandry point of
view. It could be seen in the Table 2.3 that as one moves from low hills towards high hill
zones, the area under common pasture and grazing lands increases. And this affects the
number and types of animals kept on the farms. The population density decreases as the
elevation of districts increases.
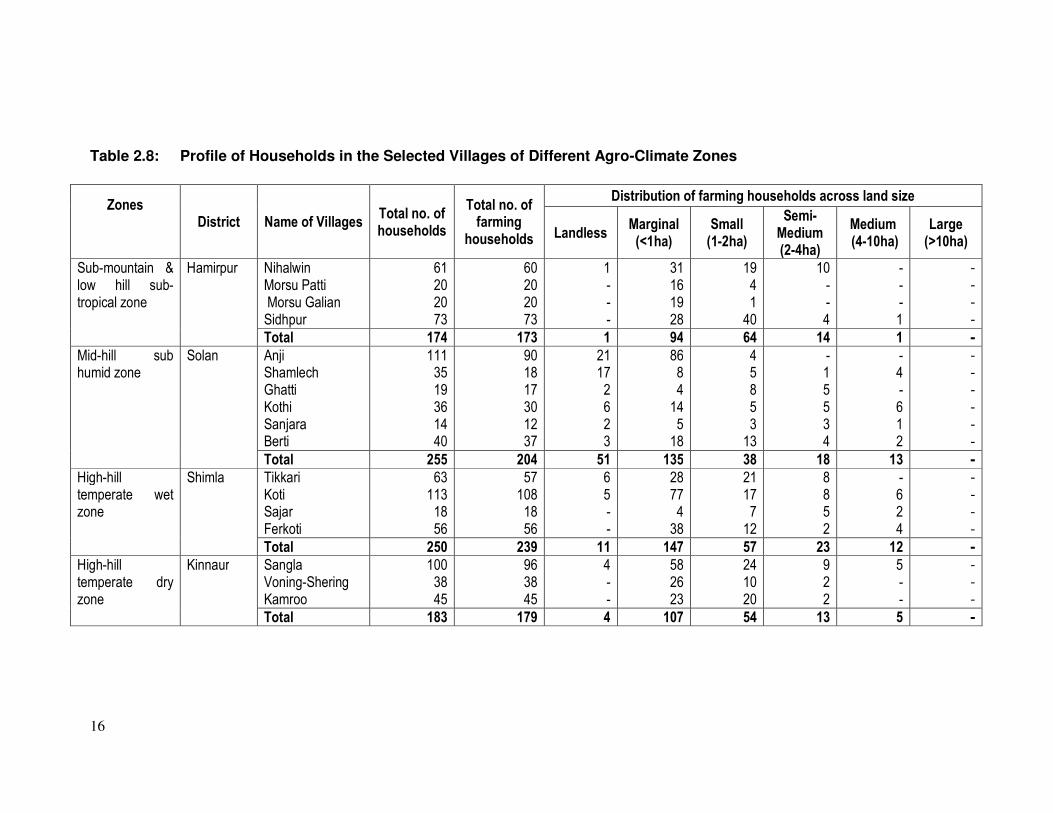
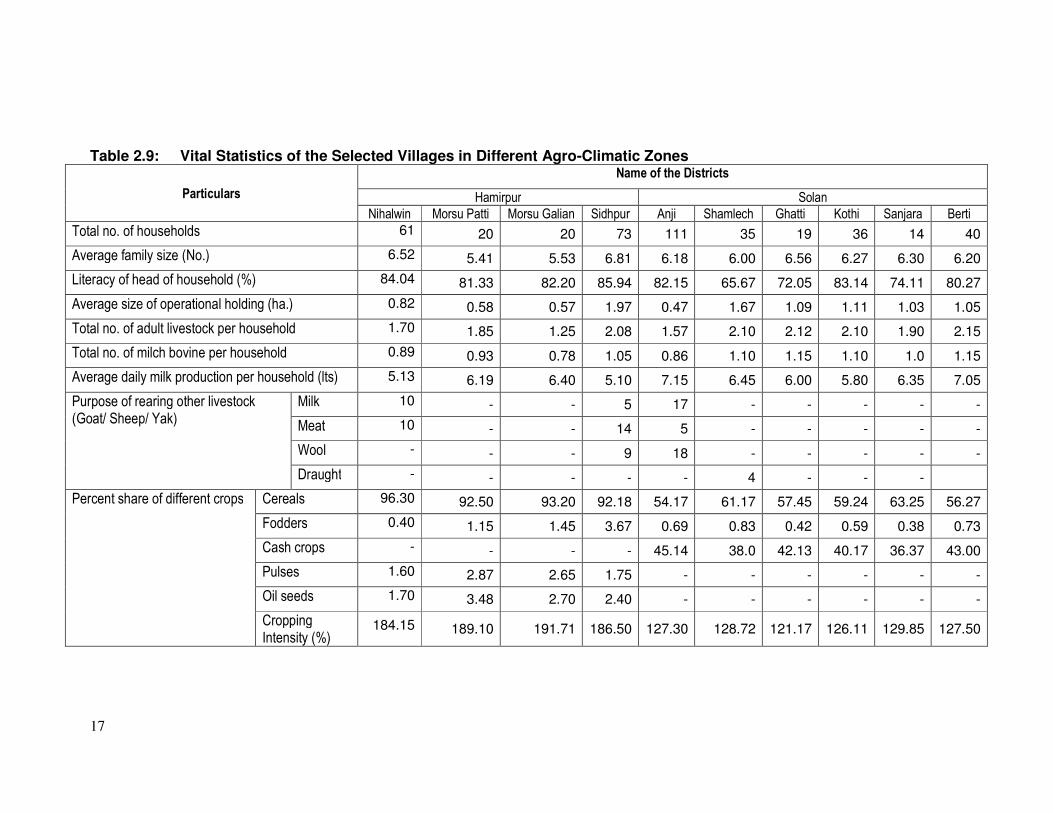
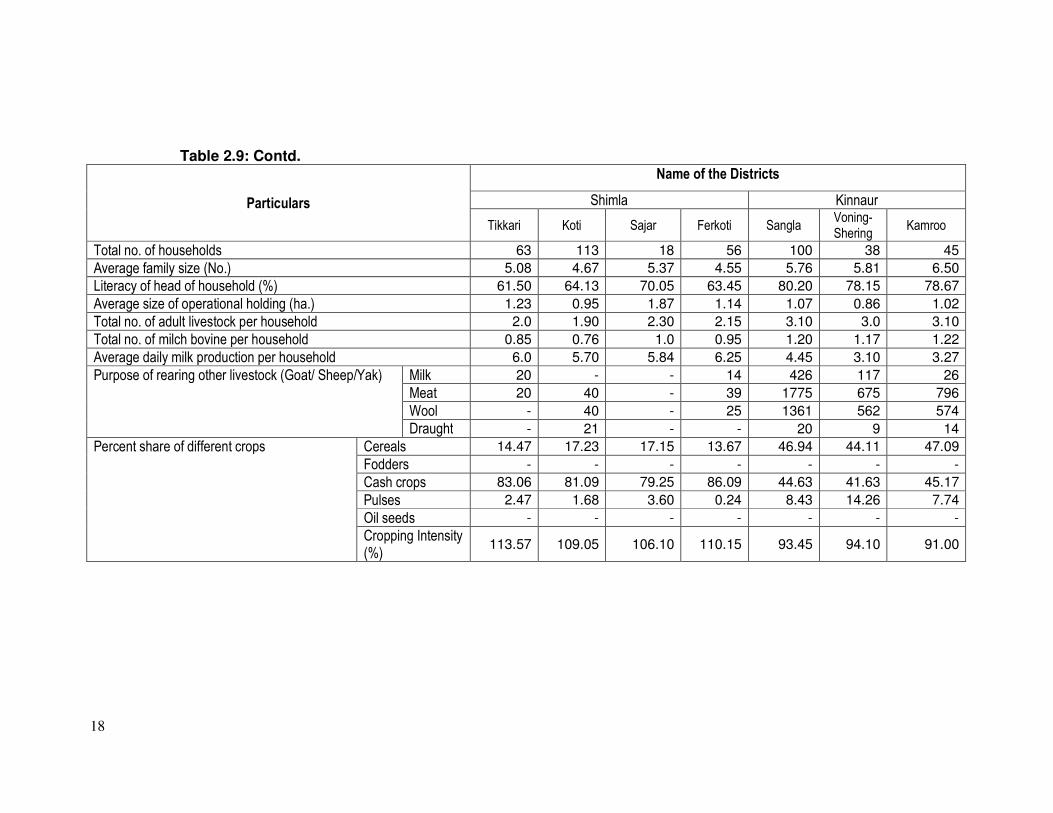
2.4 Demographic profile
Demographic profiles of households in the selected villages of different agro-
climate zones are given in Table 2.8 and 2.9. Average family size in sampled villages of
district Hamirpur of low- hill sub- tropical zone is ranges from 5.41 to 6.81 persons. In
district Solan of mid-hill sub humid zone average family size ranges from 6.00 to 6.56.
The average family size in district Shimla of high hill temperate dry zone and district
Kinnaur of high-hill temperate dry zone ranges from 4.55 to 5.37 and 5.76 to 6.50 persons
respectively. Literacy status of the head of household in sampled villages revealed that
Hamirpur district has highest literacy rate, ranges from 81.33 to 85.94 percent followed
by Kinnaur, 78.15 to 80.2 percent, Solan 65.67 to 83.14 and Shimla 61.50 to 70.05
percent.
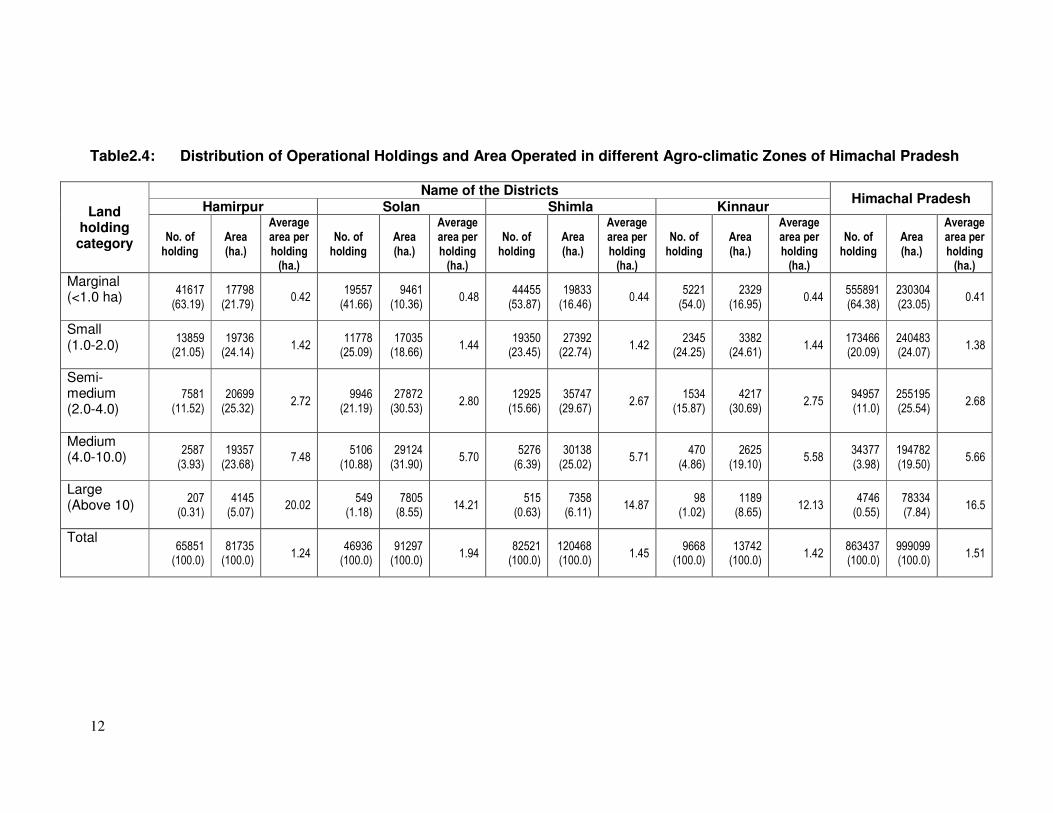
2.5 Operational holdings
As revealed from Table 2.4 average size of land holding in the State as a whole is
low (1.5 hectares). In Hamirpur district (low hill zone) average holding size is 1.24
hectares, in Solan district 1.94 hectares, in Shimla district 1.45 hectares, and in Kinnaur
district it is 1.42 hectares. The marginal and small farms together account for 84 percent
of total holdings in the State. The large farms above 10 hectares are rare. Irrigation
facilities are meagre. In the dry zone, cultivation is done mainly on irrigated fields.
Average land holding size in villages selected for the study is presented in Table 2.9. In
district Hamirpur it ranges from 0.57 to 1.97 hectares, whereas in district Solan average
land holding size ranges from 0.47 to 1.67 hectares. In Shimla and Kinnaur, it ranges
from 0.95 to 1.87 and 0.86 to 1.07 hectares respectively.
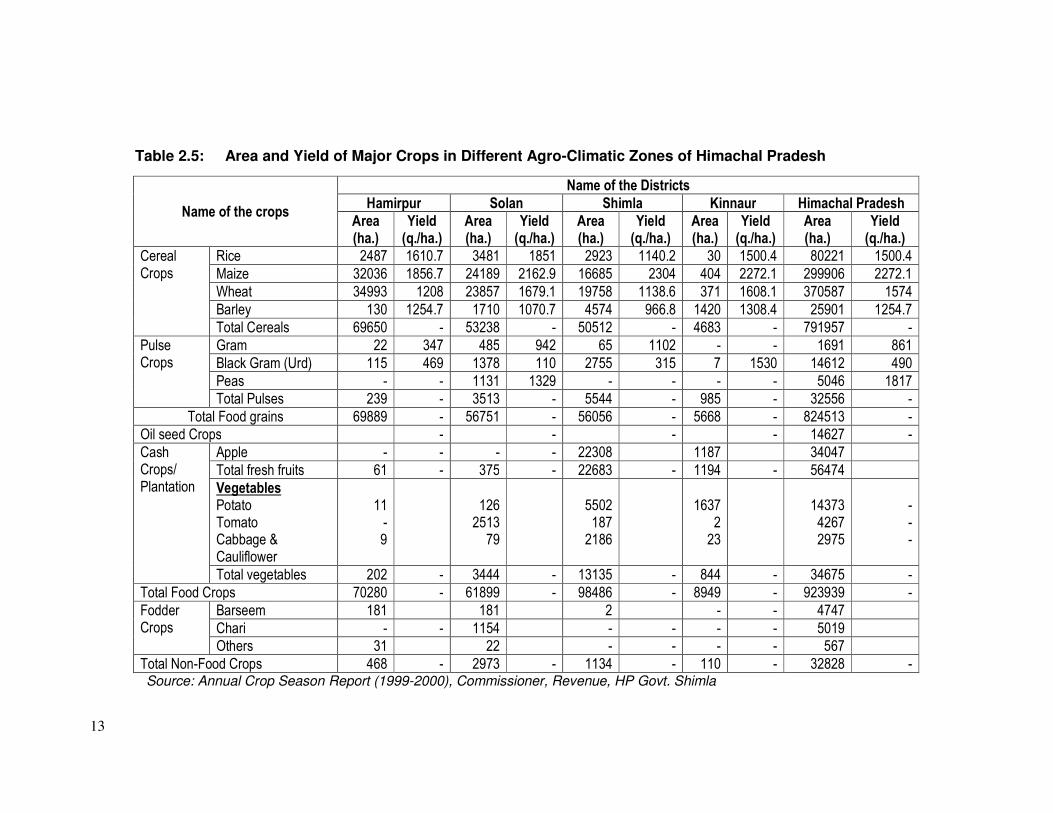
2.6 Cropping pattern
In low and mid hill zones cultivation is generally done under rain-fed conditions.
Farmers do not grow fodder crops on their farms. They devote their land to cereals,
10
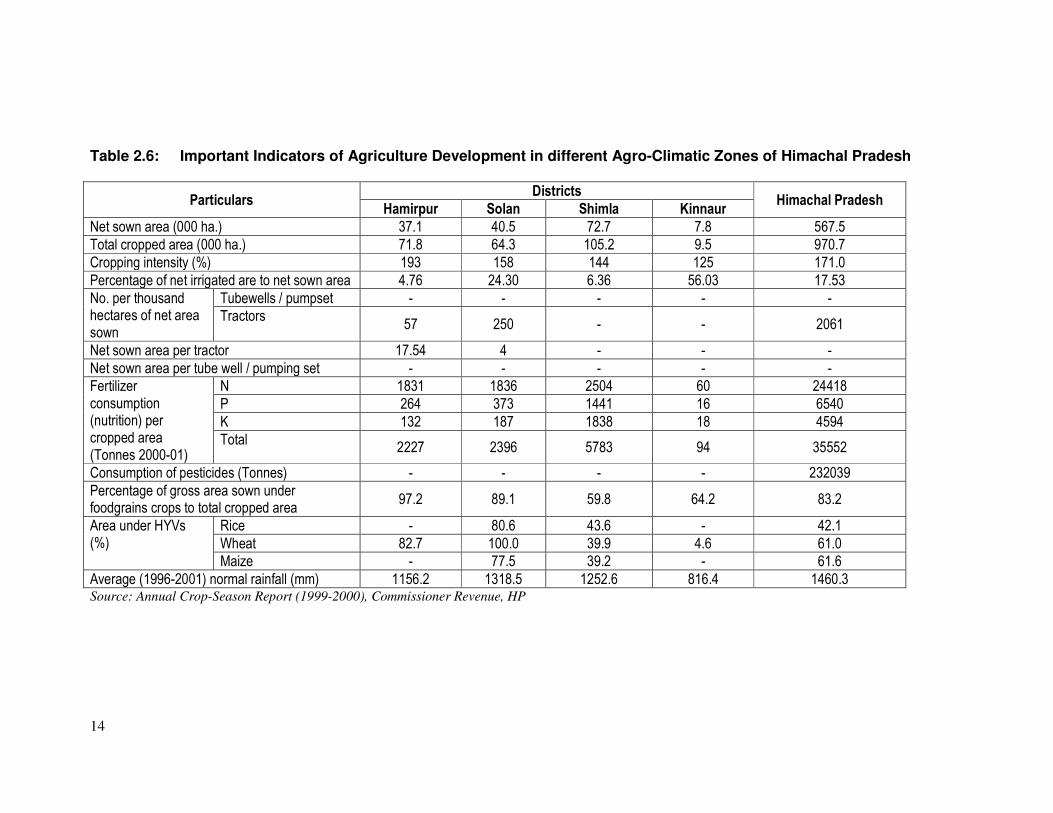
pulses oilseeds, and fruits and vegetable crops (see Table 2.5). Not only the farm size is
smaller, the yields of various crops grown in various zones are also generally lower in the
state. Table 2.6 presents important indicators of agricultural development in different
agro- climatic zones.
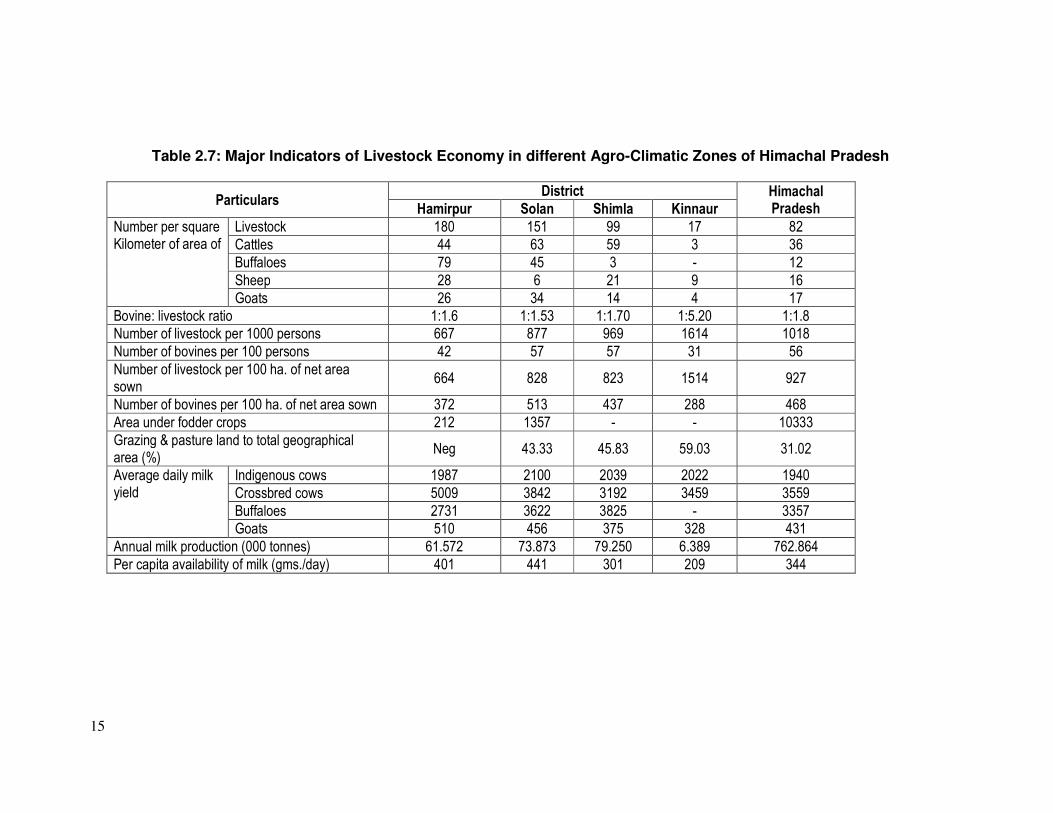
2.7 Livestock economy
The livestock economy in the State is mainly bovine based in the low and mid hill
zones, where as it is goat/sheep based in the high hill dry zone (see Table 2.7). The
pressure of animals on grazing land is quite high. The density of livestock per sq. km is
higher in low hills and lower in high hill zones. The yield of crossbred cow is
significantly higher than local cow. Per capita milk availability is higher in Solan district
and low in Kinnaur district.
11
Table 2.3: Land Use Pattern of Selected Districts in Different Agro-climatic Zones of Himachal Pradesh
Classification
Hamirpur Solan Shimla Kinnaur HP
Area
(ha.)
%age to
total
Area
(ha.)
%age to
total
Area
(ha.)
%age to
total
Area
(ha.)
%age to
total
Area
(ha.)
%age to
total
Area according to village papers 110 2.64 180.6 4.34 438.1 10.53 322.9 7.76 4161.3 100.0
2. Area under forests 20 18.18 20.1 11.13 114.6 26.16 37.9 11.74 1084.6 26.08
3. Land put to non-agril. Uses 17.9 16.27 10.7 5.92 7.7 1.75 51.2 15.85 769.9 18.50
Barren and Uncultivable land 20.0 18.18 11.9 6.59 16.9 3.86 26.6 8.23 172.1 4.13
Not available for Cultivation (3+4) 37.9 34.45 22.6 12.51 24.6 5.61 77.8 24.10 942.0 22.63
4. Permanent pastures
& other grazing lands 0.1 Neg. 78.8 43.63 200.8 45.83 190.7 59.06 1290.7 31.02
Land under misc. trees & groves
(not included in NSA) 0.1 Neg. 1.7 Neg. 1.8 Neg. 0.7 Neg. 97.8 2.35
8. Cultivable but barren land 6.0 5.45 12.8 7.08 10.9 2.48 6.4 1.98 106.2 2.55
9. Uncultivable land (6+7+8) 6.2 5.64 93.3 51.67 213.5 48.74 197.8 61.25 1494.7 35.92
10. Fallow land other
than current fallow 0.2 Neg. 0.8 Neg. 1.4 Neg. 0.1 Neg. 21.7 0.52
11. Current fallow 8.6 7.81 3.3 1.82 11.3 2.57 1.7 0.52 50.8 1.22
12. Fallow land (10+11) 8.8 8.0 4.1 2.27 12.7 2.90 1.8 0.58 72.5 1.74
13. Net area sown 37.1 33.73 40.5 22.42 72.7 16.59 7.6 2.35 567.5 13.63
14. Cultivable area (9+12+13) 51.9 47.18 57.4 31.78 96.3 21.98 15.8 4.89 746.2 17.93
15. Cultivated area (12+13) 45.9 41.72 44.6 24.69 85.4 19.49 9.4 2.91 640.0 15.37
16. Area sown more than once 34.7 31.54 23.8 13.18 32.5 7.42 1.9 0.58 403.2 9.69
17. Total cropped area (15+16) 71.8 65.27 64.3 35.6 105.2 24.01 9.5 2.94 970.7 23.32
18. Cropping intensity 193 - 158 - 144 - 125 - 171 -
Source: Annual crop season report (1999), Directorate of Land Records, Himachal Pradesh
12
Table2.4: Distribution of Operational Holdings and Area Operated in different Agro-climatic Zones of Himachal Pradesh
Land holding category
Name of the Districts Himachal Pradesh
Hamirpur Solan Shimla Kinnaur
No. of holding
Area (ha.)
Average area per holding (ha.)
No. of holding
Area (ha.)
Average area per holding (ha.)
No. of holding
Area (ha.)
Average area per holding (ha.)
No. of holding
Area (ha.)
Average area per holding (ha.)
No. of holding
Area (ha.)
Average area per holding (ha.)
Marginal (<1.0 ha)
41617 (63.19)
17798 (21.79)
0.42 19557 (41.66)
9461 (10.36)
0.48 44455 (53.87)
19833 (16.46)
0.44 5221 (54.0)
2329 (16.95)
0.44 555891 (64.38)
230304 (23.05)
0.41
Small (1.0-2.0)
13859 (21.05)
19736 (24.14)
1.42 11778 (25.09)
17035 (18.66)
1.44 19350 (23.45)
27392 (22.74)
1.42 2345
(24.25) 3382
(24.61) 1.44
173466 (20.09)
240483 (24.07)
1.38
Semi-medium (2.0-4.0)
7581 (11.52)
20699 (25.32)
2.72 9946
(21.19) 27872 (30.53)
2.80 12925 (15.66)
35747 (29.67)
2.67 1534
(15.87) 4217
(30.69) 2.75
94957 (11.0)
255195 (25.54)
2.68
Medium (4.0-10.0)
2587 (3.93)
19357 (23.68)
7.48 5106
(10.88) 29124 (31.90)
5.70 5276 (6.39)
30138 (25.02)
5.71 470
(4.86) 2625
(19.10) 5.58
34377 (3.98)
194782 (19.50)
5.66
Large (Above 10)
207 (0.31)
4145 (5.07)
20.02 549
(1.18) 7805 (8.55)
14.21 515
(0.63) 7358 (6.11)
14.87 98
(1.02) 1189 (8.65)
12.13 4746 (0.55)
78334 (7.84)
16.5
Total
65851 (100.0)
81735 (100.0)
1.24 46936 (100.0)
91297 (100.0)
1.94 82521 (100.0)
120468 (100.0)
1.45 9668
(100.0) 13742 (100.0)
1.42 863437 (100.0)
999099 (100.0)
1.51
13
Table 2.5: Area and Yield of Major Crops in Different Agro-Climatic Zones of Himachal Pradesh
Name of the crops
Name of the Districts
Hamirpur Solan Shimla Kinnaur Himachal Pradesh
Area (ha.)
Yield (q./ha.)
Area (ha.)
Yield (q./ha.)
Area (ha.)
Yield (q./ha.)
Area (ha.)
Yield (q./ha.)
Area (ha.)
Yield (q./ha.)
Cereal Crops
Rice 2487 1610.7 3481 1851 2923 1140.2 30 1500.4 80221 1500.4
Maize 32036 1856.7 24189 2162.9 16685 2304 404 2272.1 299906 2272.1
Wheat 34993 1208 23857 1679.1 19758 1138.6 371 1608.1 370587 1574
Barley 130 1254.7 1710 1070.7 4574 966.8 1420 1308.4 25901 1254.7
Total Cereals 69650 - 53238 - 50512 - 4683 - 791957 -
Pulse Crops
Gram 22 347 485 942 65 1102 - - 1691 861
Black Gram (Urd) 115 469 1378 110 2755 315 7 1530 14612 490
Peas - - 1131 1329 - - - - 5046 1817
Total Pulses 239 - 3513 - 5544 - 985 - 32556 -
Total Food grains 69889 - 56751 - 56056 - 5668 - 824513 -
Oil seed Crops - - - - 14627 -
Cash Crops/ Plantation
Apple - - - - 22308 1187 34047
Total fresh fruits 61 - 375 - 22683 - 1194 - 56474
Vegetables Potato Tomato Cabbage & Cauliflower
11 - 9
126 2513 79
5502 187 2186
1637
2 23
14373 4267 2975
- - -
Total vegetables 202 - 3444 - 13135 - 844 - 34675 -
Total Food Crops 70280 - 61899 - 98486 - 8949 - 923939 -
Fodder Crops
Barseem 181 181 2 - - 4747
Chari - - 1154 - - - - 5019
Others 31 22 - - - - 567
Total Non-Food Crops 468 - 2973 - 1134 - 110 - 32828 - Source: Annual Crop Season Report (1999-2000), Commissioner, Revenue, HP Govt. Shimla
14
Table 2.6: Important Indicators of Agriculture Development in different Agro-Climatic Zones of Himachal Pradesh
Particulars Districts
Himachal Pradesh Hamirpur Solan Shimla Kinnaur
Net sown area (000 ha.) 37.1 40.5 72.7 7.8 567.5
Total cropped area (000 ha.) 71.8 64.3 105.2 9.5 970.7
Cropping intensity (%) 193 158 144 125 171.0
Percentage of net irrigated are to net sown area 4.76 24.30 6.36 56.03 17.53
No. per thousand hectares of net area sown
Tubewells / pumpset - - - - -
Tractors 57 250 - - 2061
Net sown area per tractor 17.54 4 - - -
Net sown area per tube well / pumping set - - - - -
Fertilizer consumption (nutrition) per cropped area (Tonnes 2000-01)
N 1831 1836 2504 60 24418
P 264 373 1441 16 6540
K 132 187 1838 18 4594
Total 2227 2396 5783 94 35552
Consumption of pesticides (Tonnes) - - - - 232039
Percentage of gross area sown under foodgrains crops to total cropped area
97.2 89.1 59.8 64.2 83.2
Area under HYVs (%)
Rice - 80.6 43.6 - 42.1
Wheat 82.7 100.0 39.9 4.6 61.0
Maize - 77.5 39.2 - 61.6
Average (1996-2001) normal rainfall (mm) 1156.2 1318.5 1252.6 816.4 1460.3 Source: Annual Crop-Season Report (1999-2000), Commissioner Revenue, HP
15
Table 2.7: Major Indicators of Livestock Economy in different Agro-Climatic Zones of Himachal Pradesh
Particulars District Himachal
Pradesh Hamirpur Solan Shimla Kinnaur
Number per square Kilometer of area of
Livestock 180 151 99 17 82
Cattles 44 63 59 3 36
Buffaloes 79 45 3 - 12
Sheep 28 6 21 9 16
Goats 26 34 14 4 17
Bovine: livestock ratio 1:1.6 1:1.53 1:1.70 1:5.20 1:1.8
Number of livestock per 1000 persons 667 877 969 1614 1018
Number of bovines per 100 persons 42 57 57 31 56
Number of livestock per 100 ha. of net area sown
664 828 823 1514 927
Number of bovines per 100 ha. of net area sown 372 513 437 288 468
Area under fodder crops 212 1357 - - 10333
Grazing & pasture land to total geographical area (%)
Neg 43.33 45.83 59.03 31.02
Average daily milk yield
Indigenous cows 1987 2100 2039 2022 1940
Crossbred cows 5009 3842 3192 3459 3559
Buffaloes 2731 3622 3825 - 3357
Goats 510 456 375 328 431
Annual milk production (000 tonnes) 61.572 73.873 79.250 6.389 762.864
Per capita availability of milk (gms./day) 401 441 301 209 344
16
Table 2.8: Profile of Households in the Selected Villages of Different Agro-Climate Zones
Zones
District Name of Villages Total no. of households
Total no. of farming
households
Distribution of farming households across land size
Landless Marginal (<1ha)
Small (1-2ha)
Semi-Medium (2-4ha)
Medium (4-10ha)
Large (>10ha)
Sub-mountain & low hill sub-tropical zone
Hamirpur Nihalwin Morsu Patti Morsu Galian Sidhpur
61 20 20 73
60 20 20 73
1 - - -
31 16 19 28
19 4 1 40
10 - - 4
- - - 1
- - - -
Total 174 173 1 94 64 14 1 -
Mid-hill sub humid zone
Solan Anji Shamlech Ghatti Kothi Sanjara Berti
111 35 19 36 14 40
90 18 17 30 12 37
21 17 2 6 2 3
86 8 4 14 5 18
4 5 8 5 3 13
- 1 5 5 3 4
- 4 - 6 1 2
- - - - - -
Total 255 204 51 135 38 18 13 - High-hill temperate wet zone
Shimla Tikkari Koti Sajar Ferkoti
63 113 18 56
57 108 18 56
6 5 - -
28 77 4 38
21 17 7 12
8 8 5 2
- 6 2 4
- - - -
Total 250 239 11 147 57 23 12 - High-hill temperate dry zone
Kinnaur Sangla Voning-Shering Kamroo
100 38 45
96 38 45
4 - -
58 26 23
24 10 20
9 2 2
5 - -
- - -
Total 183 179 4 107 54 13 5 -
17
Table 2.9: Vital Statistics of the Selected Villages in Different Agro-Climatic Zones
Particulars
Name of the Districts
Hamirpur Solan
Nihalwin Morsu Patti Morsu Galian Sidhpur Anji Shamlech Ghatti Kothi Sanjara Berti
Total no. of households 61 20 20 73 111 35 19 36 14 40
Average family size (No.) 6.52 5.41 5.53 6.81 6.18 6.00 6.56 6.27 6.30 6.20
Literacy of head of household (%) 84.04 81.33 82.20 85.94 82.15 65.67 72.05 83.14 74.11 80.27
Average size of operational holding (ha.) 0.82 0.58 0.57 1.97 0.47 1.67 1.09 1.11 1.03 1.05
Total no. of adult livestock per household 1.70 1.85 1.25 2.08 1.57 2.10 2.12 2.10 1.90 2.15
Total no. of milch bovine per household 0.89 0.93 0.78 1.05 0.86 1.10 1.15 1.10 1.0 1.15
Average daily milk production per household (lts) 5.13 6.19 6.40 5.10 7.15 6.45 6.00 5.80 6.35 7.05
Purpose of rearing other livestock (Goat/ Sheep/ Yak)
Milk 10 - - 5 17 - - - - -
Meat 10 - - 14 5 - - - - -
Wool - - - 9 18 - - - - -
Draught - - - - - 4 - - -
Percent share of different crops Cereals 96.30 92.50 93.20 92.18 54.17 61.17 57.45 59.24 63.25 56.27
Fodders 0.40 1.15 1.45 3.67 0.69 0.83 0.42 0.59 0.38 0.73
Cash crops - - - - 45.14 38.0 42.13 40.17 36.37 43.00
Pulses 1.60 2.87 2.65 1.75 - - - - - -
Oil seeds 1.70 3.48 2.70 2.40 - - - - - -
Cropping Intensity (%)
184.15 189.10 191.71 186.50 127.30 128.72 121.17 126.11 129.85 127.50
18
Table 2.9: Contd.
Particulars
Name of the Districts
Shimla Kinnaur
Tikkari Koti Sajar Ferkoti Sangla Voning-Shering
Kamroo
Total no. of households 63 113 18 56 100 38 45
Average family size (No.) 5.08 4.67 5.37 4.55 5.76 5.81 6.50
Literacy of head of household (%) 61.50 64.13 70.05 63.45 80.20 78.15 78.67
Average size of operational holding (ha.) 1.23 0.95 1.87 1.14 1.07 0.86 1.02
Total no. of adult livestock per household 2.0 1.90 2.30 2.15 3.10 3.0 3.10
Total no. of milch bovine per household 0.85 0.76 1.0 0.95 1.20 1.17 1.22
Average daily milk production per household 6.0 5.70 5.84 6.25 4.45 3.10 3.27
Purpose of rearing other livestock (Goat/ Sheep/Yak) Milk 20 - - 14 426 117 26
Meat 20 40 - 39 1775 675 796
Wool - 40 - 25 1361 562 574
Draught - 21 - - 20 9 14
Percent share of different crops Cereals 14.47 17.23 17.15 13.67 46.94 44.11 47.09
Fodders - - - - - - -
Cash crops 83.06 81.09 79.25 86.09 44.63 41.63 45.17
Pulses 2.47 1.68 3.60 0.24 8.43 14.26 7.74
Oil seeds - - - - - - -
Cropping Intensity (%)
113.57 109.05 106.10 110.15 93.45 94.10 91.00
19
Chapter-3
METHODOLOGY
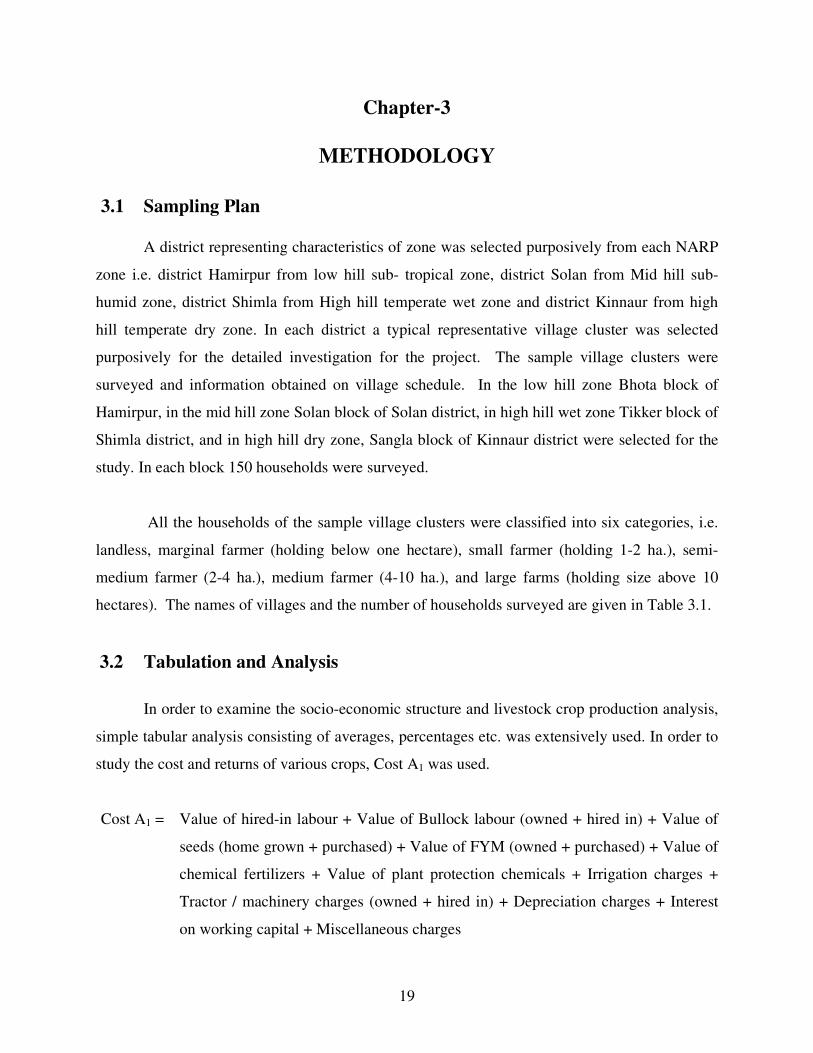
3.1 Sampling Plan
A district representing characteristics of zone was selected purposively from each NARP
zone i.e. district Hamirpur from low hill sub- tropical zone, district Solan from Mid hill sub-
humid zone, district Shimla from High hill temperate wet zone and district Kinnaur from high
hill temperate dry zone. In each district a typical representative village cluster was selected
purposively for the detailed investigation for the project. The sample village clusters were
surveyed and information obtained on village schedule. In the low hill zone Bhota block of
Hamirpur, in the mid hill zone Solan block of Solan district, in high hill wet zone Tikker block of
Shimla district, and in high hill dry zone, Sangla block of Kinnaur district were selected for the
study. In each block 150 households were surveyed.
All the households of the sample village clusters were classified into six categories, i.e.
landless, marginal farmer (holding below one hectare), small farmer (holding 1-2 ha.), semi-
medium farmer (2-4 ha.), medium farmer (4-10 ha.), and large farms (holding size above 10
hectares). The names of villages and the number of households surveyed are given in Table 3.1.
3.2 Tabulation and Analysis
In order to examine the socio-economic structure and livestock crop production analysis,
simple tabular analysis consisting of averages, percentages etc. was extensively used. In order to
study the cost and returns of various crops, Cost A1 was used.
Cost A1 = Value of hired-in labour + Value of Bullock labour (owned + hired in) + Value of
seeds (home grown + purchased) + Value of FYM (owned + purchased) + Value of
chemical fertilizers + Value of plant protection chemicals + Irrigation charges +
Tractor / machinery charges (owned + hired in) + Depreciation charges + Interest
on working capital + Miscellaneous charges
20
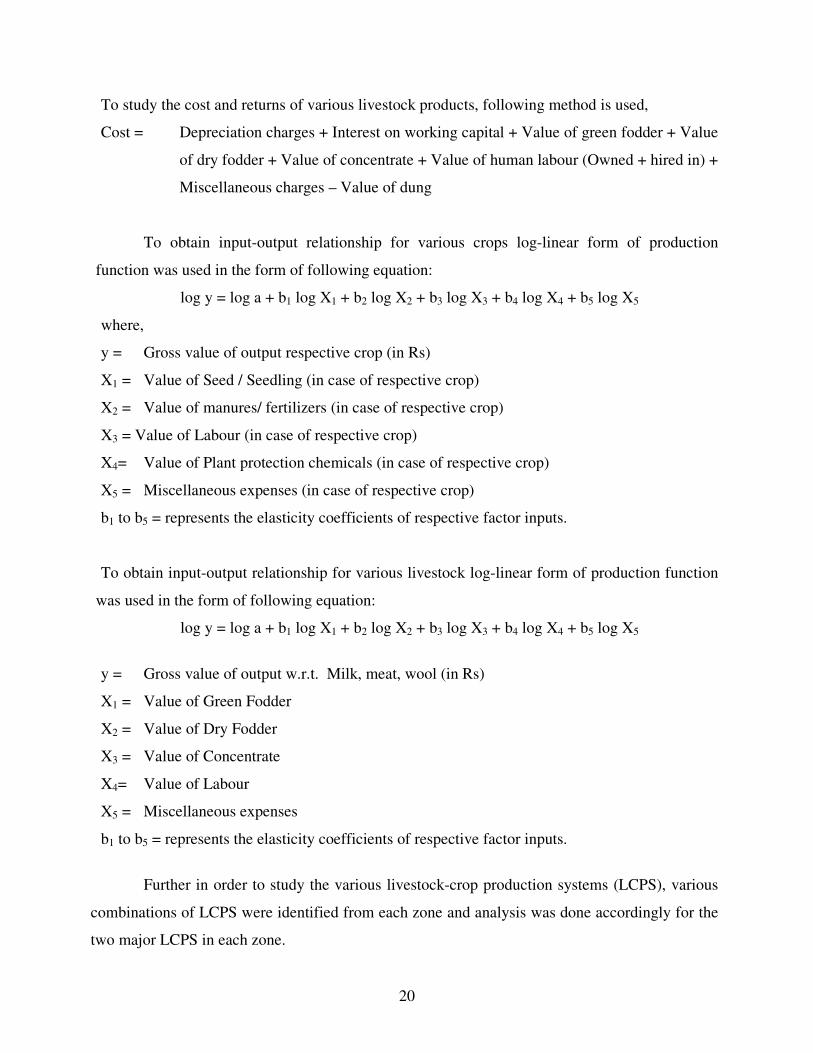
To study the cost and returns of various livestock products, following method is used,
Cost = Depreciation charges + Interest on working capital + Value of green fodder + Value
of dry fodder + Value of concentrate + Value of human labour (Owned + hired in) +
Miscellaneous charges – Value of dung
To obtain input-output relationship for various crops log-linear form of production
function was used in the form of following equation:
log y = log a + b1 log X1 + b2 log X2 + b3 log X3 + b4 log X4 + b5 log X5
where,
y = Gross value of output respective crop (in Rs)
X1 = Value of Seed / Seedling (in case of respective crop)
X2 = Value of manures/ fertilizers (in case of respective crop)
X3 = Value of Labour (in case of respective crop)
X4= Value of Plant protection chemicals (in case of respective crop)
X5 = Miscellaneous expenses (in case of respective crop)
b1 to b5 = represents the elasticity coefficients of respective factor inputs.
To obtain input-output relationship for various livestock log-linear form of production function
was used in the form of following equation:
log y = log a + b1 log X1 + b2 log X2 + b3 log X3 + b4 log X4 + b5 log X5
y = Gross value of output w.r.t. Milk, meat, wool (in Rs)
X1 = Value of Green Fodder
X2 = Value of Dry Fodder
X3 = Value of Concentrate
X4= Value of Labour
X5 = Miscellaneous expenses
b1 to b5 = represents the elasticity coefficients of respective factor inputs.
Further in order to study the various livestock-crop production systems (LCPS), various
combinations of LCPS were identified from each zone and analysis was done accordingly for the
two major LCPS in each zone.
21
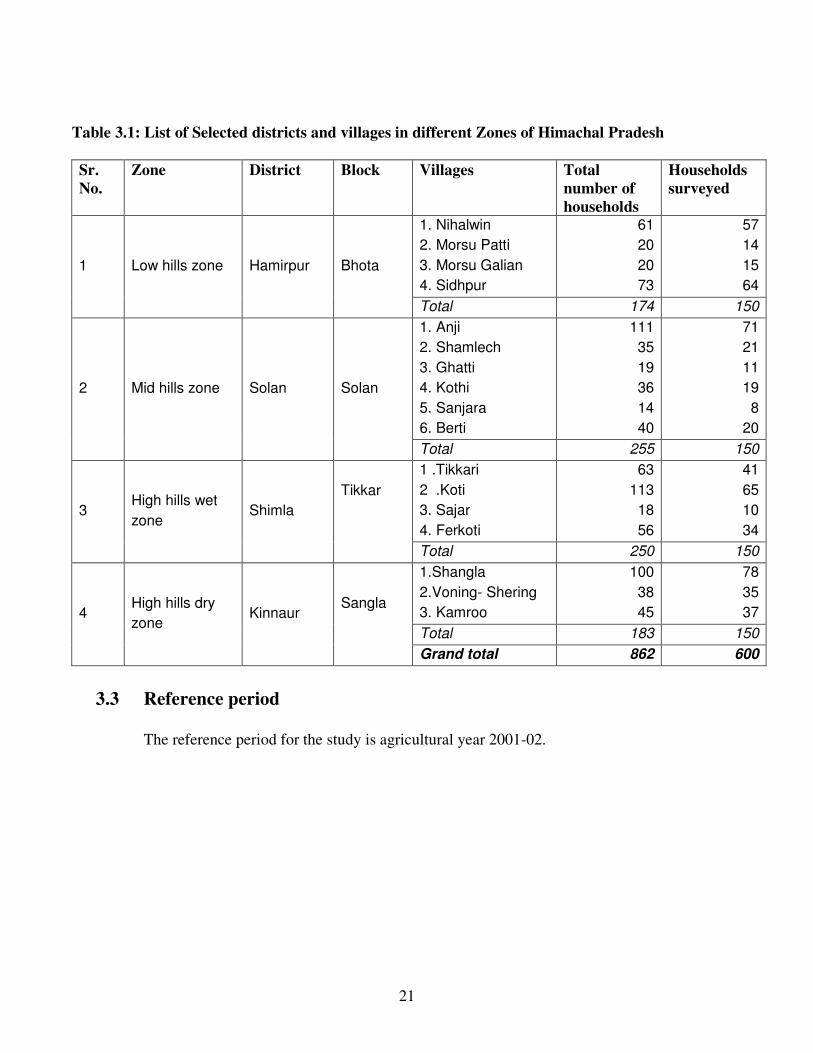
Table 3.1: List of Selected districts and villages in different Zones of Himachal Pradesh
Sr.
No.
Zone District Block Villages Total
number of
households
Households
surveyed
1 Low hills zone Hamirpur Bhota
1. Nihalwin
2. Morsu Patti
3. Morsu Galian
4. Sidhpur
61
20
20
73
57
14
15
64
Total 174 150
2 Mid hills zone Solan Solan
1. Anji
2. Shamlech
3. Ghatti
4. Kothi
5. Sanjara
6. Berti
111
35
19
36
14
40
71
21
11
19
8
20
Total 255 150
3 High hills wet
zone Shimla
Tikkar
1 .Tikkari
2 .Koti
3. Sajar
4. Ferkoti
63
113
18
56
41
65
10
34
Total 250 150
4 High hills dry
zone Kinnaur
Sangla
1.Shangla
2.Voning- Shering
3. Kamroo
100
38
45
78
35
37
Total 183 150
Grand total 862 600
3.3 Reference period
The reference period for the study is agricultural year 2001-02.
22
Chapter-4
RESOURCE STRUCTURE AND SOCIO-ECONOMIC
PROFILE OF SAMPLED FARMERS
Demographic, economic and social characteristics of the sampled households form the
subject matter of this chapter. The LCPS wise analysis of these characteristics is also done and
presented here.
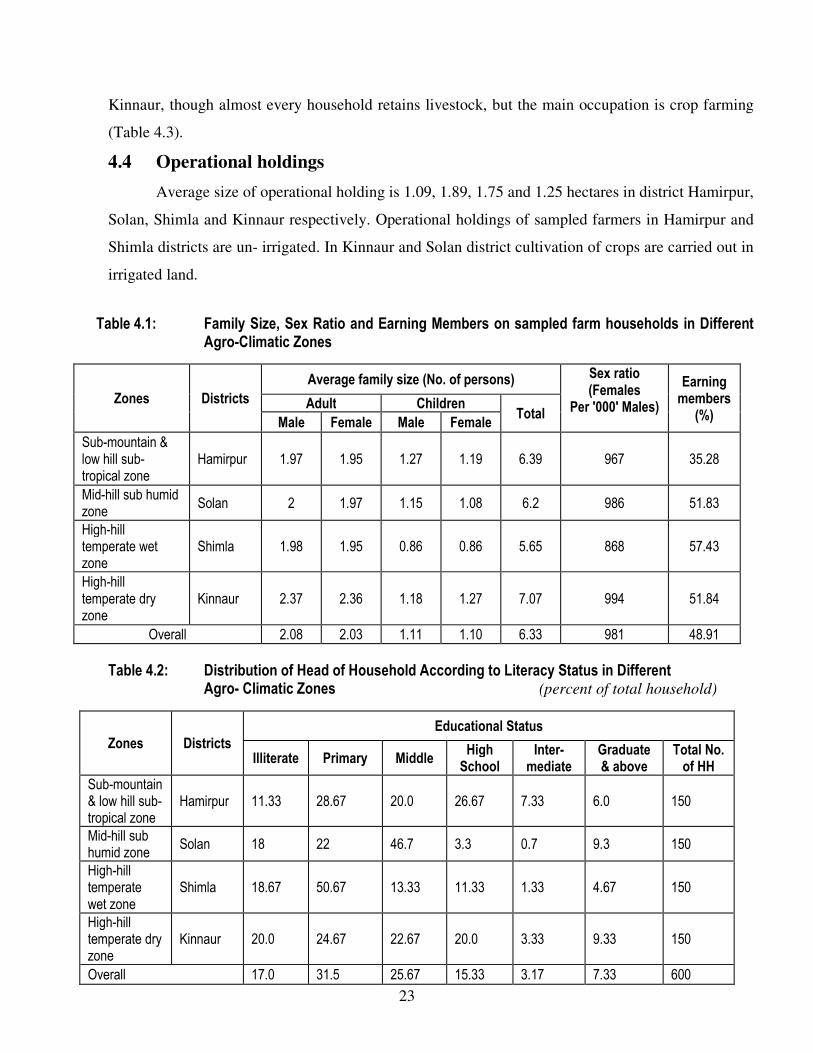
4.1 Demographic profile
It may be seen from Table 4.1 that the average family size of sampled households in district
Kinnaur of high-hill temperate dry zone is 7.07 persons with the sex ratio of 994, being highest in
the selected districts followed by district Hamirpur of low- hill sub- tropical zone, where the average
family size is 6.39 persons and sex ratio is 967. In district Solan of mid- hill sub humid zone, the
average family size is 6.2 persons and the sex ratio is 986. In district Shimla of high- hill temperate
wet zone, the average family size is 5.65 persons and the sex ratio is 868. Percentage of earning
members to the total family members is relatively higher in Shimla district (57.43), percent followed
by Kinnaur (51.84), Solan (51.83) and Hamirpur (35.28 percent).
4.2 Educational status
Education plays a positive role in development of economy of any region. Educated people
are generally innovative and receptive to new technologies. Literacy status of the head of household
is given in Table 4.2. The Table reveals that Hamirpur has highest literacy rate (88.67) followed by
Solan (82.0), Shimla (81.33) and Kinnaur (80.0) percent. But the results could not be generalized for
the development or backwardness of the area, as head of the household is older and older generation
is by and large illiterate in these rural areas. The younger age group heads of households are
generally literate across all the sizes of farms.
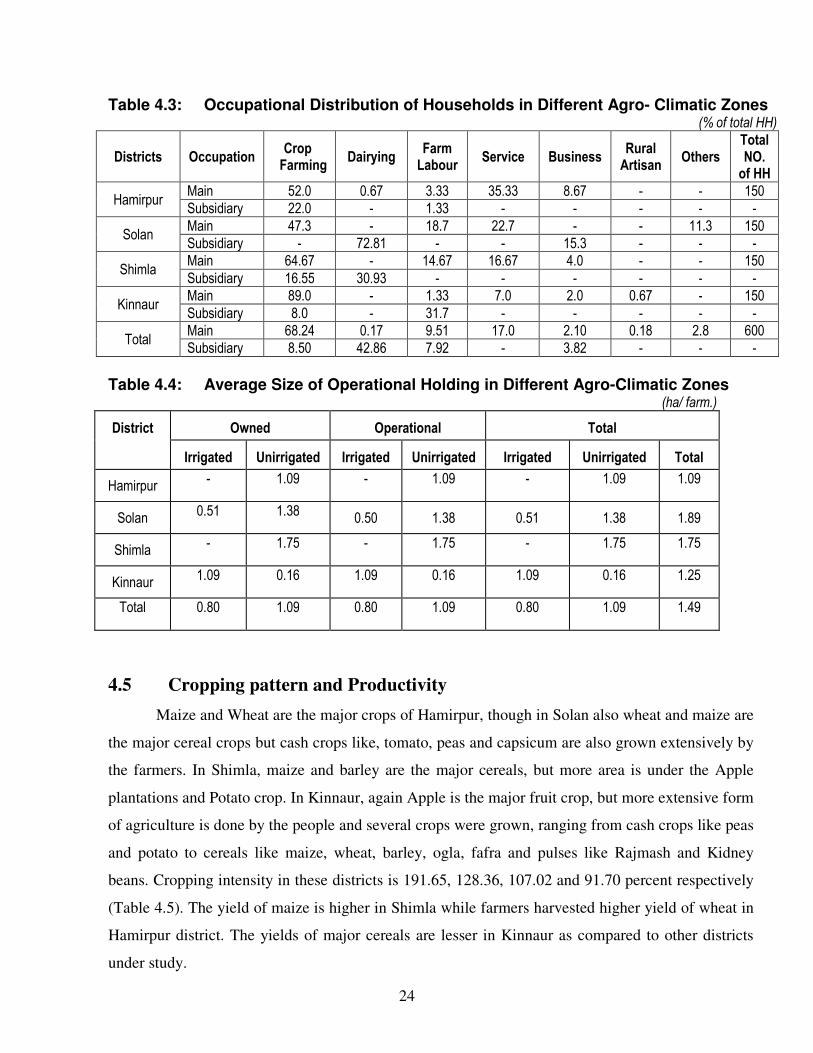
4.3 Occupational distribution
Occupational distribution of households reveals that, crop farming is the main occupation of
sampled households in all the four zones, followed by dairying in Solan and Shimla, in district
23
Kinnaur, though almost every household retains livestock, but the main occupation is crop farming
(Table 4.3).
4.4 Operational holdings
Average size of operational holding is 1.09, 1.89, 1.75 and 1.25 hectares in district Hamirpur,
Solan, Shimla and Kinnaur respectively. Operational holdings of sampled farmers in Hamirpur and
Shimla districts are un- irrigated. In Kinnaur and Solan district cultivation of crops are carried out in
irrigated land.
Table 4.1: Family Size, Sex Ratio and Earning Members on sampled farm households in Different
Agro-Climatic Zones
Table 4.2: Distribution of Head of Household According to Literacy Status in Different Agro- Climatic Zones (percent of total household)
Zones Districts
Average family size (No. of persons) Sex ratio (Females
Per '000' Males)
Earning members
(%) Adult Children
Total Male Female Male Female
Sub-mountain & low hill sub-tropical zone
Hamirpur 1.97 1.95 1.27 1.19 6.39 967 35.28
Mid-hill sub humid zone
Solan 2 1.97 1.15 1.08 6.2 986 51.83
High-hill temperate wet zone
Shimla 1.98 1.95 0.86 0.86 5.65 868 57.43
High-hill temperate dry zone
Kinnaur 2.37 2.36 1.18 1.27 7.07 994 51.84
Overall 2.08 2.03 1.11 1.10 6.33 981 48.91
Zones Districts
Educational Status
Illiterate Primary Middle High School
Inter-mediate
Graduate & above
Total No. of HH
Sub-mountain & low hill sub-tropical zone
Hamirpur 11.33 28.67 20.0 26.67 7.33 6.0 150
Mid-hill sub humid zone
Solan 18 22 46.7 3.3 0.7 9.3 150
High-hill temperate wet zone
Shimla 18.67 50.67 13.33 11.33 1.33 4.67 150
High-hill temperate dry zone
Kinnaur 20.0 24.67 22.67 20.0 3.33 9.33 150
Overall 17.0 31.5 25.67 15.33 3.17 7.33 600
24
Table 4.3: Occupational Distribution of Households in Different Agro- Climatic Zones (% of total HH)
Districts Occupation Crop Farming
Dairying Farm Labour
Service Business Rural Artisan
Others Total NO. of HH
Hamirpur Main 52.0 0.67 3.33 35.33 8.67 - - 150
Subsidiary 22.0 - 1.33 - - - - -
Solan Main 47.3 - 18.7 22.7 - - 11.3 150
Subsidiary - 72.81 - - 15.3 - - -
Shimla Main 64.67 - 14.67 16.67 4.0 - - 150
Subsidiary 16.55 30.93 - - - - - -
Kinnaur Main 89.0 - 1.33 7.0 2.0 0.67 - 150
Subsidiary 8.0 - 31.7 - - - - -
Total Main 68.24 0.17 9.51 17.0 2.10 0.18 2.8 600
Subsidiary 8.50 42.86 7.92 - 3.82 - - -
Table 4.4: Average Size of Operational Holding in Different Agro-Climatic Zones (ha/ farm.)
District Owned Operational Total
Irrigated Unirrigated Irrigated Unirrigated Irrigated Unirrigated Total
Hamirpur - 1.09 - 1.09 - 1.09 1.09
Solan 0.51 1.38
0.50 1.38 0.51 1.38 1.89
Shimla - 1.75 - 1.75 - 1.75 1.75
Kinnaur 1.09 0.16 1.09 0.16 1.09 0.16 1.25
Total 0.80 1.09 0.80 1.09 0.80 1.09 1.49
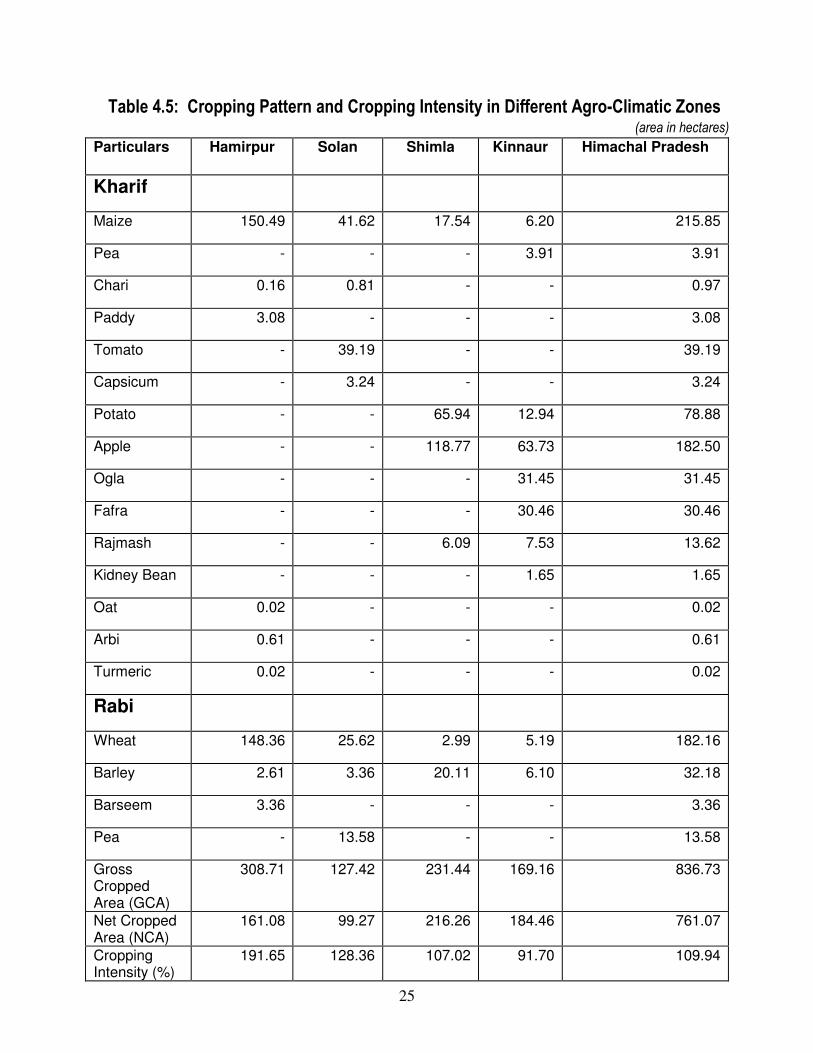
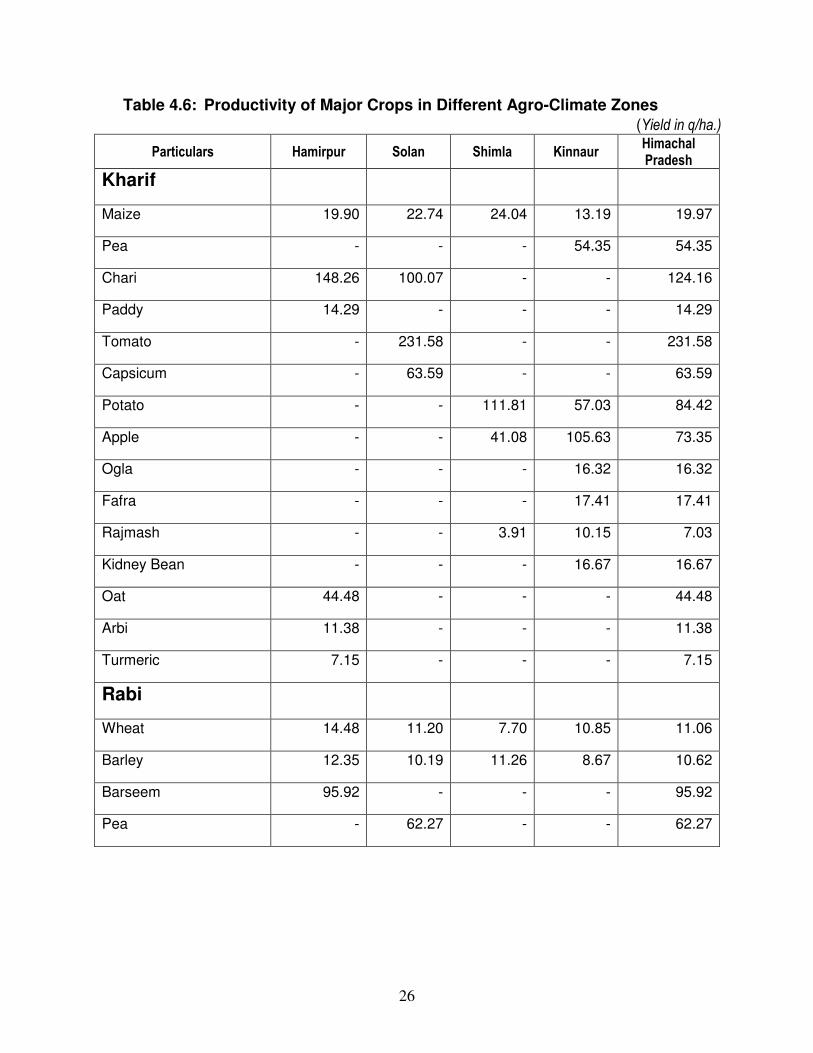
4.5 Cropping pattern and Productivity
Maize and Wheat are the major crops of Hamirpur, though in Solan also wheat and maize are
the major cereal crops but cash crops like, tomato, peas and capsicum are also grown extensively by
the farmers. In Shimla, maize and barley are the major cereals, but more area is under the Apple
plantations and Potato crop. In Kinnaur, again Apple is the major fruit crop, but more extensive form
of agriculture is done by the people and several crops were grown, ranging from cash crops like peas
and potato to cereals like maize, wheat, barley, ogla, fafra and pulses like Rajmash and Kidney
beans. Cropping intensity in these districts is 191.65, 128.36, 107.02 and 91.70 percent respectively
(Table 4.5). The yield of maize is higher in Shimla while farmers harvested higher yield of wheat in
Hamirpur district. The yields of major cereals are lesser in Kinnaur as compared to other districts
under study.
25
Table 4.5: Cropping Pattern and Cropping Intensity in Different Agro-Climatic Zones (area in hectares)
Particulars Hamirpur Solan Shimla Kinnaur Himachal Pradesh
Kharif
Maize 150.49 41.62 17.54 6.20 215.85
Pea - - - 3.91 3.91
Chari 0.16 0.81 - - 0.97
Paddy 3.08 - - - 3.08
Tomato - 39.19 - - 39.19
Capsicum - 3.24 - - 3.24
Potato - - 65.94 12.94 78.88
Apple - - 118.77 63.73 182.50
Ogla - - - 31.45 31.45
Fafra - - - 30.46 30.46
Rajmash - - 6.09 7.53 13.62
Kidney Bean - - - 1.65 1.65
Oat 0.02 - - - 0.02
Arbi 0.61 - - - 0.61
Turmeric 0.02 - - - 0.02
Rabi
Wheat 148.36 25.62 2.99 5.19 182.16
Barley 2.61 3.36 20.11 6.10 32.18
Barseem 3.36 - - - 3.36
Pea - 13.58 - - 13.58
Gross Cropped Area (GCA)
308.71 127.42 231.44 169.16 836.73
Net Cropped Area (NCA)
161.08 99.27 216.26 184.46 761.07
Cropping Intensity (%)
191.65 128.36 107.02 91.70 109.94
26
Table 4.6: Productivity of Major Crops in Different Agro-Climate Zones
(Yield in q/ha.)
Particulars Hamirpur Solan Shimla Kinnaur Himachal Pradesh
Kharif
Maize 19.90 22.74 24.04 13.19 19.97
Pea - - - 54.35 54.35
Chari 148.26 100.07 - - 124.16
Paddy 14.29 - - - 14.29
Tomato - 231.58 - - 231.58
Capsicum - 63.59 - - 63.59
Potato - - 111.81 57.03 84.42
Apple - - 41.08 105.63 73.35
Ogla - - - 16.32 16.32
Fafra - - - 17.41 17.41
Rajmash - - 3.91 10.15 7.03
Kidney Bean - - - 16.67 16.67
Oat 44.48 - - - 44.48
Arbi 11.38 - - - 11.38
Turmeric 7.15 - - - 7.15
Rabi
Wheat 14.48 11.20 7.70 10.85 11.06
Barley 12.35 10.19 11.26 8.67 10.62
Barseem 95.92 - - - 95.92
Pea - 62.27 - - 62.27
27
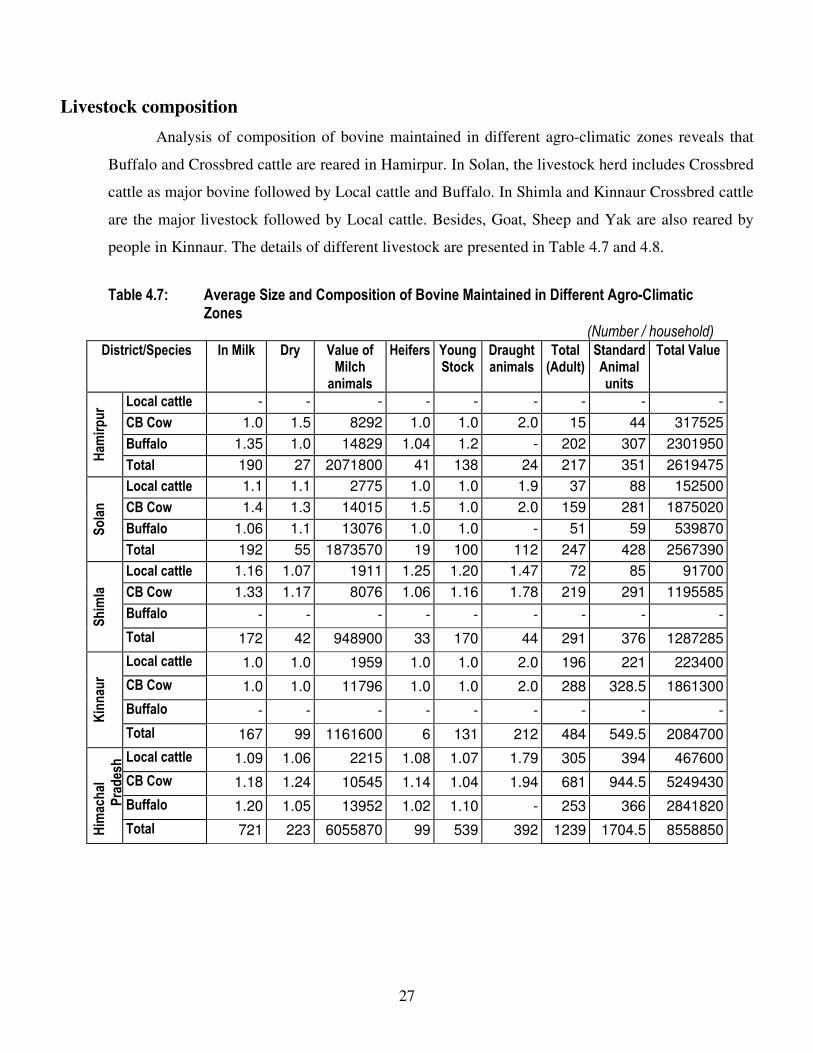
Livestock composition
Analysis of composition of bovine maintained in different agro-climatic zones reveals that
Buffalo and Crossbred cattle are reared in Hamirpur. In Solan, the livestock herd includes Crossbred
cattle as major bovine followed by Local cattle and Buffalo. In Shimla and Kinnaur Crossbred cattle
are the major livestock followed by Local cattle. Besides, Goat, Sheep and Yak are also reared by
people in Kinnaur. The details of different livestock are presented in Table 4.7 and 4.8.
Table 4.7: Average Size and Composition of Bovine Maintained in Different Agro-Climatic Zones
(Number / household) District/Species In Milk Dry Value of
Milch animals
Heifers Young Stock
Draught animals
Total (Adult)
Standard Animal units
Total Value
Ham
irpur Local cattle - - - - - - - - -
CB Cow 1.0 1.5 8292 1.0 1.0 2.0 15 44 317525
Buffalo 1.35 1.0 14829 1.04 1.2 - 202 307 2301950
Total 190 27 2071800 41 138 24 217 351 2619475
Solan
Local cattle 1.1 1.1 2775 1.0 1.0 1.9 37 88 152500
CB Cow 1.4 1.3 14015 1.5 1.0 2.0 159 281 1875020
Buffalo 1.06 1.1 13076 1.0 1.0 - 51 59 539870
Total 192 55 1873570 19 100 112 247 428 2567390
Shimla
Local cattle 1.16 1.07 1911 1.25 1.20 1.47 72 85 91700
CB Cow 1.33 1.17 8076 1.06 1.16 1.78 219 291 1195585
Buffalo - - - - - - - - -
Total 172 42 948900 33 170 44 291 376 1287285
Kinnaur
Local cattle 1.0 1.0 1959 1.0 1.0 2.0 196 221 223400
CB Cow 1.0 1.0 11796 1.0 1.0 2.0 288 328.5 1861300
Buffalo - - - - - - - - -
Total 167 99 1161600 6 131 212 484 549.5 2084700
Himachal
Pradesh Local cattle 1.09 1.06 2215 1.08 1.07 1.79 305 394 467600
CB Cow 1.18 1.24 10545 1.14 1.04 1.94 681 944.5 5249430
Buffalo 1.20 1.05 13952 1.02 1.10 - 253 366 2841820
Total 721 223 6055870 99 539 392 1239 1704.5 8558850
28
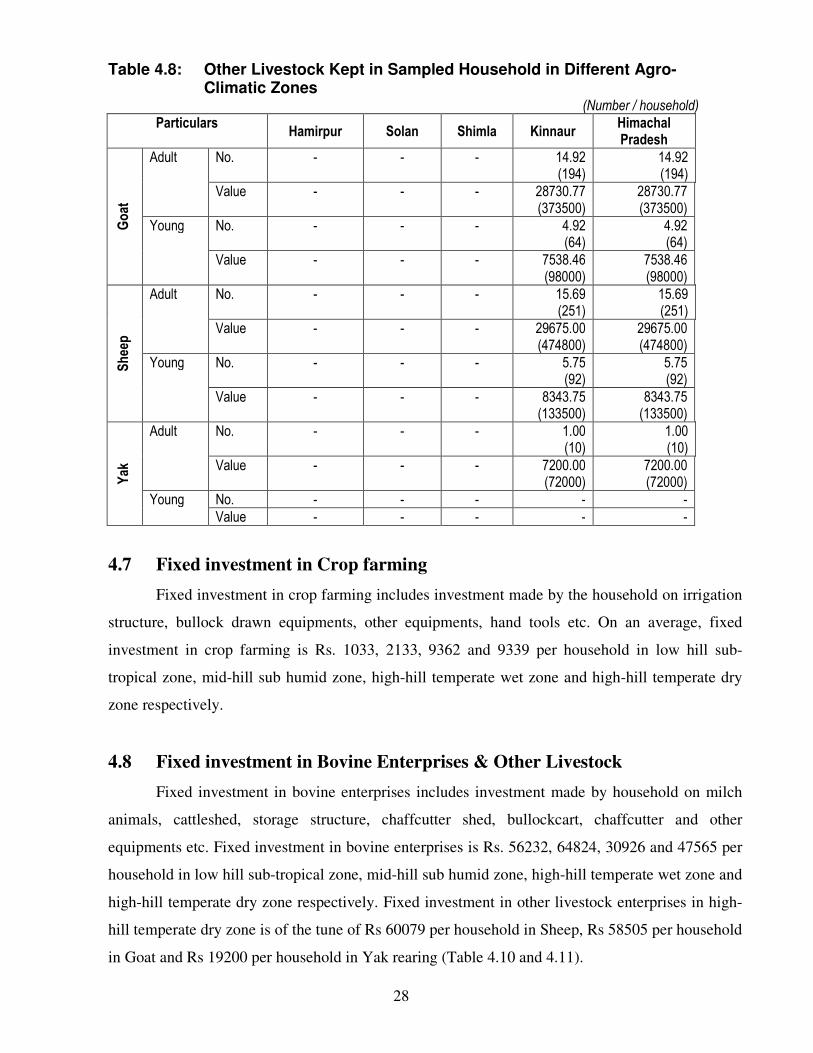
Table 4.8: Other Livestock Kept in Sampled Household in Different Agro- Climatic Zones
(Number / household)
Particulars
Hamirpur Solan Shimla Kinnaur Himachal Pradesh
Goat
Adult No. - - - 14.92 (194)
14.92 (194)
Value - - - 28730.77 (373500)
28730.77 (373500)
Young No. - - - 4.92 (64)
4.92 (64)
Value - - - 7538.46 (98000)
7538.46 (98000)
Sheep
Adult No. - - - 15.69 (251)
15.69 (251)
Value - - - 29675.00 (474800)
29675.00 (474800)
Young No. - - - 5.75 (92)
5.75 (92)
Value - - - 8343.75 (133500)
8343.75 (133500)
Yak
Adult No. - - - 1.00 (10)
1.00 (10)
Value - - - 7200.00 (72000)
7200.00 (72000)
Young No. - - - - -
Value - - - - -
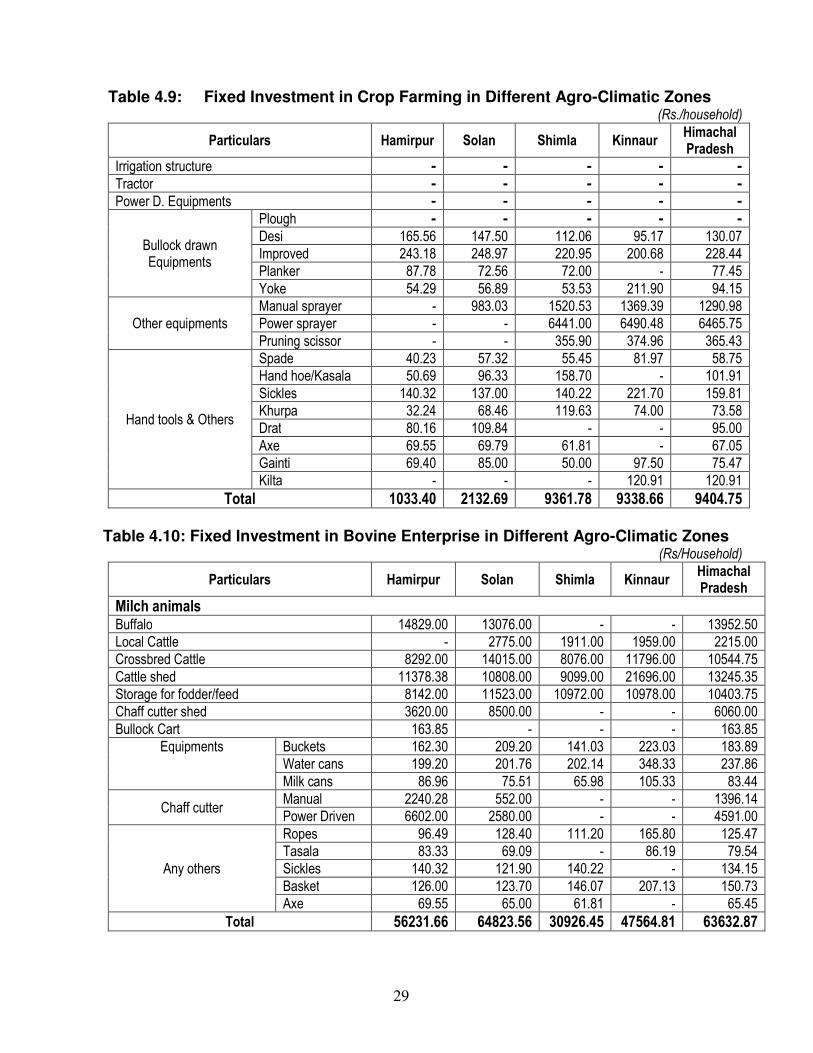
4.7 Fixed investment in Crop farming
Fixed investment in crop farming includes investment made by the household on irrigation
structure, bullock drawn equipments, other equipments, hand tools etc. On an average, fixed
investment in crop farming is Rs. 1033, 2133, 9362 and 9339 per household in low hill sub-
tropical zone, mid-hill sub humid zone, high-hill temperate wet zone and high-hill temperate dry
zone respectively.
4.8 Fixed investment in Bovine Enterprises & Other Livestock
Fixed investment in bovine enterprises includes investment made by household on milch
animals, cattleshed, storage structure, chaffcutter shed, bullockcart, chaffcutter and other
equipments etc. Fixed investment in bovine enterprises is Rs. 56232, 64824, 30926 and 47565 per
household in low hill sub-tropical zone, mid-hill sub humid zone, high-hill temperate wet zone and
high-hill temperate dry zone respectively. Fixed investment in other livestock enterprises in high-
hill temperate dry zone is of the tune of Rs 60079 per household in Sheep, Rs 58505 per household
in Goat and Rs 19200 per household in Yak rearing (Table 4.10 and 4.11).
29
Table 4.9: Fixed Investment in Crop Farming in Different Agro-Climatic Zones (Rs./household)
Particulars Hamirpur Solan Shimla Kinnaur Himachal Pradesh
Irrigation structure - - - - -
Tractor - - - - -
Power D. Equipments - - - - -
Bullock drawn Equipments
Plough - - - - -
Desi 165.56 147.50 112.06 95.17 130.07
Improved 243.18 248.97 220.95 200.68 228.44
Planker 87.78 72.56 72.00 - 77.45
Yoke 54.29 56.89 53.53 211.90 94.15
Other equipments
Manual sprayer - 983.03 1520.53 1369.39 1290.98
Power sprayer - - 6441.00 6490.48 6465.75
Pruning scissor - - 355.90 374.96 365.43
Hand tools & Others
Spade 40.23 57.32 55.45 81.97 58.75
Hand hoe/Kasala 50.69 96.33 158.70 - 101.91
Sickles 140.32 137.00 140.22 221.70 159.81
Khurpa 32.24 68.46 119.63 74.00 73.58
Drat 80.16 109.84 - - 95.00
Axe 69.55 69.79 61.81 - 67.05
Gainti 69.40 85.00 50.00 97.50 75.47
Kilta - - - 120.91 120.91
Total 1033.40 2132.69 9361.78 9338.66 9404.75
Table 4.10: Fixed Investment in Bovine Enterprise in Different Agro-Climatic Zones
(Rs/Household)
Particulars Hamirpur Solan Shimla Kinnaur Himachal Pradesh
Milch animals Buffalo 14829.00 13076.00 - - 13952.50
Local Cattle - 2775.00 1911.00 1959.00 2215.00
Crossbred Cattle 8292.00 14015.00 8076.00 11796.00 10544.75
Cattle shed 11378.38 10808.00 9099.00 21696.00 13245.35
Storage for fodder/feed 8142.00 11523.00 10972.00 10978.00 10403.75
Chaff cutter shed 3620.00 8500.00 - - 6060.00
Bullock Cart 163.85 - - - 163.85
Equipments Buckets 162.30 209.20 141.03 223.03 183.89
Water cans 199.20 201.76 202.14 348.33 237.86
Milk cans 86.96 75.51 65.98 105.33 83.44
Chaff cutter Manual 2240.28 552.00 - - 1396.14
Power Driven 6602.00 2580.00 - - 4591.00
Any others
Ropes 96.49 128.40 111.20 165.80 125.47
Tasala 83.33 69.09 - 86.19 79.54
Sickles 140.32 121.90 140.22 - 134.15
Basket 126.00 123.70 146.07 207.13 150.73
Axe 69.55 65.00 61.81 - 65.45
Total 56231.66 64823.56 30926.45 47564.81 63632.87
30
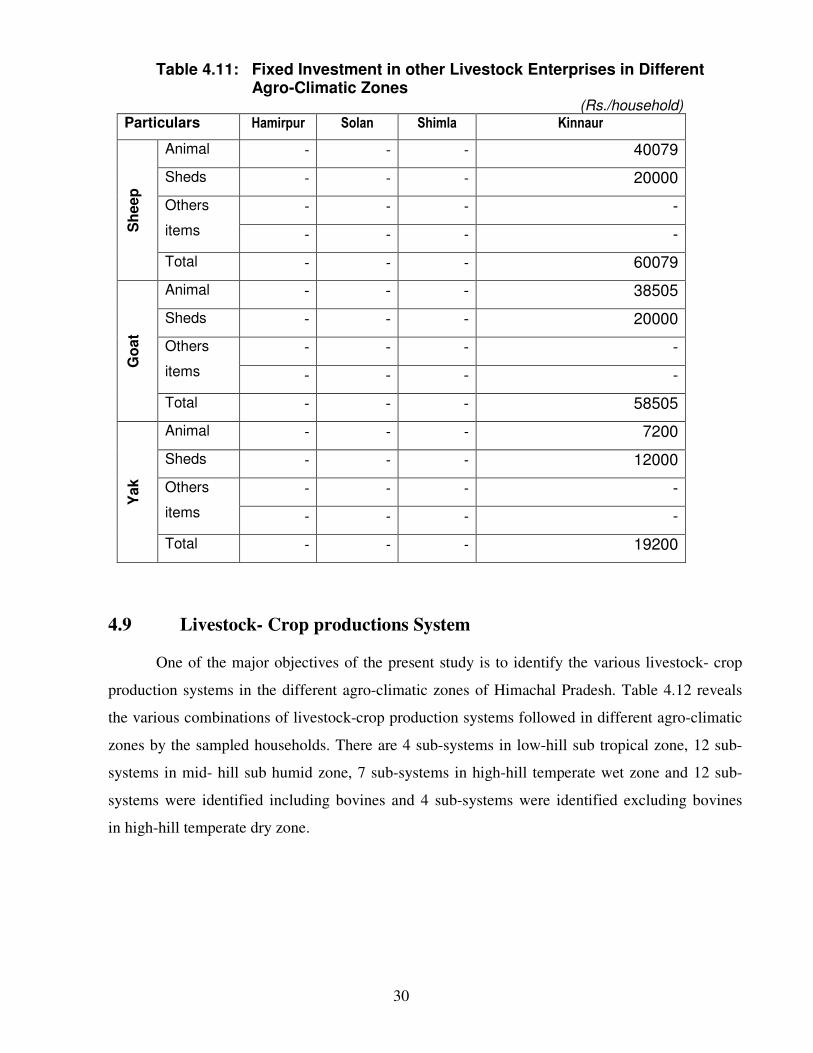
Table 4.11: Fixed Investment in other Livestock Enterprises in Different Agro-Climatic Zones (Rs./household)
Particulars Hamirpur Solan Shimla Kinnaur S
heep
Animal - - - 40079
Sheds - - - 20000
Others
items
- - - -
- - - -
Total - - - 60079
Go
at
Animal - - - 38505
Sheds - - - 20000
Others
items
- - - -
- - - -
Total - - - 58505
Yak
Animal - - - 7200
Sheds - - - 12000
Others
items
- - - -
- - - -
Total - - - 19200
4.9 Livestock- Crop productions System
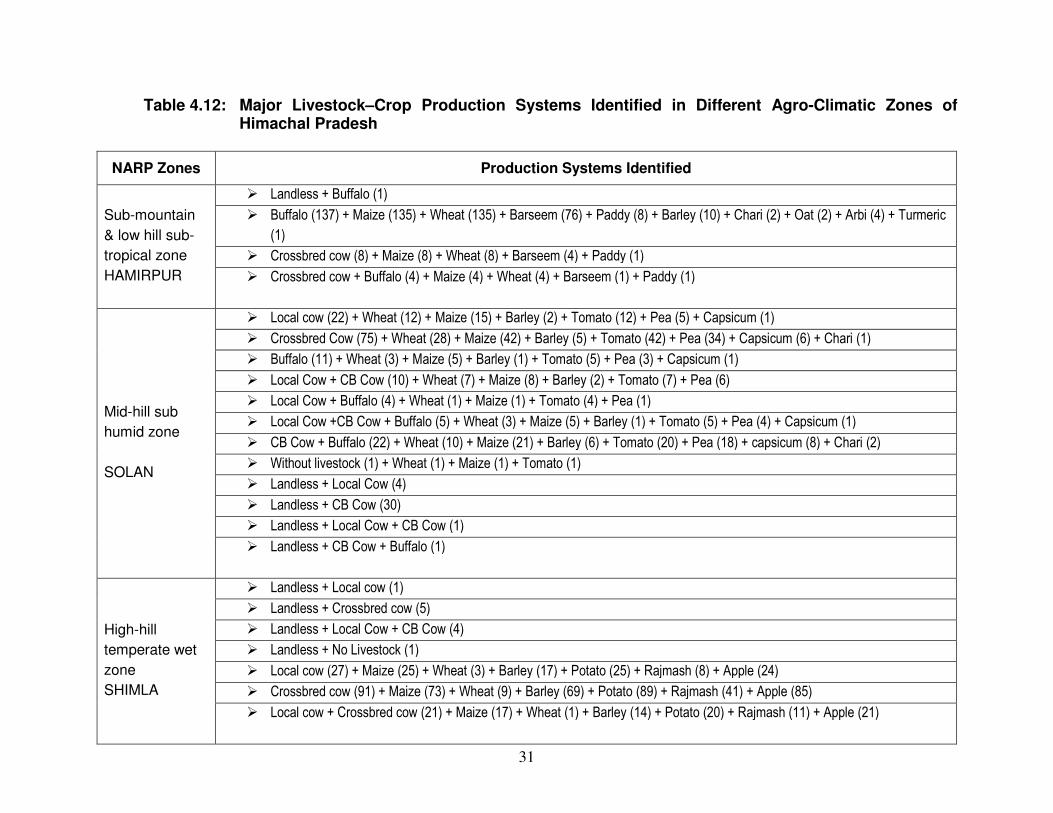
One of the major objectives of the present study is to identify the various livestock- crop
production systems in the different agro-climatic zones of Himachal Pradesh. Table 4.12 reveals
the various combinations of livestock-crop production systems followed in different agro-climatic
zones by the sampled households. There are 4 sub-systems in low-hill sub tropical zone, 12 sub-
systems in mid- hill sub humid zone, 7 sub-systems in high-hill temperate wet zone and 12 sub-
systems were identified including bovines and 4 sub-systems were identified excluding bovines
in high-hill temperate dry zone.
31
Table 4.12: Major Livestock–Crop Production Systems Identified in Different Agro-Climatic Zones of Himachal Pradesh
NARP Zones Production Systems Identified
Sub-mountain
& low hill sub-
tropical zone
HAMIRPUR
� Landless + Buffalo (1)
� Buffalo (137) + Maize (135) + Wheat (135) + Barseem (76) + Paddy (8) + Barley (10) + Chari (2) + Oat (2) + Arbi (4) + Turmeric
(1)
� Crossbred cow (8) + Maize (8) + Wheat (8) + Barseem (4) + Paddy (1)
� Crossbred cow + Buffalo (4) + Maize (4) + Wheat (4) + Barseem (1) + Paddy (1)
Mid-hill sub
humid zone
SOLAN
� Local cow (22) + Wheat (12) + Maize (15) + Barley (2) + Tomato (12) + Pea (5) + Capsicum (1)
� Crossbred Cow (75) + Wheat (28) + Maize (42) + Barley (5) + Tomato (42) + Pea (34) + Capsicum (6) + Chari (1)
� Buffalo (11) + Wheat (3) + Maize (5) + Barley (1) + Tomato (5) + Pea (3) + Capsicum (1)
� Local Cow + CB Cow (10) + Wheat (7) + Maize (8) + Barley (2) + Tomato (7) + Pea (6)
� Local Cow + Buffalo (4) + Wheat (1) + Maize (1) + Tomato (4) + Pea (1)
� Local Cow +CB Cow + Buffalo (5) + Wheat (3) + Maize (5) + Barley (1) + Tomato (5) + Pea (4) + Capsicum (1)
� CB Cow + Buffalo (22) + Wheat (10) + Maize (21) + Barley (6) + Tomato (20) + Pea (18) + capsicum (8) + Chari (2)
� Without livestock (1) + Wheat (1) + Maize (1) + Tomato (1)
� Landless + Local Cow (4)
� Landless + CB Cow (30)
� Landless + Local Cow + CB Cow (1)
� Landless + CB Cow + Buffalo (1)
High-hill
temperate wet
zone
SHIMLA
� Landless + Local cow (1)
� Landless + Crossbred cow (5)
� Landless + Local Cow + CB Cow (4)
� Landless + No Livestock (1)
� Local cow (27) + Maize (25) + Wheat (3) + Barley (17) + Potato (25) + Rajmash (8) + Apple (24)
� Crossbred cow (91) + Maize (73) + Wheat (9) + Barley (69) + Potato (89) + Rajmash (41) + Apple (85)
� Local cow + Crossbred cow (21) + Maize (17) + Wheat (1) + Barley (14) + Potato (20) + Rajmash (11) + Apple (21)
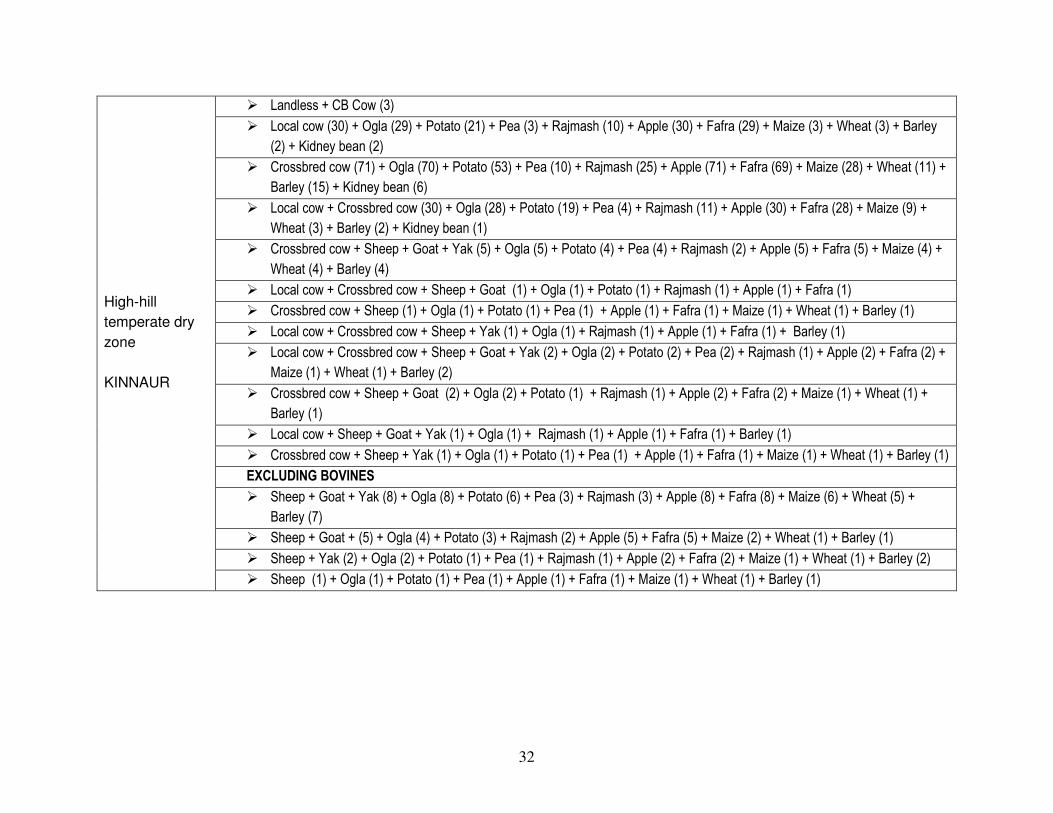
32
High-hill
temperate dry
zone
KINNAUR
� Landless + CB Cow (3)
� Local cow (30) + Ogla (29) + Potato (21) + Pea (3) + Rajmash (10) + Apple (30) + Fafra (29) + Maize (3) + Wheat (3) + Barley
(2) + Kidney bean (2)
� Crossbred cow (71) + Ogla (70) + Potato (53) + Pea (10) + Rajmash (25) + Apple (71) + Fafra (69) + Maize (28) + Wheat (11) +
Barley (15) + Kidney bean (6)
� Local cow + Crossbred cow (30) + Ogla (28) + Potato (19) + Pea (4) + Rajmash (11) + Apple (30) + Fafra (28) + Maize (9) +
Wheat (3) + Barley (2) + Kidney bean (1)
� Crossbred cow + Sheep + Goat + Yak (5) + Ogla (5) + Potato (4) + Pea (4) + Rajmash (2) + Apple (5) + Fafra (5) + Maize (4) +
Wheat (4) + Barley (4)
� Local cow + Crossbred cow + Sheep + Goat (1) + Ogla (1) + Potato (1) + Rajmash (1) + Apple (1) + Fafra (1)
� Crossbred cow + Sheep (1) + Ogla (1) + Potato (1) + Pea (1) + Apple (1) + Fafra (1) + Maize (1) + Wheat (1) + Barley (1)
� Local cow + Crossbred cow + Sheep + Yak (1) + Ogla (1) + Rajmash (1) + Apple (1) + Fafra (1) + Barley (1)
� Local cow + Crossbred cow + Sheep + Goat + Yak (2) + Ogla (2) + Potato (2) + Pea (2) + Rajmash (1) + Apple (2) + Fafra (2) +
Maize (1) + Wheat (1) + Barley (2)
� Crossbred cow + Sheep + Goat (2) + Ogla (2) + Potato (1) + Rajmash (1) + Apple (2) + Fafra (2) + Maize (1) + Wheat (1) +
Barley (1)
� Local cow + Sheep + Goat + Yak (1) + Ogla (1) + Rajmash (1) + Apple (1) + Fafra (1) + Barley (1)
� Crossbred cow + Sheep + Yak (1) + Ogla (1) + Potato (1) + Pea (1) + Apple (1) + Fafra (1) + Maize (1) + Wheat (1) + Barley (1)
EXCLUDING BOVINES
� Sheep + Goat + Yak (8) + Ogla (8) + Potato (6) + Pea (3) + Rajmash (3) + Apple (8) + Fafra (8) + Maize (6) + Wheat (5) +
Barley (7)
� Sheep + Goat + (5) + Ogla (4) + Potato (3) + Rajmash (2) + Apple (5) + Fafra (5) + Maize (2) + Wheat (1) + Barley (1)
� Sheep + Yak (2) + Ogla (2) + Potato (1) + Pea (1) + Rajmash (1) + Apple (2) + Fafra (2) + Maize (1) + Wheat (1) + Barley (2)
� Sheep (1) + Ogla (1) + Potato (1) + Pea (1) + Apple (1) + Fafra (1) + Maize (1) + Wheat (1) + Barley (1)
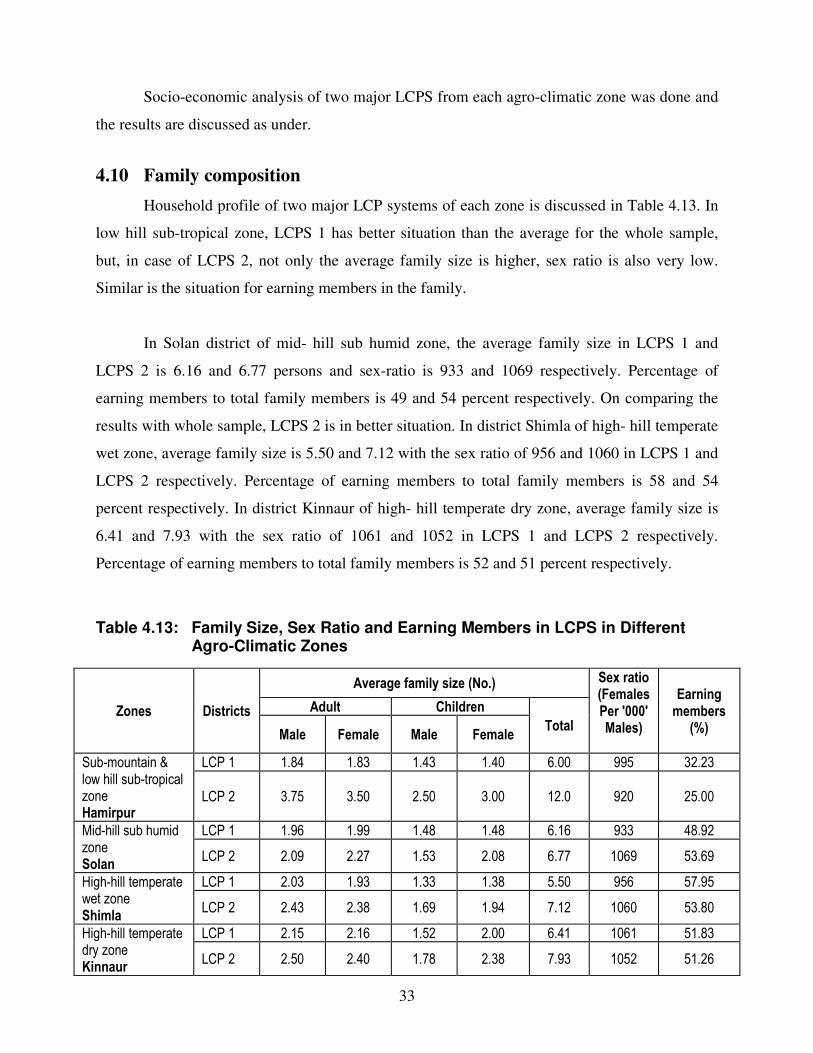
33
Socio-economic analysis of two major LCPS from each agro-climatic zone was done and
the results are discussed as under.
4.10 Family composition
Household profile of two major LCP systems of each zone is discussed in Table 4.13. In
low hill sub-tropical zone, LCPS 1 has better situation than the average for the whole sample,
but, in case of LCPS 2, not only the average family size is higher, sex ratio is also very low.
Similar is the situation for earning members in the family.
In Solan district of mid- hill sub humid zone, the average family size in LCPS 1 and
LCPS 2 is 6.16 and 6.77 persons and sex-ratio is 933 and 1069 respectively. Percentage of
earning members to total family members is 49 and 54 percent respectively. On comparing the
results with whole sample, LCPS 2 is in better situation. In district Shimla of high- hill temperate
wet zone, average family size is 5.50 and 7.12 with the sex ratio of 956 and 1060 in LCPS 1 and
LCPS 2 respectively. Percentage of earning members to total family members is 58 and 54
percent respectively. In district Kinnaur of high- hill temperate dry zone, average family size is
6.41 and 7.93 with the sex ratio of 1061 and 1052 in LCPS 1 and LCPS 2 respectively.
Percentage of earning members to total family members is 52 and 51 percent respectively.
Table 4.13: Family Size, Sex Ratio and Earning Members in LCPS in Different
Agro-Climatic Zones
Zones Districts
Average family size (No.) Sex ratio (Females Per '000' Males)
Earning members
(%)
Adult Children
Total Male Female Male Female
Sub-mountain & low hill sub-tropical zone Hamirpur
LCP 1 1.84 1.83 1.43 1.40 6.00 995 32.23
LCP 2 3.75 3.50 2.50 3.00 12.0 920 25.00
Mid-hill sub humid zone Solan
LCP 1 1.96 1.99 1.48 1.48 6.16 933 48.92
LCP 2 2.09 2.27 1.53 2.08 6.77 1069 53.69
High-hill temperate wet zone Shimla
LCP 1 2.03 1.93 1.33 1.38 5.50 956 57.95
LCP 2 2.43 2.38 1.69 1.94 7.12 1060 53.80
High-hill temperate dry zone Kinnaur
LCP 1 2.15 2.16 1.52 2.00 6.41 1061 51.83
LCP 2 2.50 2.40 1.78 2.38 7.93 1052 51.26
34
Hamirpur LCP 1- Buffalo (137) + Maize (135) + Wheat (135) + Barseem (76) + Paddy (8) + Barley (10) + Chari (2) + Oat (2) + Arbi (4) + Turmeric (1) LCP 2- Crossbred cow + Buffalo (4) + Maize (4) + Wheat (4) + Barseem (1) + Paddy (1)
Solan LCP 1- Crossbred Cow (75) + Wheat (28) + Maize (42) + Barley (5) + Tomato (42) + Pea (34) + Capsicum (6) + Chari (1)
LCP 2- CB Cow + Buffalo (22) + Wheat (10) + Maize (21) + Barley (6) + Tomato (20) + Pea (18) + capsicum (8) + Chari (2)
Shimla LCP 1- Crossbred cow (91) + Maize (73) + Wheat (9) + Barley (69) + Potato (89) + Rajmash (41) + Apple (85) LCP 2- Local cow + Crossbred cow (21) + Maize (17) + Wheat (1) + Barley (14) + Potato (20) + Rajmash (11) + Apple (21)
Kinnaur LCP 1- Crossbred cow (71) + Ogla (70) + Potato (53) + Pea (10) + Rajmash (25) + Apple (71) + Fafra (69) + Maize (28) + Wheat (11) + Barley (15) + Kidney bean (6)
LCP 2- Local cow + Crossbred cow (30) + Ogla (28) + Potato (19) + Pea (4) + Rajmash (11) + Apple (30) + Fafra (28) + Maize (9) + Wheat (3) + Barley (2) + Kidney bean (1)
4.11 Educational status
Educational status of sampled households is given in Table 4.14. In district Hamirpur of
low hill sub-tropical zone, literacy rate of the head of the household among LCPS 1 is 88.43 and
in LCPS 2 is 75 per cent, being lower than the average of whole sample. In Solan district of mid-
hill sub humid zone, the literacy rate in LCPS 1 and LCPS 2 is 82.67 and 86.36 per cent
respectively, which is higher than the average. In district Shimla of high- hill temperate wet
zone, the literacy rate in LCPS 1 and LCPS 2 is 82.28 and 91.67 per cent respectively, which is
again higher than the average. In district Kinnaur of high- hill temperate dry zone, the literacy
rate in LCPS 1 and LCPS 2 is 79.73 and 80 per cent respectively, which is almost similar to the
average literacy rate for the zone.
4.12 Occupational distribution
Occupational distribution of sample households in two major sub-systems in different
agro-climatic zones is presented in Table 4.15.
In district Hamirpur of low hill sub-tropical zone, crop farming, followed by service is
the main occupation of sampled farmers in both sub-systems. Whereas dairy farming is the major
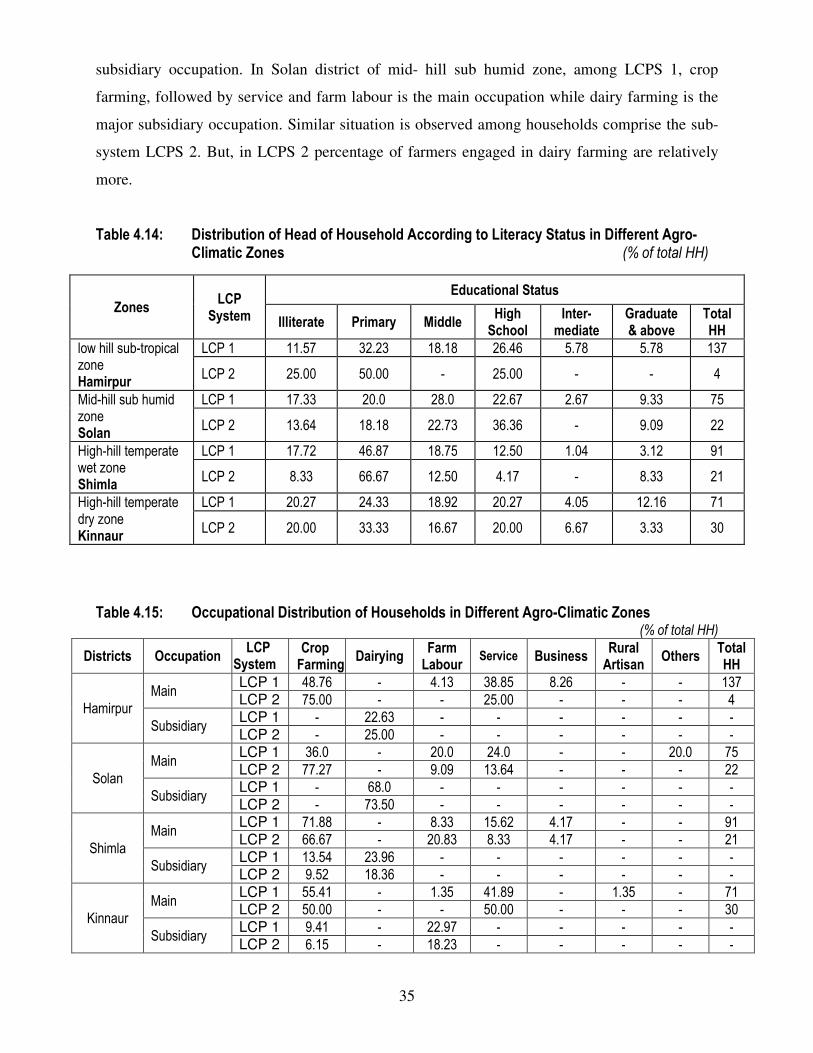
35
subsidiary occupation. In Solan district of mid- hill sub humid zone, among LCPS 1, crop
farming, followed by service and farm labour is the main occupation while dairy farming is the
major subsidiary occupation. Similar situation is observed among households comprise the sub-
system LCPS 2. But, in LCPS 2 percentage of farmers engaged in dairy farming are relatively
more.
Table 4.14: Distribution of Head of Household According to Literacy Status in Different Agro- Climatic Zones (% of total HH)
Table 4.15: Occupational Distribution of Households in Different Agro-Climatic Zones
(% of total HH)
Districts Occupation LCP
System Crop Farming
Dairying Farm Labour
Service Business Rural Artisan
Others Total HH
Hamirpur
Main LCP 1 48.76 - 4.13 38.85 8.26 - - 137
LCP 2 75.00 - - 25.00 - - - 4
Subsidiary LCP 1 - 22.63 - - - - - -
LCP 2 - 25.00 - - - - - -
Solan
Main LCP 1 36.0 - 20.0 24.0 - - 20.0 75
LCP 2 77.27 - 9.09 13.64 - - - 22
Subsidiary LCP 1 - 68.0 - - - - - -
LCP 2 - 73.50 - - - - - -
Shimla
Main LCP 1 71.88 - 8.33 15.62 4.17 - - 91
LCP 2 66.67 - 20.83 8.33 4.17 - - 21
Subsidiary LCP 1 13.54 23.96 - - - - - -
LCP 2 9.52 18.36 - - - - - -
Kinnaur
Main LCP 1 55.41 - 1.35 41.89 - 1.35 - 71
LCP 2 50.00 - - 50.00 - - - 30
Subsidiary LCP 1 9.41 - 22.97 - - - - -
LCP 2 6.15 - 18.23 - - - - -
Zones LCP
System
Educational Status
Illiterate Primary Middle High School
Inter-mediate
Graduate & above
Total HH
low hill sub-tropical zone Hamirpur
LCP 1 11.57 32.23 18.18 26.46 5.78 5.78 137
LCP 2 25.00 50.00 - 25.00 - - 4
Mid-hill sub humid zone Solan
LCP 1 17.33 20.0 28.0 22.67 2.67 9.33 75
LCP 2 13.64 18.18 22.73 36.36 - 9.09 22
High-hill temperate wet zone Shimla
LCP 1 17.72 46.87 18.75 12.50 1.04 3.12 91
LCP 2 8.33 66.67 12.50 4.17 - 8.33 21
High-hill temperate dry zone Kinnaur
LCP 1 20.27 24.33 18.92 20.27 4.05 12.16 71
LCP 2 20.00 33.33 16.67 20.00 6.67 3.33 30
36
In district Shimla of high- hill temperate wet zone, crop farming is the main occupation
followed by service and farm labour in LCPS 1. While in LCPS 2, crop farming is the main
occupation followed by farm labour and service. Dairy farming is the major subsidiary
occupation in both sub- systems.
In district Kinnaur of high- hill temperate dry zone, again crop farming followed by
service is the main occupation of sampled farmers in both the sub-systems. Whereas, crop
farming followed by farm labour is the major subsidiary occupation of sampled farmers in both
the sub-systems. Dairy faming is not an economic enterprise of farmers here because they
generally kept the bovine to fulfil their household needs and not from the business point of view.
4.13 Operational holdings
Average size of operational holding in district Hamirpur of low hill sub-tropical zone,
under LCPS 1 is 1.11 hectares and under LCPS 2 is 1.42 hectares, which is higher than the
average for the sampled farmers for whole zone (Table 4.16). In Solan district of mid- hill sub
humid zone, average size of operational holding under LCPS 1 is 1.81 hectares and under LCPS
2 is 2.11 hectares. Holding size is higher under LCPS 2 than the average for the sampled farmers
for whole zone but less in case of LCPS 1. In district Shimla of high- hill temperate wet zone,
average size of operational holding under LCPS 1 is 1.79 hectares and under LCPS 2 is 1.86
hectares, which is higher than the average for the sampled farmers for whole zone. In district
Kinnaur of high- hill temperate dry zone, average size of operational holding under LCPS 1
is1.21 hectares and under LCPS 2 is 1.32 hectares. Holding size is higher under LCPS 2 than the
average for the sampled farmers for whole zone but less in case of LCPS 1.
4.14 Cropping pattern and Productivity
The cropping pattern, cropping intensity and productivity of crops on sampled farms of
LCPS are summarized in Tables 4.17 and 4.18. Maize followed by Wheat is the major crop of
LCPS 1 while wheat followed by maize is the major crop of LCPS 2 in district Hamirpur.
Agricultural diversification is high in case of LCPS 1 which is also revealed by its cropping
intensity of 190.64 percent as compared to 185.05 percent in LCPS 2. Paddy, oat, barley,
barseem etc are the other major crops of sub-system LCPS 1. The yield of crops is relatively
higher in case of LCPS 2 as compared to LCPS 1.
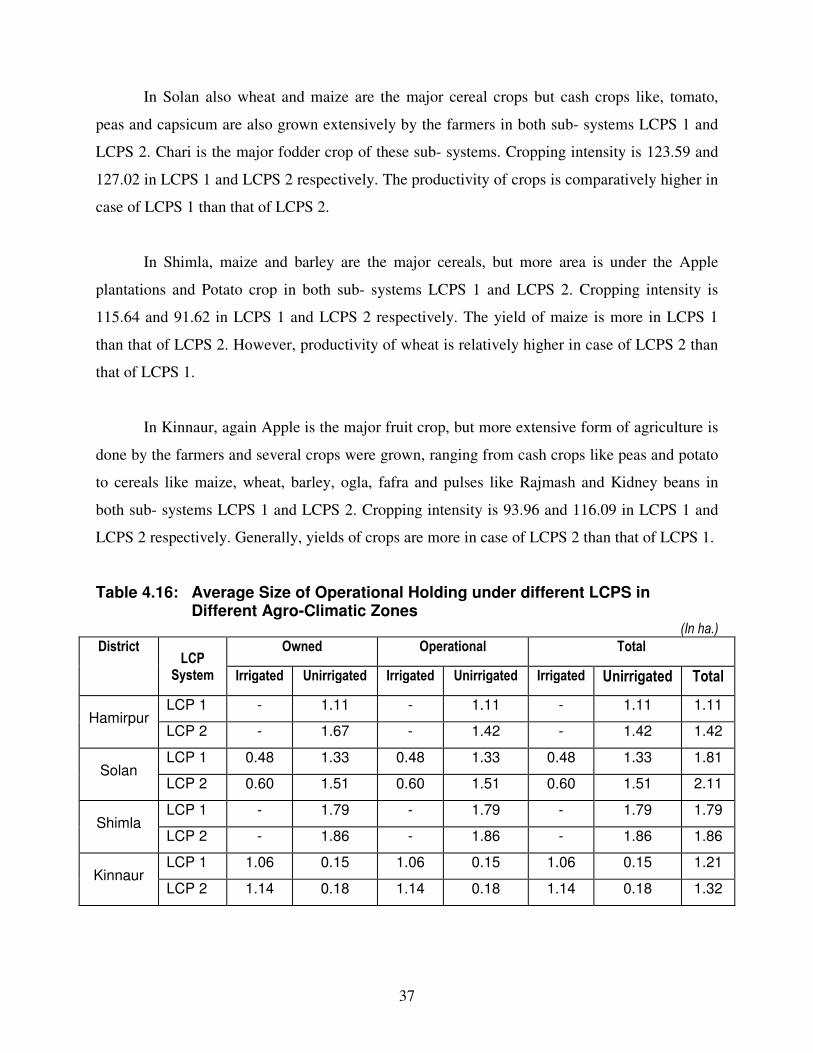
37
In Solan also wheat and maize are the major cereal crops but cash crops like, tomato,
peas and capsicum are also grown extensively by the farmers in both sub- systems LCPS 1 and
LCPS 2. Chari is the major fodder crop of these sub- systems. Cropping intensity is 123.59 and
127.02 in LCPS 1 and LCPS 2 respectively. The productivity of crops is comparatively higher in
case of LCPS 1 than that of LCPS 2.
In Shimla, maize and barley are the major cereals, but more area is under the Apple
plantations and Potato crop in both sub- systems LCPS 1 and LCPS 2. Cropping intensity is
115.64 and 91.62 in LCPS 1 and LCPS 2 respectively. The yield of maize is more in LCPS 1
than that of LCPS 2. However, productivity of wheat is relatively higher in case of LCPS 2 than
that of LCPS 1.
In Kinnaur, again Apple is the major fruit crop, but more extensive form of agriculture is
done by the farmers and several crops were grown, ranging from cash crops like peas and potato
to cereals like maize, wheat, barley, ogla, fafra and pulses like Rajmash and Kidney beans in
both sub- systems LCPS 1 and LCPS 2. Cropping intensity is 93.96 and 116.09 in LCPS 1 and
LCPS 2 respectively. Generally, yields of crops are more in case of LCPS 2 than that of LCPS 1.
Table 4.16: Average Size of Operational Holding under different LCPS in Different Agro-Climatic Zones
(In ha.) District
LCP System
Owned Operational Total
Irrigated Unirrigated Irrigated Unirrigated Irrigated Unirrigated Total
Hamirpur LCP 1 - 1.11 - 1.11 - 1.11 1.11
LCP 2 - 1.67 - 1.42 - 1.42 1.42
Solan LCP 1 0.48 1.33 0.48 1.33 0.48 1.33 1.81
LCP 2 0.60 1.51 0.60 1.51 0.60 1.51 2.11
Shimla LCP 1 - 1.79 - 1.79 - 1.79 1.79
LCP 2 - 1.86 - 1.86 - 1.86 1.86
Kinnaur LCP 1 1.06 0.15 1.06 0.15 1.06 0.15 1.21
LCP 2 1.14 0.18 1.14 0.18 1.14 0.18 1.32
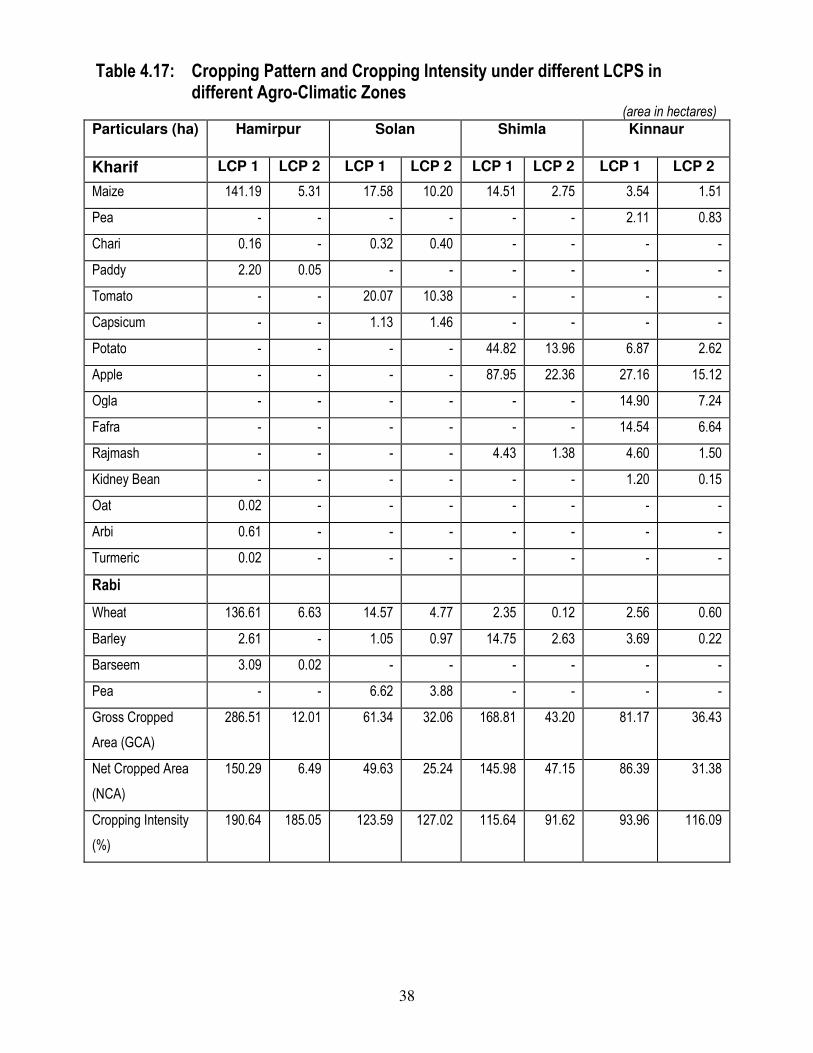
38
Table 4.17: Cropping Pattern and Cropping Intensity under different LCPS in different Agro-Climatic Zones (area in hectares)
Particulars (ha) Hamirpur Solan Shimla Kinnaur
Kharif LCP 1 LCP 2 LCP 1 LCP 2 LCP 1 LCP 2 LCP 1 LCP 2
Maize 141.19 5.31 17.58 10.20 14.51 2.75 3.54 1.51
Pea - - - - - - 2.11 0.83
Chari 0.16 - 0.32 0.40 - - - -
Paddy 2.20 0.05 - - - - - -
Tomato - - 20.07 10.38 - - - -
Capsicum - - 1.13 1.46 - - - -
Potato - - - - 44.82 13.96 6.87 2.62
Apple - - - - 87.95 22.36 27.16 15.12
Ogla - - - - - - 14.90 7.24
Fafra - - - - - - 14.54 6.64
Rajmash - - - - 4.43 1.38 4.60 1.50
Kidney Bean - - - - - - 1.20 0.15
Oat 0.02 - - - - - - -
Arbi 0.61 - - - - - - -
Turmeric 0.02 - - - - - - -
Rabi
Wheat 136.61 6.63 14.57 4.77 2.35 0.12 2.56 0.60
Barley 2.61 - 1.05 0.97 14.75 2.63 3.69 0.22
Barseem 3.09 0.02 - - - - - -
Pea - - 6.62 3.88 - - - -
Gross Cropped
Area (GCA)
286.51 12.01 61.34 32.06 168.81 43.20 81.17 36.43
Net Cropped Area
(NCA)
150.29 6.49 49.63 25.24 145.98 47.15 86.39 31.38
Cropping Intensity
(%)
190.64 185.05 123.59 127.02 115.64 91.62 93.96 116.09
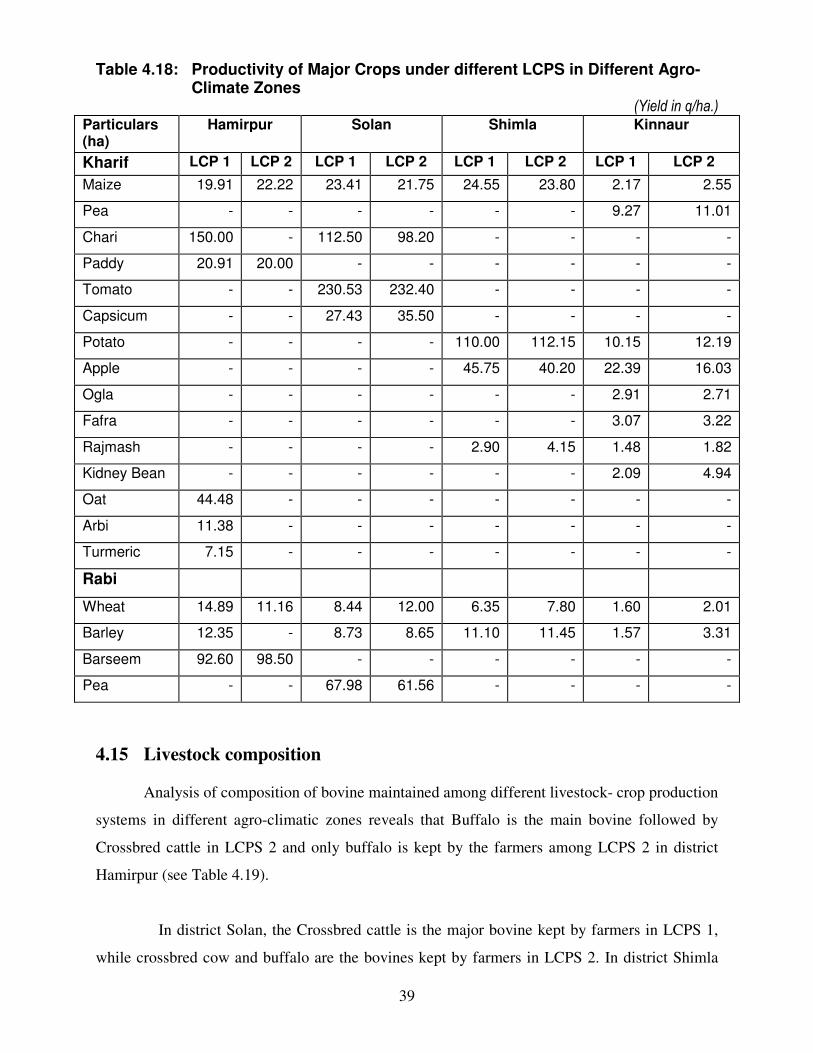
39
Table 4.18: Productivity of Major Crops under different LCPS in Different Agro-Climate Zones
(Yield in q/ha.) Particulars (ha)
Hamirpur Solan Shimla Kinnaur
Kharif LCP 1 LCP 2 LCP 1 LCP 2 LCP 1 LCP 2 LCP 1 LCP 2
Maize 19.91 22.22 23.41 21.75 24.55 23.80 2.17 2.55
Pea - - - - - - 9.27 11.01
Chari 150.00 - 112.50 98.20 - - - -
Paddy 20.91 20.00 - - - - - -
Tomato - - 230.53 232.40 - - - -
Capsicum - - 27.43 35.50 - - - -
Potato - - - - 110.00 112.15 10.15 12.19
Apple - - - - 45.75 40.20 22.39 16.03
Ogla - - - - - - 2.91 2.71
Fafra - - - - - - 3.07 3.22
Rajmash - - - - 2.90 4.15 1.48 1.82
Kidney Bean - - - - - - 2.09 4.94
Oat 44.48 - - - - - - -
Arbi 11.38 - - - - - - -
Turmeric 7.15 - - - - - - -
Rabi
Wheat 14.89 11.16 8.44 12.00 6.35 7.80 1.60 2.01
Barley 12.35 - 8.73 8.65 11.10 11.45 1.57 3.31
Barseem 92.60 98.50 - - - - - -
Pea - - 67.98 61.56 - - - -
4.15 Livestock composition
Analysis of composition of bovine maintained among different livestock- crop production
systems in different agro-climatic zones reveals that Buffalo is the main bovine followed by
Crossbred cattle in LCPS 2 and only buffalo is kept by the farmers among LCPS 2 in district
Hamirpur (see Table 4.19).
In district Solan, the Crossbred cattle is the major bovine kept by farmers in LCPS 1,
while crossbred cow and buffalo are the bovines kept by farmers in LCPS 2. In district Shimla
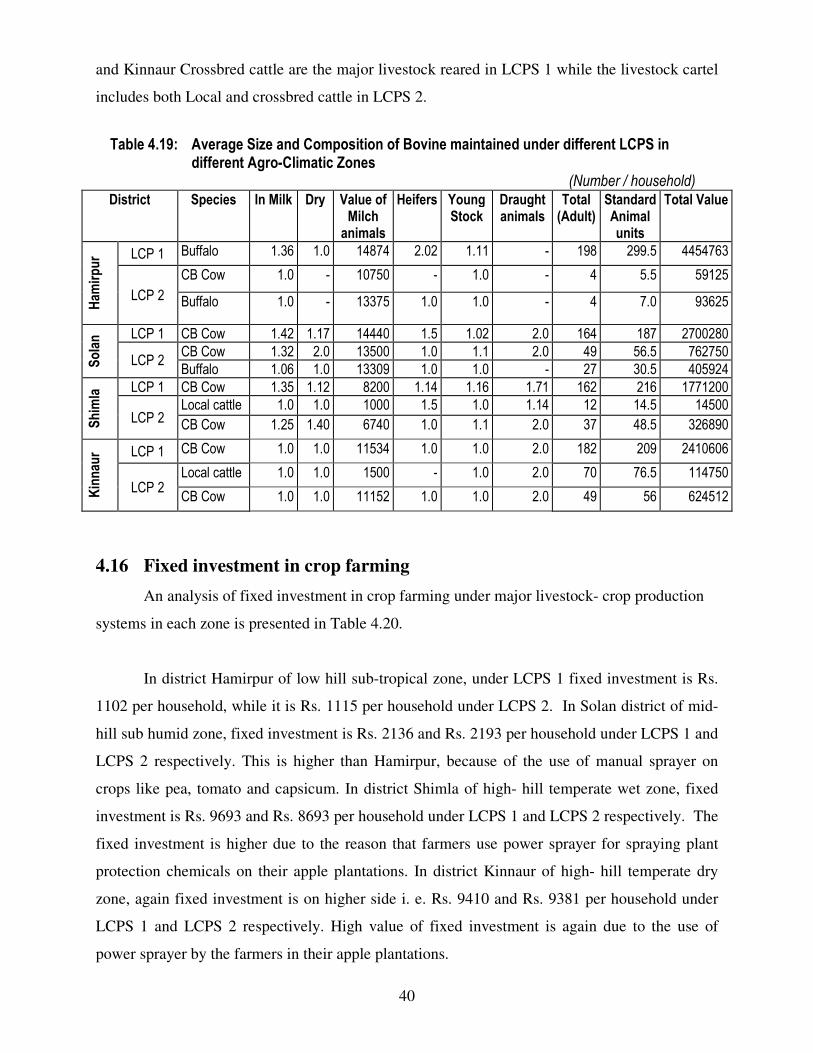
40
and Kinnaur Crossbred cattle are the major livestock reared in LCPS 1 while the livestock cartel
includes both Local and crossbred cattle in LCPS 2.
Table 4.19: Average Size and Composition of Bovine maintained under different LCPS in
different Agro-Climatic Zones
(Number / household) District Species In Milk Dry Value of
Milch animals
Heifers Young Stock
Draught animals
Total (Adult)
Standard Animal units
Total Value
Ham
irpur LCP 1 Buffalo 1.36 1.0 14874 2.02 1.11 - 198 299.5 4454763
LCP 2
CB Cow 1.0 - 10750 - 1.0 - 4 5.5 59125
Buffalo 1.0 - 13375 1.0 1.0 - 4 7.0 93625
Solan LCP 1 CB Cow 1.42 1.17 14440 1.5 1.02 2.0 164 187 2700280
LCP 2 CB Cow 1.32 2.0 13500 1.0 1.1 2.0 49 56.5 762750
Buffalo 1.06 1.0 13309 1.0 1.0 - 27 30.5 405924
Shimla LCP 1 CB Cow 1.35 1.12 8200 1.14 1.16 1.71 162 216 1771200
LCP 2 Local cattle 1.0 1.0 1000 1.5 1.0 1.14 12 14.5 14500
CB Cow 1.25 1.40 6740 1.0 1.1 2.0 37 48.5 326890
Kinnaur LCP 1 CB Cow 1.0 1.0 11534 1.0 1.0 2.0 182 209 2410606
LCP 2 Local cattle 1.0 1.0 1500 - 1.0 2.0 70 76.5 114750
CB Cow 1.0 1.0 11152 1.0 1.0 2.0 49 56 624512
4.16 Fixed investment in crop farming
An analysis of fixed investment in crop farming under major livestock- crop production
systems in each zone is presented in Table 4.20.
In district Hamirpur of low hill sub-tropical zone, under LCPS 1 fixed investment is Rs.
1102 per household, while it is Rs. 1115 per household under LCPS 2. In Solan district of mid-
hill sub humid zone, fixed investment is Rs. 2136 and Rs. 2193 per household under LCPS 1 and
LCPS 2 respectively. This is higher than Hamirpur, because of the use of manual sprayer on
crops like pea, tomato and capsicum. In district Shimla of high- hill temperate wet zone, fixed
investment is Rs. 9693 and Rs. 8693 per household under LCPS 1 and LCPS 2 respectively. The
fixed investment is higher due to the reason that farmers use power sprayer for spraying plant
protection chemicals on their apple plantations. In district Kinnaur of high- hill temperate dry
zone, again fixed investment is on higher side i. e. Rs. 9410 and Rs. 9381 per household under
LCPS 1 and LCPS 2 respectively. High value of fixed investment is again due to the use of
power sprayer by the farmers in their apple plantations.
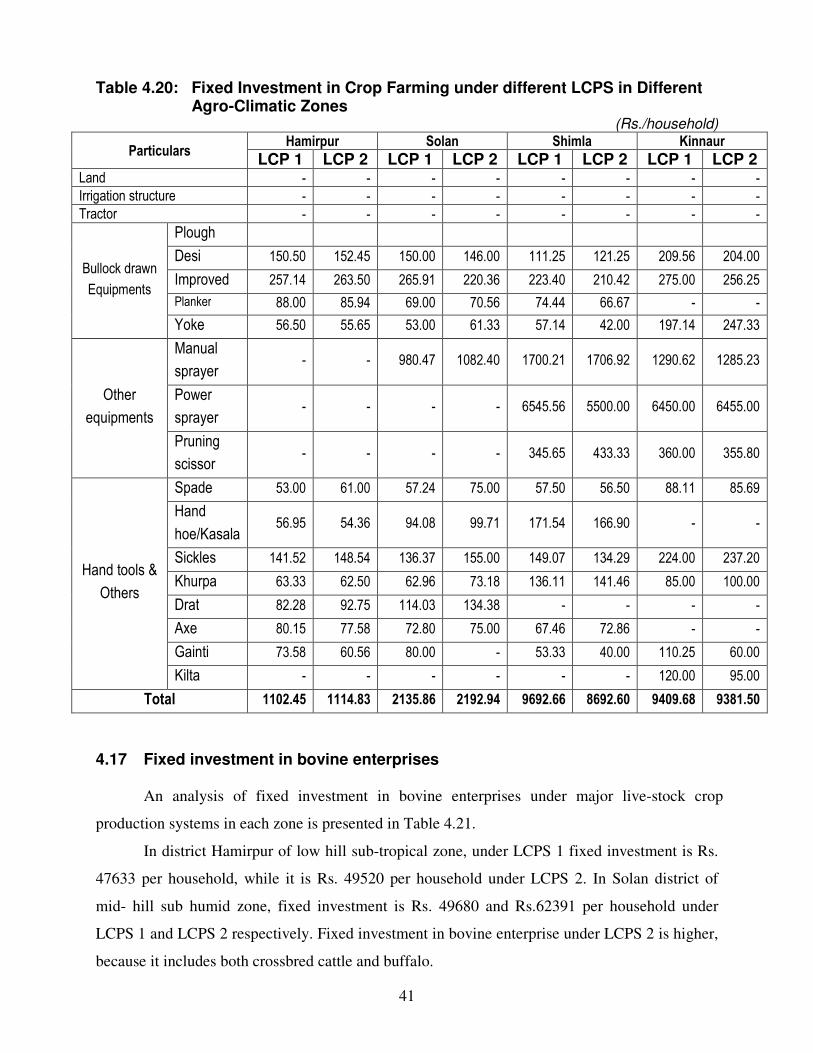
41
Table 4.20: Fixed Investment in Crop Farming under different LCPS in Different
Agro-Climatic Zones (Rs./household)
Particulars Hamirpur Solan Shimla Kinnaur
LCP 1 LCP 2 LCP 1 LCP 2 LCP 1 LCP 2 LCP 1 LCP 2 Land - - - - - - - -
Irrigation structure - - - - - - - -
Tractor - - - - - - - -
Bullock drawn
Equipments
Plough
Desi 150.50 152.45 150.00 146.00 111.25 121.25 209.56 204.00
Improved 257.14 263.50 265.91 220.36 223.40 210.42 275.00 256.25
Planker 88.00 85.94 69.00 70.56 74.44 66.67 - -
Yoke 56.50 55.65 53.00 61.33 57.14 42.00 197.14 247.33
Other
equipments
Manual
sprayer - - 980.47 1082.40 1700.21 1706.92 1290.62 1285.23
Power
sprayer - - - - 6545.56 5500.00 6450.00 6455.00
Pruning
scissor - - - - 345.65 433.33 360.00 355.80
Hand tools &
Others
Spade 53.00 61.00 57.24 75.00 57.50 56.50 88.11 85.69
Hand
hoe/Kasala 56.95 54.36 94.08 99.71 171.54 166.90 - -
Sickles 141.52 148.54 136.37 155.00 149.07 134.29 224.00 237.20
Khurpa 63.33 62.50 62.96 73.18 136.11 141.46 85.00 100.00
Drat 82.28 92.75 114.03 134.38 - - - -
Axe 80.15 77.58 72.80 75.00 67.46 72.86 - -
Gainti 73.58 60.56 80.00 - 53.33 40.00 110.25 60.00
Kilta - - - - - - 120.00 95.00
Total 1102.45 1114.83 2135.86 2192.94 9692.66 8692.60 9409.68 9381.50
4.17 Fixed investment in bovine enterprises An analysis of fixed investment in bovine enterprises under major live-stock crop
production systems in each zone is presented in Table 4.21.
In district Hamirpur of low hill sub-tropical zone, under LCPS 1 fixed investment is Rs.
47633 per household, while it is Rs. 49520 per household under LCPS 2. In Solan district of
mid- hill sub humid zone, fixed investment is Rs. 49680 and Rs.62391 per household under
LCPS 1 and LCPS 2 respectively. Fixed investment in bovine enterprise under LCPS 2 is higher,
because it includes both crossbred cattle and buffalo.
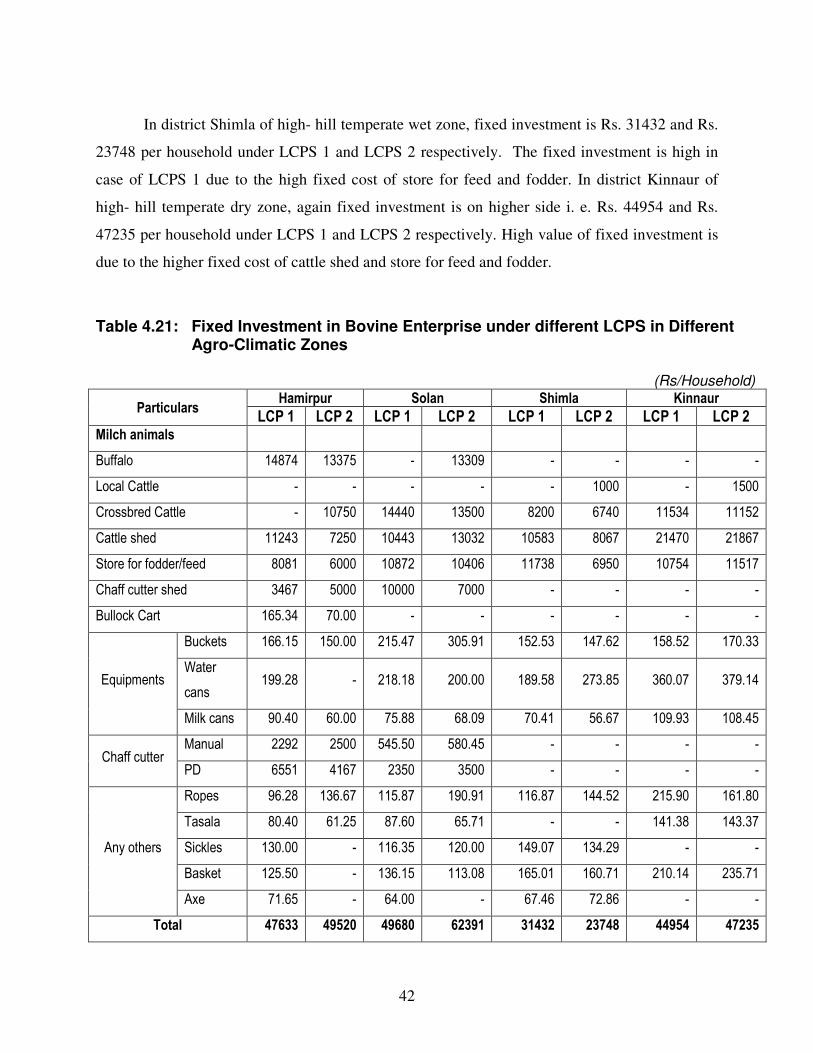
42
In district Shimla of high- hill temperate wet zone, fixed investment is Rs. 31432 and Rs.
23748 per household under LCPS 1 and LCPS 2 respectively. The fixed investment is high in
case of LCPS 1 due to the high fixed cost of store for feed and fodder. In district Kinnaur of
high- hill temperate dry zone, again fixed investment is on higher side i. e. Rs. 44954 and Rs.
47235 per household under LCPS 1 and LCPS 2 respectively. High value of fixed investment is
due to the higher fixed cost of cattle shed and store for feed and fodder.
Table 4.21: Fixed Investment in Bovine Enterprise under different LCPS in Different
Agro-Climatic Zones (Rs/Household)
Particulars Hamirpur Solan Shimla Kinnaur
LCP 1 LCP 2 LCP 1 LCP 2 LCP 1 LCP 2 LCP 1 LCP 2 Milch animals
Buffalo 14874 13375 - 13309 - - - -
Local Cattle - - - - - 1000 - 1500
Crossbred Cattle - 10750 14440 13500 8200 6740 11534 11152
Cattle shed 11243 7250 10443 13032 10583 8067 21470 21867
Store for fodder/feed 8081 6000 10872 10406 11738 6950 10754 11517
Chaff cutter shed 3467 5000 10000 7000 - - - -
Bullock Cart 165.34 70.00 - - - - - -
Equipments
Buckets 166.15 150.00 215.47 305.91 152.53 147.62 158.52 170.33
Water
cans 199.28 - 218.18 200.00 189.58 273.85 360.07 379.14
Milk cans 90.40 60.00 75.88 68.09 70.41 56.67 109.93 108.45
Chaff cutter Manual 2292 2500 545.50 580.45 - - - -
PD 6551 4167 2350 3500 - - - -
Any others
Ropes 96.28 136.67 115.87 190.91 116.87 144.52 215.90 161.80
Tasala 80.40 61.25 87.60 65.71 - - 141.38 143.37
Sickles 130.00 - 116.35 120.00 149.07 134.29 - -
Basket 125.50 - 136.15 113.08 165.01 160.71 210.14 235.71
Axe 71.65 - 64.00 - 67.46 72.86 - -
Total 47633 49520 49680 62391 31432 23748 44954 47235
43
Chapter-5
BREEDING, FEEDING AND MANAGEMENT PRACTICES ON
SAMPLED FARM HOUSEHOLDS
5.1 Feeding practices
Farmers have adopted a variety of strategies for feeding their animals. Depending on their
access to feed resources these strategies have varied across regions and also across different size
groups of producer households. The type of feed resources available to the farmers is roughage,
concentrates, compounded feed, crop residues and some amount of leguminous fodder cultivated
in the fields. Feeding practices followed in case of bovine husbandry are presented in Table
5.1and Table 5.2 for each zone under different LCPS.
5.1.1 Feeding system Feeding system adopted by majority of farmers in Hamirpur and
Solan is of individual type. In Hamirpur, 86 percent farmers in case of crossbred cow and 95
percent in case of buffalo fed their animals individually. In district Solan, 67 percent farmers fed
their crossbred cow and 94 percent fed buffalo individually, whereas in case of local cow only 54
percent farmers fed them individually. In district Shimla, 61 percent farmers in case of local cow
and 45 percent in case of crossbred cow fed their animals both individually as well as in group.
Whereas in district Kinnaur, about 48 percent farmers in case of local cow and 34 percent in case
of crossbred cow fed their animals in group. Feeding system under different LCPS shows that 95
percent farmers under LCPS 1 and LCPS 2 fed their buffalo individually in Hamirpur. Whereas,
83 percent farmers of LCPS 2fed their crossbred cow individually. In district Solan, under LCPS 1
and LCPS 2, 71 and 68 percent farmers respectively fed their crossbred cow individually and in
case of buffalo 94 percent farmers fed them individually under LCPS 2. In district Shimla, 44 and
47 percent farmers respectively fed their crossbred cow individually as well as in group under
LCPS 1 and LCPS 2. Whereas, 62 percent farmers fed their local cow individually as well as in
group under LCPS 2. In district Kinnaur, 35 and 34 percent farmers respectively fed their
crossbred cow individually, and 34 percent farmers fed their crossbred cow individually as well as
in group under LCPS 1 and LCPS 2. Whereas, 46 percent farmers fed their local cow in group
under LCPS 2.
44
5.1.2 Type of roughages fed Both dry and green fodder is fed to the bovines in all zones
except Kinnaur where about 11 percent farmers fed dry fodder, due to non-availability of green
fodder. Roughages fed are generally chaffed in district Hamirpur, whereas in district Solan, only
35 percent farmers in case of cattle and 65 percent in case of buffalo fed chaffed roughages to their
animals. In districts Shimla and Kinnaur, farmers fed un-chaffed roughages to their cattle. In
district Kinnaur, in case of crossbred cow only 5 percent farmers fed chaffed roughages to the
animals. Similar is the case under LCPS 1 and LCPS 2 in different agro- climatic zones.
5.1.3 Type of feeding Method of feeding adopted by majority of farmers is stall-fed as well
as grazing in open fields. In district Hamirpur, 72 percent farmers follow stall-feeding of their
crossbred cattle. Whereas in case of buffalo, it is 100 percent stall-feeding, because grazing
decreases the milk yield in buffalo. Under LCPS 2, 70 percent farmers follow stall-feeding of their
crossbred cattle. In district Solan, again in case of buffalo, 100 percent stall feeding is observed,
while in case of local and cross bred cow, it is 69 and 71 percent respectively. Under LCPS 1 and
LCPS 2, in case of crossbred cow, 84 and 74 percent respectively are stall-fed. In district Shimla,
76 percent farmers in case of local cattle and 67 percent in case of crossbred cattle fed their cattle
in stalls while others follow grazing in open fields as well as stall feeding. Whereas under LCPS 1,
in case of crossbred cow, 93 percent farmers follow stall feeding as compared to 58 percent
farmers in case of LCPS 2. All the sampled farmers in Kinnaur district follow both the methods of
grazing as well as stall feeding to feed their animals.
5.1.4 Type of concentrate fed The components of concentrates feed given to livestock
mostly consist of cottonseed/oilcakes, wheat bran, gram, taramira, barley and other grains. Wheat
bran was the most important item of concentrate and cotton seed/oil cakes followed it. Feeding of
taramira and grain was also observed in majority of sampled households. Gur (Jaggary) is also fed
to cow and buffaloes at the time of delivery. Both home made and compound feed is fed to
bovines but majority of farmers are not feeding min-mix to their bovines. This is higher in case of
cattle as compared to buffalo in district Hamirpur and Solan. But, in district Hamirpur about 22
percent farmers fed min- mix to their crossbred cattle. In district Kinnaur also, 18 and 47 percent
farmers fed min- mix to local and crossbred cow respectively. Similar is the case of feeding
supplementary ration/concentrate during late pregnancy in all zones, which is a matter of concern.
Results of concentrates and min- mix fed to bovines under different LCPS do not differ widely
from the average of the zone as a whole.
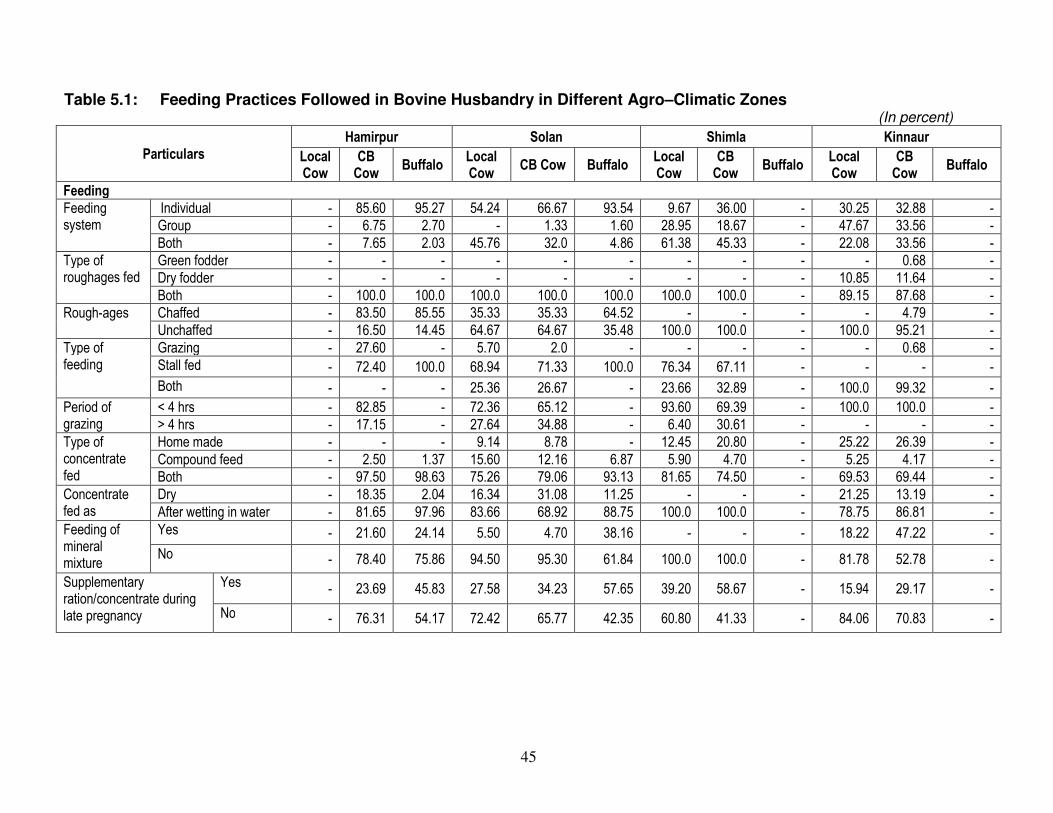
45
Table 5.1: Feeding Practices Followed in Bovine Husbandry in Different Agro–Climatic Zones (In percent)
Particulars Hamirpur Solan Shimla Kinnaur
Local Cow
CB Cow
Buffalo Local Cow
CB Cow Buffalo Local Cow
CB Cow
Buffalo Local Cow
CB Cow
Buffalo
Feeding
Feeding system
Individual - 85.60 95.27 54.24 66.67 93.54 9.67 36.00 - 30.25 32.88 -
Group - 6.75 2.70 - 1.33 1.60 28.95 18.67 - 47.67 33.56 -
Both - 7.65 2.03 45.76 32.0 4.86 61.38 45.33 - 22.08 33.56 -
Type of roughages fed
Green fodder - - - - - - - - - - 0.68 -
Dry fodder - - - - - - - - - 10.85 11.64 -
Both - 100.0 100.0 100.0 100.0 100.0 100.0 100.0 - 89.15 87.68 -
Rough-ages Chaffed - 83.50 85.55 35.33 35.33 64.52 - - - - 4.79 -
Unchaffed - 16.50 14.45 64.67 64.67 35.48 100.0 100.0 - 100.0 95.21 -
Type of feeding
Grazing - 27.60 - 5.70 2.0 - - - - - 0.68 -
Stall fed - 72.40 100.0 68.94 71.33 100.0 76.34 67.11 - - - -
Both - - - 25.36 26.67 - 23.66 32.89 - 100.0 99.32 -
Period of grazing
< 4 hrs - 82.85 - 72.36 65.12 - 93.60 69.39 - 100.0 100.0 -
> 4 hrs - 17.15 - 27.64 34.88 - 6.40 30.61 - - - -
Type of concentrate fed
Home made - - - 9.14 8.78 - 12.45 20.80 - 25.22 26.39 -
Compound feed - 2.50 1.37 15.60 12.16 6.87 5.90 4.70 - 5.25 4.17 -
Both - 97.50 98.63 75.26 79.06 93.13 81.65 74.50 - 69.53 69.44 -
Concentrate fed as
Dry - 18.35 2.04 16.34 31.08 11.25 - - - 21.25 13.19 -
After wetting in water - 81.65 97.96 83.66 68.92 88.75 100.0 100.0 - 78.75 86.81 -
Feeding of mineral mixture
Yes - 21.60 24.14 5.50 4.70 38.16 - - - 18.22 47.22 -
No - 78.40 75.86 94.50 95.30 61.84 100.0 100.0 - 81.78 52.78 -
Supplementary ration/concentrate during late pregnancy
Yes - 23.69 45.83 27.58 34.23 57.65 39.20 58.67 - 15.94 29.17 -
No - 76.31 54.17 72.42 65.77 42.35 60.80 41.33 - 84.06 70.83 -
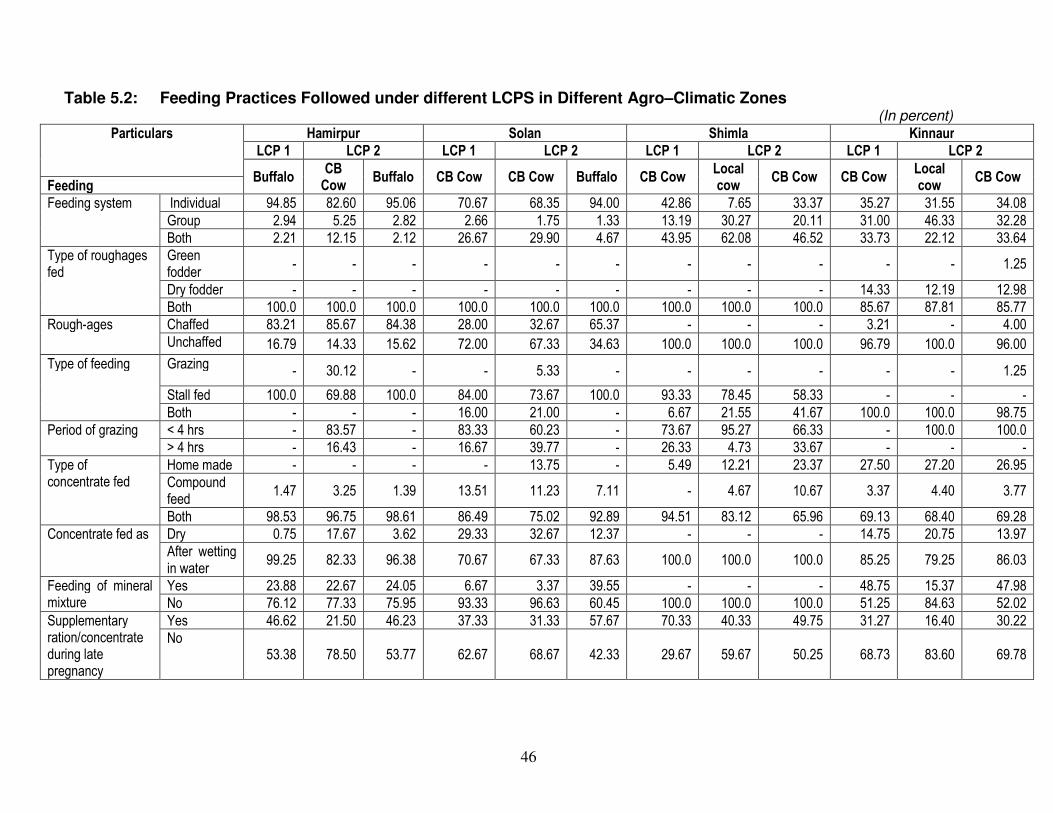
46
Table 5.2: Feeding Practices Followed under different LCPS in Different Agro–Climatic Zones (In percent)
Particulars Hamirpur Solan Shimla Kinnaur
LCP 1 LCP 2 LCP 1 LCP 2 LCP 1 LCP 2 LCP 1 LCP 2
Buffalo CB Cow
Buffalo CB Cow CB Cow Buffalo CB Cow Local cow
CB Cow CB Cow Local cow
CB Cow Feeding Feeding system Individual 94.85 82.60 95.06 70.67 68.35 94.00 42.86 7.65 33.37 35.27 31.55 34.08
Group 2.94 5.25 2.82 2.66 1.75 1.33 13.19 30.27 20.11 31.00 46.33 32.28
Both 2.21 12.15 2.12 26.67 29.90 4.67 43.95 62.08 46.52 33.73 22.12 33.64
Type of roughages fed
Green fodder
- - - - - - - - - - - 1.25
Dry fodder - - - - - - - - - 14.33 12.19 12.98
Both 100.0 100.0 100.0 100.0 100.0 100.0 100.0 100.0 100.0 85.67 87.81 85.77
Rough-ages Chaffed 83.21 85.67 84.38 28.00 32.67 65.37 - - - 3.21 - 4.00
Unchaffed 16.79 14.33 15.62 72.00 67.33 34.63 100.0 100.0 100.0 96.79 100.0 96.00
Type of feeding Grazing - 30.12 - - 5.33 - - - - - - 1.25
Stall fed 100.0 69.88 100.0 84.00 73.67 100.0 93.33 78.45 58.33 - - -
Both - - - 16.00 21.00 - 6.67 21.55 41.67 100.0 100.0 98.75
Period of grazing < 4 hrs - 83.57 - 83.33 60.23 - 73.67 95.27 66.33 - 100.0 100.0
> 4 hrs - 16.43 - 16.67 39.77 - 26.33 4.73 33.67 - - -
Type of concentrate fed
Home made - - - - 13.75 - 5.49 12.21 23.37 27.50 27.20 26.95
Compound feed
1.47 3.25 1.39 13.51 11.23 7.11 - 4.67 10.67 3.37 4.40 3.77
Both 98.53 96.75 98.61 86.49 75.02 92.89 94.51 83.12 65.96 69.13 68.40 69.28
Concentrate fed as Dry 0.75 17.67 3.62 29.33 32.67 12.37 - - - 14.75 20.75 13.97
After wetting in water
99.25 82.33 96.38 70.67 67.33 87.63 100.0 100.0 100.0 85.25 79.25 86.03
Feeding of mineral mixture
Yes 23.88 22.67 24.05 6.67 3.37 39.55 - - - 48.75 15.37 47.98
No 76.12 77.33 75.95 93.33 96.63 60.45 100.0 100.0 100.0 51.25 84.63 52.02
Supplementary ration/concentrate during late pregnancy
Yes 46.62 21.50 46.23 37.33 31.33 57.67 70.33 40.33 49.75 31.27 16.40 30.22
No 53.38 78.50 53.77 62.67 68.67 42.33 29.67 59.67 50.25 68.73 83.60 69.78
47
5.2 Breeding Practices
In order to understand the existing breeding practices followed by the farm households, the
data collected from the sample survey has been used. Farmers can build their animal herd either
by raising calves (male/female)/ offspring in their own farms or by purchasing animals or by
getting animals on exchange and lease arrangements.
The transformation of the breeding practice depends, on the one hand, on the extent and
distribution of infrastructure and the supply of input for AI and, on the other, in the degree of
utilization of the AI facility by the breeders. Breeding practices followed in case of bovine
enterprises are presented in Table 5.3 for each zone and Table 5.4 for different LCPS.
5.2.1 Breeding system Results of the analysis reveals that AI is more prevalent in case of
Local and Crossbred cow in all the four zones. In case of buffalo, 76 percent farmers in Hamirpur
and 64 percent in Solan preferred natural service. Similar results are obtained under LCPS 1 and
LCPS 2 in these districts. In district Kinnaur, 39 percent farmers adopted natural service for
breeding of crossbred cows, while under LCPS 1 and LCPS 2 the percentage is 35 and 40 percent
respectively. Nearly 90 percent farmers of Shimla district adopted AI for local cow and 75 percent
in case of crossbred cows.
5.2.2 Period of heat Period of heat at which animals are inseminated is very crucial for the
breeding of animals. In district Hamirpur, 78 percent farmers inseminated their bovine in mid heat
period, while others in late heat period in case of crossbred cow as well as buffalo. But in case of
buffalo under LCPS 1, 76 percent farmers prefer mid heat period, which is slightly less than a
percentage for the zone. In district Solan, 67, 72 and 92 percent farmers prefer mid heat period for
insemination in local cow, crossbred cow and buffalo respectively. Similar results are obtained
under LCPS 1 and LCPS 2. In district Shimla, in case of local cow, 95 percent farmers prefer mid
heat period for insemination, whereas in case of crossbred cow, 68 percent farmers prefer late heat
period for insemination. This is mainly due to the reason that the animals are not fed properly.
Similar situation is observed under LCPS 1 and LCPS 2. In district Kinnaur, about 5.4 percent
farmers inseminated their crossbred cow in early heat period. While majority of farmers prefer mid
heat in case of both local as well as crossbred cow.
48
5.2.3 Preference for exotic breed Preference for exotic breed in case of crossbred cow in
all the zones is Jersey, which is 100 percent in case of district Hamirpur, 93 percent in district
Solan, 70 percent in district Shimla and 95 percent in district Kinnaur. Whereas, local breeds are
preferred by farmers in case of local cows in all the four zones of Himachal Pradesh. Similar
results are obtained in case of LCPS 1 and LCPS 2.
5.2.4 Number of AI and Service after calving Number of artificial inseminations for
successful conception are generally two, as revealed by 88 percent farmers in case of crossbred
cow and 80 percent in case of buffalo in district Hamirpur. In district Solan, the percentage of such
farmers is 71, 62 and 84 percent in case of local cow, crossbred cow and buffalo respectively. In
Shimla, 80 percent farmers in case of local cow inseminated twice, whereas in case of crossbred
cow, one AI is done for conception in 27 percent, two AI’s in case of 53 percent, three in case of
19 percent and five in case of 1.37 percent crossbred cows. Under LCPS 1 and LCPS 2, one AI is
done for conception in case of 12 and 23 percent crossbred cows, while percentage of two AI’s is
higher than the average for the zone. In district Kinnaur, again in case of local cow, two AI’s is
done in 83 percent cows, while, in case of crossbred cow, one AI in 16 percent, two AI’s in 29
percent, three AI’s in 39 percent, four in 15 percent and five AI’s in 1.38 percent cows is done for
successful conception.
5.2.5 Pregnancy diagnosis Pregnancy diagnosis was given after 90 days in case of 86
percent farmers to crossbred cow and 93 percent to buffalo in Hamirpur. In district Solan, 85, 70
and 94 percent farmers gave pregnancy diagnosis to local cow, crossbred cow and buffalo
respectively. Whereas in district Shimla, 69 and 57 percent farmers gave pregnancy diagnosis after
60 days to local and crossbred cow respectively, while remaining farmers gave the diagnosis after
90 days. This percentage is higher in case of district Kinnaur, where 92 and 82 percent farmers
gave pregnancy diagnosis after 60 days to local and crossbred cow respectively. The similar results
are obtained under livestock- crop production systems LCPS 1 and LCPS 2 and are presented in
Table 5.4.
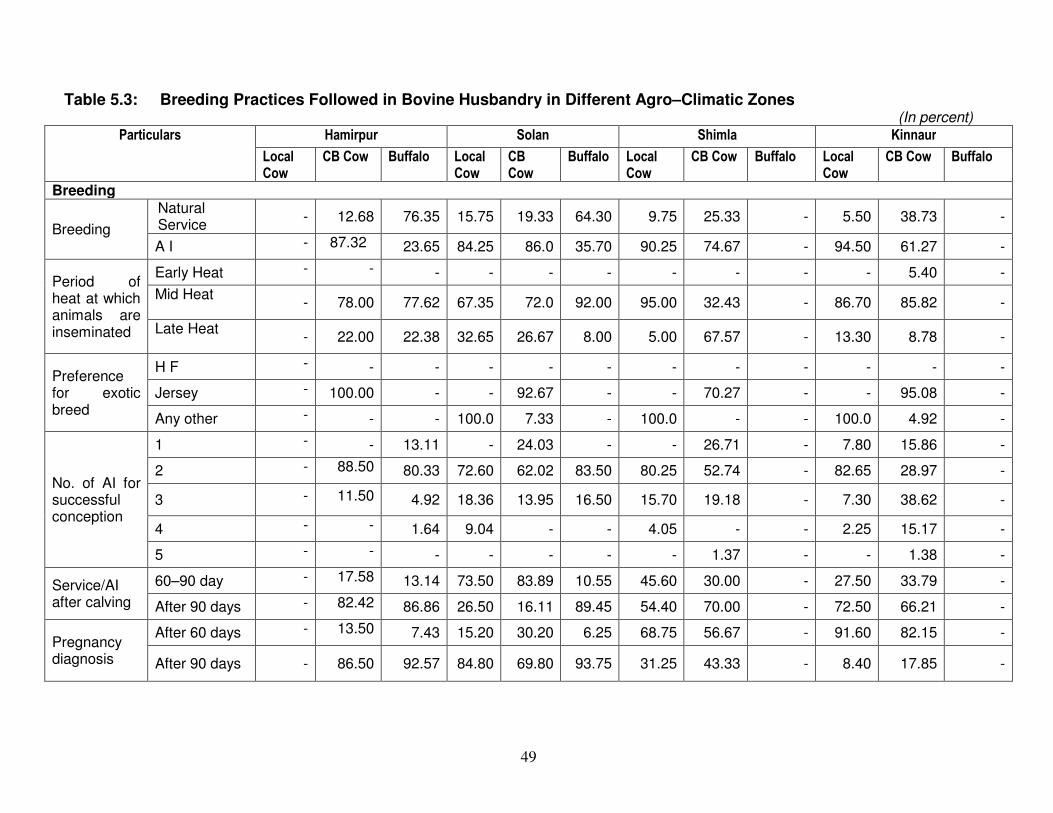
49
Table 5.3: Breeding Practices Followed in Bovine Husbandry in Different Agro–Climatic Zones
(In percent) Particulars Hamirpur Solan Shimla Kinnaur
Local Cow
CB Cow Buffalo Local Cow
CB Cow
Buffalo Local Cow
CB Cow Buffalo Local Cow
CB Cow Buffalo
Breeding
Breeding
Natural Service
- 12.68 76.35 15.75 19.33 64.30 9.75 25.33 - 5.50 38.73 -
A I - 87.32 23.65 84.25 86.0 35.70 90.25 74.67 - 94.50 61.27 -
Period of heat at which animals are inseminated
Early Heat - - - - - - - - - - 5.40 -
Mid Heat - 78.00 77.62 67.35 72.0 92.00 95.00 32.43 - 86.70 85.82 -
Late Heat - 22.00 22.38 32.65 26.67 8.00 5.00 67.57 - 13.30 8.78 -
Preference for exotic breed
H F - - - - - - - - - - - -
Jersey - 100.00 - - 92.67 - - 70.27 - - 95.08 -
Any other - - - 100.0 7.33 - 100.0 - - 100.0 4.92 -
No. of AI for successful conception
1 - - 13.11 - 24.03 - - 26.71 - 7.80 15.86 -
2 - 88.50 80.33 72.60 62.02 83.50 80.25 52.74 - 82.65 28.97 -
3 - 11.50 4.92 18.36 13.95 16.50 15.70 19.18 - 7.30 38.62 -
4 - - 1.64 9.04 - - 4.05 - - 2.25 15.17 -
5 - - - - - - - 1.37 - - 1.38 -
Service/AI after calving
60–90 day - 17.58 13.14 73.50 83.89 10.55 45.60 30.00 - 27.50 33.79 -
After 90 days - 82.42 86.86 26.50 16.11 89.45 54.40 70.00 - 72.50 66.21 -
Pregnancy diagnosis
After 60 days - 13.50 7.43 15.20 30.20 6.25 68.75 56.67 - 91.60 82.15 -
After 90 days - 86.50 92.57 84.80 69.80 93.75 31.25 43.33 - 8.40 17.85 -
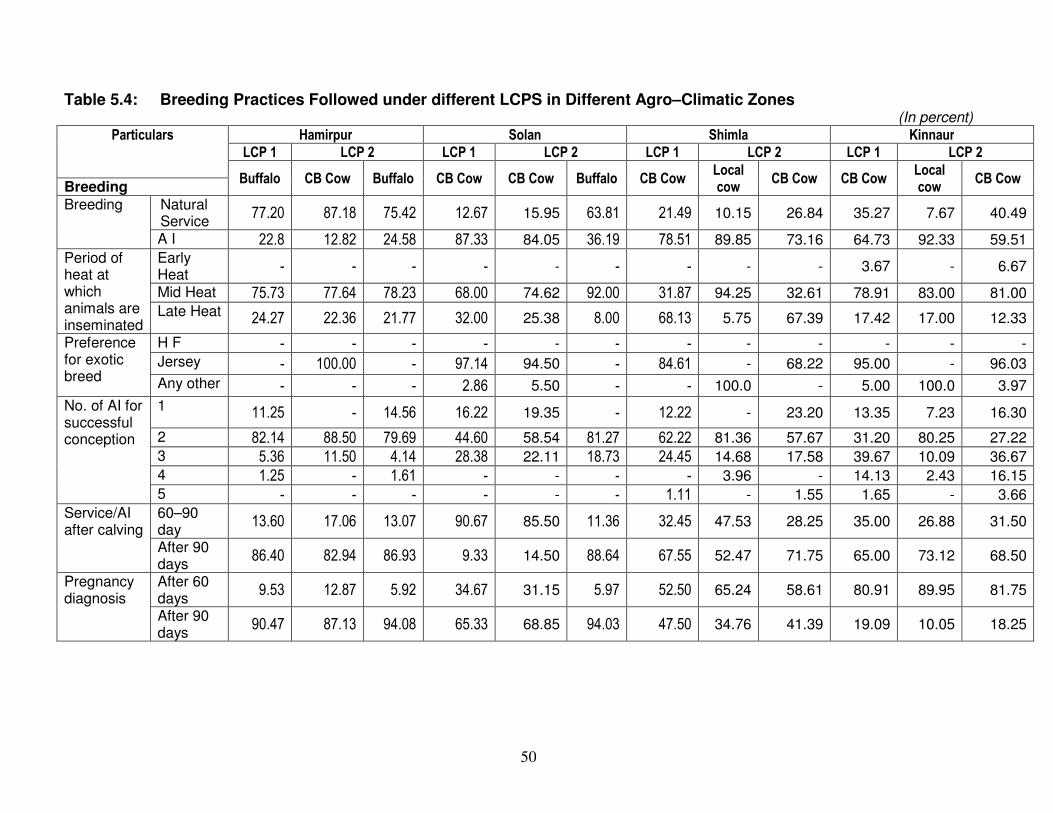
50
Table 5.4: Breeding Practices Followed under different LCPS in Different Agro–Climatic Zones
(In percent) Particulars Hamirpur Solan Shimla Kinnaur
LCP 1 LCP 2 LCP 1 LCP 2 LCP 1 LCP 2 LCP 1 LCP 2
Buffalo CB Cow Buffalo CB Cow CB Cow Buffalo CB Cow Local cow
CB Cow CB Cow Local cow
CB Cow Breeding Breeding Natural
Service 77.20 87.18 75.42 12.67 15.95 63.81 21.49 10.15 26.84 35.27 7.67 40.49
A I 22.8 12.82 24.58 87.33 84.05 36.19 78.51 89.85 73.16 64.73 92.33 59.51
Period of heat at which animals are inseminated
Early Heat
- - - - - - - - - 3.67 - 6.67
Mid Heat 75.73 77.64 78.23 68.00 74.62 92.00 31.87 94.25 32.61 78.91 83.00 81.00
Late Heat 24.27 22.36 21.77 32.00 25.38 8.00 68.13 5.75 67.39 17.42 17.00 12.33
Preference for exotic breed
H F - - - - - - - - - - - -
Jersey - 100.00 - 97.14 94.50 - 84.61 - 68.22 95.00 - 96.03
Any other - - - 2.86 5.50 - - 100.0 - 5.00 100.0 3.97
No. of AI for successful conception
1 11.25 - 14.56 16.22 19.35 - 12.22 - 23.20 13.35 7.23 16.30
2 82.14 88.50 79.69 44.60 58.54 81.27 62.22 81.36 57.67 31.20 80.25 27.22
3 5.36 11.50 4.14 28.38 22.11 18.73 24.45 14.68 17.58 39.67 10.09 36.67
4 1.25 - 1.61 - - - - 3.96 - 14.13 2.43 16.15
5 - - - - - - 1.11 - 1.55 1.65 - 3.66
Service/AI after calving
60–90 day
13.60 17.06 13.07 90.67 85.50 11.36 32.45 47.53 28.25 35.00 26.88 31.50
After 90 days
86.40 82.94 86.93 9.33 14.50 88.64 67.55 52.47 71.75 65.00 73.12 68.50
Pregnancy diagnosis
After 60 days
9.53 12.87 5.92 34.67 31.15 5.97 52.50 65.24 58.61 80.91 89.95 81.75
After 90 days
90.47 87.13 94.08 65.33 68.85 94.03 47.50 34.76 41.39 19.09 10.05 18.25
51
5.3 Management practices
Results of Management practices followed in bovine husbandry are presented in Table 5.5
for each zone and management practices followed under different LCPS are presented in Table
5.6.
5.3.1 Milking of animals In all districts under study, recommended practices are followed
in case of milking of animals. In district Hamirpur, Solan and Shimla, all the sampled farmers
reported that the udders are washed before milking of animals. In case of district Kinnaur, only 62
percent farmers in case of local cow and 60 percent farmers in case of crossbred cow washed
udders before milking. Similar results are obtained under LCPS 1and LCPS 2 for all. In district
Shimla under LCPS 2, 96 percent farmers in case of crossbred cow washed the udders before
milking.
Milking of animals is done inside as well as outside the cattleshed. In district Hamirpur,
milking is done outside the cattleshed by 52 and 79 percent farmers in case of crossbred cow and
buffalo respectively. Whereas this percentage is 48, 51 and 88 percent in case of local cow,
crossbred cow and buffalo respectively in district Solan. The percentage of milking animals
outside the cattleshed is very high in case of district Shimla and it is 96 and 95 percent in case of
local and crossbred cow respectively. In district Kinnaur, around 53 percent farmers done milking
of their animals inside the cattle shed. Similar results are obtained under LCPS 1and LCPS 2.
Milking is generally done two times a day during morning and evening in case of cattle in
all the four zones. But in case of local cow, significant number of farmers done milking thrice a
day, while in crossbred cow 25, 16, 33 and 14 percent farmers milk their animals three times a day
in district Hamirpur, Solan, Shimla and Kinnaur respectively. In case of buffalo in district
Hamirpur and Solan, milking is done two times a day. Calves are allowed to suckle by the farmers
in all the four zones except 11 and 5 percent in case of crossbred cow in district Hamirpur and
Solan respectively.
5.3.2 Housing In district Hamirpur and Shimla, bovine are generally kept in a room which
is a part of residential building. As 74 percent farmers in Hamirpur and 97 percent farmers in
Shimla responded that housing arrangements of animals are done in the ground floor of their
52
residential building. In district Solan and Kinnaur, 53 and 56 percent farmers made separate stalls
for keeping their bovines. Type of stall where animals are kept is generally kuchha, but it depends
upon whether it is separate or a part of residential building. Majority of the farmers in all the four
zones kept their bovine tied in stalls. Stall cleaning is done by majority of the farmers once a day
except in case of Hamirpur, where about 62 percent farmers done stall cleaning twice a day.
Similar results are obtained under LCPS 1and LCPS 2.
5.3.3 Animal health In district Hamirpur and Solan majority of farmers vaccinated their
bovines against preventive diseases. But in case of district Shimla only 75 and 84 percent farmers
vaccinated local and crossbred cow respectively against preventive diseases. In case of district
Kinnaur, the situation is further worsened and only 36 and 41 percent farmers vaccinated local and
crossbred cow respectively against preventive diseases. Diseased animals are generally tied
together with other animals in all the four zones. Cleaning was done after calving in all the four
districts of respective zones.
5.3.4 Calf rearing In district Hamirpur, in case of crossbred cow dehorning of calves is
done by 82 percent farmers, while in case of buffalo it was 1.49 percent. In district Solan, 77 and
72 percent farmers in local and crossbred cow respectively dehorn calves. In Shimla district, 88
and 77 percent farmers do dehorning of calves in case of local and crossbred cow respectively.
Whereas the percentage of farmers dehorning calves in district Kinnaur is very low, and only 43
and 32 percent farmers in local and crossbred cow follow the practice. Deworming is an important
process to prevent calves from various diseases, but it was not done by majority of farmers in all
the districts and is a matter of concern. Vaccination against preventive diseases is done in calves
except in district Kinnaur, where only 35 percent farmers in case of local cow and 41 percent in
case of crossbred cow vaccinated their calves against preventive diseases.
5.3.5 Marketing In case of marketing of milk consumer is the first choice of farmers in
Solan and milk vendors in Hamirpur and Shimla. Milk is not sold in Kinnaur and used for home
consumption in one form or another. Similar results are obtained under LCPS 1and LCPS 2.
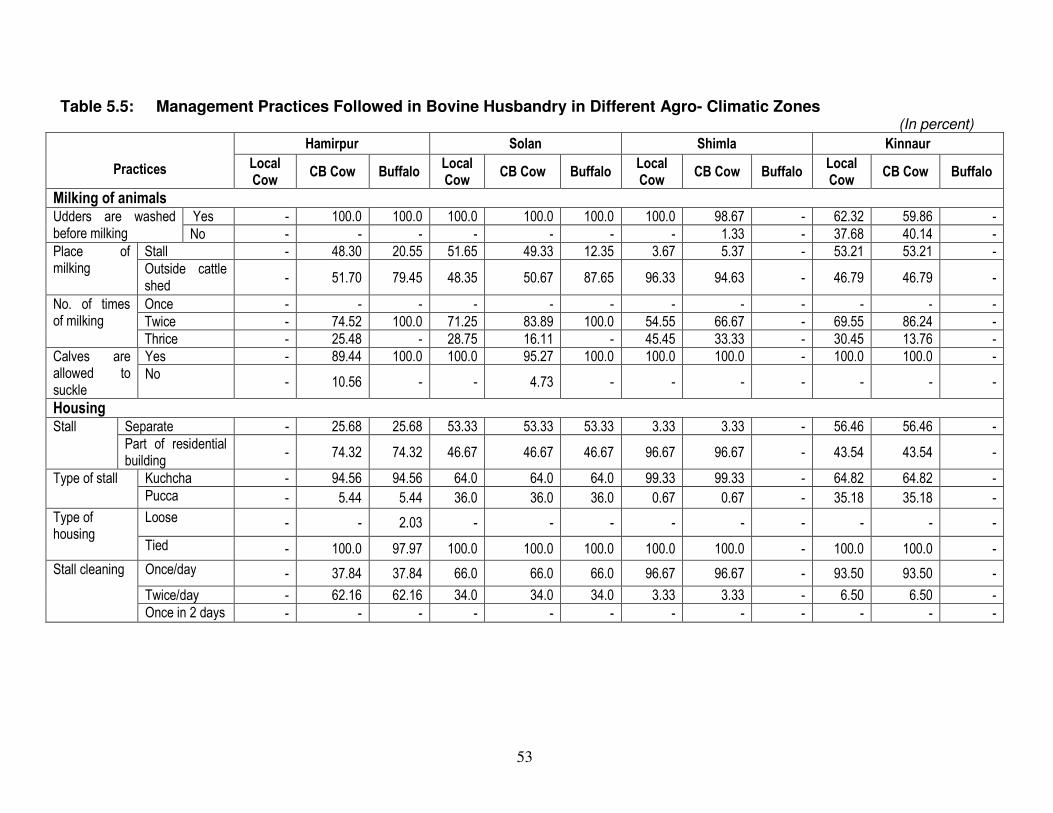
53
Table 5.5: Management Practices Followed in Bovine Husbandry in Different Agro- Climatic Zones (In percent)
Practices
Hamirpur Solan Shimla Kinnaur
Local Cow
CB Cow Buffalo Local Cow
CB Cow Buffalo Local Cow
CB Cow Buffalo Local Cow
CB Cow Buffalo
Milking of animals Udders are washed before milking
Yes - 100.0 100.0 100.0 100.0 100.0 100.0 98.67 - 62.32 59.86 -
No - - - - - - - 1.33 - 37.68 40.14 -
Place of milking
Stall - 48.30 20.55 51.65 49.33 12.35 3.67 5.37 - 53.21 53.21 -
Outside cattle shed
- 51.70 79.45 48.35 50.67 87.65 96.33 94.63 - 46.79 46.79 -
No. of times of milking
Once - - - - - - - - - - - -
Twice - 74.52 100.0 71.25 83.89 100.0 54.55 66.67 - 69.55 86.24 -
Thrice - 25.48 - 28.75 16.11 - 45.45 33.33 - 30.45 13.76 -
Calves are allowed to suckle
Yes - 89.44 100.0 100.0 95.27 100.0 100.0 100.0 - 100.0 100.0 -
No - 10.56 - - 4.73 - - - - - - -
Housing Stall Separate - 25.68 25.68 53.33 53.33 53.33 3.33 3.33 - 56.46 56.46 -
Part of residential building
- 74.32 74.32 46.67 46.67 46.67 96.67 96.67 - 43.54 43.54 -
Type of stall Kuchcha - 94.56 94.56 64.0 64.0 64.0 99.33 99.33 - 64.82 64.82 -
Pucca - 5.44 5.44 36.0 36.0 36.0 0.67 0.67 - 35.18 35.18 -
Type of housing
Loose - - 2.03 - - - - - - - - -
Tied - 100.0 97.97 100.0 100.0 100.0 100.0 100.0 - 100.0 100.0 -
Stall cleaning Once/day - 37.84 37.84 66.0 66.0 66.0 96.67 96.67 - 93.50 93.50 -
Twice/day - 62.16 62.16 34.0 34.0 34.0 3.33 3.33 - 6.50 6.50 -
Once in 2 days - - - - - - - - - - - -
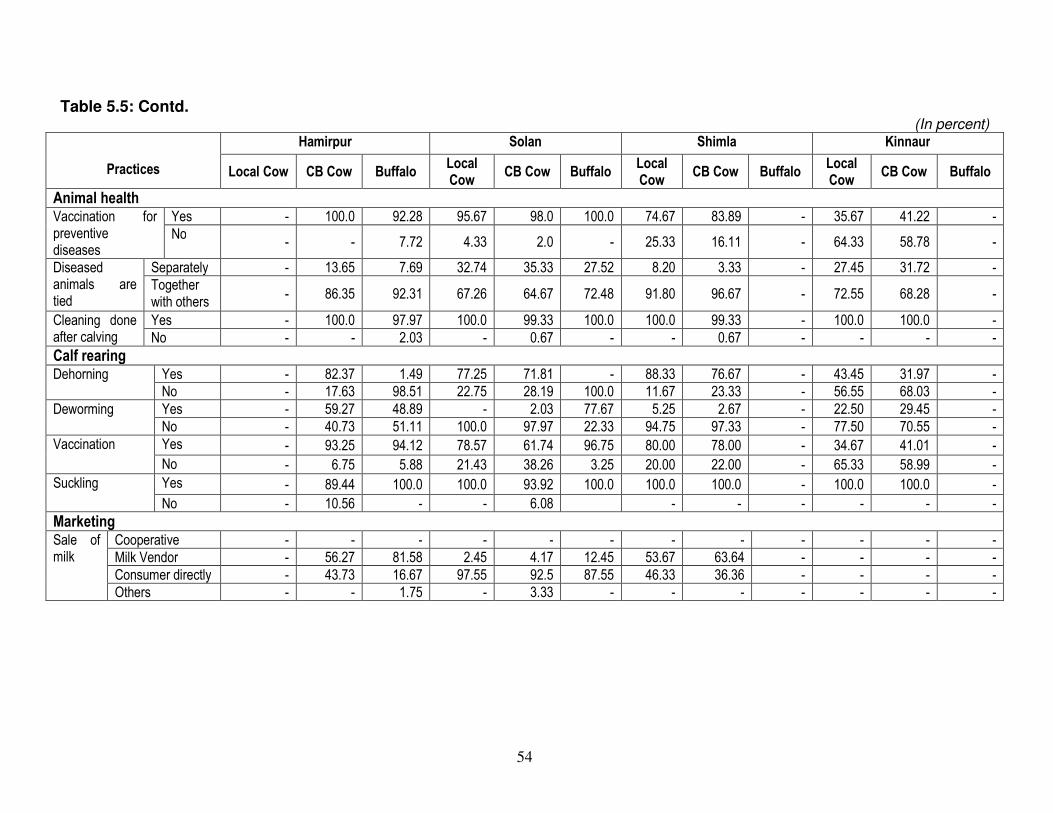
54
Table 5.5: Contd.
(In percent)
Practices
Hamirpur Solan Shimla Kinnaur
Local Cow CB Cow Buffalo Local Cow
CB Cow Buffalo Local Cow
CB Cow Buffalo Local Cow
CB Cow Buffalo
Animal health Vaccination for preventive diseases
Yes - 100.0 92.28 95.67 98.0 100.0 74.67 83.89 - 35.67 41.22 -
No - - 7.72 4.33 2.0 - 25.33 16.11 - 64.33 58.78 -
Diseased animals are tied
Separately - 13.65 7.69 32.74 35.33 27.52 8.20 3.33 - 27.45 31.72 -
Together with others
- 86.35 92.31 67.26 64.67 72.48 91.80 96.67 - 72.55 68.28 -
Cleaning done after calving
Yes - 100.0 97.97 100.0 99.33 100.0 100.0 99.33 - 100.0 100.0 -
No - - 2.03 - 0.67 - - 0.67 - - - -
Calf rearing Dehorning Yes - 82.37 1.49 77.25 71.81 - 88.33 76.67 - 43.45 31.97 -
No - 17.63 98.51 22.75 28.19 100.0 11.67 23.33 - 56.55 68.03 -
Deworming Yes - 59.27 48.89 - 2.03 77.67 5.25 2.67 - 22.50 29.45 -
No - 40.73 51.11 100.0 97.97 22.33 94.75 97.33 - 77.50 70.55 -
Vaccination Yes - 93.25 94.12 78.57 61.74 96.75 80.00 78.00 - 34.67 41.01 -
No - 6.75 5.88 21.43 38.26 3.25 20.00 22.00 - 65.33 58.99 -
Suckling Yes - 89.44 100.0 100.0 93.92 100.0 100.0 100.0 - 100.0 100.0 -
No - 10.56 - - 6.08 - - - - - -
Marketing Sale of milk
Cooperative - - - - - - - - - - - -
Milk Vendor - 56.27 81.58 2.45 4.17 12.45 53.67 63.64 - - - -
Consumer directly - 43.73 16.67 97.55 92.5 87.55 46.33 36.36 - - - -
Others - - 1.75 - 3.33 - - - - - - -
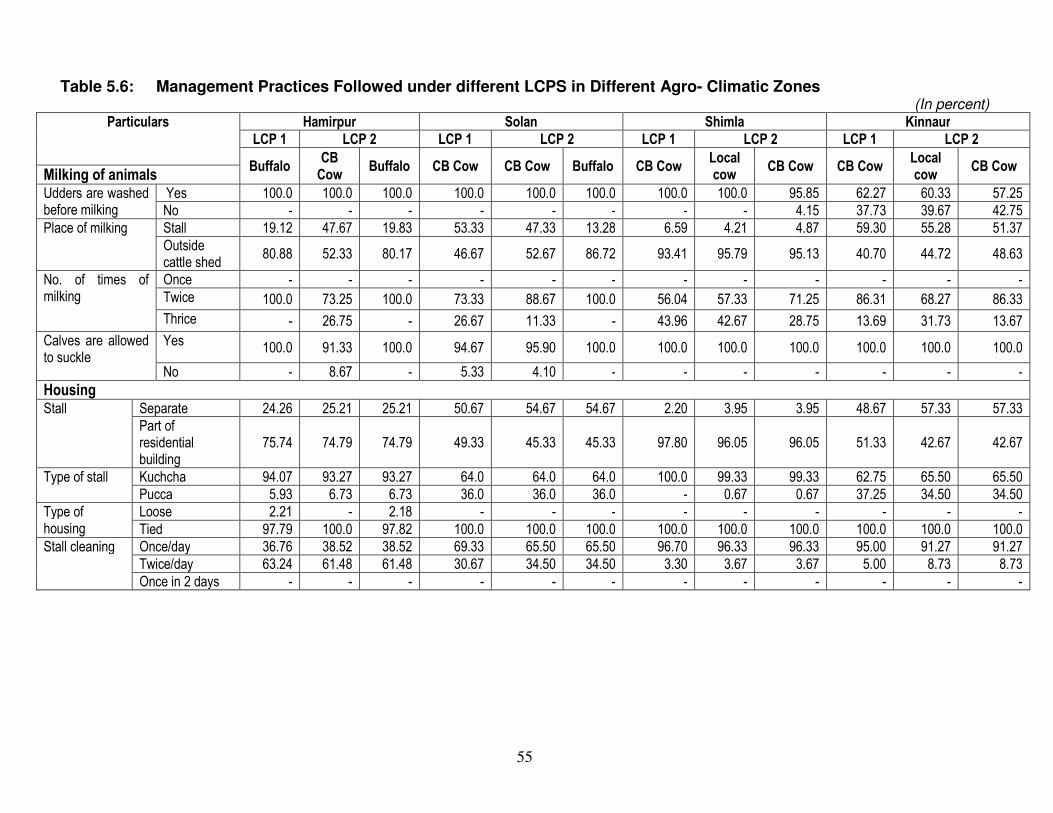
55
Table 5.6: Management Practices Followed under different LCPS in Different Agro- Climatic Zones (In percent)
Particulars Hamirpur Solan Shimla Kinnaur
LCP 1 LCP 2 LCP 1 LCP 2 LCP 1 LCP 2 LCP 1 LCP 2
Buffalo CB Cow
Buffalo CB Cow CB Cow Buffalo CB Cow Local cow
CB Cow CB Cow Local cow
CB Cow Milking of animals Udders are washed before milking
Yes 100.0 100.0 100.0 100.0 100.0 100.0 100.0 100.0 95.85 62.27 60.33 57.25
No - - - - - - - - 4.15 37.73 39.67 42.75
Place of milking Stall 19.12 47.67 19.83 53.33 47.33 13.28 6.59 4.21 4.87 59.30 55.28 51.37
Outside cattle shed
80.88 52.33 80.17 46.67 52.67 86.72 93.41 95.79 95.13 40.70 44.72 48.63
No. of times of milking
Once - - - - - - - - - - - -
Twice 100.0 73.25 100.0 73.33 88.67 100.0 56.04 57.33 71.25 86.31 68.27 86.33
Thrice - 26.75 - 26.67 11.33 - 43.96 42.67 28.75 13.69 31.73 13.67
Calves are allowed to suckle
Yes 100.0 91.33 100.0 94.67 95.90 100.0 100.0 100.0 100.0 100.0 100.0 100.0
No - 8.67 - 5.33 4.10 - - - - - - -
Housing Stall Separate 24.26 25.21 25.21 50.67 54.67 54.67 2.20 3.95 3.95 48.67 57.33 57.33
Part of residential building
75.74 74.79 74.79 49.33 45.33 45.33 97.80 96.05 96.05 51.33 42.67 42.67
Type of stall Kuchcha 94.07 93.27 93.27 64.0 64.0 64.0 100.0 99.33 99.33 62.75 65.50 65.50
Pucca 5.93 6.73 6.73 36.0 36.0 36.0 - 0.67 0.67 37.25 34.50 34.50
Type of housing
Loose 2.21 - 2.18 - - - - - - - - -
Tied 97.79 100.0 97.82 100.0 100.0 100.0 100.0 100.0 100.0 100.0 100.0 100.0
Stall cleaning Once/day 36.76 38.52 38.52 69.33 65.50 65.50 96.70 96.33 96.33 95.00 91.27 91.27
Twice/day 63.24 61.48 61.48 30.67 34.50 34.50 3.30 3.67 3.67 5.00 8.73 8.73
Once in 2 days - - - - - - - - - - - -
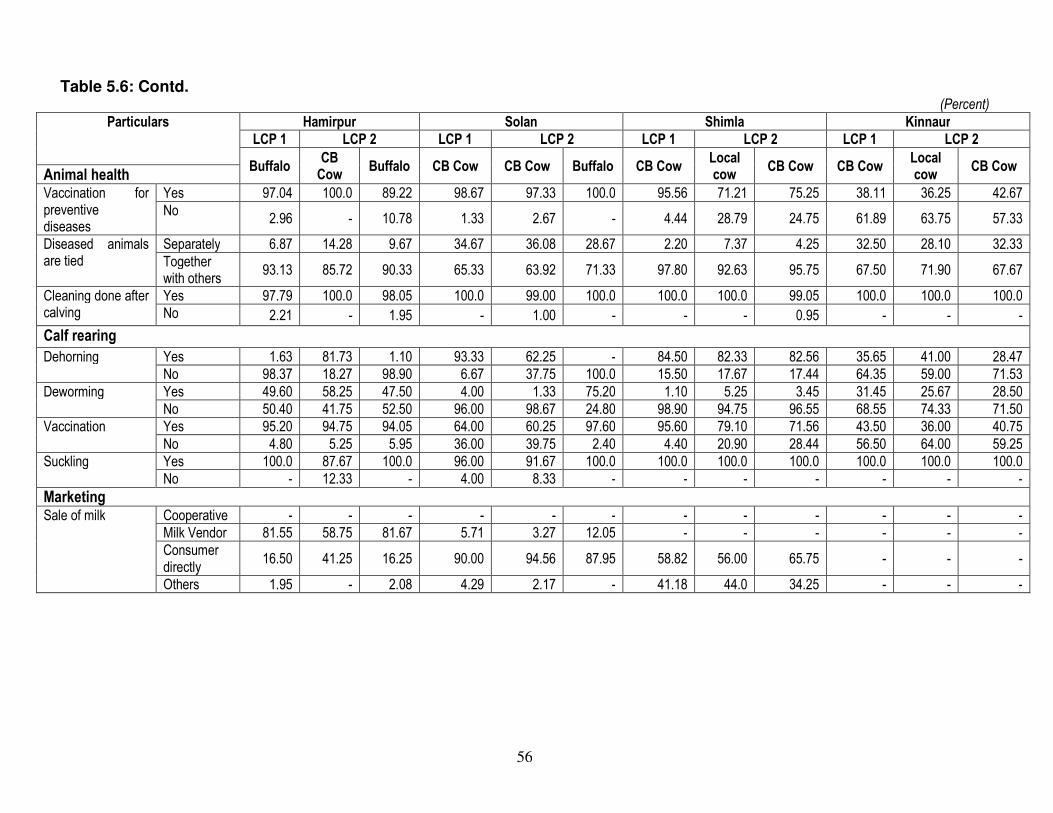
56
Table 5.6: Contd. (Percent)
Particulars Hamirpur Solan Shimla Kinnaur
LCP 1 LCP 2 LCP 1 LCP 2 LCP 1 LCP 2 LCP 1 LCP 2
Buffalo CB Cow
Buffalo CB Cow CB Cow Buffalo CB Cow Local cow
CB Cow CB Cow Local cow
CB Cow Animal health Vaccination for preventive diseases
Yes 97.04 100.0 89.22 98.67 97.33 100.0 95.56 71.21 75.25 38.11 36.25 42.67
No 2.96 - 10.78 1.33 2.67 - 4.44 28.79 24.75 61.89 63.75 57.33
Diseased animals are tied
Separately 6.87 14.28 9.67 34.67 36.08 28.67 2.20 7.37 4.25 32.50 28.10 32.33
Together with others
93.13 85.72 90.33 65.33 63.92 71.33 97.80 92.63 95.75 67.50 71.90 67.67
Cleaning done after calving
Yes 97.79 100.0 98.05 100.0 99.00 100.0 100.0 100.0 99.05 100.0 100.0 100.0
No 2.21 - 1.95 - 1.00 - - - 0.95 - - -
Calf rearing
Dehorning Yes 1.63 81.73 1.10 93.33 62.25 - 84.50 82.33 82.56 35.65 41.00 28.47
No 98.37 18.27 98.90 6.67 37.75 100.0 15.50 17.67 17.44 64.35 59.00 71.53
Deworming Yes 49.60 58.25 47.50 4.00 1.33 75.20 1.10 5.25 3.45 31.45 25.67 28.50
No 50.40 41.75 52.50 96.00 98.67 24.80 98.90 94.75 96.55 68.55 74.33 71.50
Vaccination Yes 95.20 94.75 94.05 64.00 60.25 97.60 95.60 79.10 71.56 43.50 36.00 40.75
No 4.80 5.25 5.95 36.00 39.75 2.40 4.40 20.90 28.44 56.50 64.00 59.25
Suckling Yes 100.0 87.67 100.0 96.00 91.67 100.0 100.0 100.0 100.0 100.0 100.0 100.0
No - 12.33 - 4.00 8.33 - - - - - - -
Marketing Sale of milk Cooperative - - - - - - - - - - - -
Milk Vendor 81.55 58.75 81.67 5.71 3.27 12.05 - - - - - -
Consumer directly
16.50 41.25 16.25 90.00 94.56 87.95 58.82 56.00 65.75 - - -
Others 1.95 - 2.08 4.29 2.17 - 41.18 44.0 34.25 - - -
57
Chapter-6
ECONOMIC CHARACTERISTICS AND PRODUCTIVITY OF
VARIOUS LIVESTOCK AND CROPS
6.1 Production Traits
The production traits of dairy animals are apparently closely inter-woven with the success
of dairy enterprise. Therefore, the production traits such as age at first calving, lactation length,
dry period, inter-calving period, average lactation yield and average daily milk yield per milch
animal of different breeds have been studied. Besides this, some ancillary parameters viz. breed
wise number of in milk/milch animals, conception rate, which have a crucial role in the economics
of milk production, have also been worked out. Delayed maturity of the animals is one of the
major factors responsible for the uneconomic nature of dairying. Earlier an animal attains the age
of maturity and calves, the repayment for unproductive period form date of birth to the age at first
calving begins earliest. The production traits of cows and buffaloes reared in different agro-
climatic zones of Himachal Pradesh are analysed and revealed in Table 6.1. It is found that, age at
first calving in case of crossbred cow is 2.56, 3.35, 3.61 and 2.85 years in Hamirpur, Solan, Shimla
& Kinnaur respectively. It is much earlier than in case of buffalo, which is 3.92, 4.21 in Hamirpur
& Solan respectively, followed by local cow, 4.7, 4.7, 3.8 years in Solan, Shimla & Kinnaur
respectively. The calving interval of crossbred cow is estimated as 315, 380, 410 and 420 days in
Hamirpur Solan, Shimla & Kinnaur respectively, out of which for 205, 224, 213 and 274 days it
remains in milk and rest of the days in dry period. Contrary to this, calving interval in local cow is
450, 480 and 485 days in Solan, Shimla & Kinnaur respectively out of which for 284, 236 and 218
days it remains in milk and rest of the days in dry period. It is observed that crossbred cow has the
longest lactation period, shortest dry period, as well as short inter calving period and lowest age at
first calving as compared to local cow. The calving interval in case of buffaloes is 310 and 350
days in Hamirpur and Solan respectively out of which for 191 and 208 days it remains in milk and
rest of the days in dry period. Similarly the analysis of the production traits of dairy animals under
different livestock- crop production systems in different agro-climatic zones is revealed in Table
6.2.
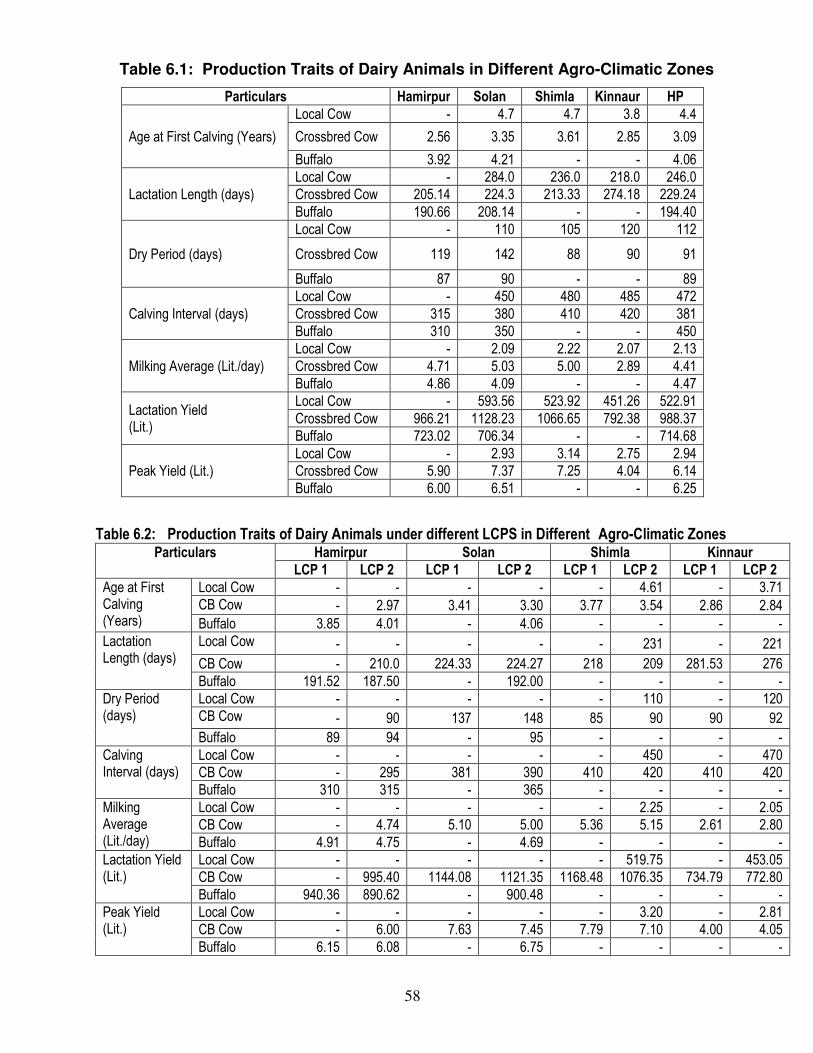
58
Table 6.1: Production Traits of Dairy Animals in Different Agro-Climatic Zones
Particulars Hamirpur Solan Shimla Kinnaur HP
Age at First Calving (Years)
Local Cow - 4.7 4.7 3.8 4.4
Crossbred Cow 2.56 3.35 3.61 2.85 3.09
Buffalo 3.92 4.21 - - 4.06
Lactation Length (days)
Local Cow - 284.0 236.0 218.0 246.0
Crossbred Cow 205.14 224.3 213.33 274.18 229.24
Buffalo 190.66 208.14 - - 194.40
Dry Period (days)
Local Cow - 110 105 120 112
Crossbred Cow 119 142 88 90 91
Buffalo 87 90 - - 89
Calving Interval (days)
Local Cow - 450 480 485 472
Crossbred Cow 315 380 410 420 381
Buffalo 310 350 - - 450
Milking Average (Lit./day)
Local Cow - 2.09 2.22 2.07 2.13
Crossbred Cow 4.71 5.03 5.00 2.89 4.41
Buffalo 4.86 4.09 - - 4.47
Lactation Yield (Lit.)
Local Cow - 593.56 523.92 451.26 522.91
Crossbred Cow 966.21 1128.23 1066.65 792.38 988.37
Buffalo 723.02 706.34 - - 714.68
Peak Yield (Lit.)
Local Cow - 2.93 3.14 2.75 2.94
Crossbred Cow 5.90 7.37 7.25 4.04 6.14
Buffalo 6.00 6.51 - - 6.25
Table 6.2: Production Traits of Dairy Animals under different LCPS in Different Agro-Climatic Zones Particulars Hamirpur Solan Shimla Kinnaur
LCP 1 LCP 2 LCP 1 LCP 2 LCP 1 LCP 2 LCP 1 LCP 2
Age at First Calving (Years)
Local Cow - - - - - 4.61 - 3.71
CB Cow - 2.97 3.41 3.30 3.77 3.54 2.86 2.84
Buffalo 3.85 4.01 - 4.06 - - - -
Lactation Length (days)
Local Cow - - - - - 231 - 221
CB Cow - 210.0 224.33 224.27 218 209 281.53 276
Buffalo 191.52 187.50 - 192.00 - - - -
Dry Period (days)
Local Cow - - - - - 110 - 120
CB Cow - 90 137 148 85 90 90 92
Buffalo 89 94 - 95 - - - -
Calving Interval (days)
Local Cow - - - - - 450 - 470
CB Cow - 295 381 390 410 420 410 420
Buffalo 310 315 - 365 - - - -
Milking Average (Lit./day)
Local Cow - - - - - 2.25 - 2.05
CB Cow - 4.74 5.10 5.00 5.36 5.15 2.61 2.80
Buffalo 4.91 4.75 - 4.69 - - - -
Lactation Yield (Lit.)
Local Cow - - - - - 519.75 - 453.05
CB Cow - 995.40 1144.08 1121.35 1168.48 1076.35 734.79 772.80
Buffalo 940.36 890.62 - 900.48 - - - -
Peak Yield (Lit.)
Local Cow - - - - - 3.20 - 2.81
CB Cow - 6.00 7.63 7.45 7.79 7.10 4.00 4.05
Buffalo 6.15 6.08 - 6.75 - - - -
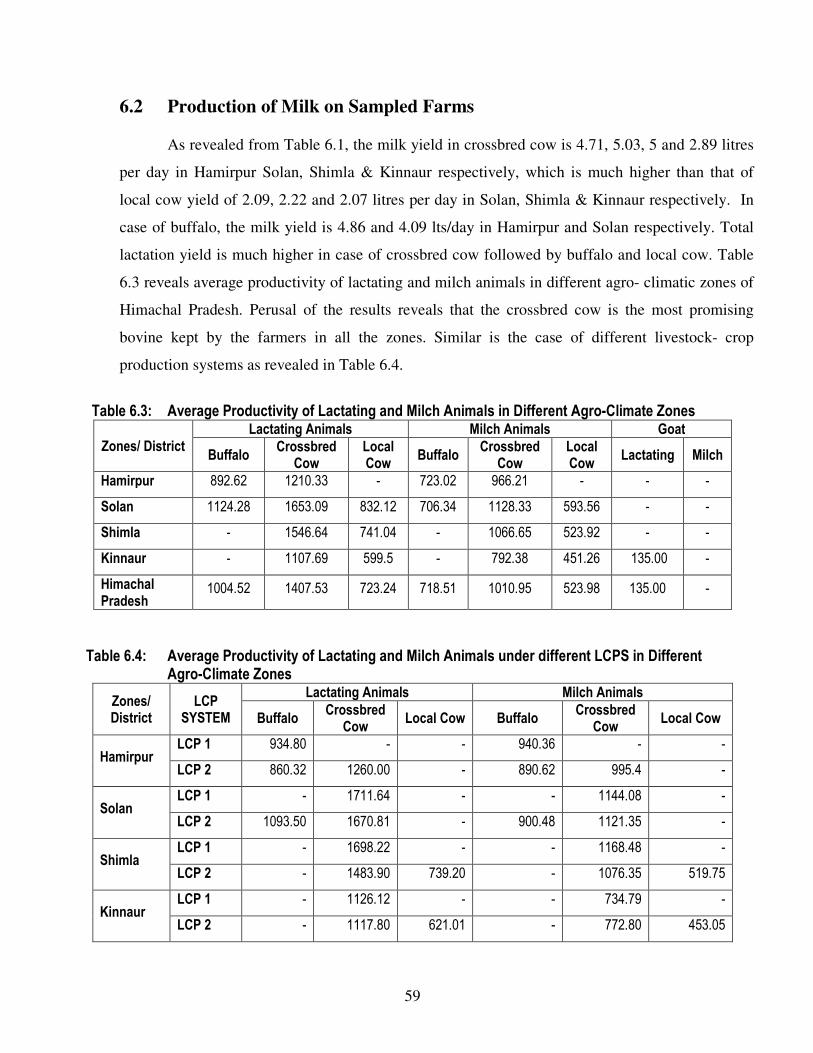
59
6.2 Production of Milk on Sampled Farms
As revealed from Table 6.1, the milk yield in crossbred cow is 4.71, 5.03, 5 and 2.89 litres
per day in Hamirpur Solan, Shimla & Kinnaur respectively, which is much higher than that of
local cow yield of 2.09, 2.22 and 2.07 litres per day in Solan, Shimla & Kinnaur respectively. In
case of buffalo, the milk yield is 4.86 and 4.09 lts/day in Hamirpur and Solan respectively. Total
lactation yield is much higher in case of crossbred cow followed by buffalo and local cow. Table
6.3 reveals average productivity of lactating and milch animals in different agro- climatic zones of
Himachal Pradesh. Perusal of the results reveals that the crossbred cow is the most promising
bovine kept by the farmers in all the zones. Similar is the case of different livestock- crop
production systems as revealed in Table 6.4.
Table 6.3: Average Productivity of Lactating and Milch Animals in Different Agro-Climate Zones
Zones/ District Lactating Animals Milch Animals Goat
Buffalo Crossbred
Cow Local Cow
Buffalo Crossbred
Cow Local Cow
Lactating Milch
Hamirpur 892.62 1210.33 - 723.02 966.21 - - -
Solan 1124.28 1653.09 832.12 706.34 1128.33 593.56 - -
Shimla - 1546.64 741.04 - 1066.65 523.92 - -
Kinnaur - 1107.69 599.5 - 792.38 451.26 135.00 -
Himachal Pradesh
1004.52 1407.53 723.24 718.51 1010.95 523.98 135.00 -
Table 6.4: Average Productivity of Lactating and Milch Animals under different LCPS in Different Agro-Climate Zones
Zones/ District
LCP SYSTEM
Lactating Animals Milch Animals
Buffalo Crossbred
Cow Local Cow Buffalo
Crossbred Cow
Local Cow
Hamirpur LCP 1 934.80 - - 940.36 - -
LCP 2 860.32 1260.00 - 890.62 995.4 -
Solan LCP 1 - 1711.64 - - 1144.08 -
LCP 2 1093.50 1670.81 - 900.48 1121.35 -
Shimla LCP 1 - 1698.22 - - 1168.48 -
LCP 2 - 1483.90 739.20 - 1076.35 519.75
Kinnaur LCP 1 - 1126.12 - - 734.79 -
LCP 2 - 1117.80 621.01 - 772.80 453.05
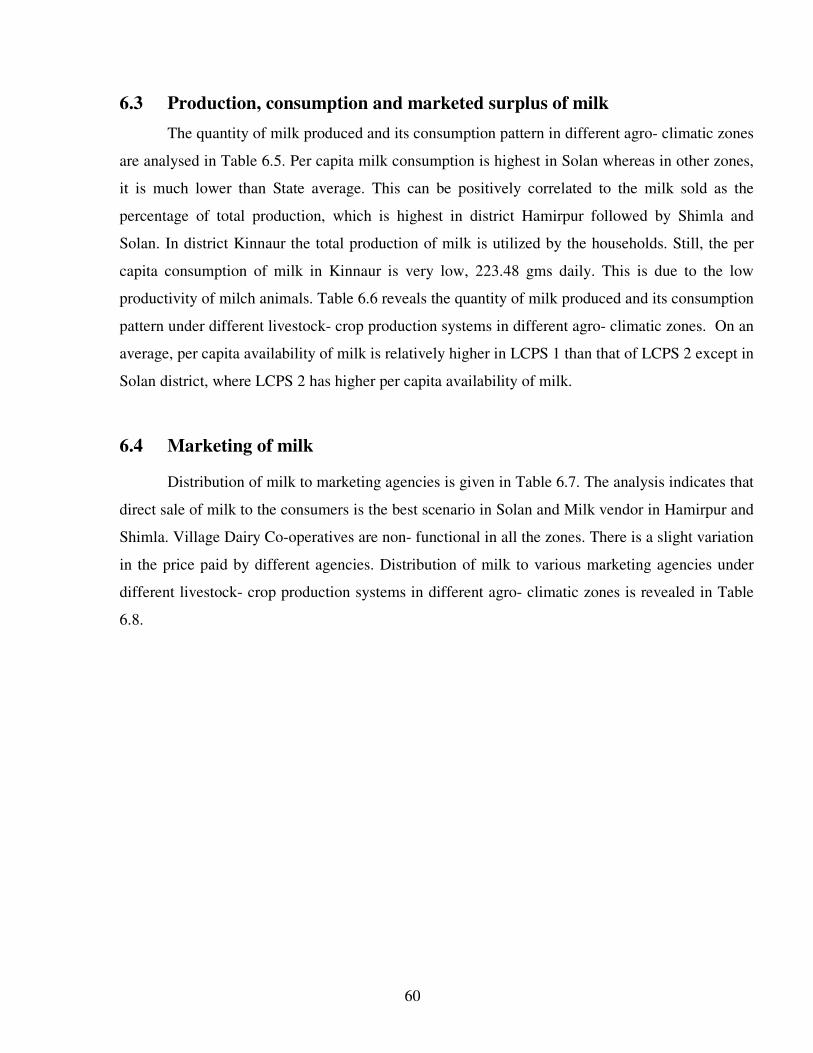
60
6.3 Production, consumption and marketed surplus of milk
The quantity of milk produced and its consumption pattern in different agro- climatic zones
are analysed in Table 6.5. Per capita milk consumption is highest in Solan whereas in other zones,
it is much lower than State average. This can be positively correlated to the milk sold as the
percentage of total production, which is highest in district Hamirpur followed by Shimla and
Solan. In district Kinnaur the total production of milk is utilized by the households. Still, the per
capita consumption of milk in Kinnaur is very low, 223.48 gms daily. This is due to the low
productivity of milch animals. Table 6.6 reveals the quantity of milk produced and its consumption
pattern under different livestock- crop production systems in different agro- climatic zones. On an
average, per capita availability of milk is relatively higher in LCPS 1 than that of LCPS 2 except in
Solan district, where LCPS 2 has higher per capita availability of milk.
6.4 Marketing of milk
Distribution of milk to marketing agencies is given in Table 6.7. The analysis indicates that
direct sale of milk to the consumers is the best scenario in Solan and Milk vendor in Hamirpur and
Shimla. Village Dairy Co-operatives are non- functional in all the zones. There is a slight variation
in the price paid by different agencies. Distribution of milk to various marketing agencies under
different livestock- crop production systems in different agro- climatic zones is revealed in Table
6.8.
61
Table6.5: Production, Consumption and Marketed Surplus of Milk in Different Agro-Climatic Zone/District (Qty. in litres/day)
Zone/ District
Total Milk Production
Milk utilized in the household (lts.) Milk Sold
Sale price of milk (Rs.)
Milk Sold as %age to
total production
Per capita milk
consumption (gm.)
As fluid For product Cow Buff. Total Cow Buff. Total Cow Buff. Mix
Hamirpur 4.27 4.88 9.15 2.03 1.40 2.20 3.52 5.72 9.75 15.00 - 62.51 317.68
Solan 6.42 5.10 11.52 4.42 4.49 1.50 1.11 2.61 10.0 12.75 - 22.66 712.90
Shimla 5.56 - 5.56 2.12 1.25 2.19 - 2.19 10.94 - - 39.39 375.22
Kinnaur 3.82 - 3.82 1.58 2.24 - - - - - - - 223.48
Himachal Pradesh
5.02 2.49 7.51 2.54 2.34 1.47 1.16 2.63 10.23 13.87 - 35.02 401.26
Table 6.6: Production, Consumption and Marketed Surplus of Milk under LCPS in Different Agro-Climatic Zone/District (Qty. in litres/day)
Zone/ District
LCP SYSTEM
Total Milk Production Milk utilized in the household (lts.)
Milk Sold Sale price of milk (Rs.) Milk Sold as %age to total production
Per capita milk consumption
(gm.) Cow Buff. Total As fluid For
product Cow Buff. Total Cow Buff. Total
Hamirpur
LCP 1 - 5.35 5.35 1.67 0.95 - 2.73 2.73 -
15.0
0 15.00 51.03 278.33
LCP 2 4.12 4.91 9.03 2.00 1.32 2.19 3.52 5.71 9.75
15.0
0 12.38 63.23 166.67
Solan
LCP 1 7.29 - 7.29 2.59 3.41 1.29 - 1.29 10.40 - 10.40 17.69 420.45
LCP 2 6.58 5.72 12.30 4.38 4.08 1.97 1.87 3.84 9.80
12.7
5 11.27 31.22 646.97
Shimla LCP 1 6.75 - 6.75 2.80 1.67 2.28 - 2.28 12.00 - 12.00 33.77 509.09
LCP 2 5.10 - 5.10 1.80 1.45 1.85 - 1.85 8.50 - 8.50 36.27 252.81
Kinnaur LCP 1 4.35 - 4.35 1.90 2.45 - - - - - - - 296.41
LCP 2 3.40 - 3.40 1.62 1.78 - - - - - - - 204.29
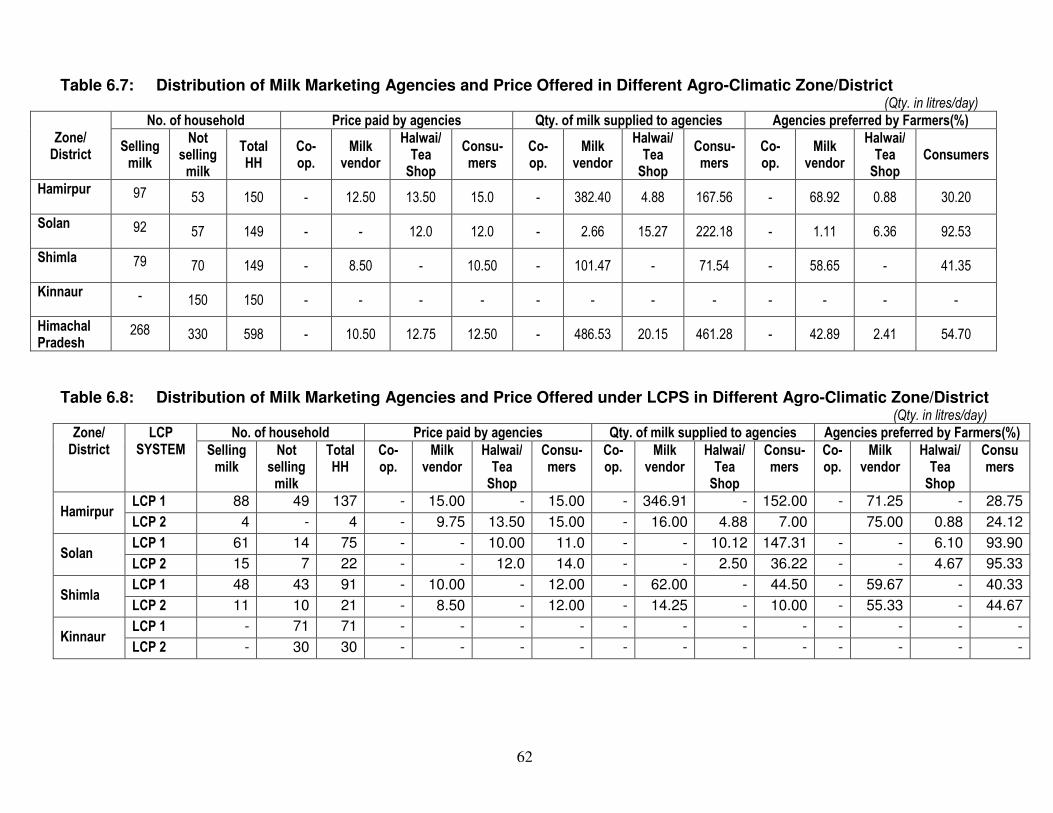
62
Table 6.7: Distribution of Milk Marketing Agencies and Price Offered in Different Agro-Climatic Zone/District (Qty. in litres/day)
Zone/ District
No. of household Price paid by agencies Qty. of milk supplied to agencies Agencies preferred by Farmers(%)
Selling milk
Not selling milk
Total HH
Co-op.
Milk vendor
Halwai/ Tea Shop
Consu-mers
Co-op.
Milk vendor
Halwai/ Tea Shop
Consu-mers
Co-op.
Milk vendor
Halwai/ Tea Shop
Consumers
Hamirpur 97 53 150 - 12.50 13.50 15.0 - 382.40 4.88 167.56 - 68.92 0.88 30.20
Solan 92 57 149 - - 12.0 12.0 - 2.66 15.27 222.18 - 1.11 6.36 92.53
Shimla 79 70 149 - 8.50 - 10.50 - 101.47 - 71.54 - 58.65 - 41.35
Kinnaur - 150 150 - - - - - - - - - - - -
Himachal Pradesh
268 330 598 - 10.50 12.75 12.50 - 486.53 20.15 461.28 - 42.89 2.41 54.70
Table 6.8: Distribution of Milk Marketing Agencies and Price Offered under LCPS in Different Agro-Climatic Zone/District (Qty. in litres/day)
Zone/ District
LCP SYSTEM
No. of household Price paid by agencies Qty. of milk supplied to agencies Agencies preferred by Farmers(%)
Selling milk
Not selling milk
Total HH
Co-op.
Milk vendor
Halwai/ Tea Shop
Consu-mers
Co-op.
Milk vendor
Halwai/ Tea Shop
Consu-mers
Co-op.
Milk vendor
Halwai/ Tea Shop
Consumers
Hamirpur LCP 1 88 49 137 - 15.00 - 15.00 - 346.91 - 152.00 - 71.25 - 28.75
LCP 2 4 - 4 - 9.75 13.50 15.00 - 16.00 4.88 7.00 75.00 0.88 24.12
Solan LCP 1 61 14 75 - - 10.00 11.0 - - 10.12 147.31 - - 6.10 93.90
LCP 2 15 7 22 - - 12.0 14.0 - - 2.50 36.22 - - 4.67 95.33
Shimla LCP 1 48 43 91 - 10.00 - 12.00 - 62.00 - 44.50 - 59.67 - 40.33
LCP 2 11 10 21 - 8.50 - 12.00 - 14.25 - 10.00 - 55.33 - 44.67
Kinnaur LCP 1 - 71 71 - - - - - - - - - - - -
LCP 2 - 30 30 - - - - - - - - - - - -
63
Chapter-7
INPUT-OUTPUT RELATIONSHIP FOR VARIOUS LIVESTOCK-
CROP PRODUCTION SYSTEMS IN HIMACHAL PRADESH
7.1 Economics of milk, meat and wool production
Economics of Milk, Meat and Wool production in different Agro–climatic zones
has been worked out and presented in Table 7.1. Cost of production per litre of milk in
case of crossbred cow is Rs 8.77, Rs. 6.81, Rs. 8.36 and Rs. 12.02 in Hamirpur, Solan,
Shimla & Kinnaur respectively. Whereas in case of local cow it comes out to be Rs.
8.17, Rs. 9.11 and Rs. 13.66 per litre in Solan, Shimla & Kinnaur respectively. In case
of Buffalo it comes out to be Rs. 9.69 and Rs. 8.98 per litre in Hamirpur and Solan. In
Kinnaur, milk is not sold by the sample households and used entirely for home
consumption. For this zone cost of production of meat and wool is worked out for sheep
and goat and found to be Rs. 23.75 per Kg. in case of Goat and Rs. 18.74 per Kg. in
case of Sheep. Cost of wool production in case of Sheep comes out to be Rs. 106.22 per
Kg. It is revealed from the analysis that rearing of goat and sheep is relatively higher
profitable enterprise for the farmers of this zone. Among the cost component, value of
fodder & feed and human labour are the major costs incurred in rearing animals.
7.2 Economics of crop production
In order to study the returns, it is essential to study the input structure and cost
of production and have an idea about the share of various input factors in total cost. For
determining the cost structure, cost A1 has been estimated for various crops in each
zone. In case of Hamirpur, per quintal cost of production estimated to be Rs. 119.67 in
maize, Rs. 248.38 in wheat, Rs. 361.20 in barley, Rs. 67.77 in barseem, Rs. 19.41 in
chari, Rs. 148.66 paddy, Rs. 76.71 in oat. In case of Solan, cost of production per
quintal comes out for different crops as; Rs.102.76 in maize, Rs. 338.53 wheat, Rs.
324.20 barley, Rs. 28.17 chari, Rs. 128.81 in pea, Rs. 231.26 in tomato and Rs. 794.78
in capsicum. In case of Shimla, per quintal cost of production is, Maize Rs. 113.35,
Wheat Rs. 522.69, Barley Rs. 229.50, Potato Rs. 143.80, Rajmash Rs. 898.59 and
Apple Rs. 605.87. In case of Kinnaur, cost of production of Maize is Rs. 170.40, Wheat
64
is Rs. 292.76, Barley is Rs. 221.86, Ogla is Rs. 123.39, Fafra is Rs. 90.00, Rajmash is
Rs. 534.45, Kidney bean is Rs. 419.83, Potato is Rs. 207.77, Apple is Rs. 199.63 and
Pea is Rs. 113.77.
7.3 Input- output relation in milk, meat and wool production
To obtain input-output relationship for various livestock-crop production
systems log-linear form of production function was used. Results (Table 7.3) revealed
that in Hamirpur in case of crossbred cow green fodder and concentrate are the major
components of cost. Production elasticity of green fodder is 0.325 and is significant at 1
percent level of probability, thus, hereby, indicating that if use of green fodder is
increased by 1 percent then on an average output of milk will increase by 0.32 percent
at geometric mean level. Whereas in case of buffalo, dry fodder and concentrate are the
main components of cost. Production elasticity of dry fodder is 0.421 and is significant
at 1 percent level of probability, thus, hereby, indicating that if use of dry fodder is
increased by 1 percent then on an average output of milk will increase by 0.42 percent
at geometric mean level. Production elasticity of concentrate is 0.251 and is significant
at 10 percent probability level. The coefficient of multiple determination (R2) indicated
that all the explanatory variables collectively explained about 97 percent variation in
milk production in case of crossbred cow and 88 percent in case of buffalo.
In Solan, in case of local cow greenfodder is the major cost component and the
response of output to dry fodder is negative. Production elasticity of green fodder is
1.152 and is significant at 1 percent level of probability, thus, hereby, indicating that if
use of green fodder is increased by 1 percent then on an average output of milk will
increase by 1.15 percent at geometric mean level. Whereas in case of crossbred cow,
dry fodder and human labour are the main components of cost. Production elasticity of
dry fodder and human labour is 0.535 and 0.398 respectively and is significant at 1
percent level of probability, thus, hereby, indicating that if use of dry fodder and human
labour is increased by 1 percent then on an average output of milk will increase by 0.53
and 0.40 percent respectively at geometric mean level. Production elasticity of green
fodder and miscellaneous expenses is 0.220 and 0.434 respectively and is significant at
10 percent level of probability. High production elasticity of miscellaneous expenses is
65
due to better management service of crossbred cow. The coefficient of multiple
determination (R2) indicated that all the explanatory variables collectively explained
about 50, 54 and 21 percent variation in milk production in case of local cow, crossbred
cow and buffalo respectively.
In case of Shimla, green fodder and concentrate are the major components of
cost whereas the response of output to dry fodder is negative. In case of local cow,
production elasticity of green fodder is 0.419 and is significant at 5 percent probability
level, thus, hereby, indicating that if use of green fodder is increased by 1 percent then
on an average output of milk will increase by 0.42 percent at geometric mean level. All
other variables are not significant. In case of crossbred cow, production elasticity of
green fodder and concentrate is 0.492 and 0.184 and is significant at 10 percent level of
probability.
In Kinnaur, in case of local cow production elasticity of dry fodder and
concentrate is 0.721 and 0.361 and is significant at 10 percent level of probability. In
case of crossbred cow production elasticity of green fodder is 0.161 and is significant at
10 percent level of probability, whereas production elasticity of concentrate and human
labour is 0.329 and 0.411 respectively and is significant at 5 per cent probability level.
The coefficient of multiple determination (R2) indicated that all the explanatory
variables collectively explained about 80 and 85 percent variation in milk production in
case of local cow and crossbred cow respectively. In case of mutton value of dry fodder
and human labour are the major components of cost. R2 indicated that all the
explanatory variables collectively explained about 85 percent variation in meat
production in case of sheep and 82 percent in case of Goat. In wool production human
labour is the major cost component followed by value of dry fodder. R2 indicated that
all the explanatory variables collectively explained about 89 percent variation in wool
production in case of sheep.
7.4 Input- output relation in crop production
Input-output relationship in crop production is worked out for each crop in each
zone. Results (Table 7.4) revealed that in Hamirpur, in case of maize crop labour, seed
66
and fertilizer contributed positively and significantly towards production, similar is the
case with wheat. In case of maize, production elasticity of seed, fertilisers and labour is
0.452, 0.434 and 0.609 and is significant at 1 percent level of probability. In case of
wheat production elasticity of seed, fertilisers and labour is 0.629, 0.227 and 0.537 and
is significant at 1 percent level of probability, thus hereby indicating that 1 percent
increase in seed, fertilisers and labour would increase production of maize and wheat by
0.45, 0.43, 0.60 and 0.63, 0.23 and 0.54 percent respectively at their geometric mean
level. In case of barley and paddy, fertilsers has negative impact and also non-
significant. In case of barley, production elasticity of human labour is 0.781 and is
significant at 10 percent level of probability. Production elasticity of seed in case of
paddy is 1.875 and is significant at 1 percent level of probability. R2 indicated that all
the explanatory variables collectively explained about 58, 81, 79 and 96 percent
variation in the production of maize, wheat, barley and paddy respectively.
In Solan, in case of maize, production elasticity of seed & fertilizers is 1.127 and
-0.163 respectively, and is significant at 1 percent level of probability. Production
elasticity of value of fertilizers indicates negative impact. In case of wheat production
elasticity of seed & human labour is 0.729 and 0.057 respectively, and is significant at
10 percent level of probability. Production elasticity of seed and labour in case of barley
is 0.587 and 0.594 respectively and is significant at 1 percent level of probability. In
case of pea, production elasticity of seed, plant protection chemicals and human labour
is 0.577, 0.668 and 0.251 respectively and is significant at 1, 1 and 10 percent level of
probability, meaning, 1 percent increase in the use of seed, plant protection chemicals
and human labour would increase the production of peas by 0.58, 0.67 and 0.25 percent
respectively at their geometric mean level. High use of fertilizers in pea indicates
negative production elasticity. Tomato is one of the major cash crop of this zone.
Production elasticity of seed, fertilizers and plant protection chemicals in case of tomato
is 0.891, 0.744 and 0.078 respectively and is significant at 10, 1 and 1 percent level of
probability. In case of capsicum, production elasticity of seed, fertilizers and plant
protection chemicals is 0.086, 0.356 and 0.461 respectively and is significant at 1, 10
and 10 percent level of probability. R2 indicated that all the explanatory variables
67
collectively explained about 73, 79, 91, 69, 50 and 73 percent variation in the
production of maize, wheat, barley, pea, tomato and capsicum respectively.
In Shimla, value of seed and human labour has a positive and significant affect
on the production of maize and wheat. Value of seed and human labour has a
production elasticity of 0.318 & 0.397 and 1.031 & 0.912 respectively and is significant
at 10 and 1 percent level of probability. Human labour has production elasticity 0.998
in case of barley and is significant at 10 percent level of probability. In case of potato
value of seed, human labour and plant protection chemicals has production elasticity of
0.801, 0.597 and 0.315, which is significant at 10 percent level of probability. Seed and
fertilizers have production elasticity of 0.415 and 0.747, significant at 10 and 1 percent
level of probability, in case of Rajmash. Apple is an important crop of this zone.
Manures & fertilizers, human labour and plant protection chemicals show significant
effect on the production of Apple. Production elasticity of these inputs is 0.318, 0.865
and 0.461 respectively and is significant at 10, 1 and 1 percent level of probability. R2
indicated that all the explanatory variables collectively explained about 96, 88, 84 and
92 percent variation in the production of wheat, potato, rajmash and apple respectively.
In Kinnaur, human labour is the major factor of production for all the crops
except potato and contributed positively and significantly. In case of maize, barley and
kidney bean, value of seed and human labour has production elasticity of 0.239 (10
percent level) & 0.427 (1 percent level), 0.439 & 0.715 (10 percent level) and 0.562 (5
percent level) & 0.764 (1 percent level) respectively. In case of wheat, ogla, rajmash
and fafra value of seed, fertilizers and human labour has production elasticity of 0.099,
0.221 & 0.056 (significant at 5, 10 and 1 percent level), 0.225, 0.392 & 0.776
(significant at 5, 10 and 1 percent level), 0.361, 0.107 & 0.481 (significant at 10, 1 and
10 percent level) and 0.233, 0.369 & 0.604 (significant at 1, 10 and 1 percent level)
respectively. Potato followed by pea is one of the important cash crop of this zone.
Seed, fertilizers and plant protection chemicals has production elasticity of 0.213, 0.224
& 0.108 respectively and is significant at 1, 1 and 5 percent level of probability. In case
of pea, human labour and plant protection chemicals have production elasticity of 0.737
& 0.888 respectively and is significant at 10 percent probability level. But manures and
68
fertilizers have negative impact on output. Manures & fertilizers, human labour and
plant protection chemicals show significant effect on the production of Apple.
Production elasticity of these inputs is 0.068, 0.807 and 0.513 respectively and is
significant at 10, 1 and 5 percent level of probability. R2 indicated that all the
explanatory variables collectively explained about 68, 53, 85, 87, 99, 91, 82 and 90
percent variation in the production of maize, wheat, barley, rajmash, kidney bean,
potato, pea and apple respectively.
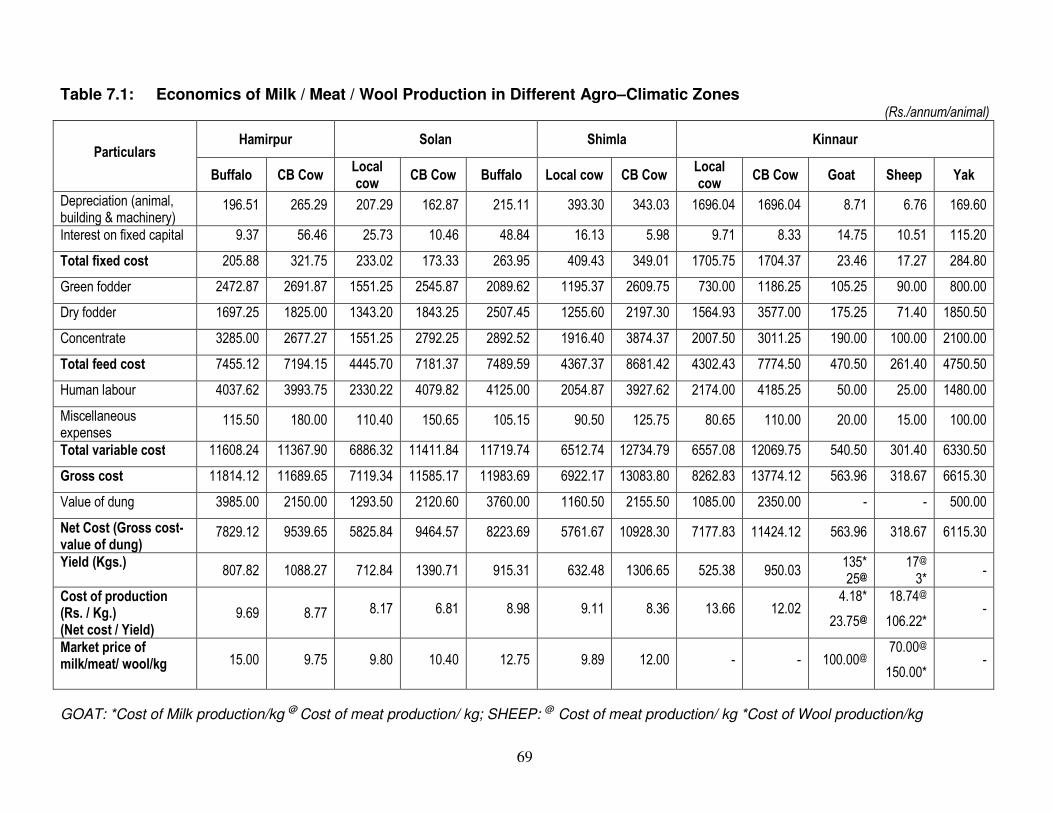
69
Table 7.1: Economics of Milk / Meat / Wool Production in Different Agro–Climatic Zones (Rs./annum/animal)
Particulars Hamirpur Solan Shimla Kinnaur
Buffalo CB Cow Local cow
CB Cow Buffalo Local cow CB Cow Local cow
CB Cow Goat Sheep Yak
Depreciation (animal, building & machinery)
196.51 265.29 207.29 162.87 215.11 393.30 343.03 1696.04 1696.04 8.71 6.76 169.60
Interest on fixed capital 9.37 56.46 25.73 10.46 48.84 16.13 5.98 9.71 8.33 14.75 10.51 115.20
Total fixed cost 205.88 321.75 233.02 173.33 263.95 409.43 349.01 1705.75 1704.37 23.46 17.27 284.80
Green fodder 2472.87 2691.87 1551.25 2545.87 2089.62 1195.37 2609.75 730.00 1186.25 105.25 90.00 800.00
Dry fodder 1697.25 1825.00 1343.20 1843.25 2507.45 1255.60 2197.30 1564.93 3577.00 175.25 71.40 1850.50
Concentrate 3285.00 2677.27 1551.25 2792.25 2892.52 1916.40 3874.37 2007.50 3011.25 190.00 100.00 2100.00
Total feed cost 7455.12 7194.15 4445.70 7181.37 7489.59 4367.37 8681.42 4302.43 7774.50 470.50 261.40 4750.50
Human labour 4037.62 3993.75 2330.22 4079.82 4125.00 2054.87 3927.62 2174.00 4185.25 50.00 25.00 1480.00
Miscellaneous expenses
115.50 180.00 110.40 150.65 105.15 90.50 125.75 80.65 110.00 20.00 15.00 100.00
Total variable cost 11608.24 11367.90 6886.32 11411.84 11719.74 6512.74 12734.79 6557.08 12069.75 540.50 301.40 6330.50
Gross cost 11814.12 11689.65 7119.34 11585.17 11983.69 6922.17 13083.80 8262.83 13774.12 563.96 318.67 6615.30
Value of dung 3985.00 2150.00 1293.50 2120.60 3760.00 1160.50 2155.50 1085.00 2350.00 - - 500.00
Net Cost (Gross cost-value of dung)
7829.12 9539.65 5825.84 9464.57 8223.69 5761.67 10928.30 7177.83 11424.12 563.96 318.67 6115.30
Yield (Kgs.) 807.82 1088.27 712.84 1390.71 915.31 632.48 1306.65 525.38 950.03
135* 25@
17@
3* -
Cost of production (Rs. / Kg.) (Net cost / Yield)
9.69 8.77 8.17 6.81 8.98 9.11 8.36 13.66 12.02 4.18*
23.75@
18.74@
106.22* -
Market price of milk/meat/ wool/kg 15.00 9.75 9.80 10.40 12.75 9.89 12.00 - - 100.00@
70.00@
150.00* -
GOAT: *Cost of Milk production/kg @ Cost of meat production/ kg; SHEEP: @ Cost of meat production/ kg *Cost of Wool production/kg
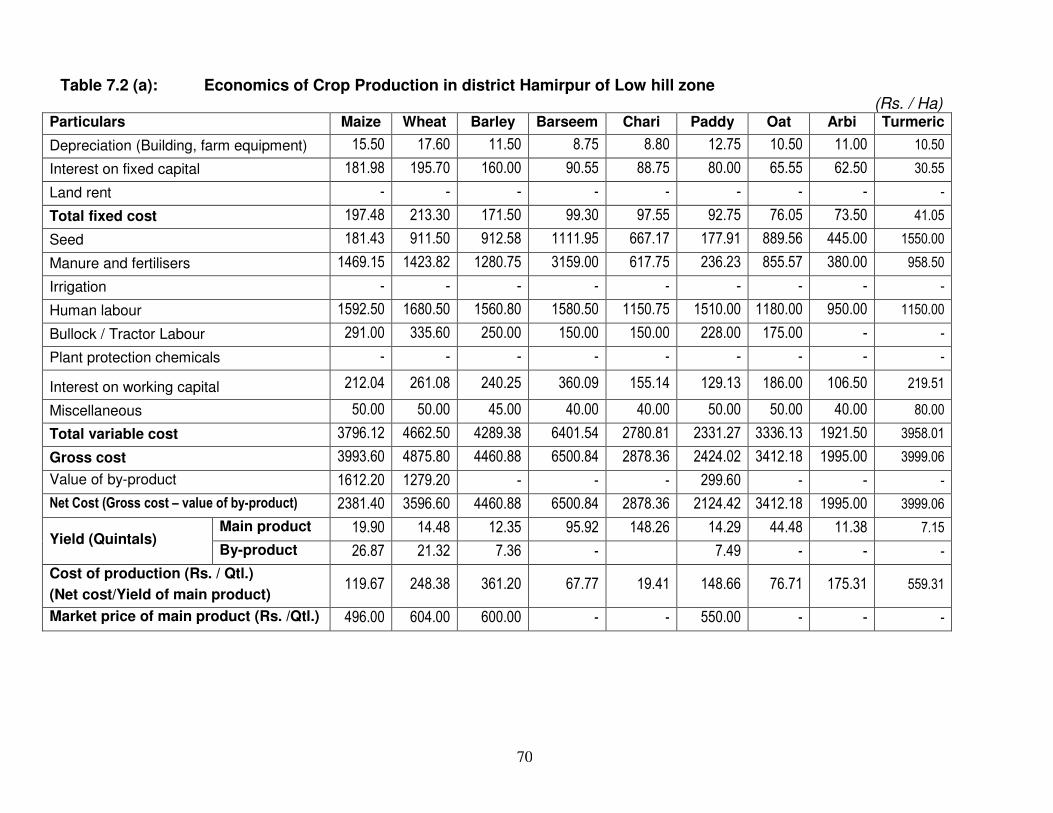
70
Table 7.2 (a): Economics of Crop Production in district Hamirpur of Low hill zone (Rs. / Ha)
Particulars Maize Wheat Barley Barseem Chari Paddy Oat Arbi Turmeric
Depreciation (Building, farm equipment) 15.50 17.60 11.50 8.75 8.80 12.75 10.50 11.00 10.50
Interest on fixed capital 181.98 195.70 160.00 90.55 88.75 80.00 65.55 62.50 30.55
Land rent - - - - - - - - -
Total fixed cost 197.48 213.30 171.50 99.30 97.55 92.75 76.05 73.50 41.05
Seed 181.43 911.50 912.58 1111.95 667.17 177.91 889.56 445.00 1550.00
Manure and fertilisers 1469.15 1423.82 1280.75 3159.00 617.75 236.23 855.57 380.00 958.50
Irrigation - - - - - - - - -
Human labour 1592.50 1680.50 1560.80 1580.50 1150.75 1510.00 1180.00 950.00 1150.00
Bullock / Tractor Labour 291.00 335.60 250.00 150.00 150.00 228.00 175.00 - -
Plant protection chemicals - - - - - - - - -
Interest on working capital 212.04 261.08 240.25 360.09 155.14 129.13 186.00 106.50 219.51
Miscellaneous 50.00 50.00 45.00 40.00 40.00 50.00 50.00 40.00 80.00
Total variable cost 3796.12 4662.50 4289.38 6401.54 2780.81 2331.27 3336.13 1921.50 3958.01
Gross cost 3993.60 4875.80 4460.88 6500.84 2878.36 2424.02 3412.18 1995.00 3999.06
Value of by-product 1612.20 1279.20 - - - 299.60 - - -
Net Cost (Gross cost – value of by-product) 2381.40 3596.60 4460.88 6500.84 2878.36 2124.42 3412.18 1995.00 3999.06
Yield (Quintals) Main product 19.90 14.48 12.35 95.92 148.26 14.29 44.48 11.38 7.15
By-product 26.87 21.32 7.36 - 7.49 - - -
Cost of production (Rs. / Qtl.)
(Net cost/Yield of main product) 119.67 248.38 361.20 67.77 19.41 148.66 76.71 175.31 559.31
Market price of main product (Rs. /Qtl.) 496.00 604.00 600.00 - - 550.00 - - -
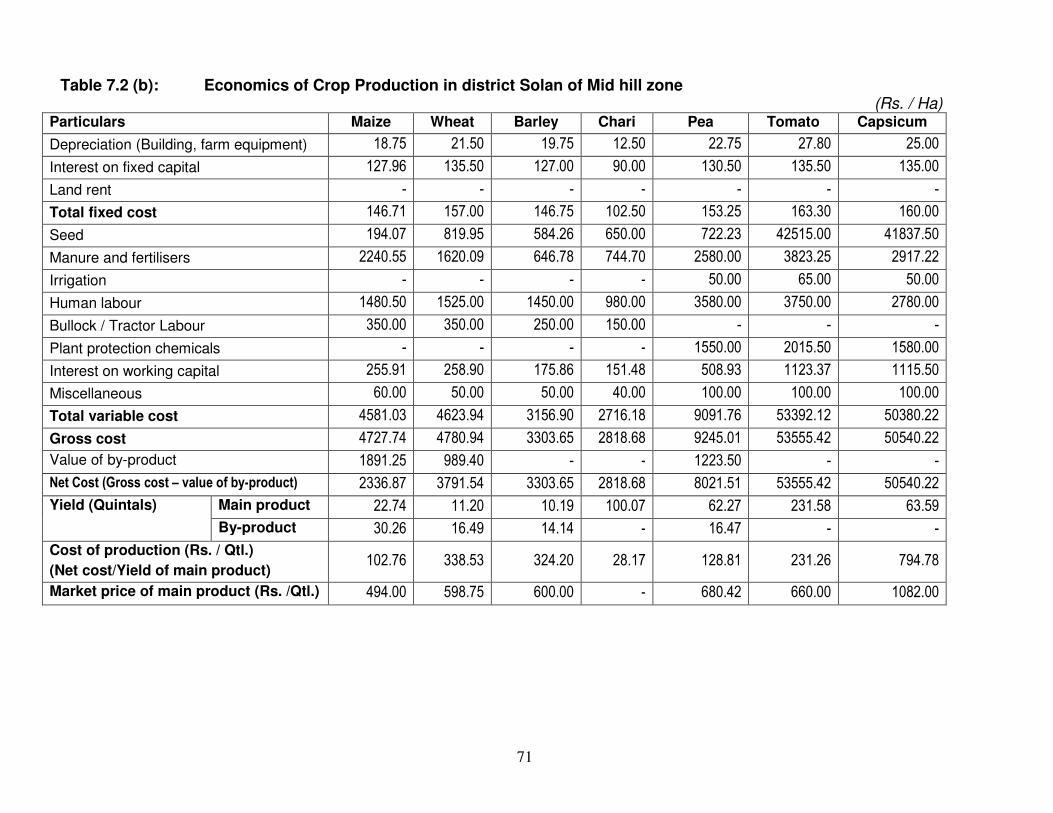
71
Table 7.2 (b): Economics of Crop Production in district Solan of Mid hill zone (Rs. / Ha)
Particulars Maize Wheat Barley Chari Pea Tomato Capsicum
Depreciation (Building, farm equipment) 18.75 21.50 19.75 12.50 22.75 27.80 25.00
Interest on fixed capital 127.96 135.50 127.00 90.00 130.50 135.50 135.00
Land rent - - - - - - -
Total fixed cost 146.71 157.00 146.75 102.50 153.25 163.30 160.00
Seed 194.07 819.95 584.26 650.00 722.23 42515.00 41837.50
Manure and fertilisers 2240.55 1620.09 646.78 744.70 2580.00 3823.25 2917.22
Irrigation - - - - 50.00 65.00 50.00
Human labour 1480.50 1525.00 1450.00 980.00 3580.00 3750.00 2780.00
Bullock / Tractor Labour 350.00 350.00 250.00 150.00 - - -
Plant protection chemicals - - - - 1550.00 2015.50 1580.00
Interest on working capital 255.91 258.90 175.86 151.48 508.93 1123.37 1115.50
Miscellaneous 60.00 50.00 50.00 40.00 100.00 100.00 100.00
Total variable cost 4581.03 4623.94 3156.90 2716.18 9091.76 53392.12 50380.22
Gross cost 4727.74 4780.94 3303.65 2818.68 9245.01 53555.42 50540.22
Value of by-product 1891.25 989.40 - - 1223.50 - -
Net Cost (Gross cost – value of by-product) 2336.87 3791.54 3303.65 2818.68 8021.51 53555.42 50540.22
Yield (Quintals) Main product 22.74 11.20 10.19 100.07 62.27 231.58 63.59
By-product 30.26 16.49 14.14 - 16.47 - -
Cost of production (Rs. / Qtl.)
(Net cost/Yield of main product) 102.76 338.53 324.20 28.17 128.81 231.26 794.78
Market price of main product (Rs. /Qtl.) 494.00 598.75 600.00 - 680.42 660.00 1082.00
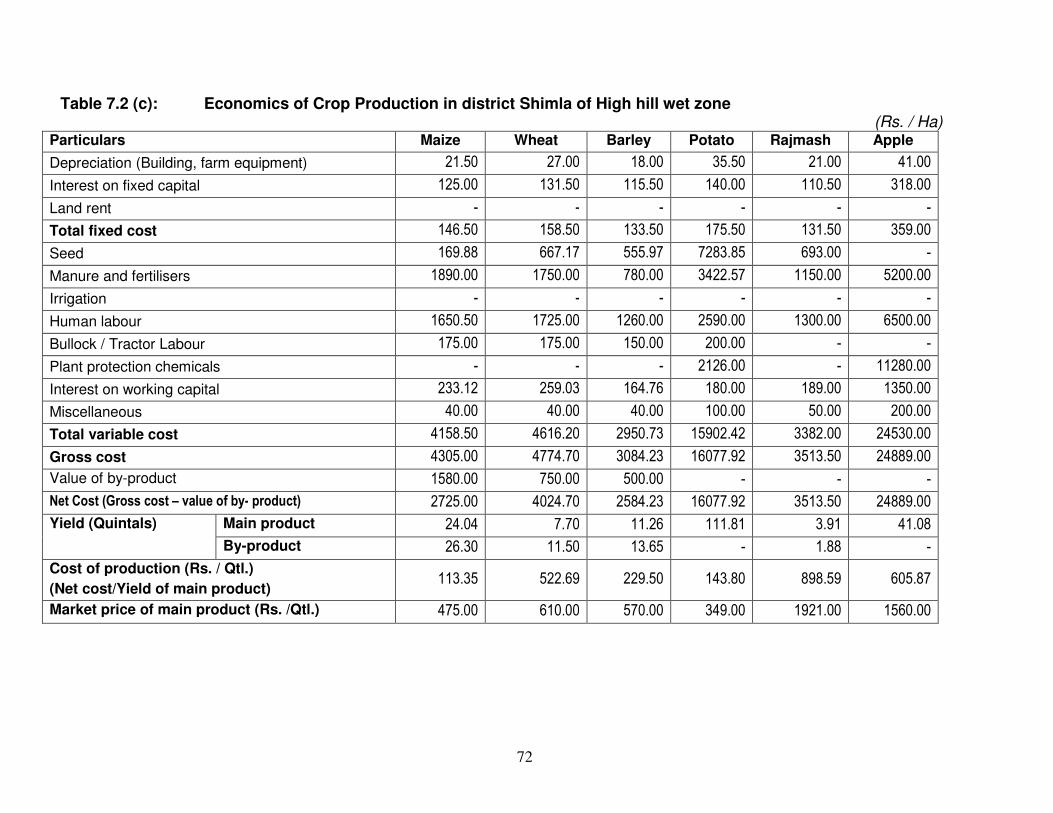
72
Table 7.2 (c): Economics of Crop Production in district Shimla of High hill wet zone (Rs. / Ha)
Particulars Maize Wheat Barley Potato Rajmash Apple
Depreciation (Building, farm equipment) 21.50 27.00 18.00 35.50 21.00 41.00
Interest on fixed capital 125.00 131.50 115.50 140.00 110.50 318.00
Land rent - - - - - -
Total fixed cost 146.50 158.50 133.50 175.50 131.50 359.00
Seed 169.88 667.17 555.97 7283.85 693.00 -
Manure and fertilisers 1890.00 1750.00 780.00 3422.57 1150.00 5200.00
Irrigation - - - - - -
Human labour 1650.50 1725.00 1260.00 2590.00 1300.00 6500.00
Bullock / Tractor Labour 175.00 175.00 150.00 200.00 - -
Plant protection chemicals - - - 2126.00 - 11280.00
Interest on working capital 233.12 259.03 164.76 180.00 189.00 1350.00
Miscellaneous 40.00 40.00 40.00 100.00 50.00 200.00
Total variable cost 4158.50 4616.20 2950.73 15902.42 3382.00 24530.00
Gross cost 4305.00 4774.70 3084.23 16077.92 3513.50 24889.00
Value of by-product 1580.00 750.00 500.00 - - -
Net Cost (Gross cost – value of by- product) 2725.00 4024.70 2584.23 16077.92 3513.50 24889.00
Yield (Quintals) Main product 24.04 7.70 11.26 111.81 3.91 41.08
By-product 26.30 11.50 13.65 - 1.88 -
Cost of production (Rs. / Qtl.)
(Net cost/Yield of main product) 113.35 522.69 229.50 143.80 898.59 605.87
Market price of main product (Rs. /Qtl.) 475.00 610.00 570.00 349.00 1921.00 1560.00
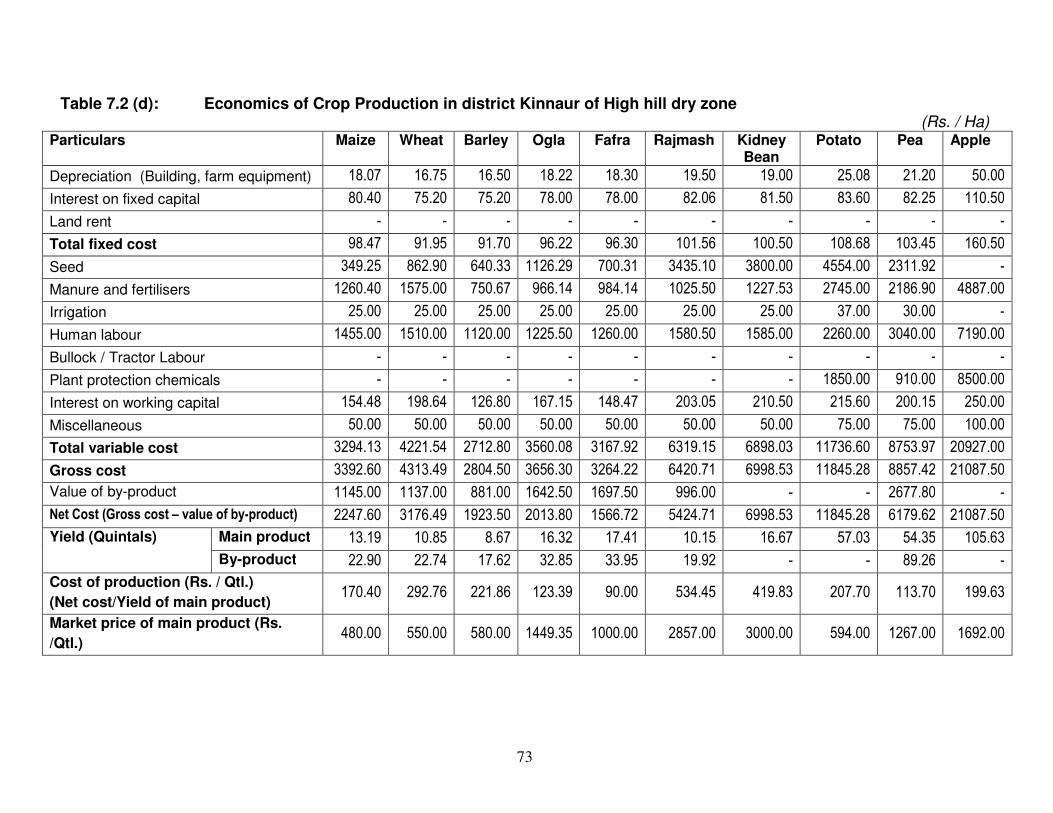
73
Table 7.2 (d): Economics of Crop Production in district Kinnaur of High hill dry zone
(Rs. / Ha) Particulars Maize Wheat Barley Ogla Fafra Rajmash Kidney
Bean Potato Pea Apple
Depreciation (Building, farm equipment) 18.07 16.75 16.50 18.22 18.30 19.50 19.00 25.08 21.20 50.00
Interest on fixed capital 80.40 75.20 75.20 78.00 78.00 82.06 81.50 83.60 82.25 110.50
Land rent - - - - - - - - - -
Total fixed cost 98.47 91.95 91.70 96.22 96.30 101.56 100.50 108.68 103.45 160.50
Seed 349.25 862.90 640.33 1126.29 700.31 3435.10 3800.00 4554.00 2311.92 -
Manure and fertilisers 1260.40 1575.00 750.67 966.14 984.14 1025.50 1227.53 2745.00 2186.90 4887.00
Irrigation 25.00 25.00 25.00 25.00 25.00 25.00 25.00 37.00 30.00 -
Human labour 1455.00 1510.00 1120.00 1225.50 1260.00 1580.50 1585.00 2260.00 3040.00 7190.00
Bullock / Tractor Labour - - - - - - - - - -
Plant protection chemicals - - - - - - - 1850.00 910.00 8500.00
Interest on working capital 154.48 198.64 126.80 167.15 148.47 203.05 210.50 215.60 200.15 250.00
Miscellaneous 50.00 50.00 50.00 50.00 50.00 50.00 50.00 75.00 75.00 100.00
Total variable cost 3294.13 4221.54 2712.80 3560.08 3167.92 6319.15 6898.03 11736.60 8753.97 20927.00
Gross cost 3392.60 4313.49 2804.50 3656.30 3264.22 6420.71 6998.53 11845.28 8857.42 21087.50
Value of by-product 1145.00 1137.00 881.00 1642.50 1697.50 996.00 - - 2677.80 -
Net Cost (Gross cost – value of by-product) 2247.60 3176.49 1923.50 2013.80 1566.72 5424.71 6998.53 11845.28 6179.62 21087.50
Yield (Quintals) Main product 13.19 10.85 8.67 16.32 17.41 10.15 16.67 57.03 54.35 105.63
By-product 22.90 22.74 17.62 32.85 33.95 19.92 - - 89.26 -
Cost of production (Rs. / Qtl.)
(Net cost/Yield of main product) 170.40 292.76 221.86 123.39 90.00 534.45 419.83 207.70 113.70 199.63
Market price of main product (Rs.
/Qtl.) 480.00 550.00 580.00 1449.35 1000.00 2857.00 3000.00 594.00 1267.00 1692.00
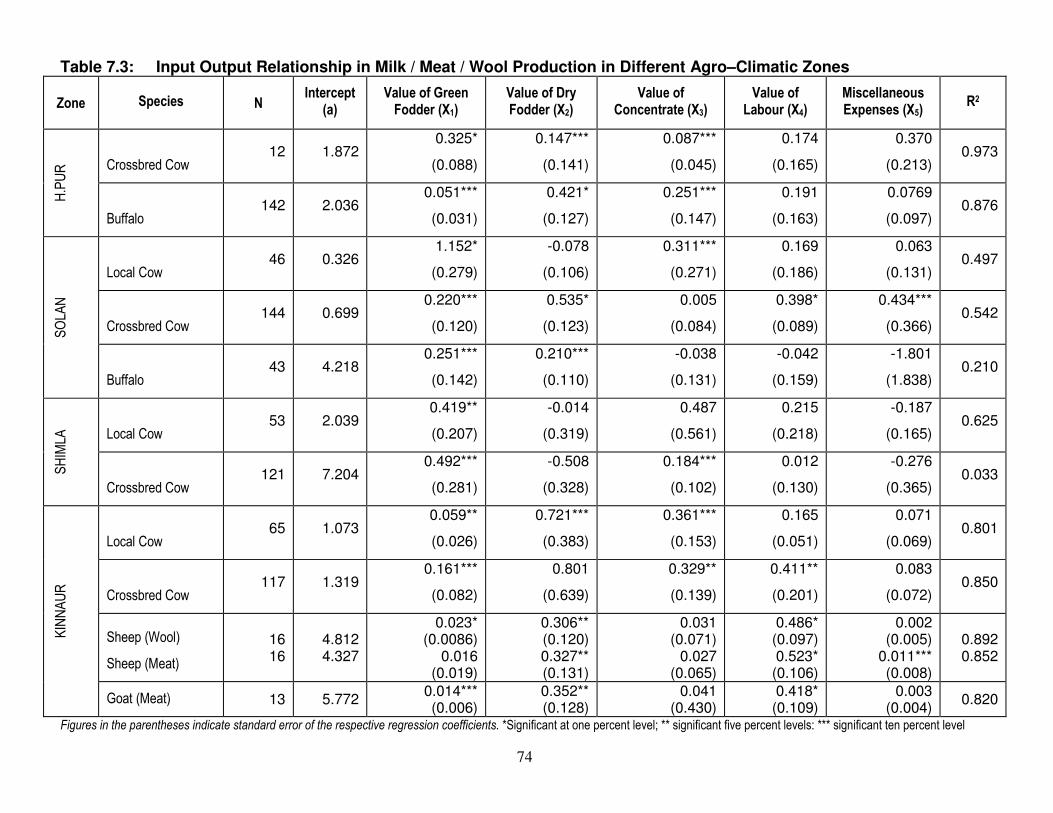
74
Table 7.3: Input Output Relationship in Milk / Meat / Wool Production in Different Agro–Climatic Zones
Zone Species N Intercept
(a) Value of Green Fodder (X1)
Value of Dry Fodder (X2)
Value of Concentrate (X3)
Value of Labour (X4)
Miscellaneous Expenses (X5)
R2
H.PUR Crossbred Cow
12 1.872 0.325*
(0.088)
0.147***
(0.141)
0.087***
(0.045)
0.174
(0.165)
0.370
(0.213) 0.973
Buffalo 142 2.036
0.051***
(0.031)
0.421*
(0.127)
0.251***
(0.147)
0.191
(0.163)
0.0769
(0.097) 0.876
SOLAN
Local Cow 46 0.326
1.152*
(0.279)
-0.078
(0.106)
0.311***
(0.271)
0.169
(0.186)
0.063
(0.131) 0.497
Crossbred Cow 144 0.699
0.220***
(0.120)
0.535*
(0.123)
0.005
(0.084)
0.398*
(0.089)
0.434***
(0.366) 0.542
Buffalo 43 4.218
0.251***
(0.142)
0.210***
(0.110)
-0.038
(0.131)
-0.042
(0.159)
-1.801
(1.838) 0.210
SHIMLA
Local Cow 53 2.039
0.419**
(0.207)
-0.014
(0.319)
0.487
(0.561)
0.215
(0.218)
-0.187
(0.165) 0.625
Crossbred Cow 121 7.204
0.492***
(0.281)
-0.508
(0.328)
0.184***
(0.102)
0.012
(0.130)
-0.276
(0.365) 0.033
KINNAUR
Local Cow 65 1.073
0.059**
(0.026)
0.721***
(0.383)
0.361***
(0.153)
0.165
(0.051)
0.071
(0.069) 0.801
Crossbred Cow 117 1.319
0.161***
(0.082)
0.801
(0.639)
0.329**
(0.139)
0.411**
(0.201)
0.083
(0.072) 0.850
Sheep (Wool)
Sheep (Meat)
16 16
4.812 4.327
0.023* (0.0086)
0.016 (0.019)
0.306** (0.120) 0.327** (0.131)
0.031 (0.071)
0.027 (0.065)
0.486* (0.097) 0.523* (0.106)
0.002 (0.005)
0.011*** (0.008)
0.892 0.852
Goat (Meat) 13 5.772 0.014*** (0.006)
0.352** (0.128)
0.041 (0.430)
0.418* (0.109)
0.003 (0.004)
0.820
Figures in the parentheses indicate standard error of the respective regression coefficients. *Significant at one percent level; ** significant five percent levels: *** significant ten percent level
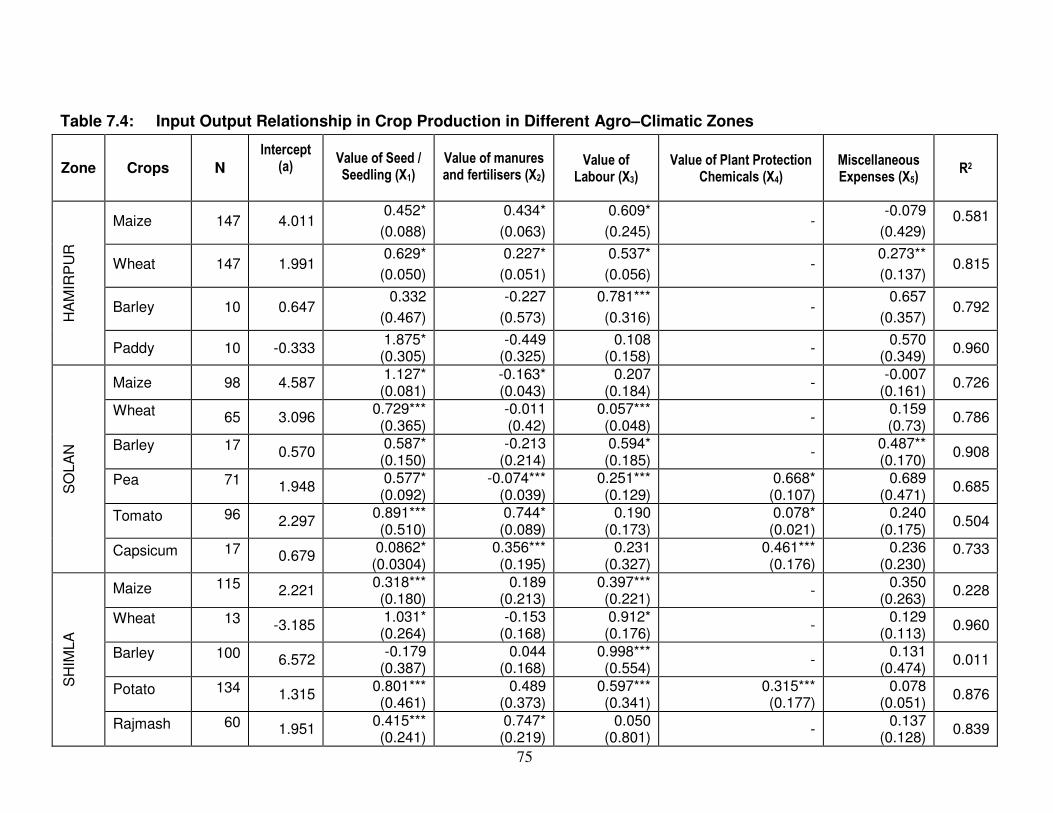
75
Table 7.4: Input Output Relationship in Crop Production in Different Agro–Climatic Zones
Zone Crops N
Intercept (a)
Value of Seed / Seedling (X1)
Value of manures and fertilisers (X2)
Value of Labour (X3)
Value of Plant Protection Chemicals (X4)
Miscellaneous Expenses (X5)
R2
HA
MIR
PU
R
Maize 147 4.011 0.452*
(0.088)
0.434*
(0.063)
0.609*
(0.245) -
-0.079
(0.429) 0.581
Wheat 147 1.991 0.629*
(0.050)
0.227*
(0.051)
0.537*
(0.056) -
0.273**
(0.137) 0.815
Barley 10 0.647 0.332
(0.467)
-0.227
(0.573)
0.781***
(0.316) -
0.657
(0.357) 0.792
Paddy 10 -0.333 1.875* (0.305)
-0.449 (0.325)
0.108 (0.158)
- 0.570
(0.349) 0.960
SO
LA
N
Maize 98 4.587 1.127* (0.081)
-0.163* (0.043)
0.207 (0.184)
- -0.007
(0.161) 0.726
Wheat 65 3.096 0.729*** (0.365)
-0.011 (0.42)
0.057*** (0.048)
- 0.159 (0.73)
0.786
Barley 17 0.570 0.587* (0.150)
-0.213 (0.214)
0.594* (0.185)
- 0.487** (0.170)
0.908
Pea 71 1.948 0.577* (0.092)
-0.074*** (0.039)
0.251*** (0.129)
0.668* (0.107)
0.689 (0.471)
0.685
Tomato 96 2.297 0.891*** (0.510)
0.744* (0.089)
0.190 (0.173)
0.078* (0.021)
0.240 (0.175)
0.504
Capsicum 17 0.679 0.0862* (0.0304)
0.356*** (0.195)
0.231 (0.327)
0.461*** (0.176)
0.236 (0.230)
0.733
SH
IMLA
Maize 115 2.221 0.318*** (0.180)
0.189 (0.213)
0.397*** (0.221)
- 0.350
(0.263) 0.228
Wheat 13 -3.185 1.031* (0.264)
-0.153 (0.168)
0.912* (0.176)
- 0.129
(0.113) 0.960
Barley 100 6.572 -0.179
(0.387) 0.044
(0.168) 0.998*** (0.554)
- 0.131
(0.474) 0.011
Potato 134 1.315 0.801*** (0.461)
0.489 (0.373)
0.597*** (0.341)
0.315*** (0.177)
0.078 (0.051)
0.876
Rajmash 60 1.951 0.415*** (0.241)
0.747* (0.219)
0.050 (0.801)
- 0.137
(0.128) 0.839
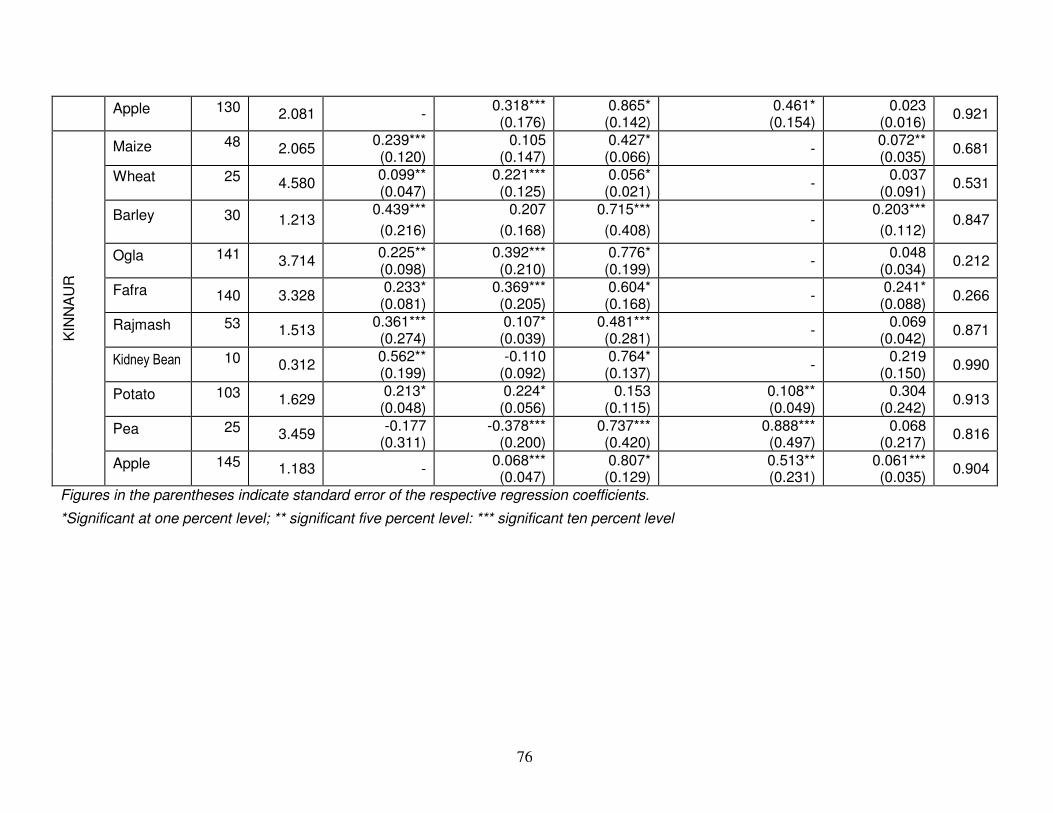
76
Apple 130 2.081 - 0.318*** (0.176)
0.865* (0.142)
0.461* (0.154)
0.023 (0.016)
0.921
KIN
NA
UR
Maize 48 2.065 0.239*** (0.120)
0.105 (0.147)
0.427* (0.066)
- 0.072** (0.035)
0.681
Wheat 25 4.580 0.099** (0.047)
0.221*** (0.125)
0.056* (0.021)
- 0.037
(0.091) 0.531
Barley 30 1.213 0.439***
(0.216)
0.207
(0.168)
0.715***
(0.408) -
0.203***
(0.112) 0.847
Ogla 141 3.714 0.225** (0.098)
0.392*** (0.210)
0.776* (0.199)
- 0.048
(0.034) 0.212
Fafra 140 3.328 0.233* (0.081)
0.369*** (0.205)
0.604* (0.168)
- 0.241* (0.088)
0.266
Rajmash 53 1.513 0.361*** (0.274)
0.107* (0.039)
0.481*** (0.281)
- 0.069
(0.042) 0.871
Kidney Bean 10 0.312 0.562** (0.199)
-0.110 (0.092)
0.764* (0.137)
- 0.219
(0.150) 0.990
Potato 103 1.629 0.213* (0.048)
0.224* (0.056)
0.153 (0.115)
0.108** (0.049)
0.304 (0.242)
0.913
Pea 25 3.459 -0.177
(0.311) -0.378***
(0.200) 0.737*** (0.420)
0.888*** (0.497)
0.068 (0.217)
0.816
Apple 145 1.183 - 0.068*** (0.047)
0.807* (0.129)
0.513** (0.231)
0.061*** (0.035)
0.904
Figures in the parentheses indicate standard error of the respective regression coefficients.
*Significant at one percent level; ** significant five percent level: *** significant ten percent level
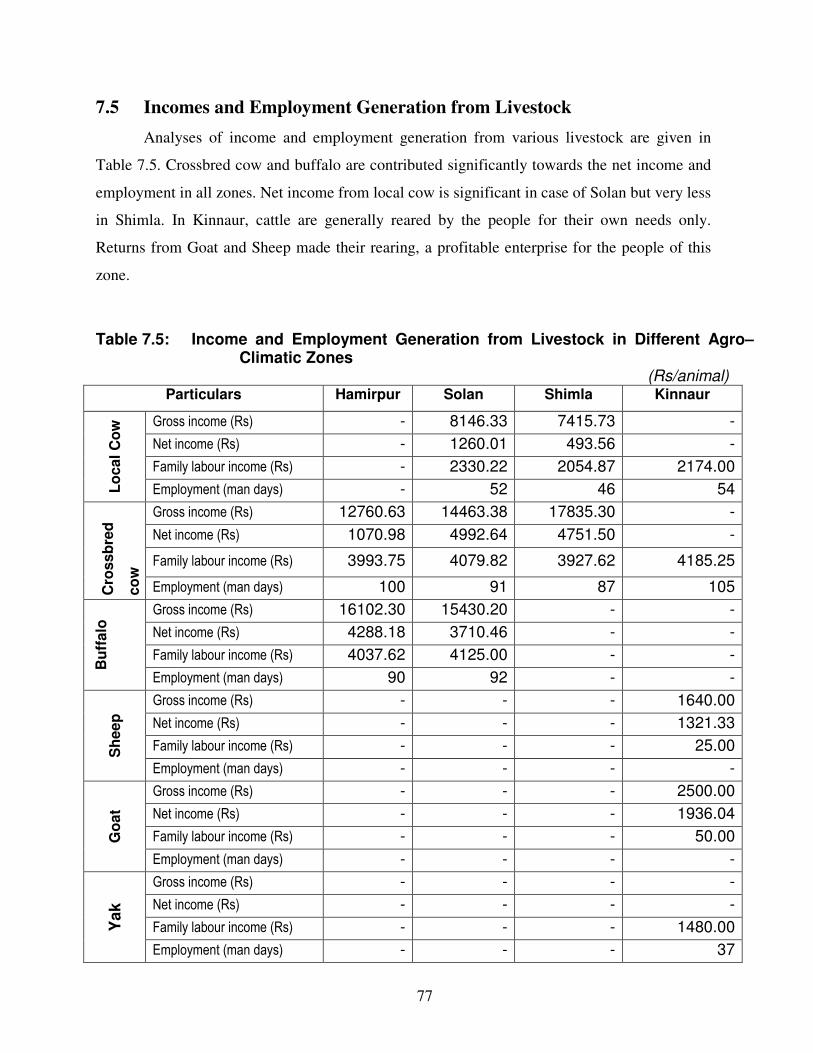
77
7.5 Incomes and Employment Generation from Livestock
Analyses of income and employment generation from various livestock are given in
Table 7.5. Crossbred cow and buffalo are contributed significantly towards the net income and
employment in all zones. Net income from local cow is significant in case of Solan but very less
in Shimla. In Kinnaur, cattle are generally reared by the people for their own needs only.
Returns from Goat and Sheep made their rearing, a profitable enterprise for the people of this
zone.
Table 7.5: Income and Employment Generation from Livestock in Different Agro–
Climatic Zones (Rs/animal)
Particulars Hamirpur Solan Shimla Kinnaur
Lo
cal
Co
w Gross income (Rs) - 8146.33 7415.73 -
Net income (Rs) - 1260.01 493.56 -
Family labour income (Rs) - 2330.22 2054.87 2174.00
Employment (man days) - 52 46 54
Cro
ssb
red
co
w
Gross income (Rs) 12760.63 14463.38 17835.30 -
Net income (Rs) 1070.98 4992.64 4751.50 -
Family labour income (Rs) 3993.75 4079.82 3927.62 4185.25
Employment (man days) 100 91 87 105
Bu
ffalo
Gross income (Rs) 16102.30 15430.20 - -
Net income (Rs) 4288.18 3710.46 - -
Family labour income (Rs) 4037.62 4125.00 - -
Employment (man days) 90 92 - -
Sh
eep
Gross income (Rs) - - - 1640.00
Net income (Rs) - - - 1321.33
Family labour income (Rs) - - - 25.00
Employment (man days) - - - -
Go
at
Gross income (Rs) - - - 2500.00
Net income (Rs) - - - 1936.04
Family labour income (Rs) - - - 50.00
Employment (man days) - - - -
Ya
k
Gross income (Rs) - - - -
Net income (Rs) - - - -
Family labour income (Rs) - - - 1480.00
Employment (man days) - - - 37
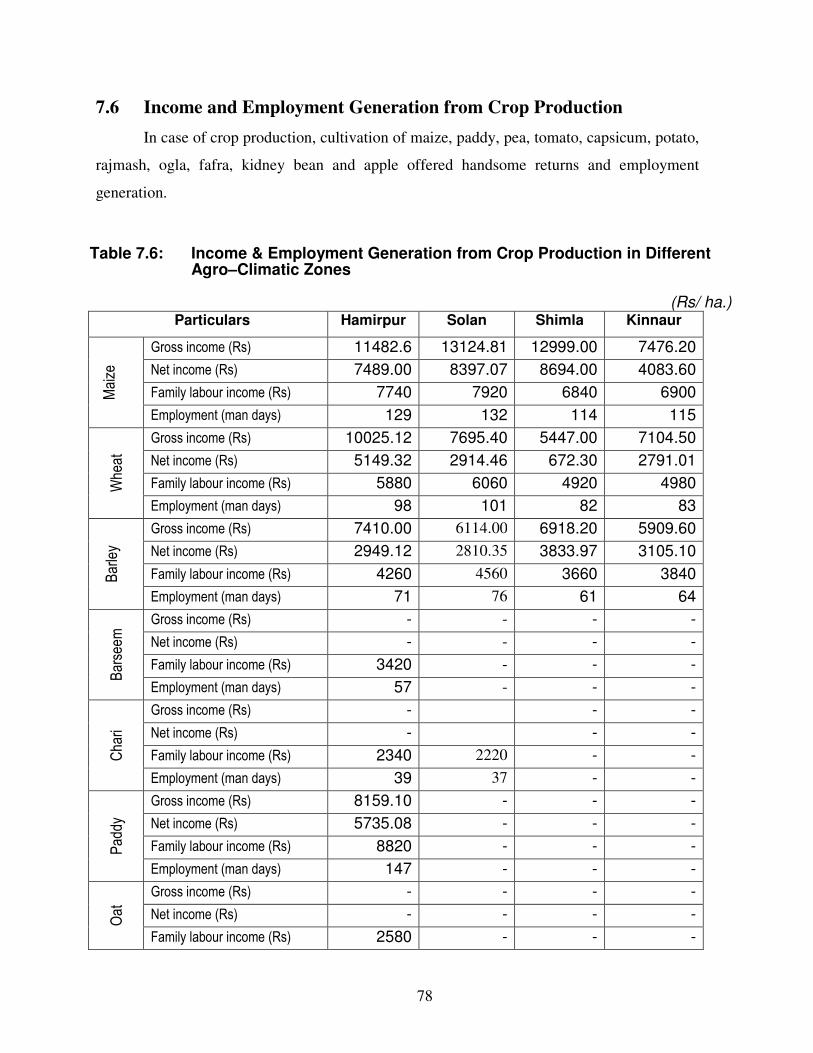
78
7.6 Income and Employment Generation from Crop Production
In case of crop production, cultivation of maize, paddy, pea, tomato, capsicum, potato,
rajmash, ogla, fafra, kidney bean and apple offered handsome returns and employment
generation.
Table 7.6: Income & Employment Generation from Crop Production in Different Agro–Climatic Zones
(Rs/ ha.)
Particulars Hamirpur Solan Shimla Kinnaur
Maize
Gross income (Rs) 11482.6 13124.81 12999.00 7476.20
Net income (Rs) 7489.00 8397.07 8694.00 4083.60
Family labour income (Rs) 7740 7920 6840 6900
Employment (man days) 129 132 114 115
Wheat
Gross income (Rs) 10025.12 7695.40 5447.00 7104.50
Net income (Rs) 5149.32 2914.46 672.30 2791.01
Family labour income (Rs) 5880 6060 4920 4980
Employment (man days) 98 101 82 83
Barley
Gross income (Rs) 7410.00 6114.00 6918.20 5909.60
Net income (Rs) 2949.12 2810.35 3833.97 3105.10
Family labour income (Rs) 4260 4560 3660 3840
Employment (man days) 71 76 61 64
Barseem
Gross income (Rs) - - - -
Net income (Rs) - - - -
Family labour income (Rs) 3420 - - -
Employment (man days) 57 - - -
Chari
Gross income (Rs) - - -
Net income (Rs) - - -
Family labour income (Rs) 2340 2220 - -
Employment (man days) 39 37 - -
Paddy
Gross income (Rs) 8159.10 - - -
Net income (Rs) 5735.08 - - -
Family labour income (Rs) 8820 - - -
Employment (man days) 147 - - -
Oat
Gross income (Rs) - - - -
Net income (Rs) - - - -
Family labour income (Rs) 2580 - - -
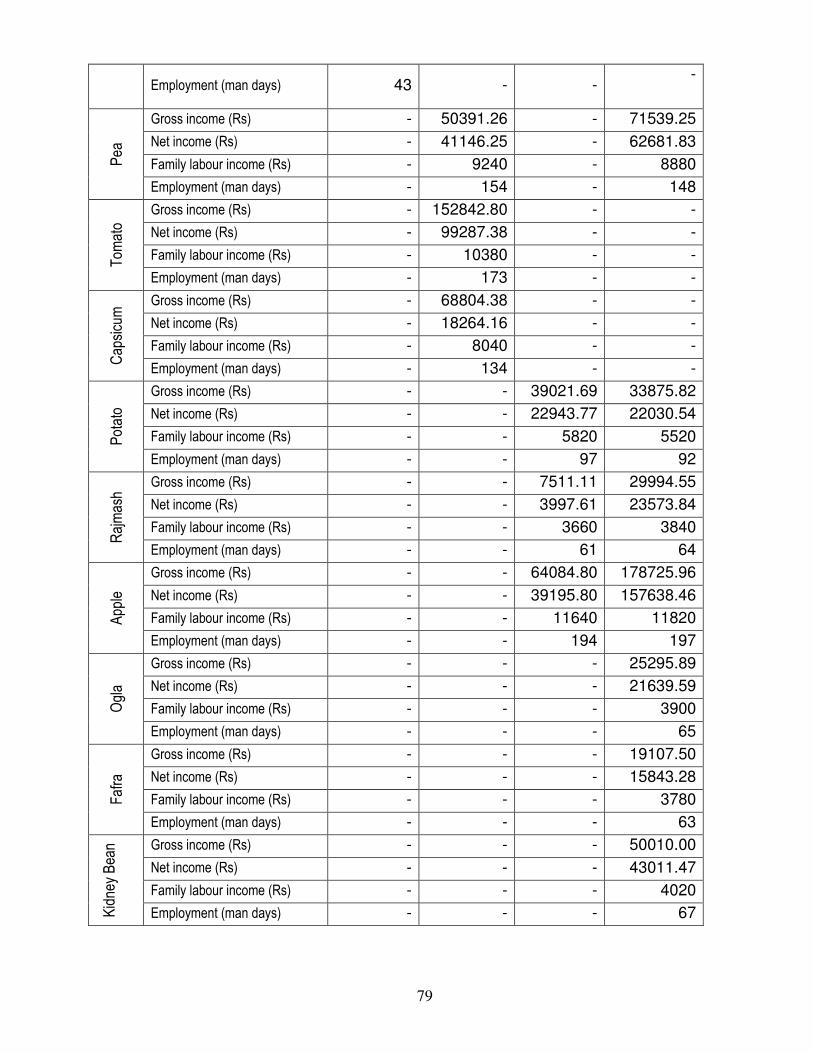
79
Employment (man days) 43 - - -
Pea
Gross income (Rs) - 50391.26 - 71539.25
Net income (Rs) - 41146.25 - 62681.83
Family labour income (Rs) - 9240 - 8880
Employment (man days) - 154 - 148
Tom
ato
Gross income (Rs) - 152842.80 - -
Net income (Rs) - 99287.38 - -
Family labour income (Rs) - 10380 - -
Employment (man days) - 173 - -
Capsicum Gross income (Rs) - 68804.38 - -
Net income (Rs) - 18264.16 - -
Family labour income (Rs) - 8040 - -
Employment (man days) - 134 - -
Potato
Gross income (Rs) - - 39021.69 33875.82
Net income (Rs) - - 22943.77 22030.54
Family labour income (Rs) - - 5820 5520
Employment (man days) - - 97 92
Rajmash
Gross income (Rs) - - 7511.11 29994.55
Net income (Rs) - - 3997.61 23573.84
Family labour income (Rs) - - 3660 3840
Employment (man days) - - 61 64
Apple
Gross income (Rs) - - 64084.80 178725.96
Net income (Rs) - - 39195.80 157638.46
Family labour income (Rs) - - 11640 11820
Employment (man days) - - 194 197
Ogla
Gross income (Rs) - - - 25295.89
Net income (Rs) - - - 21639.59
Family labour income (Rs) - - - 3900
Employment (man days) - - - 65
Fafra
Gross income (Rs) - - - 19107.50
Net income (Rs) - - - 15843.28
Family labour income (Rs) - - - 3780
Employment (man days) - - - 63
Kidney Bean Gross income (Rs) - - - 50010.00
Net income (Rs) - - - 43011.47
Family labour income (Rs) - - - 4020
Employment (man days) - - - 67
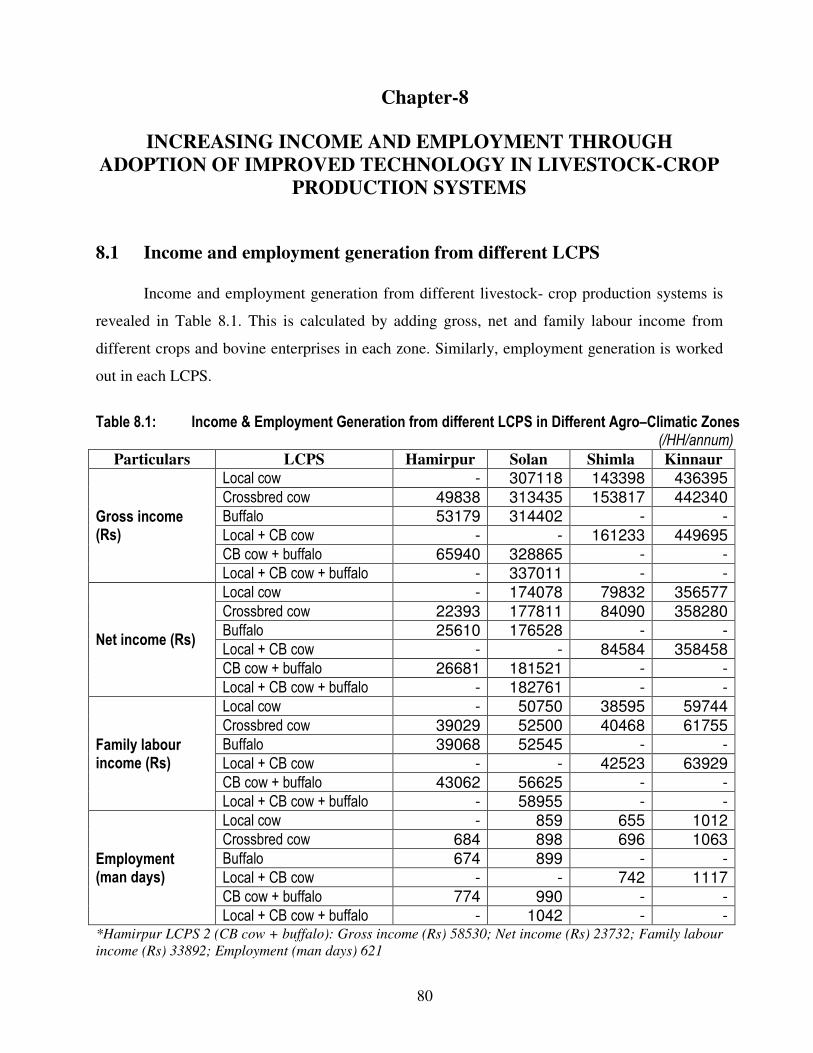
80
Chapter-8
INCREASING INCOME AND EMPLOYMENT THROUGH
ADOPTION OF IMPROVED TECHNOLOGY IN LIVESTOCK-CROP
PRODUCTION SYSTEMS
8.1 Income and employment generation from different LCPS
Income and employment generation from different livestock- crop production systems is
revealed in Table 8.1. This is calculated by adding gross, net and family labour income from
different crops and bovine enterprises in each zone. Similarly, employment generation is worked
out in each LCPS.
Table 8.1: Income & Employment Generation from different LCPS in Different Agro–Climatic Zones
(/HH/annum)
Particulars LCPS Hamirpur Solan Shimla Kinnaur
Gross income (Rs)
Local cow - 307118 143398 436395 Crossbred cow 49838 313435 153817 442340 Buffalo 53179 314402 - - Local + CB cow - - 161233 449695 CB cow + buffalo 65940 328865 - - Local + CB cow + buffalo - 337011 - -
Net income (Rs)
Local cow - 174078 79832 356577 Crossbred cow 22393 177811 84090 358280 Buffalo 25610 176528 - - Local + CB cow - - 84584 358458 CB cow + buffalo 26681 181521 - - Local + CB cow + buffalo - 182761 - -
Family labour income (Rs)
Local cow - 50750 38595 59744 Crossbred cow 39029 52500 40468 61755 Buffalo 39068 52545 - - Local + CB cow - - 42523 63929 CB cow + buffalo 43062 56625 - - Local + CB cow + buffalo - 58955 - -
Employment (man days)
Local cow - 859 655 1012 Crossbred cow 684 898 696 1063 Buffalo 674 899 - - Local + CB cow - - 742 1117 CB cow + buffalo 774 990 - - Local + CB cow + buffalo - 1042 - -
*Hamirpur LCPS 2 (CB cow + buffalo): Gross income (Rs) 58530; Net income (Rs) 23732; Family labour
income (Rs) 33892; Employment (man days) 621
81
8.2 Potential income and employment generation from different LCPS Potential income and employment generation in different agro-climatic zones under
different livestock- crop production systems is calculated by identifying farmers having
maximum yield of milk and different crops. This may be largely due to the use of improved
technology and mix of recommended package of practices. Results are revealed in Table 8.2.
In Hamirpur district of low hill sub-tropical zone under LCPS 1, gross income, net
income, family labour income and employment days generated are Rs. 53179, Rs. 25610, Rs.
39068 and 674 days respectively, whereas potential income and employment days are Rs.
70349, Rs. 37423, Rs. 44220 and 737 days respectively. Under LCPS 2, gross income, net
income, family labour income and employment days generated are Rs. 58530, Rs.23732, Rs.
33892 and 621 days respectively, whereas potential income and employment days under this
system comes out to be Rs. 67393, Rs. 33805, Rs. 37200 and 637 days respectively.
In Solan district of mid hill sub-humid zone, under LCPS 1, gross income, net income,
family labour income and employment days generated are Rs. 313435, Rs. 177811, Rs.52500
and 898 days respectively, whereas potential income and employment days are Rs. 370990,
Rs. 201667, Rs. 57120 and 952 days respectively. Under LCPS 2, gross income, net income,
family labour income and employment days generated are Rs. 328865, Rs.181521, Rs. 56625
and 990 days respectively, whereas potential income and employment days under this system
comes out to be Rs. 402757, Rs. 249581, Rs. 59580 and 993 days respectively.
In Shimla district of high hill wet zone under LCPS 1, gross income, net income, family
labour income and employment days generated are Rs. 153817, Rs.84090, Rs. 40468 and 696
days respectively, whereas potential income and employment days are Rs. 166227, Rs.92835,
Rs. 42480 and 708 days respectively. Under LCPS 2, gross income, net income, family labour
income and employment days generated are Rs. 161233, Rs.84584, Rs. 42523 and 742 days
respectively, whereas potential income and employment days under this system comes out to
be Rs. 172633, Rs. 92491, Rs. 43980 and 753 days respectively.
In Kinnaur district of high hill dry zone under LCPS 1, gross income, net income, family
labour income and employment days generated are Rs. 442340, Rs. 358280, Rs. 61755 and
1063 days respectively, whereas potential income and employment days are Rs. 467915, Rs.
367107, Rs. 62819 and 1108 days respectively. Under LCPS 2, gross income, net income,
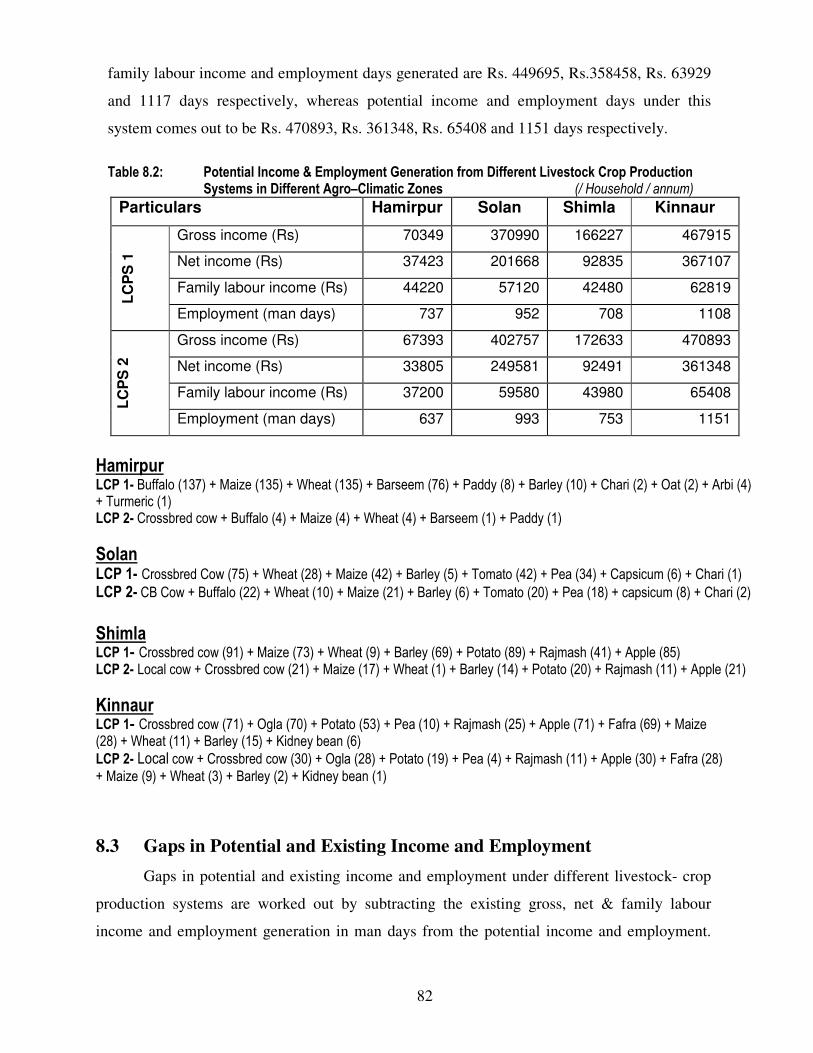
82
family labour income and employment days generated are Rs. 449695, Rs.358458, Rs. 63929
and 1117 days respectively, whereas potential income and employment days under this
system comes out to be Rs. 470893, Rs. 361348, Rs. 65408 and 1151 days respectively.
Table 8.2: Potential Income & Employment Generation from Different Livestock Crop Production
Systems in Different Agro–Climatic Zones (/ Household / annum)
Particulars Hamirpur Solan Shimla Kinnaur
LC
PS
1
Gross income (Rs) 70349 370990 166227 467915
Net income (Rs) 37423 201668 92835 367107
Family labour income (Rs) 44220 57120 42480 62819
Employment (man days) 737 952 708 1108
LC
PS
2
Gross income (Rs) 67393 402757 172633 470893
Net income (Rs) 33805 249581 92491 361348
Family labour income (Rs) 37200 59580 43980 65408
Employment (man days) 637 993 753 1151
Hamirpur LCP 1- Buffalo (137) + Maize (135) + Wheat (135) + Barseem (76) + Paddy (8) + Barley (10) + Chari (2) + Oat (2) + Arbi (4) + Turmeric (1) LCP 2- Crossbred cow + Buffalo (4) + Maize (4) + Wheat (4) + Barseem (1) + Paddy (1)
Solan LCP 1- Crossbred Cow (75) + Wheat (28) + Maize (42) + Barley (5) + Tomato (42) + Pea (34) + Capsicum (6) + Chari (1) LCP 2- CB Cow + Buffalo (22) + Wheat (10) + Maize (21) + Barley (6) + Tomato (20) + Pea (18) + capsicum (8) + Chari (2)
Shimla LCP 1- Crossbred cow (91) + Maize (73) + Wheat (9) + Barley (69) + Potato (89) + Rajmash (41) + Apple (85) LCP 2- Local cow + Crossbred cow (21) + Maize (17) + Wheat (1) + Barley (14) + Potato (20) + Rajmash (11) + Apple (21)
Kinnaur LCP 1- Crossbred cow (71) + Ogla (70) + Potato (53) + Pea (10) + Rajmash (25) + Apple (71) + Fafra (69) + Maize (28) + Wheat (11) + Barley (15) + Kidney bean (6)
LCP 2- Local cow + Crossbred cow (30) + Ogla (28) + Potato (19) + Pea (4) + Rajmash (11) + Apple (30) + Fafra (28) + Maize (9) + Wheat (3) + Barley (2) + Kidney bean (1)
8.3 Gaps in Potential and Existing Income and Employment
Gaps in potential and existing income and employment under different livestock- crop
production systems are worked out by subtracting the existing gross, net & family labour
income and employment generation in man days from the potential income and employment.
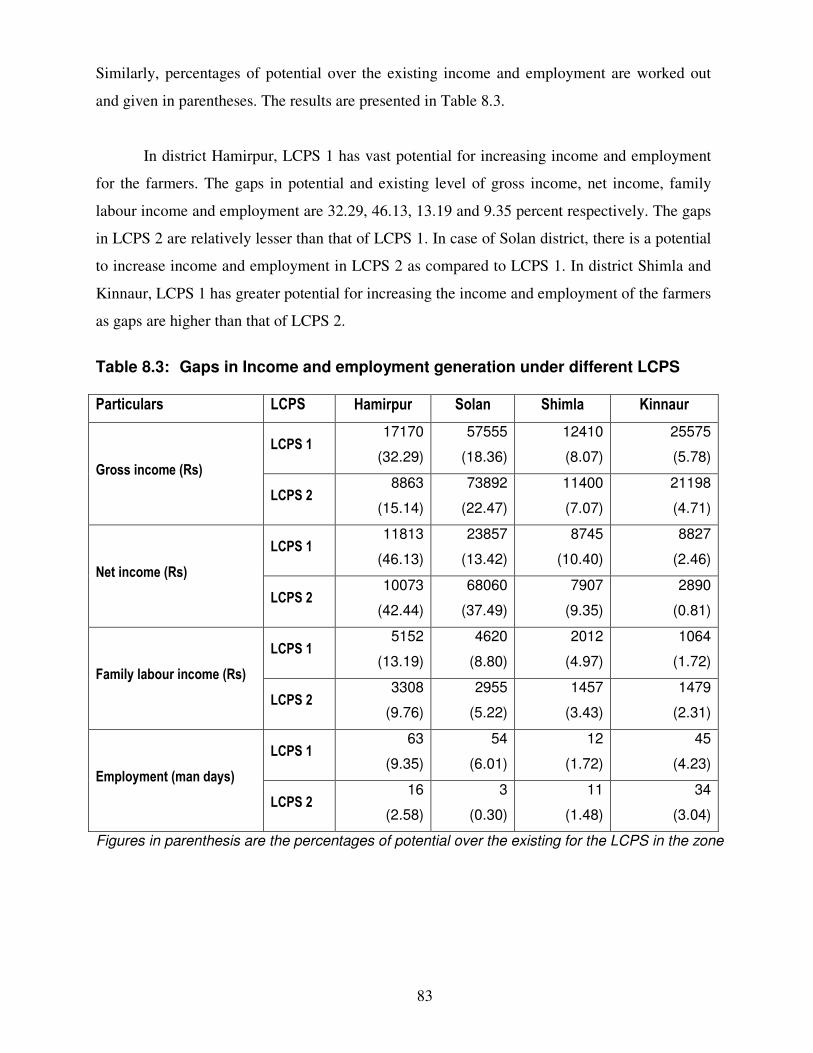
83
Similarly, percentages of potential over the existing income and employment are worked out
and given in parentheses. The results are presented in Table 8.3.
In district Hamirpur, LCPS 1 has vast potential for increasing income and employment
for the farmers. The gaps in potential and existing level of gross income, net income, family
labour income and employment are 32.29, 46.13, 13.19 and 9.35 percent respectively. The gaps
in LCPS 2 are relatively lesser than that of LCPS 1. In case of Solan district, there is a potential
to increase income and employment in LCPS 2 as compared to LCPS 1. In district Shimla and
Kinnaur, LCPS 1 has greater potential for increasing the income and employment of the farmers
as gaps are higher than that of LCPS 2.
Table 8.3: Gaps in Income and employment generation under different LCPS Particulars LCPS Hamirpur Solan Shimla Kinnaur
Gross income (Rs)
LCPS 1 17170
(32.29)
57555
(18.36)
12410
(8.07)
25575
(5.78)
LCPS 2 8863
(15.14)
73892
(22.47)
11400
(7.07)
21198
(4.71)
Net income (Rs)
LCPS 1 11813
(46.13)
23857
(13.42)
8745
(10.40)
8827
(2.46)
LCPS 2 10073
(42.44)
68060
(37.49)
7907
(9.35)
2890
(0.81)
Family labour income (Rs)
LCPS 1 5152
(13.19)
4620
(8.80)
2012
(4.97)
1064
(1.72)
LCPS 2 3308
(9.76)
2955
(5.22)
1457
(3.43)
1479
(2.31)
Employment (man days)
LCPS 1 63
(9.35)
54
(6.01)
12
(1.72)
45
(4.23)
LCPS 2 16
(2.58)
3
(0.30)
11
(1.48)
34
(3.04)
Figures in parenthesis are the percentages of potential over the existing for the LCPS in the zone
84
Chapter-9
CONSTRAINTS IN MARKETING OF CROPS
AND LIVESTOCK PRODUCTS
9.1 Production and Financial constraints in crop production
Production and Financial constraints in case of crop production as reported by the farmers
of Hamirpur district are high incidence of insects/ pests in HYVs followed by high cost of credit
and lack of credit availability from institutional sources. Lack of knowledge about recommended
package of practices is the reason of lower productivity of various crops and higher cost of
production. Though constraints like lack of timely availability of good quality seeds, poor
communication & extension facilities, lack of capital resources and inadequate irrigation facilities
are rated low on scale by the farmers but their combined impact hampers the crop production in the
zone.
In Solan, inadequate irrigation facilities, high cost of credit and lack of availability of
agricultural labour during peak seasons are the major constraints reported by the farmers in
production of cash crops like pea, tomato and capsicum. High incidences of insects, pests and
diseases in vegetable crops made them less remunerative to the farmers and require proper attention
of the concerned authorities.
High cost of credit, inadequate irrigation facilities, lack of knowledge about recommended
package of practices and poor communication and extension facilities are the major constraints
faced by the farmers in crop production in district Shimla.
In district Kinnaur, inadequate irrigation facility is the major constraint faced by the farmers
in crop farming. Other constraints faced by the farmers in production of crops are lack of
knowledge about recommended package of practices, lack of timely availability of good quality
seeds, poor communication and extension facilities etc.
Constraints faced in crop production under different livestock- crop production systems in
different agro- climatic zones are presented in Table 9.2.
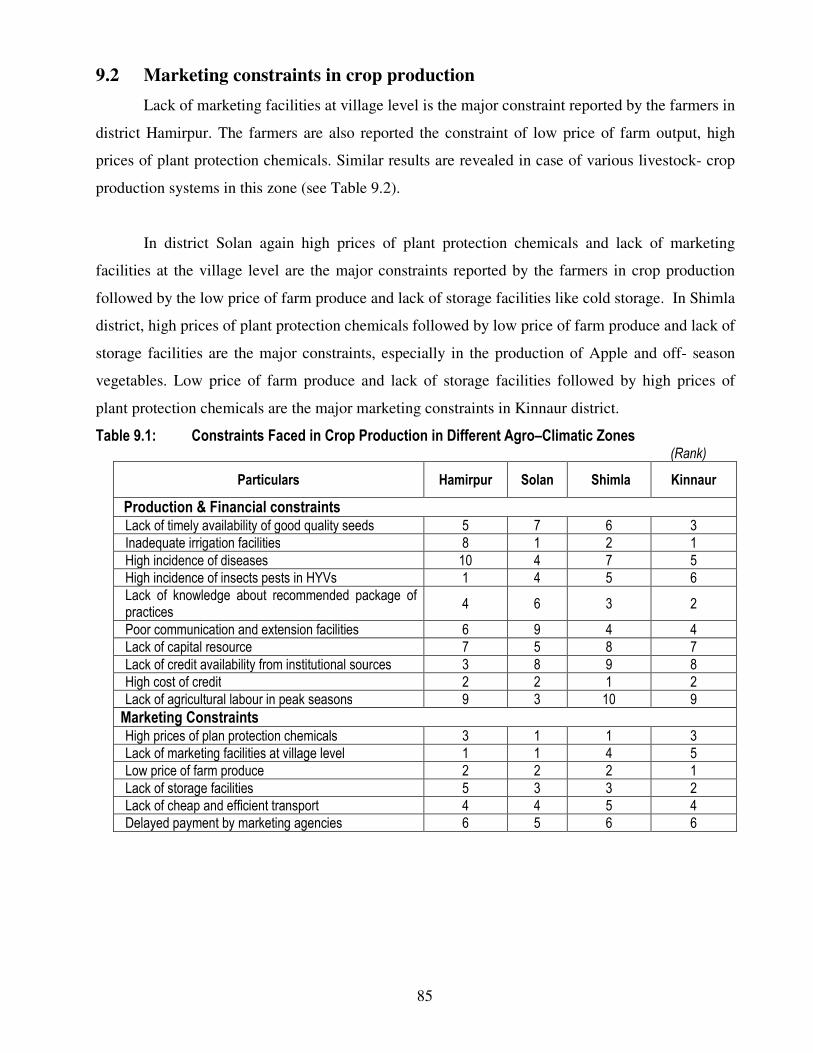
85
9.2 Marketing constraints in crop production
Lack of marketing facilities at village level is the major constraint reported by the farmers in
district Hamirpur. The farmers are also reported the constraint of low price of farm output, high
prices of plant protection chemicals. Similar results are revealed in case of various livestock- crop
production systems in this zone (see Table 9.2).
In district Solan again high prices of plant protection chemicals and lack of marketing
facilities at the village level are the major constraints reported by the farmers in crop production
followed by the low price of farm produce and lack of storage facilities like cold storage. In Shimla
district, high prices of plant protection chemicals followed by low price of farm produce and lack of
storage facilities are the major constraints, especially in the production of Apple and off- season
vegetables. Low price of farm produce and lack of storage facilities followed by high prices of
plant protection chemicals are the major marketing constraints in Kinnaur district.
Table 9.1: Constraints Faced in Crop Production in Different Agro–Climatic Zones (Rank)
Particulars Hamirpur Solan Shimla Kinnaur
Production & Financial constraints Lack of timely availability of good quality seeds 5 7 6 3
Inadequate irrigation facilities 8 1 2 1
High incidence of diseases 10 4 7 5
High incidence of insects pests in HYVs 1 4 5 6
Lack of knowledge about recommended package of practices
4 6 3 2
Poor communication and extension facilities 6 9 4 4
Lack of capital resource 7 5 8 7
Lack of credit availability from institutional sources 3 8 9 8
High cost of credit 2 2 1 2
Lack of agricultural labour in peak seasons 9 3 10 9
Marketing Constraints High prices of plan protection chemicals 3 1 1 3
Lack of marketing facilities at village level 1 1 4 5
Low price of farm produce 2 2 2 1
Lack of storage facilities 5 3 3 2
Lack of cheap and efficient transport 4 4 5 4
Delayed payment by marketing agencies 6 5 6 6
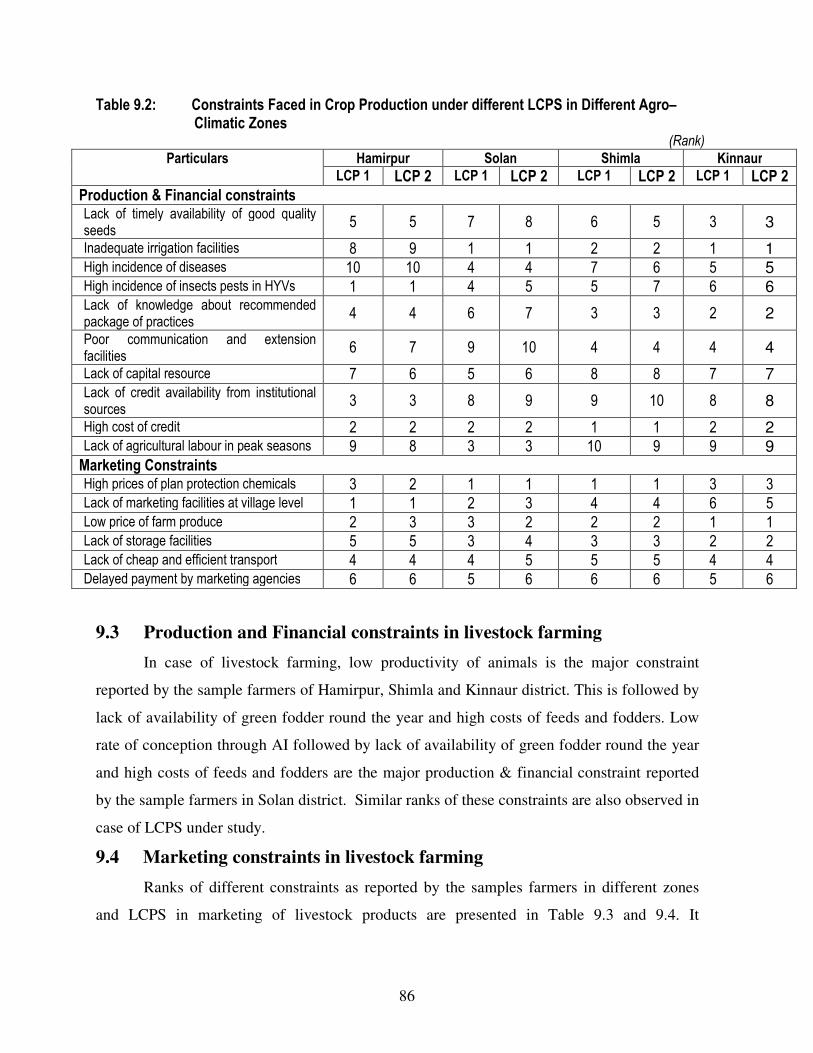
86
Table 9.2: Constraints Faced in Crop Production under different LCPS in Different Agro– Climatic Zones (Rank)
Particulars Hamirpur Solan Shimla Kinnaur LCP 1 LCP 2 LCP 1 LCP 2 LCP 1 LCP 2 LCP 1 LCP 2
Production & Financial constraints Lack of timely availability of good quality seeds
5 5 7 8 6 5 3 3
Inadequate irrigation facilities 8 9 1 1 2 2 1 1 High incidence of diseases 10 10 4 4 7 6 5 5 High incidence of insects pests in HYVs 1 1 4 5 5 7 6 6 Lack of knowledge about recommended package of practices
4 4 6 7 3 3 2 2
Poor communication and extension facilities
6 7 9 10 4 4 4 4
Lack of capital resource 7 6 5 6 8 8 7 7 Lack of credit availability from institutional sources
3 3 8 9 9 10 8 8
High cost of credit 2 2 2 2 1 1 2 2 Lack of agricultural labour in peak seasons 9 8 3 3 10 9 9 9 Marketing Constraints High prices of plan protection chemicals 3 2 1 1 1 1 3 3 Lack of marketing facilities at village level 1 1 2 3 4 4 6 5 Low price of farm produce 2 3 3 2 2 2 1 1 Lack of storage facilities 5 5 3 4 3 3 2 2 Lack of cheap and efficient transport 4 4 4 5 5 5 4 4 Delayed payment by marketing agencies 6 6 5 6 6 6 5 6
9.3 Production and Financial constraints in livestock farming
In case of livestock farming, low productivity of animals is the major constraint
reported by the sample farmers of Hamirpur, Shimla and Kinnaur district. This is followed by
lack of availability of green fodder round the year and high costs of feeds and fodders. Low
rate of conception through AI followed by lack of availability of green fodder round the year
and high costs of feeds and fodders are the major production & financial constraint reported
by the sample farmers in Solan district. Similar ranks of these constraints are also observed in
case of LCPS under study.
9.4 Marketing constraints in livestock farming
Ranks of different constraints as reported by the samples farmers in different zones
and LCPS in marketing of livestock products are presented in Table 9.3 and 9.4. It
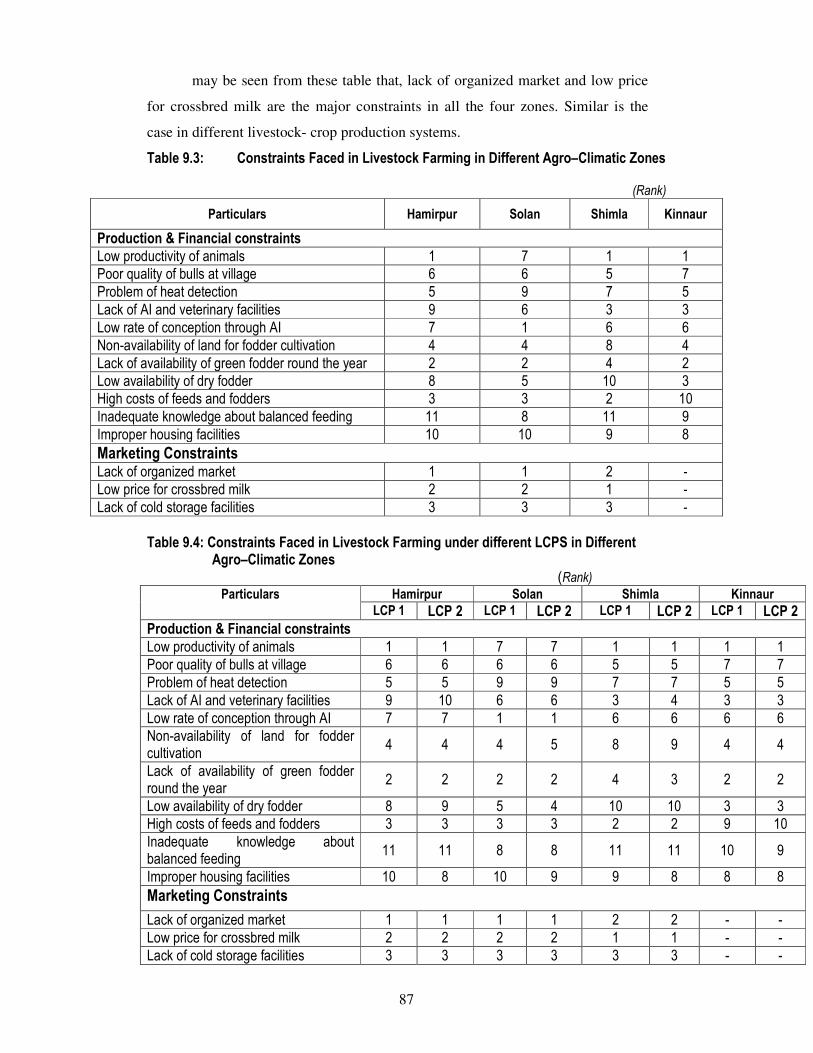
87
may be seen from these table that, lack of organized market and low price
for crossbred milk are the major constraints in all the four zones. Similar is the
case in different livestock- crop production systems.
Table 9.3: Constraints Faced in Livestock Farming in Different Agro–Climatic Zones
(Rank)
Particulars Hamirpur Solan Shimla Kinnaur
Production & Financial constraints
Low productivity of animals 1 7 1 1
Poor quality of bulls at village 6 6 5 7
Problem of heat detection 5 9 7 5
Lack of AI and veterinary facilities 9 6 3 3
Low rate of conception through AI 7 1 6 6
Non-availability of land for fodder cultivation 4 4 8 4
Lack of availability of green fodder round the year 2 2 4 2
Low availability of dry fodder 8 5 10 3
High costs of feeds and fodders 3 3 2 10
Inadequate knowledge about balanced feeding 11 8 11 9
Improper housing facilities 10 10 9 8
Marketing Constraints Lack of organized market 1 1 2 -
Low price for crossbred milk 2 2 1 -
Lack of cold storage facilities 3 3 3 -
Table 9.4: Constraints Faced in Livestock Farming under different LCPS in Different Agro–Climatic Zones (Rank)
Particulars Hamirpur Solan Shimla Kinnaur LCP 1 LCP 2 LCP 1 LCP 2 LCP 1 LCP 2 LCP 1 LCP 2
Production & Financial constraints Low productivity of animals 1 1 7 7 1 1 1 1
Poor quality of bulls at village 6 6 6 6 5 5 7 7
Problem of heat detection 5 5 9 9 7 7 5 5
Lack of AI and veterinary facilities 9 10 6 6 3 4 3 3
Low rate of conception through AI 7 7 1 1 6 6 6 6
Non-availability of land for fodder cultivation
4 4 4 5 8 9 4 4
Lack of availability of green fodder round the year
2 2 2 2 4 3 2 2
Low availability of dry fodder 8 9 5 4 10 10 3 3
High costs of feeds and fodders 3 3 3 3 2 2 9 10
Inadequate knowledge about balanced feeding
11 11 8 8 11 11 10 9
Improper housing facilities 10 8 10 9 9 8 8 8
Marketing Constraints
Lack of organized market 1 1 1 1 2 2 - -
Low price for crossbred milk 2 2 2 2 1 1 - -
Lack of cold storage facilities 3 3 3 3 3 3 - -
88
Chapter 10
CONCLUSION AND RECOMMENDATIONS
10.1 Conclusion
In Himachal Pradesh livestock are largely raised on pastures. Cattle of this area
are non- descript, short statured and of low productivity. Sheep and goats are as
important as cattle. The sheep reared in this State yield good quality wool. Temperate
hilly regions of Himachal Pradesh are ideally suited for the exotic high yielding milch
cattle and Merino sheep. Livestock rearing is practised generally within the framework
of mixed farming. The mechanized system of cultivation is not prevalent in the State,
because of terraced fields and smallholdings. Thus, the bulk of draft power
requirements are provided by the bullocks. In most of the villages vehicular traffic is
not possible, therefore, most of the commodities are still transported by the pack
animals like ponies, mules, sheep, goats etc.
Since the net sown area is lesser, farmers generally do not grow any fodder
crop on farmland. Irrigation facilities are meagre. In the dry zone, cultivation is done
mainly on irrigated fields. While in low and mid hill zones cultivation is generally
done under rain fed conditions.
The livestock economy in the State is mainly bovine based in the low and mid
hill zones, whereas it is goat, sheep based in the high hill dry zone. The density of
livestock per sq. km is higher in low hills and lower in high hill zones.
Out of the various LCPS identified in different zones, it was found that rearing
of Buffalo combined with farming of different crops including cereals, vegetable etc.
has a vast potential for increasing income and employment in low- hill sub tropical and
mid- hill sub humid zone. On the other hand, rearing of crossbred cow combined with
farming of cash crops like fruits and vegetables has a good potential for increasing
income and employment of the farmers in high- hill temperate wet and dry zone of
Himachal Pradesh.
The production traits such as age at first calving, lactation length, dry period,
inter-calving period, average lactation yield and average daily milk yield in milch
animals in all the four zones are below optimum level. This results in higher cost of
89
production of milk and milk products and the profit margin for the farmers is on lower
side, which makes dairy farming a less remunerative enterprise.
Input- output relation in milk, meat and wool production indicated that the
feeding of animals with green fodder, dry fodder and concentrates should be increased
in a balanced way to increase the productivity of milch animals.
The resource use efficiency indicated that there is a scope to increase crop
output by efficient use of inputs in the cultivation of different crops. It may be
concluded that the farmers should use more of HYV seeds, labour and plant protection
chemicals in the crops. Use of manures and fertilisers should also be increased in
certain crops like tomato, capsicum, potato, apple etc. Whereas manures and fertilizers
in case of maize, wheat, paddy, barley, pea can be turned into positive and used
efficiently if proper irrigation arrangements would be done.
Crossbred cow and buffalo are contributed significantly towards the net
income and employment generation in all zones. Net income from local cow is
relatively more in case of mid hill zone and less in high hill dry zone. Production of
maize, paddy, pea, tomato, capsicum, potato, rajmash, ogla, fafra, kidney bean and
apple offered remunerative returns and employment to the farmers.
High cost of credit, inadequate irrigation facilities, lack of knowledge about
recommended package of practices, lack of marketing facilities at village level and
low price of farm produce are the major constraints in crop production as reported by
the farmers.
In case of livestock farming, low productivity of animals, low rate of
conception through AI, high costs of feeds and fodders, lack of organized market and
low price for crossbred milk are the major constraints.
10.2 Recommendations
The following recommendations are emerged from the study for improving the
livestock- crop production systems in Himachal Pradesh:
90
� For obtaining higher returns from dairy animals proper breeding, feeding and weaning
of livestock is urgently required. These are presently lacking due to hilly terrain and
inaccessible villages.
� The concentration of buffaloes is higher in low hill areas whereas cows are
predominant in mid and high hill areas. The development strategy should address this
particular fact.
� The cultivation of fodder crop on farm is negligible. Farmers are dependent on CPRs
and own grasslands for obtaining fodder for the livestock. It is suggested that the
agro- forestry on degraded CPR lands for both soil and water conservation and
enhancing green leaf fodder supply is very essential. The programme for improving
the fodder production efficiency on private land by providing seed/ sapling should be
taken on large scale. Rotary chaff- cutter should be popularised in the rural areas.
� The quality of cattle feed available in the market is poor and priced high. As a result
the use of cattle feed is very low. This results in poor milk yield and animal health.
This problem required intervention of the concerned government agencies.
� Lack of veterinary facilities especially at village level requires urgent attention.
� To improve efficiency of milk marketing system, there is a need for training and
advocacy of co- operative principles.
� In remote areas of the State, there is a considerable quantity of milk available for sale,
but cannot be disposed off, as there are no marketing facilities. The dairy farmers in
such areas do not have the knowledge of co- operative milk marketing.
� Training programmes related to breeding, feeding and management practices should
be organised at village level for the farmers including men and women.
For promotion of livestock- crop production system following approach is suggested:
Sustainable increase in food grain production through extension of improved
crop varieties, particularly in agro- pastoral areas, improving marginal croplands and
improving water use and irrigation system – including promotion of water harvesting
and efficient use technologies. The croplands should also provide more opportunities
for livestock development through processing of feed from agricultural by- products
and production of more forage and hay. The crop- livestock production system cannot
91
progress unless a productive crop farming system is established. Ensuring sufficient
food grain means developing a potential supply of concentrated feed with a high
quality grain base. Increasing the productivity of major cropland also means that more
marginal areas can be devoted to developing artificial grassland and cultivating
perennial forage integrated with crops.
Sustainable development of livestock farming in crop dominated areas, made
possible by giving priority to the production of animal feed and the development of
markets for livestock products. In order to increase the production of feed, it is very
important to improve the forage production technologies associated with cropland.
Developing multiple cropping systems for forage production and using barley and
wheat straw for livestock feed are the most promising options. The focus should be on
optimising the agricultural production structure, achieving sustainable increases in
productivity, improving the quality of agro- products, promoting the income
generating capability of agricultural production and conserving environment.
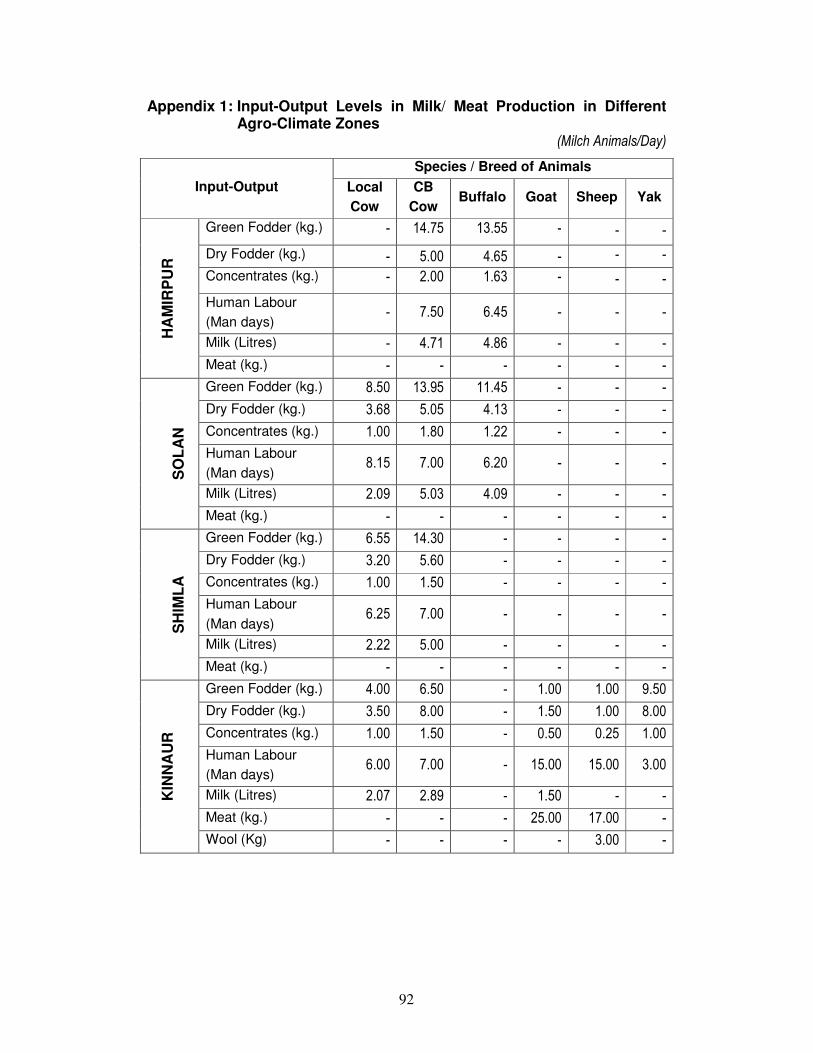
92
Appendix 1: Input-Output Levels in Milk/ Meat Production in Different Agro-Climate Zones
(Milch Animals/Day)
Input-Output
Species / Breed of Animals
Local
Cow
CB
Cow Buffalo Goat Sheep Yak
HA
MIR
PU
R
Green Fodder (kg.) - 14.75 13.55 - - -
Dry Fodder (kg.) - 5.00 4.65 - - -
Concentrates (kg.) - 2.00 1.63 - - -
Human Labour
(Man days) - 7.50 6.45 - - -
Milk (Litres) - 4.71 4.86 - - -
Meat (kg.) - - - - - -
SO
LA
N
Green Fodder (kg.) 8.50 13.95 11.45 - - -
Dry Fodder (kg.) 3.68 5.05 4.13 - - -
Concentrates (kg.) 1.00 1.80 1.22 - - -
Human Labour
(Man days) 8.15 7.00 6.20 - - -
Milk (Litres) 2.09 5.03 4.09 - - -
Meat (kg.) - - - - - -
SH
IML
A
Green Fodder (kg.) 6.55 14.30 - - - -
Dry Fodder (kg.) 3.20 5.60 - - - -
Concentrates (kg.) 1.00 1.50 - - - -
Human Labour
(Man days) 6.25 7.00 - - - -
Milk (Litres) 2.22 5.00 - - - -
Meat (kg.) - - - - - -
KIN
NA
UR
Green Fodder (kg.) 4.00 6.50 - 1.00 1.00 9.50
Dry Fodder (kg.) 3.50 8.00 - 1.50 1.00 8.00
Concentrates (kg.) 1.00 1.50 - 0.50 0.25 1.00
Human Labour
(Man days) 6.00 7.00 - 15.00 15.00 3.00
Milk (Litres) 2.07 2.89 - 1.50 - -
Meat (kg.) - - - 25.00 17.00 -
Wool (Kg) - - - - 3.00 -
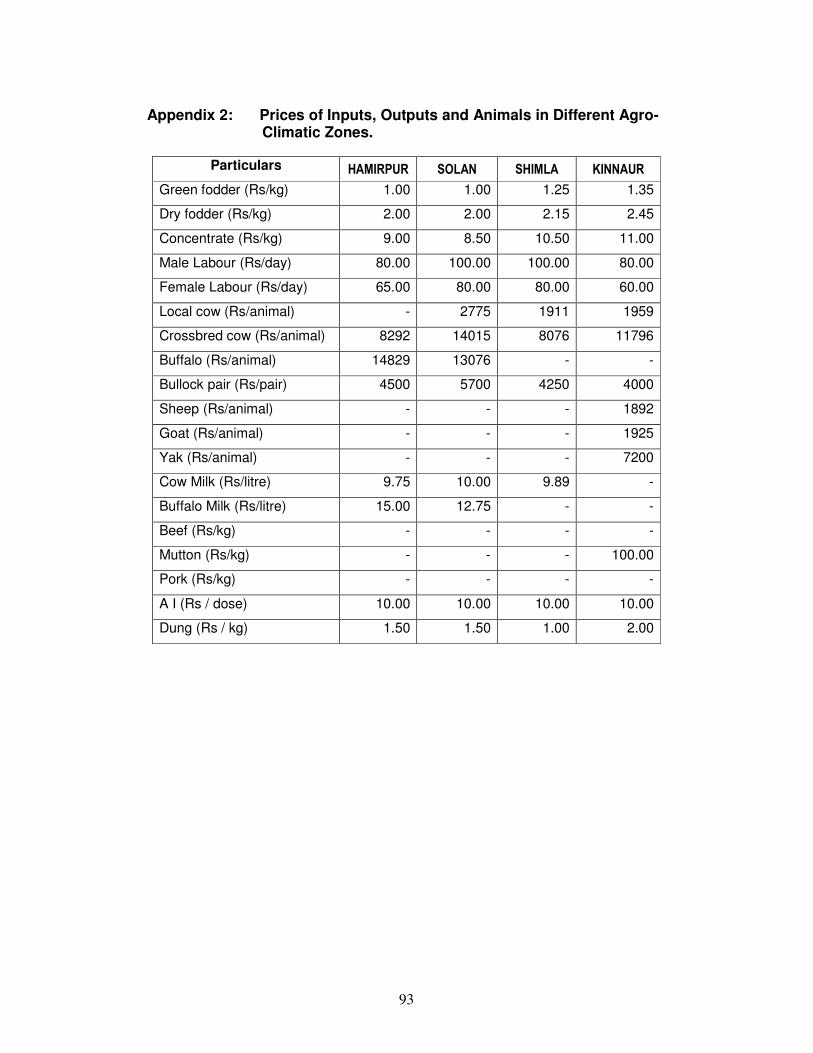
93
Appendix 2: Prices of Inputs, Outputs and Animals in Different Agro-
Climatic Zones.
Particulars HAMIRPUR SOLAN SHIMLA KINNAUR
Green fodder (Rs/kg) 1.00 1.00 1.25 1.35
Dry fodder (Rs/kg) 2.00 2.00 2.15 2.45
Concentrate (Rs/kg) 9.00 8.50 10.50 11.00
Male Labour (Rs/day) 80.00 100.00 100.00 80.00
Female Labour (Rs/day) 65.00 80.00 80.00 60.00
Local cow (Rs/animal) - 2775 1911 1959
Crossbred cow (Rs/animal) 8292 14015 8076 11796
Buffalo (Rs/animal) 14829 13076 - -
Bullock pair (Rs/pair) 4500 5700 4250 4000
Sheep (Rs/animal) - - - 1892
Goat (Rs/animal) - - - 1925
Yak (Rs/animal) - - - 7200
Cow Milk (Rs/litre) 9.75 10.00 9.89 -
Buffalo Milk (Rs/litre) 15.00 12.75 - -
Beef (Rs/kg) - - - -
Mutton (Rs/kg) - - - 100.00
Pork (Rs/kg) - - - -
A I (Rs / dose) 10.00 10.00 10.00 10.00
Dung (Rs / kg) 1.50 1.50 1.00 2.00