Embed Size (px)
Citation preview

ORI GIN AL ARTICLE
Rankings as coordination games: the Dutch Top 2000pop song ranking
Aloys Prinz1
Received: 2 July 2015 / Accepted: 29 February 2016 / Published online: 16 March 2016
� The Author(s) 2016. This article is published with open access at Springerlink.com
Abstract The Dutch Top 2000 pop song ranking has been broadcast each year
since 1999 between Christmas and New Year’s Eve. As a nationwide event, it
receives cult status in the Netherlands. In this paper, it is argued that rankings are
coordination games. To demonstrate this, statistical methods are applied, first to
analyze the extent to which competition prevails between pop songs. While con-
ventional charts collect pop song rankings on a commercial basis, the Top 2000
ranking is voted on once a year. Moreover, a very wide range of songs is allocated
to 2000 positions. The ranking displays tremendous stability among the top five
songs over the years and demonstrates the importance of superstardom. Moreover, a
detailed statistical analysis provides evidence that there is hardly any competition
among the most liked 100–150 songs. The empirical distribution of these songs
follows a Pareto distribution, whereas the songs up to rank 1500 are exponentially
distributed. These different distributions may be explained by two different voting
strategies, namely voting for the individually most liked songs and voting to
maximize the social value of the Top 2000 by taking account of the assumed
preferences of other voters. In this manner, superstardom acts as a coordination
device in a large-scale coordination game.
Keywords Pop charts � Superstars � Coordination games � Pareto distribution �Exponential distribution � Voting strategies
JEL Classification Z110
& Aloys Prinz
1 Institute of Public Economics, University of Munster, Wilmergasse 6-8, 48143 Munster,
Germany
123
J Cult Econ (2017) 41:379–401
DOI 10.1007/s10824-016-9272-y

1 Introduction
Nowadays, not only pop songs and books are ranked, but also countries,
universities, scientific journals, and even single scientists. There seems to be a
genuine public interest in knowing how other people rate almost everything. In
contrast, not so much is known of the meaning of rankings. In this paper, it is argued
that rankings are coordination games. The players in this game are people who want
to coordinate a social activity that has characteristics of both a private good and a
public good. The respective social activity may be a productive process, for
instance, scientific work, or a leisure event such as listening to pop music. The
private good of the activity may be individual status (in productive processes) or
simply personal enjoyment (in leisure events). However, the social activity also has
characteristics of a public good, as it requires many coordinated activities to be
productive or to be a fully enjoyable event. In leisure events, the good itself—the
‘‘event’’—is collectively provided by the participants themselves (see DeSerpa and
Faith 1996, who dubbed such goods ‘‘mob goods’’).
Rankings as such, and especially rankings as coordination games, raise two
related questions. Firstly, how stable and contestable are rankings? Superstars, for
instance, are those people or institutions who are at the top of rankings, in some
cases for a long time. Although there is an economic theory of superstardom (Rosen
1981; Adler 1985; MacDonald 1988), it neither is known whether the superstar
position is stable nor whether it is contestable. The second question is how these
rankings and their contestability can be explained.
To answer these questions, in this paper, the Top 2000 charts of the Dutch public
NPO Radio 2 (www.radio2.nl/top2000) are analyzed. This chart started in 1999 and
has become very popular until today. The chart is based on a voting by radio
listeners, i.e., it is not a ranking of songs according to commercial success. Rather, it
looks for the 2000 ‘‘most meaningful songs to our audience,’’ as pointed out by the
broadcaster (NPO Radio 2 2015a). The songs are ranked according to votes and are
broadcast (starting with position 2000) from Christmas Day to midnight on New
Year’s Eve. The Top 2000 is a big social event nationwide in the Netherlands.
The data of all rankings from 1999 to 2014 are available on the Web site of NPO
Radio 2 (2014). The song titles, the artists, and the year of song production are all
indicated. Almost the same dataset (i.e., the data without 2014) was analyzed
recently by Sterken (2014). Sterken’s main objective was to analyze the impact of
the year of song production on its ranking. The ‘‘loss of collective memory’’ effect
was juxtaposed with the ‘‘nostalgia’’ effect of pop songs. Additionally, Sterken
(2014) explained empirically the life span of songs by means of the respective
artists’ superstar status (The Beatles, The Rolling Stones, and several others are
present in the ranking with a large number of songs), the songs’ lengths and
language, as well as their debut rankings.
The dataset of the Top 2000 songs and their rankings over time are an unusual
source for studying the dynamics of popularity and success in popular music. Charts
and bestseller lists are normally very short (about ten to 100 ranks). Consequently,
they represent only a small fragment of the respective market, so that the
380 J Cult Econ (2017) 41:379–401
123

distribution of popularity and success can only be measured for the very top level. In
addition, charts measure mainly commercial success. In contrast to music charts and
bestseller lists, the Top 2000 event takes place annually, and the song rankings are
voted on by a large part of the Dutch population. Hence, the rankings represent a
much greater share of the popular music market. Moreover, song success in the Top
2000 charts is not commercially defined and motivated. Hence, this data basis
allows for a much broader analysis, both statistically and economically.
In this paper, the distribution of song success over all rankings, as well as the
underlying stochastic process, is studied. The first objective is to determine the
contestability of the song ranking. Although this issue is related to the topics studied
in Sterken (2014), the objective is nevertheless quite different. The second objective
of the paper is to provide a rationale for the distribution of the popularity of songs in
the Top 2000 charts. Since the database of these charts is large, the distribution of
song success can be analyzed thoroughly. Moreover, the statistical results constitute
a solid basis for economic interpretation. The result is that the Top 2000 ranking is
seen here as a coordination game of the Dutch population.
The remainder of the paper is structured as follows. In the second section, the
relevant literature on the distribution of success in the industry of popular music is
reviewed. Section 3 contains the descriptive statistics of the bilateral ranking
correlations for the years 1999–2014, as well as an analysis of the empirical
distribution of song success. In Sect. 4, the empirical results are discussed and
interpreted. Section 5 concludes.
2 Literature review
Besides the paper of Sterken (2014), there is an economics literature on success and
popularity in popular music. The industry is an integral part of modern culture.
According to Statista (2015), the global revenue of the music industry in 2012 was
US-$ 47.4 billion, of which US-$ 15.2 billion were generated in the USA [for the
economics of the music industry, see Burke (2011); an economic analysis of the
rock and roll industry is provided by Connolly and Krueger (2006); they also
discuss ranking methods].
The cultural aspect of songs is emphasized by the unpredictability of success
even by experts, the partial influence of ‘‘quality’’ on success, as well as the
inequality of success. In a study of Salganik et al. (2006), for instance, ‘‘quality’’
was measured by the ranking of songs by participants, but without any information
about the ranking decision of other participants. Haan et al. (2005) compare the
‘‘quality’’ judgment of experts with the judgment of the public opinion in the
national finals of the European Song Contest. Ginsburgh and Noury (2008) measure
‘‘quality’’ in the same contest by excluding votes of the same ‘‘voting bloc’’ via the
result of the contest. Ginsburgh (2003) compares ‘‘types of evidence’’ for ‘‘quality’’
measured with prizes awarded by experts, economic success, and long-term
reputation of the artwork (which is assumed as a key variable for aesthetic quality).
The success variable applied in this paper is similar to Ginsburgh’s long-term
J Cult Econ (2017) 41:379–401 381
123

reputation since success will be defined via the number and ranks of appearances in
the Top 2000 rankings over more than a decade.
A larger number of papers study the Eurovision Song Contest that started in 1955
and are still running each year. However, the main topic of these papers is whether
there exist voting blocs (see, e.g., Yair and Maman 1996; Fenn et al. 2006; Gatherer
2006; Spierdijk and Vellekoop 2009), friends, and foes (Garcıa and Tanase 2013,
who also measure cultural affinity among contest countries and vote polarization),
as well as if political considerations affect voting (among others, Ginsburgh and
Noury 2008). According to these studies, although voting blocs due to cultural
affinity and geographical proximity seem to exist (Ginsburgh and Noury 2008;
Spierdijk and Vellekoop 2009), evidence for political voting is rather mixed, but it
became probably more likely in the recent years of European crises (Garcıa and
Tanase 2013).
Apparently, songs can be divided into two categories only, ‘‘the best’’ and ‘‘the
rest’’ (Salganik et al. 2006). The latter means that the distribution of success is
highly concentrated on a small number of ‘‘hits.’’ Therefore, pop music can be
regarded as an excellent field for research on superstardom (for economic analyses
of superstars, see Rosen 1981, 1983; Adler 1985, 2006; MacDonald 1988; Schulze
2011).
Superstardom in popular music is a topic in Hamlen (1991; 1994). The superstar
hypothesis of Marshall (1947) and Rosen (1981)—small differences in talent
(‘‘quality’’) make a big difference in success—could not be confirmed by Hamlen
(1991). About 100 singers are analyzed, with the total value of record sales as the
measure of success. Although ‘‘voice quality’’ played a role in success, its estimated
coefficient was too small to confirm a superstar effect. Differentiating between the
market for ‘‘singles’’ (as an ‘‘entry-level quality’’; Hamlen 1994, p. 395) and
‘‘albums’’ did not change this result (Hamlen 1994). Chung and Cox (1994) took a
statistical approach to modeling the superstar phenomenon. They showed that a
stochastic model, applying the Yule distribution (Yule 1924; Simon 1955),
generates a distribution of success with a small number of winners. This model
was supported by music industry data for gold records of 1377 performers between
1958 and 1989 (Chung and Cox 1994, p. 773). The conclusion of Chung and Cox
was that superstardom could indeed exist without differences in talent.
Since the definition of ‘‘success’’ is crucial for the measurement of stardom, Giles
(2006) employs the number of weeks a number-one hit retains (not necessarily
consecutively) this spot as a measure of success. Data for 1955–2003 are used, with
more than 900 observations. As a second success measure, Giles applies the number
of number-one hits by artists. Only 245 artists (of a total number of 429 artists with
at least 13 recordings in the charts) gained number ones during the respective time
period. The result, however, was that the Yule distribution does not fit the data well
if number-one hits (in both versions) are taken as measures of success. In an earlier
study, Cook (1989) did not find statistically significant relationships between the
observed distribution of the Billboard Top 40 single chart artists and the Lotka
(1926) as well as the Bradford (1934) distribution.
Also, Fox and Kochanowski (2004) did not find a stochastic superstar effect for
single records that gained gold or even platinum (single) awards in the USA
382 J Cult Econ (2017) 41:379–401
123

between 1958 and 2001, when applying the Lotka (1926) and Yule (1924)
distribution to test for superstardom. The result changes if a so-called generalized
Lotka distribution is applied (Fox and Kochanowski 2004, pp. 516 ff.). The
application of ‘‘Lotka’s law’’ to analyzing the distribution of gold records, studied
by Cox et al. 1995, reached results that are very similar to those of Fox and
Kochanowski, as the ‘‘generalized Lotka law’’ provided a good fit. However, as
pointed out by Fox and Kochanowski, a major problem with stochastic approaches
is that they do not say anything about the underlying processes that generate the
statistical distribution (Fox and Kochanowski 2004, p. 518).
Popular music chart success in the UK (British album charts) for 1980–1993 was
studied by Strobl and Tucker (2000). The substantial skewness of all measures of
album success in the charts was, among others, also driven by the initial popularity
of the respective album. However, the Yule distribution was rejected as the
underlying stochastic process for success (Strobl and Tucker 2000, p. 124).
Although no dynamic process was studied, an analysis of the demand for top
popular music singles and albums in Japan provided empirical evidence of a highly
skewed cumulative share of singles and albums in the Top 100 charts in 2007 and
2008 (Asai 2011, p. 124).
Crain and Tollison (2002) present a model-based estimation of the concentration
of top artists in the popular music industry. The crucial notion is that stardom may
be a device for economizing on time that customers devote to seeking people with
similar music preferences (Crain and Tollison 2002, p. 4). Data from Billboard
Magazine on the top four and top five artists who were ranked number one are
employed. An artist concentration index was defined as the proportion of weeks of
the year that those artists were ranked number one. Customers’ average weekly
earnings are the key variable for determining the concentration index, because they
reflect customers’ time opportunity costs. As a result of the estimations, higher
earnings are Granger-causal for higher concentration values. Hence, the authors
conclude that time economizing for consumers is the driving force of stardom.
Taking account of incomplete consumer information, Hendricks and Sorensen
(2009) explain the skewed demand for popular music via a learning-based model.
Due to a lack of information about artists, a new album release of an artist that
becomes a hit causes a so-called backward spillover as sales of the artist’s old
albums increase permanently after the new album’s success. As a consequence, the
demand for popular music is far more skewed with incomplete than with complete
information.
The ‘‘lifetimes’’ of songs was statistically analyzed by Bradlow and Fader (2001).
To describe the lifetime of the Hot 100 Billboard songs, the authors assumed a
generalized gamma lifetime curve. An interesting result was that a popular song
falls quickly once it leaves the Top 40. Moreover, a 20-week life span separated
different exit patterns for songs, and the turnover of songs was not smooth (Bradlow
and Fader 2001, p. 378).
The stochastic dynamics of the music album lifecycle was studied by
Bhattacharjee et al. (2007). Due to the advent of file sharing and other such
processes, album time in the charts has shortened. However, albums that survive the
first few weeks fare much better afterward, staying longer in the charts.
J Cult Econ (2017) 41:379–401 383
123

To sum up, a number of studies emphasize the stochastic nature of success in the
popular music industry. However, the measure of success used is crucial, as the
results differ for different success measures. Moreover, although a number of
different candidate distributions were checked to describe the distribution of success
statistically, the results are ambiguous. Nevertheless, even if the stochastic nature of
pop song success is well established, the underlying economic process does not
seem to be well understood.
3 Empirical analysis
3.1 Descriptive data analysis
The Top 2000 charts have been broadcast by the Dutch public NPO Radio 2 each
year since 1999, between Christmas and New Year’s Eve (December 25–31). The
charts contain the ranking of 2000 pop songs, collected via a not entirely publicly
available voting mechanism (see Sterken 2014, and the sources given therein). The
songs are predominantly in English (83.5 %), but some have also been in Dutch
(9.9 %), French (1.6 %), Italian (0.9 %), German (0.7 %), Spanish (0.6 %), and
Portuguese (0.1 %) over the years (Sterken 2014, p. 6; Table 1; percentages
rounded here; note that the percentages are calculated without 2014).
Table 1 Number of songs by
artists and bands with the largest
number of songs in the Top 2000
(2014)
Source: http://www.radio2.nl/
nieuws/id-6066-top-2000-facts-
figures.html (Accessed Novem-
ber 05, 2015)
Artist 2014
The Beatles 41
The Rolling Stones 30
Queen 24
Michael Jackson 22
ABBA 21
U2 21
Bruce Springsteen 20
Coldplay 19
Fleetwood Mac 18
Bløf 16
De Dijk 15
David Bowie 15
Elvis Presley 14
Anouk 14
Dire Straits 13
Bee Gees 12
Creedence Clearwater Revival 12
Golden Earring 12
Ilse DeLange 12
Marco Borsato 12
384 J Cult Econ (2017) 41:379–401
123

The number of song voters grew from 150,000 in 1999 to 3.3 million in 2013
(Sterken 2014, p. 4) and 3.8 million in 2014 (http://www.radio2.nl/ebu/?page=t2k-
impact, Accessed November 05, 2015). That is, based on the Netherlands popula-
tion aged between 20 and 65 in 2009 (Statistics Netherlands 2015), this yields
participation rates of 1.5, 32.7, and 37.7 %, respectively. Hence, a substantial part of
the eligible Dutch population participated in the voting. However, according to a
statistical analysis for 2010 (Goris 2010), 62 % of the voters were men so that the
Top 2000 voting is male-dominated.
Figure 1 shows the age distribution of voters in 2010. It is bimodal, with the first
peak for the age group of 16–20 years and the second between 46 and 50 years
(Goris 2010). About 59.4 % of voters are aged between 41 and 60.
Between 1999 and 2008, voters could choose ten songs, from 2009 onwards they
could choose 15 (Sterken 2014, p. 5). The choice of songs was entirely open in 1999
and 2000, but restricted afterward. The restricted choice consists of the titles of the
1999 and 2000 polls, as well as of the record lists of NPO Radio 2 for the respective
year (Sterken 2014, p. 5). However, Sterken (2014, p. 5) claims that this did not
change the chart’s composition, according to NPO Radio 2.
In all 16 years of the Top 2000, a total of 3906 songs competed for the 2000
available ranks; i.e., the relationship of songs to ranks is 1.953. New songs are given
a chance to make it to the Top 2000 charts if they replace another song that is
already listed. Figure 2 shows the distribution of publication years of songs in the
pool of the Top 2000 songs.
The range of publication years starts in 1924, with George Gershwin’s
‘‘Rhapsody in Blue,’’ and ends for this analysis in 2014; the median publication
year is 1979, and the mean year is 1982 with a standard deviation of 14.62 years.
Figure 3 demonstrates that the publishing years of songs are not distributed
uniformly over the years; songs before the year 1960 and those published between
1970 and about 1990 are overrepresented. Taking account of the age structure of
voters in Fig. 1, the age of songs corresponds to some extent with voter age (see also
Sterken 2014).
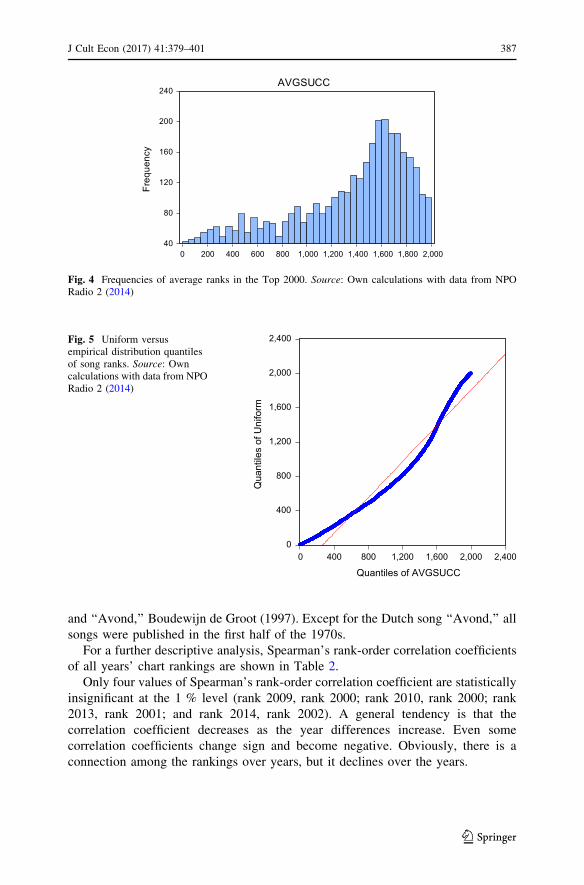
The frequencies of average song ranks (‘‘avgsucc’’) in the Top 2000 charts are
presented in Fig. 4.
02468
101214161820
up to15
16-20 21-25 26-30 31-35 36-40 41-45 46-50 51-55 56-60 61-65 66-70 71-75 over75
Age distribution of Top 2000 voters
Fig. 1 Age distribution Top 2000 voters (women and men). Source: Goris (2010), p. 39
J Cult Econ (2017) 41:379–401 385
123

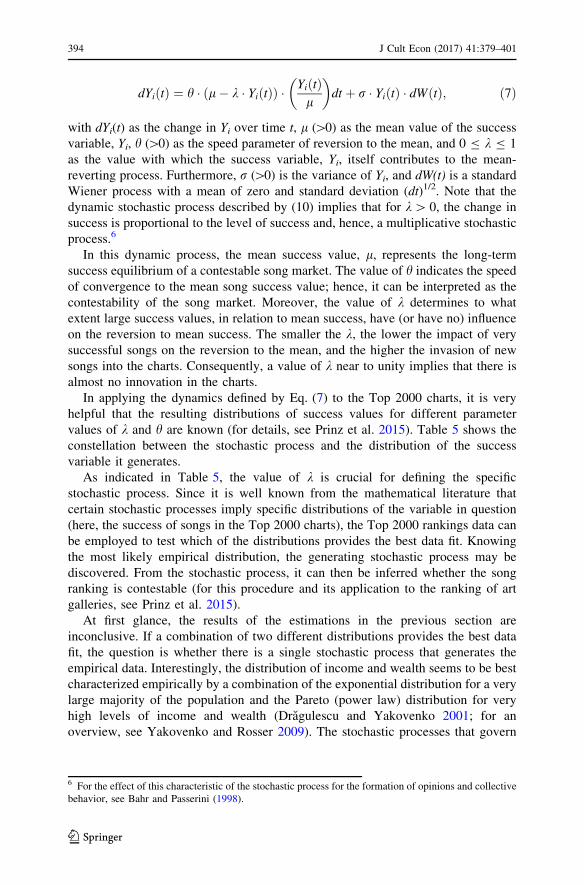
The median song rank is 1373 and the mean rank 1225, with a standard deviation
of 539.28 ranks. Figure 5 demonstrates that the distribution of ranks is not uniform
and that there are thick tails at the highest and lowest ranks.
A general tendency, already mentioned in the reviewed literature, is the
concentration of songs by artists in pop charts. This is also true for the Top 2000
(Table 1). In the Top 2000 of 2014, The Beatles, The Rolling Stones, and Queen are
those bands with the highest number of ranked songs.
Moreover, since 2004, the top 5 songs did not change; only their ranking varied.
These top 5 songs are (in the order of the Top 2000 ranking in 2014) as follows:
‘‘Hotel California,’’ The Eagles (1977); ‘‘Bohemian Rhapsody,’’ Queen (1975);
‘‘Stairway to Heaven,’’ Led Zeppelin (1971); ‘‘Child in Time,’’ Deep Purple (1972);
0
40
80
120
160
200
240
280
320
360
1,920 1,930 1,940 1,950 1,960 1,970 1,980 1,990 2,000 2,010 2,020
Freq
uenc
y
TITLE_YEAR
Fig. 2 Distribution of Top 2000 songs according to publication year. Source: Own calculations with datafrom NPO Radio 2 (2014)
0
400
800
1,200
1,600
2,000
2,400
1,920 1,940 1,960 1,980 2,000 2,020
Quantiles of TITLE_YEAR
Qua
ntile
s of
Uni
form
Fig. 3 Uniform versusempirical distribution quantilesof song publication years.Source: Own calculations withdata from NPO Radio 2 (2014)
386 J Cult Econ (2017) 41:379–401
123
and ‘‘Avond,’’ Boudewijn de Groot (1997). Except for the Dutch song ‘‘Avond,’’ all
songs were published in the first half of the 1970s.
For a further descriptive analysis, Spearman’s rank-order correlation coefficients
of all years’ chart rankings are shown in Table 2.
Only four values of Spearman’s rank-order correlation coefficient are statistically
insignificant at the 1 % level (rank 2009, rank 2000; rank 2010, rank 2000; rank
2013, rank 2001; and rank 2014, rank 2002). A general tendency is that the
correlation coefficient decreases as the year differences increase. Even some
correlation coefficients change sign and become negative. Obviously, there is a
connection among the rankings over years, but it declines over the years.
40
80
120
160
200
240
0 200 400 600 800 1,000 1,200 1,400 1,600 1,800 2,000
Freq
uenc
y
AVGSUCC
Fig. 4 Frequencies of average ranks in the Top 2000. Source: Own calculations with data from NPORadio 2 (2014)
0
400
800
1,200
1,600
2,000
2,400
0 400 800 1,200 1,600 2,000 2,400
Quantiles of AVGSUCC
Qua
ntile
s of
Uni
form
Fig. 5 Uniform versusempirical distribution quantilesof song ranks. Source: Owncalculations with data from NPORadio 2 (2014)
J Cult Econ (2017) 41:379–401 387
123

3.2 Distribution of song success
In order to analyze the distribution of song success, its measurement must be
defined. As shown by Simkin and Roychowdhury (2013) with empirical data, the
logarithm of ‘‘fame’’ seems to be an adequate measure of ‘‘achievement’’ (see also
the ‘‘Celebrity Index’’ in Lamport 2006). Therefore, the following definition is
employed for the analysis in this paper:
Xi ¼ log #Rankij [ 0� �
�X#Rankij [ 0
j¼1
Rankij
!�10
@
1
A
2
4
3
5þ C; j ¼ year,
j ¼ 1999; . . .; 2014:
ð1Þ
The success of song i, Xi, is the natural logarithm of the mean rank the song
occupied in all the years it had a rank greater than zero, i.e., the number of years it
was ranked in the Top 2000 charts. Moreover, a constant C = 7.7 is added to obtain
success values that start only at about zero (this means that the success of the song
ranked 2000 is about zero). The distribution of the success values, calculated via
Eq. (1), is shown in Fig. 6.
The question is as follows: Which distribution function does the distribution of
song success, as depicted in Fig. 6, fit best? As a first step in finding this out,
Table 2 Spearman’s rank-order correlation coefficients of all songs for all years
RANK1999
RANK2000
RANK2001
RANK2002
RANK2003
RANK2004
RANK2005
RANK2006
RANK2007
RANK2008
RANK2009
RANK2010
RANK2011
RANK2012
RANK2013
RANK2014
RANK1999 1.00RANK2000 0.24 1.00RANK2001 0.43 0.39 1.00RANK2002 0.38 0.37 0.65 1.00RANK2003 0.31 0.31 0.57 0.70 1.00RANK2004 0.28 0.29 0.56 0.70 0.79 1.00RANK2005 0.20 0.20 0.47 0.59 0.67 0.74 1.00RANK2006 0.13 0.16 0.38 0.52 0.61 0.68 0.78 1.00RANK2007 0.06 0.08 0.29 0.41 0.48 0.53 0.64 0.73 1.00RANK2008 0.10 0.13 0.35 0.50 0.59 0.66 0.79 0.88 0.77 1.00RANK2009 -0.08 -0.03* 0.13 0.22 0.30 0.33 0.44 0.52 0.56 0.54 1.00RANK2010 -0.05 0.01* 0.19 0.27 0.36 0.39 0.49 0.57 0.61 0.59 0.79 1.00RANK2011 -0.14 -0.08 0.07 0.14 0.22 0.25 0.35 0.43 0.50 0.45 0.73 0.74 1.00RANK2012 -0.16 -0.10 0.04 0.11 0.17 0.21 0.28 0.36 0.41 0.37 0.59 0.59 0.71 1.00RANK2013 -0.19 -0.12 -0.00* 0.06 0.13 0.15 0.24 0.31 0.38 0.33 0.55 0.57 0.69 0.79 1.00RANK2014 -0.23 -0.18 -0.07 -0.01* 0.05 0.07 0.14 0.20 0.27 0.22 0.42 0.43 0.54 0.61 0.71 1.00
Values with an asterisk * are not statistically significant at the 1 % level
Source: Own calculations with data from NPO Radio 2 (2014)
388 J Cult Econ (2017) 41:379–401
123

Q–Q plots are generated.1 In these plots, the success variable’s quantiles of the
empirical distribution are juxtaposed against the respective quantiles of the
theoretical distribution that is tested. EViews estimates the parameters of
the theoretical distribution via maximum likelihood estimations. In Fig. 7, the
Q–Q plots for the theoretical exponential distribution are presented (for a statistical
analysis of popularity, see Pan and Sinha 2010).2
The figure indicates that the exponential distribution fits the empirical
distribution of the success variable well up to a point. For major success, the fit
of the exponential distribution is not good. The fit of the other distributions
mentioned in footnote 2 is also not good. Nonparametric tests of the respective
distributions against the empirical distribution confirm that the respective null
hypotheses (i.e., the empirical distribution is an exponential, Pareto, Weibull,
gamma, or lognormal distribution) are altogether rejected.
However, the distribution histogram of the success variable seemingly hints at a
sort of extreme distribution. According to the econophysics concept of ‘‘preferential
attachment’’ (see, e.g., Newman 2010, chapters 14.1–14.4, pp. 487 ff.), the data
might follow a power law distribution. To test this, the estimation method of Gabaix
and Ibragimov (2011) is applied. The equation of estimation is then given by:
log i � 0:5ð Þ ¼ a þ b � Xi; ð2Þ
with i as rank and a, b as estimation coefficients of the Pareto (power law) distri-
bution.3 The results of the OLS estimation with ‘‘White heteroskedasticity-consis-
tent standard errors and covariance’’ are shown in Table 3.4
0
200
400
600
800
1,000
1,200
1,400
0 1 2 3 4 5 6 7
Series: SUCCESSSample 1 3906Observations 3906
Mean 0.779680Median 0.475083Maximum 7.528150Minimum 0.099598Std. Dev. 0.785728Skewness 2.429862Kurtosis 11.23484
Jarque-Bera 14880.16Probability 0.000000
Fig. 6 Histogram of song success values. Source: Own calculation with data from NPO Radio 2 (2014).
1 The plots are produced with the econometric software package EViews 8.2 Q–Q plots of the Pareto, Weibull, gamma, and lognormal distribution (not presented) were also tested,
but did not produce better results.3 Note that the standard error of the estimated power law coefficient b is asymptotically (2/N)1/2b (Gabaix
and Ibragimov 2011).4 It is worth emphasizing that the estimation of the power law coefficient is a descriptive statistic.
Therefore, the adjusted R-squared value must be interpreted very cautiously. The reason is that the
J Cult Econ (2017) 41:379–401 389
123

Although the estimation seems to fit the data well, a look at the residuals reveals
that there is a systematic deviation of the fitted from the actual data. Moreover, tests
of the stability of the estimated coefficients (CUSUM test) in Fig. 8 show that they
are not sufficiently stable (at the 5 % level).
To check this more thoroughly, the dataset is split into increasing rank groups.
Starting with the ranks up to rank 50, the next group encompasses those up to rank
100, and so on. In each case, the null hypothesis that the data follow a Pareto
distribution (an exponential distribution) is tested. The detailed results are shown in
Table 4. Up to about rank 100, the hypothesis of a Pareto (power law) distribution is
not rejected (Cramer–Mises test). The most promising alternative hypothesis, that
the data follow an exponential distribution, is also tested, and clearly, this
distribution fits the data well up to rank 1500; the hypothesis is not rejected
(Cramer–Mises test). However, the best fit of the exponential distribution is between
the ranks of 100 and 1500.
The conclusion of these tests is as follows:
1. For the first 50 ranks, the Pareto distribution seems to be the appropriate
distribution function.
2. For the ranks between 50 and about 1500, the exponential distribution gives the
best fit.
These results lead to the question of whether it is possible to find a combination
of the Pareto (power law) and exponential distributions that may fit the data even
0
1
2
3
4
5
6
7
0 1 2 3 4 5 6 7 8
Quantiles of SUCCESS
Qua
ntile
s of
Exp
onen
tial
(a=0
.099
6, m
u=0.
6801
)
Fig. 7 Q–Q plot for theexponential distribution:
f xja;muð Þ ¼ 1mu e�
x�amuð Þ. Source:
Own calculation with data fromNPO Radio 2 (2014)
Footnote 4 continued
measure of success is serially correlated; however, since success is defined via the autocorrelation of
positions in subsequent rankings, this correlation cannot be eliminated for the estimation of the form of
the success distribution function.
390 J Cult Econ (2017) 41:379–401
123

better. Meerschaert et al. (2012) proposed the ‘‘tempered power law distributions’’
for so-called ‘‘semi-heavy tailed distributions’’ (p. 1839). The distribution, with x as
song success, is defined as (Meerschaert et al. 2012, p. 1841):
f xð Þ ¼ c � xa � e�bx; ð3Þ
which can be written in logarithmic form as follows:
log f xð Þ ¼ log cþ a � log x � bx: ð4Þ
The OLS estimation equation reads:
log Rankð Þ ¼ c 1ð Þ þ c 2ð Þ � log x � c 3ð Þ � x�1: ð5Þ
The coefficients of estimation are as follows: c(1) = 7.017, c(2) = -1.8138, and
c(3) = 0.3433; all coefficients are statistically significant at the 1 % level; the
adjusted R-squared value is 0.9505. The residuals of the estimation are depicted in
Fig. 9.
The CUSUM stability test of the estimated coefficients, depicted in Fig. 10,
shows that they are stable up to about rank 3000. The adjusted R-squared value of
Table 3 Power law coefficients, all data
Variable Coefficient Standard error Prob.
A 8.2564*** 0.0038 0.0000
B -1.2647*** 0.0049 0.0000
Adjusted R2 0.9888
***, **, * Statistically significant at the 1, 5, and 10 % level, respectively
-400
0
400
800
1,200
1,600
2,000
2,400
500 1000 1500 2000 2500 3000 3500
CUSUM 5% Significance
Fig. 8 CUSUM stability test for the power law estimation
J Cult Econ (2017) 41:379–401 391
123

the power law estimation is also slightly higher than that of the tempered power law
estimation, and the CUSUM test implies a higher stability for the latter.
Hence, the distribution of song success in the Dutch Top 2000 charts seems to
follow a power law tail, combined with an exponential tempering.
The results presented here are similar to those of Chung and Cox (1994); they
also found a stochastic superstar effect in their analysis, but for a different success
Table 4 Test of Pareto and exponential distribution functions
Rank Pareto
distribution
Cramer–Mises
probability
Exponential
distribution
Cramer–Mises
probability
\51 K = 3.5871
A = 5.0851
0.2078 A = 4.9196
MU = 0.8461
0.0878
\101 K = 2.9865
A = 4.2843
0.0784 A = 3.5871
MU = 0.8459
0.5431
\151 K = 2.6390
A = 3.9062
0.0443 A = 2.9865
MU = 0.8613
0.8346
\501 K = 1.5650
A = 2.5261
0.0000 A = 1.5650
MU = 0.8794
0.9544
\1001 K = 0.9585
A = 1.7635
0.0000 A = 0.9585
MU = 0.8840
0.5675
\1501 A = 0.6462
MU = 0.8473
0.1611
\2001 A = 0.4635
MU = 0.7936
0.0000
Pareto distribution: K and A are parameter of the function: f xjA;Kð Þ ¼ A � KAð Þ=xAþ1. Exponential dis-
tribution: A: parameter of this distribution, MU: mean of the function f xjA;MUð Þ ¼ 1
MU e�x�AMUð Þ. These
distributions are implemented in EViews 8.
-4
-3
-2
-1
0
1
0
2
4
6
8
10
3906
3756
3606
3456
3306
3156
3006
2856
2706
2556
2406
2256
2106
1956
1806
1656
1506
1356
1206
1056
906
756
606
456
306
156 6
Residual Actual Fitted
Fig. 9 Residuals of the tempered power law estimation
392 J Cult Econ (2017) 41:379–401
123

measure. The paper of Fox and Kochanowski (2004)—that could not find
unambiguous evidence for stochastic superstardom—is not directly comparable
with this paper since the authors applied the number of gold and platinum records as
a success measure. Since the measure applied in this paper resembles more that of
Giles (2006), the result of this paper is comparable to the latter. Giles could not find
superstardom when analyzing the life lengths of number-one hits in the Billboard
Hot 100 chart. In contrast, in the Top 2000 charts, a superstar effect is present, with
the top five songs at least.
4 Interpretation of the empirical results
According to Prinz et al. (2015), let Yi ¼ 1Xi
be the success measure of a pop song in
the Top 2000 charts for song i, i = 1, … N, such that i is also the rank of the song:5
Y1 [ Y2 � � � [ YN : ð6Þ
Song success can be modeled as a dynamic stochastic process in which
competition between songs for listeners’ votes plays a crucial role. If the songs were
equally contestable, there would be a strong so-called reversion to the mean effect
that sets a limit to song success. As a consequence, a large number of songs should
in fact be represented in the rankings over time, with no extremely long presence of
songs at the top positions of the ranking.
A general mean-reverting stochastic process that represents the dynamics of song
success can be written formally as (Prinz et al. 2015):
-1,400
-1,200
-1,000
-800
-600
-400
-200
0
200
500 1000 1500 2000 2500 3000 3500
CUSUM 5% Significance
Fig. 10 CUSUM stability test for the tempered power law estimation
5 This kind of formalization and the following stochastic analysis closely follows Prinz et al. (2015),
Sect. 4.
J Cult Econ (2017) 41:379–401 393
123
dYi tð Þ ¼ h � l� k � Yi tð Þð Þ � Yi tð Þl
� �dt þ r � Yi tð Þ � dW tð Þ; ð7Þ
with dYi(t) as the change in Yi over time t, l ([0) as the mean value of the success
variable, Yi, h ([0) as the speed parameter of reversion to the mean, and 0 B k B 1
as the value with which the success variable, Yi, itself contributes to the mean-
reverting process. Furthermore, r ([0) is the variance of Yi, and dW(t) is a standard
Wiener process with a mean of zero and standard deviation (dt)1/2. Note that the
dynamic stochastic process described by (10) implies that for k[ 0, the change in
success is proportional to the level of success and, hence, a multiplicative stochastic
process.6
In this dynamic process, the mean success value, l, represents the long-term
success equilibrium of a contestable song market. The value of h indicates the speed
of convergence to the mean song success value; hence, it can be interpreted as the
contestability of the song market. Moreover, the value of k determines to what
extent large success values, in relation to mean success, have (or have no) influence
on the reversion to mean success. The smaller the k, the lower the impact of very
successful songs on the reversion to the mean, and the higher the invasion of new
songs into the charts. Consequently, a value of k near to unity implies that there is
almost no innovation in the charts.
In applying the dynamics defined by Eq. (7) to the Top 2000 charts, it is very
helpful that the resulting distributions of success values for different parameter
values of k and h are known (for details, see Prinz et al. 2015). Table 5 shows the
constellation between the stochastic process and the distribution of the success
variable it generates.
As indicated in Table 5, the value of k is crucial for defining the specific
stochastic process. Since it is well known from the mathematical literature that
certain stochastic processes imply specific distributions of the variable in question
(here, the success of songs in the Top 2000 charts), the Top 2000 rankings data can
be employed to test which of the distributions provides the best data fit. Knowing
the most likely empirical distribution, the generating stochastic process may be
discovered. From the stochastic process, it can then be inferred whether the song
ranking is contestable (for this procedure and its application to the ranking of art
galleries, see Prinz et al. 2015).
At first glance, the results of the estimations in the previous section are
inconclusive. If a combination of two different distributions provides the best data
fit, the question is whether there is a single stochastic process that generates the
empirical data. Interestingly, the distribution of income and wealth seems to be best
characterized empirically by a combination of the exponential distribution for a very
large majority of the population and the Pareto (power law) distribution for very
high levels of income and wealth (Dragulescu and Yakovenko 2001; for an
overview, see Yakovenko and Rosser 2009). The stochastic processes that govern
6 For the effect of this characteristic of the stochastic process for the formation of opinions and collective
behavior, see Bahr and Passerini (1998).
394 J Cult Econ (2017) 41:379–401
123

the distribution of income and wealth, as well as the success of pop songs in the Top
2000 contest, seem to be very similar.
The reason for this similarity might be purely accidental; however, the
distribution of income and wealth, as well as the success of popular music (and
other forms of artwork), is the result of a combination of talent, performance, and
luck. To become very rich, as well as to get to the top of the charts, involves many
successful steps in-between, each of them very unstable (see Prinz 2015). Such a
process implies that ‘‘success breeds success’’, as success in the next step is
proportional to success of the previous step. Formally, such processes are best
described by multiplicative stochastic processes (see Bahr and Passerini 1998;
Yakovenko and Rosser 2009). They imply very often skewed distribution of the
success variable, i.e., a lognormal or a power law distribution (see Prinz et al. 2015).
Moreover, what separates ‘‘the best’’ from ‘‘the rest’’ may be that the chain of
successful steps is much shorter in case of the latter.
As mentioned by Fox and Kochanowski (2004, p. 518), similar stochastic
processes do generally not explain the rationale behind these processes. For the Top
2000 charts, however, there is an economic interpretation of the stochastic process.
Leaving aside the economics of the empirical distribution of income and wealth, it
will be argued below that there are indeed two processes with respect to the ranking
of pop songs. There is a very slow process with very little innovation among the top
100 songs and a much more innovative process at the lower and lowest ranks. Put
technically, in the top ranks, the innovation factor k (see Eq. 7 above) is close to
zero, whereas it is significantly higher in the lower the ranks. Hence, the top ranked
songs are not contestable, in sharp contrast to the remaining songs. With about 50
incontestable songs (2.5 % of songs), a very large majority of songs (97.5 % of
songs) compete heavily with each other.
As argued by Prinz et al. (2015), an economic rationale for such a small number
of incontestable items as, for instance, artworks and pop songs entails incomplete
consumer information about the aesthetic value of cultural goods. As soon as a
small number of highly respected institutions are established that define aesthetic
value—as in the cases of art galleries and top museums—no further institutions are
required. Put differently, a highly variable or very large number of such institutions
would cause insecurity to return concerning the aesthetic value of cultural items and
hence lead to incomplete information. These institutions define the quality of
Table 5 Stochastic processes and their distribution functions
Stochastic process Distribution of Yi
Geometric Brownian motion (k = 0, l = h) Lognormal distribution (with mean = h)
Mean-reverting geometric Ornstein–Uhlenbeck process
(0\ k B 1)
For 2 h[r2: Gamma distributiona
Inhomogeneous geometric Brownian motion (k = 1) Pareto distribution (also called power law
distribution)
Source: Compiled from Prinz et al. (2015)a Note that the exponential distribution (also applied to the data) is a special case of the gamma
distribution
J Cult Econ (2017) 41:379–401 395
123

cultural goods. As a consequence, the number of top artists, paintings, etc., will be
very limited, because they represent the highest quality standards for the respective
goods. Nonetheless, competition between artworks, as well as standard-setting
institutions, will remain—but not at the top level. Therefore, a small number of
standard-setting institutions, as well as artworks, will be incontestable. The large
number of institutions and artworks, however, will continue to compete with each
other for art lovers and customers.
However, this explanation of the divided nature of pop song rankings is
incomplete. Social institutions emerge because they have a function for society
(Parsons 1951; Merton 1957; Luhmann 1995, 2000). The function of pop music is
described by Wilfred Dolfsma: ‘‘By consuming pop music, people want to express
who they are, to which group they belong, what their identity is’’ (Dolfsma 1999,
p. 1019). According to the host radio station, the Top 2000 charts reach about three
quarters of the Dutch population each year. It is broadcast between Christmas and
New Year’s Eve, because at this time of the year, people tend to spend their time in
groups (NPO Radio 2 2015a, b). ‘‘The chart connects generations but it also unites
music genres (…) For that reason, the Top 2000 connects a wide range of music
lovers’’ (NPO Radio 2 2015b).
To fulfill this task successfully, the Top 2000 charts can be considered
economically as a coordination game. To be enjoyed by a large part of the Dutch
population between Christmas and New Year’s Eve, the Top 2000 pop songs have
to be truly very popular. To formalize the decision problem of a voter, assume that
they gain utility not only form listening to their individually preferred, highly
ranked songs, songsi, but also from the number of other people who very much like
to listen to these songs, #p(songsi):
ui songsi;#p songsið Þð Þ; oui
osongi
[ 0;oui
o#p
o#p
osongsi
[ 0: ð8Þ
The first utility component is individual, and the second is social (see for ‘‘social
preferences’’ Bowles and Gintis 2011, chapter 3). Note that the second utility
component is defined via the utility that the songs provide others than person i, since
otherwise, they would not want to listen to these songs. A plausible specification of
the utility of songs could be (see, for instance, Dybvig and Spatt 1983, p. 233, in a
different context):
ui songsi;#p songsið Þð Þ ¼ #p songsið Þ � ui songsið Þ: ð9Þ
This specification states that the individual utility gained from the songs is
proportional to the number of other people who also like them most.
Obviously, choosing songs to maximize utility in Eqs. (8) or (9) requires a
guessing of the most preferred songs in a specific country. These songs provide a
‘‘focal point’’ (Schelling 1960, p. 57) as a form of ‘‘tacit coordination’’ (Schelling
1960, p. 54) for the individual voting decision, if it is socially motivated in the sense
defined above.7
7 The neural basis for focal points in coordination games is studied in McMillan et al. (2011).
396 J Cult Econ (2017) 41:379–401
123

Since conventions (Young 1996) and culture specifics (Jackson and Xing 2014;
Molleman et al. 2013), as well as networks (Tomassini and Pestelacci 2010) and
tradition (Bentley and Omerod 2009; Golosovsky and Solomon 2013), play a
fundamental role in coordination games, the relevant songs tend to be rather older
ones and so-called evergreens, and songs in the country’s own language, i.e., in
Dutch for the Top 2000. Since the number of these songs is restricted, as well as the
number of votes a person has, these songs are likely to collect a huge proportion of
all votes. As shown above, the top ranks are almost fixed in advance. This
concentration of votes on a small number of extremely well-known songs as a
cultural focal point may explain the fat8 Pareto or power law tail of the song success
distribution.
In contrast, since each voter in the Top 2000 has 10 or 15 votes (depending on the
year), there is also leeway for expressing one’s own song preferences. Because this
voting is unconditional, the whole range of available songs provides the basis for
individual selection. The result is far fewer votes for these songs, and a very large
spectrum. Hence, individual idiosyncratic preferences may explain the long tail of
the song success distribution that follows an exponential distribution.9
As a result, ‘‘nostalgia,’’ ‘‘evergreens’’ (Sterken), ‘‘focal points’’ (Schelling),
‘‘memory’’ (Dall’ Asta L. and Castellano 2007), and ‘‘superstardom’’ (Rosen 1981;
Adler 1985; MacDonald 1988) may have the same social function, namely to
coordinate the social preferences of people in large coordination games.
Additionally, the host radio station of the Top 2000, NPO Radio 2, took over the
role of a coordinator, when it introduced the Top 2000 in 1999. It created a channel
for coordinating pop music preferences at a time of the year when people in Western
societies are most susceptible to group-feelings. ‘‘Whatever memories they are built
on: Music carries meaning and songs tell the stories of our lives. The Top 2000 is
compiled of thousands of these stories’’ (NPO Radio 2 2015a, b). By allowing
people to choose a large number of songs quite freely, it contributed to a so-called
the maximal Nash, i.e., to an equilibrium of the coordination game that dominates
all other Nash equilibria for all people (Dybvig and Spatt 1983, p. 234).
5 Conclusion
In this paper, rankings are interpreted as results of coordination games. To
demonstrate this, the annual Dutch Top 2000 charts are analyzed both statistically
and econometrically. The first objective is to find out whether there is a superstar
effect and to what extent the song ranking is contestable. To check this, a test is
conducted to determine what probability distribution fits best the success of songs in
the Top 2000. Knowing the probability distribution, the data-generating stochastic
process could be determined. Finally, the parameters of the stochastic process are
8 For the differentiation of ‘‘fat’’ and ‘‘thin’’ tails of distributions, see Sornette (2000, p. 138).9 See Vilone et al. (2012) for an analysis of the dynamics of social and strategic imitation in an
econophysics model. The resulting distribution converges either to an exponential or to a power law tail,
depending on the imitation. An evolutionary process of social preferences for music in a sociophysics
voter model is developed in Lanoue (2015).
J Cult Econ (2017) 41:379–401 397
123
interpreted economically with respect to competition between the songs and the
innovation level within the rankings. These results are employed to find out what
such rankings are good for. It is argued that these rankings perform a social function
of coordinating people in large groups.
The empirical result is that song success in the Top 2000 charts cannot be
described by a single empirical distribution, but by two. The top 100–150 ranks
follow a Pareto distribution, whereas the songs up to rank 1500 are best fitted by an
exponential distribution. Consequently, if one wants to describe the empirical
distribution of song success by a single distribution, an exponentially tempered
power law (Pareto) distribution seems to be appropriate.
Because of the Pareto distributed song success variable, the underlying stochastic
process for the top 100–150 songs is an inhomogeneous geometric Brownian
motion. This stochastic process implies almost no change of the ranks and, hence, a
very low degree of song contestability. Technically, the innovation factor is close to
zero in the top 10 ranks, whereas it is increasing with the position in the rankings.
Quantitatively, about 50 songs or 2.5 % are incontestable. This is different for the
lower ranks, where song success follows an exponential distribution. For these
ranks, songs are much more contestable, and the level of musical innovation is
considerable higher. This means that about 97.5 % of the remaining ranks are highly
competitive.
Since the ranking in the Top 2000 is based on voting, the question arises as to
what kind of voting strategies may generate the respective song rankings. Because
of the empirical distribution, a pure random walk can be excluded. Instead, voters
are confronted with a typical ‘‘beauty contest’’ (Keynes 1936, p. 156), that is, with a
coordination game. Although voters have their own song preferences, in order to get
the most enjoyment from listening to the Top 2000 radio broadcasting, they
nonetheless want a large number of equally minded listeners. As a consequence,
voters have to choose which of these two strategies (or a combination) they would
like to apply. The top ranks are then the result of a coordination game in which
evergreens, nostalgia, and superstardom play a coordinative role. The remaining
ranks, however, can be interpreted as the result of voting according to individual
preferences.
As indicated empirically by a study with data of the Eurovision Song Contest,
data from this contest can be employed as predictors of trade relations between
countries (Kokko and Tingvali 2012). Therefore, different incomes and preferences,
as well as cultural affinity, may even be captured by single supranational cultural
events. In effect, it demonstrates the close relation between culture and the economy
as a whole. Put differently, the economy may be considered as a part of culture.
There is another aspect worth noting. The Top 2000 charts are a nonprofit
cultural event, in contrast to other cultural goods as, for instance, books, movies,
commercial charts, and sports. The Dutch Top 2000 voting is one of those events
that provide evidence for very similar social processes with both for-profit and
nonprofit culture goods. As pointed out in The Economist (N. N. 2009), modern
technology did not end block busters in the profit-based culture economy, but to the
contrary, block busters are currently more important than ever. In addition,
however, also the number of culture businesses, as well as competition between and
398 J Cult Econ (2017) 41:379–401
123

innovation within culture businesses, did not decline (N. N. 2009). This
development is mirrored in the nonprofit sector of culture, as the Top 2000 charts
demonstrate. Voting by approval and by economic demand seems to follow
common principles in the case of culture goods.
Last, but not least, the methods applied here to the Top 2000 songs may also be
used to analyze other rankings, ranging from scientific journals to universities and
scientists. The hypothesis is that all forms of rankings are coordination tools in
large-scale coordination games.
Acknowledgments I thank three referees for their comments and suggestions on earlier versions of this
paper, as well as Brian Bloch for extensive text editing. However, all remaining errors are mine.
Compliance with ethical standards
Conflict of interest The author declares that he has no conflict of interest.
Open Access This article is distributed under the terms of the Creative Commons Attribution 4.0
International License (http://creativecommons.org/licenses/by/4.0/), which permits unrestricted use, dis-
tribution, and reproduction in any medium, provided you give appropriate credit to the original
author(s) and the source, provide a link to the Creative Commons license, and indicate if changes were
made.
References
Adler, M. (1985). Stardom and talent. American Economic Review, 75, 208–212.
Adler, M. (2006). Stardom and talent. In V. Ginsburgh & D. Thorsby (Eds.), Handbook of the economics
of art and culture (pp. 895–906). Amsterdam: North-Holland.
Asai, S. (2011). Demand analysis of hit music in Japan. Journal of Cultural Economics, 35, 101–117.
Bahr, D. B., & Passerini, E. (1998). Statistical mechanics of opinion formation and collective behavior:
Micro-sociology. Journal of Mathematical Sociology, 23(1), 1–27.
Bentley, R. A., & Omerod, P. (2009). Tradition versus fashion in consumer choice. arXiv:0902.2976v1
[physics.soc-ph].
Bhattacharjee, S., Gopal, R. D., Lertwachara, K., & Marsden, J. R. (2007). Stochastic dynamics of music
album lifecycle: An analysis of the new market landscape. International Journal of Human–
Computer Studies, 65(1), 85–93.
Bowles, S., & Gintis, H. (2011). A cooperative species. Princeton and Oxford: Princeton University Press.
Bradford, S. (1934/1985). Sources of information on specific subjects. Engineering, 137, 85–86 (reprinted
in: Journal of Information Science, 10, 176–180).
Bradlow, E. T., & Fader, P. S. (2001). A Bayesian lifetime model for the ‘‘Hot 100’’ Billboard songs.
Journal of the American Statistical Association, 96, 368–381.
Burke, A. E. (2011). The music industry. In R. Towse (Ed.), A handbook of cultural economics (2nd ed.,
pp. 297–303). Cheltenham; Northampton, MA: Edward Elgar.
Chung, K. H., & Cox, R. A. K. (1994). A stochastic model of superstardom: An application of the Yule
distribution. Review of Economics and Statistics, 76(4), 771–775.
Connolly, M., & Krueger, A. B. (2006). Rockonomics: The economics of popular music. In V.
A. Ginsburgh & D. Throsby (Eds.), Handbook of the economics of art and culture (Vol. 1,
pp. 668–718). Amsterdam: Elsevier.
Cook, K. L. (1989). Laws of scattering applied to popular music. Journal of the American Society for
Information Science, 40(2), 277–283.
Cox, R. A. K., Felton, J. M., & Chung, K. H. (1995). The concentration of commercial success in popular
music: An analysis of the distribution of gold records. Journal of Cultural Economics, 19, 333–340.
Crain, W. M., & Tollison, R. D. (2002). Consumer choice and the popular music industry: A test of the
superstar theory. Empirica, 29, 1–9.
J Cult Econ (2017) 41:379–401 399
123

Dall’ Asta, L., & Castellano, C. (2007). Effective surface-tension in the noise-reduced voter model.
European Physics Letters, 77, 60005.
DeSerpa, A. C., & Faith, R. L. (1996). ‘‘Bru-u-u-uce’’: The simple economics of mob goods. Public
Choice, 89, 77–91.
Dolfsma, W. (1999). The consumption of music and the Expression of VALUES: A social economic
explanation for the advent of pop music. American Journal of Economics and Sociology, 58(4),
1019–1046.
Dragulescu, A., & Yakovenko, V. M. (2001). Exponential and power-law probability distributions of
wealth and income in the United Kingdom and the United States. Physica A, 299, 213–221.
Dybvig, P. H., & Spatt, C. S. (1983). Adoption externalities as public goods. Journal of Public
Economics, 20, 231–247.
Fenn, D., Suleman, O., Efstathiou, J., & Johnson, N. F. (2006). How does Europe Make Its Mind Up?
Connections, cliques, and compatibility between countries in the Eurovision Song Contest. Physica
A, 360, 576–598.
Fox, M. A., & Kochanowski, P. (2004). Models of superstardom: An application of the Lotka and Yule
distributions. Popular Music and Society, 27(4), 507–522.
Gabaix, X., & Ibragimov, R. (2011). Rank—�: A simple way to improve the OLS estimation of tail
exponents. Journal of Business & Economic Statistics, 29(1), 24–39.
Garcıa, D., & Tanase, D. (2013). Measuring cultural dynamics through the Eurovision Song Contest.
arXiv:1301.2995v1 [physics.coc-ph].
Gatherer, D. (2006). Comparison of Eurovision Song Contest simulation with actual results reveals
shifting patters of collusive voting alliances. Journal of Artificial Societies and Social Simulation,
9(2), 1.
Giles, D. E. (2006). Superstardom in the U.S. popular music industry revisited. Economics Letters, 92,
68–74.
Ginsburgh, V. (2003). Awards, success and aesthetic quality in the arts. Journal of Economic
Perspectives, 17(2), 99–111.
Ginsburgh, V., & Noury, A. G. (2008). The Eurovision Song Contest. Is voting political or cultural?
European Journal of Political Economy, 24, 41–52.
Golosovsky, M., & Solomon, S. (2013). The transition towards immortality: Non-linear autocatalytic
growth of citations to scientific papers. Journal of Statistical Physics, 151, 340–354.
Goris, T. (2010). Wiskunde en de Top 2000. Nieuwe Wiskrant 30-2/December 2010, 39–40.
Haan, M. A., Dijkstra, S. G., & Dijkstra, P. T. (2005). Expert judgment versus public opinion—Evidence
from the Eurovision Song Contest. Journal of Cultural Economics, 29, 59–78.
Hamlen, W. A. (1991). Superstardom in popular music: Empirical evidence. Review of Economics and
Statistics, 73(4), 729–733.
Hamlen, W. A. (1994). Variety and superstardom in popular music. Economic Inquiry, 32(3), 395–406.
Hendricks, K., & Sorensen, A. (2009). Information and the skewness of music sales. Journal of Political
Economy, 117(2), 324–369.
Jackson, M. O., & Xing, Y. (2014). Culture-dependent strategies in coordination games. PNAS,
111(suppl. 3), 10889–10896.
Keynes, J. M. (1936). The general theory of employment, interest, and money. London: Macmillan.
Kokko, A., & Tingvali, P. G. (2012). The Eurovision Song Contest, preferences and European trade.
Ratio Working Paper No. 183, Stockholm.
Lamport, L. (2006). Measuring celebrity. Annals of Improbable Research, 12(1), 14–15.
Lanoue, D. (2015). The iPod model. Electronic Journal of Probability, 20(64), 1–20.
Lotka, A. J. (1926). The frequency distribution of scientific productivity. Journal of the Washington
Academy of Sciences, 16, 317–323.
Luhmann, N. (1995). Social systems. Stanford, CA: Stanford University Press.
Luhmann, N. (2000). Art as a social system. Stanford, CA: Stanford University Press.
MacDonald, G. (1988). The economics of rising stars. American Economic Review, 78, 155–166.
Marshall, A. (1947). Principles of economics (8th ed.). London and Basingstoke: Macmillan.
McMillan, C. T., Rascovsky, K., Khella, M. C., Clark, R., & Grossman, M. (2011). The neural basis for
establishing a focal point in pure coordination games. SCAN, 7, 881–887.
Meerschaert, M. M., Roy, P., & Shao, Q. (2012). Parameter estimation for exponentially tempered power
law distributions. Communications in Statistics—Theory and Methods, 41, 1839–1856.
Merton, R. K. (1957). Social theory and social structure. Glencoe, IL: The Free Press.
400 J Cult Econ (2017) 41:379–401
123

Molleman, L., Pen, I., & Weissing, F. J. (2013). Effects of conformism on the cultural evolution of social
behaviour. PLoS One, 8(7), e68153.
N. N. (2009). A world of hits. http://www.economist.com/node/14959982. Accessed February 10, 2016.
Newman, M. E. J. (2010). Networks. An introduction. Oxford: Oxford University Press.
NPO Radio 2 (2014). Top2000. Lijsten alle jaren. http://www.radio2.nl/radio2-2/documents/2014/lijsten_
alle_jaren.xlsx.
NPO Radio 2 (2015a). Top2000 handout. http://www.radio2.nl/ebu/download/top2000-handout-final.pdf.
Accessed November 11, 2015.
NPO Radio 2 (2015b). Building blocks. http://www.radio2.nl/ebu/?page=t2k-building-blocks. Accessed
November 05, 2015.
Pan, R. K., & Sinha, S. (2010). The statistical laws of popularity: Universal properties of the box-office
dynamics of motion pictures. New Journal of Physics, 12, 115004.
Parsons, T. (1951). The social system. Glencoe, IL: The Free Press.
Prinz, A. (2015). Do capitalistic institutions breed billionaires? Empirical Economics,. doi:10.1007/
s00181-015-1058-0.
Prinz, A., Piening, J., & Ehrmann, T. (2015). The success of art galleries: A dynamic model with
competition and information effects. Journal of Cultural Economics, 39, 153–176.
Rosen, S. (1981). The economics of superstars. American Economic Review, 71, 845–858.
Rosen, S. (1983). The economics of superstars: Reply. American Economic Review, 73, 460–462.
Salganik, M. J., Dodds, P. S., & Watts, D. J. (2006). Experimental study of inequality and unpredictability
in an artificial cultural market. Science, 311, 854–856.
Schelling, T. C. (1960). The strategy of conflict. Cambridge, Massachusetts: Harvard University.
Schulze, G. G. (2011). Superstars. In R. Towse (Ed.), A handbook of cultural economics (2nd ed.,
pp. 401–407). Cheltenham, UK; Northampton, MA, USA: Edward Elgar.
Simkin, M. V., & Roychowdhury, V. P. (2013). A mathematical theory of fame. Journal of Statistical
Physics, 151, 319–328.
Simon, H. A. (1955). On a class of skew distribution functions. Biometrika, 42, 425–440.
Sornette, D. (2000). Critical phenomena in natural sciences. Berlin: Springer.
Spierdijk, L., & Vellekoop, M. (2009). The structure of bias in peer voting systems: Lessons from the
Eurovision Song Contest. Empirical Economics, 36, 403–425.
Statista. (2015). Statistics and facts about music industry in the U.S. http://www.statista.com/topics/1639/
music/. Accessed November 4, 2015.
Statistics Netherlands. (2015). Population; key figures (as of April 05, 2013). WWW.Statline.cbs.nl.
Sterken, E. (2014). Collective memory and nostalgia in the Dutch Radio2 Top2000 Chart 1999–2013.
CESifo Working Paper No. 4632.
Strobl, E. A., & Tucker, C. (2000). The dynamics of chart success in the U.K. pre-recorded popular music
industry. Journal of Cultural Economics, 24, 113–134.
Tomassini, M., & Pestelacci, E. (2010). Coordination games on dynamical networks. Games, 1, 242–261.
Vilone, D., Ramasco, J. J., Sanchez, A., & San Miguel, M. (2012). Social and strategic imitation: The way
to consensus. Scientific Reports, 2(686), 1–7.
Yair, G., & Maman, D. (1996). The persistent structure of hegemony in the European Song Contest. Acta
Sociologica, 39, 309–325.
Yakovenko, V. M., & Rosser, J. B, Jr. (2009). Colloquium: Statistical mechanics of money, income, and
wealth. Review of Modern Physics, 81(4), 1703–1725.
Young, H. P. (1996). The economics of convention. Journal of Economic Perspectives, 10(2), 105–122.
Yule, G. U. (1924). A mathematical theory of evolution, based on the conclusions of Dr. J. C. Willis,
F.R.S. Philosophical Transactions of the Royal Society, B, 213, 21–87.
J Cult Econ (2017) 41:379–401 401
123