Embed Size (px)
Citation preview
COMMENTARY
CURRENT SCIENCE, VOL. 97, NO. 3, 10 AUGUST 2009 304
Ranking of Indian engineering and technological institutes for their research performance during 1999–2008 Gangan Prathap and B. M. Gupta Among the major countries, India has one of the largest infrastructures of engi-neering and technological institutes (over 2000). It also produces the largest num-ber of engineering and technology gradu-ates (over 300,000) every year. Some of these institutes are very prestigious and even make it to the list of top universities in the world1–3. Only a handful of insti-tutes (IISc and some IITs) among the major Indian engineering and technolo-gical institutes, however, account for most of the research output of the coun-try. Majority of the others, however have very meagre research output, which is also reflected in the poor out-turn of Ph Ds (less than a thousand each year) from these institutions. So far, no rank-ing of all the Indian engineering and technology institutes for their research performance has been undertaken. In this regard, it is to be noted that most of the international ranking schemes are com-plex exercises and assess for both quan-tity and quality of scientific research, but use such elitist levels of achievement (number of Nobel Laureates; papers in Nature, Science, etc.) that they cannot be meaningfully applied to the list under scrutiny here. In the present exercise therefore, a proposal is presented for a ranking of research performance of Indian engineering and technological in-stitutes using data from SCOPUS4 inter-national bibliographical database, using a recently introduced p-index, which can serve as a composite indicator that com-bines quality with quantity5–7. A total of 67 Indian engineering and technological institutes with compara-tively higher output of publications dur-ing a ten-year period from 1999 to 2008 were identified. These institutes together have published 75,166 papers during this period, according to publication data downloaded from the SCOPUS Interna-tional multidisciplinary bibliographical database. Put together, this is more than the output of the university sector (59,685 papers) and constitutes nearly 23% of the total cumulative research output from India during 1999–2008. The citations received by papers of these Indian engineering and technologi-
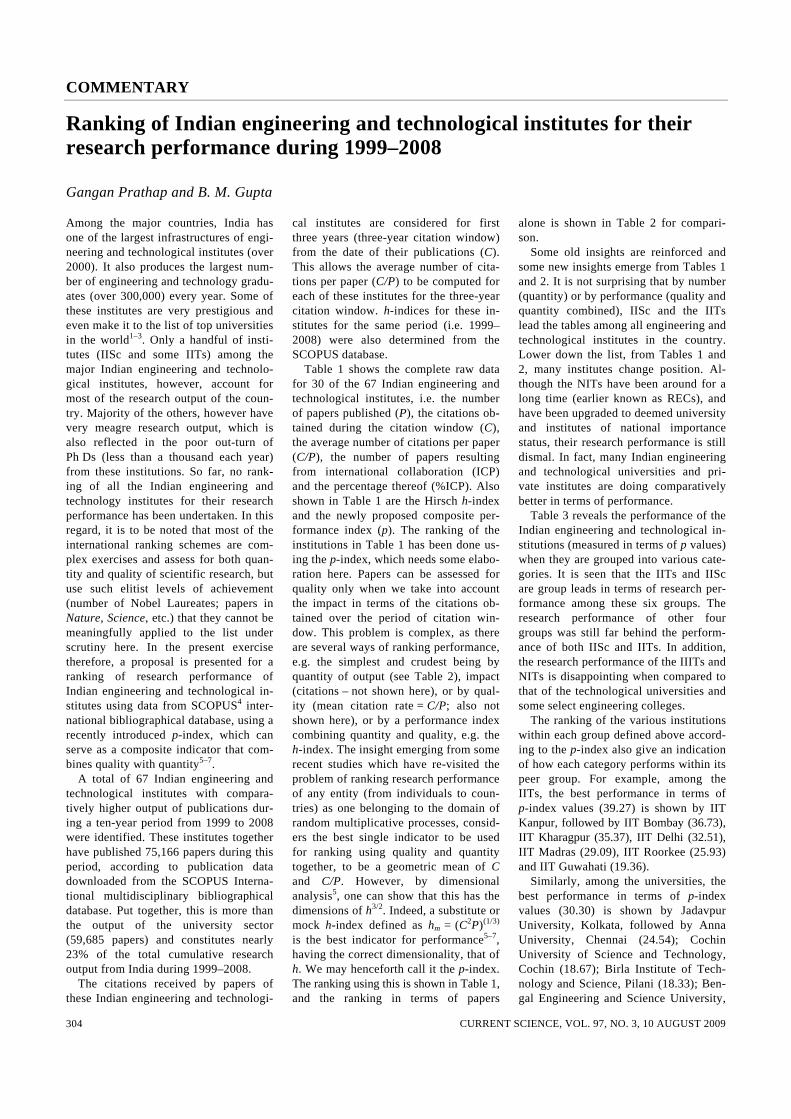
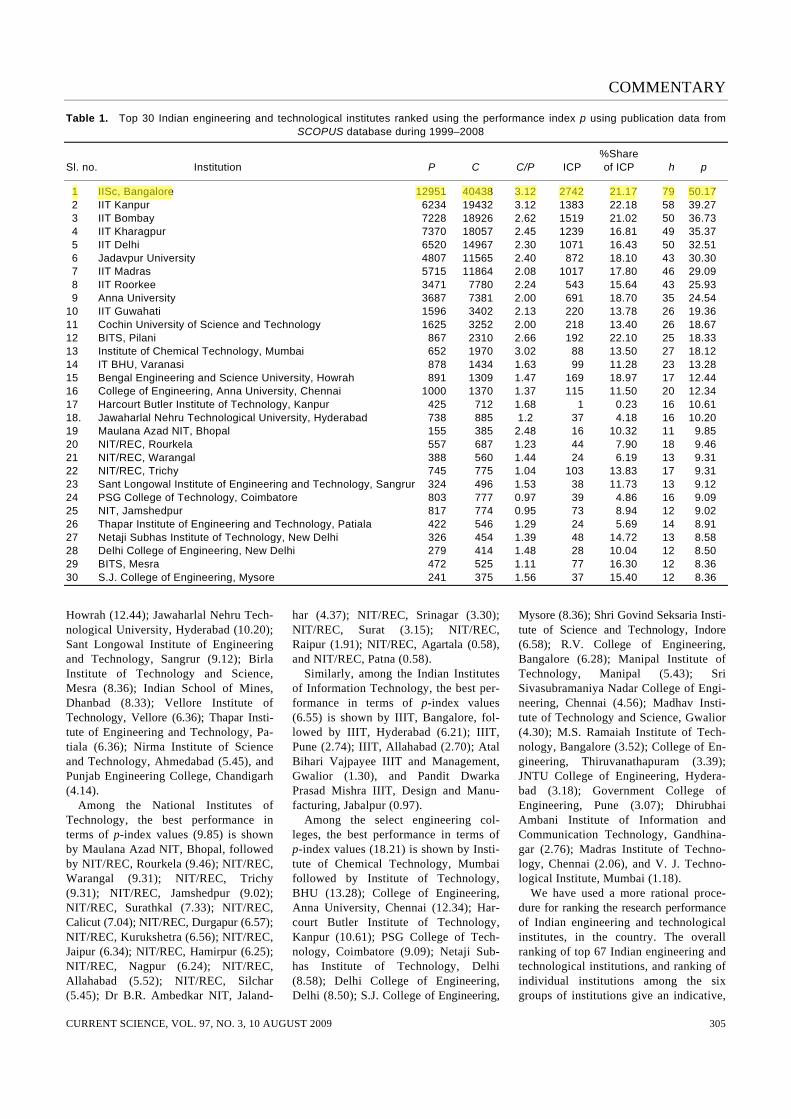
cal institutes are considered for first three years (three-year citation window) from the date of their publications (C). This allows the average number of cita-tions per paper (C/P) to be computed for each of these institutes for the three-year citation window. h-indices for these in-stitutes for the same period (i.e. 1999–2008) were also determined from the SCOPUS database. Table 1 shows the complete raw data for 30 of the 67 Indian engineering and technological institutes, i.e. the number of papers published (P), the citations ob-tained during the citation window (C), the average number of citations per paper (C/P), the number of papers resulting from international collaboration (ICP) and the percentage thereof (%ICP). Also shown in Table 1 are the Hirsch h-index and the newly proposed composite per-formance index (p). The ranking of the institutions in Table 1 has been done us-ing the p-index, which needs some elabo-ration here. Papers can be assessed for quality only when we take into account the impact in terms of the citations ob-tained over the period of citation win-dow. This problem is complex, as there are several ways of ranking performance, e.g. the simplest and crudest being by quantity of output (see Table 2), impact (citations – not shown here), or by qual-ity (mean citation rate = C/P; also not shown here), or by a performance index combining quantity and quality, e.g. the h-index. The insight emerging from some recent studies which have re-visited the problem of ranking research performance of any entity (from individuals to coun-tries) as one belonging to the domain of random multiplicative processes, consid-ers the best single indicator to be used for ranking using quality and quantity together, to be a geometric mean of C and C/P. However, by dimensional analysis5, one can show that this has the dimensions of h3/2. Indeed, a substitute or mock h-index defined as hm = (C2P)(1/3) is the best indicator for performance5–7, having the correct dimensionality, that of h. We may henceforth call it the p-index. The ranking using this is shown in Table 1, and the ranking in terms of papers
alone is shown in Table 2 for compari-son. Some old insights are reinforced and some new insights emerge from Tables 1 and 2. It is not surprising that by number (quantity) or by performance (quality and quantity combined), IISc and the IITs lead the tables among all engineering and technological institutes in the country. Lower down the list, from Tables 1 and 2, many institutes change position. Al-though the NITs have been around for a long time (earlier known as RECs), and have been upgraded to deemed university and institutes of national importance status, their research performance is still dismal. In fact, many Indian engineering and technological universities and pri-vate institutes are doing comparatively better in terms of performance. Table 3 reveals the performance of the Indian engineering and technological in-stitutions (measured in terms of p values) when they are grouped into various cate-gories. It is seen that the IITs and IISc are group leads in terms of research per-formance among these six groups. The research performance of other four groups was still far behind the perform-ance of both IISc and IITs. In addition, the research performance of the IIITs and NITs is disappointing when compared to that of the technological universities and some select engineering colleges. The ranking of the various institutions within each group defined above accord-ing to the p-index also give an indication of how each category performs within its peer group. For example, among the IITs, the best performance in terms of p-index values (39.27) is shown by IIT Kanpur, followed by IIT Bombay (36.73), IIT Kharagpur (35.37), IIT Delhi (32.51), IIT Madras (29.09), IIT Roorkee (25.93) and IIT Guwahati (19.36). Similarly, among the universities, the best performance in terms of p-index values (30.30) is shown by Jadavpur University, Kolkata, followed by Anna University, Chennai (24.54); Cochin University of Science and Technology, Cochin (18.67); Birla Institute of Tech-nology and Science, Pilani (18.33); Ben-gal Engineering and Science University,
COMMENTARY
CURRENT SCIENCE, VOL. 97, NO. 3, 10 AUGUST 2009 305
Table 1. Top 30 Indian engineering and technological institutes ranked using the performance index p using publication data from SCOPUS database during 1999–2008
%Share Sl. no. Institution P C C/P ICP of ICP h p
1 IISc, Bangalore 12951 40438 3.12 2742 21.17 79 50.17 2 IIT Kanpur 6234 19432 3.12 1383 22.18 58 39.27 3 IIT Bombay 7228 18926 2.62 1519 21.02 50 36.73 4 IIT Kharagpur 7370 18057 2.45 1239 16.81 49 35.37 5 IIT Delhi 6520 14967 2.30 1071 16.43 50 32.51 6 Jadavpur University 4807 11565 2.40 872 18.10 43 30.30 7 IIT Madras 5715 11864 2.08 1017 17.80 46 29.09 8 IIT Roorkee 3471 7780 2.24 543 15.64 43 25.93 9 Anna University 3687 7381 2.00 691 18.70 35 24.54 10 IIT Guwahati 1596 3402 2.13 220 13.78 26 19.36 11 Cochin University of Science and Technology 1625 3252 2.00 218 13.40 26 18.67 12 BITS, Pilani 867 2310 2.66 192 22.10 25 18.33 13 Institute of Chemical Technology, Mumbai 652 1970 3.02 88 13.50 27 18.12 14 IT BHU, Varanasi 878 1434 1.63 99 11.28 23 13.28 15 Bengal Engineering and Science University, Howrah 891 1309 1.47 169 18.97 17 12.44 16 College of Engineering, Anna University, Chennai 1000 1370 1.37 115 11.50 20 12.34 17 Harcourt Butler Institute of Technology, Kanpur 425 712 1.68 1 0.23 16 10.61 18. Jawaharlal Nehru Technological University, Hyderabad 738 885 1.2 37 4.18 16 10.20 19 Maulana Azad NIT, Bhopal 155 385 2.48 16 10.32 11 9.85 20 NIT/REC, Rourkela 557 687 1.23 44 7.90 18 9.46 21 NIT/REC, Warangal 388 560 1.44 24 6.19 13 9.31 22 NIT/REC, Trichy 745 775 1.04 103 13.83 17 9.31 23 Sant Longowal Institute of Engineering and Technology, Sangrur 324 496 1.53 38 11.73 13 9.12 24 PSG College of Technology, Coimbatore 803 777 0.97 39 4.86 16 9.09 25 NIT, Jamshedpur 817 774 0.95 73 8.94 12 9.02 26 Thapar Institute of Engineering and Technology, Patiala 422 546 1.29 24 5.69 14 8.91 27 Netaji Subhas Institute of Technology, New Delhi 326 454 1.39 48 14.72 13 8.58 28 Delhi College of Engineering, New Delhi 279 414 1.48 28 10.04 12 8.50 29 BITS, Mesra 472 525 1.11 77 16.30 12 8.36 30 S.J. College of Engineering, Mysore 241 375 1.56 37 15.40 12 8.36
Howrah (12.44); Jawaharlal Nehru Tech-nological University, Hyderabad (10.20); Sant Longowal Institute of Engineering and Technology, Sangrur (9.12); Birla Institute of Technology and Science, Mesra (8.36); Indian School of Mines, Dhanbad (8.33); Vellore Institute of Technology, Vellore (6.36); Thapar Insti-tute of Engineering and Technology, Pa-tiala (6.36); Nirma Institute of Science and Technology, Ahmedabad (5.45), and Punjab Engineering College, Chandigarh (4.14). Among the National Institutes of Technology, the best performance in terms of p-index values (9.85) is shown by Maulana Azad NIT, Bhopal, followed by NIT/REC, Rourkela (9.46); NIT/REC, Warangal (9.31); NIT/REC, Trichy (9.31); NIT/REC, Jamshedpur (9.02); NIT/REC, Surathkal (7.33); NIT/REC, Calicut (7.04); NIT/REC, Durgapur (6.57); NIT/REC, Kurukshetra (6.56); NIT/REC, Jaipur (6.34); NIT/REC, Hamirpur (6.25); NIT/REC, Nagpur (6.24); NIT/REC, Allahabad (5.52); NIT/REC, Silchar (5.45); Dr B.R. Ambedkar NIT, Jaland-
har (4.37); NIT/REC, Srinagar (3.30); NIT/REC, Surat (3.15); NIT/REC, Raipur (1.91); NIT/REC, Agartala (0.58), and NIT/REC, Patna (0.58). Similarly, among the Indian Institutes of Information Technology, the best per-formance in terms of p-index values (6.55) is shown by IIIT, Bangalore, fol-lowed by IIIT, Hyderabad (6.21); IIIT, Pune (2.74); IIIT, Allahabad (2.70); Atal Bihari Vajpayee IIIT and Management, Gwalior (1.30), and Pandit Dwarka Prasad Mishra IIIT, Design and Manu-facturing, Jabalpur (0.97). Among the select engineering col-leges, the best performance in terms of p-index values (18.21) is shown by Insti-tute of Chemical Technology, Mumbai followed by Institute of Technology, BHU (13.28); College of Engineering, Anna University, Chennai (12.34); Har-court Butler Institute of Technology, Kanpur (10.61); PSG College of Tech-nology, Coimbatore (9.09); Netaji Sub-has Institute of Technology, Delhi (8.58); Delhi College of Engineering, Delhi (8.50); S.J. College of Engineering,
Mysore (8.36); Shri Govind Seksaria Insti-tute of Science and Technology, Indore (6.58); R.V. College of Engineering, Bangalore (6.28); Manipal Institute of Technology, Manipal (5.43); Sri Sivasubramaniya Nadar College of Engi-neering, Chennai (4.56); Madhav Insti-tute of Technology and Science, Gwalior (4.30); M.S. Ramaiah Institute of Tech-nology, Bangalore (3.52); College of En-gineering, Thiruvanathapuram (3.39); JNTU College of Engineering, Hydera-bad (3.18); Government College of Engineering, Pune (3.07); Dhirubhai Ambani Institute of Information and Communication Technology, Gandhina-gar (2.76); Madras Institute of Techno-logy, Chennai (2.06), and V. J. Techno-logical Institute, Mumbai (1.18). We have used a more rational proce-dure for ranking the research performance of Indian engineering and technological institutes, in the country. The overall ranking of top 67 Indian engineering and technological institutions, and ranking of individual institutions among the six groups of institutions give an indicative,
COMMENTARY
CURRENT SCIENCE, VOL. 97, NO. 3, 10 AUGUST 2009 306
Table 2. Top 67 Indian engineering and technological institutes ranked using the total number of papers published during 1999–2008 according to the SCOPUS database
Rank Institution P Rank Institution P
1 IISc, Bangalore 12951 35 NIT/REC, Hamirpur 305 2 IIT Kharagpur 7370 36 NIT/REC, Nagpur 295 3 IIT Bombay 7228 37 NIT/REC, Calicut 286 4 IIT Delhi 6520 38 Delhi College of Engineering, New Delhi 279 5 IIT Kanpur 6234 39 IIIT, Bangalore 279 6 IIT Madras 5715 40 S.J. College of Engineering, Mysore 241 7 Jadavpur University 4807 41 NIT/REC, Durgapur 238 8 Anna University 3687 42 NIT/REC, Allahabad 238 9 IIT Roorkee 3471 43 Dr B.R. Ambedkar NIT, Jalandhar 219 10 Cochin University of Science and Technology 1625 44 Punjab Engineering College, Chandigarh 217 11 IIT Guwahati 1596 45 Manipal Institute of Technology, Manipal 214 12 College of Engineering, Anna University, Chennai 1000 46 NIT/REC, Jaipur 193 13. Bengal Engineering and Science University, Howrah 891 47 Nirma University of Science and Technology, 158 14 IT BHU, Varanasi 878 Ahmedabad 15 BITS, Pilani 867 48 Maulana Azad NIT, Bhopal 155 16 NIT, Jamshedpur 817 49 JNTU College of Engineering, Hyderabad 153 17 PSG College of Technology, Coimbatore 803 50 Government College of Engineering, Pune 146 18 NIT/REC, Trichy 745 51 Sri Sivasubramaniya Nadar College of Engineering, 116 19 Jawaharlal Nehru Technological University, Hyderabad 738 Chennai 20. Institute of Chemical Technology, Mumbai 652 52 Dhirubhai Ambani Institute of Information and 105 21 NIT/REC, Rourkela 557 Communication Technology, Gandhingar 22 BITS, Mesra 472 53 NIT/REC, Surat 104 23 ISM, Dhanbad 463 54 IIIT, Allahabad 90 24 Vellore Institute of Technology, Vellore 429 55 Madhav Institute of Technology and Science, Gwalior 89 25 Harcourt Butler Institute of Technology, Kanpur 425 56 College of Engineering, Thiruvananthapuram 89 26 Thapar Institute of Engineering and Technology, 422 57 M.S. Ramaiah Institute of Technology, Bangalore 67 Patiala 58 Atal Bihari Vajpayee IIIT and Management, Gwalior 66 27 NIT/REC, Warangal 388 59 Veermata Jijabai Technological Institute, Mumbai 61 28 Shri Govindram Seksaria Institute of Technology 369 60 NIT/REC, Srinagar 59 and Science, Indore 61 NIT/REC, Silchar 57 29 NIT/REC, Surathkal 357 62 Madras Institute of Technology, Chennai 55 30 R.V. College of Engineering, Bangalore 345 63 IIIT, Pune 33 31 Netaji Subhas Institute of Technology, New Delhi 326 64 Pandit Dwarka Prasad Mishra IIIT, Design and 10 32 Sant Longowal Institute of Engineering and 324 Manufacturing, Jabalpur Technology, Sangrur 65 NIT/REC, Raipur 7 33 IIIT, Hyderabad 313 66 NIT/REC, Agartala 5 34 NIT/REC, Kurukshetra 306 67 NIT/REC, Patna 5
Table 3. Ranking of Indian engineering and technological institute groups using the performance index p during 1999–2008 according to the SCOPUS database
Rank Institution P C p
1 IITs (7) 38134 94428 61.61 2 IISc (1) 12951 40438 50.17 3 University and Deemed University (13) 15100 29402 38.54 4 Select Engineering Colleges (20) 6413 8823 22.98 5 NITs/RECs (20) 5336 5732 18.33 6 IIITs (6) 791 637 8.01
Numbers in brackets indicate number of institutions in the group. if not nearly comprehensive, assessment of how the engineering and technological sector of higher education is performing as generators of new knowledge.
1. Balaram, P., Curr. Sci., 2004, 86, 1347–1348.
2. http://www.arwu.org/ 3. Virk, H. S., Curr. Sci., 2004, 87, 416. 4. http://www.scopus.com 5. Prathap, G., Scientometrics (to appear),
2009; DOI: 10.1007/s11192-009-0066-2 6. Prathap, G., Scientometrics (to appear),
2009; DOI: 10.1007/s11192-009-0067-1 7. Prathap, G., Scientometrics (to appear),
2009; DOI: 10.1007/s11192-009-0068-0
Gangan Prathap* is in the National Institute of Science Communication and Information Resources, New Delhi 110 012, India; B. M. Gupta is in the National Institute of Science, Technology and Development Studies, New Delhi 110 012, India. *e-mail: [email protected]


![Untitled-1 []€¦ · The Indian Institutes of Management (11Ms), Indian Institute of Forest Management (IIFM), Institute of Rural Management, Anand (IRMA), Xavier Institute of Management,](https://img.pdfslide.us/doc/110x75/5fa3e1b1e25d4f3f3627ad48/untitled-1-the-indian-institutes-of-management-11ms-indian-institute-of-forest.jpg)