Embed Size (px)
DESCRIPTION
Greenpeace selected 28 National Environmental Protection Priority Cities as defined by Ministry of Environmental Protection in three key regions and ranked them based on their current air quality, "clean air" action plans and targets committed to by their local governments.
Citation preview
Ranking Eastern Chinese Cities by their "Clean Air" Actions
Preface
1
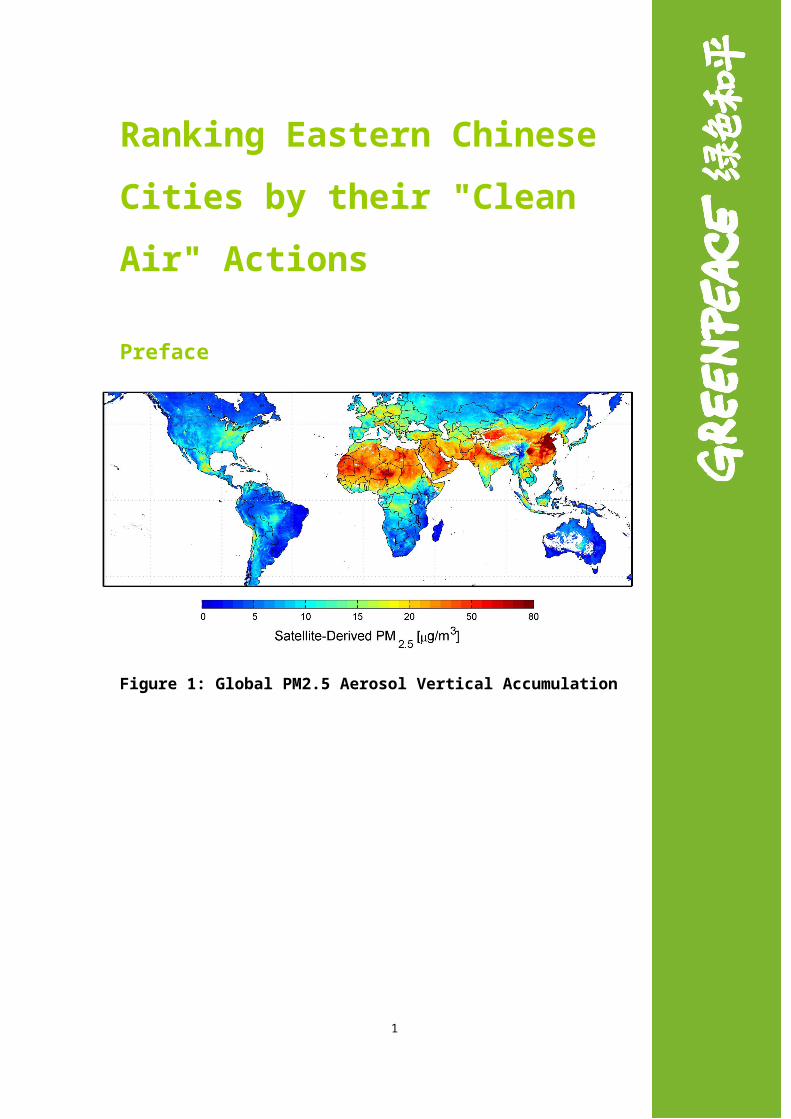
Figure 1: Global PM2.5 Aerosol Vertical Accumulation Distribution Map1
A satellite mapping analysis of PM2.5 concentration, as published by the US NASA lab, indicates the coastal areas of Eastern China as the most affected by PM2.5 pollution in the world. According to statistics from China's Ministry of Environmental Protection, cities in three regions—Yangtze River Delta, Pearl River Delta and Jing-Jin-Ji Region (Beijing-Tianjin-Hebei) have seen over 100 smoggy days each year, with fine particle concentration two to four times the level recommended by WHO Air Quality Guidelines2. This comes as a result of a continuous increase in coal burning and vehicle usage. Investigations by the Chinese Academy of Engineering reveal the above-mentioned air pollution of these cities are attributable to both soot and vehicle tail gas. Because of their insatiable demand for energy, these cities have been hit hard by air pollution3.
Jing-Jin-Ji region, Yangtze River Delta and Pearl River Delta covers three direct-controlled municipalities (Beijing, Tianjin and Shanghai) and four provinces (Hebei, Jiangsu, Zhejiang and Guangdong), and is the most densely-populated and economically developed area in China. In 2010, its population accounted for 27% of the total in China and its GDP represented 43% of the national GDP. It attracted a huge amount of public attention from the general public and media during the PM2.5 crisis of late last year. Public outcry for transparency prompted Beijing, Tianjin, Shanghai, Guangzhou and other cities to commit to disclosure of air quality monitoring data and map out a plan called "Clean Air" Action. And since polluted air is likely to migrate to other cities, individual cities must join forces in order to improve air quality. A joint action plan for different administrative divisions and regions to cooperate with tackling air pollution is urgently required.
In the six months that followed the public discussion around PM2.5, Greenpeace selected 28 National Environmental Protection Priority Cities as defined by Ministry of Environmental Protection in three key regions and ranked them based on their current air quality, "clean air" action plans and targets committed to by their local governments. We also analyzed the huge challenges these regions are facing in environmental protection by examining the major sources of pollution of these cities. Greenpeace also hopes that cities within these three regions (including direct-controlled municipalities) along with provincial governments will create joint efforts to reduce air pollution and demonstrate enough determination and persistence to make clean air a reality in the near future.
1. City Ranking of Air Quality
1 NASA website, http://www.nasa.gov/topics/earth/features/health-sapping.html2 Environment Planning Academy, Ministry of Environmental Protection, Guidance on Formulation of 12th Five-Year Plan of Atmospheric Pollution Joint Prevention and Control in Priority Regions.3 China's Energy Mid-Long Term Development Strategy Research—Environment, Science Press, February 2011.
2
We have ranked the state of air quality of 28 cities in key regions according to National Statistics of Air Quality of Environmental Protection Priority Cities, released by Ministry of Environmental Protection in 2010. Annual average PM2.5 levels of these cities cannot yet be directly acquired due to monitoring and information disclosure of PM2.5 having only just begun in China. Numerous findings have indicated that the proportion of PM2.5 within PM10 stands at 50-80%. Thus, statistics of annual average PM10 concentration of cities released by Ministry of Environmental Protection have been used as a reference for the level of PM2.5 of the 28 cities in these three regions4.
In Table 1 which ranks the annual average PM10 concentration of 28 environmental protection priority cities in 2010, one can see that the region with the lowest level of inhalable particles is the six Pearl Delta cities (marked blue); meanwhile the air quality of 15 environmental protection priority cities in Yangtze Delta, which has been marked as pink, have been deemed unsatisfactory. Shanghai on the other hand has fared better than others in the Yangtze River Delta region. And significant variations have been found among seven cities in the Jing-Jin-Ji (Beijing-Tianjin-Hebei) region, which has been marked purple. Beijing, Hangzhou and Nanjing, are all severely affected by particle pollution, three cities most affected by inhalable particles.
Also of note is the particle concentration of 28 cities in the Jing-Jin-Ji region, Yangtze River Delta, and Pearl Delta River, which is two to six times the WHO level. They all fail to live up to the new, national grade-one standard of air quality announced in 2012. Other than the cities of the Pearl Delta, most cities in the Yangtze Delta and Jing-Jin-Ji region are not even up to the national grade-two air quality standards. Clearly there's a long way to go before we see significant improvement of the country's air quality.
To observe whether the cities' air quality is improving, we compared the PM10 concentration of the 28 cities for the first half of 20115 to the data of 2010. We found that two fifths of the national environmental protection priority cities in the three regions (11 cities) was lower than the annual average in 2010, indicating some small progress, while the remaining 17 cities saw an increase in inhalable particle concentration over the same period; pollutants in Zhuhai, Shanghai, Huzhou, Yangzhou and other cities increased by 20%.
4 2010 Statistics of Air Quality of Environmental Protection Priority Citieshttp://www.mep.gov.cn/gkml/hbb/bgg/201102/t20110217_200906.htm5 China's Energy Mid-Long Term Development Strategy Investigation—Environment, Science Press, February 2011.http://www.mep.gov.cn/pv_obj_cache/pv_obj_id_D9E0CF7069AEFA8C52E0ADC84E045CF6F0E40200/filename/W020110730434018324100.pdf
3
Table 1: Ranking Air Quality of Cities in Jing-Jin-Ji Region, Yantgtze River Delta, and Pearl River Delta6
Ranking within the three regions
PM10 level national rankingsin 2010
City
Average PM10 levels in 2010 (ug/m3)
% Exceeded PM10 compared to national II standards (75ug/m3)7
% Exceeded PM10 compared to national I standards (40ug/m3)
% Exceeded PM10 compared to WHO standards (20ug/m3)
% Change for the first half of 2011
1 2 Zhan Jiang 45 —— 13% 225% -6.502 4 Zhu Hai 49 —— 23% 245% 25.63 6 Shen Zhen 57 —— 43% 285% 15.44 9 Shan Tou 60 —— 50% 300% 05 11 Qinghuangdao 64 —— 60% 320% -1.406 20 Guangzhou 69 —— 73% 345% 07 26 Shanguan 74 6% 85% 370% 7.48 34 Shanghai 79 13% 98% 395% 25.39 43 Baoding 84 20% 110% 420% -510 45 Tangshan 85 21% 113% 425% -12.911 46 Wenzhou 85 21% 113% 425% 13.512 48 Huzhou 86 23% 115% 430% 25.313 53 Wuxi 88 26% 120% 440% 12.114 54 Xuzhou 88 26% 120% 440% 10.815 61 Handan 90 29% 125% 450% -4.716 62 Suzhou 90 29% 125% 450% 017 63 Lianyuangang 90 29% 125% 450% 19.818 70 Shaoxing 95 36% 138% 475% -119 72 Tianjin 96 37% 140% 480% -3.120 73 Yangzhou 96 37% 140% 480% 20.621 74 Ningbo 96 37% 140% 480% 12.622 76 Changzhou 97 39% 143% 485% 123 77 Nantong 97 39% 143% 485% -124 78 Zhenjiang 97 39% 143% 485% 10.625 82 Shi Jiazhuang 98 40% 145% 490% 026 83 Hangzhou 98 40% 145% 490% -3.927 104 Nanjing 114 63% 185% 570% -6.6
28 109 Beijing 121 73% 203% 605% -4.9
(Blue represents Pearl River Delta Cities. Pink represents Yangtze River Delta Cities.
6 2010 Statistics of Ambient Air Quality of Environmental Protection Priority Cities, Ministry of Environmental Protection
http://www.mep.gov.cn/gkml/hbb/bgg/201102/t20110217_200906.htm7 Ambient Air Quality Standard (GB3095-2012)grade-one standard: annual average PM10 is 70ug/m3, equivalent to the first transitional level of WHO air quality standard; second level: annual average PM10 is 40ug/m3, between the second transitional level of WHO air quality standard (50ug/m3) and the third transitional level(30ug/m3).
4
Purple represents Jing-Jin-Ji Region Cities. The green line represents the annual average limit of PM10 for the new national grade-one standard. The orange line represents limits for the grade-two standard.)
2. City Ranking for "Clean Air" ActionThe smoggy weather that blanketed half of China in the winter of 2011 has sparked a huge debate over PM2.5 amongst the general public. Public discontent over air quality and a demand for transparency of government information has urged local governments to speed up the disclosure of PM2.5 readings.
However, information disclosure is simply the first step in the huge marathon that is air quality improvement. The challenge to improve air quality is so big that very strong commitments are required from these cities; it needs a legally binding action plan. Also important is a real shift from end of pipe pollutant control to controlling the source of pollutant, and an interdepartmental pollution prevention and control mechanism is required, thereby facilitating the implementation of any "clean air" action.
Rating "clean air" actions of 28 cities from four different respects below (see Table 2).
A. Air Quality Improvement Targets:
Three key indicators were used here: whether or not a clean air action plan has been released, whether or not an air quality improvement target has been specified and whether or not a timeline has been detailed.
China's Air Pollution Prevention and Control Law stipulate that for a city with substandard air quality, its government must have a legally binding plan to gradually improve air quality in order to meet this standard. After searching the websites of the above municipal governments we've found that until now none of them have formulated such a legally binding plan to ensure their air quality meets the standard, although these provinces and cities all have an emissions reduction and energy savings plan. Then we searched for ad hoc air pollution treatment plans formulated by these cities and provinces to which they belong and found their programs have been given various names, such as the "clean air plan", "blue sky program" and "comprehensive air pollution treatment plan". See attachment for plans and policy documents related to this.
The improvement of air quality not only requires a clear target, but also concerted action by regions, in contrast to isolated efforts made by individual cities. We found only Zhejiang and Guangdong has introduced a unified regional air pollution
5
treatment scheme by their provincial governments and municipal governments.
With regard to the air quality improvement target, these cities have not yet set specific targets and timelines for the improvement of air quality as demanded by the public, although they all have targets for total amount of pollution emission reduction. Thus we have also chosen another two indicators: is there a quantitative target set for the improvement of air quality? This means when pollution concentration can be reduced by what percentage. Additionally we included whether or not a timeline has been created to meet the standard, which means by when they pledge to meet the national standards – an important commitment to public demand.
We found only Beijing had given 2030 as a clear timeline to meet the national standard. Wuxi and Hangzhou has proposed a PM10 concentration decreasing target, while the other cities had set no specific timelines. Obscure illustrations of target setting – "significant decrease of PM2.5 since 2013", "achieve functional area standard by the end of 'twelve-five'" - are also used by some cities. To some extent this shows that local governments still lack a commitment to improve air quality.
B. Control on Pollution from Coal CombustionWith regards to actions taken to improve air quality, we are mainly focusing on two aspects: treatment of pollution from coal combustion in industry, electricity use, heating and other sectors, as well as emissions from vehicles.
The dominance of coal in China's energy mix is the major cause of high air pollution emissions. Coal combustion from all over the country contributes to 70-80% of the emissions of sulfur dioxide and nitrogen oxide. End-of pipe treatment of coal pollution in Eastern China began early and has shown up as comparatively better levels of air pollution compared to other regions8. Thus, there's limited space for further end of pipe pollution control improvement. Currently coal combustion control measures taken by most of these cities include designation of zero combustion zones within urban area, tightening approval of newly built coal-fired power plants and heavy industry programs, as well as enhancing the mechanisms used to control the pollution from the current coal combustion facilities. But to solve the current regional compound pollution, there's no escaping the necessity of putting a cap on coal consumption. This will assist in achieving zero growth of coal consumption or even reduction.
Therefore whether there exists limits on total coal consumption has been used as the most critical indicator of pollution control action. Despite the Ministry of Environmental Protection delivering a proposal that Jing-Jin-Ji Region, Yangtze River
8 Chinese Academy of Engineering, China's energy medium and long-term development strategy research –environment volume, Science Press, February 2011
6

Delta and Pearl River Delta should set limits on total coal consumption the plan is yet to be approved by the State Council. Presently Beijing has announced a coal consumption reduction target of 20 million tons in the coming five years and Shanghai, Wuxi, Changzhou and Ningbo have also put forth absolute targets to limit the increase of coal consumption. The remaining cities haven't put forward any specific targets to control total coal consumption.
C.Efforts to Control Vehicle Pollution
Two key indicators are used here: whether or not a target has been set to phase out yellow-label vehicles, whether or not measures have been taken to slow down increase of vehicles.
Most of the cities in Jing-jin-ji Region, Yangtze Delta and Pearl Delta have put forward a timeline to fully phase out yellow-label vehicles (heavy polluting vehicles). Beijing is the first city that has adopted National-V emission standards for vehicles in 2012. Beijing and Shanghai introduced different mechanisms to alleviate rapid growth of the total number of vehicles. However, given most of the cities haven't curbed the growth of vehicles, they are expected to continue to increase rapidly over the next five years. Therefore the possibility of effective control of pollution from vehicle emissions remains unclear.
D.Disclosing PM2.5 Data
We found that of these 28 cities, 15 Yangtze River Delta environmental protection priority cities had all disclosed their daily average of PM2.5 levels by mid-May this year. Of them, nine cities in Jiangsu even managed hourly PM2.5 data. The Pearl River Delta unified plans for PM2.5 data disclosure had yet to include observation stations in Zhanjiang, Shaoguan, and Shantou. The Jing-Jin-Ji region performed the least satisfactory in terms of information disclosure. Except Beijing, none of the other six cities (including Tianjin) within the region had disclosed their data.
7
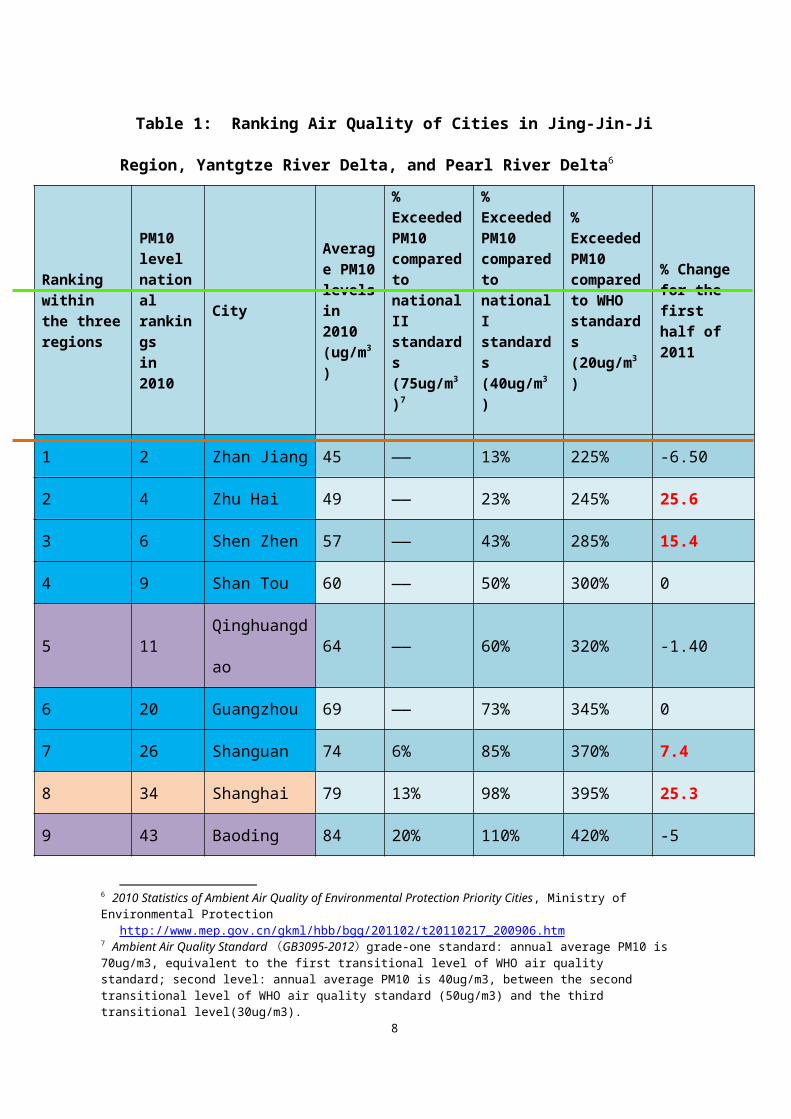
Table 2: Ranking of Cities by "Clean Air" Actions
City
Clean air action plan announced?(1 point)
Air quality improvement target? (1 point)
Timeline to meet standard(1 point)
Coal cap(3 points)
Phasing out yellow label vehicle target(1 point)
Vehicle increase control (2 points)
PM2.5 data disclosure(1 point)
Total score
Beijing Yes Yes Yes Yes Yes Yes Yes 10
Shanghai No No No Yes Yes Yes Yes 7
Wuxi Yes Yes No Yes No No Yes 6
Changzhou Yes No No Yes No No Yes 5
Ningbo No No No Yes No No Yes 4
Shenzhen Yes No No No Yes No Yes 3
Suzhou Yes No No No Yes No Yes 3
Nantong Yes No No No Yes No Yes 3
Nanjing Yes No No No Yes No Yes 3
Hangzhou Yes Yes No No No No Yes 3
Zhuhai Yes No No No No No Yes 2
Guangzhou Yes No No No No No Yes 2
Xuzhou Yes No No No No No Yes 2
Lianyungang Yes No No No No No Yes 2
Yangzhou No No No No Yes No Yes 2
Wenzhou Yes No No No No No Yes 2
Huzhou Yes No No No No No Yes 2
Shaoxing Yes No No No No No Yes 2
Zhanjiang Yes No No No No No No 1
Shaoguan Yes No No No No No No 1
Shantou Yes No No No No No No 1
Baoding No No No No Yes No No 1
Handan Yes No No No No No No 1
Shijiazhuang No No No No Yes No No 1
Tianjin No No No No Yes No No 1
Zhenjiang No No No No No No Yes 1
Qinhuangdao No No No No No No No 0
Tangshan No No No No No No No 0
8

After considering the above seven indicators with regards to "Clean Air" actions made by local governments, Beijing stands out in terms of both determination and willingness to take action among the cities of the three regions in Eastern China. Some cities in the Yangtze River region also had a fairly progressive set of actions in the pipeline, such as Shanghai and Wuxi, but regional cooperation in the region is still lagging behind. The Pearl River Delta had comparatively good coordination within the region, however till now we can't see a clear target on capping coal consumption or vehicle increase. While the remaining cities in Jing-Jin-Ji region (with Beijing the exception) doing the poorest.
3. Challenges Facing Air Quality ImprovementKey to improving urban air quality is reducing air pollutants. Numerous research findings have indicated that the increased of secondary particles in PM2.5 is linked to increases in sulfur dioxide and nitrogen oxide9. According to statistics from the Ministry of Environment Protection, major air pollution emissions in China are huge - 22.678 million tons of sulfur dioxide and 22.736 million tons of nitrogen dioxide per year - landing China at number one in the world. Industrial dust emissions have reached 12.778 million tons and all these air pollutants have overwhelmed the nation's environmental capacity10. Jing-Jin-Ji region, Pearl River Delta and Yangtze River Delta are hubs of economic activity and are where pollution emissions concentrate in China. In these regions the problem of air pollution is more prominent. While the above regions account for 6% of the area of China, their combined sulfur dioxide accounts for 20% of the total in China, and nitrogen oxide accounts for 28% of the total11. See Table 3 for the emission intensity of sulfur dioxide and nitrogen oxide within different administrative areas of these regions.
9 Cao Guoliang, Zhang Xiaoran, Gong Shanling et al, List of Sources of Major Particles and Air Pollution in China, 2011.Jiang Dahe, On Investigation and Control of Smog, 2010 Papers of Annual Symposium of Chinese Society for Environmental Science10 12th Five Year Plan of Atmospheric Pollution Joint Prevention and Control in Environmental Protection Priority Regions (Draft for Discussion), September 201111 These statistics come from the Notice on the Issuance of the 12th Five-Year Plan of Energy Saving and Emission Reduction Comprehensive Program by State Council (NDRC [2011]26)
9
Table 3: Emission Intensity of Pollutants in Eastern China12
Area Emission Intensity of Sulfur Dioxide in 2010 (Ton/Square Kilometer)
Emission Intensity of Nitrogen Oxide in 2010 (Ton/Square kilometer)
Beijing 6.19 11.79Tianjin 21.64 30.91Hebei 7.57 9.02Jing-Jin-Ji 8.17 10.34Shanghai 43.97 76.38Jiangsu 10.86 14.72Zhejiang 6.84 8.53Yangtze River Delta 9.84 13.45Guangdong 4.66 7.35National Average Level 2.36 2.37
Figure 2: Pollutant emission intensity
Table 3 shows the intensity of sulfur dioxide and nitrogen oxide emissions in Shanghai ranks the highest - 25 times the national level. Tianjin ranks second while Guangdong's emission intensity is the lowest, but is still approximately three times the national level. Higher intensity indicates a tougher battle in the fight against air pollution.
The above pollutants primarily come from two sources, which are coal combustion and vehicles emission. An overreliance on coal is the major reason why air pollution
12 Pollution intensity equals to statistics of pollution emission in 2010 divided by the areas of administrative divisions. These statistics come from the Notice on the Issuance of the 12th Five-Year Plan of Energy Saving and Emission Reduction Comprehensive Program by State Council (NDRC [2011]26)
10
emissions are so high. Coal combustion contributes to 80% of total sulfur dioxide emissions and 70% of total nitrogen oxide emissions. As China's push to urbanize speeds up, recent years have seen an increase in the number of vehicles on the roads, becoming a major contributor to nitrogen oxide. In 2010, nitrogen oxide emissions from vehicles accounted for 26% of the total in China. Thus our analysis on the future challenge of improving air quality factors in coal combustion and the vehicle numbers.
A. Coal Consumption Table 4: Coal consumption intensity in three regions
Area
Coal Consumption in 2010 (10,000 tons)
Coal Consumption Intensity Per Unit Area in 2010 (ton/km2)
Coal Consumption in 201513 (10,000 tons)
Coal Consumption Intensity in 2015 (ton/km2)
Shanghai 5876 9326 5876 9327 Jiangsu 23100 2310 25411 2541 Zhejiang 13950 1395 15345 1534 Yangtze River Delta 42926 2081 46631 2260Tianjin 4807 4370 5528 5025 Beijing 2635 1568 1500 893 Hebei 27465 1446 31584 1662 Jing-Jin-Ji 34906 1603 38612 1773 Guangdong 15984 888 15984 888 National Average Level
342.9
13 The calculation is based on the limit on coal consumption raised by Ministry of Environmental Protection in the 12th Five-Year Plan of Atmospheric Pollution Joint Prevention and Control in Priority Regions (Draft for Discussion).
11

Figure 3: Coal Consumption Intensity in three Regions
Shanghai tops the list in terms of coal consumption intensity. Tianjin, an industrially developed city, ranks second. Jiangsu in Yangtze River Delta takes third place, while Guangdong fares better. But overall, the coal consumption intensity per unit area in coastal areas of Eastern China is three to six times the national level. According to the limit of total coal consumption for the coming five years as set by Ministry of Environmental Protection, coal consumption intensity in Jing-Jin-Ji region and Yangtze River Delta will continue to increase by 8% and 10 % respectively, which will pose a great challenge to the improvement of air quality and meeting standards in the above regions. The only exception being the Pearl River Delta which is expecting zero coal consumption increases in MEP’s draft plan.
B. The Number of VehiclesIn 2010, nitrogen oxide emitted from vehicles throughout the country reached 5.994 million tons, accounting for 26% of the total emissions (also see footnote 13). The continuous increase in vehicles makes air pollution a complicated issue. According to the 2011 Vehicle air pollution Annual Report, provinces that have a large number of vehicles in 2010 are primarily located in Eastern China. Guangdong (7.768 million), Shandong (7.005 million), Jiangsu (5.453 million), Zhejiang (5.381 million), Hebei (4.869 million) top the list in terms of number of vehicles.
Density of vehicles can also tell us something. Table 5 shows that Beijing has the largest number of vehicles in China and the highest density of vehicles in Jing-Jin-Ji region. With regards to density, Shanghai has the highest density of vehicles in China, equivalent to 23 times the national average level.
But we must take note that except Beijing and Shanghai, none of the other areas have introduced a policy to control the increasing number of vehicles. The
12
National average line

uncontrolled vehicle increase will undoubtedly burden the already heavily polluted air.
Table 5: Density of Vehicles in Three Regions
Province/Direct-Controlled Municipality
The Number of Vehicles in 2010 (Million)14
Density of Vehicles (Million/Square Kilometers)15
Shanghai 2.7 4.66Beijing 4.76 2.83Tianjin 1.8 1.64Jiangsu 5.45 0.55Zhejiang 5.38 0.54Guangdong 7.77 0.43Hebei 4.87 0.26Naitonal Average Level 190 0.2
4. Policy RecommendationsIn conclusion, the air pollution situation in the cities of Jing-Jin-Ji region, Yangtze River Delta and Pearl River Delta is increasingly bleak, with coal consumption and the number of vehicles on the roads continuing to grow far too rapidly. Eastern China is already heavily burdened with pollution and this, without a doubt, will bring great challenges to air quality improvement.
Expanding urbanization only increases the influence and impacts between neighboring areas. The Ministry of Environmental Protection has found that the above cities all share a portion of air pollution to other parts of their respective region. 16-26% of inhalable particles are contributed by external sources16. The urban air quality improvement action requires coordinated efforts among regions.
Hence the suggestions from Greenpeace are: 1. Ministry of Environmental Protection should introduce the 12th Five-Year Plan of Air Pollution Joint Control and Prevention Planning in Priority Regions as early as possible, specify the air pollution improvement target in priority areas during the 12th FYP, set clear targets regarding the control of coal consumption in these areas and check the increase of pollutants at their source.
14 Source of Data, 2011 Annual air pollution Report of Vehicle Pollution Prevention, Ministry of Environmental Protection. 15 Vehicle Density = Number of Vehicles ÷ Size of Administrative Area16 12th Five Year Plan of Atmospheric Pollution Joint Prevention and Control in Environmental Protection Priority Regions (Draft for Discussion), September 2011
13
2. Cities in Jing-Jin-Ji region, Yangtze River Delta and Pearl River Delta should formulate legally binding plans as early as possible as well as regional coordinated plans to ensure air quality in these regions and propose clear timelines to reach national air quality standards, especially on PM2.5. 3. Cities in Jing-Jin-Ji region, Yangtze River Delta and Pearl River Delta should set clear, progressive and absolute limits on coal consumption – a coal cap, to effectively restrain the rapid growth of coal consumption.
4. Cities in Jing-Jin-Ji region, Yangtze River Delta and Pearl River Delta should introduce effective policy instruments to curb the rapid growth of the number of vehicles on the roads.
5. Given that coal consumption could still continue to increase in the years to come, Jing-Jin-Ji region, Yangtze River Delta, Pearl River Delta should implement the special limit for air pollution emissions (the strictest limit) as seen in Table 2 of Emission Standard of Air Pollution of Coal-Fired Power Plants (GB13223-2001)17 as early as possible, and introduce similar regulations to other big coal consuming industries.
Final words from Greenpeace
This ranking is the first attempt from Greenpeace, and likely from any other organizations, to combine and comment on "clean air" actions taken by major Chinese cities, following the recent debate in China on PM2.5 pollution. Limited by the different levels of government information disclosure on plans or regulations, there may still be points missing from this ranking report, making this far from perfect. We will continue to carry on our ranking work and as more information becomes available strive to produce more comprehensive rankings in the future.
May 2012
17 Ministry of Environmental Protection, Emission standard of air pollutants for thermal power plants, http://kjs.mep.gov.cn/hjbhbz/bzwb/dqhjbh/dqgdwrywrwpfbz/201109/t20110921_217534.htm
14

Attachment: A compilation of local air pollution alleviation plans and regulations in cities and provinces in the three regions (in Chinese).
15