Embed Size (px)
Citation preview
HOUSTONREGIONAL MARKET PROFILE
i
TA B L E O F CO N T EN TS
2 | Regional Growth
4 | Innovation
6 | Regional Economy
8 | Greater Houston Region
10 | Global Access to People and Goods
12 | Talent & Education
18 | Demographics & Diversity
20 | Quality of Life
24 | Industry Sector: Energy
26 | Industry Sector: Life Sciences
28 | Industry Sector: HQ & Business Services
30 | Industry Sector: Advanced Manufacturing
32 | Top Projects
34 | Doing Business in Houston
37 | State & Local Business incentives
41 | Accessibility and Transportation
44 | Services
45 | Economic Development Organizations
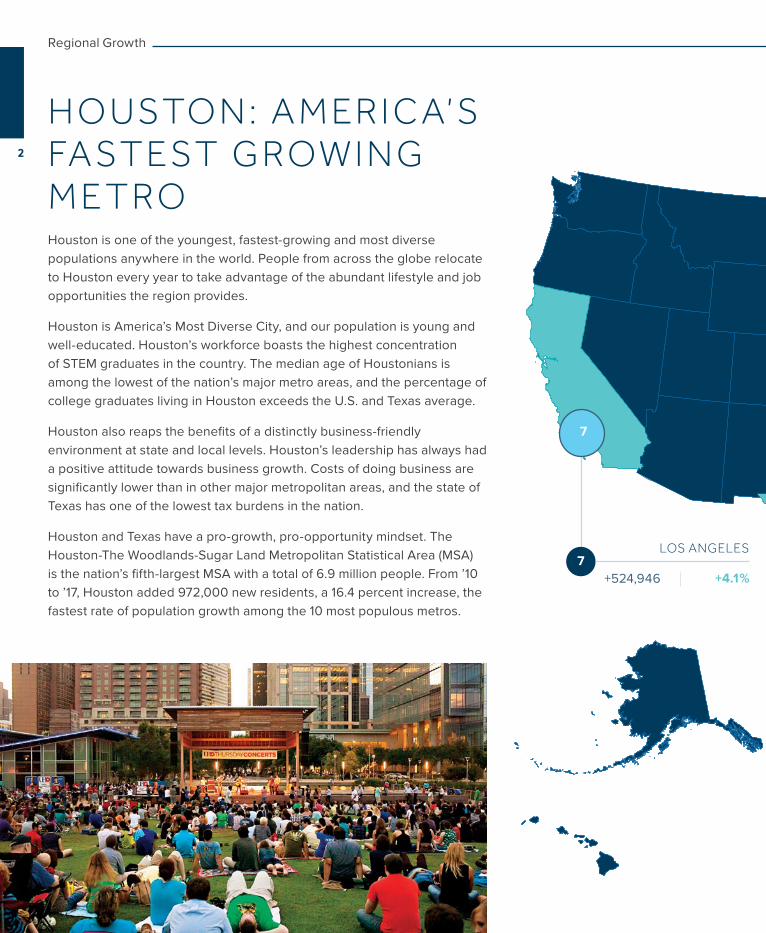
H O USTO N : A M ER I C A’ S FA ST E ST G ROW I N G M E T ROHouston is one of the youngest, fastest-growing and most diverse populations anywhere in the world. People from across the globe relocate to Houston every year to take advantage of the abundant lifestyle and job opportunities the region provides.
Houston is America’s Most Diverse City, and our population is young and well-educated. Houston’s workforce boasts the highest concentration of STEM graduates in the country. The median age of Houstonians is among the lowest of the nation’s major metro areas, and the percentage of college graduates living in Houston exceeds the U.S. and Texas average.
Houston also reaps the benefits of a distinctly business-friendly environment at state and local levels. Houston’s leadership has always had a positive attitude towards business growth. Costs of doing business are significantly lower than in other major metropolitan areas, and the state of Texas has one of the lowest tax burdens in the nation.
Houston and Texas have a pro-growth, pro-opportunity mindset. The Houston-The Woodlands-Sugar Land Metropolitan Statistical Area (MSA) is the nation’s fifth-largest MSA with a total of 6.9 million people. From ’10 to ’17, Houston added 972,000 new residents, a 16.4 percent increase, the fastest rate of population growth among the 10 most populous metros.
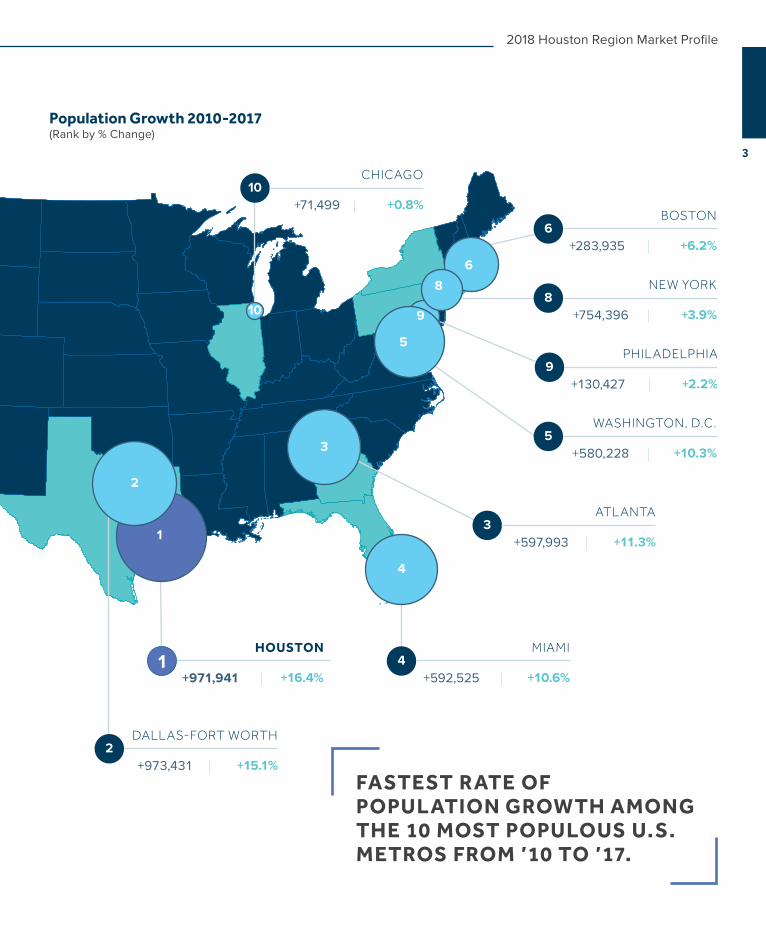
Population Growth 2010-2017(Rank by % Change)
2DALLAS-FORT WORTH
+973,431 +15.1%
+11.3%3
ATLANTA
+597,993
4MIAMI
+592,525 +10.6%
5WASHINGTON, D.C.
+580,228 +10.3%
6BOSTON
+283,935 +6.2%
8NEW YORK
+754,396 +3.9%
9PHILADELPHIA
+130,427 +2.2%
HOUSTON
+971,941 +16.4%1
7LOS ANGELES
+524,946 +4.1%
10CHICAGO
+71,499 +0.8%
7
1
2
3
4
10
5
6
8
9
2
Regional Growth
Population Growth 2010-2017(Rank by % Change)
2DALLAS-FORT WORTH
+973,431 +15.1%
+11.3%3
ATLANTA
+597,993
4MIAMI
+592,525 +10.6%
5WASHINGTON, D.C.
+580,228 +10.3%
6BOSTON
+283,935 +6.2%
8NEW YORK
+754,396 +3.9%
9PHILADELPHIA
+130,427 +2.2%
HOUSTON
+971,941 +16.4%1
7LOS ANGELES
+524,946 +4.1%
10CHICAGO
+71,499 +0.8%
7
1
2
3
4
10
5
6
8
9
FASTEST RATE OF POPULATION GROWTH AMONG THE 10 MOST POPULOUS U.S. METROS FROM ’10 TO ’17.
3
2018 Houston Region Market Profile
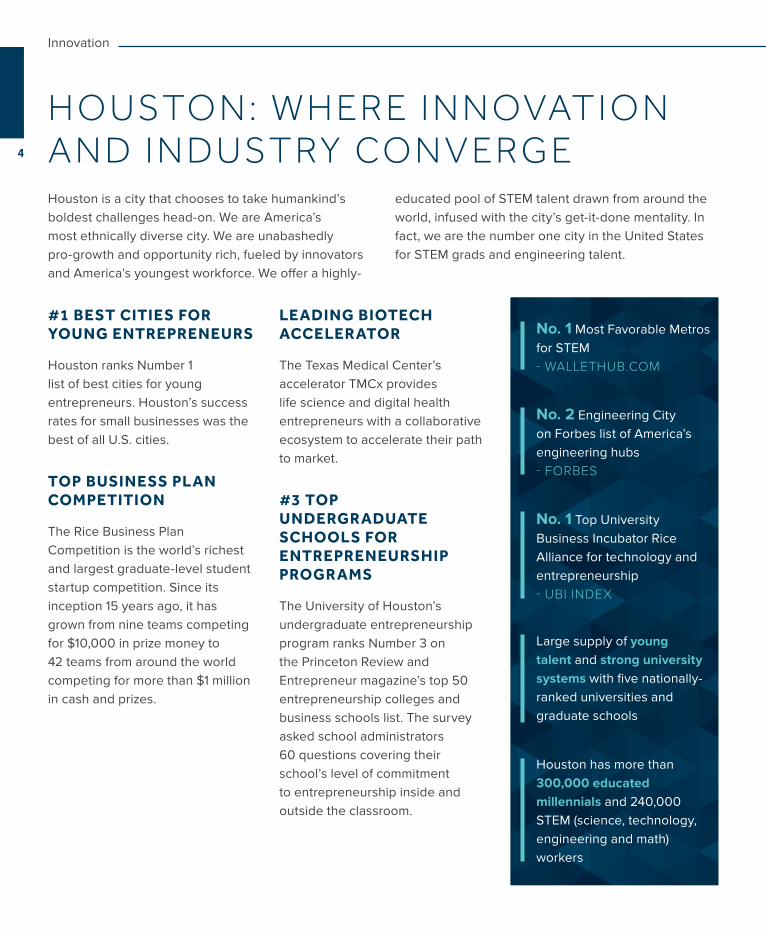
Houston is a city that chooses to take humankind’s boldest challenges head-on. We are America’s most ethnically diverse city. We are unabashedly pro-growth and opportunity rich, fueled by innovators and America’s youngest workforce. We offer a highly-
educated pool of STEM talent drawn from around the world, infused with the city’s get-it-done mentality. In fact, we are the number one city in the United States for STEM grads and engineering talent.
#1 BEST CITIES FOR YOUNG ENTREPRENEURS
Houston ranks Number 1 list of best cities for young entrepreneurs. Houston’s success rates for small businesses was the best of all U.S. cities.
TOP BUSINESS PLAN COMPETITION
The Rice Business Plan Competition is the world’s richest and largest graduate-level student startup competition. Since its inception 15 years ago, it has grown from nine teams competing for $10,000 in prize money to 42 teams from around the world competing for more than $1 million in cash and prizes.
LEADING BIOTECH ACCELERATOR
The Texas Medical Center’s accelerator TMCx provides life science and digital health entrepreneurs with a collaborative ecosystem to accelerate their path to market.
#3 TOP UNDERGRADUATE SCHOOLS FOR ENTREPRENEURSHIP PROGRAMS
The University of Houston’s undergraduate entrepreneurship program ranks Number 3 on the Princeton Review and Entrepreneur magazine’s top 50 entrepreneurship colleges and business schools list. The survey asked school administrators 60 questions covering their school’s level of commitment to entrepreneurship inside and outside the classroom.
H O USTO N : W H ER E I N N OVAT I O N A N D I N D UST RY CO N V ERG E
Houston has more than 300,000 educated millennials and 240,000 STEM (science, technology, engineering and math) workers
No. 1 Most Favorable Metros for STEM- WALLETHUB.COM
No. 2 Engineering City on Forbes list of America’s engineering hubs- FORBES
No. 1 Top University Business Incubator Rice Alliance for technology and entrepreneurship- UBI INDEX
Large supply of young talent and strong university systems with five nationally-ranked universities and graduate schools
4
Innovation
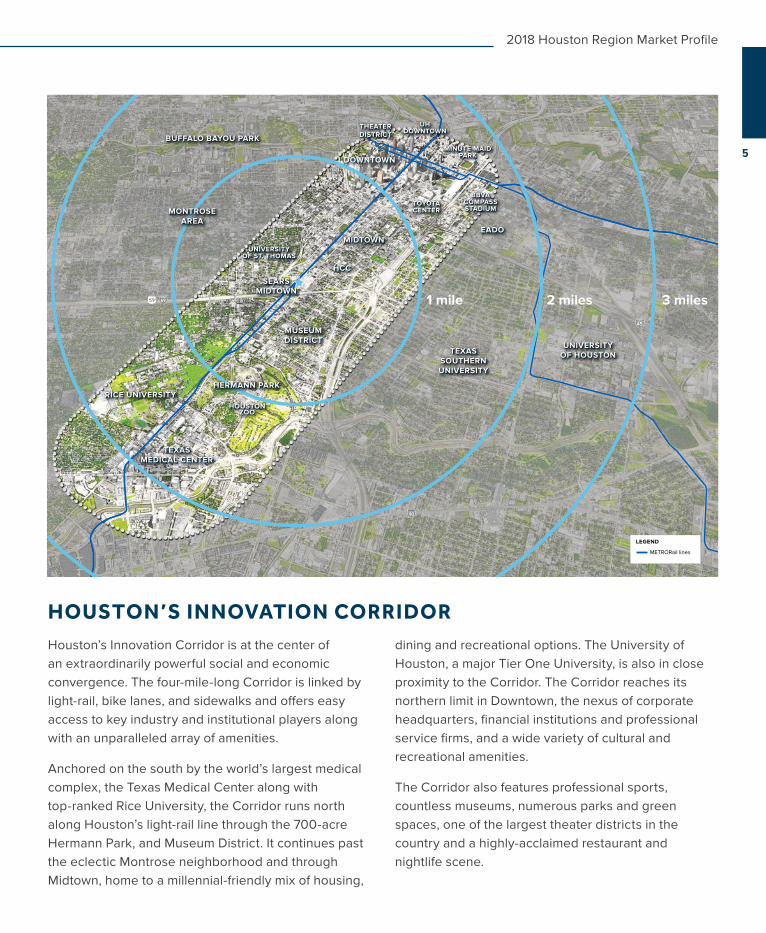
HOUSTON’S INNOVATION CORRIDOR Houston’s Innovation Corridor is at the center of an extraordinarily powerful social and economic convergence. The four-mile-long Corridor is linked by light-rail, bike lanes, and sidewalks and offers easy access to key industry and institutional players along with an unparalleled array of amenities.
Anchored on the south by the world’s largest medical complex, the Texas Medical Center along with top-ranked Rice University, the Corridor runs north along Houston’s light-rail line through the 700-acre Hermann Park, and Museum District. It continues past the eclectic Montrose neighborhood and through Midtown, home to a millennial-friendly mix of housing,
dining and recreational options. The University of Houston, a major Tier One University, is also in close proximity to the Corridor. The Corridor reaches its northern limit in Downtown, the nexus of corporate headquarters, financial institutions and professional service firms, and a wide variety of cultural and recreational amenities.
The Corridor also features professional sports, countless museums, numerous parks and green spaces, one of the largest theater districts in the country and a highly-acclaimed restaurant and nightlife scene.
TEXASSOUTHERNUNIVERSITY
TEXASMEDICAL CENTER
RICE UNIVERSITYHERMANN PARK
DOWNTOWN
HOUSTONZOO
MUSEUMDISTRICT
EADO
UNIVERSITYOF HOUSTON
MONTROSEAREA
BUFFALO BAYOU PARK
THEATERDISTRICT
MINUTE MAIDPARK
TOYOTACENTER
UHDOWNTOWN
BBVACOMPASSSTADIUM
MIDTOWN
HCC
UNIVERSITYOF ST. THOMAS
TEXASSOUTHERNUNIVERSITY
90
45
6959 1 mile 2 miles 3 miles
TEXASMEDICAL CENTER
RICE UNIVERSITYHERMANN PARK
DOWNTOWN
HOUSTONZOO
MUSEUMDISTRICT
EADO
UNIVERSITYOF HOUSTON
MONTROSEAREA
BUFFALO BAYOU PARK
THEATERDISTRICT
MINUTE MAIDPARK
TOYOTACENTER
UHDOWNTOWN
BBVACOMPASSSTADIUM
MIDTOWN
HCC
UNIVERSITYOF ST. THOMAS
90
45
6959
SEARSMIDTOWN
SEARSMIDTOWN
LEGEND
METRORail lines
5
2018 Houston Region Market Profile
Metro Area $ in Billions
New York 1,657.5
Los Angeles 1,001.7
Chicago 651.2
Dallas 511.6
Washington, D.C. 509.2
HOUSTON 478.6
San Francisco 470.5
Philadelphia 431.0
Boston 422.7
Atlanta 363.8
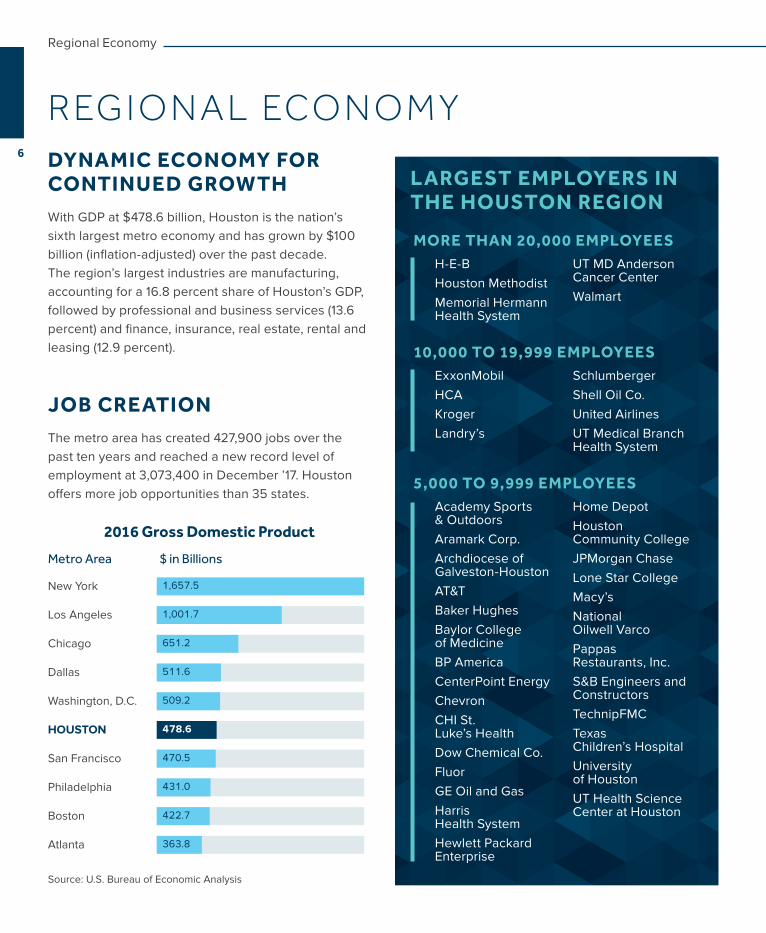
DYNAMIC ECONOMY FOR CONTINUED GROWTHWith GDP at $478.6 billion, Houston is the nation’s sixth largest metro economy and has grown by $100 billion (inflation-adjusted) over the past decade. The region’s largest industries are manufacturing, accounting for a 16.8 percent share of Houston’s GDP, followed by professional and business services (13.6 percent) and finance, insurance, real estate, rental and leasing (12.9 percent).
JOB CREATIONThe metro area has created 427,900 jobs over the past ten years and reached a new record level of employment at 3,073,400 in December ’17. Houston offers more job opportunities than 35 states.
R EG I O N A L ECO N O MY
2016 Gross Domestic Product
Source: U.S. Bureau of Economic Analysis
H-E-BHouston MethodistMemorial Hermann Health System
UT MD Anderson Cancer CenterWalmart
MORE THAN 20,000 EMPLOYEES
ExxonMobilHCAKrogerLandry’s
SchlumbergerShell Oil Co. United AirlinesUT Medical Branch Health System
10,000 TO 19,999 EMPLOYEES
Academy Sports & OutdoorsAramark Corp. Archdiocese of Galveston-HoustonAT&TBaker HughesBaylor College of MedicineBP AmericaCenterPoint EnergyChevronCHI St. Luke’s HealthDow Chemical Co.FluorGE Oil and GasHarris Health SystemHewlett Packard Enterprise
Home DepotHouston Community CollegeJPMorgan ChaseLone Star CollegeMacy’sNational Oilwell VarcoPappas Restaurants, Inc.S&B Engineers and ConstructorsTechnipFMCTexas Children’s HospitalUniversity of HoustonUT Health Science Center at Houston
5,000 TO 9,999 EMPLOYEES
LARGEST EMPLOYERS IN THE HOUSTON REGION
6
Regional Economy
Source: 2018 Perryman Economic Forecast, released February 2018
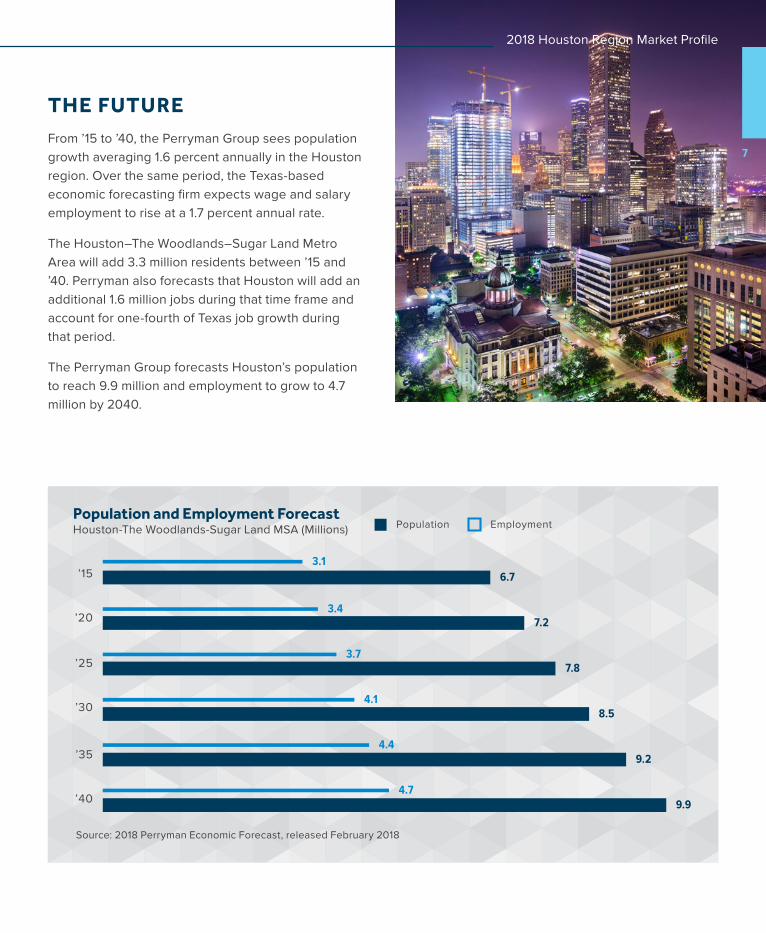
Population and Employment ForecastHouston-The Woodlands-Sugar Land MSA (Millions)
’15 6.73.1
7.23.4
’20
7.83.7
’25
8.54.1
’30
9.24.4
’35
9.94.7
’40
Population Employment
THE FUTUREFrom ’15 to ’40, the Perryman Group sees population growth averaging 1.6 percent annually in the Houston region. Over the same period, the Texas-based economic forecasting firm expects wage and salary employment to rise at a 1.7 percent annual rate.
The Houston–The Woodlands–Sugar Land Metro Area will add 3.3 million residents between ’15 and ’40. Perryman also forecasts that Houston will add an additional 1.6 million jobs during that time frame and account for one-fourth of Texas job growth during that period.
The Perryman Group forecasts Houston’s population to reach 9.9 million and employment to grow to 4.7 million by 2040.
7
2018 Houston Region Market Profile
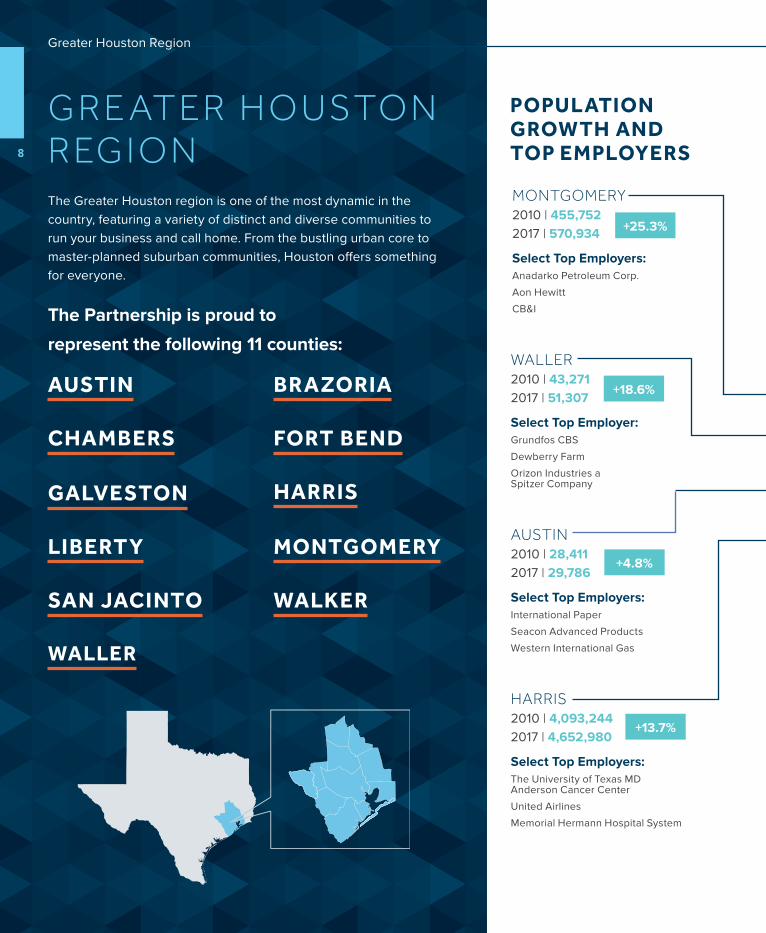
AUSTIN 2010 | 28,4112017 | 29,786
Select Top Employers:International Paper
Seacon Advanced Products
Western International Gas
+4.8%
MONTGOMERY2010 | 455,7522017 | 570,934
Select Top Employers:Anadarko Petroleum Corp.
Aon Hewitt
CB&I
+25.3%
HARRIS 2010 | 4,093,2442017 | 4,652,980
Select Top Employers:The University of Texas MD Anderson Cancer Center
United Airlines
Memorial Hermann Hospital System
+13.7%
WALLER2010 | 43,2712017 | 51,307
Select Top Employer:Grundfos CBS
Dewberry Farm
Orizon Industries a Spitzer Company
+18.6%
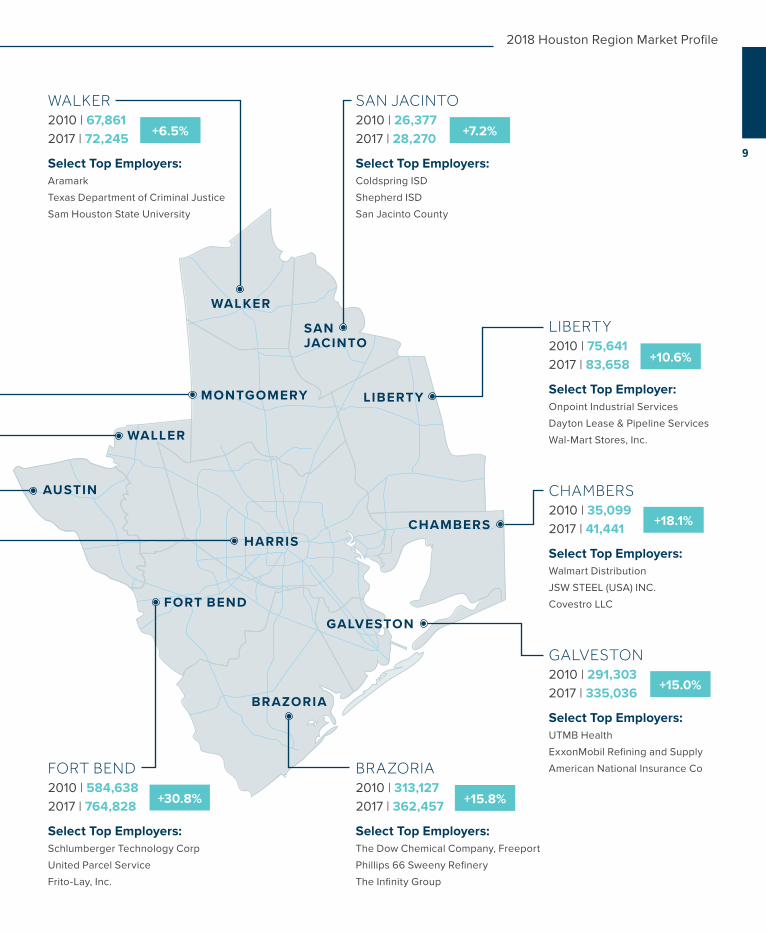
G R E AT ER H O USTO N R EG I O NThe Greater Houston region is one of the most dynamic in the country, featuring a variety of distinct and diverse communities to run your business and call home. From the bustling urban core to master-planned suburban communities, Houston offers something for everyone.
POPULATION GROWTH AND TOP EMPLOYERS
The Partnership is proud to
represent the following 11 counties:
WALLER
AUSTIN BRAZORIA
LIBERTY MONTGOMERY
FORT BENDCHAMBERS
GALVESTON HARRIS
WALKERSAN JACINTO
8
Greater Houston Region
SANJACINTO
LIBERTY
CHAMBERS
GALVESTON
BRAZORIA
FORT BEND
HARRIS
AUSTIN
MONTGOMERY
WALKER
WALLER
GALVESTON2010 | 291,3032017 | 335,036
Select Top Employers:UTMB Health
ExxonMobil Refining and Supply
American National Insurance Co
+15.0%
FORT BEND 2010 | 584,6382017 | 764,828
Select Top Employers:Schlumberger Technology Corp
United Parcel Service
Frito-Lay, Inc.
+30.8%
BRAZORIA 2010 | 313,1272017 | 362,457
Select Top Employers:The Dow Chemical Company, Freeport
Phillips 66 Sweeny Refinery
The Infinity Group
+15.8%
CHAMBERS 2010 | 35,0992017 | 41,441
Select Top Employers:Walmart Distribution
JSW STEEL (USA) INC.
Covestro LLC
+18.1%
SAN JACINTO 2010 | 26,3772017 | 28,270
Select Top Employers:Coldspring ISD
Shepherd ISD
San Jacinto County
+7.2%
LIBERTY 2010 | 75,6412017 | 83,658
Select Top Employer:Onpoint Industrial Services
Dayton Lease & Pipeline Services
Wal-Mart Stores, Inc.
+10.6%
WALKER 2010 | 67,8612017 | 72,245
Select Top Employers:Aramark
Texas Department of Criminal Justice
Sam Houston State University
+6.5%
9
2018 Houston Region Market Profile
6TH LARGEST ECONOMY IN THE U.S., 24TH LARGEST IN THE WORLD BY GDP.-U.S. BEA, IMF
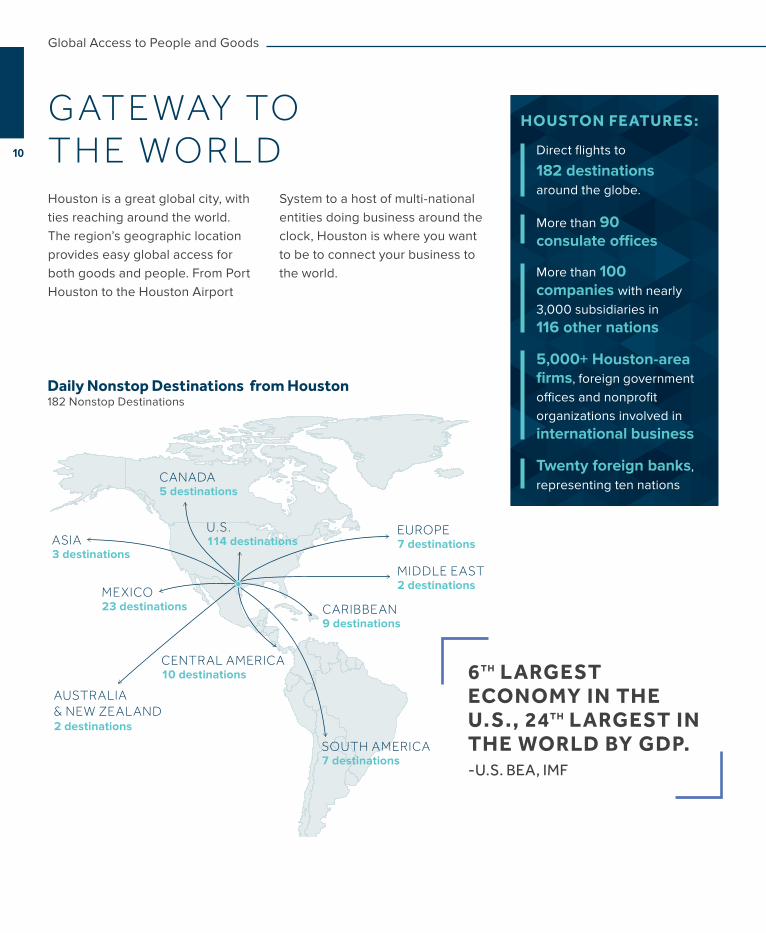
Daily Nonstop Destinations from Houston182 Nonstop Destinations
CENTRAL AMERICA10 destinations
SOUTH AMERICA7 destinations
AUSTRALIA& NEW ZEALAND2 destinations
MEXICO23 destinations
U.S.114 destinationsASIA
3 destinations
CARIBBEAN9 destinations
MIDDLE EAST2 destinations
EUROPE7 destinations
CANADA5 destinations
Houston is a great global city, with ties reaching around the world. The region’s geographic location provides easy global access for both goods and people. From Port Houston to the Houston Airport
System to a host of multi-national entities doing business around the clock, Houston is where you want to be to connect your business to the world.
GAT E WAY TO T H E WO R L D
HOUSTON FEATURES:
Direct flights to
182 destinations around the globe.
More than 90 consulate offices
More than 100 companies with nearly 3,000 subsidiaries in 116 other nations
5,000+ Houston-area firms, foreign government offices and nonprofit organizations involved in international business
Twenty foreign banks, representing ten nations
10
Global Access to People and Goods
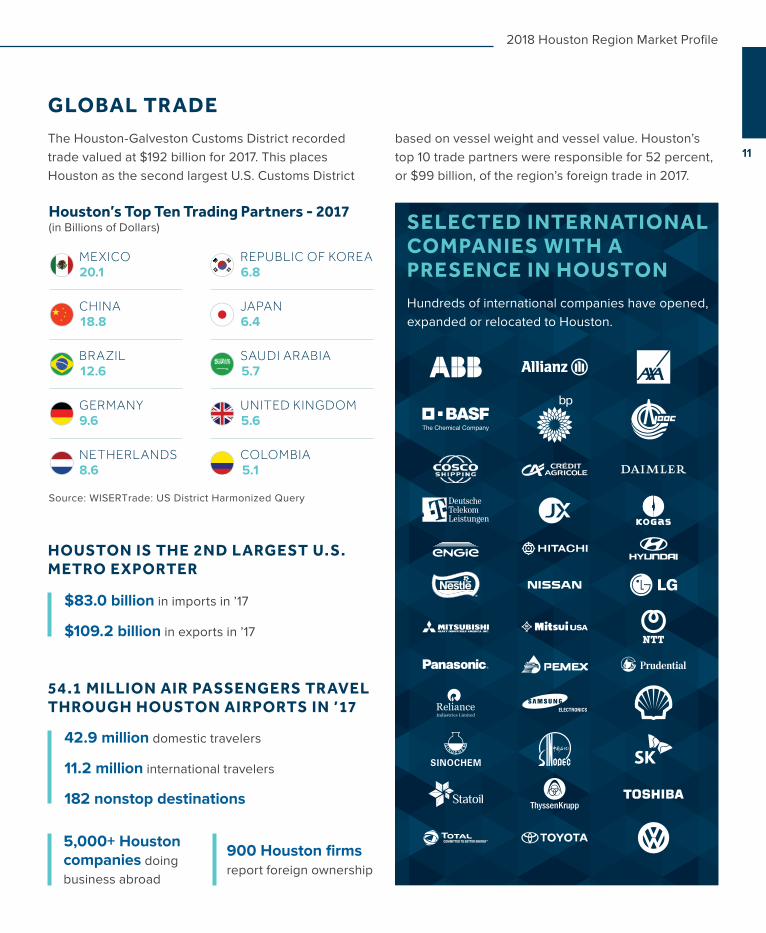
SELECTED INTERNATIONAL COMPANIES WITH A PRESENCE IN HOUSTONHundreds of international companies have opened, expanded or relocated to Houston.
HOUSTON IS THE 2ND LARGEST U.S. METRO EXPORTER
$83.0 billion in imports in ’17
$109.2 billion in exports in ’17
54.1 MILLION AIR PASSENGERS TRAVEL THROUGH HOUSTON AIRPORTS IN ’17
42.9 million domestic travelers
182 nonstop destinations
11.2 million international travelers
5,000+ Houston companies doing business abroad
900 Houston firms report foreign ownership
GLOBAL TRADEThe Houston-Galveston Customs District recorded trade valued at $192 billion for 2017. This places Houston as the second largest U.S. Customs District
based on vessel weight and vessel value. Houston’s top 10 trade partners were responsible for 52 percent, or $99 billion, of the region’s foreign trade in 2017.
Houston’s Top Ten Trading Partners - 2017(in Billions of Dollars)
Source: WISERTrade: US District Harmonized Query
20.1MEXICO
6.8REPUBLIC OF KOREA
18.8CHINA
6.4JAPAN
12.6BRAZIL
5.7SAUDI ARABIA
9.6GERMANY
5.6UNITED KINGDOM
8.6NETHERLANDS COLOMBIA
5.1
11
2018 Houston Region Market Profile
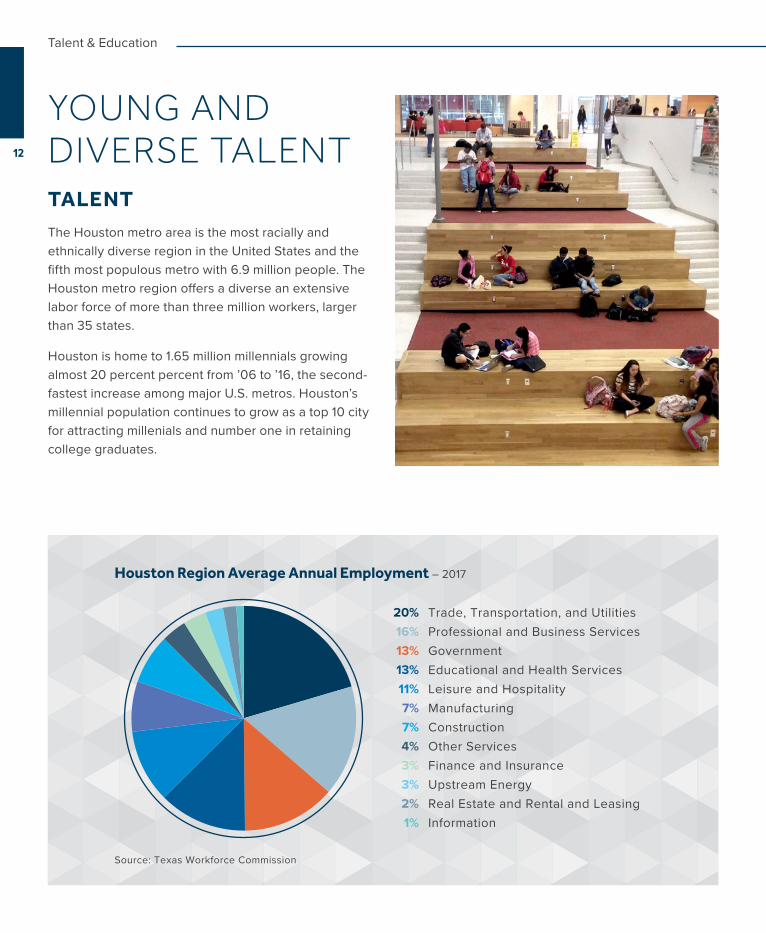
TALENTThe Houston metro area is the most racially and ethnically diverse region in the United States and the fifth most populous metro with 6.9 million people. The Houston metro region offers a diverse an extensive labor force of more than three million workers, larger than 35 states.
Houston is home to 1.65 million millennials growing almost 20 percent percent from ’06 to ’16, the second-fastest increase among major U.S. metros. Houston’s millennial population continues to grow as a top 10 city for attracting millenials and number one in retaining college graduates.
YOUNG AND DIVERSE TALENT
Houston Region Average Annual Employment – 2017
Source: Texas Workforce Commission
Trade, Transportation, and Utilities20%Professional and Business Services16%Government13%Educational and Health Services13%Leisure and Hospitality11%Manufacturing7%Construction7%Other Services4%Finance and Insurance3%Upstream Energy3%Real Estate and Rental and Leasing2%Information1%
12
Talent & Education
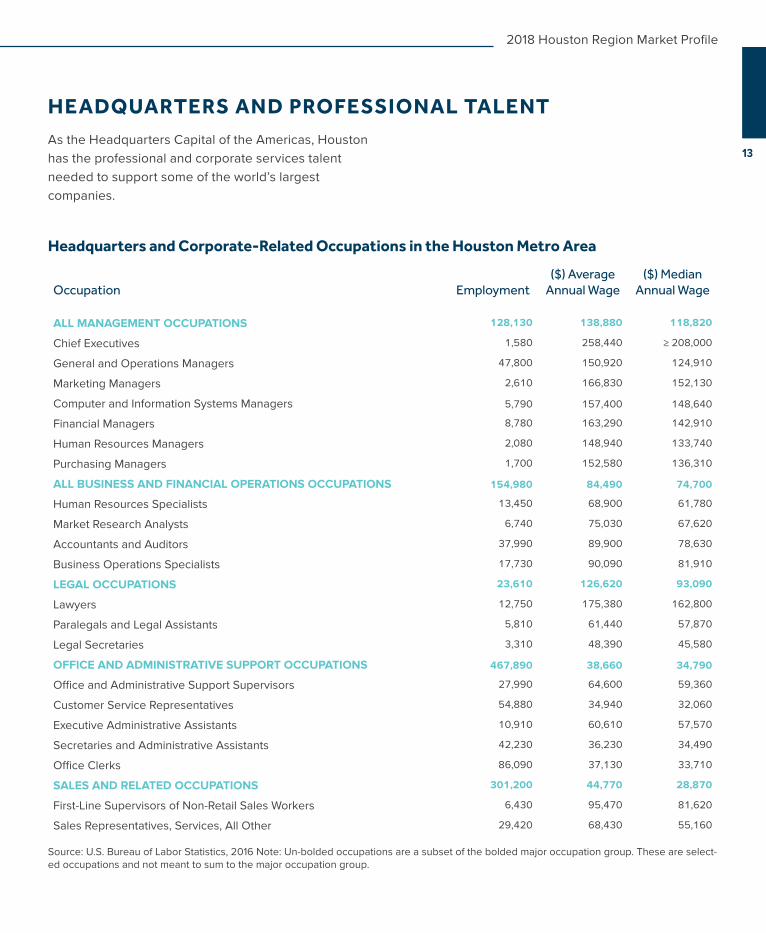
Occupation Employment($) Average
Annual Wage($) Median
Annual Wage
ALL MANAGEMENT OCCUPATIONS 128,130 138,880 118,820
Chief Executives 1,580 258,440 ≥ 208,000
General and Operations Managers 47,800 150,920 124,910
Marketing Managers 2,610 166,830 152,130
Computer and Information Systems Managers 5,790 157,400 148,640
Financial Managers 8,780 163,290 142,910
Human Resources Managers 2,080 148,940 133,740
Purchasing Managers 1,700 152,580 136,310
ALL BUSINESS AND FINANCIAL OPERATIONS OCCUPATIONS 154,980 84,490 74,700
Human Resources Specialists 13,450 68,900 61,780
Market Research Analysts 6,740 75,030 67,620
Accountants and Auditors 37,990 89,900 78,630
Business Operations Specialists 17,730 90,090 81,910
LEGAL OCCUPATIONS 23,610 126,620 93,090
Lawyers 12,750 175,380 162,800
Paralegals and Legal Assistants 5,810 61,440 57,870
Legal Secretaries 3,310 48,390 45,580
OFFICE AND ADMINISTRATIVE SUPPORT OCCUPATIONS 467,890 38,660 34,790
Office and Administrative Support Supervisors 27,990 64,600 59,360
Customer Service Representatives 54,880 34,940 32,060
Executive Administrative Assistants 10,910 60,610 57,570
Secretaries and Administrative Assistants 42,230 36,230 34,490
Office Clerks 86,090 37,130 33,710
SALES AND RELATED OCCUPATIONS 301,200 44,770 28,870
First-Line Supervisors of Non-Retail Sales Workers 6,430 95,470 81,620
Sales Representatives, Services, All Other 29,420 68,430 55,160
Headquarters and Corporate-Related Occupations in the Houston Metro Area
Source: U.S. Bureau of Labor Statistics, 2016 Note: Un-bolded occupations are a subset of the bolded major occupation group. These are select-ed occupations and not meant to sum to the major occupation group.
HEADQUARTERS AND PROFESSIONAL TALENTAs the Headquarters Capital of the Americas, Houston has the professional and corporate services talent needed to support some of the world’s largest companies.
13
2018 Houston Region Market Profile
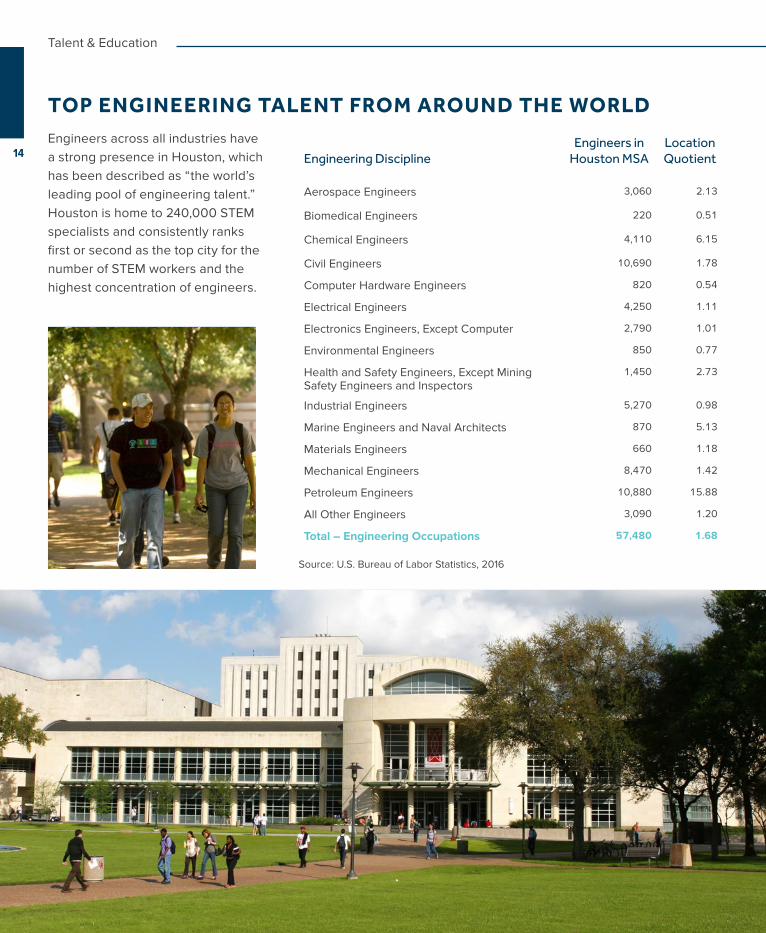
TOP ENGINEERING TALENT FROM AROUND THE WORLDEngineers across all industries have a strong presence in Houston, which has been described as “the world’s leading pool of engineering talent.” Houston is home to 240,000 STEM specialists and consistently ranks first or second as the top city for the number of STEM workers and the highest concentration of engineers.
Engineering DisciplineEngineers in
Houston MSALocation Quotient
Aerospace Engineers 3,060 2.13
Biomedical Engineers 220 0.51
Chemical Engineers 4,110 6.15
Civil Engineers 10,690 1.78
Computer Hardware Engineers 820 0.54
Electrical Engineers 4,250 1.11
Electronics Engineers, Except Computer 2,790 1.01
Environmental Engineers 850 0.77
Health and Safety Engineers, Except Mining Safety Engineers and Inspectors
1,450 2.73
Industrial Engineers 5,270 0.98
Marine Engineers and Naval Architects 870 5.13
Materials Engineers 660 1.18
Mechanical Engineers 8,470 1.42
Petroleum Engineers 10,880 15.88
All Other Engineers 3,090 1.20
Total – Engineering Occupations 57,480 1.68
Source: U.S. Bureau of Labor Statistics, 2016
14
Talent & Education
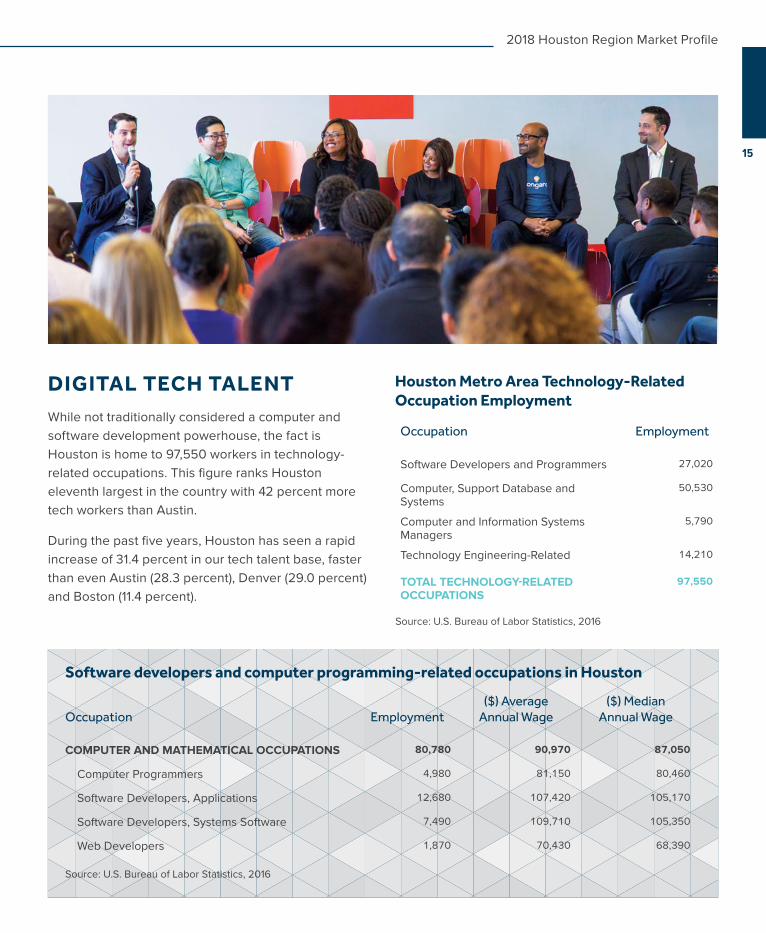
DIGITAL TECH TALENTWhile not traditionally considered a computer and software development powerhouse, the fact is Houston is home to 97,550 workers in technology-related occupations. This figure ranks Houston eleventh largest in the country with 42 percent more tech workers than Austin.
During the past five years, Houston has seen a rapid increase of 31.4 percent in our tech talent base, faster than even Austin (28.3 percent), Denver (29.0 percent) and Boston (11.4 percent).
Occupation Employment($) Average
Annual Wage($) Median
Annual Wage
COMPUTER AND MATHEMATICAL OCCUPATIONS 80,780 90,970 87,050
Computer Programmers 4,980 81,150 80,460
Software Developers, Applications 12,680 107,420 105,170
Software Developers, Systems Software 7,490 109,710 105,350
Web Developers 1,870 70,430 68,390
Source: U.S. Bureau of Labor Statistics, 2016
Software developers and computer programming-related occupations in Houston
Occupation Employment
Software Developers and Programmers 27,020
Computer, Support Database and Systems
50,530
Computer and Information Systems Managers
5,790
Technology Engineering-Related 14,210
TOTAL TECHNOLOGY-RELATED OCCUPATIONS
97,550
Houston Metro Area Technology-Related Occupation Employment
Source: U.S. Bureau of Labor Statistics, 2016
15
2018 Houston Region Market Profile
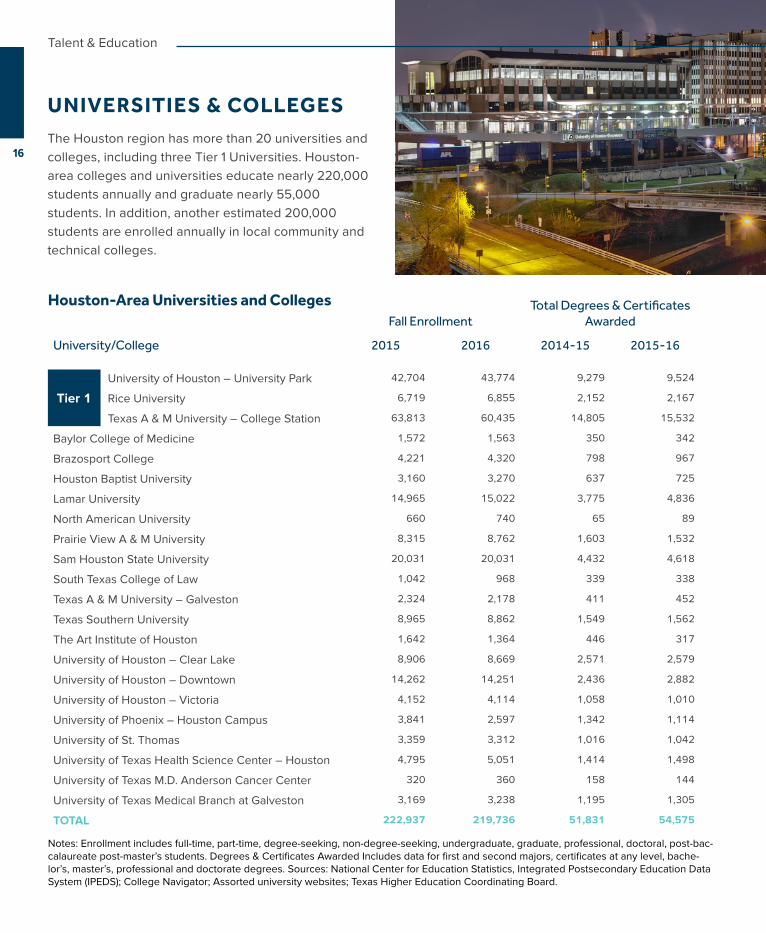
UNIVERSITIES & COLLEGESThe Houston region has more than 20 universities and colleges, including three Tier 1 Universities. Houston-area colleges and universities educate nearly 220,000 students annually and graduate nearly 55,000 students. In addition, another estimated 200,000 students are enrolled annually in local community and technical colleges.
Fall EnrollmentTotal Degrees & Certificates
Awarded
University/College 2015 2016 2014-15 2015-16
University of Houston – University Park 42,704 43,774 9,279 9,524
Rice University 6,719 6,855 2,152 2,167
Texas A & M University – College Station 63,813 60,435 14,805 15,532
Baylor College of Medicine 1,572 1,563 350 342
Brazosport College 4,221 4,320 798 967
Houston Baptist University 3,160 3,270 637 725
Lamar University 14,965 15,022 3,775 4,836
North American University 660 740 65 89
Prairie View A & M University 8,315 8,762 1,603 1,532
Sam Houston State University 20,031 20,031 4,432 4,618
South Texas College of Law 1,042 968 339 338
Texas A & M University – Galveston 2,324 2,178 411 452
Texas Southern University 8,965 8,862 1,549 1,562
The Art Institute of Houston 1,642 1,364 446 317
University of Houston – Clear Lake 8,906 8,669 2,571 2,579
University of Houston – Downtown 14,262 14,251 2,436 2,882
University of Houston – Victoria 4,152 4,114 1,058 1,010
University of Phoenix – Houston Campus 3,841 2,597 1,342 1,114
University of St. Thomas 3,359 3,312 1,016 1,042
University of Texas Health Science Center – Houston 4,795 5,051 1,414 1,498
University of Texas M.D. Anderson Cancer Center 320 360 158 144
University of Texas Medical Branch at Galveston 3,169 3,238 1,195 1,305
TOTAL 222,937 219,736 51,831 54,575
Houston-Area Universities and Colleges
Notes: Enrollment includes full-time, part-time, degree-seeking, non-degree-seeking, undergraduate, graduate, professional, doctoral, post-bac-calaureate post-master’s students. Degrees & Certificates Awarded Includes data for first and second majors, certificates at any level, bache-lor’s, master’s, professional and doctorate degrees. Sources: National Center for Education Statistics, Integrated Postsecondary Education Data System (IPEDS); College Navigator; Assorted university websites; Texas Higher Education Coordinating Board.
Tier 1
16
Talent & Education
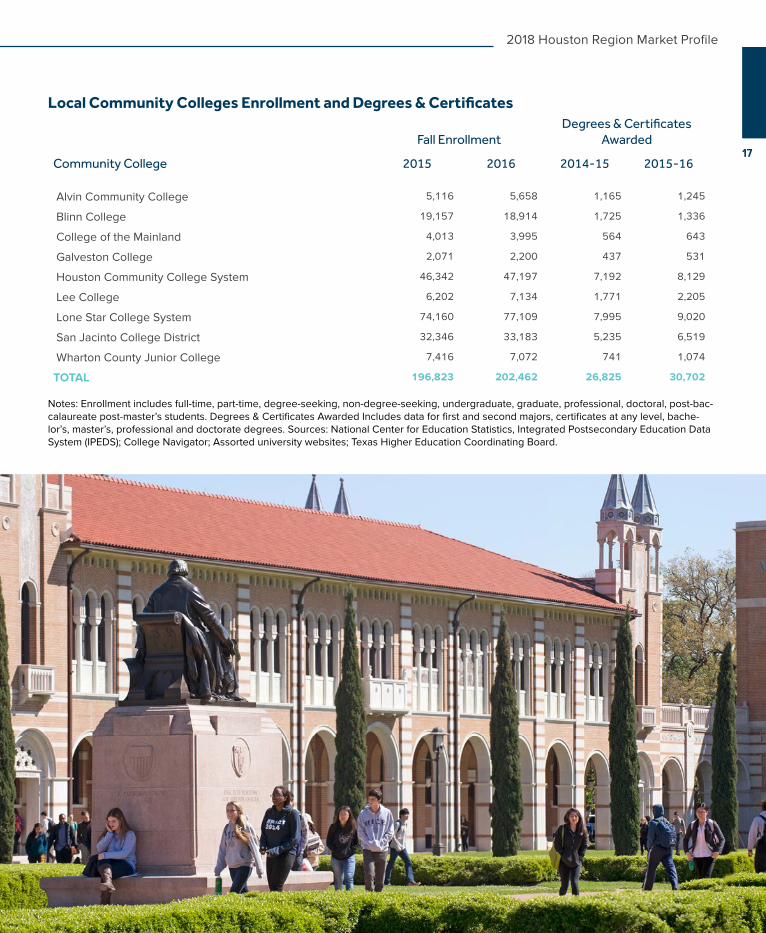
Fall EnrollmentDegrees & Certificates
Awarded
Community College 2015 2016 2014-15 2015-16
Alvin Community College 5,116 5,658 1,165 1,245
Blinn College 19,157 18,914 1,725 1,336
College of the Mainland 4,013 3,995 564 643
Galveston College 2,071 2,200 437 531
Houston Community College System 46,342 47,197 7,192 8,129
Lee College 6,202 7,134 1,771 2,205
Lone Star College System 74,160 77,109 7,995 9,020
San Jacinto College District 32,346 33,183 5,235 6,519
Wharton County Junior College 7,416 7,072 741 1,074
TOTAL 196,823 202,462 26,825 30,702
Local Community Colleges Enrollment and Degrees & Certificates
Notes: Enrollment includes full-time, part-time, degree-seeking, non-degree-seeking, undergraduate, graduate, professional, doctoral, post-bac-calaureate post-master’s students. Degrees & Certificates Awarded Includes data for first and second majors, certificates at any level, bache-lor’s, master’s, professional and doctorate degrees. Sources: National Center for Education Statistics, Integrated Postsecondary Education Data System (IPEDS); College Navigator; Assorted university websites; Texas Higher Education Coordinating Board.
17
2018 Houston Region Market Profile
Both the New York Times and LA Times have declared Houston “America’s Most Diverse City.” Houston has no ethnic majority and welcomes people from around the world. It has been said that in terms of racial and ethnic composition, the Houston of today resembles what America will look like in 40 years. In 2016, the Houston metro area was home to an estimated 1.6 million foreign-born residents, according to the U.S. Census Bureau. This figure represents 23.2 percent of the metro population, meaning nearly one-in-four Houstonians was born outside of the United States.
Also, as a global city, more than 145 languages are spoken here. In fact, four-in-ten Houstonians speak a language other than English at home. This is a fact that shows up in the Houston Independent School District’s dual-language programs that offer immersive-instruction in Arabic, Chinese, French, German, Hindi, Japanese, Spanish and several other languages. There is a richness to the fabric of Houston you will not find in many other cities. You will discover that Houstonians
have a sense of shared community, commitment and mutual respect that many American cities are searching for today.
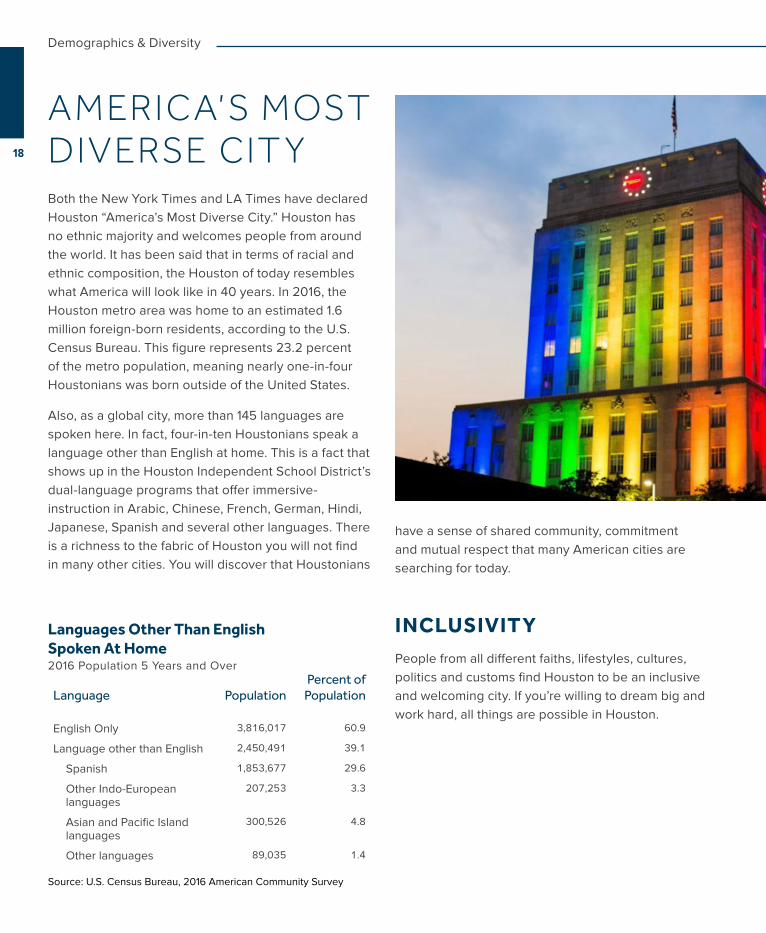
INCLUSIVITYPeople from all different faiths, lifestyles, cultures, politics and customs find Houston to be an inclusive and welcoming city. If you’re willing to dream big and work hard, all things are possible in Houston.
AMERICA’S MOST DIVERSE CIT Y
Demographics & Diversity
Language PopulationPercent of
Population
English Only 3,816,017 60.9
Language other than English 2,450,491 39.1
Spanish 1,853,677 29.6
Other Indo-European languages
207,253 3.3
Asian and Pacific Island languages
300,526 4.8
Other languages 89,035 1.4
Languages Other Than EnglishSpoken At Home2016 Population 5 Years and Over
Source: U.S. Census Bureau, 2016 American Community Survey
18
1 IN 4 HOUSTONIANS ARE FOREIGN-BORN
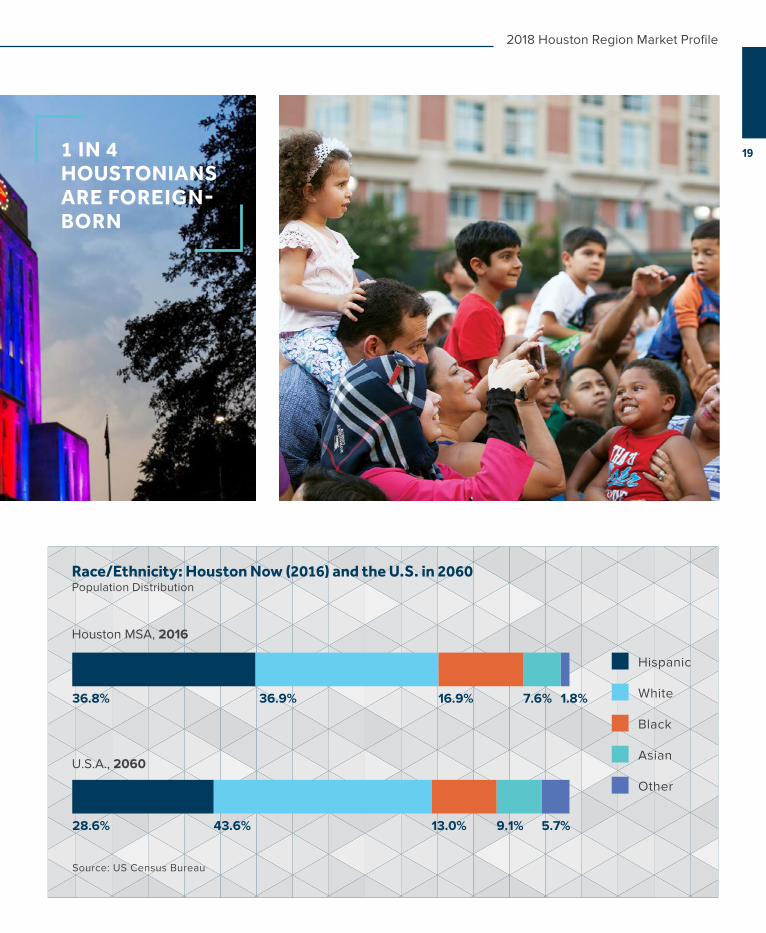
Race/Ethnicity: Houston Now (2016) and the U.S. in 2060Population Distribution
Houston MSA, 2016
U.S.A., 2060
36.8%
28.6%
36.9% 16.9% 7.6% 1.8%
43.6% 13.0% 9.1% 5.7%
Hispanic
White
Black
Asian
Other
Source: US Census Bureau
19
2018 Houston Region Market Profile
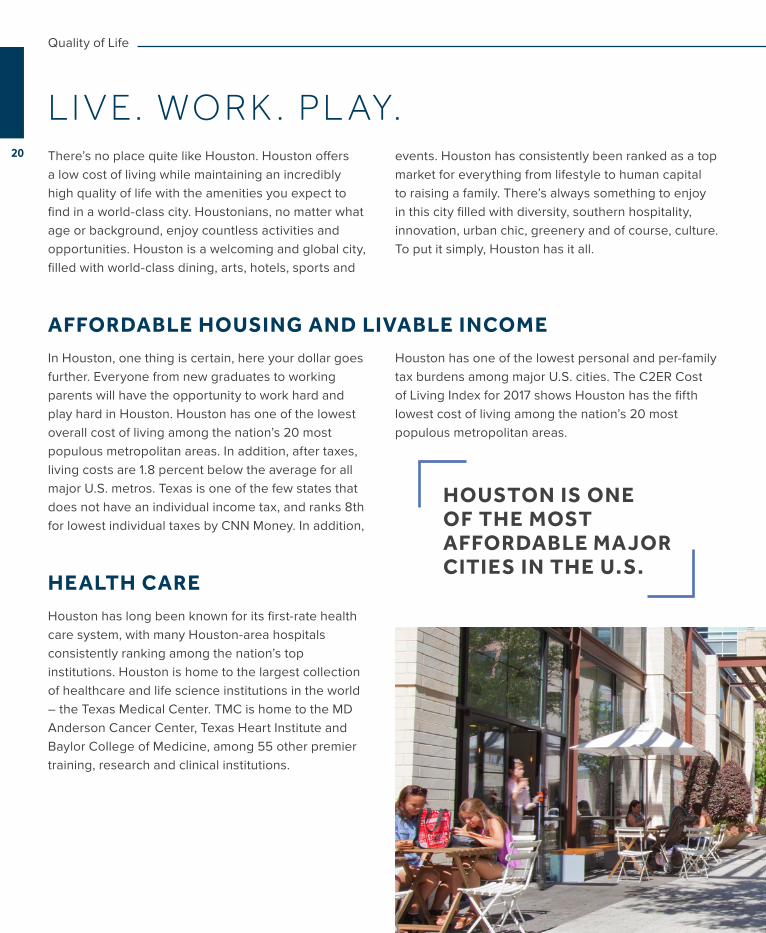
There’s no place quite like Houston. Houston offers a low cost of living while maintaining an incredibly high quality of life with the amenities you expect to find in a world-class city. Houstonians, no matter what age or background, enjoy countless activities and opportunities. Houston is a welcoming and global city, filled with world-class dining, arts, hotels, sports and
events. Houston has consistently been ranked as a top market for everything from lifestyle to human capital to raising a family. There’s always something to enjoy in this city filled with diversity, southern hospitality, innovation, urban chic, greenery and of course, culture. To put it simply, Houston has it all.
AFFORDABLE HOUSING AND LIVABLE INCOMEIn Houston, one thing is certain, here your dollar goes further. Everyone from new graduates to working parents will have the opportunity to work hard and play hard in Houston. Houston has one of the lowest overall cost of living among the nation’s 20 most populous metropolitan areas. In addition, after taxes, living costs are 1.8 percent below the average for all major U.S. metros. Texas is one of the few states that does not have an individual income tax, and ranks 8th for lowest individual taxes by CNN Money. In addition,
Houston has one of the lowest personal and per-family tax burdens among major U.S. cities. The C2ER Cost of Living Index for 2017 shows Houston has the fifth lowest cost of living among the nation’s 20 most populous metropolitan areas.
HEALTH CAREHouston has long been known for its first-rate health care system, with many Houston-area hospitals consistently ranking among the nation’s top institutions. Houston is home to the largest collection of healthcare and life science institutions in the world – the Texas Medical Center. TMC is home to the MD Anderson Cancer Center, Texas Heart Institute and Baylor College of Medicine, among 55 other premier training, research and clinical institutions.
L I V E. WO R K . PL AY.
HOUSTON IS ONE OF THE MOST AFFORDABLE MAJOR CITIES IN THE U.S.
20
Quality of Life
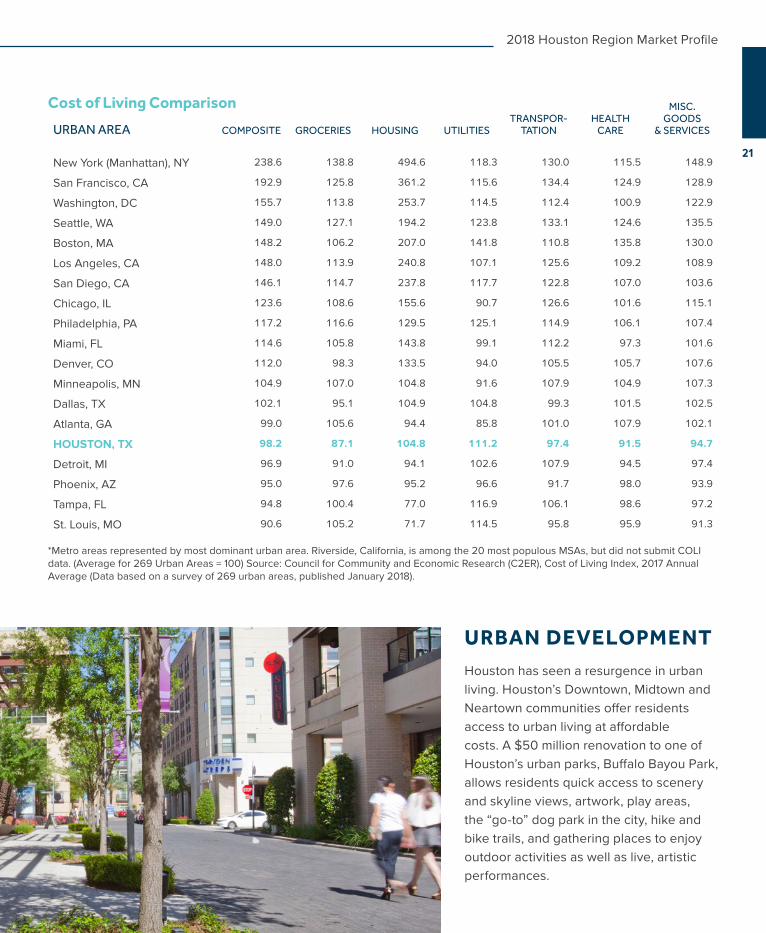
URBAN DEVELOPMENT Houston has seen a resurgence in urban living. Houston’s Downtown, Midtown and Neartown communities offer residents access to urban living at affordable costs. A $50 million renovation to one of Houston’s urban parks, Buffalo Bayou Park, allows residents quick access to scenery and skyline views, artwork, play areas, the “go-to” dog park in the city, hike and bike trails, and gathering places to enjoy outdoor activities as well as live, artistic performances.
URBAN AREA COMPOSITE GROCERIES HOUSING UTILITIESTRANSPOR-
TATIONHEALTH
CARE
MISC. GOODS
& SERVICES
New York (Manhattan), NY 238.6 138.8 494.6 118.3 130.0 115.5 148.9
San Francisco, CA 192.9 125.8 361.2 115.6 134.4 124.9 128.9
Washington, DC 155.7 113.8 253.7 114.5 112.4 100.9 122.9
Seattle, WA 149.0 127.1 194.2 123.8 133.1 124.6 135.5
Boston, MA 148.2 106.2 207.0 141.8 110.8 135.8 130.0
Los Angeles, CA 148.0 113.9 240.8 107.1 125.6 109.2 108.9
San Diego, CA 146.1 114.7 237.8 117.7 122.8 107.0 103.6
Chicago, IL 123.6 108.6 155.6 90.7 126.6 101.6 115.1
Philadelphia, PA 117.2 116.6 129.5 125.1 114.9 106.1 107.4
Miami, FL 114.6 105.8 143.8 99.1 112.2 97.3 101.6
Denver, CO 112.0 98.3 133.5 94.0 105.5 105.7 107.6
Minneapolis, MN 104.9 107.0 104.8 91.6 107.9 104.9 107.3
Dallas, TX 102.1 95.1 104.9 104.8 99.3 101.5 102.5
Atlanta, GA 99.0 105.6 94.4 85.8 101.0 107.9 102.1
HOUSTON, TX 98.2 87.1 104.8 111.2 97.4 91.5 94.7
Detroit, MI 96.9 91.0 94.1 102.6 107.9 94.5 97.4
Phoenix, AZ 95.0 97.6 95.2 96.6 91.7 98.0 93.9
Tampa, FL 94.8 100.4 77.0 116.9 106.1 98.6 97.2
St. Louis, MO 90.6 105.2 71.7 114.5 95.8 95.9 91.3
Cost of Living Comparison
*Metro areas represented by most dominant urban area. Riverside, California, is among the 20 most populous MSAs, but did not submit COLI data. (Average for 269 Urban Areas = 100) Source: Council for Community and Economic Research (C2ER), Cost of Living Index, 2017 Annual Average (Data based on a survey of 269 urban areas, published January 2018).
21
2018 Houston Region Market Profile
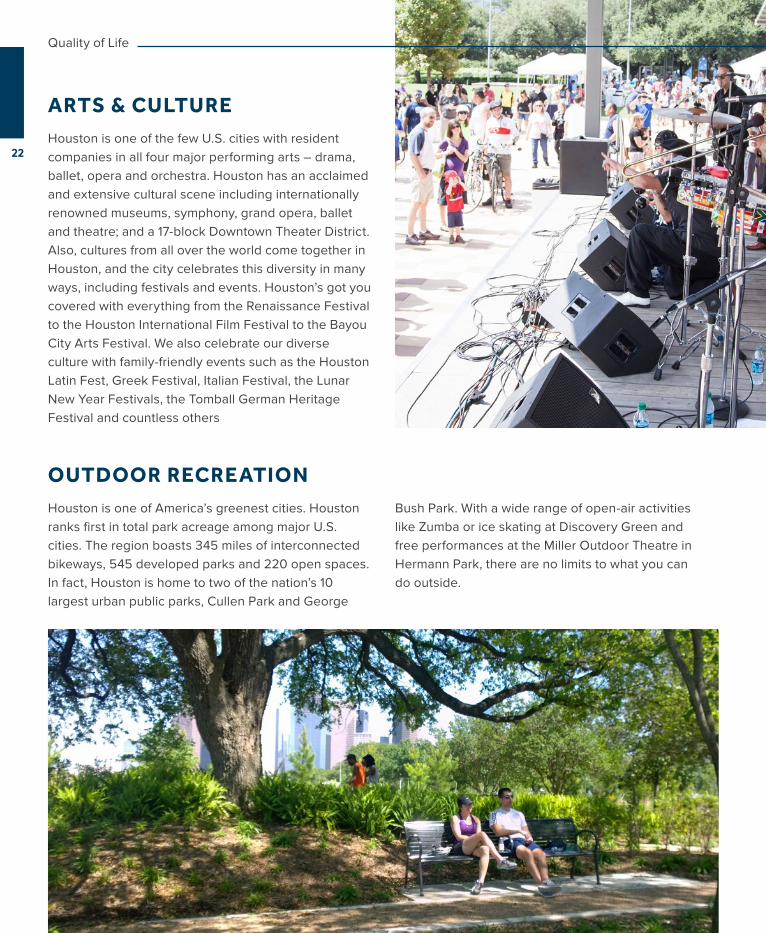
ARTS & CULTUREHouston is one of the few U.S. cities with resident companies in all four major performing arts – drama, ballet, opera and orchestra. Houston has an acclaimed and extensive cultural scene including internationally renowned museums, symphony, grand opera, ballet and theatre; and a 17-block Downtown Theater District. Also, cultures from all over the world come together in Houston, and the city celebrates this diversity in many ways, including festivals and events. Houston’s got you covered with everything from the Renaissance Festival to the Houston International Film Festival to the Bayou City Arts Festival. We also celebrate our diverse culture with family-friendly events such as the Houston Latin Fest, Greek Festival, Italian Festival, the Lunar New Year Festivals, the Tomball German Heritage Festival and countless others
OUTDOOR RECREATIONHouston is one of America’s greenest cities. Houston ranks first in total park acreage among major U.S. cities. The region boasts 345 miles of interconnected bikeways, 545 developed parks and 220 open spaces. In fact, Houston is home to two of the nation’s 10 largest urban public parks, Cullen Park and George
Bush Park. With a wide range of open-air activities like Zumba or ice skating at Discovery Green and free performances at the Miller Outdoor Theatre in Hermann Park, there are no limits to what you can do outside.
22
Quality of Life
SHOPPING & ENTERTAINMENTHouston offers world-class shopping, from the famed Houston Galleria to the pedestrian-friendly Sugar Land Town Square; from the urban vibe of CITYCENTRE to the family-friendly Memorial City Mall and The Woodlands Market Street. There is something for every taste and budget. Everyone can find something that they enjoy in Houston. And when it comes to music, there’s never a dull moment when it comes to Houston’s nightlife and entertainment. After all, this is where Lyle Lovett, Beyoncé and even ZZ Top got their start. The region boasts many of the top music venues in the country, with two state-of-the-art venues coming online within the last year: The White Oak Music Hall, Houston’s newest outdoor venue with 8,000 square feet of space with indoor and outdoor stages and the Sugar Land Smart Financial Centre, a flexible 200,000-square foot venue. These are just a few of the several dozen venues to check out for concerts and shows.
SPORTSHouston is a great place to play. You can enjoy countless lifestyles without the premium price of other major cities. From team sports to extreme sports, Houstonians are loyal and have that winning spirit. Houston has played host to the nation’s and the world’s largest sporting events like the Super Bowl, NCAA Finals, Major League Baseball All-Star Game, Copa America Centenario, and the NBA All-Star Game. Locally, Houstonians cheer on the Astros at Minute Maid Park, the Rockets at Toyota Center, the Texans at NRG Stadium, the Dynamo and the Dash at BBVA Compass Stadium, and the rustlers at the Houston Livestock Show and Rodeo (the world’s largest live entertainment and livestock exhibition in the world,) – and everything in between.
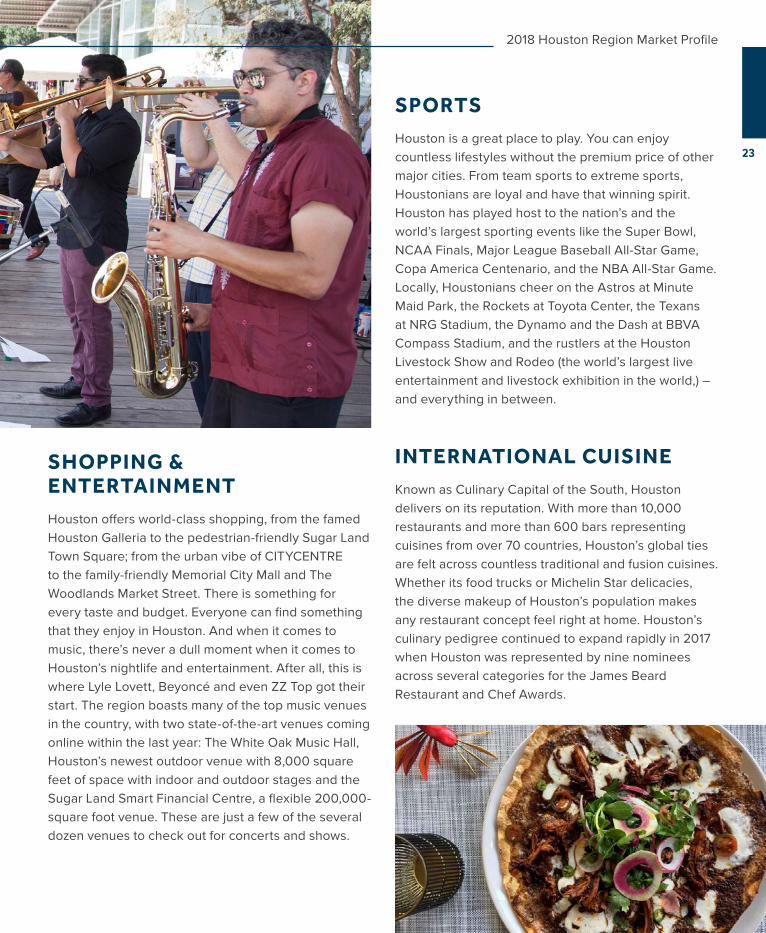
INTERNATIONAL CUISINEKnown as Culinary Capital of the South, Houston delivers on its reputation. With more than 10,000 restaurants and more than 600 bars representing cuisines from over 70 countries, Houston’s global ties are felt across countless traditional and fusion cuisines. Whether its food trucks or Michelin Star delicacies, the diverse makeup of Houston’s population makes any restaurant concept feel right at home. Houston’s culinary pedigree continued to expand rapidly in 2017 when Houston was represented by nine nominees across several categories for the James Beard Restaurant and Chef Awards.
23
2018 Houston Region Market Profile
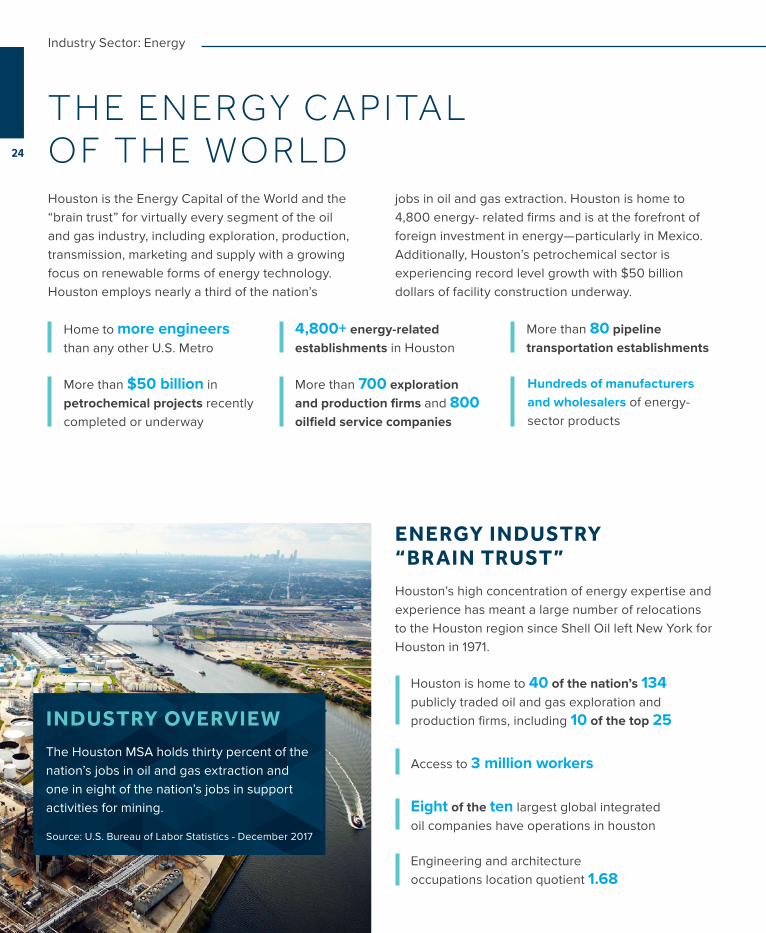
Houston is the Energy Capital of the World and the “brain trust” for virtually every segment of the oil and gas industry, including exploration, production, transmission, marketing and supply with a growing focus on renewable forms of energy technology. Houston employs nearly a third of the nation’s
jobs in oil and gas extraction. Houston is home to 4,800 energy- related firms and is at the forefront of foreign investment in energy—particularly in Mexico. Additionally, Houston’s petrochemical sector is experiencing record level growth with $50 billion dollars of facility construction underway.
INDUSTRY OVERVIEW The Houston MSA holds thirty percent of the nation’s jobs in oil and gas extraction and one in eight of the nation’s jobs in support activities for mining.
Source: U.S. Bureau of Labor Statistics - December 2017
T H E EN ERGY C A PI TA L O F T H E WO R L D
Home to more engineers than any other U.S. Metro
4,800+ energy-related establishments in Houston
More than 80 pipeline transportation establishments
More than $50 billion in petrochemical projects recently completed or underway
More than 700 exploration and production firms and 800 oilfield service companies
Hundreds of manufacturers and wholesalers of energy-sector products
Engineering and architecture occupations location quotient 1.68
Houston is home to 40 of the nation’s 134 publicly traded oil and gas exploration and production firms, including 10 of the top 25
Eight of the ten largest global integrated oil companies have operations in houston
ENERGY INDUSTRY “BRAIN TRUST” Houston’s high concentration of energy expertise and experience has meant a large number of relocations to the Houston region since Shell Oil left New York for Houston in 1971.
Access to 3 million workers
24
Industry Sector: Energy
Chevron Technology Ventures
Aramco Services’ 60,000 sf R&D center
Dow Chemical’s Texas Innovation Center
Houston is home to:
BP’s Center for High-Performance Computing (world’s largest private super computer)
Shell Technology Ventures (the first corporate venture fund in the oil and gas industry)
TECHNOLOGY AND RESEARCH AND DEVELOPMENT New energy technologies such as horizontal drilling, hydraulic fracturing and deep water offshore technology began or are centered in Houston.
PETROCHEMICAL POWERHOUSE
The Texas Gulf Coast has 25% of the nation’s refining capacity, capable of refining 4.8 Million barrels of oil per day
Houston has 40% of the nation’s base petrochemical manufacturing capacity
Source: Texas Workforce Commission, 3Q17
The Houston metro is home to:
576 Chemical 102 Petroleum products 220 Plastic
manufacturing establishments
25
2018 Houston Region Market Profile
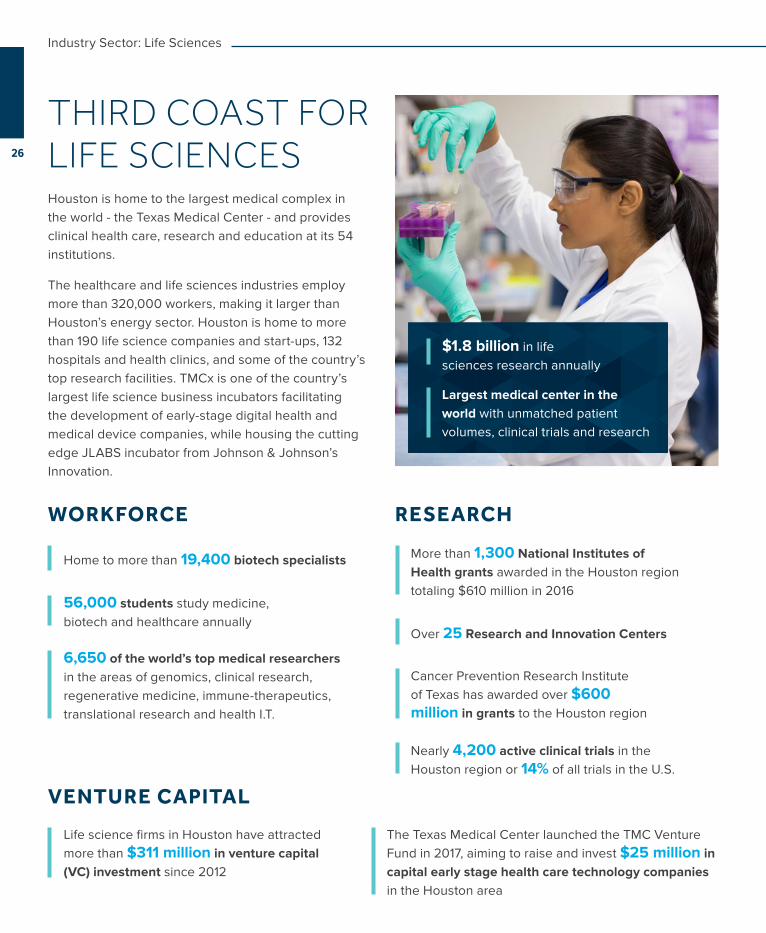
Houston is home to the largest medical complex in the world - the Texas Medical Center - and provides clinical health care, research and education at its 54 institutions.
The healthcare and life sciences industries employ more than 320,000 workers, making it larger than Houston’s energy sector. Houston is home to more than 190 life science companies and start-ups, 132 hospitals and health clinics, and some of the country’s top research facilities. TMCx is one of the country’s largest life science business incubators facilitating the development of early-stage digital health and medical device companies, while housing the cutting edge JLABS incubator from Johnson & Johnson’s Innovation.
THIRD COAST FOR LIFE SCIENCES
$1.8 billion in life sciences research annually
Largest medical center in the world with unmatched patient volumes, clinical trials and research
VENTURE CAPITAL
Life science firms in Houston have attracted more than $311 million in venture capital (VC) investment since 2012
The Texas Medical Center launched the TMC Venture Fund in 2017, aiming to raise and invest $25 million in capital early stage health care technology companies in the Houston area
WORKFORCE
Home to more than 19,400 biotech specialists
6,650 of the world’s top medical researchers in the areas of genomics, clinical research, regenerative medicine, immune-therapeutics, translational research and health I.T.
56,000 students study medicine, biotech and healthcare annually
RESEARCH
More than 1,300 National Institutes of Health grants awarded in the Houston region totaling $610 million in 2016
Over 25 Research and Innovation Centers
Cancer Prevention Research Institute of Texas has awarded over $600 million in grants to the Houston region
Nearly 4,200 active clinical trials in the Houston region or 14% of all trials in the U.S.
26
Industry Sector: Life Sciences
TMC: THE CENTER FOR INNOVATIONTMCx is one of the largest life sciences business accelerators in the nation providing a gateway to the facilities and resources of TMC.
THE FUTURE OF TMCTMC3 Innovation Campus will be a 30-acre campus centered around a 250,000 sq. ft. double helix. The facility will link existing campus research institutions to promote collaborative research under a single Institutional Review Board (IRB).
TEX AS MEDICAL CENTERWith the largest concentration of scientists anywhere, TMC is harnessing their collective knowledge, talent, and technology to lead the next generation of innovation.
TMC is the 8th largest business district in the U.S.
10 million patient encounters per year
Over 9,200 total patient beds
1,345 total acres106,000+ total employee
27
2018 Houston Region Market Profile
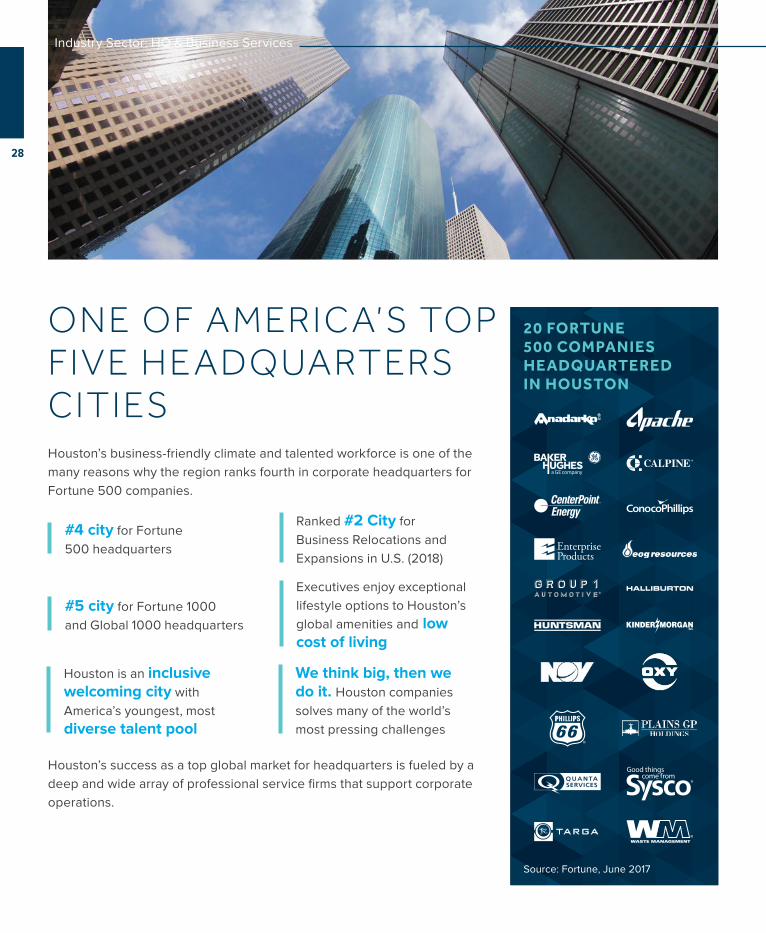
#5 city for Fortune 1000 and Global 1000 headquarters
Ranked #2 City for Business Relocations and Expansions in U.S. (2018)
#4 city for Fortune 500 headquarters
Executives enjoy exceptional lifestyle options to Houston’s global amenities and low cost of living
Houston is an inclusive welcoming city with America’s youngest, most diverse talent pool
We think big, then we do it. Houston companies solves many of the world’s most pressing challenges
20 FORTUNE 500 COMPANIES HEADQUARTERED IN HOUSTON
Source: Fortune, June 2017
28
Industry Sector: HQ & Business Services
ONE OF AMERICA’S TOP FIVE HE ADQUARTERS CITIESHouston’s business-friendly climate and talented workforce is one of the many reasons why the region ranks fourth in corporate headquarters for Fortune 500 companies.
Houston’s success as a top global market for headquarters is fueled by a deep and wide array of professional service firms that support corporate operations.
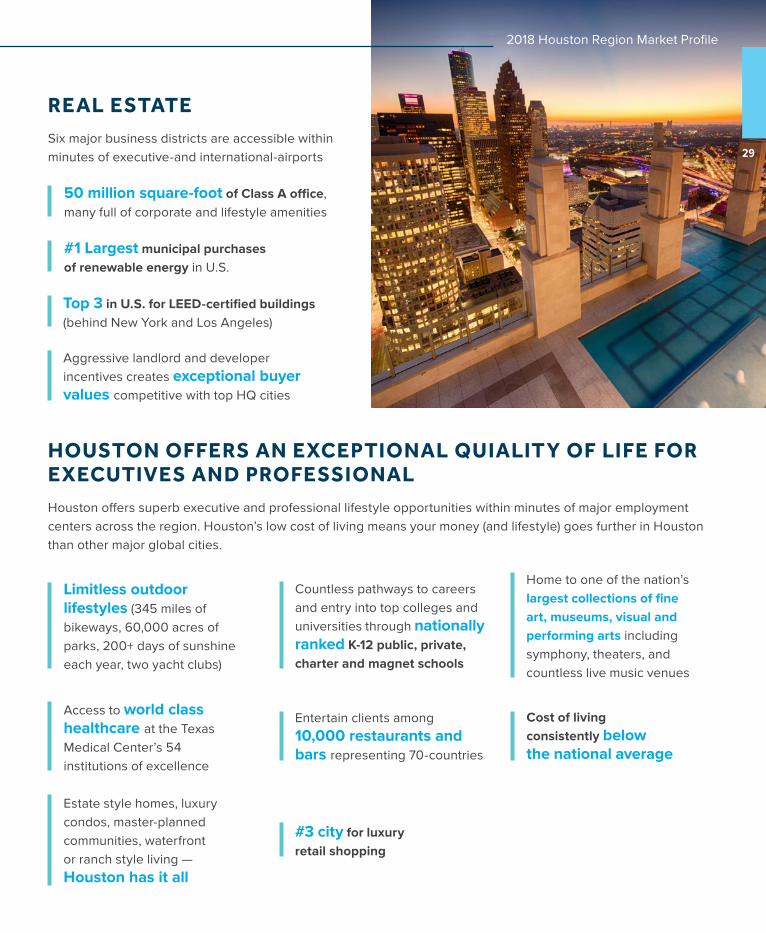
Estate style homes, luxury condos, master-planned communities, waterfront or ranch style living — Houston has it all
#3 city for luxury retail shopping
Entertain clients among 10,000 restaurants and bars representing 70-countries
Cost of living consistently below the national average
Access to world class healthcare at the Texas Medical Center’s 54 institutions of excellence
Limitless outdoor lifestyles (345 miles of bikeways, 60,000 acres of parks, 200+ days of sunshine each year, two yacht clubs)
Countless pathways to careers and entry into top colleges and universities through nationally ranked K-12 public, private, charter and magnet schools
Home to one of the nation’s largest collections of fine art, museums, visual and performing arts including symphony, theaters, and countless live music venues
HOUSTON OFFERS AN EXCEPTIONAL QUIALITY OF LIFE FOR EXECUTIVES AND PROFESSIONALHouston offers superb executive and professional lifestyle opportunities within minutes of major employment centers across the region. Houston’s low cost of living means your money (and lifestyle) goes further in Houston than other major global cities.
#1 Largest municipal purchases of renewable energy in U.S.
Aggressive landlord and developer incentives creates exceptional buyer values competitive with top HQ cities
50 million square-foot of Class A office, many full of corporate and lifestyle amenities
Top 3 in U.S. for LEED-certified buildings (behind New York and Los Angeles)
REAL ESTATESix major business districts are accessible within minutes of executive-and international-airports 29
2018 Houston Region Market Profile
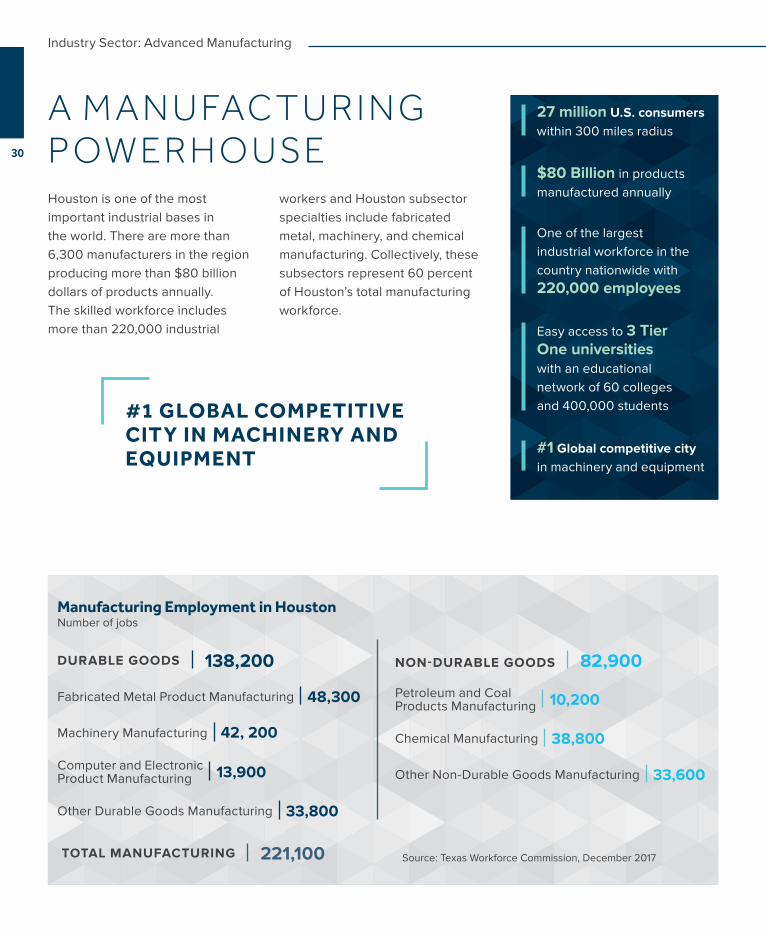
Source: Texas Workforce Commission, December 2017
Manufacturing Employment in HoustonNumber of jobs
221,100TOTAL MANUFACTURING
138,200DURABLE GOODS
48,300Fabricated Metal Product Manufacturing
42, 200Machinery Manufacturing
13,900Computer and Electronic Product Manufacturing
33,800Other Durable Goods Manufacturing
82,900NON-DURABLE GOODS
10,200Petroleum and Coal Products Manufacturing
38,800Chemical Manufacturing
33,600Other Non-Durable Goods Manufacturing
#1 GLOBAL COMPETITIVE CITY IN MACHINERY AND EQUIPMENT
27 million U.S. consumers within 300 miles radius
$80 Billion in products manufactured annually
One of the largest industrial workforce in the country nationwide with 220,000 employees
Easy access to 3 Tier One universities with an educational network of 60 colleges and 400,000 students
#1 Global competitive city in machinery and equipment
Houston is one of the most important industrial bases in the world. There are more than 6,300 manufacturers in the region producing more than $80 billion dollars of products annually. The skilled workforce includes more than 220,000 industrial
workers and Houston subsector specialties include fabricated metal, machinery, and chemical manufacturing. Collectively, these subsectors represent 60 percent of Houston’s total manufacturing workforce.
A M A N U FAC T U R I N G POW ER H O USE30
Industry Sector: Advanced Manufacturing
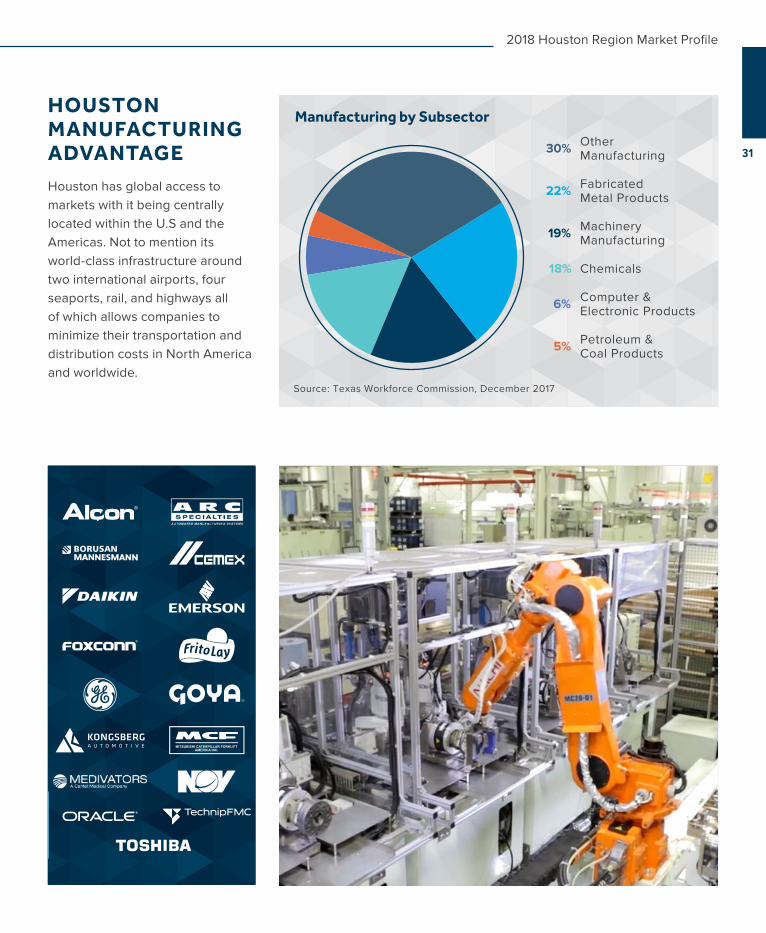
Chemicals18%
Petroleum & Coal Products5%
6% Computer &Electronic Products
MachineryManufacturing19%
FabricatedMetal Products22%
OtherManufacturing30%
Manufacturing by Subsector
Source: Texas Workforce Commission, December 2017
HOUSTON MANUFACTURING ADVANTAGEHouston has global access to markets with it being centrally located within the U.S and the Americas. Not to mention its world-class infrastructure around two international airports, four seaports, rail, and highways all of which allows companies to minimize their transportation and distribution costs in North America and worldwide.
31
2018 Houston Region Market Profile
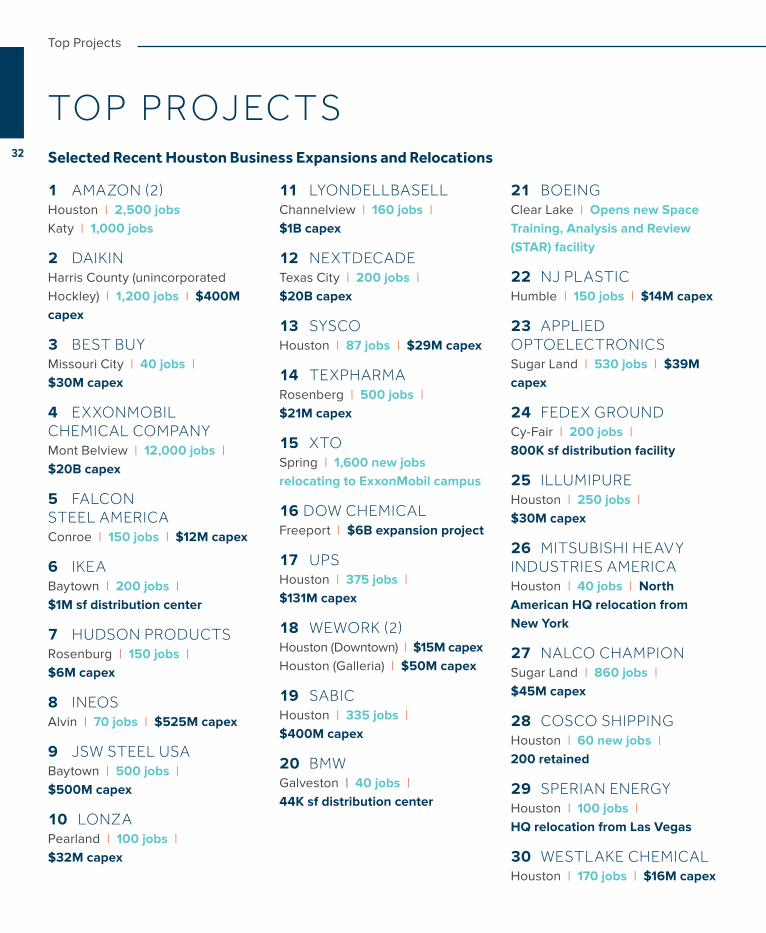
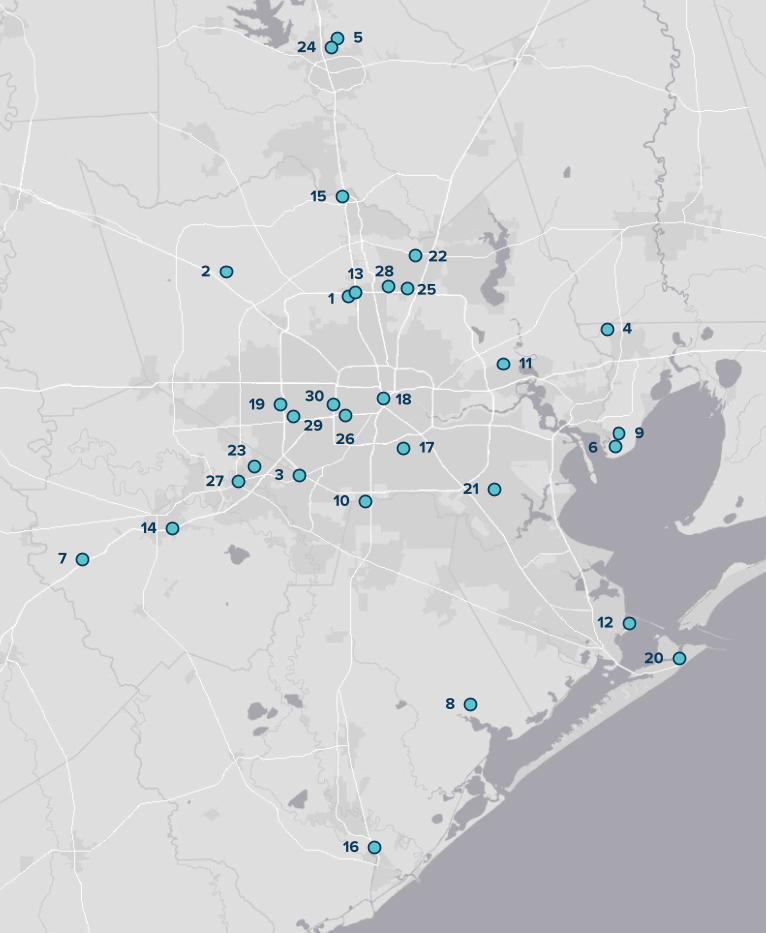
Selected Recent Houston Business Expansions and Relocations
1 AMAZON(2)Houston | 2,500 jobsKaty | 1,000 jobs
2 DAIKINHarris County (unincorporated Hockley) | 1,200 jobs | $400M capex
3 BEST BUYMissouri City | 40 jobs | $30M capex
4 EXXONMOBIL CHEMICAL COMPANYMont Belview | 12,000 jobs | $20B capex
5 FALCON STEEL AMERICAConroe | 150 jobs | $12M capex
6 IKEABaytown | 200 jobs | $1M sf distribution center
7 HUDSON PRODUCTSRosenburg | 150 jobs | $6M capex
8 INEOSAlvin | 70 jobs | $525M capex
9 JSW STEEL USABaytown | 500 jobs | $500M capex
10 LONZAPearland | 100 jobs | $32M capex
11 LYONDELLBASELLChannelview | 160 jobs | $1B capex
12 NEXTDECADETexas City | 200 jobs | $20B capex
13 SYSCOHouston | 87 jobs | $29M capex
14 TEXPHARMARosenberg | 500 jobs | $21M capex
15 XTOSpring | 1,600 new jobs relocating to ExxonMobil campus
16 DOW CHEMICAL Freeport | $6B expansion project
17 UPSHouston | 375 jobs | $131M capex
18WEWORK(2)Houston (Downtown) | $15M capexHouston (Galleria) | $50M capex
19 SABICHouston | 335 jobs | $400M capex
20 BMWGalveston | 40 jobs | 44K sf distribution center
21 BOEING Clear Lake | Opens new Space Training, Analysis and Review (STAR) facility
22 NJ PLASTICHumble | 150 jobs | $14M capex
23 APPLIED OPTOELECTRONICSSugar Land | 530 jobs | $39M capex
24 FEDEX GROUNDCy-Fair | 200 jobs | 800K sf distribution facility
25 ILLUMIPUREHouston | 250 jobs | $30M capex
26 MITSUBISHI HEAVY INDUSTRIES AMERICAHouston | 40 jobs | North American HQ relocation from New York
27 NALCO CHAMPIONSugar Land | 860 jobs | $45M capex
28 COSCO SHIPPINGHouston | 60 new jobs | 200 retained
29 SPERIAN ENERGYHouston | 100 jobs | HQ relocation from Las Vegas
30 WESTLAKE CHEMICALHouston | 170 jobs | $16M capex
TO P PROJ EC TS32
Top Projects
33
2018 Houston Region Market Profile
1
2
3
4
5
6
7
8
9
10
11
12
13
14
15
16
17
1819
20
21
22
23
24
25
26
27
28
29
30
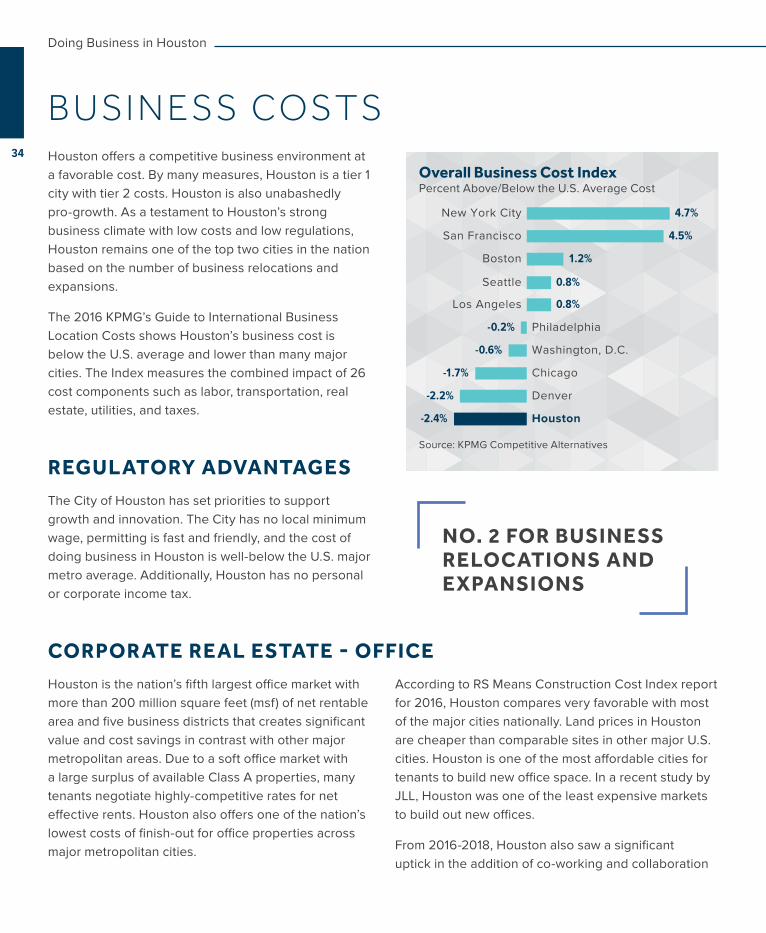
Houston offers a competitive business environment at a favorable cost. By many measures, Houston is a tier 1 city with tier 2 costs. Houston is also unabashedly pro-growth. As a testament to Houston’s strong business climate with low costs and low regulations, Houston remains one of the top two cities in the nation based on the number of business relocations and expansions.
The 2016 KPMG’s Guide to International Business Location Costs shows Houston’s business cost is below the U.S. average and lower than many major cities. The Index measures the combined impact of 26 cost components such as labor, transportation, real estate, utilities, and taxes.
REGULATORY ADVANTAGES The City of Houston has set priorities to support growth and innovation. The City has no local minimum wage, permitting is fast and friendly, and the cost of doing business in Houston is well-below the U.S. major metro average. Additionally, Houston has no personal or corporate income tax.
CORPORATE REAL ESTATE - OFFICEHouston is the nation’s fifth largest office market with more than 200 million square feet (msf) of net rentable area and five business districts that creates significant value and cost savings in contrast with other major metropolitan areas. Due to a soft office market with a large surplus of available Class A properties, many tenants negotiate highly-competitive rates for net effective rents. Houston also offers one of the nation’s lowest costs of finish-out for office properties across major metropolitan cities.
According to RS Means Construction Cost Index report for 2016, Houston compares very favorable with most of the major cities nationally. Land prices in Houston are cheaper than comparable sites in other major U.S. cities. Houston is one of the most affordable cities for tenants to build new office space. In a recent study by JLL, Houston was one of the least expensive markets to build out new offices.
From 2016-2018, Houston also saw a significant uptick in the addition of co-working and collaboration
NO. 2 FOR BUSINESS RELOCATIONS AND EXPANSIONS
Source: KPMG Competitive Alternatives
New York City 4.7%
San Francisco 4.5%
Boston 1.2%
Seattle 0.8%
Los Angeles 0.8%
Philadelphia-0.2%
Washington, D.C.-0.6%
Chicago -1.7%
Denver -2.2%
Houston-2.4%
Overall Business Cost IndexPercent Above/Below the U.S. Average Cost
34
Doing Business in Houston
B USI N E S S COSTS
spaces across the region. To meet the need of tech firms, startups and small collaboration labs for global companies, new facilities opened at StationHouston,
WeWork, START Houston, Headquarters, The Cannon and other developments. Maker space is also available at several locations across the region.
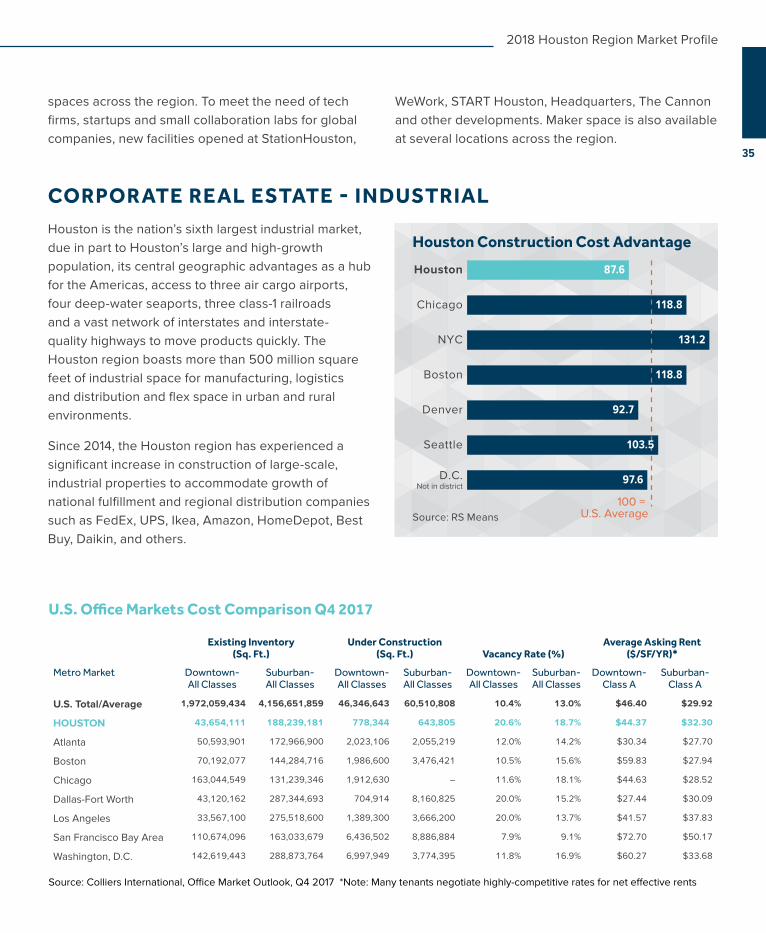
CORPORATE REAL ESTATE - INDUSTRIALHouston is the nation’s sixth largest industrial market, due in part to Houston’s large and high-growth population, its central geographic advantages as a hub for the Americas, access to three air cargo airports, four deep-water seaports, three class-1 railroads and a vast network of interstates and interstate-quality highways to move products quickly. The Houston region boasts more than 500 million square feet of industrial space for manufacturing, logistics and distribution and flex space in urban and rural environments.
Since 2014, the Houston region has experienced a significant increase in construction of large-scale, industrial properties to accommodate growth of national fulfillment and regional distribution companies such as FedEx, UPS, Ikea, Amazon, HomeDepot, Best Buy, Daikin, and others.
Metro Market
Existing Inventory (Sq. Ft.)
Under Construction (Sq. Ft.) Vacancy Rate (%)
Average Asking Rent ($/SF/YR)*
Downtown- All Classes
Suburban- All Classes
Downtown- All Classes
Suburban- All Classes
Downtown- All Classes
Suburban- All Classes
Downtown- Class A
Suburban-Class A
U.S. Total/Average 1,972,059,434 4,156,651,859 46,346,643 60,510,808 10.4% 13.0% $46.40 $29.92
HOUSTON 43,654,111 188,239,181 778,344 643,805 20.6% 18.7% $44.37 $32.30
Atlanta 50,593,901 172,966,900 2,023,106 2,055,219 12.0% 14.2% $30.34 $27.70
Boston 70,192,077 144,284,716 1,986,600 3,476,421 10.5% 15.6% $59.83 $27.94
Chicago 163,044,549 131,239,346 1,912,630 – 11.6% 18.1% $44.63 $28.52
Dallas-Fort Worth 43,120,162 287,344,693 704,914 8,160,825 20.0% 15.2% $27.44 $30.09
Los Angeles 33,567,100 275,518,600 1,389,300 3,666,200 20.0% 13.7% $41.57 $37.83
San Francisco Bay Area 110,674,096 163,033,679 6,436,502 8,886,884 7.9% 9.1% $72.70 $50.17
Washington, D.C. 142,619,443 288,873,764 6,997,949 3,774,395 11.8% 16.9% $60.27 $33.68
U.S. Office Markets Cost Comparison Q4 2017
Source: Colliers International, Office Market Outlook, Q4 2017 *Note: Many tenants negotiate highly-competitive rates for net effective rents
Source: RS Means
Houston Construction Cost Advantage
Chicago 118.8
NYC 131.2
Boston 118.8
Denver 92.7
Seattle
D.C.Not in district
97.6
Houston 87.6
100 = U.S. Average
103.5
35
2018 Houston Region Market Profile

UNION & LABOR COSTSTexas is a right-to-work state, ensuring a choice among quality union and non-union skilled labor. Houston boasts one of the lowest unionization rates nationwide with only 2.9 percent of its private workers unionized, significantly lower than the national rate of 6.7 percent.
Metro Market Existing Inventory (Sq. Ft.)
Under Construction (Sq. Ft.) Vacancy Rate (%)
Average Asking Rent ($/SF/YR)
Flex/Service Warehouse/Distribution
U.S. Total/Average 14,758,248,349 219,557,643 5.1% $11.93 $5.41
HOUSTON 549,843,737 6,375,868 5.4% $10.33 $6.56
Atlanta 689,594,885 21,481,026 6.9% $9.22 $3.94
Boston 147,979,548 1,250,000 9.3% $9.64 $6.56
Chicago 1,377,282,749 9,226,216 6.8% – $5.13
Dallas-Fort Worth 800,289,328 19,765,767 5.9% $9.60 $4.41
Los Angeles 1,589,570,300 25,851,600 2.5% – $8.01
San Francisco Bay Area 384,939,071 1,193,678 4.9% $24.40 $7.45
Washington, D.C. 196,832,010 1,229,171 8.3% $12.52 $7.78
U.S. Industrial Markets Cost Comparison Q4 2017
Source: Colliers International, Industrial Market Outlook, Q4 2017
UTILITIESThe majority of Texas enjoys a deregulated energy market, thus providing electricity customers with a selection of retail electric providers and open market competition. Electric power is distributed across the region by CenterPoint Energy, Entergy Texas, and AEP. Each of these PUC-regulated transmission and distribution utilities are the “local wires company” who ensure a high level of performance with minimal business disruptions in their respective geographic markets.
TA XESTexas and Houston understand the need for a stable, friendly and transparent tax structure. Texas is one of the few states without a personal, state, or corporate income tax, which makes the cost of doing business very competitive. In 2015, Governor Greg Abbott signed H.B. 32, which permanently reduced the Texas Franchise Tax (Margin Tax) rates by 25 percent. Houston is a cost-effective location for any company looking to establish a presence or expand their current business. Houston’s tax structure makes it a low-cost center for doing business. Plus, the personal tax burden in the Houston area consistently ranks among the lowest in the nation, which makes it an attractive place for people of all backgrounds to live and work.
36
Doing Business in Houston
37
2018 Houston Region Market Profile
STATETexas Enterprise Fund State (Cash Incentives)
The Texas Enterprise Fund (TEF), one of the nation’s largest deal-closing funds, is a performance-based cash grant for qualifying projects that offer significant projected job creation and capital investment where a single Texas site is competing with another viable out-of-state option. Administered by the Office of the Governor, TEF awards require unanimous approval by the Governor, Lieutenant Governor and Speaker of the House.
Texas Enterprise Zone Program (Tax Incentives)
The Texas Enterprise Zone Program (EZP) is a potential Sales and Use tax refund based on new and retained jobs associated with the qualified business site during the designation period. Communities may nominate projects for an EZP designation, and projects are awarded by the Governor’s Office during quarterly competitive rounds.
Skills Development Fund (Workforce Incentives)
Skills Development Fund (SDF) grants are provided to help companies form partnerships with local state community colleges and technical schools to provide custom job training for new or existing employees. Average training costs is $1,800 per trainee and is administered by the Texas Workforce Commission. Businesses with fewer than 100 employees can also apply for this program through the Skills for Small Business program.
Texas Capital Fund State (Cash Incentives)
The Texas Capital Fund administered by the Department of Agriculture is an economic development tool designed to provide financial resources to non-entitlement communities that can be utilized for public infrastructure or real estate development needed to assist a business that commits to create and/or retain permanent jobs.
Diversification Waiver (Out-of-State Tuition Waiver) (Workforce Incentives)
This incentive allows employees and family members of qualified businesses who have not yet located in Texas to pay in-state tuition fees if the individual files with a Texas institution of higher education.
Permit Assistance
TCEQ and the Office of the Governor have established a relationship to assist companies, which may experience unwarranted delays in their environmental permitting process for projects that could affect job creation or have a high economic impact.
Manufacturing Sales Tax Exemption (Tax Incentives)
Leased or purchased machinery, equipment, replacement parts, and accessories that are used or consumed in the manufacturing, processing, fabricating, or repairing of tangible personal property for ultimate sale, are exempt from state and local sales and use tax.
STAT E & LO C A L B USI N E S S I N CEN T I V E S
38
State & Local Business incentives
Natural Gas & Electricity Sales & Use Tax Exemption (Tax Incentives)
Natural Gas & Electricity Texas companies are exempt from paying state and local sales and use tax on electricity and natural gas used in manufacturing, processing, or fabricating tangible personal property.
State Sales Tax Exemption for Qualified Data Centers (Tax Incentives)
Texas provides 100 percent exemption on sales tax for computers, equipment, cooling systems, power infrastructure, electricity and fuel for data centers meeting the minimum thresholds of $200 million in capital investment, 20 new jobs, and a salary at least 120 percent of the county average salary.
Business Relocation (Tax Incentives)
A taxable entity may deduct relocation costs incurred from relocating a main office or other principal place of business to the State of Texas from another state or country if the taxable entity did not do business in the State of Texas before relocating.
Research and Development Tax Credit (Tax Incentives)
The Research & Development tax credit provides qualified companies with an option for tax savings based on a purchase of equipment or software, R&D expenditures or contracts with higher education institutions performing research.
Self-Sufficiency Fund (Workforce Incentives)
The Self-Sufficiency Fund is a job-training program that is specifically designed for individuals that receive Temporary Assistance for Needy Families (TANF). The program links the business community with local educational institutions and is administered by the Texas Workforce Commission. The goal of the Fund is to assist TANF recipients become independent of government financial assistance.
Talent Recruitment and Employer Services (Workforce Incentives)
Workforce Solutions offers recruiting, training and retraining, outplacement services, assistance recruiting and retaining qualified employees, and valuable information on employment law and labor market trends and statistics.
Texas Manufacturing Assistance Center (TMAC)
Designed to help Texas small manufacturing companies remain competitive in the ever changing global marketplace. The TMAC center provides technical assistance at a discounted rate for process improvements, environmental regulations upgrades, changes in the technology and the marketplace.
Cancer Prevention and Research Institute of Texas (Cash Incentive)
Cancer Prevention and Research Institute of Texas (CPRIT) offers several funding opportunities for promising cancer research, product development, and prevention programs. All funding opportunities are announced through formal Requests for Applications (RFAs) and applications must be submitted through the online application receipt system.
On-the-Job Training State (Workforce Incentives)
On-the-Job Training (OJT) offers participants an opportunity to earn as they learn, while employers benefit from a partial wage reimbursement during the training period. OJT focuses on jobs that involve new technologies, production, service or additional skills for full-time positions (30 hours per week is considered full-time) paying at least $12.00 per hour or more.
Texas Economic Development Act - Chapter 313 (Tax Incentives)
An appraised value limitation agreement in which a taxpayer agrees to build or install property and create jobs in exchange for a limitation on the taxable property value for school district maintenance and operations tax (M&O) purposes and a tax credit. The minimum limitation value varies by school district.
39
2018 Houston Region Market Profile
LOCALProperty Tax Abatement – Chapter 312 (Tax Incentives)
A variety of cities and counties in the Houston region offer tax abatement agreements that exempt part of the increased value in real or personal property from taxation for a period not to exceed 10 years.
Chapter 380 & 381 (Tax Incentives)
These discretionary incentives typically take the form of property tax abatements, loans or grants, commitments for infrastructure, or payments of portions of the sales tax generated by the project. Negotiations on these incentives between the local jurisdiction and the developer occur on a case by case basis. The Chapter 380 is targeted specifically for use by cities while Chapter 381 is specifically for use by county governments. These agreements can be used in tandem for the same project.
Type A & Type B (Cash Incentives)
Municipalities may offer cash awards made possible by local sales and use tax allotments dedicated to economic development (Type A and Type B sales tax). The tax revenues in two forms, the original ‘4A’ tax and the more flexible ‘4B’ tax, are used to finance economic development programs and projects that create primary (or direct) jobs.
Type A & Type B Local (Cash Incentives)
Municipalities may offer cash awards made possible by local sales and use tax allotments dedicated to economic development (Type A and Type B sales tax). The tax revenues in two forms, the original ‘4A’ tax and the more flexible ‘4B’ tax, are used to finance economic development programs and projects that create primary (or direct) jobs.
Foreign Trade Zone Local
Foreign Trade Zones (FTZ’s) allow companies dealing in foreign trade to delay payment of U.S. Custom’s import duties until their goods and merchandise actually enter U.S. commerce. Goods can be brought into Foreign Trade Zones (FTZ) without formal U.S. Customs entry or without incurring U.S. Customs duties or excise taxes unless and until they are imported into the United States. Ad valorem taxes on inventory may be exempt in some zones, upon approval of the FTZ sponsor.
Freeport Tax Exemption (Tax Incentives)
Many cities, counties and school districts in the Houston region have adopted the Freeport Tax Exemption, exempting ad valorem property taxes for any inventory exported outside the state within 175 days. Freeport property includes goods, wares, merchandise, ores and certain aircraft and aircraft parts in jurisdictions who opt-in.
Goods in Transit Exemption
A small number of taxing entities in Texas have adopted the Goods-in-Transit direct or indirect ownership interest in the inventory. To be eligible, the inventory must be transported to another location, inside or outside the state, within 175 days after the items were acquired or imported into the state.
Small Business Development Centers - SBDC (Small Business Assistance)
The University of Houston Bauer College and Lone Star College Small Business Development Centers (SBDC) provides free business advising and affordable training seminars to small and medium-sized business owners and managers.
State & Local Business incentives
40
SCORE (Small Business Assistance)
SCORE (formerly known as Service Corps Of Retired Executives) is a valuable network of tens of thousands volunteers who, through 300+ chapters nationwide, offer small business entrepreneurs practical business advice at no charge for the lifecycle of the business (from conception to profitable growth).
Pollution Control Property Tax Abatement
Ad Valorem Property Tax Abatements are available to companies with facilities, devices and equipment used to control air, water or land pollution. Companies wishing to apply for tax relief for their efforts in controlling pollution can apply to the Texas Commission on Environmental Quality.
Renewables Property Tax Exemption
Residential, commercial, and industrial renewable energy devices are exempt from property tax under Texas law. This exemption is applicable to most renewable technologies, including solar, wind, and biomass.
LEED (Tax Incentives)
The LEED (Leadership in Energy and Environmental Design) Green Building Rating System™ - This is the most widely used green building rating system in the world. Available for virtually all building, community
and home project types, LEED provides a framework to create healthy, highly efficient and cost-saving green buildings. LEED certification is a globally recognized symbol of sustainability achievement.
Property Assessed Clean Energy (TX-PACE) Renewable/State (Cash Incentives)
Property Assessed Clean Energy (TX-PACE) is a proven financial tool that incentivizes Texas’ property owners to upgrade facility infrastructure with little or no capital outlay. Approved by State legislation and established by your local governments, TX-PACE programs enable owners to lower their operating costs and use the savings to pay for eligible water conservation, energy efficiency, resiliency, and distributed generation projects. Owners gain access to private, affordable, long-term (typically 10-20 years) financing that is not available through traditional funding avenues.
Renewables Franchise Tax Deduction
Companies solely engaged in manufacturing, selling, or installing solar or wind devices are exempt from the Texas franchise tax. Other businesses that install solar or wind energy systems are eligible for a franchise tax deduction of 10% of the system’s cost.
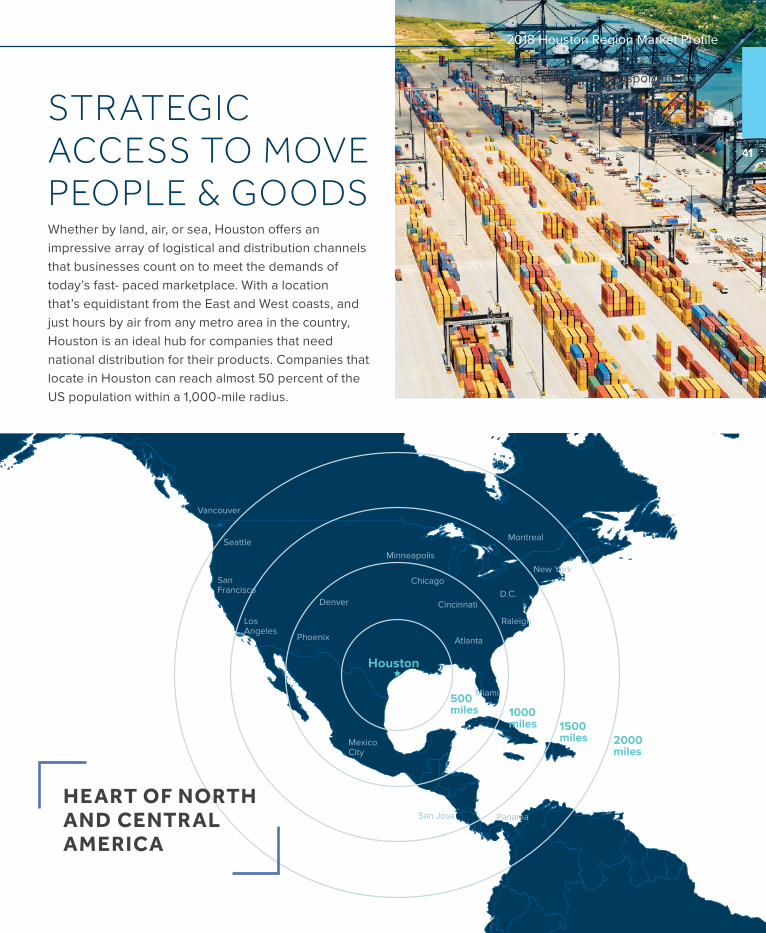
Whether by land, air, or sea, Houston offers an impressive array of logistical and distribution channels that businesses count on to meet the demands of today’s fast- paced marketplace. With a location that’s equidistant from the East and West coasts, and just hours by air from any metro area in the country, Houston is an ideal hub for companies that need national distribution for their products. Companies that locate in Houston can reach almost 50 percent of the US population within a 1,000-mile radius.
STRATEGIC ACCESS TO MOVE PEOPLE & GOODS
500miles 1000
miles 1500miles 2000
miles
Houston
MexicoCity
PanamaSan Jose
D.C.
SanFrancisco
New York
Miami
Atlanta
Chicago
Denver
Phoenix
LosAngeles
Seattle
Vancouver
Cincinnati
Raleigh
Minneapolis
Montreal
HEART OF NORTH AND CENTRAL AMERICA
41
2018 Houston Region Market Profile
Accessibility and Transportation
Accessibility and Transportation
Daily Nonstop Destinations from Houston182 Nonstop Destinations
CENTRAL AMERICA10 destinations
SOUTH AMERICA7 destinations
AUSTRALIA& NEW ZEALAND2 destinations
MEXICO23 destinations
U.S.114 destinationsASIA
3 destinations
CARIBBEAN9 destinations
MIDDLE EAST2 destinations
EUROPE7 destinations
CANADA5 destinations
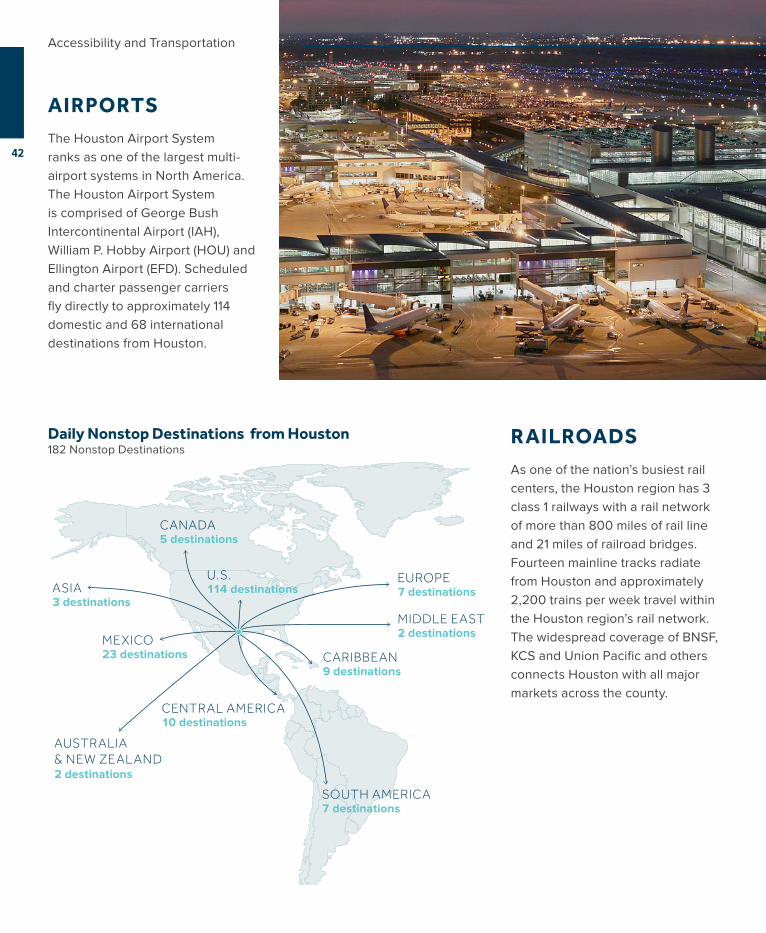
RAILROADSAs one of the nation’s busiest rail centers, the Houston region has 3 class 1 railways with a rail network of more than 800 miles of rail line and 21 miles of railroad bridges. Fourteen mainline tracks radiate from Houston and approximately 2,200 trains per week travel within the Houston region’s rail network. The widespread coverage of BNSF, KCS and Union Pacific and others connects Houston with all major markets across the county.
AIRPORTSThe Houston Airport System ranks as one of the largest multi-airport systems in North America. The Houston Airport System is comprised of George Bush Intercontinental Airport (IAH), William P. Hobby Airport (HOU) and Ellington Airport (EFD). Scheduled and charter passenger carriers fly directly to approximately 114 domestic and 68 international destinations from Houston.
42
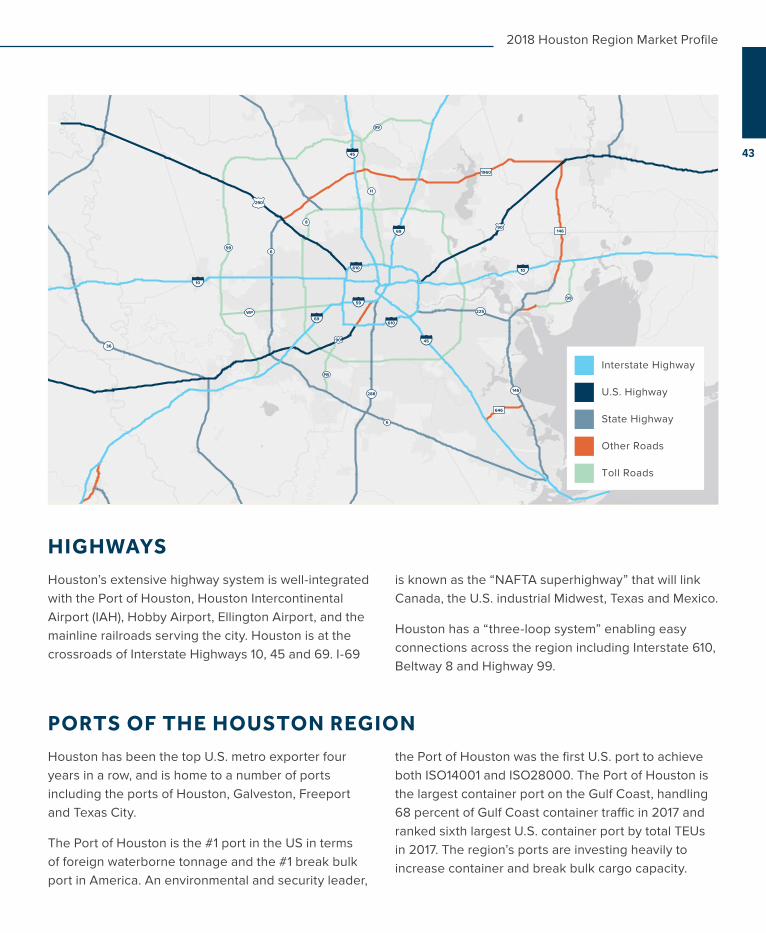
HIGHWAYSHouston’s extensive highway system is well-integrated with the Port of Houston, Houston Intercontinental Airport (IAH), Hobby Airport, Ellington Airport, and the mainline railroads serving the city. Houston is at the crossroads of Interstate Highways 10, 45 and 69. I-69
is known as the “NAFTA superhighway” that will link Canada, the U.S. industrial Midwest, Texas and Mexico.
Houston has a “three-loop system” enabling easy connections across the region including Interstate 610, Beltway 8 and Highway 99.
PORTS OF THE HOUSTON REGIONHouston has been the top U.S. metro exporter four years in a row, and is home to a number of ports including the ports of Houston, Galveston, Freeport and Texas City.
The Port of Houston is the #1 port in the US in terms of foreign waterborne tonnage and the #1 break bulk port in America. An environmental and security leader,
the Port of Houston was the first U.S. port to achieve both ISO14001 and ISO28000. The Port of Houston is the largest container port on the Gulf Coast, handling 68 percent of Gulf Coast container traffic in 2017 and ranked sixth largest U.S. container port by total TEUs in 2017. The region’s ports are investing heavily to increase container and break bulk cargo capacity.
10
10
69
69
59
45
45
610
610
H
FB
WP
99
99
99
6
6
8
225
288146
3690
290
1960
146
646
90
Interstate Highway
U.S. Highway
State Highway
Other Roads
Toll Roads
43
2018 Houston Region Market Profile
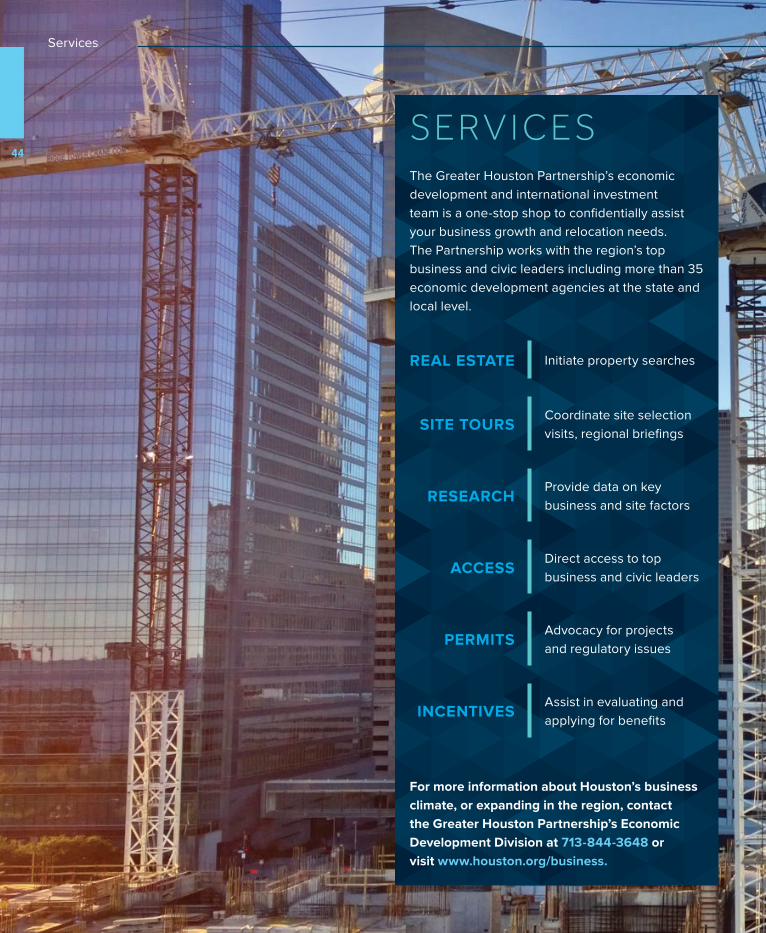
REAL ESTATE Initiate property searches
SITE TOURSCoordinate site selection visits, regional briefings
RESEARCHProvide data on key business and site factors
ACCESSDirect access to top business and civic leaders
PERMITS Advocacy for projects and regulatory issues
INCENTIVESAssist in evaluating and applying for benefits
For more information about Houston’s business climate, or expanding in the region, contact the Greater Houston Partnership’s Economic Development Division at 713-844-3648 or visit www.houston.org/business.
The Greater Houston Partnership’s economic development and international investment team is a one-stop shop to confidentially assist your business growth and relocation needs. The Partnership works with the region’s top business and civic leaders including more than 35 economic development agencies at the state and local level.
SERV I CE S44
Services
ECO N O M I C D E V ELO PM EN T O RGA N IZ AT I O N S IN THE 11 COUNTY REGION
Bay Area Houston Economic Partnership www.bayareahouston.com
Baytown/West Chambers County Economic Development Foundation www.baytownedf.org
BNSF www.bnsf.com
Brookshire Economic Development Corp. Board www.brookshiretexas.org
CenterPoint Energy www.CenterPointEnergy.com
Central Houston www.centralhouston.org
City of Alvin www.alvin-tx.gov
City of Deer Park www.deerparktx.gov
City of Friendswood www.ci.friendswood.tx.us
City of Fulshear www.fulsheartexas.gov
City of Hitchcock www.cityofhitchcock.org
City of Houston www.houstontx.gov
City of Huntsville www.huntsvilletx.gov
City of Kemah www.kemah-tx.gov
City of La Porte www.laportetx.gov
City of League City www.leaguecity.com
City of Meadows Place www.cityofmeadowsplace.org
City of Missouri City www.missouricitytx.gov
City of Mont Bellevue www.montbelvieu.net
City of Pasadena www.ci.pasadena.tx.us
City of Rosenberg www.rosenbergecodev.com
City of Santa Fe www.ci.santa-fe.tx.us
City of Seabrook www.seabrooktx.gov
City of Sugar Land www.sugarlandtx.gov
City of Texas City www.texas-city-tx.org
City of Webster www.cityofwebster.com
City of Willis www.ci.willis.tx.us
City Development Corporation of El Campo www.elcampoeco.org
Cy-Fair Houston Chamber of Commerce www.cyfairchamber.com
Dayton Community Development Corp. www.daytontx.retail360.us
Development Corporation of Richmond www.richmondtx.gov
East Montgomery County Improvement District www.emctx.com
Economic Alliance Houston Port Region www.allianceportregion.com
The Economic Development Alliance for Brazoria County www.eda-bc.com
Energy Corridor Management District www.energycorridor.org
Entergy Texas www.Entergy-Texas.com
Fort Bend County www.fortbendcountytx.gov
Galveston County Economic Alliance www.gcea.us
Galveston Economic Development Partnership www.gedp.org
Greater Conroe Economic Development Council www.gcedc.org
Greater East End Management District www.greatereastend.com
Greater Fort Bend Economic Development Council www.fortbendcounty.org
Greater Houston Partnership www.houston.org
Greater Northside Management District www.greaternorthside.org
Harris County http://budget.harriscountytx.gov
Houston East End Chamber of Commerce www.eecoc.org
Houston Intercontinental Chamber of Commerce www.houstonicc.org
Houston-Galveston Area Council www.h-gac.com
Katy Area Economic Development Council www.katyedc.org
Kansas City Southern Railroad www.kcsouthern.com
Lake Houston Economic Development Partnership www.lakehouston.edp.org
LaMarque Economic Development Corporation www.ci.la-marque.tx.us
The Lone Star College System www.lonestar.edu
Montgomery Economic Development Corporation www.montgomerytexas.gov
North Houston Association www.north-houston.com
North Houston District www.northhouston.org
Oak Ridge North Economic Development Corporation www.oakridgenorth.com
Pearland Economic Development Corp. www.pearlandedc.com
Port Freeport www.portfreeport.com
Port of Galveston www.portofgalveston.com
Port Houston www.porthouston.com
The Port of Texas City http://tctrr.com
San Jacinto College District www.sanjac.edu
Sealy Economic Development Corporation www.sealyedc.com
Tomball Economic Development Corporation www.tomballtxedc.org
Union Pacific Railroad Company www.up.com
Uptown Houston District www.uptown-houston.com
Waller County Economic Development Partnership www.wallercounty.org
Waller Economic Development Corporation www.walleredc.org
West Houston Association www.westhouston.org
Westchase District www.westchasedistrict.com
Wharton County www.whartonedc.com
The Woodlands Area Economic Development Partnership www.edpartnership.net
45
2018 Houston Region Market Profile Economic Development Organizations

PA RT N E RS H I P TO W E R | 7 0 1 AV E N I DA D E L AS A M E R I C AS, S U I T E 9 0 0 | H O U STO N , T X 7 7 0 1 0 | H O U STO N .O RG
AU ST I N | B R A ZO R I A | C H A M B E RS | FO RT B E N D | G A LV ESTO N | H A R R I S | L I B E RT Y | M O N TG O M E RY | SA N JAC I N TO | WA L K E R | WA L L E R