Embed Size (px)
Citation preview
Agricultural Labour in India Ranjan Kumar Som
In a developing economy the change in the pattern of employment indicated by a fall in the number at agricultural labourers and labour households should be welcome unless the erstwhile agricultural labourers shifted to less productive jobs or were rendered unemployed.
It is possible that among agricultural labourers those who were comparatively better off readily took the opportunity to shift to better occupations. But the supply of agricultural labour being still far in excess of demand, the wage rate failed to rise as a result of the reduction in the total number of agricultural labourers,
This is, of course, a hypothesis but some indirect evidence in support of it is found in the fact that the number of land-holding agricultural labour households fell, while that of non-landholding households increased.
Further, increase in the number (and proportion) of child labourers, the decrease in the extent of self-employ ment and the comparatively higher net income of the non-landholding households all this may be construed to confirm the assumption that the comparatively better off among agricultural labourers have shifted to other occupations.
A G R I C U L T U R A L labour consti-tutes, numerically, the most impor
tant single clement among the gainfully employed population in India. It is also the poorest. The first Agr i cultural Labour Enquiry was conducted by the Ministry of Labour in 1950-51 to probe the economic condition of agricultural labourers. The second Enquiry was conducted in 1956-57 by the Ministry, through the agency of the National Sample Survey in the n t h and 12th rounds (August 1956-August 1957
A Working Party consisting of representitives of the Ministry of Labour and Employment, the National Sample Survey Directorate, the Central Statistical Organisation, and the Indian Statistical Institute was responsible for planning the survey. It made some improvements in methodology of the survey, including the sample design. The concepts and definitions were pretested in the course of a Try-out on Agricultural Labour Enquiry in A p r i l -May 1959 conducted in 24 sample villages spread over 15 (pre-reorganiza-tion) Slates.
The definition of an agricultural labour household adopted for the second ALE was operationally different from and more convenient than that used in the first A L E . In the first A L E , a household in which either the head of the household or 50 per cent or more of earning members reported agricultural labour as the main occupation was deemed to constitute an agricultural labour household. In the second A L E , a household deriving 50 per cent or more of its income (after imputing the value of home-grown and self-consumed products) from agricultural labour was defined as an agricultural labour household. The Try-out on Agricultural Labour En-quiry revealed that the two definitions were co-terminus. A l l households
which were classified as agricultural labour households according to the definition used for the second Enquiry also fell wi th in the scope of the difinition used for the first Enquiry. The criterion of earnings to determine the occupation of the household was also adopted in the 1951 Census and later National Sample Survey rounds.
The days of work spent in different types of activities — agricultural wage employment, non-agricultural wage employment, self-employment, unemployment and activities outside labour force — were recorded separately under suitable "intensity"-of-employment classification along with the normal length of a full working day and the normal hours of work for the activity in the locality. The days of work were calculated after assigning proper weightage to part-employment. In the event of a person having more than one activity during a day, the activity which occupied him the longest was deemed as the major activity and the other activities as minor activities.
THE SAMPLE A two stage stratified sampling design
was adopted in both the surveys, the villages being the first-stage unit and the sample agricultural labour households, the second-stage unit. The selection of the sample villages was done wi th equal probability in the first A L E and wi th probability proportional to the 1951 Census population in the second A L E . Wi th in the selected villages, a number of sample households was chosen wi th equal probability in the first A L E and systematically wi th a random start in the second A L E ,
About 11,000 agricultural labour households in about 800 villages supplied information in the first A L E . The corresponding figures were about 21,000 households in about '4,700 villages in
the second A L E . In the first A L E , the same set of households was to be visited every month for a period of 12 months and the annual data were to be built up from these monthly data. This led to difficulties since a number of households either left the village or were not available for interrogation during most months of the year. Consequently, the "universe" wi th which the Survey began changed considerably by the end. Also, the non-sampling biases are likely to be more if such a procedure is adopted, in the second A L E , the sample households were uniformly spread over time and the monthly data collected were inflated proportionately to give annual estimates.
In the first A L E the data were collected by an ad hoc staff. In the second A L E the task was entrusted to the regular staff of the NSS. The comparison made below of results of the two surveys assumes that the quality of data was similar in both surveys. This remains to be examined.
The reliability of estimates was cal-culated in the first A L E by the usual method of "standard errot"; in the second A L E , although "standard error" were calculated for some items, the margin of error was calculated directly, and more cheaply, from the estimates for the four sub-samples into which the full sample was divided. The probability that the "true" value would lie between the minimum and maximum of the four values is 1-(½).3 or 7 in 8.
The proportion of agricultural labour households, wi th and without land, to the total rural households in the two surveys is given in table 1. The number of households was calculated in the second A L E on basis of the projected population and the average household size for the same period, obtained from the NSS. While the number of rural households increased
263


from 58.0 mi l l ion in 1950-51 to 64.5 mi l l ion in 1956-57 (an increase of 11 per cent), the number of agricultural labour households decreased from 17.7 mil l ion to 15.8 mi l l ion (a decrease of 10 per cent). The number of agricultural labour households wi th land decreased from 8.8 mi l l ion to 6.6 mi l l ion (a decrease of 25 per cent) while that of households without land increased by 5 per cent from 8.8 mil l ion to 9.2 mi l l ion . The percentage of agricultural labour households to total rural households decreased from 304 per cent to 24.5 per cent. The number of agricultural labour households w i th land decreased from 15.2 per cent to 10.2 per cent and that of households without land from 15.2 per cent to 14.3 per cent. The number of households and their percentage were about the same for agricultural labour households, w i th and without land, in 1950-51. The number of agricultural labour households without land, however, increased substantially in 1956-57 as d id their percentage. The number of casual agricultural labour households was about three times that of the attached households (11.6 mi l l ion as against 4.2 mi l l i on ) . The percentage of households wi th land was slightly more among the attached households than among the
casual ones (44.4 per cent and 40.6 per cent respectively).
LABOUR I N C O M M U N I T Y D E V E L O P M E N T
AREAS
The number of agricultural labour households in Community Project areas and their proportion to total labour households arc also indicated in table 1. The number of rural households in Community Project areas was about one-third of the total. The proportion of agricultural labour households in CP areas to total agricultural labour households was also about the same.
The average number of persons per agricultural labour household was 4.3 in 1950-51, and 4.4 in 1956-57. The agerage size of attached labour house
h o l d s in the second A L E was 4.67 and that of casual households 4.30.
The agricultural labour households were defined as casual or attached according to the type of agricultural wage-employment from which the income obtained by the household during the year was higher. The difinition was the sama in both the surveys. Attached labourers were defined as those in more or less continuous employment and under some sort of contract with their employers during the period
of employment. A l l other agricultural labourers were defined as casual. They were employed from time to time, according to exigencies of work.
Households with cultivated land were described as land-holding households. Cultivated land was defined to include the net area sown (including orchards) and areas lying fallow during the previous agricultural year.
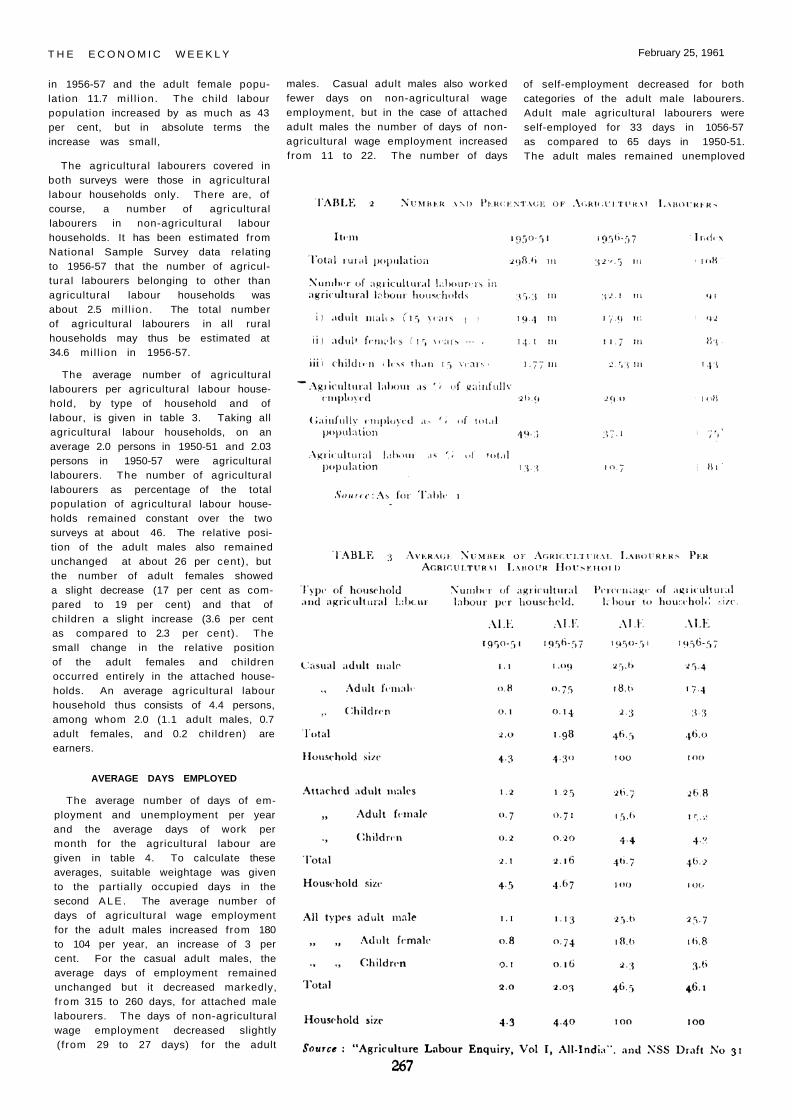
The total rural population and the number of agricultural labourers in 1950-51 and 1956-57 are given in table 2. The break-down of the number of agricultural labourers by adult males, adult females, and children is also given in the table. From 298.6 mil l ion in 1950-51, the rural population increased to 322.5 mi l l ion in 1956-57, an increase of 8 per cent. The number of agricultural labourers in agricultural labour households, however, decreased from 35.3 mil l ion to 32.1 mi l l ion , a deerease of 9 per cent. The decrease was more in the case of adult females, than in that of males (17 per cent and 8 per cent, respectively). The sex composition of the adult agricultural labour population thus changed from 137 males per 100 females as revealed by the first A L E to 153 males per 100 females. Adult male agricultural labour population numbered about 17.9 mil l ion
Source: For A L E 1950-51: "Agricultural Labour Enquiry, Vol . 1 — Al l India" Government of India; for A L E 1956-57, NSS Draft No 31, "Tables with notes on wages, employment, income and indebtedness of agricultural labour households", and No, 43, 'Tables with notes en employment and unemployment", Indian Statistical Institute; the estimated numbers for the Second A L E are based on projected population.
Note : In this and following tables, the components have been rounded off separately and may not, therefore agree with the total. The percentages and indices were also calculated before rounding off,
The index, in these tables, have been calculated as: 100 X Value for 1956-57 Value for 1950-51.
265

February 25, 1961 T H E E C O N O M I C W E E K L Y
T H E E C O N O M I C W E E K L Y February 25, 1961
in 1956-57 and the adult female population 11.7 mi l l ion. The chi ld labour population increased by as much as 43 per cent, but in absolute terms the increase was small,
The agricultural labourers covered in both surveys were those in agricultural labour households only. There are, of course, a number of agricultural labourers in non-agricultural labour households. It has been estimated from National Sample Survey data relating to 1956-57 that the number of agricultural labourers belonging to other than agricultural labour households was about 2.5 mi l l ion. The total number of agricultural labourers in all rural households may thus be estimated at 34.6 mi l l ion in 1956-57.
The average number of agricultural labourers per agricultural labour household, by type of household and of labour, is given in table 3. Taking all agricultural labour households, on an average 2.0 persons in 1950-51 and 2.03 persons in 1950-57 were agricultural labourers. The number of agricultural labourers as percentage of the total population of agricultural labour households remained constant over the two surveys at about 46. The relative position of the adult males also remained unchanged at about 26 per cent), but the number of adult females showed a slight decrease (17 per cent as compared to 19 per cent) and that of children a slight increase (3.6 per cent as compared to 2.3 per cent). The small change in the relative position of the adult females and children occurred entirely in the attached households. An average agricultural labour household thus consists of 4.4 persons, among whom 2.0 (1.1 adult males, 0.7 adult females, and 0.2 children) are earners.
AVERAGE DAYS EMPLOYED
The average number of days of employment and unemployment per year and the average days of work per month for the agricultural labour are given in table 4. To calculate these averages, suitable weightage was given to the partially occupied days in the second A L E . The average number of days of agricultural wage employment for the adult males increased from 180 to 104 per year, an increase of 3 per cent. For the casual adult males, the average days of employment remained unchanged but it decreased markedly, f rom 315 to 260 days, for attached male labourers. The days of non-agricultural wage employment decreased slightly ( f rom 29 to 27 days) for the adult
males. Casual adult males also worked fewer days on non-agricultural wage employment, but in the case of attached adult males the number of days of non-agricultural wage employment increased from 11 to 22. The number of days
of self-employment decreased for both categories of the adult male labourers. Adult male agricultural labourers were self-employed for 33 days in 1056-57 as compared to 65 days in 1950-51. The adult males remained unemploved
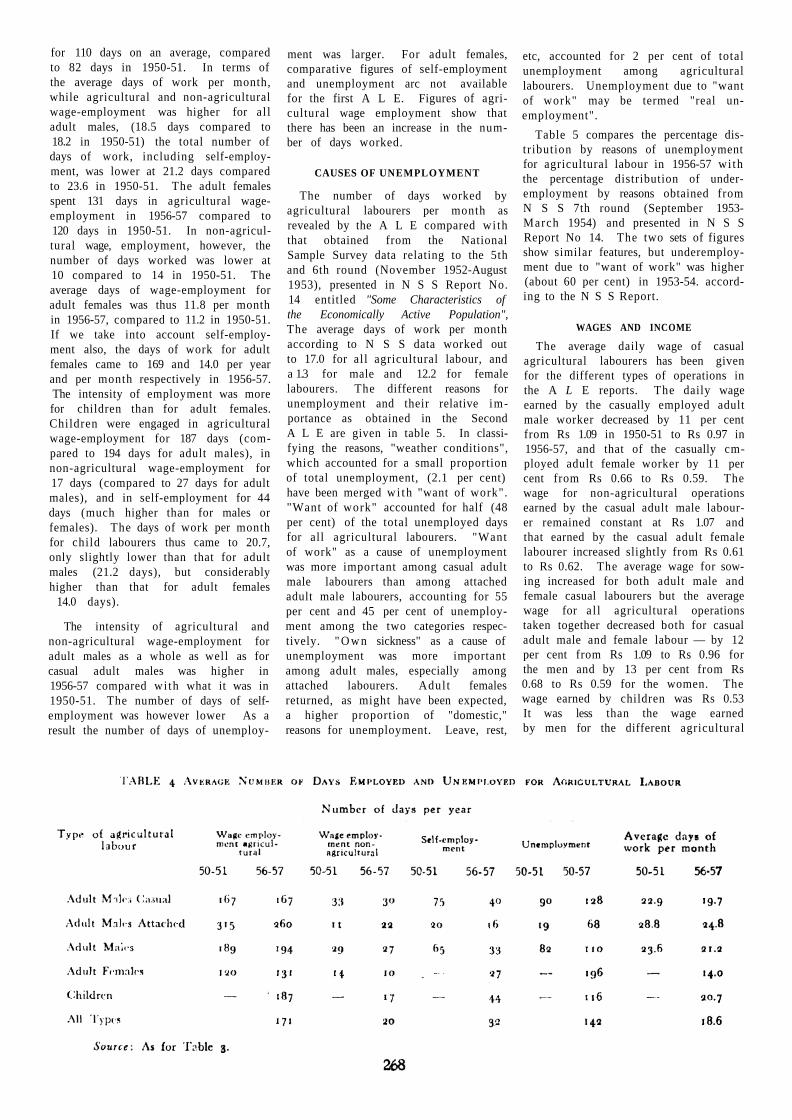
for 110 days on an average, compared to 82 days in 1950-51. In terms of the average days of work per month, while agricultural and non-agricultural wage-employment was higher for al l adult males, (18.5 days compared to 18.2 in 1950-51) the total number of days of work, including self-employment, was lower at 21.2 days compared to 23.6 in 1950-51. The adult females spent 131 days in agricultural wage-employment in 1956-57 compared to 120 days in 1950-51. In non-agricultural wage, employment, however, the number of days worked was lower at 10 compared to 14 in 1950-51. The average days of wage-employment for adult females was thus 11.8 per month in 1956-57, compared to 11.2 in 1950-51. If we take into account self-employment also, the days of work for adult females came to 169 and 14.0 per year and per month respectively in 1956-57. The intensity of employment was more for children than for adult females. Children were engaged in agricultural wage-employment for 187 days (compared to 194 days for adult males), in non-agricultural wage-employment for 17 days (compared to 27 days for adult males), and in self-employment for 44 days (much higher than for males or females). The days of work per month for child labourers thus came to 20.7, only slightly lower than that for adult males (21.2 days), but considerably higher than that for adult females
14.0 days).
The intensity of agricultural and non-agricultural wage-employment for adult males as a whole as well as for casual adult males was higher in 1956-57 compared wi th what it was in 1950-51. The number of days of self-employment was however lower As a result the number of days of unemploy
ment was larger. For adult females, comparative figures of self-employment and unemployment arc not available for the first A L E. Figures of agricultural wage employment show that there has been an increase in the number of days worked.
CAUSES OF UNEMPLOYMENT
The number of days worked by agricultural labourers per month as revealed by the A L E compared wi th that obtained from the National Sample Survey data relating to the 5th and 6th round (November 1952-August 1953), presented in N S S Report No. 14 entitled "Some Characteristics of the Economically Active Population", The average days of work per month according to N S S data worked out to 17.0 for all agricultural labour, and a 1.3 for male and 12.2 for female labourers. The different reasons for unemployment and their relative importance as obtained in the Second A L E are given in table 5. In classifying the reasons, "weather conditions", which accounted for a small proportion of total unemployment, (2.1 per cent) have been merged wi th "want of work". "Want of work" accounted for half (48 per cent) of the total unemployed days for all agricultural labourers. "Want of work" as a cause of unemployment was more important among casual adult male labourers than among attached adult male labourers, accounting for 55 per cent and 45 per cent of unemployment among the two categories respectively. " O w n sickness" as a cause of unemployment was more important among adult males, especially among attached labourers. Adul t females returned, as might have been expected, a higher proportion of "domestic," reasons for unemployment. Leave, rest,
etc, accounted for 2 per cent of total unemployment among agricultural labourers. Unemployment due to "want of work" may be termed "real unemployment".
Table 5 compares the percentage distribution by reasons of unemployment for agricultural labour in 1956-57 wi th the percentage distribution of underemployment by reasons obtained from N S S 7th round (September 1953-March 1954) and presented in N S S Report No 14. The two sets of figures show similar features, but underemployment due to "want of work" was higher (about 60 per cent) in 1953-54. according to the N S S Report.
WAGES AND INCOME
The average daily wage of casual agricultural labourers has been given for the different types of operations in the A L E reports. The daily wage earned by the casually employed adult male worker decreased by 11 per cent from Rs 1.09 in 1950-51 to Rs 0.97 in 1956-57, and that of the casually cm-ployed adult female worker by 11 per cent from Rs 0.66 to Rs 0.59. The wage for non-agricultural operations earned by the casual adult male labourer remained constant at Rs 1.07 and that earned by the casual adult female labourer increased slightly from Rs 0.61 to Rs 0.62. The average wage for sowing increased for both adult male and female casual labourers but the average wage for a l l agricultural operations taken together decreased both for casual adult male and female labour — by 12 per cent from Rs 1.09 to Rs 0.96 for the men and by 13 per cent from Rs 0.68 to Rs 0.59 for the women. The wage earned by children was Rs 0.53 It was less than the wage earned by men for the different agricultural
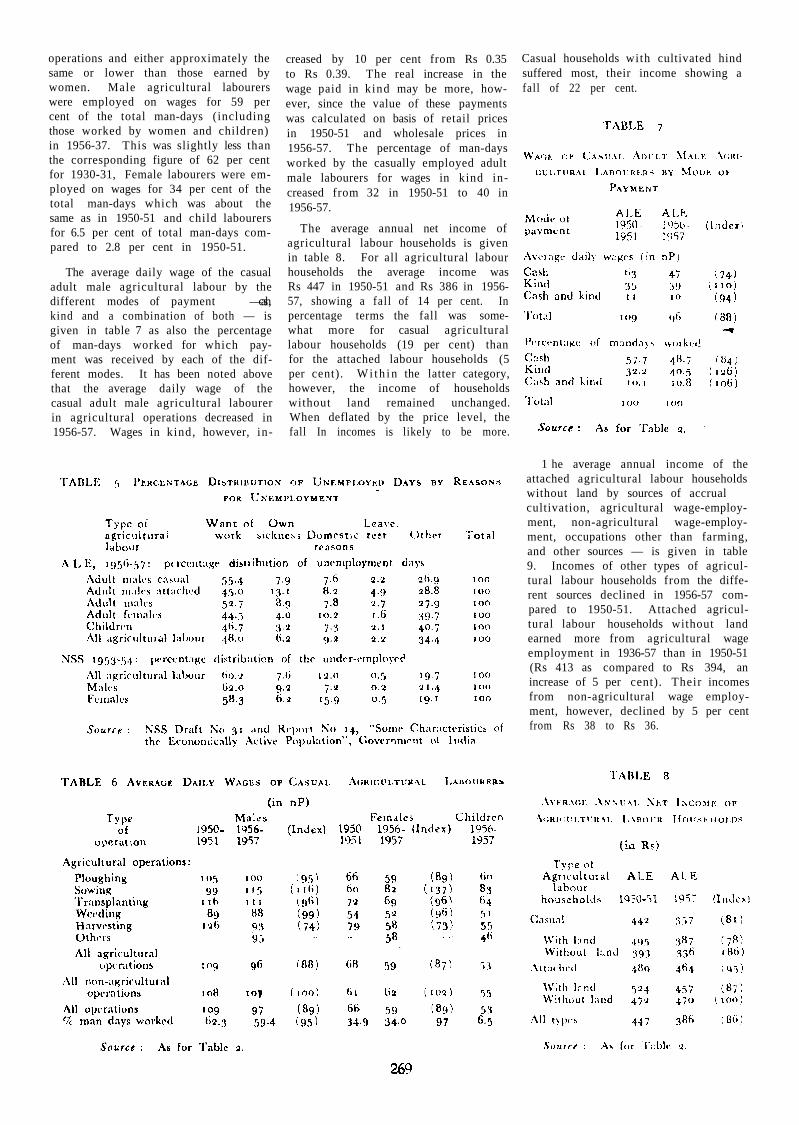
operations and either approximately the same or lower than those earned by women. Male agricultural labourers were employed on wages for 59 per cent of the total man-days (including those worked by women and children) in 1956-37. This was slightly less than the corresponding figure of 62 per cent for 1930-31, Female labourers were employed on wages for 34 per cent of the total man-days which was about the same as in 1950-51 and child labourers for 6.5 per cent of total man-days compared to 2.8 per cent in 1950-51.
The average daily wage of the casual adult male agricultural labour by the different modes of payment —cash, kind and a combination of both — is given in table 7 as also the percentage of man-days worked for which payment was received by each of the different modes. It has been noted above that the average daily wage of the casual adult male agricultural labourer in agricultural operations decreased in 1956-57. Wages in kind, however, in
creased by 10 per cent from Rs 0.35 to Rs 0.39. The real increase in the wage paid in kind may be more, however, since the value of these payments was calculated on basis of retail prices in 1950-51 and wholesale prices in 1956-57. The percentage of man-days worked by the casually employed adult male labourers for wages in kind increased from 32 in 1950-51 to 40 in 1956-57.
The average annual net income of agricultural labour households is given in table 8. For all agricultural labour households the average income was Rs 447 in 1950-51 and Rs 386 in 1956-57, showing a fall of 14 per cent. In percentage terms the fall was somewhat more for casual agricultural labour households (19 per cent) than for the attached labour households (5 per cent). W i t h i n the latter category, however, the income of households without land remained unchanged. When deflated by the price level, the fall In incomes is likely to be more.
Casual households with cultivated hind suffered most, their income showing a fall of 22 per cent.
1 he average annual income of the attached agricultural labour households without land by sources of accrual cultivation, agricultural wage-employment, non-agricultural wage-employment, occupations other than farming, and other sources — is given in table 9. Incomes of other types of agricultural labour households from the different sources declined in 1956-57 compared to 1950-51. Attached agricultural labour households without land earned more from agricultural wage employment in 1936-57 than in 1950-51 (Rs 413 as compared to Rs 394, an increase of 5 per cent). Their incomes from non-agricultural wage employment, however, declined by 5 per cent from Rs 38 to Rs 36.

The average annual consumer expenditure of agricultural labour households is given in table 10 along wi th their average indebtedness. The average annual consumer expenditure for al l types of agricultural labour households increased by 33 per cent from Rs 468 in 1950-51 to Rs 621 in 1956-57, The different types of households also showed an increase in the consumer expenditure, ranging from 26 per cent in the case of casual households without land to 40 per cent in that of attached households without land.
INDEBTEDNESS
The indebtedness of agricultural labour households was almost double in 1956-57 compared to 1950-51, increasing from Rs 47 to Rs 89. Indebtedness was greater in the case of the attached labour households (Rs 109) than in that of the casual labour households (Rs 82) , This does not necessarily mean that the casual labour households were economically better off. The ability to procure a loan is directly related to the ability to pay it back. The latter ability is generally higher in the case of attached agricultural labour households, hence their greater indebtedness.
Some general conclusions about the employment position of the agricultural labour population as revealed in the two inquiries emerge from the discussion above. While the total agricultural population and households increased, the number of agricultural labour and agricultural labour households declined in 1956-57 compared to 1950-51. The average number of persons per household and the composition of earning members remained substantially unchanged over the period. The intensity of employment of the casual labourers and all adult males on wage employment was favourable compared to 1950-51 but the number self-employed working days decreased and the number of days unemployed increased. The intensity of employment of adult female labourers in agricultural wage employment was higher. About half of the days unemployed were accounted for by 'wan t of work". For 68 days a year, agricultural labourers remained unemployed for want of work.
The wages of casual agricultural labourers remained about the same for non-agricultural operations, but except for sowing, wages for all agricultural operations declined in 1956-67 compared to those in 1950-51. Taking agricultural and non-agricultural operations, the average daily wage was Rs 0.97 in 1956-57, (Rs 1.09 in 1950-51) for casual adult males, Rs 0.59 (Rs
0.66 in 1950-51) for casual adult fe-males, and Rs 0.53 for casual chi ld labour. For casual adult males, wages paid in kind, however, increased in 1956-57 as compared to that in 1950-51. The average annual net income of non-land-holding attached agricultural labour remained constant at Rs 471 in the two surveys. For other types of households, average income declined. Taking all agricultural labour households, net annual income increased from Rs 394 to Rs 413.
Judging from the average wage of agricultural labour or the income of labour households, the condition of agricultural labourers may be said to have worsened in 1956-57 as compared to 1950-51.
CHANGE IN OCCUPATION PATTERN
In a developing economy the change in the pattern of employment indicated by a fall in the number of agricultural labourers and labour households should
be welcome unless the erstwhile agricultural labourers shifted to less productive jobs or were rendered unemployed. It is possible that among agricultural labourers, those who were comparatively better off readily took the opportunity to shift to better occupations. But the supply of agricultural labour being still far in excess of demand, the wage rate failed to rise as a result of the reduction in the total number of agricultural labourers. This is of course an assump-tion but some indirect evidence in support of it is found in the fact that the number of land-holding agricultural labour households fell, while that of non-land-holding households increased. Further, increase in the number (and proportion) of child labourers, the decrease in the extent of self-employment and the comparatively higher net income of the non-land-holding households — all these may be construed to confirm the hypothesis though admittedly much more direct evidence is necessary to conclusively establish i t .