Embed Size (px)
Citation preview
Ranger Energy Services Corporate Presentation
August 2019
Ranger Energy Services © 2019
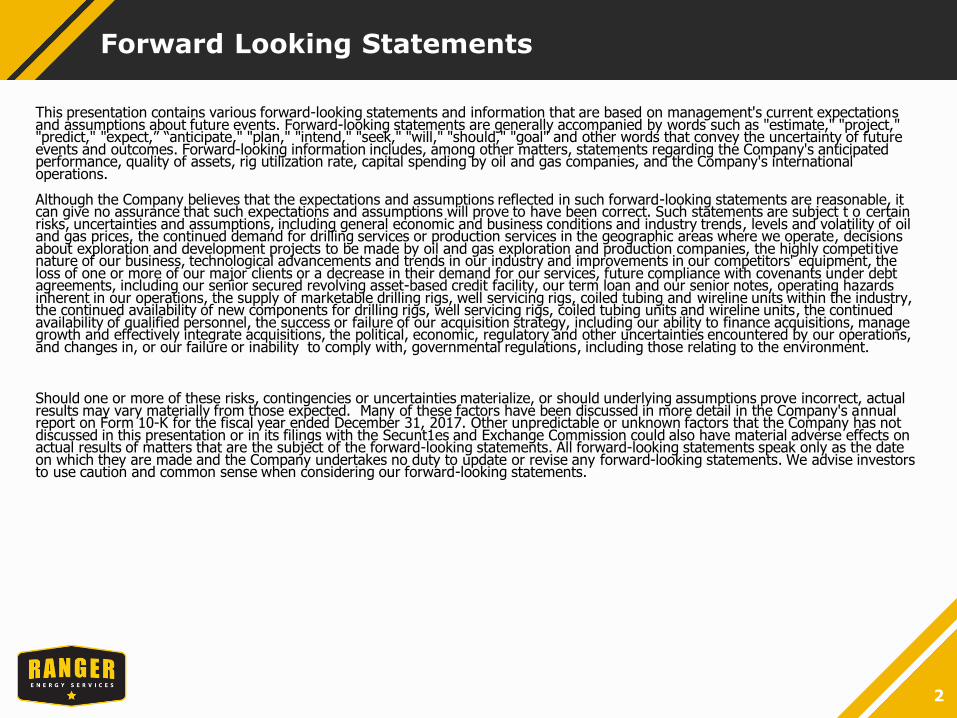
Forward Looking Statements
2
This presentation contains various forward-looking statements and information that are based on management's current expectations and assumptions about future events. Forward-looking statements are generally accompanied by words such as "estimate," "project," "predict," "expect,” “anticipate," "plan," "intend," "seek," "will," "should," "goal" and other words that convey the uncertainty of future events and outcomes. Forward-looking information includes, among other matters, statements regarding the Company's anticipated performance, quality of assets, rig utilization rate, capital spending by oil and gas companies, and the Company's international operations.
Although the Company believes that the expectations and assumptions reflected in such forward-looking statements are reasonable, it can give no assurance that such expectations and assumptions will prove to have been correct. Such statements are subject t o certain risks, uncertainties and assumptions, including general economic and business conditions and industry trends, levels and volatility of oil and gas prices, the continued demand for drilling services or production services in the geographic areas where we operate, decisions about exploration and development projects to be made by oil and gas exploration and production companies, the highly competitive nature of our business, technological advancements and trends in our industry and improvements in our competitors' equipment, the loss of one or more of our major clients or a decrease in their demand for our services, future compliance with covenants under debt agreements, including our senior secured revolving asset-based credit facility, our term loan and our senior notes, operating hazards inherent in our operations, the supply of marketable drilling rigs, well servicing rigs, coiled tubing and wireline units within the industry, the continued availability of new components for drilling rigs, well servicing rigs, coiled tubing units and wireline units, the continued availability of qualified personnel, the success or failure of our acquisition strategy, including our ability to finance acquisitions, manage growth and effectively integrate acquisitions, the political, economic, regulatory and other uncertainties encountered by our operations, and changes in, or our failure or inability to comply with, governmental regulations, including those relating to the environment.
Should one or more of these risks, contingencies or uncertainties materialize, or should underlying assumptions prove incorrect, actual results may vary materially from those expected. Many of these factors have been discussed in more detail in the Company's annual report on Form 10-K for the fiscal year ended December 31, 2017. Other unpredictable or unknown factors that the Company has not discussed in this presentation or in its filings with the Secunt1es and Exchange Commission could also have material adverse effects on actual results of matters that are the subject of the forward-looking statements. All forward-looking statements speak only as the date on which they are made and the Company undertakes no duty to update or revise any forward-looking statements. We advise investors to use caution and common sense when considering our forward-looking statements.
Overview
3
Background
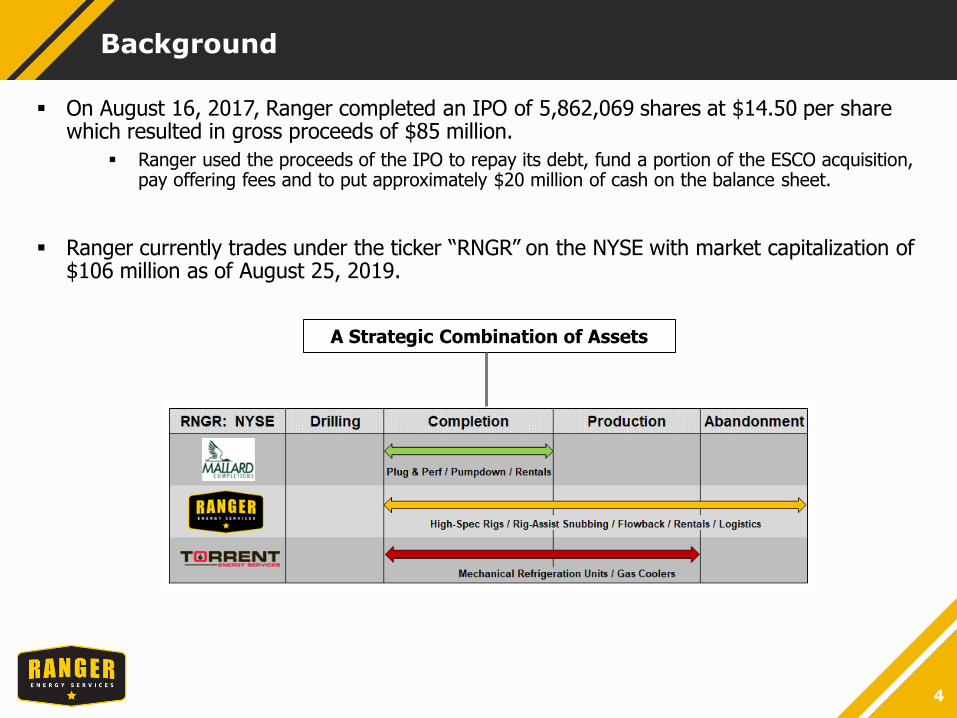
On August 16, 2017, Ranger completed an IPO of 5,862,069 shares at $14.50 per share which resulted in gross proceeds of $85 million.
Ranger used the proceeds of the IPO to repay its debt, fund a portion of the ESCO acquisition, pay offering fees and to put approximately $20 million of cash on the balance sheet.
Ranger currently trades under the ticker “RNGR” on the NYSE with market capitalization of $106 million as of August 25, 2019.
4
A Strategic Combination of Assets
Operating Divisions
5
Ranger Operations are Reported in Three Segments:
Completion & Other Services Primary operations include wireline (plug & perf and pump down)
Well Testing, Snubbing, Fluid Hauling and Tank Rental
Locations in Permian and DJ Basins
Well Service Rigs & Related Services Primary operations include well completion support, workovers, well maintenance and P&A
Related equipment rentals include power swivels, well control packages, hydraulic catwalks, pipe racks and pipe handling tools
Locations in the Permian, DJ, Bakken, Eagle Ford, Haynesville, Gulf Coast, SCOOP/STACK
Processing Solutions Primary operations include the rental of Modular Mechanical Refrigeration Units (“MRUs”) and
other natural gas processing equipment
Locations in the Permian, Bakken, Utica, San Joaquin and Piceance
Investment Highlights
6
Investment Highlights
7
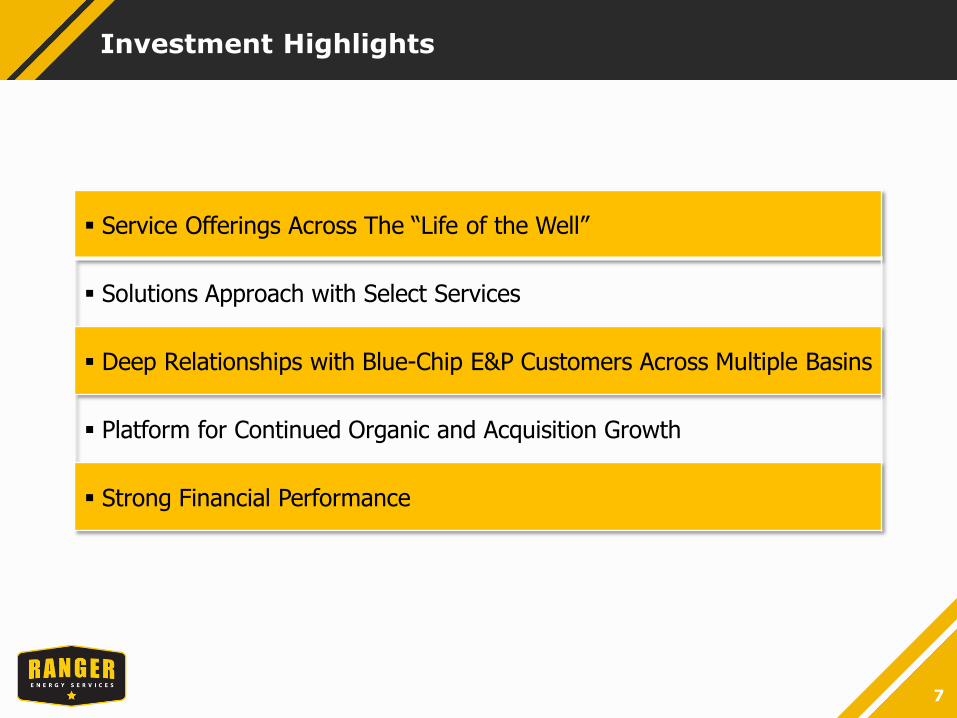
Service Offerings Across The “Life of the Well”
Solutions Approach with Select Services
Deep Relationships with Blue-Chip E&P Customers Across Multiple Basins
Platform for Continued Organic and Acquisition Growth
Strong Financial Performance
Service Offerings Across “Life Of the Well”
8
Wireline Completion Services
9
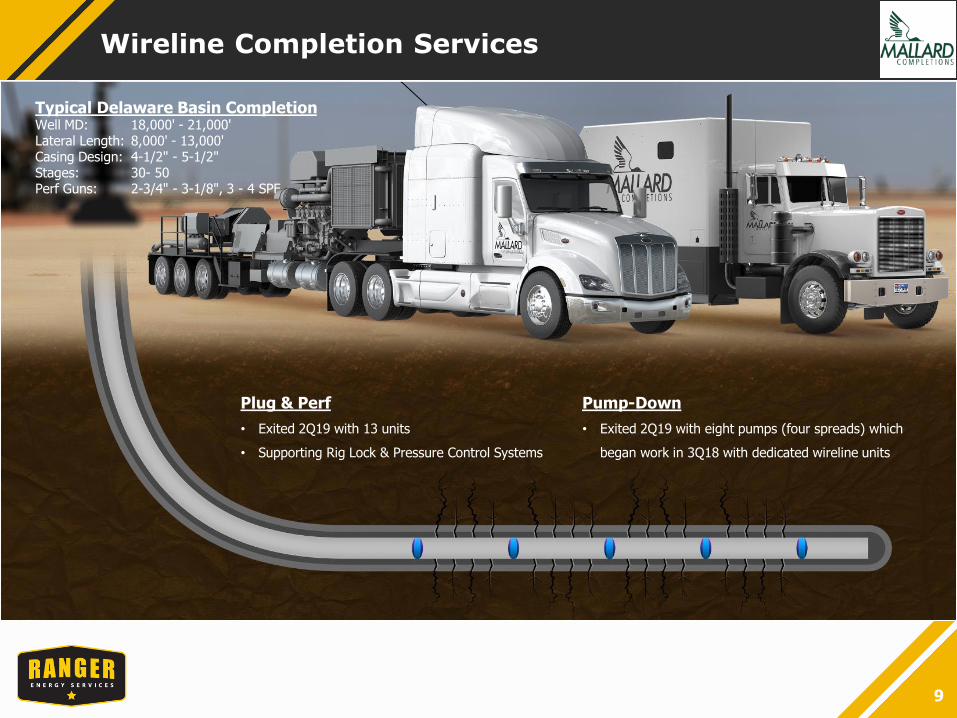
Typical Delaware Basin CompletionWell MD: 18,000' - 21,000'Lateral Length: 8,000' - 13,000'Casing Design: 4-1/2" - 5-1/2"Stages: 30- 50Perf Guns: 2-3/4" - 3-1/8", 3 - 4 SPF
Plug & Perf
• Exited 2Q19 with 13 units
• Supporting Rig Lock & Pressure Control Systems
Pump-Down
• Exited 2Q19 with eight pumps (four spreads) which
began work in 3Q18 with dedicated wireline units
High-Spec Rig Completion Services
10
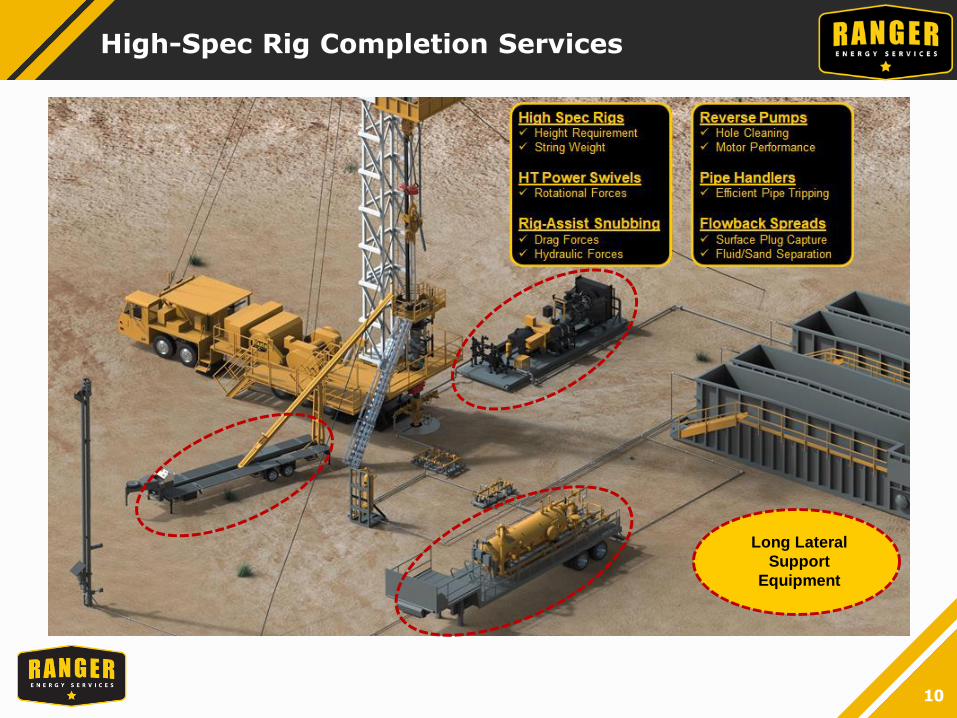
Long Lateral
Support
Equipment
High-Spec Rigs
11
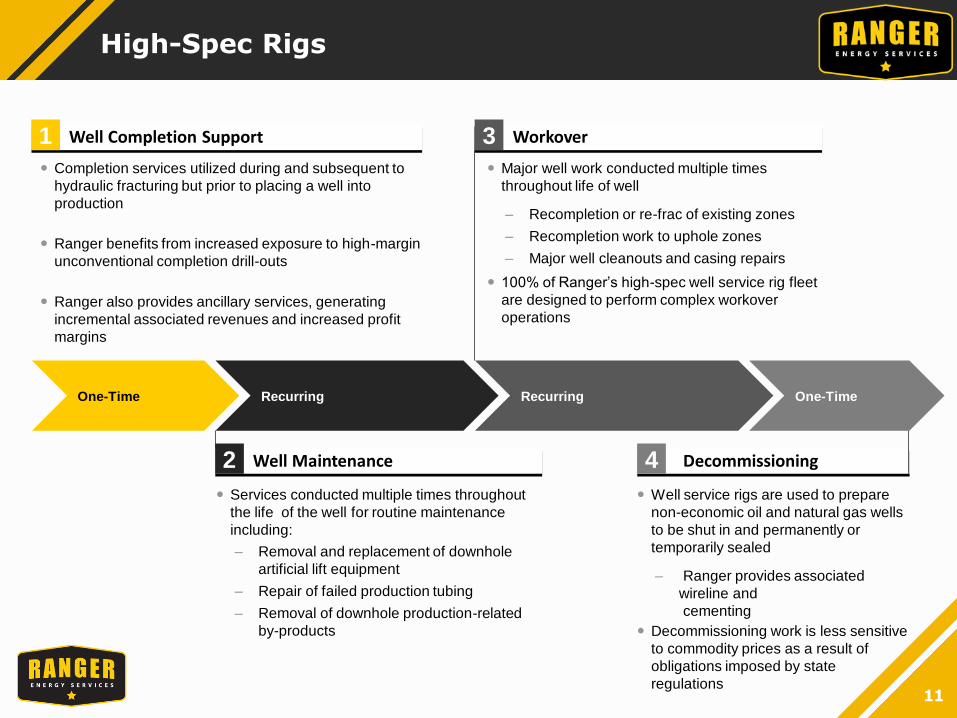
One-Time Recurring Recurring
Completion services utilized during and subsequent to
hydraulic fracturing but prior to placing a well into
production
Ranger benefits from increased exposure to high-margin
unconventional completion drill-outs
Ranger also provides ancillary services, generating
incremental associated revenues and increased profit
margins
Services conducted multiple times throughout
the life of the well for routine maintenance
including:
– Removal and replacement of downhole
artificial lift equipment
– Repair of failed production tubing
– Removal of downhole production-related
by-products
Major well work conducted multiple times
throughout life of well
– Recompletion or re-frac of existing zones
– Recompletion work to uphole zones
– Major well cleanouts and casing repairs
100% of Ranger’s high-spec well service rig fleet
are designed to perform complex workover
operations
Well service rigs are used to prepare
non-economic oil and natural gas wells
to be shut in and permanently or
temporarily sealed
– Ranger provides associated
wireline and
cementing
Decommissioning work is less sensitive
to commodity prices as a result of
obligations imposed by state
regulations
Well Maintenance2 Decommissioning
Well Completion Support1
4
Workover3
One-Time
High-Spec Rig Fleet
12
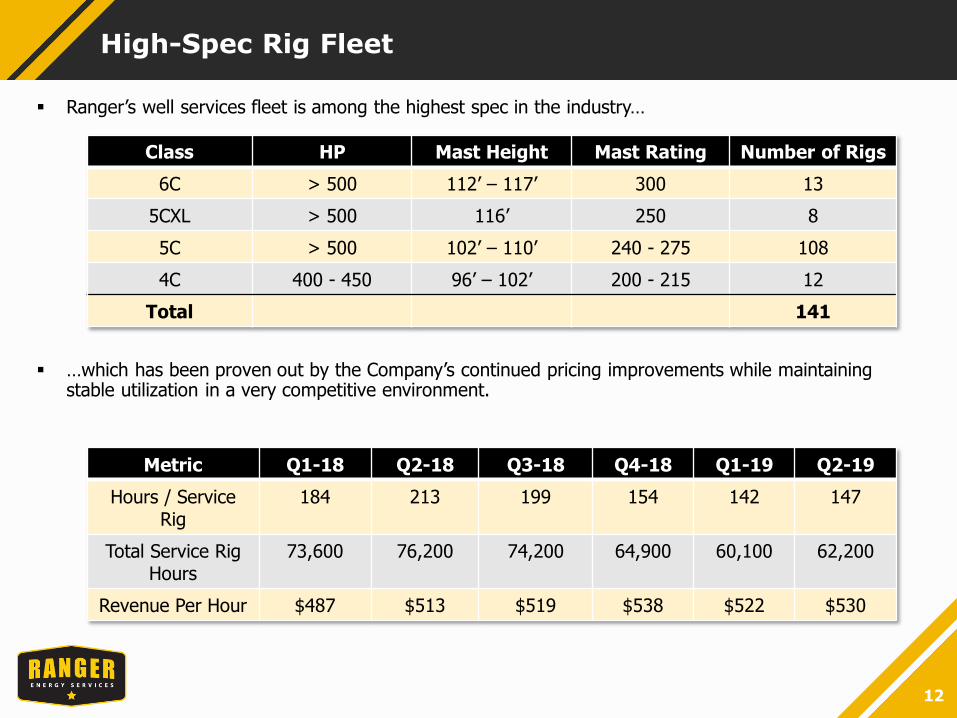
Ranger’s well services fleet is among the highest spec in the industry…
…which has been proven out by the Company’s continued pricing improvements while maintaining stable utilization in a very competitive environment.
Class HP Mast Height Mast Rating Number of Rigs
6C > 500 112’ – 117’ 300 13
5CXL > 500 116’ 250 8
5C > 500 102’ – 110’ 240 - 275 108
4C 400 - 450 96’ – 102’ 200 - 215 12
Total 141
Metric Q1-18 Q2-18 Q3-18 Q4-18 Q1-19 Q2-19
Hours / Service Rig
184 213 199 154 142 147
Total Service Rig Hours
73,600 76,200 74,200 64,900 60,100 62,200
Revenue Per Hour $487 $513 $519 $538 $522 $530
Processing Solutions
13
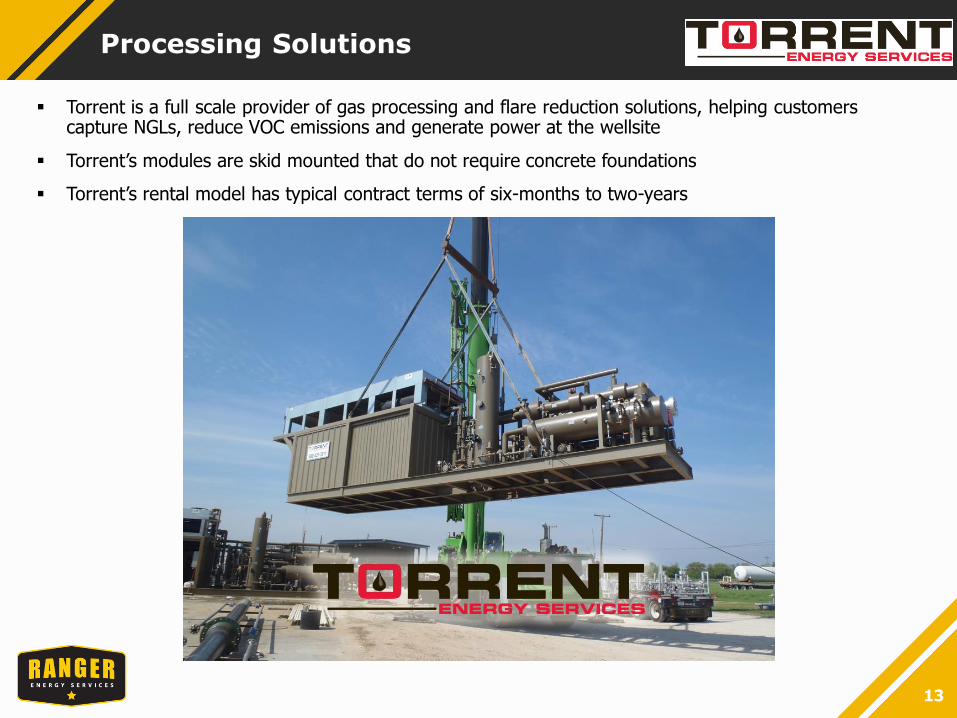
Torrent is a full scale provider of gas processing and flare reduction solutions, helping customers capture NGLs, reduce VOC emissions and generate power at the wellsite
Torrent’s modules are skid mounted that do not require concrete foundations
Torrent’s rental model has typical contract terms of six-months to two-years
Solutions Approach
14
Blue-Chip E&P Customer Base
15
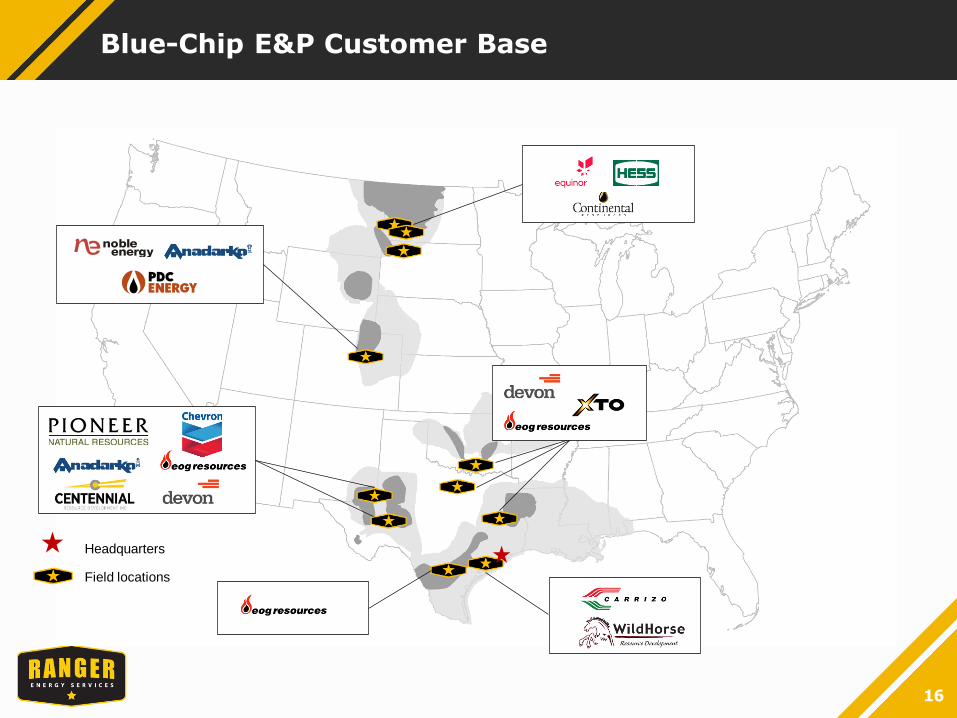
Blue-Chip E&P Customer Base
16
Field locations
Headquarters
Financial Overview
17
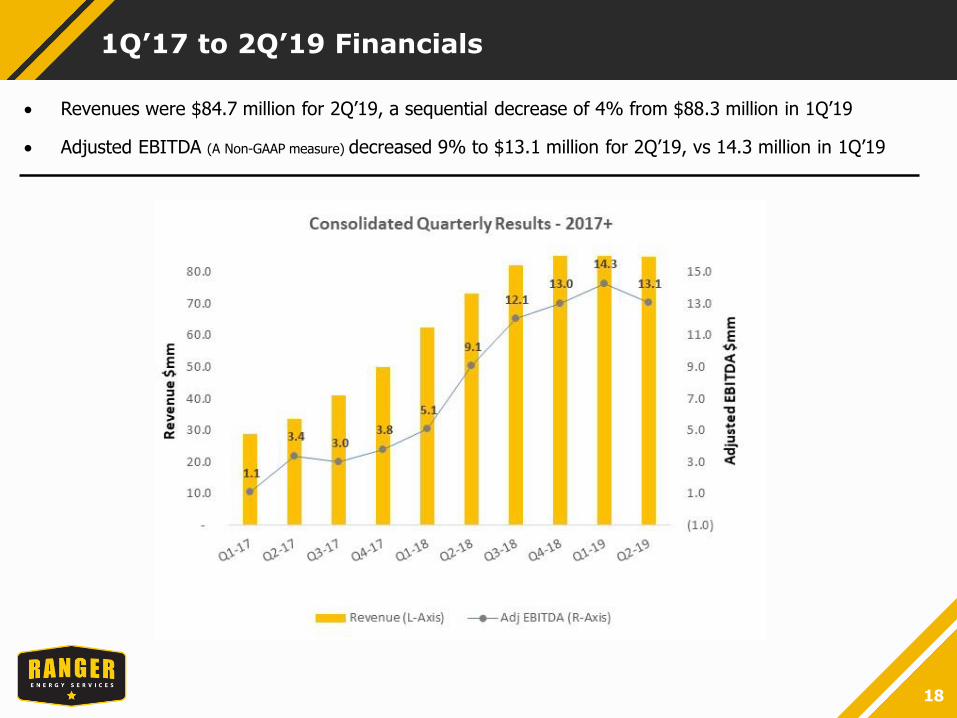
1Q’17 to 2Q’19 Financials
18
Revenues were $84.7 million for 2Q’19, a sequential decrease of 4% from $88.3 million in 1Q’19
Adjusted EBITDA (A Non-GAAP measure) decreased 9% to $13.1 million for 2Q’19, vs 14.3 million in 1Q’19
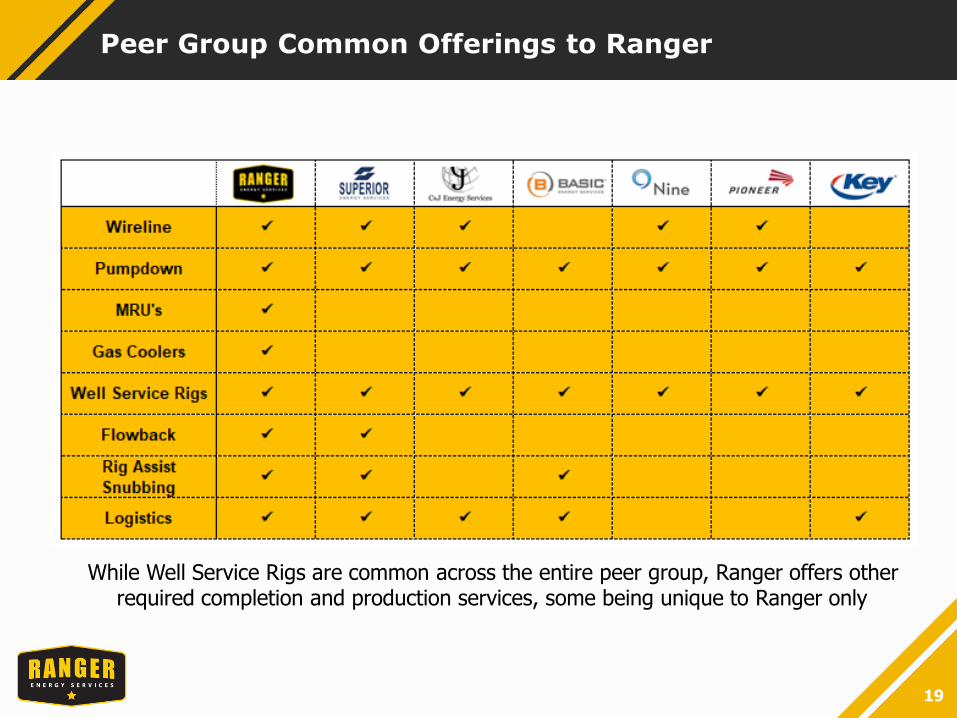
Peer Group Common Offerings to Ranger
19
While Well Service Rigs are common across the entire peer group, Ranger offers other required completion and production services, some being unique to Ranger only
Peer Comparison Valuation
20
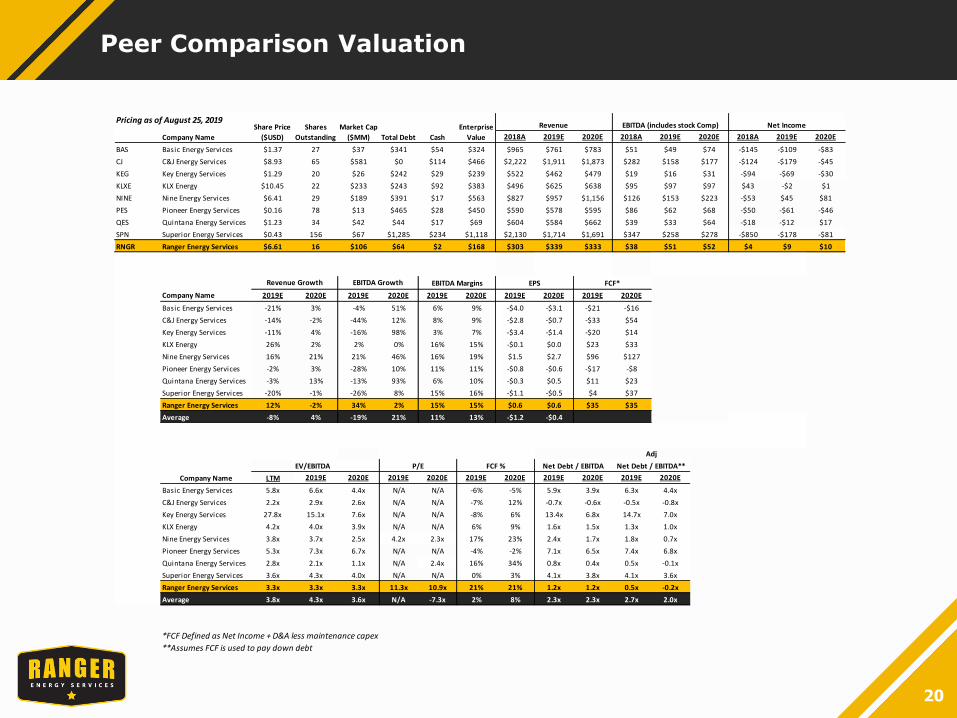
Pricing as of August 25, 2019
Company Name 2018A 2019E 2020E 2018A 2019E 2020E 2018A 2019E 2020E
BAS Basic Energy Services $1.37 27 $37 $341 $54 $324 $965 $761 $783 $51 $49 $74 -$145 -$109 -$83
CJ C&J Energy Services $8.93 65 $581 $0 $114 $466 $2,222 $1,911 $1,873 $282 $158 $177 -$124 -$179 -$45
KEG Key Energy Services $1.29 20 $26 $242 $29 $239 $522 $462 $479 $19 $16 $31 -$94 -$69 -$30
KLXE KLX Energy $10.45 22 $233 $243 $92 $383 $496 $625 $638 $95 $97 $97 $43 -$2 $1
NINE Nine Energy Services $6.41 29 $189 $391 $17 $563 $827 $957 $1,156 $126 $153 $223 -$53 $45 $81
PES Pioneer Energy Services $0.16 78 $13 $465 $28 $450 $590 $578 $595 $86 $62 $68 -$50 -$61 -$46
QES Quintana Energy Services $1.23 34 $42 $44 $17 $69 $604 $584 $662 $39 $33 $64 -$18 -$12 $17
SPN Superior Energy Services $0.43 156 $67 $1,285 $234 $1,118 $2,130 $1,714 $1,691 $347 $258 $278 -$850 -$178 -$81
RNGR Ranger Energy Services $6.61 16 $106 $64 $2 $168 $303 $339 $333 $38 $51 $52 $4 $9 $10
2019E 2020E 2019E 2020E 2019E 2020E 2019E 2020E 2019E 2020E
Basic Energy Services -21% 3% -4% 51% 6% 9% -$4.0 -$3.1 -$21 -$16
C&J Energy Services -14% -2% -44% 12% 8% 9% -$2.8 -$0.7 -$33 $54
Key Energy Services -11% 4% -16% 98% 3% 7% -$3.4 -$1.4 -$20 $14
KLX Energy 26% 2% 2% 0% 16% 15% -$0.1 $0.0 $23 $33
Nine Energy Services 16% 21% 21% 46% 16% 19% $1.5 $2.7 $96 $127
Pioneer Energy Services -2% 3% -28% 10% 11% 11% -$0.8 -$0.6 -$17 -$8
Quintana Energy Services -3% 13% -13% 93% 6% 10% -$0.3 $0.5 $11 $23
Superior Energy Services -20% -1% -26% 8% 15% 16% -$1.1 -$0.5 $4 $37
Ranger Energy Services 12% -2% 34% 2% 15% 15% $0.6 $0.6 $35 $35
Average -8% 4% -19% 21% 11% 13% -$1.2 -$0.4
EV/EBITDA
LTM 2019E 2020E 2019E 2020E 2019E 2020E 2019E 2020E 2019E 2020E
Basic Energy Services 5.8x 6.6x 4.4x N/A N/A -6% -5% 5.9x 3.9x 6.3x 4.4x
C&J Energy Services 2.2x 2.9x 2.6x N/A N/A -7% 12% -0.7x -0.6x -0.5x -0.8x
Key Energy Services 27.8x 15.1x 7.6x N/A N/A -8% 6% 13.4x 6.8x 14.7x 7.0x
KLX Energy 4.2x 4.0x 3.9x N/A N/A 6% 9% 1.6x 1.5x 1.3x 1.0x
Nine Energy Services 3.8x 3.7x 2.5x 4.2x 2.3x 17% 23% 2.4x 1.7x 1.8x 0.7x
Pioneer Energy Services 5.3x 7.3x 6.7x N/A N/A -4% -2% 7.1x 6.5x 7.4x 6.8x
Quintana Energy Services 2.8x 2.1x 1.1x N/A 2.4x 16% 34% 0.8x 0.4x 0.5x -0.1x
Superior Energy Services 3.6x 4.3x 4.0x N/A N/A 0% 3% 4.1x 3.8x 4.1x 3.6x
Ranger Energy Services 3.3x 3.3x 3.3x 11.3x 10.9x 21% 21% 1.2x 1.2x 0.5x -0.2x
Average 3.8x 4.3x 3.6x N/A -7.3x 2% 8% 2.3x 2.3x 2.7x 2.0x
*FCF Defined as Net Income + D&A less maintenance capex
**Assumes FCF is used to pay down debt
Net Debt / EBITDA**
FCF*
Adj
Net Debt / EBITDA
Net Income
P/E FCF %
Company Name
EBITDA Margins
Revenue
Revenue Growth EPS
EBITDA (includes stock Comp)
Company Name
EBITDA Growth
Share Price
($USD)
Shares
Outstanding
Market Cap
($MM) Total Debt Cash
Enterprise
Value