Embed Size (px)
Citation preview
Randomised controlled trial of the MEND
programme: a family-based community
intervention for childhood obesity
Paul Manfred Sacher
University College London
Institute of Child Health
Thesis submitted for the degree of Doctor of Philosophy
August 2013

In memory of my much loved grandparents
Barney and Cecile Abramowitz

3
4
Abstract
Background and aims Childhood obesity is a serious global public health
issue. The number of children affected has increased dramatically in recent
years, and despite extensive research in this field, no effective generalisable
prevention or treatment interventions have been achieved as yet. The aim of this
randomised controlled trial (RCT) was to evaluate the efficacy of the Mind,
Exercise, Nutrition, Do it (MEND) programme, a multicomponent community-
based childhood obesity intervention.
Methods One hundred and seventeen obese children were randomly
assigned to intervention or waiting list control (6-month delayed intervention)
groups. Parents and children attended eighteen 2-hour group educational and
physical activity sessions held twice weekly in sports centres and schools,
followed by provision of a 12-week free family swimming pass. Waist
circumference, BMI, body composition, physical activity level, sedentary
activities, cardiovascular fitness and self-esteem were assessed at baseline, 3,
6, 9 and 12 months.
Results Participants in the intervention group exhibited reduced waist
circumference z-score (−0.37; p < 0.0001, n = 81) and BMI z-score (−0.24; p <
0.0001, n = 82) at 6 months, compared to the control subjects. Significant
between-group differences were additionally observed in cardiovascular fitness,
physical activity, sedentary behaviours, and self-esteem. Mean attendance for
the MEND programme was 86%, with a drop-out rate of 4%. At 12 months waist
and BMI z-scores of children in the intervention group were reduced by 0.47 (p <
0.0001) and 0.23 (p < 0.0001), respectively, along with sustained benefits in
cardiovascular fitness, physical activity levels, and self-esteem.

5
Conclusions The MEND programme had beneficial effects on physical
and psychological outcomes (anthropometry, cardiovascular fitness, physical
activity habits, self-esteem), which were sustained at 12 months from baseline.
The high attendance and low drop-out rates suggest that families found this
intensive community-based intervention acceptable. Further studies are currently
underway to confirm the promising findings of this trial.

6
Acknowledgements
I am extremely grateful to my PhD supervisors, Professor Atul Singhal, Dr.
Margaret Lawson and Professor Tim Cole, for providing support and guidance
throughout the PhD process.
Much gratitude goes to Maria Kolotourou, a very dear friend and the trial
research assistant, for her dedication, tireless work, support and encouragement.
I wish to express a special acknowledgement to David Hodgson and the rest of
my family who provided emotional support and motivation to continue with my
studies.
I would also like to extend my gratitude to Harry MacMillan and other colleagues
at MEND for their continued support and for allowing me to have some time out
of the office to dedicate to the completion of this thesis.
Many thanks go to Vanessa Shaw for approving my secondment from Great
Ormond Street Hospital for Children NHS Trust to the MRC Childhood Nutrition
Research Centre UCL Institute of Child Health to conduct the RCT.
The MEND RCT was gratefully supported by a Researcher Development Award
in 2004 from the National Institute of Health Research. Additionally, financial and
non-financial support (e.g., staff and venues) were provided by the following
organisations: Sainsbury’s Supermarkets Ltd., Bromley Mytime, Bromley Primary
Care Trust (PCT), Great Ormond Street Hospital for Children NHS Trust, London
Borough of Lewisham, MEND Central Ltd., New Cross Gate New Deal for
Communities, Parkwood Leisure, Southwark PCT, The Lewisham Hospital NHS
Trust, UCL Institute of Child Health, and Waveney PCT.

7
Ultimately, this trial could not have been completed without the participating
families. I would like to personally thank all the children and parents for their
time, patience and enthusiasm.
This thesis is dedicated to my Grandparents who sadly passed away before
completion of my PhD. I know they would be proud of me.
8
Glossary of abbreviations
ADA American Dietetic Association
BF% Body Fat percentage
BIA Bioelectrical impedance analysis
BME Black and Minority Ethnic
BMI Body Mass Index
bpm beats per minute
CDC Centers for Disease Control and Prevention
CI Confidence Interval
cm centimetres
COMA Committee on Medical Aspects of Food Policy
CVD Cardiovascular Disease
d day
DEXA Dual-energy X-ray absorptiometry
DH Department of Health
DISC Dietary Intervention Study in Children
DRV Dietary Reference Values
EAR Estimated Average Requirement
EFSA European Food Safety Authority
ERV Energy Reference Value
FAO Food and Agriculture Organisation
FBBT Family-Based Behavioural Treatment
FDA Food and Drug Administration
FSA Food Standards Agency
FFM Fat-Free Mass
FM Fat Mass
GP General Practitioner

9
HD High Density Lipoprotein
HFFM Fraction of FFM that is water
hr hour
HSE Health Survey for England
IASO International Association for the Study of Obesity
ICER Incremental Cost-Effectiveness Ratio
IOTF International Obesity Taskforce
kcal kilocalories
kg kilograms
JECFA Joint FAO/WHO Expert Committee on Food Additives
LDL Low-Density Lipoprotein
LEAP Live, Eat and Play
m metre
m2 square metre
MEND Mind, Exercise, Nutrition, Do it!
mg milligrams
MK Maria Kolotourou
ml millilitres
mmHg millimetres of Mercury
mmol millimoles
MREC Metropolitan Multi-Centre Research Ethics Committee
MORI Market and Opinion Research International
n sample size
NAO National Audit Office
NCMP National Child Measurement Programme
NDNS National Diet and Nutrition Survey
NHLBI National Heart, Lung and Blood Institute

10
NHMRC National Health and Medical Research Council
NHS National Health Service
NICE National Institute for Health and Clinical Excellence
Ob gene Obese gene
OECD Organisation of Economic Co-operation and Development
P p-value
PCT Primary Care Trust
PE Physical Education
PS Paul Sacher
QALY Quality Adjusted Life Year
R&D Research and Development
RCT Randomised Controlled Trial
SCOTT Scottish Childhood Overweight Treatment Trial
SD Standard Deviation
SEC Socioeconomic Circumstances
SEP Socioeconomic Position
SHA Strategic Health Authority
SIGN Scottish Intercollegiate Guidelines Network
SOP Standard Operating Procedures
TBW Total Body Water
TG Triglycerides
TV Television
UCL University College London
UK United Kingdom
WHO World Health Organisation
11
Table of Contents
Abstract.......... ..................................................................................................... 4
Acknowledgements ............................................................................................ 6
Glossary of abbreviations.................................................................................. 8
List of Tables..... ............................................................................................... 19
List of Figures.. ................................................................................................. 22
List of Appendices ........................................................................................... 25
Chapter 1: Background and Introduction....................................................... 26
1.1 Background................................................................................................ 26
1.2 Introduction ................................................................................................ 27
1.3 Prevalence and future projections.............................................................. 28
1.3.1 Prevalence ........................................................................................... 28
1.3.2 Future projections................................................................................. 43
1.4 Definition of obesity.................................................................................... 45
1.5 Measures of weight status and body composition...................................... 46
1.5.1 Body mass index (BMI) ........................................................................ 46
1.5.2 BMI, BMI growth charts and z-scores in children ................................. 46
1.5.3 Adjusting for changes in BMI due to natural growth over time ............. 48
1.5.4 Clinical application of BMI .................................................................... 50
1.5.5 Waist circumference and waist circumference z-score in children ....... 52
1.5.6 Other methods of measuring body composition ................................... 54
1.6 Causes of childhood obesity ...................................................................... 59
1.6.1 Genetic factors ..................................................................................... 62
12
1.6.2 Diet and physical activity ...................................................................... 63
1.6.3 Other suggested factors ....................................................................... 74
1.7 Consequences of childhood obesity........................................................... 79
1.7.1 Short-term consequences .................................................................... 79
1.7.2 Long-term consequences..................................................................... 82
Chapter 2: Childhood obesity prevention ...................................................... 85
2.1. Categories of prevention interventions....................................................... 86
2.1.1 Primary prevention ............................................................................... 89
2.1.2 Secondary prevention .......................................................................... 98
2.1.3 Tertiary prevention ............................................................................. 150
Chapter 3: Development of the MEND intervention..................................... 153
3.1 Defining MEND as a complex intervention ............................................... 153
3.2 The MRC complex intervention process .................................................. 154
3.3 Development of the intervention............................................................... 155
3.3.1 Dietary component ............................................................................. 157
3.3.2 Behaviour modification component .................................................... 172
3.3.3 Physical activity component ............................................................... 173
3.3.4 Maintenance phase............................................................................ 176
Chapter 4: Feasibility and piloting methods ................................................ 179
4.1 MEND feasibility and piloting methods trial .............................................. 180
4.1.1 Methods ............................................................................................. 180
4.1.2 Recruitment........................................................................................ 182
4.1.3 Assessment........................................................................................ 183
13
4.1.4 Intervention ........................................................................................ 183
4.1.5 Outcomes........................................................................................... 184
4.1.6 Results ............................................................................................... 184
4.1.7 Discussion.......................................................................................... 186
4.2 Findings that informed the MEND RCT.................................................... 189
4.3 Reflection on the research process.......................................................... 191
Chapter 5: Hypotheses and aims .................................................................. 193
5.1 Trial hypotheses....................................................................................... 193
5.1.1 Hypothesis 1 ...................................................................................... 193
5.1.2 Hypothesis 2 ...................................................................................... 193
5.1.3 Hypothesis 3 ...................................................................................... 193
5.2 Aims ......................................................................................................... 194
Chapter 6: Methods ........................................................................................ 196
6.1 Identification of reviewed literature........................................................... 196
6.2 Standardisation ........................................................................................ 199
6.3 Training .................................................................................................... 199
6.4 Intervention resources.............................................................................. 199
6.5 Manualisation of the intervention.............................................................. 200
6.6 Intervention delivery teams and locations ................................................ 202
6.7 Training .................................................................................................... 203
6.8 The MEND RCT intervention.................................................................... 205
6.9 Study design ............................................................................................ 206
6.9.1 MRC guidance on evaluating a complex intervention......................... 206
14
6.9.2 Participants ........................................................................................ 209
6.9.3 Randomisation ................................................................................... 212
6.9.4 Sample size........................................................................................ 213
6.9.5 Outcome measurements .................................................................... 213
6.9.6 Anthropometry.................................................................................... 213
6.9.7 Body composition............................................................................... 215
6.9.8 Cardiovascular health......................................................................... 216
6.9.9 Physical activity and inactivity ............................................................ 216
6.9.10 Self-esteem ....................................................................................... 218
6.9.11 Dietary intake .................................................................................... 219
6.9.12 Socioeconomic and ethnic group classification ................................. 221
6.9.13 Puberty staging ................................................................................. 221
6.9.14 Attendance and retention .................................................................. 222
6.9.15 Data .................................................................................................. 223
6.9.16 Ethical, safety and other considerations............................................ 227
Chapter 7: Primary and secondary data analysis results ........................... 229
7.1 Trial flow chart.......................................................................................... 229
7.2 Dates of recruitment and follow-up........................................................... 229
7.3 Trial demographics................................................................................... 231
7.3.1 Baseline characteristics of the trial population ................................... 231
7.3.2 Baseline dietary intake ....................................................................... 234
7.4 Comparison of randomised groups at 3 months....................................... 236
7.5 Comparison of randomised groups at 6 months....................................... 240
15
7.5.1 Anthropometry.................................................................................... 240
7.5.2 Body composition............................................................................... 240
7.5.3 Cardiovascular health, physical and sedentary activity levels, and self-
esteem ............................................................................................... 241
7.5.4 Swimming pass use ........................................................................... 241
7.5.5 Dietary data........................................................................................ 243
7.6 Within-subject changes at 3 months from baseline .................................. 245
7.7 Within-subject changes at 6 months from baseline .................................. 247
7.8 Within-subject changes for waist circumference z-score and BMI z-scores
at 3 and 6 months .................................................................................... 249
7.9 Within-subject changes at 12 months from baseline ................................ 251
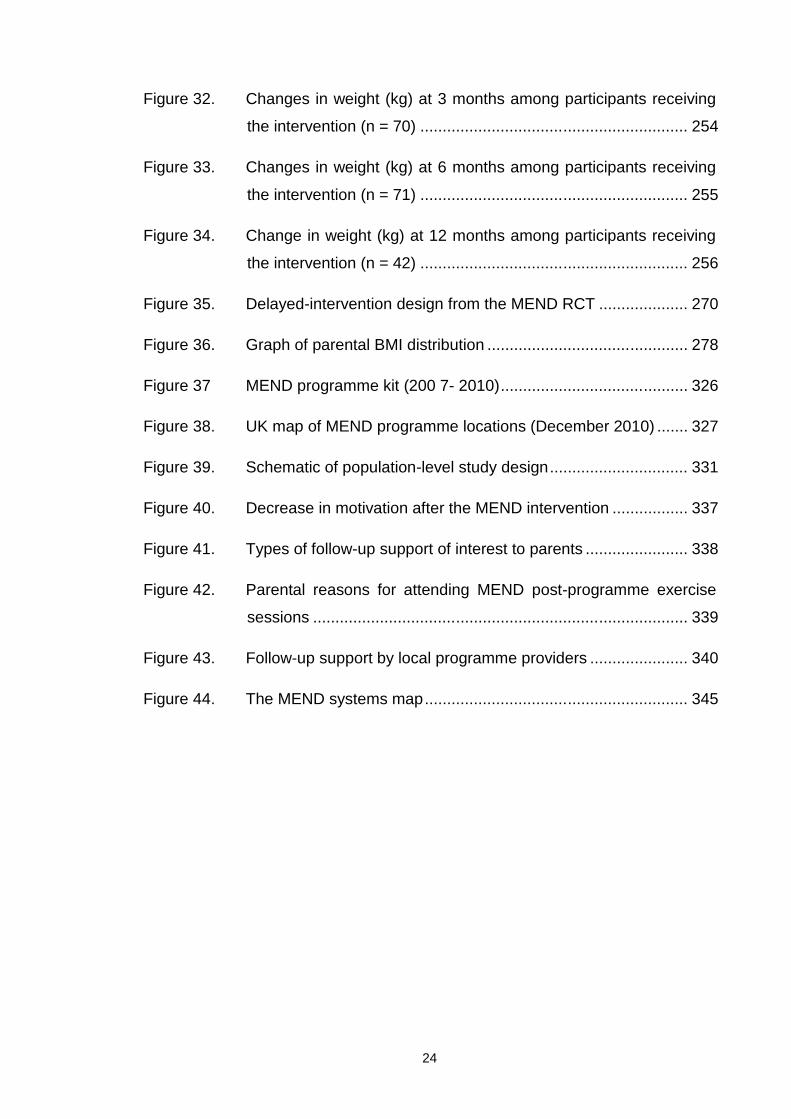
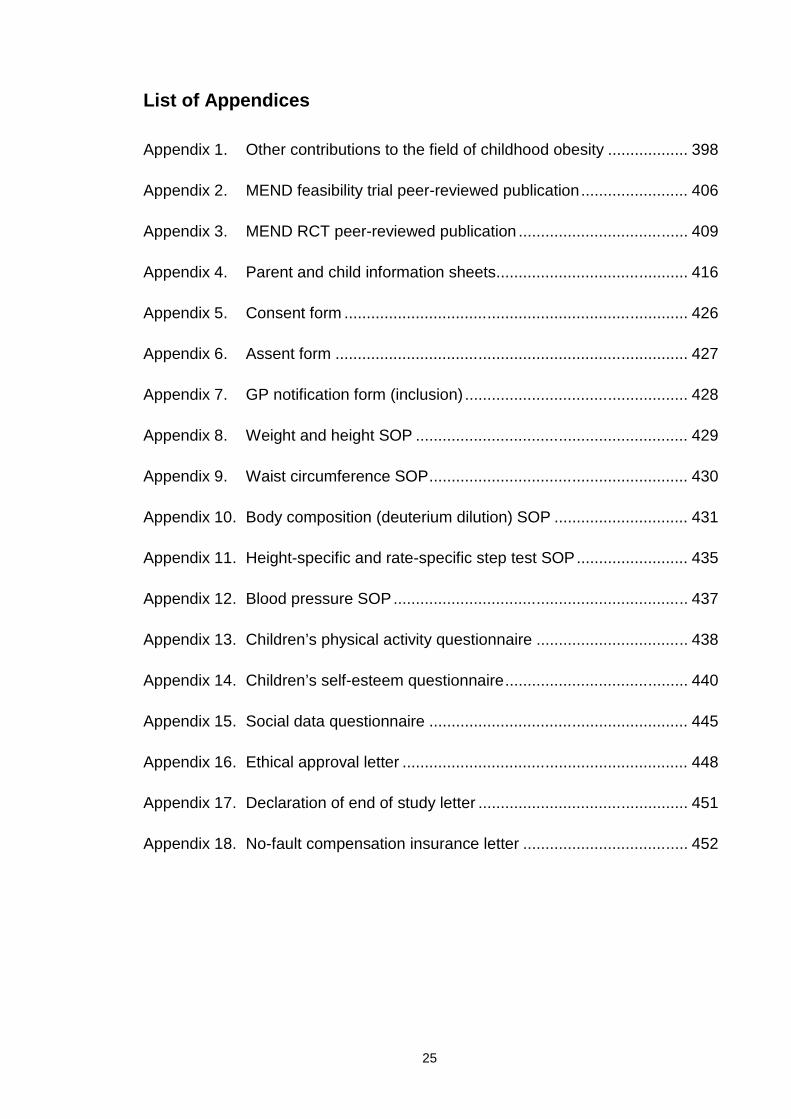
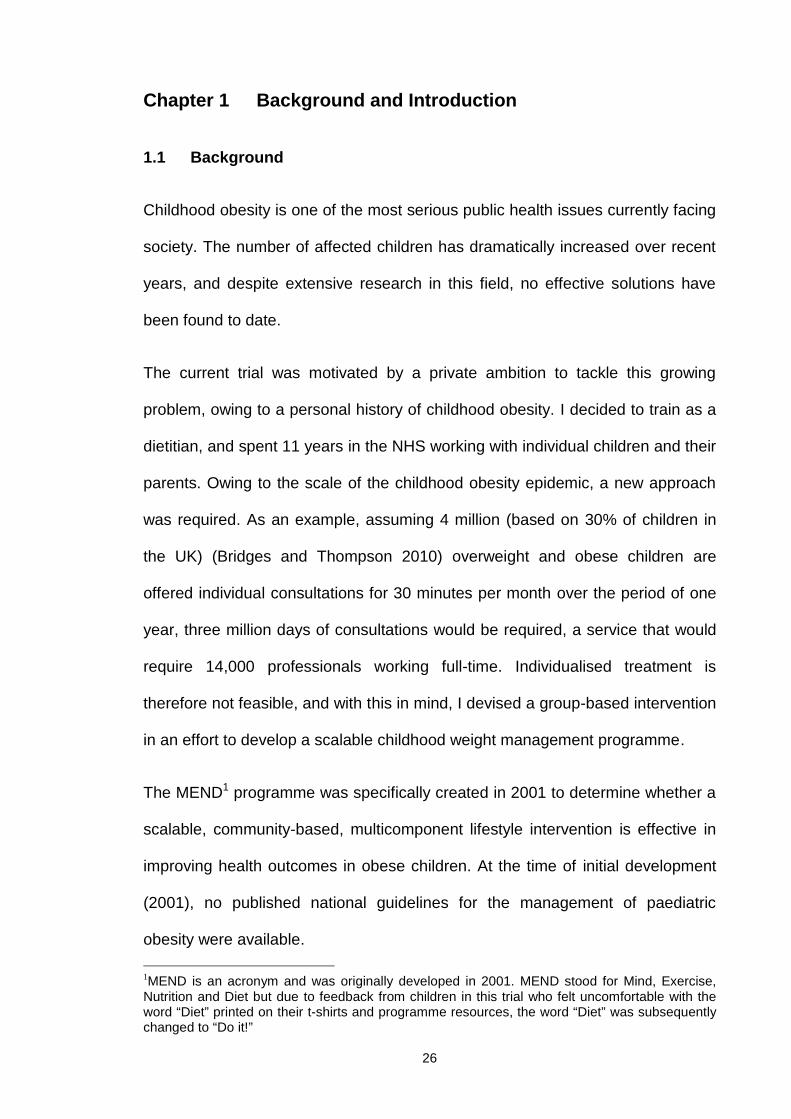
7.10 Changes in weight.................................................................................... 253
7.11 Within-subject changes at 3 and 6 months from the start of intervention
(dietary data) ............................................................................................ 256
7.12 Within-subject changes at 3 and 6 months (controls)............................... 260
7.13 Within-subject changes in reported dietary intake at 3 months from the start
of intervention (controls)........................................................................... 263
7.14 Within-subject changes in reported dietary intake at 6 months from the start
of intervention (controls)........................................................................... 265
7.15 Response rates ……………..…………………………………………………272
7.16 Measurement retention and trial dropout rates......................................... 267
7.17 Programme attendance and dropout rates............................................... 268
7.18 Adverse effects ........................................................................................ 268
7.19 Secondary data analysis results............................................................... 268
7.20 MEND UK implementation (Roll-out) results ............................................ 276
16
Chapter 8: Discussion.................................................................................... 280
8.1 Trial population baseline measures.......................................................... 281
8.1.1 Ethnicity and socioeconomic circumstances (SEC) ........................... 281
8.1.2 Anthropometry and body composition ................................................ 282
8.1.3 Parental obesity ................................................................................. 283
8.1.4 Cardiovascular fitness ........................................................................ 284
8.1.5 Physical and sedentary activity levels ................................................ 286
8.1.6 Global self-esteem ............................................................................. 287
8.1.7 Dietary intake ..................................................................................... 287
8.2 Changes in indicators of adiposity............................................................ 289
8.2.1 Waist circumference and waist circumference z-score....................... 289
8.2.2 BMI and BMI z-score.......................................................................... 292
8.2.3 Body composition............................................................................... 296
8.2.4 Weight loss......................................................................................... 297
8.2.5 Control group ..................................................................................... 298
8.3 Changes in indicators of cardiovascular fitness ....................................... 300
8.3.1 Blood pressure ................................................................................... 300
8.3.2 Recovery heart rate, physical and sedentary activity levels ............... 302
8.4 Changes in self-esteem............................................................................ 305
8.5 Changes in dietary intake......................................................................... 306
8.6 Assessment of clinical effectiveness ........................................................ 308
8.7 Potential factors influencing outcomes..................................................... 311
8.7.1 Socio-demographics........................................................................... 312
17
8.7.2 Intensity of multicomponent interventions .......................................... 312
8.7.3 Role of parents................................................................................... 315
8.7.4 Attendance and retention ................................................................... 316
8.7.5 Inclusion of physical activity ............................................................... 317
8.7.6 Physical activity versus sedentary behaviour ..................................... 318
8.7.7 Types of maintenance strategies ....................................................... 319
8.8 Comparison of MEND RCT with MEND feasibility trial............................. 321
8.9 Further research since completion of MEND RCT ................................... 323
8.9.1 Implementation: evaluation of a scaled-up intervention....................... 324
8.9.2 Independent evaluation ....................................................................... 330
8.9.3 Evaluation of maintenance strategies.................................................. 334
8.9.4 Evaluation of long-term follow-up ........................................................ 341
8.10 Research in progress ............................................................................... 342
Chapter 9: Strengths and limitations of MEND ............................................ 344
9.1 Strengths.................................................................................................. 344
9.1.1 MRC framework - developing and evaluating complex interventions . 344
9.1.2 Outcomes........................................................................................... 345
9.1.3 Acceptability to families ...................................................................... 346
9.1.4 Ethnicity and SEC .............................................................................. 347
9.1.5 Community and group-based intervention.......................................... 348
9.1.6 Internal validity ................................................................................... 349
9.2 Limitations ................................................................................................ 350
9.2.1 Study design and methods................................................................. 350
18
9.2.2 Recruitment........................................................................................ 352
9.2.3 Measurements ................................................................................... 353
9.2.4 Baseline demographics ...................................................................... 353
9.2.5 Contamination bias............................................................................. 354
9.2.6 Compliance bias................................................................................. 354
9.2.7 Waist circumference as a primary outcome ....................................... 354
9.2.8 Clinical significance of BMI................................................................. 355
9.2.9 Secondary data analysis .................................................................... 355
9.2.10 Physical and sedentary activities....................................................... 356
9.2.11 Poor dietary data ............................................................................... 356
9.2.12 Poor quality puberty data .................................................................. 357
9.2.13 Selective measurement dropout........................................................ 358
9.2.14 Economic evaluation ......................................................................... 359
9.3 Conclusions.............................................................................................. 360
9.4 Recommendations - future directions .…………………..………..….……. 356
References..... ................................................................................................. 365
Appendices..... ................................................................................................ 398
19
List of Tables
Table 1. Causes of obesity identified in research ...................................... 59
Table 2. Child overweight or obesity incidence according to parental weight
status........................................................................................... 78
Table 3. Options for prevention of childhood obesity................................. 90
Table 4. Comparison of best-practice individualised behavioural
intervention with standard dietetic care used in the SCOTT trial135
Table 5. Comparison - childhood obesity weight management
interventions. ............................................................................. 139
Table 6. MEND programme curriculum (theory sessions only)................ 162
Table 7. Summary of MEND’s dietary classification system.................... 166
Table 8. MEND label reading rules.......................................................... 168
Table 9. Behaviour modification principles used in the MEND programme172
Table 10. Baseline characteristics of the MEND feasibility trial participants….185
Table 11. Summary of feasibility trial results at baseline (0 months), end of
intervention (0-3 months) and follow-up (0-6 months) ............... 186
Table 12. Locations and professional backgrounds of MEND leaders ...... 202
Table 13. Baseline characteristics of the trial population........................... 232
Table 14. Detailed ethnicity breakdown..................................................... 233
Table 15. Baseline dietary intake and Dietary Reference Values .............. 235
Table 16. Comparison of randomised groups at 3 months ........................ 237
Table 17. Comparison of randomised groups at 3 months (dietary data) .. 239
Table 18. Comparison of randomised groups at 6 months ........................ 242
Table 19. Comparison of dietary intake between groups (6 months)......... 244
20
Table 20. Within-subject changes in outcomes at 3 months...................... 246
Table 21. Within-subject changes in outcome variables at 6 months ........ 248
Table 22. Within-subject changes in outcomes at 12 months.................... 252
Table 23. Within-subject changes in reported dietary intake at 3 months.. 258
Table 24. Within-subject changes in dietary intake at 6 months ................ 259
Table 25. Within-subject changes in outcomes at 3 months (controls) ...... 261
Table 26. Within-subject changes in outcomes at 6 months (controls) ...... 262
Table 27. Within subject changes in outcomes at 3 months (dietary data,
controls)..................................................................................... 264
Table 28. Within subject changes in outcomes at 6 months (dietary data,
controls)..................................................................................... 266
Table 29. Secondary data analysis: pre-intervention variables.................. 270
Table 30. Changes in BMI, waist circumference, blood pressure, fitness,
activity and self-esteem over 6 and 12 months ......................... 271
Table 31. Changes in BMI, waist circumference, blood pressure, fitness,
activity and self-esteem with BMI z-score change over 6 months272
Table 32. Changes in BMI, waist circumference, blood pressure, fitness,
activity and self-esteem with BMI z-score change over 12 months274
Table 33. Baseline characteristics of participants (UK Roll-out data) ........ 277
Table 34. Ethnicity breakdown (UK Roll-out data) ..................................... 277
Table 35. Within-subject analysis before and after the MEND programme
(UK Roll-out data)...................................................................... 279
Table 36. Comparison of BMI z-score at 12 months.................................. 295
Table 37. Hours of contact, professional time and physical activity .................. 314
Table 38. Outcome measures for MEND RCT and UK implementation
(Roll-out).................................................................................... 325
21
Table 39. Changes in BMI at 3 months for the MEND feasibility trial, RCT
and UK implementation (Roll-out) ............................................. 328
Table 40. Change in waist circumference at 3 months for the MEND
feasibility trial, RCT and UK implementation (Roll-out).............. 329
Table 41. Attendance and retention rates at 3 months for the MEND
feasibility trial, RCT and UK implementation (Roll-out).............. 329
Table 42. Parent surveys on follow-up support.......................................... 336
Table 43. Current independent trials to evaluate the MEND intervention .. 342
22
List of Figures
Figure 1. Global prevalence of overweight in boys (prior to 1990).............. 29
Figure 2. Global prevalence of overweight in boys (1990 -1999)................ 29
Figure 3. Global prevalence of overweight in boys (2000 - 2006)............... 30
Figure 4. Global prevalence of overweight in girls (prior to 1990)............... 30
Figure 5. Global prevalence of overweight in girls (1990 -1999)................. 31
Figure 6. Global prevalence of overweight in girls (2000 - 2006)................ 31
Figure 7. Latest available estimates of overweight and obese children aged
5 - 17 years ................................................................................. 32
Figure 8. Mean BMI for children aged 2 - 15 in relation to age and gender 34
Figure 9. Overweight and obesity prevalence of children aged 2-15 in
relation to age and gender (1995 - 2010) .................................... 34
Figure 10. Overweight and obesity prevalence of children aged 2-15 in
relation to age and gender (1995 - 2010) .................................... 35
Figure 11. Proportion of children meeting government recommendations for
physical activity in relation to age and gender ............................. 37
Figure 12. Objective summary of activity levels (children aged 4 - 15 years)
with 7 days valid accelerometry................................................... 38
Figure 13. Proportion of children in Years 1 - 11 (aged 5 - 16) participating in
at least 120 minutes of curriculum PE per week (2003/4 to
2009/10) ...................................................................................... 39
Figure 14. Prevalence of obesity (with 95% confidence limits) in relation to
year of measurement, school year and gender ........................... 42
Figure 15. Mean BMI z-score (with 95% confidence limits) in relation to year
of measurement, school year and gender ................................... 42
23
Figure 16. Prevalence of underweight, overweight, obese, and combined
overweight and obese children in relation to NCMP year and
school year .................................................................................. 43
Figure 17. Forecast trend in the proportions of overweight and obese adults
and children from 1993 to 2050................................................... 44
Figure 18. Changes in weight, BMI, and BMI z-score over a one-year period
for a fictitious eight-year old boy participating in a weight
management intervention ............................................................ 50
Figure 19. Prevalence of underweight, overweight and obesity in Reception
year in relation to ethnic group .................................................... 76
Figure 20. Prevalence of underweight, overweight and obesity in Year 6 in
relation to ethnic group................................................................ 77
Figure 21. Consequences of childhood obesity ............................................ 80
Figure 22. Outline of Ensemble Prévenons l'Obésité Des Enfants (EPODE)
stakeholders at central and local levels ....................................... 87
Figure 23. Summary of meta-analysis results from RCTs of treatments for
paediatric obesity ...................................................................... 119
Figure 24. Key elements of the MRC development and evaluation process154
Figure 25. The Eatwell plate ....................................................................... 160
Figure 26. The MEND programme kit (2005).............................................. 200
Figure 27. Trial flow chart ........................................................................... 208
Figure 28. Trial flow chart (with numbers)................................................... 230
Figure 29. Maternal BMI distribution at baseline......................................... 233
Figure 30. Within-subject changes for waist circumference z-score at
baseline, 3 and 6 months ........................................................ 249
Figure 31. Within-subject changes for BMI z-score -baseline, 3 and 6 months.250
24
Figure 32. Changes in weight (kg) at 3 months among participants receiving
the intervention (n = 70) ............................................................ 254
Figure 33. Changes in weight (kg) at 6 months among participants receiving
the intervention (n = 71) ............................................................ 255
Figure 34. Change in weight (kg) at 12 months among participants receiving
the intervention (n = 42) ............................................................ 256
Figure 35. Delayed-intervention design from the MEND RCT .................... 270
Figure 36. Graph of parental BMI distribution ............................................. 278
Figure 37 MEND programme kit (200 7- 2010).......................................... 326
Figure 38. UK map of MEND programme locations (December 2010) ....... 327
Figure 39. Schematic of population-level study design............................... 331
Figure 40. Decrease in motivation after the MEND intervention ................. 337
Figure 41. Types of follow-up support of interest to parents ....................... 338
Figure 42. Parental reasons for attending MEND post-programme exercise
sessions .................................................................................... 339
Figure 43. Follow-up support by local programme providers ...................... 340
Figure 44. The MEND systems map........................................................... 345
25
List of Appendices
Appendix 1. Other contributions to the field of childhood obesity .................. 398
Appendix 2. MEND feasibility trial peer-reviewed publication........................ 406
Appendix 3. MEND RCT peer-reviewed publication ...................................... 409
Appendix 4. Parent and child information sheets........................................... 416
Appendix 5. Consent form ............................................................................. 426
Appendix 6. Assent form ............................................................................... 427
Appendix 7. GP notification form (inclusion) .................................................. 428
Appendix 8. Weight and height SOP ............................................................. 429
Appendix 9. Waist circumference SOP.......................................................... 430
Appendix 10. Body composition (deuterium dilution) SOP .............................. 431
Appendix 11. Height-specific and rate-specific step test SOP......................... 435
Appendix 12. Blood pressure SOP.................................................................. 437
Appendix 13. Children’s physical activity questionnaire .................................. 438
Appendix 14. Children’s self-esteem questionnaire......................................... 440
Appendix 15. Social data questionnaire .......................................................... 445
Appendix 16. Ethical approval letter ................................................................ 448
Appendix 17. Declaration of end of study letter ............................................... 451
Appendix 18. No-fault compensation insurance letter ..................................... 452
26
Chapter 1 Background and Introduction
1.1 Background
Childhood obesity is one of the most serious public health issues currently facing
society. The number of affected children has dramatically increased over recent
years, and despite extensive research in this field, no effective solutions have
been found to date.
The current trial was motivated by a private ambition to tackle this growing
problem, owing to a personal history of childhood obesity. I decided to train as a
dietitian, and spent 11 years in the NHS working with individual children and their
parents. Owing to the scale of the childhood obesity epidemic, a new approach
was required. As an example, assuming 4 million (based on 30% of children in
the UK) (Bridges and Thompson 2010) overweight and obese children are
offered individual consultations for 30 minutes per month over the period of one
year, three million days of consultations would be required, a service that would
require 14,000 professionals working full-time. Individualised treatment is
therefore not feasible, and with this in mind, I devised a group-based intervention
in an effort to develop a scalable childhood weight management programme.
The MEND1 programme was specifically created in 2001 to determine whether a
scalable, community-based, multicomponent lifestyle intervention is effective in
improving health outcomes in obese children. At the time of initial development
(2001), no published national guidelines for the management of paediatric
obesity were available.
1MEND is an acronym and was originally developed in 2001. MEND stood for Mind, Exercise,Nutrition and Diet but due to feedback from children in this trial who felt uncomfortable with theword “Diet” printed on their t-shirts and programme resources, the word “Diet” was subsequentlychanged to “Do it!”
27
I developed the MEND concept, and acted as the Chief Investigator for both the
feasibility and randomised controlled trials. The curriculum for the MEND
intervention was developed by a multidisciplinary team, led by myself. Appendix
1 summarises my contributions to the field of childhood obesity.
This thesis provides a critical appraisal of the relevant childhood obesity
literature and describes how the MEND intervention was developed, evaluated in
the form of a feasibility trial and RCT, and subsequently implemented in diverse
communities in the UK.
1.2 Introduction
Obesity is a complex disease caused by a wide range of factors. At a basic level,
people gain weight by consuming more calories than expended over a prolonged
period of time. Excess calories accumulate and are stored by the body as fat,
leading to overweight and obesity. Several variables, including biological,
behavioural and societal influences, increase the likelihood of excessive weight
gain. Childhood obesity is currently a major public health issue, as evident from
the numerous academic and governmental publications related to this topic and
reports of its frequent occurrence in the media and press. Effective, replicable
and scalable interventions are thus urgently required to treat the millions of
children affected by this serious medical condition.
Data on the prevalence and future projections of the childhood obesity epidemic
are presented in the next section.
28
1.3 Prevalence and future projections
1.3.1 Prevalence
International
The prevalence of overweight and obesity is escalating worldwide in both
developed and developing countries. A recent analysis of the global (144
countries) prevalence of overweight and obesity in preschool children (< 5 years)
showed that in 2010, 43 million children (35 million from developing countries)
were estimated as overweight and obese, while 92 million were at risk of
overweight. The prevalence of preschool childhood overweight and obesity
increased from 4.2% (95% CI: 3.2%, 5.2%) in 1990 to 6.7% (95% CI: 5.6%,
7.7%) in 2010 (de Onis, Blossner et al. 2010).The worldwide childhood obesity
problem varies significantly across countries, owing to the different
characteristics of populations, lack of data and methodological issues (Wang and
Lobstein 2006). Interesting illustrations of the increasing global prevalence of
overweight in children and adolescents have been published by the International
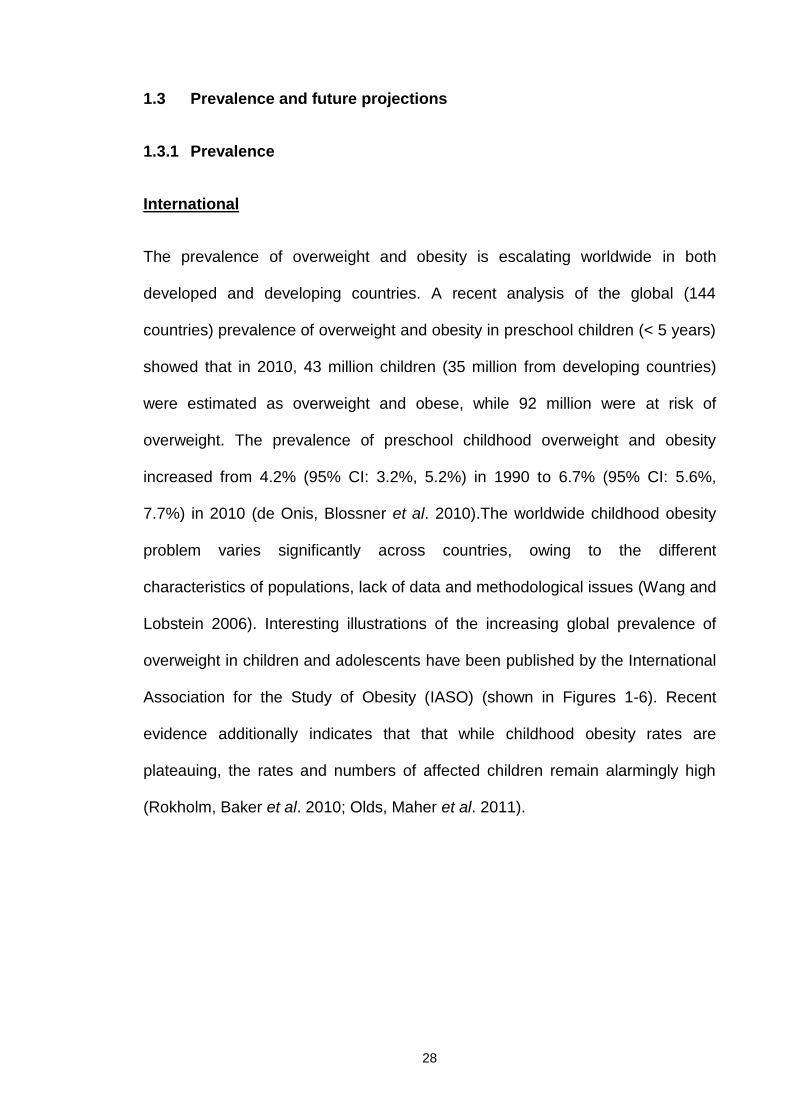
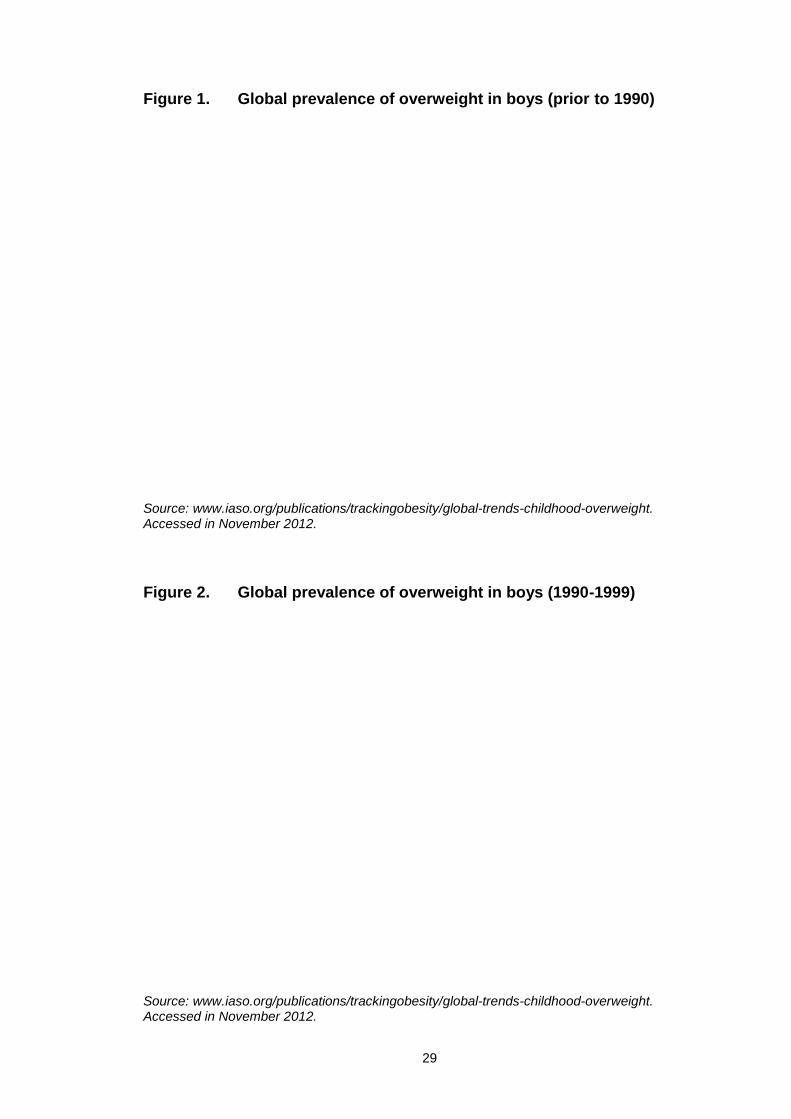
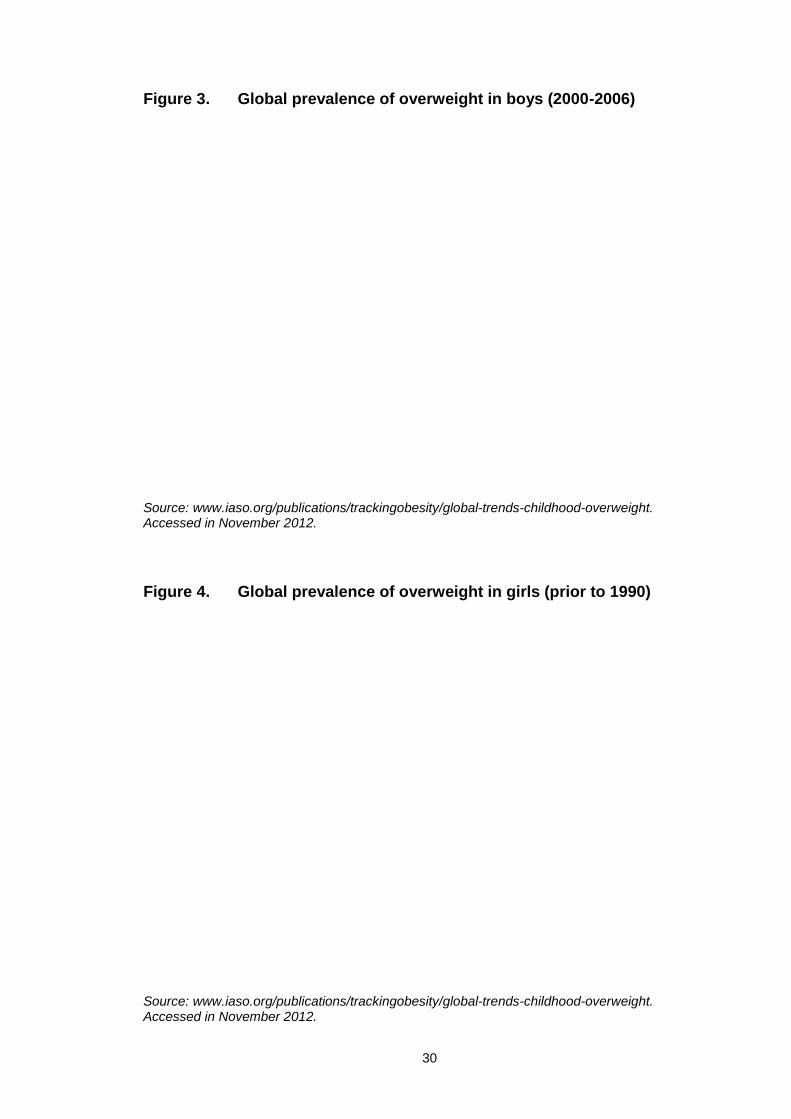
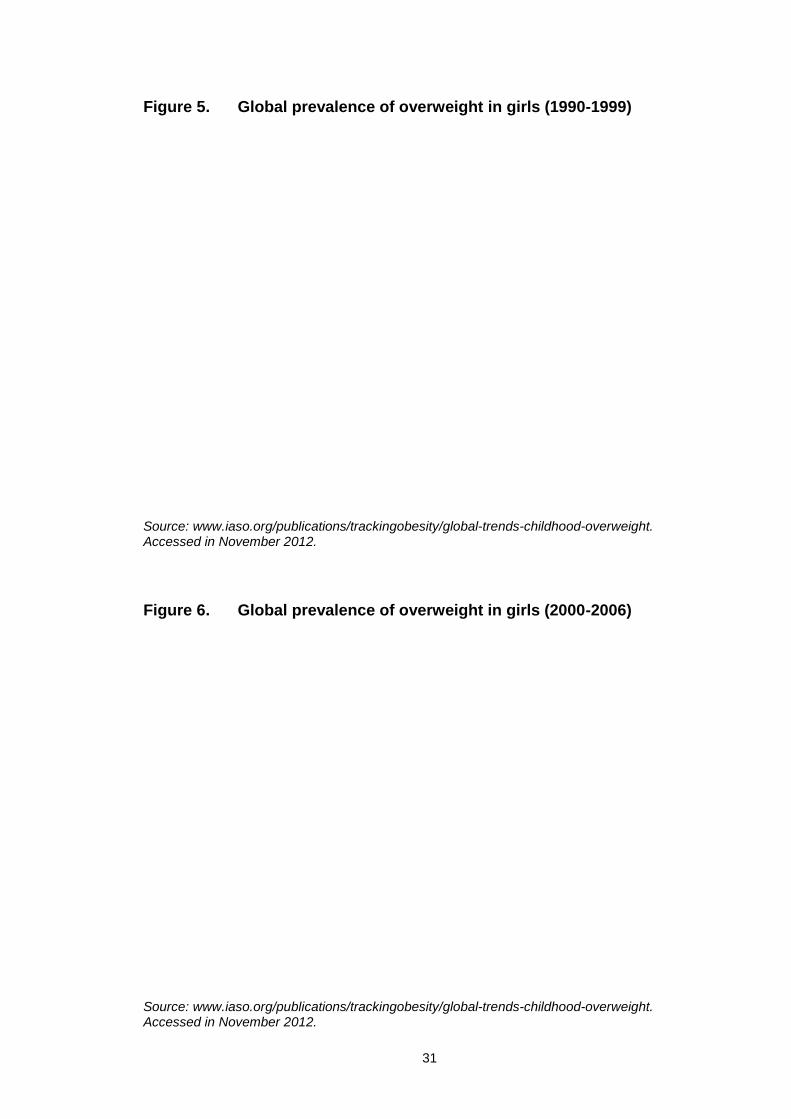
Association for the Study of Obesity (IASO) (shown in Figures 1-6). Recent
evidence additionally indicates that that while childhood obesity rates are
plateauing, the rates and numbers of affected children remain alarmingly high
(Rokholm, Baker et al. 2010; Olds, Maher et al. 2011).
29
Figure 1. Global prevalence of overweight in boys (prior to 1990)
Source: www.iaso.org/publications/trackingobesity/global-trends-childhood-overweight.Accessed in November 2012.
Figure 2. Global prevalence of overweight in boys (1990-1999)
Source: www.iaso.org/publications/trackingobesity/global-trends-childhood-overweight.Accessed in November 2012.
30
Figure 3. Global prevalence of overweight in boys (2000-2006)
Source: www.iaso.org/publications/trackingobesity/global-trends-childhood-overweight.Accessed in November 2012.
Figure 4. Global prevalence of overweight in girls (prior to 1990)
Source: www.iaso.org/publications/trackingobesity/global-trends-childhood-overweight.Accessed in November 2012.
31
Figure 5. Global prevalence of overweight in girls (1990-1999)
Source: www.iaso.org/publications/trackingobesity/global-trends-childhood-overweight.Accessed in November 2012.
Figure 6. Global prevalence of overweight in girls (2000-2006)
Source: www.iaso.org/publications/trackingobesity/global-trends-childhood-overweight.Accessed in November 2012.
32
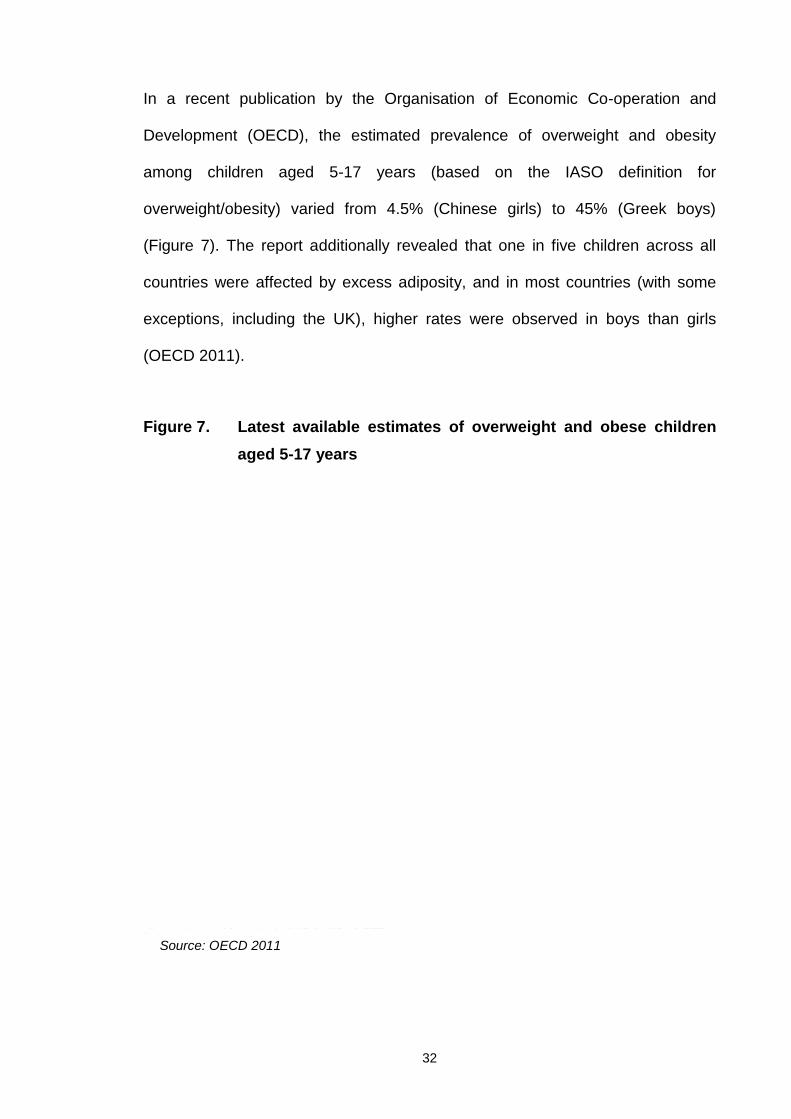
In a recent publication by the Organisation of Economic Co-operation and
Development (OECD), the estimated prevalence of overweight and obesity
among children aged 5-17 years (based on the IASO definition for
overweight/obesity) varied from 4.5% (Chinese girls) to 45% (Greek boys)
(Figure 7). The report additionally revealed that one in five children across all
countries were affected by excess adiposity, and in most countries (with some
exceptions, including the UK), higher rates were observed in boys than girls
(OECD 2011).
Figure 7. Latest available estimates of overweight and obese childrenaged 5-17 years
Source: OECD 2011
33
United Kingdom (UK)
Currently, the two most widely available sources of data in the UK for the
calculation of childhood overweight and obesity prevalence are the Health
Survey for England (HSE) and National Child Measurement Programme
(NCMP). Both datasets use the 85th (overweight) and 95th (obese) BMI
percentiles of the 1990 reference population (Cole, Freeman et al. 1995) (see
Section 1.5) for classification of overweight and obese, respectively.
Health Survey for England (HSE)
The HSE presents a cross-sectional survey of health and health-related
behaviours in adults and children in England. Since 1993, HSE datasets have
been produced annually. HSE comprises a series of core elements that are
included every year and specific topics that are included in selected years. Core
childhood topics include general health, fruit and vegetable consumption, height
and weight (BMI).
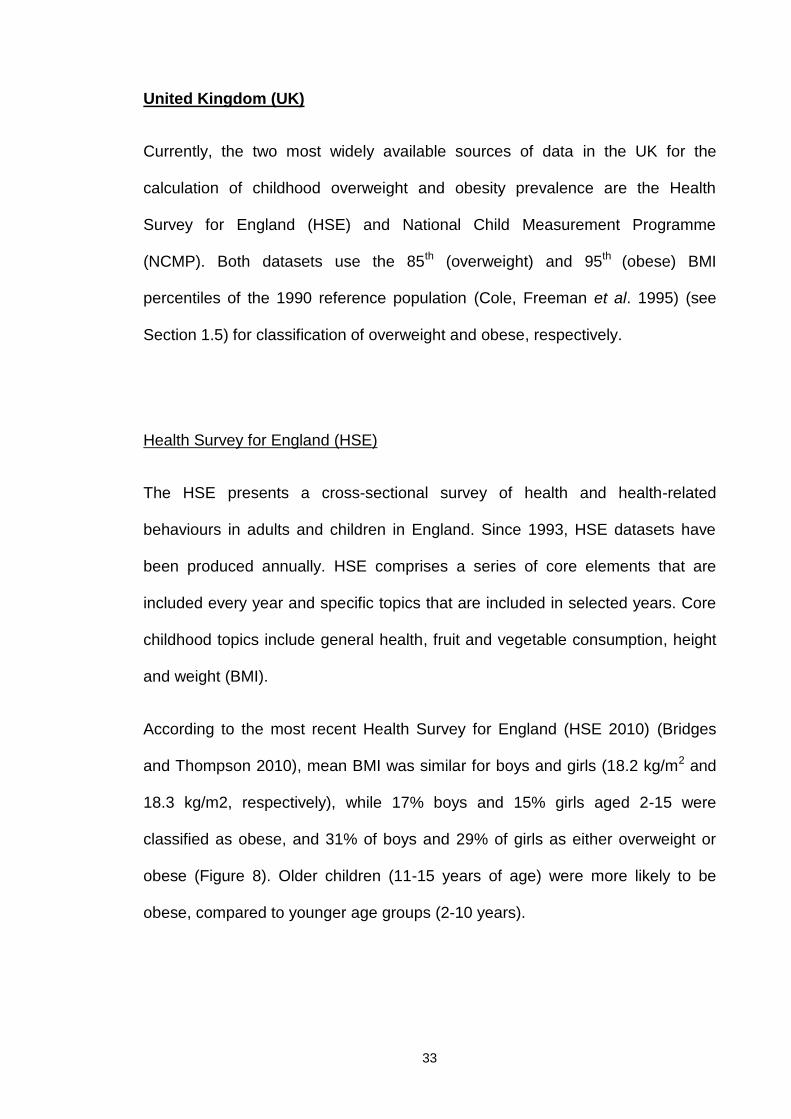
According to the most recent Health Survey for England (HSE 2010) (Bridges
and Thompson 2010), mean BMI was similar for boys and girls (18.2 kg/m2 and
18.3 kg/m2, respectively), while 17% boys and 15% girls aged 2-15 were
classified as obese, and 31% of boys and 29% of girls as either overweight or
obese (Figure 8). Older children (11-15 years of age) were more likely to be
obese, compared to younger age groups (2-10 years).
34
Figure 8. Mean BMI for children aged 2-15 in relation to age and gender
Taken from the Health Survey for England (2010) publication (Bridges and Thompson 2010).
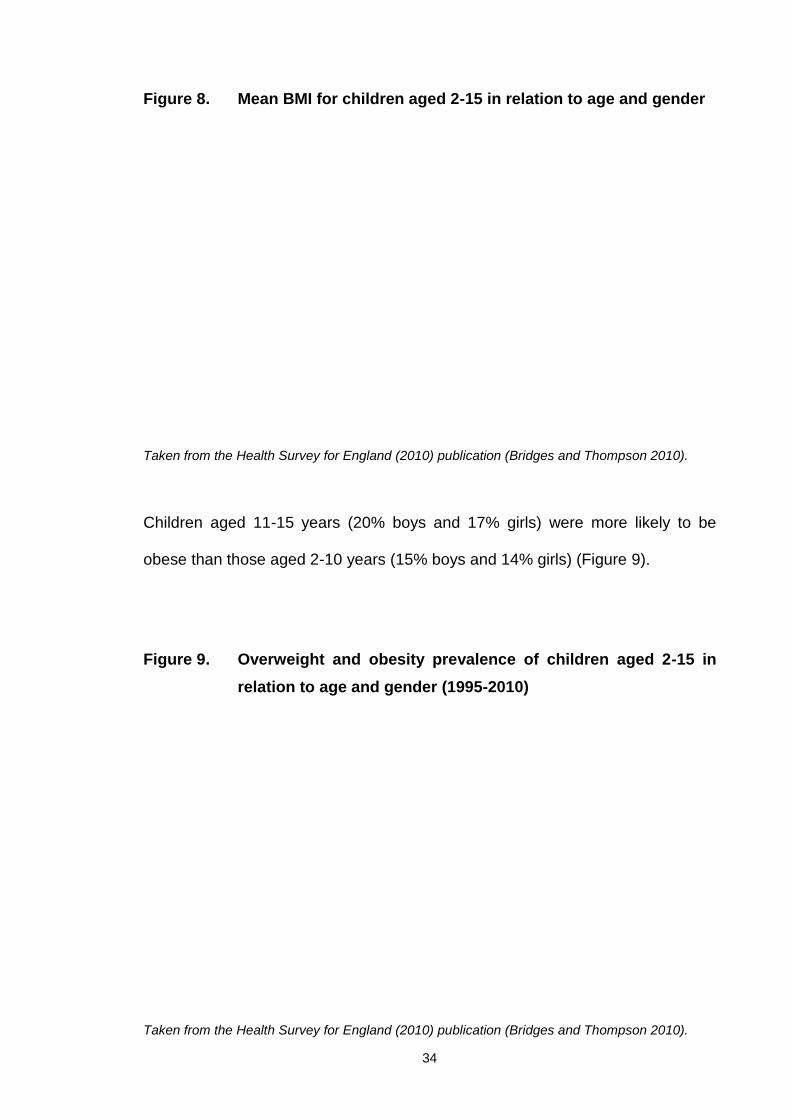
Children aged 11-15 years (20% boys and 17% girls) were more likely to be
obese than those aged 2-10 years (15% boys and 14% girls) (Figure 9).
Figure 9. Overweight and obesity prevalence of children aged 2-15 inrelation to age and gender (1995-2010)
Taken from the Health Survey for England (2010) publication (Bridges and Thompson 2010).
35
Figure 9 depicts the trends in mean BMI and the prevalence of overweight and
obesity between 1995 and 2010 for children aged 2-15 in the UK. For boys,
mean BMI increased by 0.5 kg/m2 (from 17.7 kg/m2 to 18.2 kg/m2). Among girls,
mean BMI in 2010, recorded as 18.3 kg/m2, was not significantly different from
that in 1995, although increases were recorded in the intervening period.
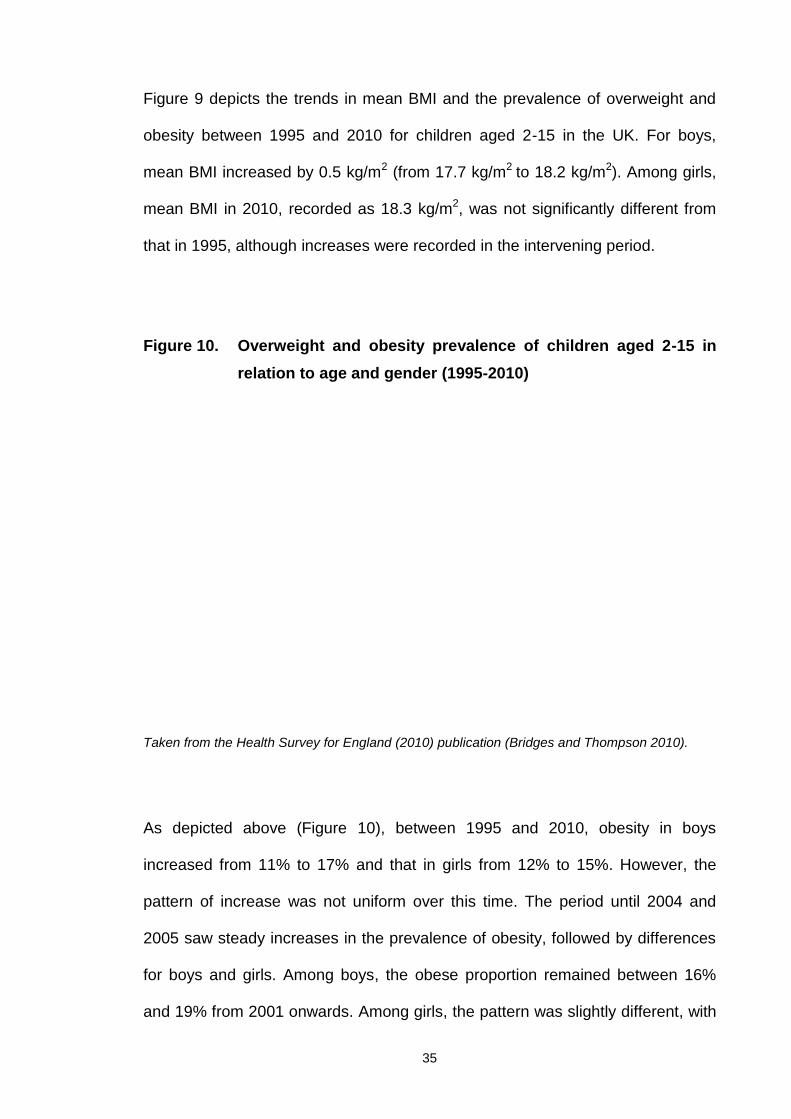
Figure 10. Overweight and obesity prevalence of children aged 2-15 inrelation to age and gender (1995-2010)
Taken from the Health Survey for England (2010) publication (Bridges and Thompson 2010).
As depicted above (Figure 10), between 1995 and 2010, obesity in boys
increased from 11% to 17% and that in girls from 12% to 15%. However, the
pattern of increase was not uniform over this time. The period until 2004 and
2005 saw steady increases in the prevalence of obesity, followed by differences
for boys and girls. Among boys, the obese proportion remained between 16%
and 19% from 2001 onwards. Among girls, the pattern was slightly different, with
36
a significant decrease in obesity between 2005 and 2006 and similar levels
between 2006 and 2010.The lack of significant changes in the proportion of
obese children over the last four to five years suggests that the trend in obesity
may be stabilising.
Similarly, a study in the USA reported no significant changes in the prevalence of
high BMI for age among children and adolescents between 2003-2004 and
2005-2006 (Ogden, Carroll et al. 2012).The authors of the HSE have highlighted
the importance of monitoring trends in the future using HSE data to confirm that
this is a continuing pattern in England, and not just a plateau within a longer-term
trend of a more gradual increase.
Analysis of the HSE 2010 data additionally revealed differences in the proportion
of obese children when adjusted for equivalised household income. Children in
the highest income quintiles were the least likely to be obese (14% in the highest
two quintiles for boys and 12%-13% in the highest three quintiles for girls), and
obesity was most likely in children in the lowest quintiles (20% in the lowest
quintile for boys and 17%-18% for girls).This is a common finding, consistent
with earlier studies showing that childhood obesity is more prevalent among
older children and lower income households(HSE 2006; Stamatakis, Zaninotto et
al. 2010; El-Sayed, Scarborough et al. 2011; van Stralen, te Velde et al. 2012).
Earlier analysis of HSE data (2008) focusing on physical activity and fitness
revealed that physical activity levels decrease with age and no more than 45% of
the population at any age achieved the government recommendations for
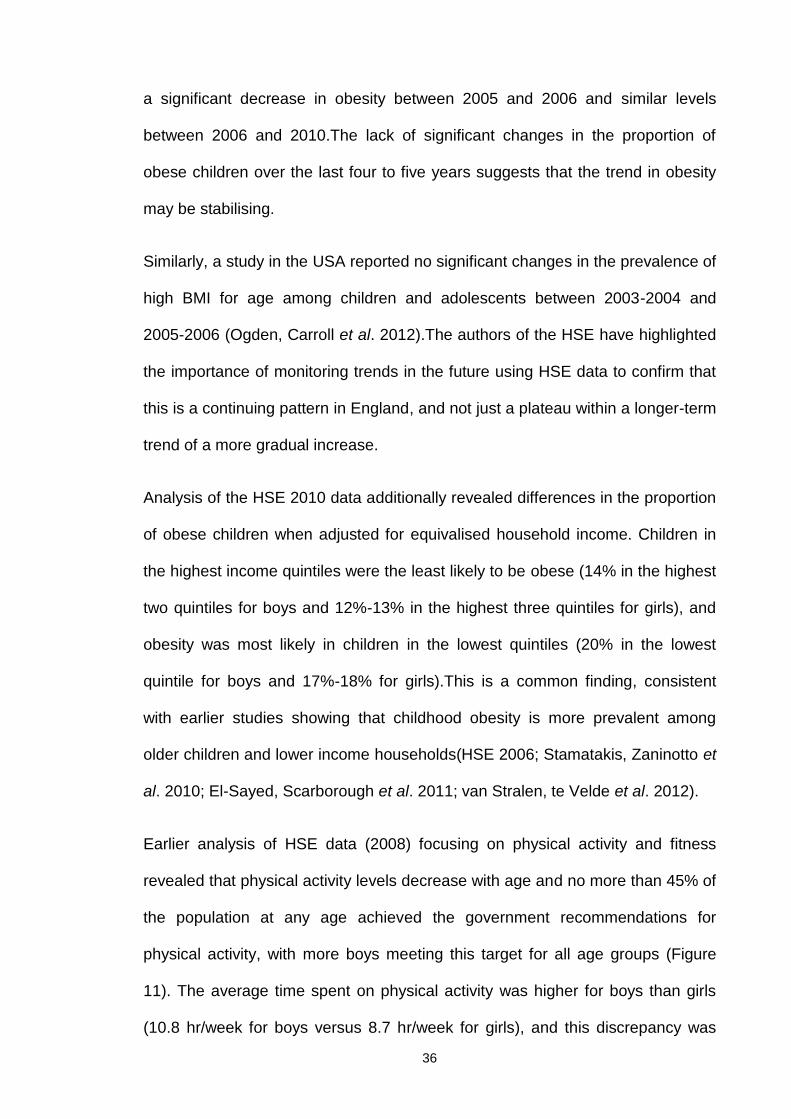
physical activity, with more boys meeting this target for all age groups (Figure
11). The average time spent on physical activity was higher for boys than girls
(10.8 hr/week for boys versus 8.7 hr/week for girls), and this discrepancy was
37
more obvious with increasing age, as activity time was significantly reduced in
girls. Girls were found to walk more, while boys participated in more informal
activities (90% for boys and 86% for girls) and formal sports (49% for boys and
38% for girls).
Figure 11. Proportion of children meeting government recommendationsfor physical activity in relation to age and gender
Source: HSE 2008
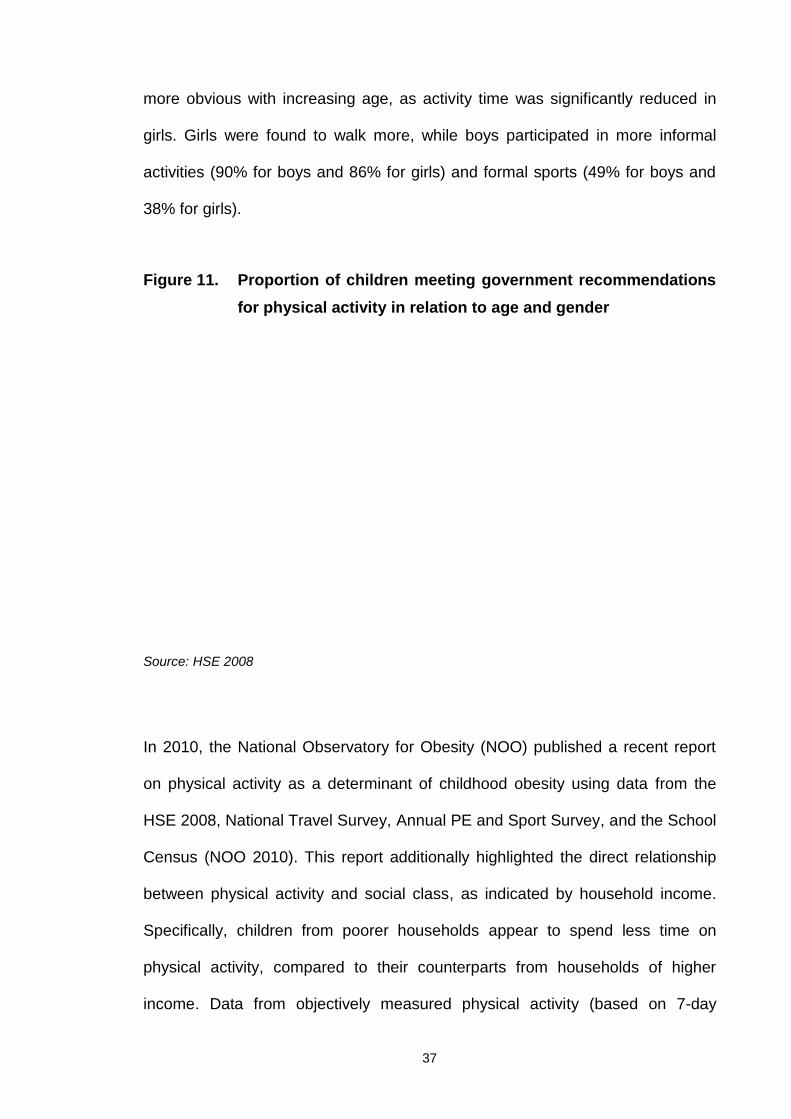
In 2010, the National Observatory for Obesity (NOO) published a recent report
on physical activity as a determinant of childhood obesity using data from the
HSE 2008, National Travel Survey, Annual PE and Sport Survey, and the School
Census (NOO 2010). This report additionally highlighted the direct relationship
between physical activity and social class, as indicated by household income.
Specifically, children from poorer households appear to spend less time on
physical activity, compared to their counterparts from households of higher
income. Data from objectively measured physical activity (based on 7-day
38
accelerometry), shown in Figure 12, further supported the gender differences in
physical activity levels as well as the alarming failure to meet the government's
recommendations for physical activity with increasing age.
Figure 12. Objective summary of activity levels (children aged 4-15 years)with 7 days valid accelerometry
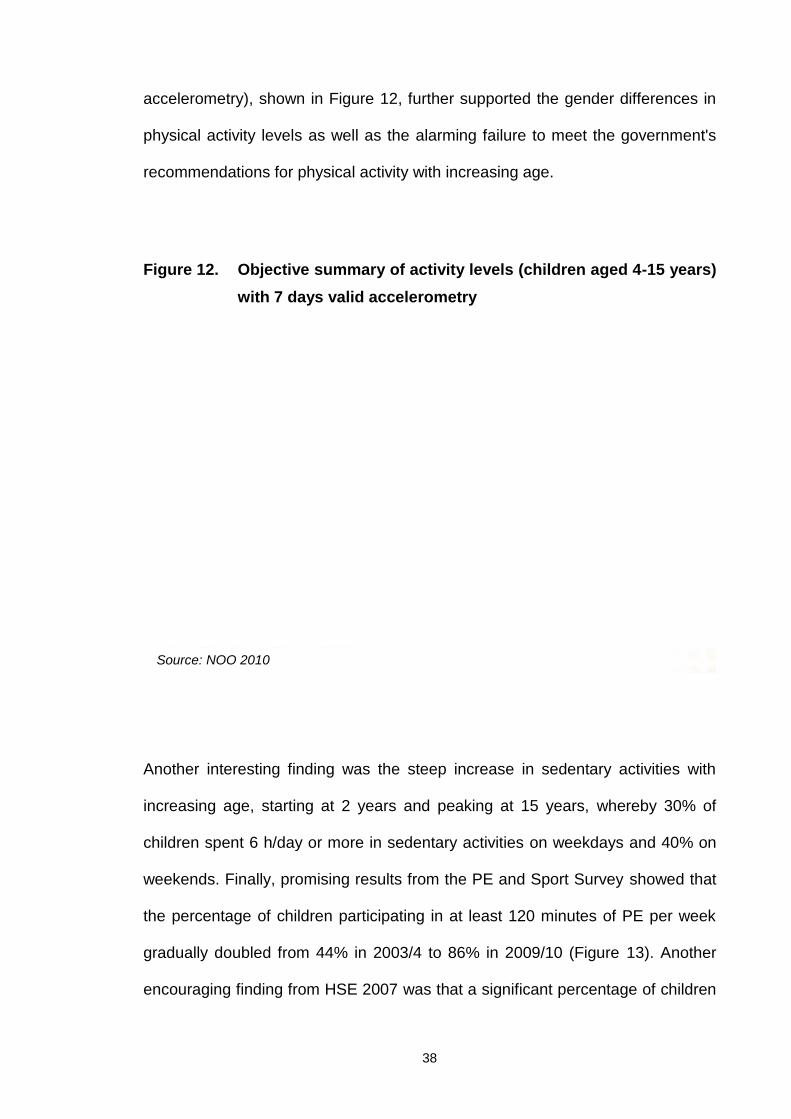
Another interesting finding was the steep increase in sedentary activities with
increasing age, starting at 2 years and peaking at 15 years, whereby 30% of
children spent 6 h/day or more in sedentary activities on weekdays and 40% on
weekends. Finally, promising results from the PE and Sport Survey showed that
the percentage of children participating in at least 120 minutes of PE per week
gradually doubled from 44% in 2003/4 to 86% in 2009/10 (Figure 13). Another
encouraging finding from HSE 2007 was that a significant percentage of children
Source: NOO 2010
39
aged 11-15 years, especially girls, expressed a wish to increase their levels of
physical activity during the day (NOO 2010).
Figure 13. Proportion of children in Years 1-11 (aged 5-16) participating inat least 120 minutes of curriculum PE per week (2003/4 to2009/10)
National Child Measurement Programme (NCMP)
NCMP is an annual programme that measures the heights and weights of
children aged 4-5 years (Reception) and 10-11 years (Year 6) in England. The
2010/11 NCMP represents the fifth year of assessment after incorporation of this
system (DH 2011), and contains the largest number of child measurements
collected to date by the programme, specifically, 1,036,608 measurements of
children from state-maintained schools. Overall participation in NCMP was
92.6% in 2010/11, which was the highest ever achieved. This high rate of
participation dramatically narrowed the confidence intervals, thus minimising the
chance of potential errors in prevalence rates. However, it should be noted that
40
there is a high risk of bias due to the issue of selective opt-out. Overweight and
obese children are more likely to be self-conscious about their weight and
therefore sensitive to the measurement process. In addition, parent’s may fear
upsetting their children by allowing school nurses to weigh them, or may not be
ready to face the issue that their child is either overweight or obese. For these
reasons, it is possible, that the 7.4% of missing data may consist of a higher
proportion of overweight and obese children therefore skewing the overall
prevalence rates downwards at both Reception year and Year 6. Further efforts
should be made to ensure that all children are measured as part of the NCMP in
order to obtain accurate prevalence rates. Accurate NCMP prevalence rates will
provide much needed data to establish yearly changes in UK childhood
overweight and obesity levels.
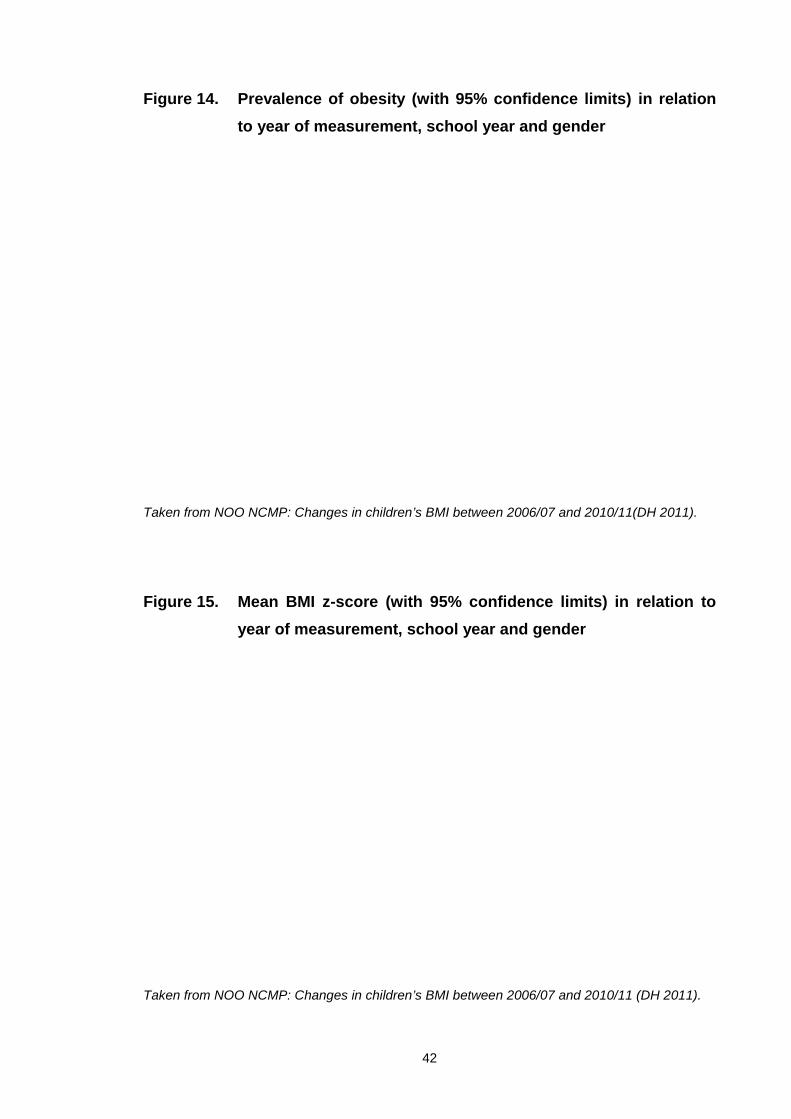
According to this study, the combined prevalence of overweight and obesity at
Reception year was 22.6% (around one in five children) and 33.4% at Year 6
(around one in three children). The prevalence of obesity in Year 6 was over
twice that in Reception (19% versus 9.4%). A higher number of boys than girls
were classified as obese in both year groups.
Another interesting observation was that in the Reception year, prevalence of
overweight was higher than that of obesity (13.2% for Reception versus 9.4% for
Year 6), whereas in Year 6, the converse was observed (14.4% for Reception
versus 19% for Year 6). More girls than boys were classified as healthy weight
among both Reception (77.9% girls versus 66.6% boys) and Year 6 children
(75% girls versus 64% boys). In terms of location, South Central Strategic Health
Authority (SHA) had the lowest prevalence of obesity (8.1% and 16.5% for
Reception and Year 6, respectively), while London SHA had the highest
41
prevalence (11.1% and 21.9% for Reception and Year 6, respectively). Similar
trends were observed for urban areas, which had higher obesity rates, compared
to town and village areas. Interestingly, HSE 2010 revealed no differences in
children across different SHAs in terms of prevalence of obesity or BMI (Bridges
and Thompson 2010).
As expected, more deprived areas were associated with greater prevalence of
obesity, and the discrepancy was more pronounced among the older children
(Reception year: 12.1% in the most deprived areas versus 6.9% in the least
deprived areas; Year 6: 23.7% in the most deprived areas versus 13.8% in the
least deprived areas). Ethnicity additionally affected the prevalence of obesity. In
particular, significantly higher rates of obesity were recorded in children from the
"Asian or Asian British", "Any other ethnic group", "Black or Black British" and
"Mixed" groups, compared to the national average.
Comparison of NCMP 2010/2011 data with earlier years
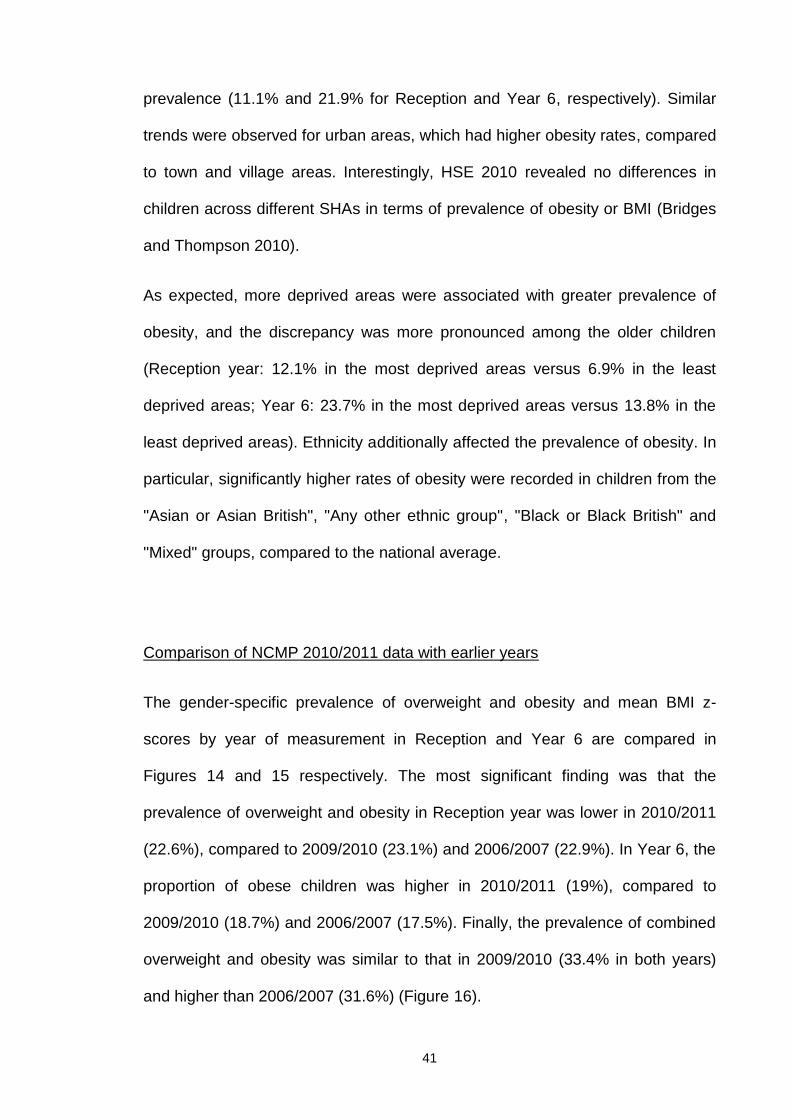
The gender-specific prevalence of overweight and obesity and mean BMI z-
scores by year of measurement in Reception and Year 6 are compared in
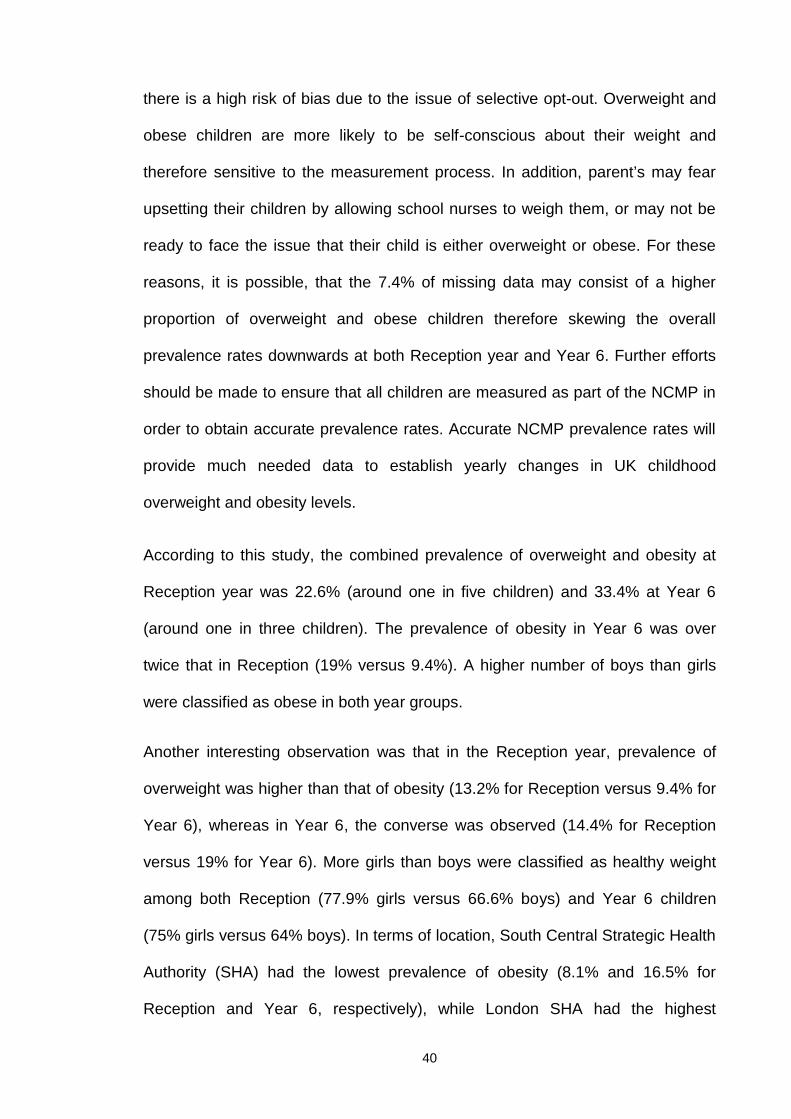
Figures 14 and 15 respectively. The most significant finding was that the
prevalence of overweight and obesity in Reception year was lower in 2010/2011
(22.6%), compared to 2009/2010 (23.1%) and 2006/2007 (22.9%). In Year 6, the
proportion of obese children was higher in 2010/2011 (19%), compared to
2009/2010 (18.7%) and 2006/2007 (17.5%). Finally, the prevalence of combined
overweight and obesity was similar to that in 2009/2010 (33.4% in both years)
and higher than 2006/2007 (31.6%) (Figure 16).
42
Figure 14. Prevalence of obesity (with 95% confidence limits) in relationto year of measurement, school year and gender
Taken from NOO NCMP: Changes in children’s BMI between 2006/07 and 2010/11(DH 2011).
Figure 15. Mean BMI z-score (with 95% confidence limits) in relation toyear of measurement, school year and gender
Taken from NOO NCMP: Changes in children’s BMI between 2006/07 and 2010/11 (DH 2011).
43
Figure 16. Prevalence of underweight, overweight, obese, and combinedoverweight and obese children in relation to NCMP year andschool year
1.3.2 Future projections
According to the Foresight Report, around 14% of the under 20s in the UK are
predicted to be obese by 2025, which should increase to 25% by 2050 (Figure
17) (DH 2011). A recent publication indicates that if the current trends persist,
the percentage and numbers of overweight and obese children in the UK will
considerably increase by 2015,with further widening of the gap between manual
and non-manual classes (Stamatakis, Wardle et al. 2010). Globally, for
preschool children, this prevalence of obesity is expected to reach 9.1% (95%
CI: 7.3%, 10.9%) or 60 million by 2020 (de Onis, Blossner et al. 2010). However,
despite the observed plateau in the prevalence of childhood overweight and
Taken from NOO NCMP: Changes in children’s BMI between 2006/07 and
2010/11 (DH 2011).
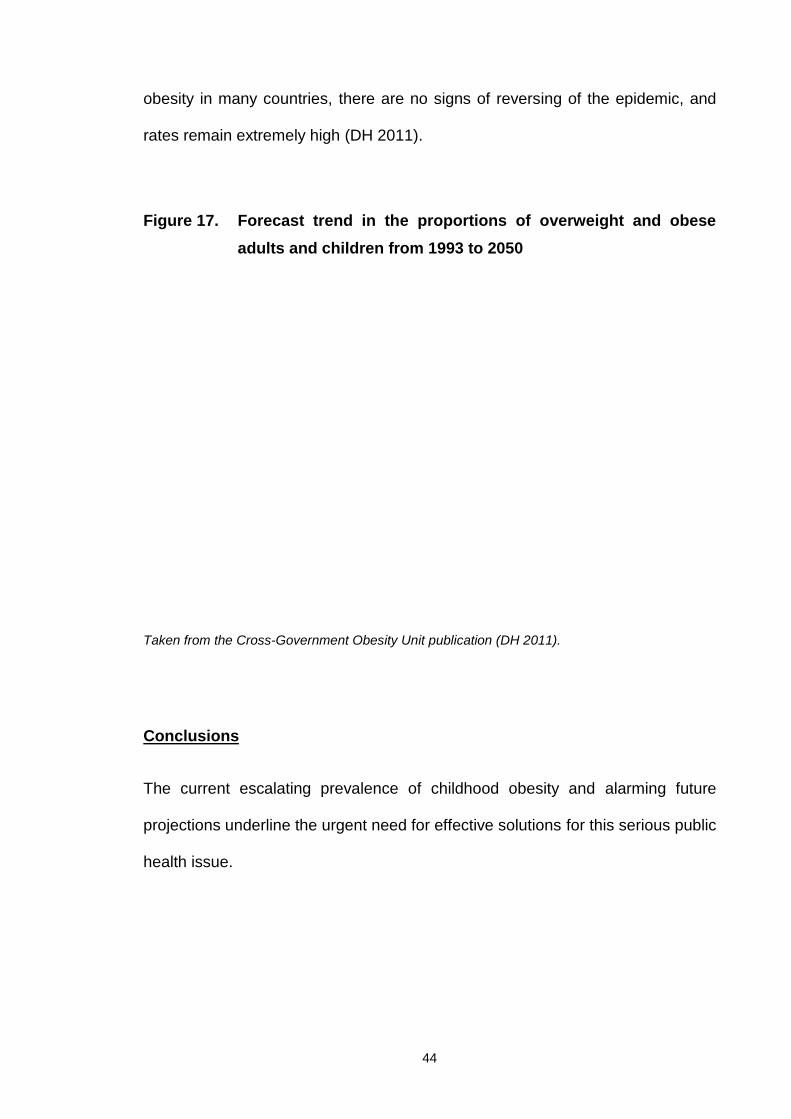
44
obesity in many countries, there are no signs of reversing of the epidemic, and
rates remain extremely high (DH 2011).
Figure 17. Forecast trend in the proportions of overweight and obeseadults and children from 1993 to 2050
Taken from the Cross-Government Obesity Unit publication (DH 2011).
Conclusions
The current escalating prevalence of childhood obesity and alarming future
projections underline the urgent need for effective solutions for this serious public
health issue.
45
1.4 Definition of obesity
Obesity is defined as the condition of excessive accumulation of fat to the extent
where it impairs health by increasing the risk of morbidity and/or mortality (Reilly
2005).
Fat accumulation occurs with positive energy balance, i.e., when energy intake
exceeds energy expenditure. This condition can result from increased energy
intake, reduced energy expenditure or a combination of the two factors. Positive
energy balance does not have to be considerable to lead to weight gain.
Accumulation of small daily positive balances causes an increase in body weight
over time.
For instance, in theory, increasing daily energy intake by 100 kcal (e.g., eating
an extra slice of bread per day) can cause an increase in body weight of
approximately 4.5 to 5 kg over a year if dietary intake and physical activity levels
remain unchanged. Therefore, prolonged small positive energy balance,
especially in combination with decreased physical activity, rapidly leads to
increased body weight, and eventually, obesity (Maffeis 2000).
Different measures for assessing obesity have been suggested. Weight,
percentage above ideal weight, body mass index (BMI), waist circumference and
body fat percentage are the most widely used adiposity indicators to date.
Among these, BMI is the most common tool, providing a reliable measure for
assessing weight status in both adults and children.
46
1.5 Measures of weight status and body composition
1.5.1 Body mass index (BMI)
In adults, BMI values between 25 and 29.99 kg/m2 indicate overweight, while
those above 30 kg/m2 signify obesity. BMI values between 30 and 34.99 kg/m2,
35 and 39.99 kg/m2 and above 40 kg/m2 are grouped as Class I, II and III
obesity, respectively. These cut-off values are lower for specific ethnicities, such
as Asians, where metabolic syndrome has been reported at a lower BMI, relative
to Caucasian populations.
1.5.2 BMI, BMI growth charts and z-scores in children
BMI provides an easy-to-measure indication of a child’s weight status, similar to
adults, and is used in clinical practice to categorise individuals as underweight,
healthy weight, overweight or obese. BMI is used in preference to weight alone,
since at any given age, it takes into account (effectively removing) variations in
weight attributable to differences in height. BMI is also a valuable tool for short-
term evaluation following childhood weight management programmes where only
small changes are likely to occur as a result of growth.
To assess BMI status when monitoring children over the long-term, it is important
to take into account their age, gender and natural growth patterns.
Consequently, BMI growth charts have been developed. The expected changes
in BMI or weight for a child according to age and gender can be predicted by
examining the respective growth charts.
47
Each country should apply BMI charts constructed using data from their own
representative paediatric population, since different populations have different
growth patterns. The most commonly used growth charts and cut-offs for the
assessment of childhood obesity include:
World Health Organisation (WHO) BMI growth charts (de Onis, Onyango et al.
2007) published in 2007. The representative sample included children from
Brazil, Ghana, India, Norway, Oman and the United States for the 0-5 year
growth charts. For the 5-19 year growth charts, data from the National Centre for
Health Statistics (USA) were used. The cut-offs used to define overweight and
obesity are the 85th and 95th centiles, respectively.
Centre for Disease Control (CDC) BMI growth charts (Kuczmarski, Ogden et al.
2002) published in 2002. The sample consisted of children participating in
national US surveys. The cut-offs used to define overweight and obesity are the
85th and 95th centiles, respectively.
International Obesity Task Force (IOTF) BMI growth charts (Cole, Bellizzi et al.
2000). These growth charts introduced international cut-offs for obesity that
facilitated cross-country comparison of obesity prevalence. The cut-offs for
overweight and obesity were devised to correspond to the adult cut-off points of
25 kg/m2 and 30 kg/m2 at 18 years.
UK BMI growth charts (Cole, Freeman et al. 1995) based on a national UK
sample. In this case, the cut-offs used to define overweight and obesity in clinical
practice are the 91st and 98th centiles, respectively. The corresponding
48
percentiles for epidemiological use are 85th and 95th to define overweight and
obesity, respectively.
1.5.3 Adjusting for changes in BMI due to natural growth over time
The natural pattern of growth for a child is to continue along the same percentile
for BMI, i.e., we would expect a child at the 50th percentile at age 7 years to
remain at this centile at 10 years of age.
Increases in BMI and weight over time represent changes that occur due to
natural growth. However, it is important to note that the magnitude of BMI and
weight changes that represent natural growth differ over time, depending on the
age, gender and weight status (percentile) of a child. Consequently, monitoring
weight status using raw BMI or weight values will not provide a true indication of
the success of a childhood weight management programme or allow meaningful
interpretation of changes between individuals and groups.
The z-score2 presents an appropriate tool to measure the long-term effects of
child weight management programmes. BMI z-score is a preferable
measurement to weight z-score, as it accounts for differences attributable to
increase in height. The z-scores effectively provide a unit to represent the
percentile on growth charts, e.g., 50th percentile equals a z-score of 0 units, 70th
percentile a z-score of 0.524 units, and 95th percentile a z-score of 1.645 units. In
the UK, the BMI z-score cut-offs are 1.33 and 2 for overweight (91st centile) and
obesity (98th centile) (Cole, Freeman et al. 1995), and values above 3.5 and 4
are classified as severe and extreme obesity, respectively (SIGN 2010). The
2A z-score (or standard deviation score) indicates the distance (measured in standard deviations)a data point is from the mean of the reference population for their age and gender.
49
corresponding figures for WHO and CDC growth charts are 1.036 for overweight
(85th centile) and 1.645 (95th centile) for obesity.
The key to understanding z-scores is based on two main principles:
1. If the BMI of a child increases at the rate expected due to growth for their
gender, age and weight status, i.e., continuing along the same percentile,
z-scores remain the same. For example, if a boy displays increased BMI
but stays at the 95th percentile at 9, 10 and 11 years of age, his BMI z-
score would be 1.7 at all time-points.
2. The z-score for a child of any given age or gender remains the same if
they are at the same percentile. For example, the BMI of a 7-year old boy
at the 98th percentile is 19.5 kg/m2 and that of a 9 year old girl at the 98th
percentile is 22.2 kg/m2. Although these two children have different BMI
values, ages and genders, their BMI z-scores are similar (i.e. 2.1).
Therefore, z-scores allow the meaningful evaluation and comparison of both
individual and groups of children of different genders and ages. The utility of z-
scores when monitoring a child participating in a weight management
programme is clearly evident when considering the example presented in Figure
18.
In this case, changes over a one-year period for an 8-year old boy participating
in a weight management programme are presented. His weight increased by 3
kg over the year, but his BMI remained constant, because his height also
increased by 6 cm. These data do not represent a true indication of changes in
his weight status or the success of the programme, since weight and BMI do not
take into account changes that occur during growth.
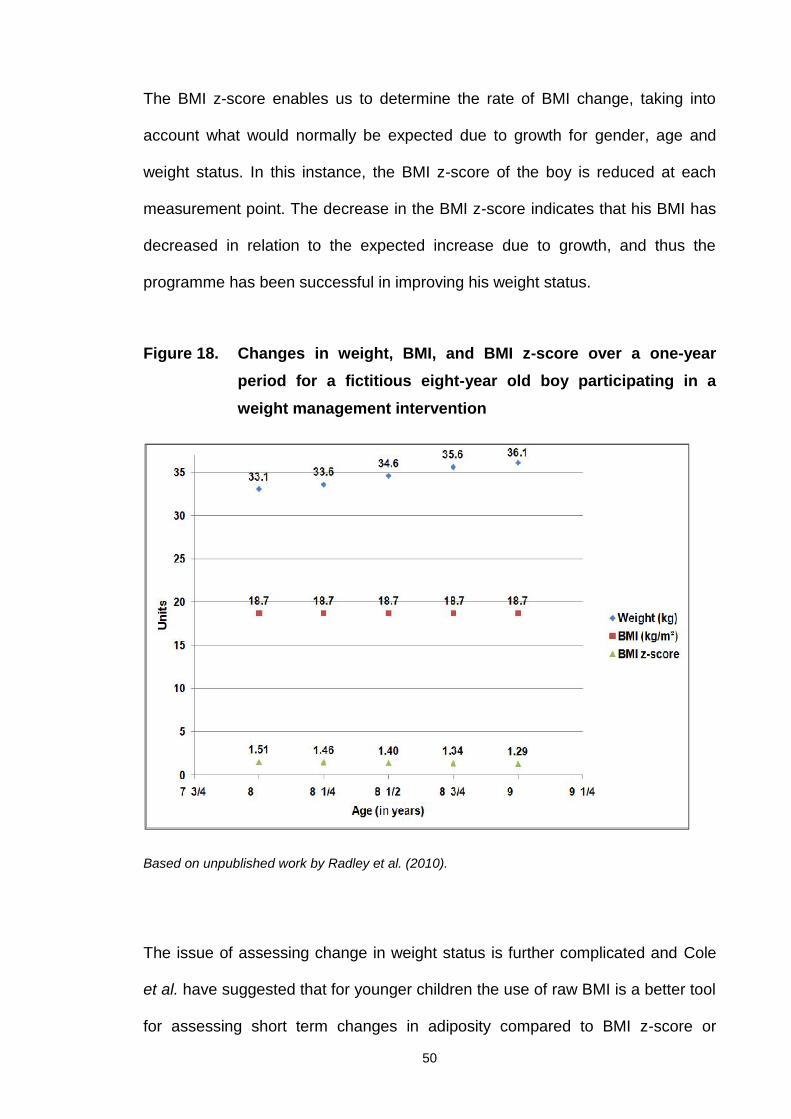
50
The BMI z-score enables us to determine the rate of BMI change, taking into
account what would normally be expected due to growth for gender, age and
weight status. In this instance, the BMI z-score of the boy is reduced at each
measurement point. The decrease in the BMI z-score indicates that his BMI has
decreased in relation to the expected increase due to growth, and thus the
programme has been successful in improving his weight status.
Figure 18. Changes in weight, BMI, and BMI z-score over a one-yearperiod for a fictitious eight-year old boy participating in aweight management intervention
Based on unpublished work by Radley et al. (2010).
The issue of assessing change in weight status is further complicated and Cole
et al. have suggested that for younger children the use of raw BMI is a better tool
for assessing short term changes in adiposity compared to BMI z-score or
51
percentage BMI. This is due to the fact that BMI units for obese children result in
larger percentage changes compared to leaner individuals and centile curves are
further apart for higher centiles due to the skewness of the BMI distribution
(Cole, Faith et al. 2005). For older children, Hunt et al. have suggested that
changes in BMI z-score may better reflect percentage fat loss compared to raw
BMI (Hunt, Ford et al. 2007). However, according to a summary of evidence for
the US Preventive Services Task Force conducted by Whitlock et al., although
BMI is recognised as a relative measure of weight rather than body fat, it
remains the recommended method to determine overweight among children and
adolescents. Despite the lack of data to determine clinically significant levels of
overweight and obesity, BMI is recommended as the best adiposity proxy
currently available for children of all ages due to the fact that it tracks reasonably
well from childhood to adolescence and from adolescence to young adulthood.
(Whitlock, Williams et al. 2005).
1.5.4 Clinical application of BMI
BMI is a useful substitute for total adiposity and an easy, rapid and cost-effective
form of measurement. Indeed, for the general population, BMI adequately
represents total body fat (Pietrobelli, Faith et al. 1998; Phan, Maresca et al.
2012). However, this index is not as sensitive for children who are overweight or
obese, and does not provide an indication of body fat distribution and abdominal
fat (Savva, Tornaritis et al. 2000; Brambilla, Bedogni et al. 2006).
Central adiposity is more strongly related to cardiovascular disease and
metabolic risk factors in children than total adiposity (Savva, Tornaritis et al.
52
2000; Janssen, Katzmarzyk et al. 2004; Rudolf, Greenwood et al. 2004;
Janssen, Katzmarzyk et al. 2005; McCarthy, Cole et al. 2006).
Moreover, over the past two decades, visceral obesity, measured using waist
circumference, among British children has increased to a greater extent
compared to BMI, suggesting that BMI measurements alone are insufficient for
assessment of obesity (McCarthy, Ellis et al. 2003; Rudolf, Greenwood et al.
2004).
1.5.5 Waist circumference and waist circumference z-score in children
Waist circumference is a cost-effective, practical and easy-to-measure indicator
of abdominal fat (Rudolf, Greenwood et al. 2004; Ness-Abramof and Apovian
2008), although its use as a practical tool for this purpose is controversial.
However, encouraging evidence associating waist circumference with several
cardiovascular disease and metabolic syndrome risk factors (Leibowitz, Moore et
al. 2009; l'Allemand-Jander 2010) has resulted in the development of waist
circumference growth charts for several populations (Schwandt, Kelishadi et al.
2008; Galcheva, Iotova et al. 2009; Poh, Jannah et al. 2011), including children
in the UK (McCarthy, Jarrett et al. 2001).
In both research and clinical practice, a combination of waist circumference and
BMI is currently considered the best method to assess children’s weight status,
as the combined measurement provides information on overall adiposity status
and indication of abdominal fat (Savva, Tornaritis et al. 2000; McCarthy, Jarrett
et al. 2001; Janssen, Katzmarzyk et al. 2004; Rudolf, Walker et al. 2007; Aeberli,
Gut-Knabenhans et al. 2012). The purpose of performing both measurements is
53
to identify children at risk due to increased adiposity and optimise assessment of
the effectiveness of obesity treatment programmes (Janssen, Katzmarzyk et al.
2005; McCarthy, Jarrett et al. 2005).
The issue of how waist circumference can be measured accurately (especially in
severely obese individuals) is under debate (Reilly, Kelly et al. 2010), and other
concerns regarding the use of appropriate cut-off points according to different
populations and ethnicities have been highlighted (SIGN 2010; Glasser, Zellner
et al. 2011). In addition, waist circumference measures subcutaneous rather than
intra-abdominal fat, raising doubts about its suitability for use in paediatric
populations (Bosy-Westphal, Booke et al. 2010). Despite these issues, waist
circumference remains a practical anthropometric measurement before and
during weight loss treatment, as it provides a proxy measure of abdominal fat
and is easily obtained (NHLBI 1998; Chiavaroli, Giannini et al. 2012).
A recent study by Ross and colleagues showed that the measurement protocol
for waist circumference does not substantially affect its association with all -
cause and cardiovascular disease mortality and diabetes (Ross, Berentzen et al.
2008). However, earlier investigations suggest that the protocol followed and its
standardisation influences research findings and affects results, particularly in
women (Mason and Katzmarzyk 2009; Mason and Katzmarzyk 2009). As long as
the protocols are carefully selected and implemented, individuals performing the
measurements are meticulously trained, and standard operating procedures are
always followed on site, it appears unreasonable to exclude a measure that can
easily and inexpensively provide supplementary information on body composition
in children.
54
For this reason, an increasing number of paediatric obesity interventions have
started to include the waist circumference measurement, (NHMRC 2003;
McCarthy 2006; Benfield, Fox et al. 2008). Another notable point is that
discrepancies in measurements in children have a relatively small impact on the
corresponding z-scores due to the inherent characteristics of waist
circumference growth charts. More precisely, higher centiles of waist
circumference growth charts are further apart, compared to lower centiles,
resulting in small differences for larger discrepancies among children with
increased waist circumference (Rudolf, Walker et al. 2007).
A study has reported that monitoring waist circumference in addition to BMI z-
score provides a useful tool for assessing children and adolescents at increased
risk for cardiovascular disease risk factors (Tybor, Lichtenstein et al. 2011).
Therefore, close adherence to a well-designed protocol and proper training
(ideally, performance of measurements by the same individual) can minimise
variability in waist circumference data, facilitating its application as an effective
measurement of obesity (Rudolf, Walker et al. 2007).
1.5.6 Other methods of measuring body composition
Skinfold thickness measurement
Skinfold thickness has been used over a long period of time for the assessment
of body composition. The advantages of the method include ease of use once
training is complete, low cost, rapidity and non-invasiveness. Moreover, skinfold
callipers are small, light and portable. The disadvantages include technical
errors, especially when different people perform the measurements, unsuitability
55
for use in very lean or obese individuals, and the fact that the method mainly
provides a measure of subcutaneous fat, leaving visceral fat out of the equation.
No scientific evidence is available supporting its validity as a predictor of body fat
in children when BMI for age is known. Use of triceps and subscapular skinfold
thickness and plotting on relevant growth charts is more often performed as a
result of clinical judgment and expert panel recommendation. However,
published evidence indicates that the use of skinfold thickness measurement is
inappropriate and does not provide any additional information, compared to BMI
percentiles, especially in overweight and obese children (Freedman, Wang et al.
2007; Mei, Grummer-Strawn et al. 2007; Semiz, Ozgoren et al. 2007).
Underwater weight measurement
Underwater weighing is based on the Archimedes principle assuming that
muscles and bones are denser, whereas fat is less dense than water and
therefore "floats" in it. The purpose is to assess body density and subsequently
derive body composition using specific equations. The subject needs to be fully
covered by water for the test to be performed. The volume of water displaced,
combined with the weight of the subject, is used to derive values for fat and fat-
free mass. Due to its accuracy at the time of conception, this technique was
considered the "gold standard" for body composition assessment, even though it
is only based on the two-component model. Recent advances in technology
have allowed the development of more sophisticated methods. Some significant
disadvantages of the procedure include the requirement for special equipment
that takes up considerable space, its long duration, dependence on cooperation
56
from understudy subjects and experience of the person delivering the test (Ellis
2000).
Air displacement plethysmography (Bod Pod)
Air displacement utilises the same principles as underwater weighing, but uses
air instead of water. This is an advancement on the previous method, and body
density is defined and used to calculate body composition. The procedure is
better tolerated by subjects, less invasive, quicker and easier to implement, and
applicable to a variety of subjects, including obese children, but still requires
expensive, bulky equipment (Lee and Gallagher 2008).
Dilution techniques
According to this method, body weight is divided into fat-free and fat mass, and
changes in total body water affect body composition. The method assumes that
fat-free mass in healthy individuals is 73% water. Therefore, using a tracer dose
of labeled water (tritium, deuterium, or oxygen-18) and collecting body fluid
samples (blood, urine or saliva), the excretion rate of the tracers/isotopes after
equilibration time can be employed to estimate body composition. As the more
hydrated compartment, fat-free mass is initially estimated, and fat mass
subsequently derived by subtracting fat-free mass from total body weight (Ellis
2000; Lee and Gallagher 2008).
57
Bioelectrical impedance analysis (BIA)
Bioelectrical impedance is used to estimate body composition based on the two-
component model. The method involves measurement of body's impedance after
transmitting a low voltage electric current. The underlying principle is that the
body's two components manifest different impedance to current, i.e., fat-free
mass has more water and is therefore a better conductor of electricity, whereas
fat mass is less hydrated and a poorer conductor of electricity, with the basic
assumption that 73% of body's fat-free mass comprises water. The main
advantages of the method are that the equipment is portable, simply and rapidly
performed, and requires minimal training, along with being relatively low-cost and
safe for most individuals. The major disadvantage is that successful
implementation of the method depends on individual compliance with specific
guidelines that need to be followed prior to measurement (no food and fluid
consumption hours before measurement, and no caffeine, alcohol intake and
exercise 8-12 hours before measurement) and may be affected by diseases or
other factors that influence body hydration (Lee and Gallagher 2008). Over the
years, a number of studies have confirmed that when using the appropriate
equations, BIA provides an effective means to assess body composition in
overweight and obese children (Hosking, Metcalf et al. 2006; Wright, Sherriff et
al. 2008; Haroun, Taylor et al. 2010).
Dual-energy X-Ray absorptiometry (DEXA)
DEXA assumes the body has three components: fat mass, bone-free fat mass
and bone minerals. The method uses low radiation (1-10% of a chest X-ray) to
58
estimate these three components for the whole body or partially for specific
regions, and is the gold standard for assessing bone density. Additionally, DEXA
is widely used for body composition assessment. The method has better
accuracy than the two-component model methods (underwater weighing, Bod
Pod, BIA) and good reproducibility, and can be used on a variety of subjects with
exposure to only a very small amount of radiation. However, limitations include
the requirement for large and expensive equipment and fact that the subject
needs to stand still during the procedure (Lee and Gallagher 2008).
Other methods for body composition assessment
Other less frequently used procedures for body composition assessment include
total body potassium method, neutron activation analysis, magnetic resonance
imaging and computed tomography, applied occasionally in specialty centres
mainly for research purposes (Ellis 2000).
Conclusions
The above sections provide a summary of the different methods employed for
measuring body composition in children. Thus, in general, obesity in children is
assessed using a variety of methods ranging from simple and inexpensive
measurements applicable in community settings, such as BMI and waist
circumference, to more sophisticated procedures, including DEXA, air
displacement plethysmography, BIA and dilution techniques.
59
1.6 Causes of childhood obesity
The 2007 Foresight report on obesity by the Government Office for Science
provides a comprehensive summary on the causes of obesity (Finegood, Merth
et al. 2010).
The report suggests that obesity simply results from energy intake exceeding
energy expenditure over a sustained period of time. However, this energy
imbalance does not have a simple explanation, since there are many
complexities in the ways people acquire and use energy. For the general
population, the report argues “…it is now generally accepted by health and other
professionals that the current prevalence of obesity in the UK population is
primarily caused by people’s latent biological susceptibility interacting with a
changing environment that includes more sedentary lifestyles and increased
dietary abundance.” In theory, obesity results from an imbalance between energy
intake and energy expenditure. However, the exact mechanisms underlying this
process remain unknown. In fact, obesity reflects complex interactions between
genetic, metabolic, cultural, socioeconomic and behavioural factors. The
environment contributes significantly to these interactions and seriously affects
eating and activity habits, owing to the ready availability of abundant food with
low nutritional value, discouragement of physical activity and encouragement of
sedentary activities, such as watching television or playing on computer games.
Additionally, economic and cultural factors, perinatal development and practices
are important contributors to the obesity epidemic (summarised in Table 1).
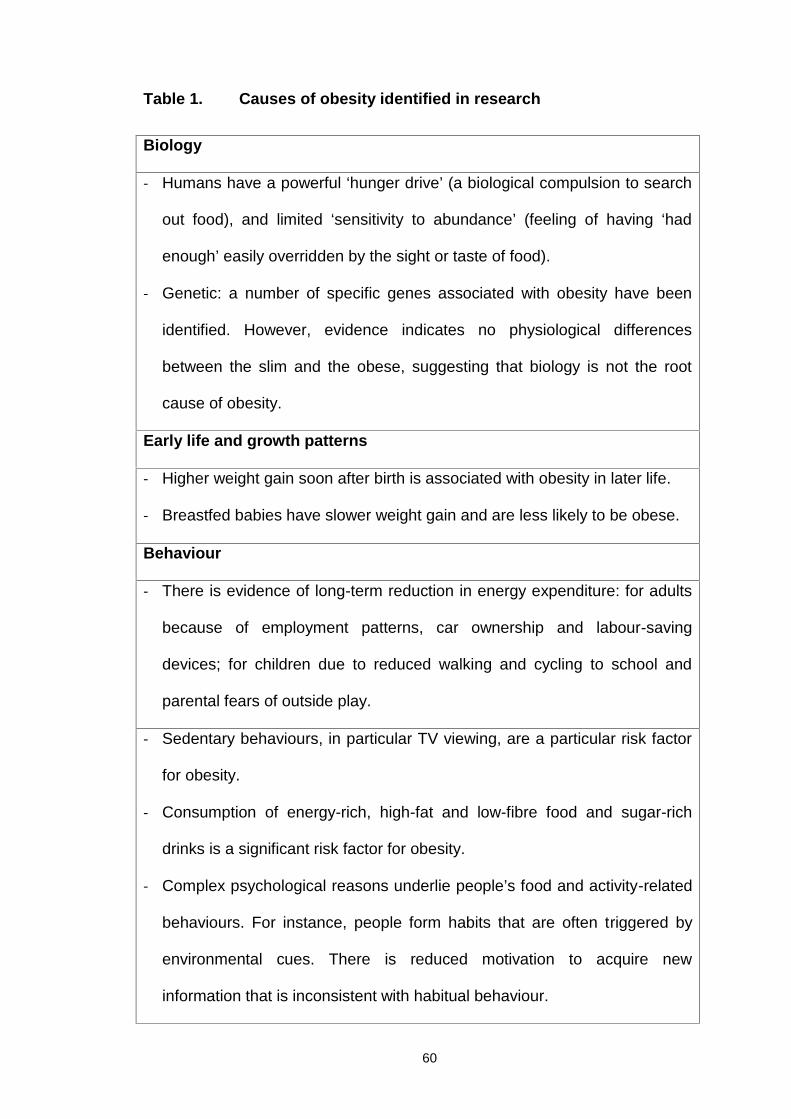
60
Table 1. Causes of obesity identified in research
Biology
- Humans have a powerful ‘hunger drive’ (a biological compulsion to search
out food), and limited ‘sensitivity to abundance’ (feeling of having ‘had
enough’ easily overridden by the sight or taste of food).
- Genetic: a number of specific genes associated with obesity have been
identified. However, evidence indicates no physiological differences
between the slim and the obese, suggesting that biology is not the root
cause of obesity.
Early life and growth patterns
- Higher weight gain soon after birth is associated with obesity in later life.
- Breastfed babies have slower weight gain and are less likely to be obese.
Behaviour
- There is evidence of long-term reduction in energy expenditure: for adults
because of employment patterns, car ownership and labour-saving
devices; for children due to reduced walking and cycling to school and
parental fears of outside play.
- Sedentary behaviours, in particular TV viewing, are a particular risk factor
for obesity.
- Consumption of energy-rich, high-fat and low-fibre food and sugar-rich
drinks is a significant risk factor for obesity.
- Complex psychological reasons underlie people’s food and activity-related
behaviours. For instance, people form habits that are often triggered by
environmental cues. There is reduced motivation to acquire new
information that is inconsistent with habitual behaviour.
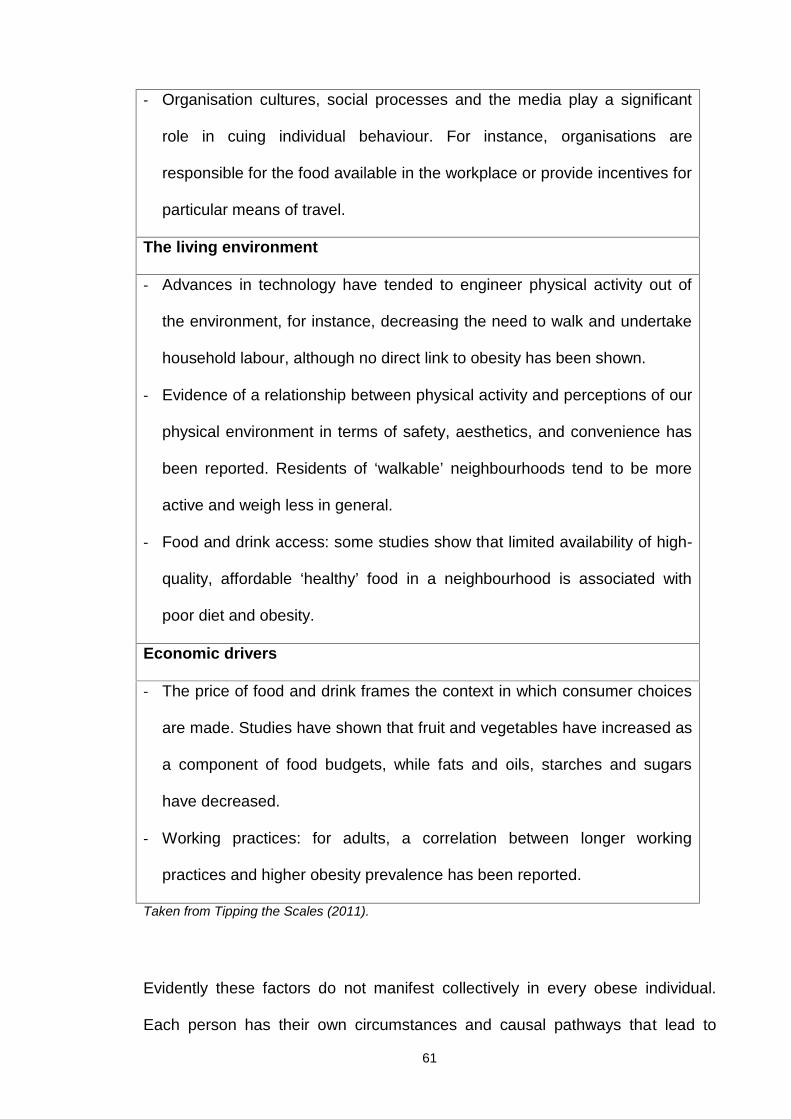
61
- Organisation cultures, social processes and the media play a significant
role in cuing individual behaviour. For instance, organisations are
responsible for the food available in the workplace or provide incentives for
particular means of travel.
The living environment
- Advances in technology have tended to engineer physical activity out of
the environment, for instance, decreasing the need to walk and undertake
household labour, although no direct link to obesity has been shown.
- Evidence of a relationship between physical activity and perceptions of our
physical environment in terms of safety, aesthetics, and convenience has
been reported. Residents of ‘walkable’ neighbourhoods tend to be more
active and weigh less in general.
- Food and drink access: some studies show that limited availability of high-
quality, affordable ‘healthy’ food in a neighbourhood is associated with
poor diet and obesity.
Economic drivers
- The price of food and drink frames the context in which consumer choices
are made. Studies have shown that fruit and vegetables have increased as
a component of food budgets, while fats and oils, starches and sugars
have decreased.
- Working practices: for adults, a correlation between longer working
practices and higher obesity prevalence has been reported.
Taken from Tipping the Scales (2011).
Evidently these factors do not manifest collectively in every obese individual.
Each person has their own circumstances and causal pathways that lead to
62
increased body weight. Identification of the specific factors for individuals is the
job of researchers and health professionals, as the only way to effectively
combat the condition is to specify the underlying causes, which often constitute
the starting point that can lead to a feasible solution. However, given the
complexity of the factors involved and their interrelationships, the puzzle of
obesity aetiology is often difficult to assemble for each individual, and even when
deciphered successfully, the route leading to its solution can prove highly
challenging.
1.6.1 Genetic factors
In 1994, identification of the obese gene (ob gene) and its protein product, leptin,
resulted in the early hypothesis that defects in this gene are responsible for the
obesity epidemic (Zhang, Proenca et al. 1994). Leptin is a hormone produced
mainly by adipose tissue that acts in the brain by suppressing appetite, and
consequently, food intake. However, leptin deficiency is a relatively rare
condition, with very few reported cases (Bell-Anderson and Bryson 2004).
Since 1994, several obesity-related genes have been identified. In general, the
condition seems to be polygenic, i.e., several genes act synergistically to
increase the risk for obesity (Speiser, Rudolf et al. 2005; Wardle 2005), and only
in exceptional cases, body weight is the result of a defect in a single gene
(monogenic obesity). According to the most recent human obesity gene map,
460 genes, markers and chromosomal regions are associated with human
obesity, supporting the multifactorial nature of the condition (Perusse, Rankinen
et al. 2005). Additionally, recent studies have shown that that apart from effects
63
on weight regulation and energy balance, genes indirectly influence the weight
status by manipulating behaviour and leading to dietary or activity habits that
promote weight gain, and ultimately, obesity (Wardle 2005).
Thus, genetics certainly plays a role, but this factor alone is unlikely to explain
the current epidemic. A genetic predisposition to increased adiposity is relevant,
but does not necessarily mean that the individual is destined to become or
remain obese. This is particularly true for children, where weight management
programmes are very important, as these can effectively help in the maintenance
of healthy weight, regardless of their genetic background.
1.6.2 Diet and physical activity
Broadly speaking, the main environmental factors associated with obesity are
diet and physical activity. These two elements represent the two sides of the
energy balance equation, i.e., energy intake (diet) and energy expenditure
(physical activity).
Diet
Diet becomes a factor in the equation of childhood obesity well before the child is
even born. There is growing evidence that eating habits in pregnancy, in utero
exposure to flavours, maternal weight before conception, weight gain during
pregnancy and other factors, e.g., gestational diabetes, breastfeeding practices
and introduction of solid foods, constitute important parameters affecting the risk
of an individual becoming overweight or obese in childhood (Robinson and
64
Godfrey 2008; Kim, England et al. 2011; Martinez, Cordero et al. 2012; Oddy
2012; Spencer 2012; Trout and Wetzel-Effinger 2012).
During growth, the dietary factors resulting in childhood obesity relate to food
quantity and quality. In particular, the shift towards large-portion high-calorie
foods and drinks, which are abundantly available, encourages the consumption
of energy-dense diets (Powell and Nguyen 2012). Furthermore, children have
more unstructured eating patterns in the current times, due to increased home
snacking and access to more money than in the past. Τhe increased
consumption of fast food, ready meals and the availability and/or price of healthy
foods in supermarkets are believed to have a significant contribution to the high
prevalence rates of childhood obesity (Wang, Ludwig et al. 2009; Lamichhane,
Puett et al. 2012). Sugar-sweetened beverages and fruit juice are also a
contributory factor to the increase in calorie intake, and hence increased weight,
leading to suggestions for their replacement with water and whole fruits (de
Ruyter, Olthof et al. 2012; Powell and Nguyen 2012; Wilson 2012).
On the other hand, measuring dietary intake in children is inherently complicated
and the real overall picture of diet in children remains unknown (Lambert,
Agostoni et al. 2004). Even with the numerous technological advances, there is
no consensus on the best methodology that facilitates accurate reporting of
children's eating habits. Diet records, 24-hour recalls, and food frequency
questionnaires have specific advantages and disadvantages. Therefore, it is up
to the individual researchers to decide which technique is best suited for their
study population. However, the differential use of tools across studies makes it
difficult to compare results, and consequently, draw conclusions on the real
scenario. In fact, it is practically impossible to measure children's dietary intake
65
under real-life conditions with no errors, especially in obese populations that are
more prone to misreporting (Collins, Watson et al. 2010).
It is well established that measurement of dietary intake in children has serious
misreporting implications. Under the age of 12, parents are the main source of
information on children’s eating habits. However, employment and everyday
commitments often reduce parental control of food intake in children and
undermine the accuracy of their reports. Furthermore, as children grow older,
dietary intake remains unsupervised in many cases owing to increasing
purchasing power and out-of-house food consumption, and is consequently
unreported by parents (Livingstone, Robson et al. 2004; Collins, Watson et al.
2010). This, in turn, reduces the accuracy of dietary assessment in children,
leading to significant misreporting of dietary intake. The situation becomes more
complicated for obese children, as this group is characterised by higher rates of
underreporting (Bandini, Schoeller et al. 1990; Fisher, Johnson et al. 2000;
Lambert, Agostoni et al. 2004).
However most available evidence suggests that the energy and/or macronutrient
composition of children's diet does not play an important role, as different
combinations of macronutrient breakdown do not appear to have an effect on
weight status (Rodriguez and Moreno 2006; Collins, Watson et al. 2010;
Agostoni, Braegger et al. 2011; Elliott, Truby et al. 2011). Some studies have
indicated benefits of macronutrient manipulation in obese children with metabolic
syndrome, mostly as a result of reduction in total and saturated fat, free fructose
and increase in antioxidants (Zimmermann and Aeberli 2008; Aeberli, Spinas et
al. 2009).
66
The prevailing lack of association between diet and weight status may be
masked by the known problem of increased underreporting among overweight
and obese children, compared to their healthy weight counterparts, combined
with the inherent issues in measuring dietary intake. However, despite these
limitations, specific characteristics in children's diet appear to correlate with
healthier weight status. For instance, increased intake of dietary fibre and slow-
release carbohydrates and reduction in simple sugars, as well as structured
eating patterns, age-appropriate portion sizes, regular family meals and limitation
of fast food and frequent snacking may enable the maintenance of healthy
weight in paediatric populations (Agostoni, Braegger et al. 2011).
Dietary assessment tools
Dietary assessment tools can be qualitative or quantitative and prospective or
retrospective. The most commonly used tools for dietary assessment at present
are 24-hour recalls (retrospective quantitative), food diaries (prospective
quantitative) and food frequency questionnaires (retrospective qualitative), as
summarised below.
Twenty-four hour recall
Twenty-four hour recalls are retrospective tools for assessing dietary intake. This
method requires a trained interviewer to obtain information about all the foods
and drinks consumed by the subject during the previous day. Multiple recalls (3
or 4 days, including weekdays and weekends) are considered good tools for the
67
assessment of habitual dietary intake (Holmes, Dick et al. 2008). Single recalls
are used in epidemiological studies with large samples, but are insufficient to
assess individual dietary intake. Repeated dietary recalls provide detailed,
qualitative information about the foods consumed, and since they are
retrospective and relatively rapid, the method does not alter eating habits or
require literacy from the subject. However recalls have certain disadvantages, as
they rely on the subject's memory, portion estimation is not as precise as in
weighed records, and the interviewers need to be sufficiently trained to ask all
the necessary questions in a neutral way without directing the subject towards
specific answers (Trabulsi and Schoeller 2001). It is suggested that the cognitive
level in children does not allow them to effectively recall all the foods consumed
on the previous day, especially before 8 years of age (Baranowski and Domel
1994; Livingstone, Robson et al. 2003). However, a recent review of the
literature found that for children aged 4-11 years, 24-hour multiple pass recalls
conducted over at least a 3-day period (including weekdays and weekends)
using parents as proxy reporters of children's intake were the most accurate in
estimating total energy intake in children (Burrows, Martin et al. 2010).
Food diaries
Food diaries are prospective quantitative tools used to assess individual habitual
dietary intake. The individual is required to record all food and drink at the time of
consumption. These diaries have been traditionally used in the United Kingdom
for the assessment of dietary intakes in national surveys (e.g., National Diet and
Nutrition survey) (Gibson 2010). Food diaries can be weighed or based on
household measures (estimated) and last from a few days to a full week or more.
68
The 7-day weighed food diary was considered the gold standard method of
dietary assessment until the doubly labelled method in 1990 revealed the
problem of underreporting (Livingstone, Prentice et al. 1990; Schoeller 2002).
Food diaries are beneficial in that they do not rely on memory, provide better
measures of portions than recalls and record foods and drinks in considerable
detail, allowing better estimates of energy and other nutrients. However, food
records are time-consuming and subject to reporting bias, as individuals may
alter their habits to complete the diary more easily or to generate more desirable
results, particularly overweight or obese people. Moreover, this method requires
literacy, motivation and compliance (Trabulsi and Schoeller 2001). Food diaries
are still considered a good estimate of children's diet when completed by both
the parents and children, depending on age (O'Connor, Ball et al. 2001; Burrows,
Martin et al. 2010).
Food frequency questionnaires
Food frequency questionnaires are qualitative or semi-quantitative retrospective
tools used for assessing food patterns. These surveys report the frequency of
consumption of foods from a list over specific time-periods, both of which vary
considerably. The method is quick and easy to complete, highlights infrequently
consumed foods, and can target specific foods to provide information on
micronutrient intake. Questionnaires are often used to investigate relationships
between diet and disease, for e.g., extensive use has been recorded in the EPIC
(European Prospective Investigation into Cancer and Nutrition) study (Ocke,
Larranaga et al. 2009). Their use is more related to groups than individuals, as
they allow response ranking but do not provide exact quantities of foods or
69
nutrients (Andersen, Tomten et al. 2003). Moreover, this method relies on
memory and retrospective portion estimation, grouping of foods can be
problematic when analysing data, consumption of composite foods can affect the
responses in some cases, and since the questions are closed and the list is
limited, individuals may not be able to correctly translate their actual intake under
the questionnaire's structure (Trabulsi and Schoeller 2001). In children, food
frequency questionnaires have been successfully applied to estimate diet quality
(Huybrechts, Vereecken et al. 2010), but not habitual intake (Burrows, Martin et
al. 2010; Kobayashi, Kamimura et al. 2011).
Physical activity and sedentary behaviours
Apart from its contribution to energy balance for the maintenance of healthy
weight, physical activity in youth is essential for overall health and wellbeing, and
has a considerable impact on physical, social and emotional development.
Recent observations suggest that decreased physical activity levels in children
substantially exceed the potential decrease in dietary energy intake. Therefore, a
major cause of the observed childhood obesity epidemic may be physical
inactivity, rather than increased energy intake (Livingstone and Robson 2000;
Molnar, Torok et al. 2000; Sallis and Glanz 2006). This theory is reinforced by
the proportion of children failing to achieve the recommended physical activity
(60 minutes of moderate to vigorous activity per day) (NICE 2009).
As with diet, reduced physical activity in children starts early. Available evidence
indicates that toddlers are significantly less active than those a few generations
ago. This finding justifies the increased prevalence of overweight and obesity in
70
preschoolers, which provides the basis for subsequent obesity maintenance or
deterioration (Reilly 2008; Cox, Skouteris et al. 2012). Obesity established at
such a young age persists easily as the child grows, leading to childhood,
adolescent and adult obesity, along with all the potential co-morbidities.
Moreover, growing children tend to maintain their eating and activity habits, and
therefore, if reduced physical activity is present in the preschool period, the odds
are that physical activity will become even more limited with age (Janz, Kwon et
al. 2009). Indeed, research on the UK population has shown a continuous
reduction in the physical activity of growing children to alarmingly low levels,
particularly in adolescent girls (HSE 2008; NOO 2010).
Several, and in some cases, interrelated underlying factors contribute to low
physical activity levels. For instance, increased time spent in sedentary activities
(television viewing and computer use), automation (e.g., elevators, cars) and
parental child safety and accessibility concerns are likely to have contributed to
decreased physical activities among children over the years. In addition, given
the overall low levels of physical activity, peer pressure to be active is particularly
low, compared to playing video games or watching television (NICE 2009).
Additionally, apart from the direct effect of physical activity on energy
expenditure, children who exercise regularly tend to have better and more
structured eating habits (Nelson, Stovitz et al. 2011), further supporting the link
between low physical activity levels and childhood obesity (Sallis and Glanz
2006; Cox, Skouteris et al. 2012; De Craemer, De Decker et al. 2012). In
practice, if a child stays at home for many hours sitting, studying, watching
television or playing on the computer, opportunities to reach for food are
inevitably increased. Boredom is often a trigger for increasing snacking on
unhealthy foods, which links to comfort eating and all the associated implications
71
on body weight and psychology. Physical activity helps the child to maintain
insulin and glucose levels, thereby eliminating food cravings and allowing better
control of glucose levels throughout the day (Tompkins, Moran et al. 2011).
Psychology is another area suggested to affect physical activity levels in youth
(NICE 2009). Children with increased body weight often have low self-esteem,
which discourages play with their healthy weight counterparts. Their perception
of physical appearance and athletic competence can lead to abstinence from
activities owing to fear of being bullied (Mitchell, Moore et al. 2012). Thus, these
factors often prevent children from participating in free-living physical activities
(Guinhouya 2012). Moreover, the increase in built-up environments has severely
reduced opportunities for children to be physically active, compared to the past,
including minimisation of basic activities, such as walking, taking the stairs,
cycling or playing in the neighbourhood (Saelens, Sallis et al. 2003; Frank and
Kavage 2009). These factors collectively create a vicious cycle that feeds low
physical activity and fitness levels in youth and increases the rates of total and
abdominal obesity (Ortega, Ruiz et al. 2010).
However, scientific evidence validating a decreasing trend in physical activity
levels among children remains controversial. This is mainly attributed to the
different methodologies used, such as self-reports and questionnaires versus
accelerometry. Indeed, several studies have implemented different methods to
assess physical activity levels, which, by design, require considerable input and
cooperation from parents, and after a certain age, the child involved.
Accelerometry is currently considered the most accurate and objective method to
measure physical activity, but is relatively expensive (although the prices have
decreased over the last few years). Moreover, interpretation of accelerometry
72
results can prove challenging and the method relies on full compliance of the
participants with wearing the device at all times and places, which can prove
difficult for children (NICE 2009; Ekelund, Tomkinson et al. 2011).
On the other hand, questionnaires and recalls have more limitations, as they rely
on self-reporting and categorised sports, thus failing to capture daily or common
unstructured activities. These methods rely on memory, which can be a serious
burden, owing to inaccurate event recall and time estimates (Ekelund,
Tomkinson et al. 2011). Additionally, the historical focus on moderate to vigorous
physical activity has drawn attention to specific types of activities, leaving out of
the equation important features of lifestyle activities in everyday life that may
contribute importantly to weight status in children, such as light activities that can
be performed more easily and are more sustainable than higher-level activities
(Belanger, Gray-Donald et al. 2009; Marshall 2009).
Sedentary activities comprise the other part of the energy expenditure equation
that contributes to the onset and maintenance of childhood obesity. The majority
of studies refer to sedentary activity in terms of the time spent in front of the
television, but other activities, such as studying, computers and video games,
additionally take considerable time in the daily routines of children and should
not be neglected. Television viewing and computer usage have been reported as
factors that contribute to obesity in youth, both directly by promoting sedentary
behaviour and indirectly by encouraging the consumption of large-portion, high-
energy foods (Goran and Treuth 2001; Matheson, Killen et al. 2004; Buijzen,
Schuurman et al. 2008; Pearson and Biddle 2011).
An additional indirect effect of television on energy balance is the impact of food
advertisements on children’s nutritional intake, as the multicolour alternation of
73
images promoting certain products, combined with the use of specific role
models popular among the audience, make the products highly desirable (Guran
and Bereket 2011). Parents often decide to give in to their children's demands for
such products for various reasons, including lack of knowledge, pressure of peer
consumption, or potential guilt for the limited time spent with their children as a
result of work and other commitments.
The amount of food consumed has also been shown to increase after exposure
to food-related advertisements (Halford, Boyland et al. 2008), and a considerable
proportion of the daily energy intake in children occurs during screen time
(Matheson, Killen et al. 2004). Indeed, 90% of the food advertisements relate to
foods that are high in fat, sugar or salt (Guran and Bereket 2011). This
observation, coupled with the finding that children are exposed to an estimated
10,000 advertisements per year (among which around 95% promote “junk food”),
provides further support of links between television viewing and the escalating
prevalence of childhood obesity (Schwartz and Puhl 2003; Guran and Bereket
2011).
Television viewing, computer usage and video games take up time that may be
otherwise engaged in sports, active play or other more physical pursuits
(Lambiase 2009). Television viewing has additionally been associated with
reduced resting metabolic rate (Klesges, Shelton et al. 1993).However, these
findings have not been confirmed by more recent studies (Cooper, Klesges et al.
2006; Jackson, Djafarian et al. 2009).
As both diet and physical activity are difficult to assess accurately, their precise
roles in the aetiology of childhood obesity remain unknown. Indications of poorer
diet quality and reduction in total energy expenditure provide a plausible
74
explanation for the childhood obesity epidemic, although the underlying
mechanisms are complex and multi-factorial.
1.6.3 Other suggested factors
Apart from the obvious contributions of diet and physical activity on weight status
in children, additional risk factors associated with obesity in children are specified
below.
Perinatal nutrition
Nutrition during pregnancy, in utero nutrition and early infant feeding practices
contribute to the nutrition programming of obesity. There is growing evidence
that perinatal nutrition is a serious risk factor for the development of childhood
obesity. Interventions are therefore needed to target maternal obesity and the
early years (Plagemann 2006; Das 2008).
Adiposity rebound
Adiposity rebound is the period around 6 years of age when BMI begins to
increase after reaching its lowest point. Early adiposity rebound has been linked
with greater risk for development of obesity in adolescence and early adulthood.
Addressing obesity in the early years, before the adiposity rebound, may be an
effective strategy for preventing later obesity (Williams and Goulding 2009;
Campbell, Williams et al. 2011; Boonpleng, Park et al. 2012).
75
Socioeconomic circumstances (SEC)
The patterns of socioeconomic distribution of obesity mainly depend on the
social structure and developmental status of the country. In developed countries,
children from low socioeconomic circumstance (SEC) families are more prone to
obesity, while childhood obesity is less common in families of higher SEC where
parents are better educated and aware of the negative health and psychosocial
consequences of excessive body weight for their children. In the Health Survey
for England (2008) children from lower-income households were more likely to
be obese. Twenty percent of boys in the lowest income quintile were obese,
compared to 12% of boys in the highest income quintile (HSE 2008).
In contrast, in countries undergoing nutrition transition where under nutrition is
traditionally the major cause of morbidity and mortality, the opposite trend is
observed, as obesity and westernised lifestyles constitute symbols of wealth and
well-being and their negative health effects are not generally known or given
much consideration (Popkin and Gordon-Larsen 2004).
Ethnicity
Similar to adults, obesity in childhood differs among ethnic groups. According to
the most recent NCMP results (2010/2011), certain ethnicities are clearly
associated with higher obesity rates (Figures 19 and 20). More precisely, black,
Asian and mixed race children had higher levels of obesity, while the lowest
prevalence was observed among white children and Indian girls (DH 2011). The
reasons behind these discrepancies may be attributable to parental obesity
status, i.e., if parents are overweight or obese, the chance of children in the
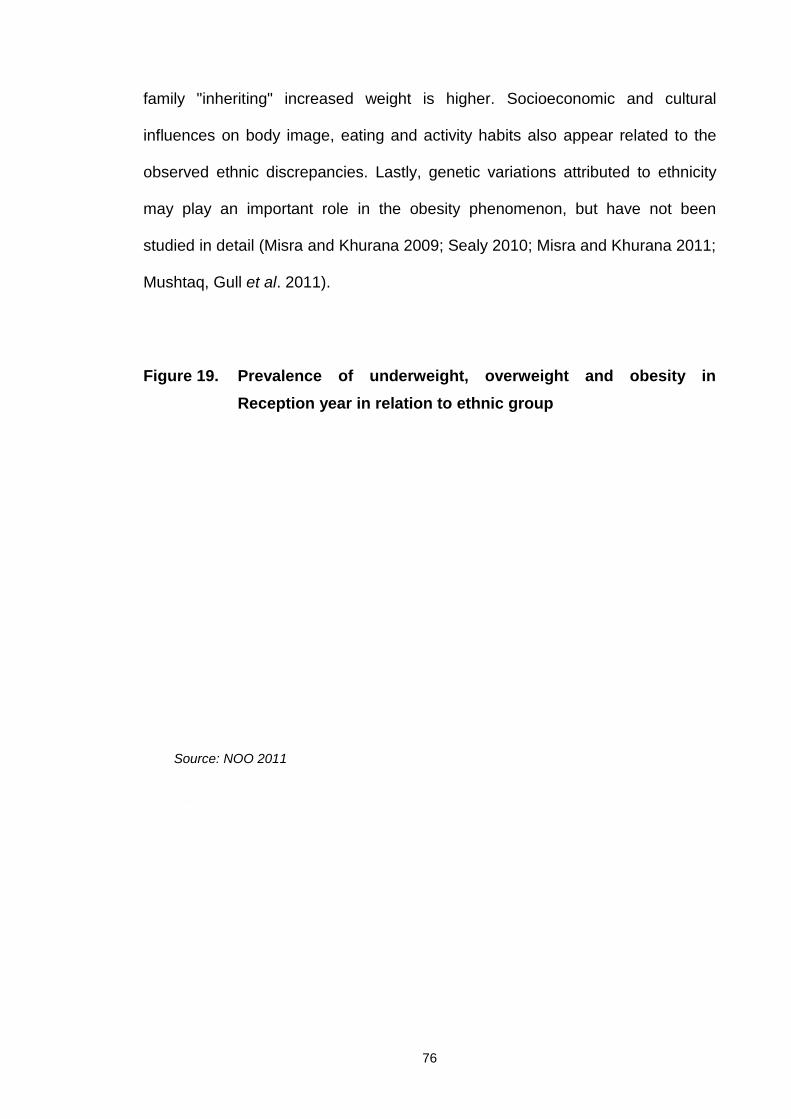
76
family "inheriting" increased weight is higher. Socioeconomic and cultural
influences on body image, eating and activity habits also appear related to the
observed ethnic discrepancies. Lastly, genetic variations attributed to ethnicity
may play an important role in the obesity phenomenon, but have not been
studied in detail (Misra and Khurana 2009; Sealy 2010; Misra and Khurana 2011;
Mushtaq, Gull et al. 2011).
Figure 19. Prevalence of underweight, overweight and obesity inReception year in relation to ethnic group
Source: NOO 2011
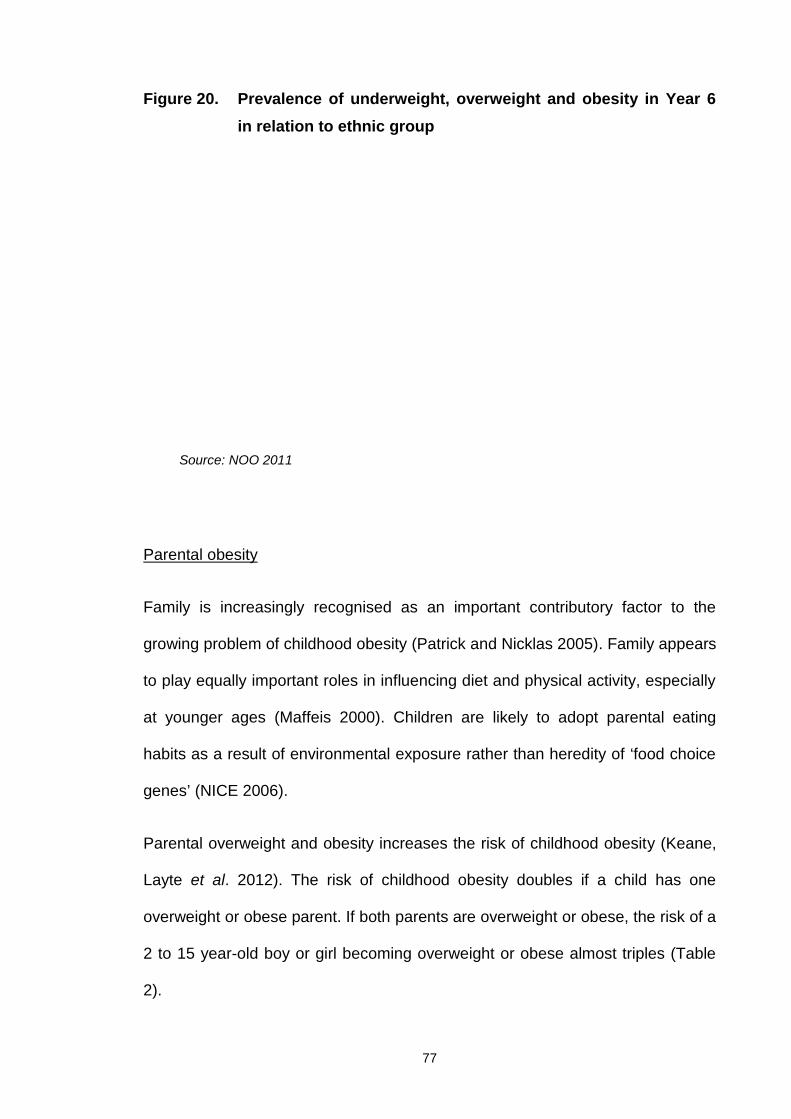
77
Figure 20. Prevalence of underweight, overweight and obesity in Year 6in relation to ethnic group
Parental obesity
Family is increasingly recognised as an important contributory factor to the
growing problem of childhood obesity (Patrick and Nicklas 2005). Family appears
to play equally important roles in influencing diet and physical activity, especially
at younger ages (Maffeis 2000). Children are likely to adopt parental eating
habits as a result of environmental exposure rather than heredity of ‘food choice
genes’ (NICE 2006).
Parental overweight and obesity increases the risk of childhood obesity (Keane,
Layte et al. 2012). The risk of childhood obesity doubles if a child has one
overweight or obese parent. If both parents are overweight or obese, the risk of a
2 to 15 year-old boy or girl becoming overweight or obese almost triples (Table
2).
Source: NOO 2011
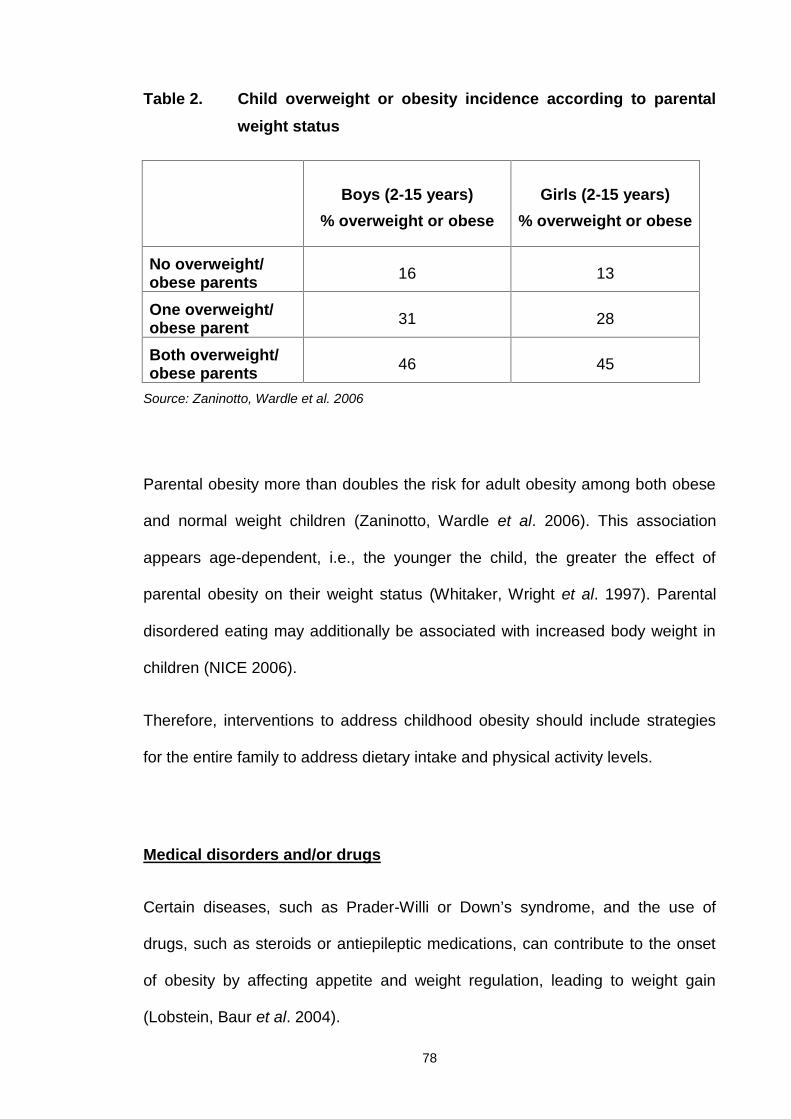
78
Table 2. Child overweight or obesity incidence according to parentalweight status
Boys (2-15 years)% overweight or obese
Girls (2-15 years)% overweight or obese
No overweight/obese parents 16 13
One overweight/obese parent 31 28
Both overweight/obese parents 46 45
Source: Zaninotto, Wardle et al. 2006
Parental obesity more than doubles the risk for adult obesity among both obese
and normal weight children (Zaninotto, Wardle et al. 2006). This association
appears age-dependent, i.e., the younger the child, the greater the effect of
parental obesity on their weight status (Whitaker, Wright et al. 1997). Parental
disordered eating may additionally be associated with increased body weight in
children (NICE 2006).
Therefore, interventions to address childhood obesity should include strategies
for the entire family to address dietary intake and physical activity levels.
Medical disorders and/or drugs
Certain diseases, such as Prader-Willi or Down’s syndrome, and the use of
drugs, such as steroids or antiepileptic medications, can contribute to the onset
of obesity by affecting appetite and weight regulation, leading to weight gain
(Lobstein, Baur et al. 2004).
79
Conclusions
All the evidence presented in this section indicates that the causes of childhood
obesity are multifactorial and complex. Knowledge of the exact mechanisms
leading to increased body weight in the young is essential to facilitate the design
of effective solutions for this serious public health issue.
1.7 Consequences of childhood obesity
Childhood obesity is a global public health epidemic with many serious
consequences both in childhood and adulthood. Indeed, its short and long-term
effects on physical and psychological health, including a potential decrease in life
expectancy, have made prevention and treatment of childhood obesity a national
and international priority (NICE 2006; Barlow 2007; SIGN 2010).
1.7.1 Short-term consequences
The short-term (within childhood) effects of increased body weight on children’s
health include respiratory and orthopaedic problems as well as
gastroenterological, endocrine and cardiovascular complications (Figure21).
Furthermore, obesity in children is often associated with a number of
cardiovascular disease (CVD) risk factors, such as sub-clinical dyslipidaemia,
insulin resistance, high blood pressure and low fitness levels (Batch and Baur
2005).
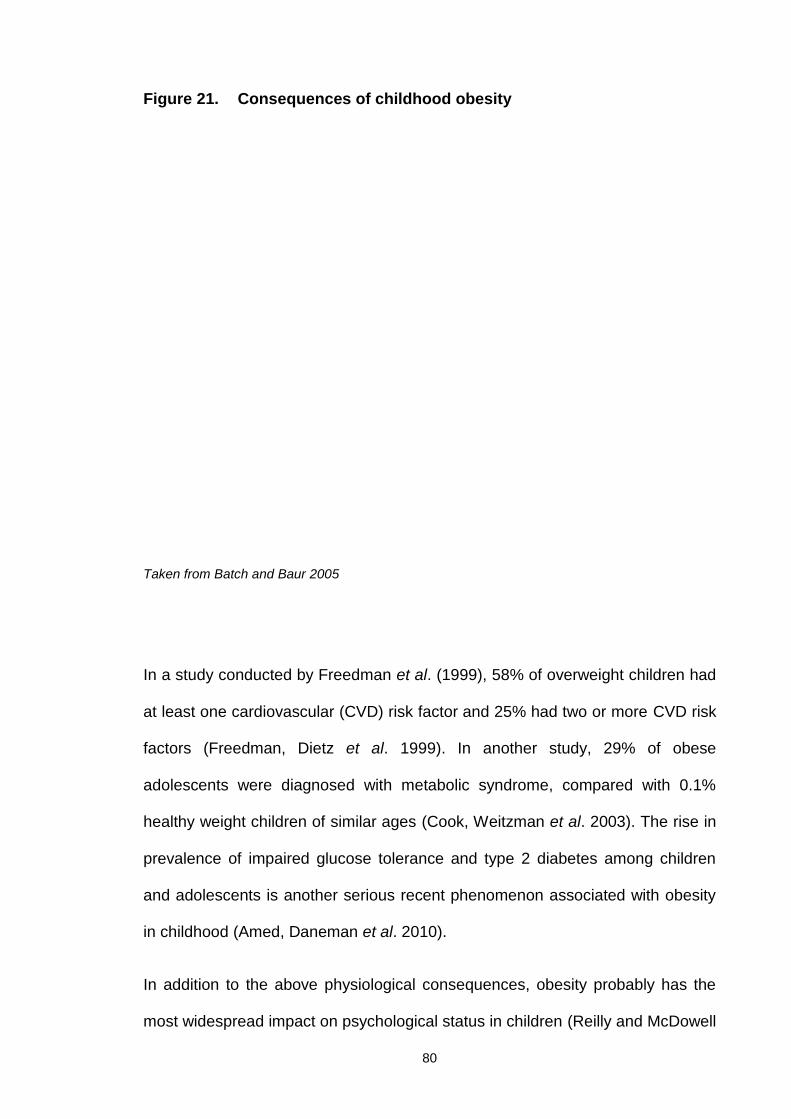
80
Figure 21. Consequences of childhood obesity
Taken from Batch and Baur 2005
In a study conducted by Freedman et al. (1999), 58% of overweight children had
at least one cardiovascular (CVD) risk factor and 25% had two or more CVD risk
factors (Freedman, Dietz et al. 1999). In another study, 29% of obese
adolescents were diagnosed with metabolic syndrome, compared with 0.1%
healthy weight children of similar ages (Cook, Weitzman et al. 2003). The rise in
prevalence of impaired glucose tolerance and type 2 diabetes among children
and adolescents is another serious recent phenomenon associated with obesity
in childhood (Amed, Daneman et al. 2010).
In addition to the above physiological consequences, obesity probably has the
most widespread impact on psychological status in children (Reilly and McDowell
81
2003). The psychosocial effects of childhood obesity include peer discrimination,
body dissatisfaction and low self-esteem (Strauss 2000; Zametkin, Zoon et al.
2004; Puhl and Latner 2007). Low self-confidence and fear of being bullied can
prevent obese children from participating in sports, often leading to a vicious
cycle of inactivity that further exacerbates weight gain (Strauss, Rodzilsky et al.
2001; Trost 2001). Psychosocial development of children may thus be impaired
as a result of obesity (Must and Strauss 1999). Self-esteem is a commonly used
measure of this impairment (Strauss 2000). However, inconsistent data
suggesting moderate or no differences in self-esteem between obese and
healthy weight children have additionally been reported (Zametkin, Zoon et al.
2004). This discrepancy has been attributed to the fact that obese children use
compensatory methods to protect against low self-esteem (Manus and Killeen
1995). Poor body image, usually as a result of peer teasing or parental concerns,
is a more consistent finding in obese children, leading to body dissatisfaction,
depression and increased risk for future onset of eating disorders (Ricciardelli
and McCabe 2001; Zametkin, Zoon et al. 2004). Recent studies have shown that
weight management interventions for overweight and obese children have a
positive effect on their psychological status (SIGN 2010).
The most consistent finding is negative body image, which is more pronounced
among females, possibly due to differences in their physical appearance in
relation to the prevailing standard of the socially acceptable slim female
(Zametkin, Zoon et al. 2004). The features of negative psychology due to body
dissatisfaction among obese children are associated with anxiety, depression,
problematic eating behaviours and unhealthy eating habits that often persist into
adulthood, and lead to psychosocial dysfunction and social isolation (Kelly,
Ricciardelli et al. 1999; Lobstein, Baur et al. 2004).
82
Stigmatisation is another consequence of childhood obesity. Bullying is often a
problem, and increased body weight can seriously affect relationships of children
with their peers (Eisenberg, Neumark-Sztainer et al. 2003). School is the most
common environment where obese children receive negative comments and
rejection due to their weight. Worrying reports suggest that healthy weight
children perceive their overweight peers as mean, stupid, ugly, unhappy, lazy,
selfish, stupid, dishonest and unpopular (Wardle, Volz et al. 1995). Notably, even
teachers and parents can have negative attitudes and beliefs relating to
childhood obesity (Wardle, Volz et al. 1995).
Unfortunately, children often do not have the skills or maturity to effectively cope
with such negative life experiences, and the same often applies to parents who
are frequently criticised with regard to their children’s weight status.
Consequently, parents of overweight and obese children commonly experience
guilt, helplessness and anger (Schwartz and Puhl 2003).
1.7.2 Long-term consequences
Childhood obesity is an independent risk factor for adult obesity (Biro and Wien
2010; Lloyd, Langley-Evans et al. 2010; Vamosi, Heitmann et al. 2010; Lloyd,
Langley-Evans et al. 2012). The risk of overweight children maintaining their
weight status into adulthood is at least twice that of healthy weight children. This
means that most overweight and obese children will maintain their increased
body weight in adulthood. The risk is higher for adolescents and children with
obese parents (Singh, Mulder et al. 2008).
83
While most adults with obesity were not obese as children, the majority of obese
children appear to retain their excess weight as adults (Singh, Mulder et al. 2008;
Herman, Craig et al. 2009; Craigie, Lake et al. 2011). The risk of persistence of
increased body weight from childhood into adulthood is associated with parental
obesity, and increases with age, severity and duration of obesity (Reilly 2005;
Herman, Craig et al. 2009). In other words, a morbidly obese adolescent carrying
excess weight from an early age with obese parents has a significantly higher
risk of remaining obese as an adult, compared to a moderately obese 5-yearold
with no family history of obesity (Whitaker, Wright et al. 1997).
Overweight and obese children additionally have a higher risk of developing
serious health problems in later life, including coronary heart disease and stroke,
type 2 diabetes, eating disorders, bowel cancer and high blood pressure (Flynn,
McNeil et al. 2006; Barlow 2007). United States researchers have estimated the
prevalence of obese 35-year olds in 2020 on the basis of adolescent overweight
and historical trends regarding overweight adolescents who become obese
adults. Based on computer modelling analysis, the group estimated that
adolescent overweight will increase the prevalence of obese 35-year olds in
2020 to between 30 to 37% in men and 34 to 44% in women. As a consequence,
an increase in the total number of coronary heart disease events and deaths is
projected to occur in young adulthood (Bibbins-Domingo, Coxson et al. 2007).
Moreover, in another study, higher BMI at 18 years of age was found to be
independently associated with premature mortality (Reilly 2005). Obesity in
childhood additionally has social consequences in adulthood, as overweight
adolescents complete fewer years in education, are less likely to get married,
84
and are more affected by poverty than their healthy weight peers (Gortmaker,
Must et al. 1993).
Finally, childhood obesity has significant direct and indirect economic
consequences. The primary care costs for the treatment of obese children are
reported to account for 2-7% of total health care costs. This excludes the long-
term costs of associated medical conditions, such as diabetes, cancer and
cardiovascular disease (Daviglus, Liu et al. 2004; Lobstein, Baur et al. 2004).
Indirect costs associated with decreased productivity are also considerable, but
their magnitude is difficult to assess (Reilly and McDowell 2003). In 2005, the UK
Government requested Foresight to carry out a review of obesity. Foresight
concluded that without action, obesity-related diseases would cost an additional
£45.5 billion per year (Kopelman, Jebb et al. 2007; Finegood, Merth et al. 2010).
Conclusions
In summary, childhood obesity is associated with several serious short- and
long-term health and psychosocial problems, as well as significant mounting
economic costs. Consequently, its prevention and treatment has become a
serious public health priority.
85
Chapter 2 Childhood obesity prevention
Childhood provides an important opportunity for obesity prevention, as diet and
activity habits adopted during this period are likely to persist in adulthood.
Childhood obesity prevention programmes should aim to target all children from
birth, particularly the younger groups and those with risk factors, since once
established, increased adiposity is significantly more difficult to overcome.
Over the past 10 years, considerable research and multiple publications have
focused on identifying the features of a successful childhood obesity prevention
programme. Policy-makers and practitioners addressing childhood obesity
require this evidence to aid in making informed decisions. This is mainly done
once target behaviours are identified, but most importantly, when implementation
within the family context proves successful (Barlow 2007).
Ideally, evidence on whether the intended results are obtained, which parts of
the population benefit or not, the underlying reasons for success or otherwise,
and whether any negative side-effects deserve attention is additionally required.
However, a review of the existing literature reveals a striking contrast between
the high prevalence and consequent importance of addressing obesity and the
paucity of knowledge to facilitate prevention efforts, despite the large number of
studies. A body of intervention research on policy and environmental approaches
for evidence-based obesity prevention efforts is largely absent in the literature
(Making and Medicine 2010).
Reversal of the childhood obesity epidemic requires several interventions that
span multiple levels and are sustained for many years, including changes in
individual behaviour, schools, homes and workplaces, and sectors within
86
agriculture, food services, education, transportation, as well as urban planning.
While there is overwhelming evidence on the need to reduce obesity, the
consensus on effective policies or programmatic strategies is less clear
(Gortmaker, Swinburn et al. 2011).
As discussed (Section 1.6), the causes of obesity are multiple and interrelated.
Obesity can occur as a result of a wide variety of ‘causal pathways’, which differ
between individuals and change over the course of life. Correspondingly, this
variability of causal pathways highlights a need for a range of different solutions
to treat obesity. All childhood obesity interventions, targeted at either healthy
weight or overweight and obese children, aim to avoid, halt or reverse obesity,
and are therefore classified as prevention. The ultimate aim of childhood obesity
prevention is to reduce the number of overweight and obese children as well as
healthy weight children progressing to overweight or obese adolescents and
adults. There are four categories of prevention, which are discussed below.
2.1. Categories of prevention interventions
Prevention activities at the system level
In 2010, an Institute of Medicine committee for obesity prevention in the USA
recommended that researchers, government, educators and journal editors
incorporate systems thinking to guide the development of environmental and
policy interventions and study design (Making and Medicine 2010).
Examples of prevention activities at the systems level include changes to the
built environment (infrastructure), increased facilities for outdoor physical activity,
reduction in fast food outlets, financial subsidies for healthy foods (economic)
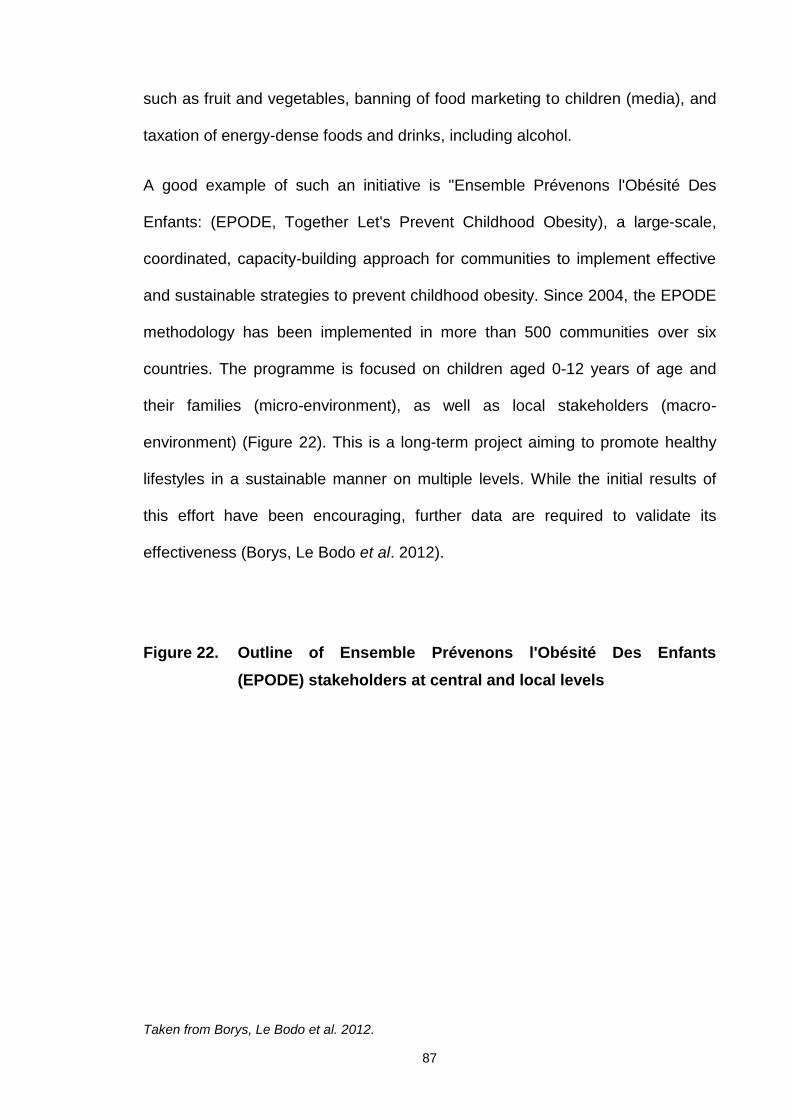
87
such as fruit and vegetables, banning of food marketing to children (media), and
taxation of energy-dense foods and drinks, including alcohol.
A good example of such an initiative is "Ensemble Prévenons l'Obésité Des
Enfants: (EPODE, Together Let's Prevent Childhood Obesity), a large-scale,
coordinated, capacity-building approach for communities to implement effective
and sustainable strategies to prevent childhood obesity. Since 2004, the EPODE
methodology has been implemented in more than 500 communities over six
countries. The programme is focused on children aged 0-12 years of age and
their families (micro-environment), as well as local stakeholders (macro-
environment) (Figure 22). This is a long-term project aiming to promote healthy
lifestyles in a sustainable manner on multiple levels. While the initial results of
this effort have been encouraging, further data are required to validate its
effectiveness (Borys, Le Bodo et al. 2012).
Figure 22. Outline of Ensemble Prévenons l'Obésité Des Enfants(EPODE) stakeholders at central and local levels
Taken from Borys, Le Bodo et al. 2012.
88
Primary prevention
Primary prevention refers to preventive strategies aimed at limiting the incidence
of disease by controlling the factors identified as being causes and/or risk factors
for a specific condition. In this case, the target population consists not only of
selected risk groups, but also the general population, including healthy
individuals (Beaglehole, Bonita et al. 2003). For the purposes of this publication,
primary prevention includes all interventions aimed at stopping children from
becoming overweight or obese and is reviewed further in Section 2.1.1.
Secondary prevention
Secondary prevention aims to cure patients and reduce the more serious
consequences of disease through early diagnosis and treatment. This
intervention is directed at the period between onset of the disease and the time
when symptoms emerge. Secondary prevention aims to reduce the prevalence
of disease (Beaglehole, Bonita et al. 2003). For the purposes of this publication,
secondary prevention refers to all interventions aiming to improve the health and
weight status of overweight or obese children and is reviewed further in Section
2.1.2.
Tertiary prevention
Tertiary prevention aims at reducing the progress or complications of established
disease, and is an important aspect of therapeutic and rehabilitation medicine
89
(Beaglehole, Bonita et al. 2003). Tertiary prevention is reviewed further in
Section 2.1.3.
2.1.1 Primary prevention
Governments worldwide are being urged to take action to prevent childhood
obesity and address underlying determinants of the condition. Strong evidence
indicates that once established, obesity is difficult to reverse (Barlow 2007).
Successful prevention interventions are desperately required to reduce the
current childhood obesity epidemic (Summerbell, Waters et al. 2005). Effective
prevention would ensure that the “conveyor belt” effect leading to childhood and
subsequent adult obesity is terminated. However, prevention of childhood
obesity remains a considerable challenge. Evaluation of primary prevention
studies is fraught with difficulties (Bautista-Castano, Doreste et al. 2004; Waters,
de Silva-Sanigorski et al. 2011), and therefore, well-designed population-based
studies are essential to develop effective public health strategies for childhood
obesity prevention.
In 2004, a group of 65 physicians and other healthcare professionals
representing nine countries convened in Israel to review the available evidence
and develop a consensus statement on childhood obesity (Speiser, Rudolf et al.
2005). As part of this process, prevention strategies during the life-course were
examined. Although 8 years old now these options presented in the form of
suggestions are still relevant (Table 3).

90
Table 3. Options for prevention of childhood obesity
Pregnancy- Achieve normal BMI before pregnancy
- Do not smoke- Engage in moderate exercise (as tolerated)
Lactation/weaning
- Exclusive breastfeeding for a minimum of 6 months- Delay introduction of solids and sweet liquids
Family
- Eat as a family in a fixed time and place
- Do not skip meals, especially breakfast- Turn off the television during meals, keep it off in
children’s bedrooms and restrict times for television,video and computer usage
- Use small plates and keep serving dishes away from thetable
- Avoid sweet or fatty foods and soft drinks
Schools
- Review policies and procedures to promote healthyeating
- Set a curriculum for nutrition education- Educate teachers about basic nutrition and the benefits
of physical activity
- Provide facilities for physical activity- Establish minimum standards for physical education- Review content of vending machines, substitute
unhealthy with healthy choices
Community- Provide family-friendly playing facilities for all age groups- Provide nutrition education on healthy shopping and offer
healthy versions of cultural-specific foods
Healthcareprofessionals
- Provide accurate and appropriate information to thepublic with respect to the obesity issue
- Emphasise the extent and importance of the obesityepidemic
Industry - Introduce age-specific nutrition labelling for productsadvertised to children
Taken from Speiser, Rudolf et al. 2005.
91
All the strategies listed in Table 3 aim to modify behaviours, with a view to
improving nutrition and physical activity levels at the individual, family,
community and societal levels. Evidence at the time suggested that inclusion of
the entire family is a crucial factor in the prevention of childhood obesity
(Bautista-Castano, Doreste et al. 2004).
Generic systematic reviews on childhood obesity prevention
In 2005, Summerbell and co-workers conducted a Cochrane systematic review
of studies to prevent childhood obesity, with the main objective of determining
the effectiveness of educational, health promotion and/or psychological/family/
behavioural therapy/counselling/management interventions that focused on diet,
physical activity or lifestyle support or both in preventing obesity. Twenty-two
controlled trials were included, of which 10 were long-term (at least 12 months)
and 12 were short-term (12 weeks to 12 months). All studies included children
aged 18 years or younger, and the majority of studies were conducted in school
settings. Only two studies were family-based interventions targeting non-obese
children of obese or overweight parents (Summerbell, Waters et al. 2005).
The authors noted methodological weaknesses in all 22 studies, but reported
greater than 74% follow-up data. Intervention components included dietary
education alone, physical activity alone and combined diet and physical activity.
The results of these studies indicated no significant impact on children’s weight
status, and the review concluded that there was no evidence of effective
strategies to prevent childhood obesity. The underlying reasons included a lack
of well-designed long-term studies and coordination among sectors affecting
92
aspects of children’s lives (food industry and marketing, schools, media,
environmental factors) that influence areas directly related to the risk for obesity
development. It is worth noting at the time the significant mismatch between the
severity and prevalence of child obesity and evidence base to inform policy and
wider preventative initiatives (Summerbell, Waters et al. 2005).
Recently, the Cochrane systematic review examining interventions for preventing
childhood obesity, referred to above, was updated (Summerbell, Waters et al.
2005; Waters, de Silva-Sanigorski et al. 2011). An additional 36 studies (55 in
total, as 3 were excluded from previous review) were included in the update, with
the majority focusing on children aged 6-12 years. Twenty-six studies were
conducted in the USA, 6 in the United Kingdom, and the remainder in other
countries. Among the 55 studies included, 50 were set in high-income countries
and therefore the results were potentially applicable to a UK setting. The majority
(75%) of the studies lasted for 12 months or less, and 30 had high risk of bias for
one or more domains (selection, blinding, attrition, performance and detection).
Thirty-nine studies targeted children aged 6-12 years. However, according to the
authors, only 27 provided appropriate BMI or BMI z-score data for inclusion in
the meta-analysis. Interestingly, only seven of the 39 studies were conducted
outside of an education setting. Results of the meta-analysis revealed a
statistically significant mean effect size in BMI or BMI z-score of -0.15 (95% CI:
-0.23 to -0.08) (Waters, de Silva-Sanigorski et al. 2011).
Physical activity was assessed using a variety of measures and indicators.
Overall physical activity-related factors were shown to improve in the majority
(21) of studies. A forest plot of changes in BMI or BMI z-score revealed that
physical activity interventions (16 studies) resulted in a significant difference of -
93
0.11 (95% CI: -0.19 to -0.02), while dietary interventions (6 studies) led to a non-
significant difference of -0.12 (95% CI: -0.28 to 0.05). Combined physical activity
and dietary interventions resulted in a significant difference of -0.18 (95% CI:
-0.27 to -0.09).
Eight studies reported the impact of the interventions on cardiovascular risk
factors. Four of these showed beneficial effects on blood pressure, heart rate,
blood lipids and cardiovascular fitness. Results based on gender depicted an
inconclusive picture, with some studies showing an influence and others
indicating no effect. Analyses performed relative to duration revealed a
significant mean effect size in BMI or BMI z-score of -0.17 (95% CI: -0.25 to
-0.09) for duration ≤12 months, and a corresponding mean effect size of -0.12 for
studies lasting for >12 months (95% CI: -0.21 to -0.03).
The authors concluded that the best estimate of effect on BMI was a 0.15 kg/m2
reduction, corresponding to a small but clinically important shift in population BMI
if sustained over several years. However, they highlighted that due to the
heterogeneity of the observed effects, potential attrition bias in many studies and
likelihood of small study bias, findings should be interpreted with caution.
Another potential bias suggested is evidence of under-reporting of small studies
with negative findings in the published literature, which could inflate the effect
sizes. The strongest evidence of effectiveness was found in 6-12 year olds, but
the finding was primarily attributed to the larger number of studies performed in
this age group. As 75% of studies lasted for 12 months or less, no conclusions
could be reached in terms of sustainability of health outcomes.
The authors concluded that some support is now available to determine the
effectiveness of obesity prevention interventions in children. Importantly, few
94
minor adverse outcomes were reported. For the first time, a systematic review of
childhood obesity prevention interventions provided evidence that interventions
aimed at all children can successfully reduce BMI. However, further research is
required to determine whether these interventions are generalisable and
effective when delivered at scale.
An earlier systematic review and meta-analysis examined behavioural
interventions to prevent childhood obesity (Kamath, Vickers et al. 2008). In
contrast to previous systematic reviews, the approach of the authors was to
examine the extent to which preventive interventions affected lifestyle (physical
activity and dietary) behaviours as outcomes, and not focus on obesity as a
direct outcome.
Twenty-nine RCTs (children aged 2-18 years) were included with complete
datasets for at least one of the behavioural outcomes. Interventions caused
minor changes in the respective target behaviours, but had no significant effect
on BMI, compared to controls. As expected, results were similar to those
reported in the earlier Cochrane review (Summerbell, Waters et al. 2005), but
dissimilar to the most recent Cochrane review (Waters, de Silva-Sanigorski et al.
2011). This finding suggests that either the recent trial has more positive effects
on BMI or increased power provided by the larger number of studies (55 versus
29) allows the detection of smaller changes.
In conclusion, recent reviews and meta-analyses have started to report optimistic
results from interventions aiming at reducing the risk for obesity in childhood.
However, methodological issues pose a serious problem, as they are
responsible for significant heterogeneity among studies, making it difficult to
95
assess effectiveness. Future research should shed more light on the features
associated with success, given the importance of early obesity prevention.
Prevention studies in schools
Considerable research in the field of prevention of childhood obesity has focused
on school-based interventions. In 2009, a meta-analysis of trials examining the
effect of school-based physical activity interventions on body mass index was
conducted (Harris, Kuramoto et al. 2009). Eighteen randomised and non-
randomised controlled studies involving 18,141 children were included. BMI did
not improve following school-based physical activity interventions (weighted
mean difference -0.05 kg/m2 (95% CI: -0.19 to 0.10). Moreover, no consistent
changes in other measures of body composition were observed, despite positive
changes in eating habits in children. These results were analogous to those
reported from a systematic review (Waters, de Silva-Sanigorski et al. 2011) .
A research team from Australia conducted a review of existing systematic
reviews and meta-analyses of school-based behavioural interventions for
preventing obesity (Khambalia, Dickinson et al. 2012). Studies were included,
based on the following selection criteria: (i) participants were school-based
children, (ii) the study design had to be a review with sufficient reporting of
methodological details to allow critical appraisal of data quality (preferably a
systematic review or meta-analysis, and (iii) reviews considered individual
studies examining behavioural interventions for preventing overweight or obesity,
including physical activity, dietary behaviours, modifying exercise or dietary
behaviours or a combination of these approaches.
96
A total of 8 reviews (3 meta-analyses, 5 qualitative systematic reviews) met the
inclusion criteria, and as observed with previous systematic reviews, the
differences in methodology, results and interpretation made comparisons
difficult. Intervention components in the school setting associated with significant
weight reduction in children included long-term programmes with combined diet
and physical activity and a family component. As established previously, no
single intervention will fit all schools and populations, and therefore, further high-
quality research focusing on identifying specific programme characteristics
predictive of success is essential.
Owing to the increasing percentage of both parents being in full-time
employment, children spend more time in schools. In the USA, 8.4 million
children participate in some form of after-school programme (Branscum and
Sharma 2012). The aim of these programmes is to provide a safe and structured
environment for children after school hours, and offer an opportunity to promote
health-based interventions for preventing childhood obesity. In another study,
researchers conducted a comprehensive review of after-school obesity
prevention interventions between 2006 and 2011 (Branscum and Sharma 2012).
Twenty-five studies (7 RCTs) were included in this review, the majority of which
were USA-based. Overall, the group concluded that these types of interventions
have a low impact on outcomes, but outlined a number of recommendations for
future after-school programme trials.
Thus, evidence on the effectiveness of school-based and after-school
interventions for the prevention of childhood obesity is still inconclusive. Despite
the lack of significant findings with regard to adiposity, school-based physical
activity remains a crucial area that is reported to have considerable benefits on
97
health, and linked to reduced blood pressure, improved lean muscle mass, bone
mineral density, aerobic capacity and flexibility (Harris, Kuramoto et al. 2009).
However, given the lack of conclusive evidence, efforts should be made to obtain
generalisable positive data to support decisions by policy-makers promoting
school-based physical activity as a central component of the strategy to reduce
childhood obesity.
Conclusions
Most of the available primary prevention studies are school-based, and those
combining diet and physical activity appear the most effective. However, results
obtained from reviews supporting protective effects of specific interventions are
inconsistent, and further investigation is required (Summerbell, Waters et al.
2005; Kamath, Vickers et al. 2008; Khambalia, Dickinson et al. 2012).
Although primary prevention of childhood obesity is more cost-effective than
secondary prevention, the lack of successful primary prevention strategies
combined with the escalating prevalence of obesity necessitates the
simultaneous development of strategies aimed at both primary and secondary
prevention (Gortmaker, Swinburn et al. 2011). Primary prevention is always
preferable to secondary and tertiary prevention. However, we cannot neglect
overweight or obese children by focusing mainly on primary prevention
strategies. With current childhood obesity rates at their highest levels in human
history, effective joint primary and secondary prevention interventions are
urgently required to manage this devastating epidemic. Up-to-date evidence
shows that the impact of current primary prevention interventions on reducing
98
childhood obesity, their mechanism of action, and safety remain poorly
understood, impeding assessment of their effectiveness.
2.1.2 Secondary prevention
The primary purpose of secondary prevention interventions (childhood weight
management interventions) is to support and promote behavioural modifications
to improve nutritional intake and increase energy expenditure. This allows
normal growth to continue with little risk of impaired growth and future eating
disorders (Kirk, Zeller et al. 2005; Hunt, Ford et al. 2007). Consequently, results
are more likely to be sustained in the long-term (Batch and Baur 2005;
Williamson, Han et al. 2011).
Many combinations of strategies are incorporated into multicomponent child
weight management interventions. The majority include lifestyle interventions
consisting of behavioural modifications focused on diet and physical activity.
Dietary interventions are included in most multicomponent interventions, and
many types have been trialled, varying from brief advice to intensive and
structured dietary management by a dietitian. Physical activity interventions may
be used to improve treatment success. These interventions also vary in nature
from brief lifestyle advice provided by a health care professional to structured
physical activity supervised and delivered by an exercise professional.
Differences in the health care and non-health care settings in which
multicomponent interventions are conducted and variations in terms of views
regarding what constitutes an effective approach to weight management
contribute to the variability observed across weight management trials. Evidence

99
regarding the type and number of individual interventions included in a weight
management multicomponent programme is difficult to obtain. Instead, data may
be obtained from each component supporting its effectiveness for incorporation
into a "best practice" multicomponent intervention, depending on the area of
delivery, target population and available resources, such as skills and venues.
Individual strategies and published evidence supporting the efficacy of individual
strategies are discussed in the following sections.
Study design and multicomponent interventions
Several study designs have been employed to evaluate the effectiveness of
multicomponent interventions for childhood weight management. The majority of
these are non-controlled, which may result in overestimation of intervention
effectiveness. Most studies are undermined by high levels of drop-out or loss of
follow-up of participants, resulting in increased selection bias that limits the
generalisability of findings.
Goals of multicomponent interventions
The most commonly cited goal for multicomponent interventions is to achieve
improvements in anthropometry (Oude Luttikhuis, Baur et al. 2009). The
outcomes targeted in children’s weight management interventions generally
include objectively measured markers of body composition, such as BMI
(adjusted for age and gender), and less commonly, waist circumference.
Secondary goals commonly include a wide range of other outcomes (clinical,
e.g., blood pressure, lipids, cardiovascular fitness, time spent in physical or
100
sedentary activities, and psychosocial, e.g., self-esteem and quality of life). In
some trials, parental outcomes are included as markers for entire family lifestyle
change.
Effectiveness of dietary interventions
Successful treatment of childhood obesity requires a sustained negative energy
balance, which may be achieved by modification of dietary intake. This section
focuses on interventions with a strong dietary modification component.
A systematic review examined the effectiveness of dietetic interventions for
treatment of childhood obesity (Collins, Warren et al. 2006). Thirty-seven RCTs
met the inclusion criteria, and 17 of which contained sufficient information for
meta-analysis of the standardised effects. Owing to the various combinations of
treatments, including a dietary intervention and variable composition of the
control groups, a meta-analysis to ascertain the effectiveness of dietetic
interventions per se was not possible. However, a meta-analysis was performed
on the subset of studies (n=8) including both a dietary intervention component
and adequate control group. Limited studies have evaluated dietary intervention
as the sole component of treatment and compared this with a non-intervention
control group. The authors stressed that caution should be taken when
interpreting the results, as only a small number of studies were included in the
meta-analysis and diet was only a single component of the interventions, making
its contribution difficult to evaluate.
The results suggest that interventions containing a dietary component are
effective in achieving relative weight loss in overweight or obese children (pooled
101
standardised mean difference, -1.82, 95% CI: -2.40 to -1.23) (Collins, Warren et
al. 2006). Only four studies had follow-up data, and meta-analysis of the
outcomes indicated a diminishing effect of the intervention over time (pooled
standardised mean difference, -0.64, 95% CI: -0.89 to -0.39). Sixteen studies
used the Traffic Light Diet (or a variation) for intervention. Five studies included a
food or calorie exchange programme, while only one compared two different
dietary interventions (low-fat versus low carbohydrate). Reports on dietary
compliance were extremely poor in the majority of studies. The authors
concluded by reiterating that due to the lack of quality research in this area,
results need to be interpreted with caution. Thus, application of this research is
challenging, as while interventions including dietary treatments clearly achieve
weight loss, it is difficult to establish conclusions about details or particular
features. As the majority of internationally available childhood weight
management programmes contain a dietary component, further research would
be invaluable to determine the most effective dietary treatment.
In the most recent Cochrane review on childhood obesity management (Oude
Luttikhuis, Baur et al. 2009), four studies were categorised as dietary
interventions. Only two (Nova, Russo et al. 2001; Epstein, Paluch et al. 2008) of
these studies fulfilled all the criteria for pooling in a meta-analysis, but involved
different comparisons.
One investigation was of particular interest, as it compared the effect of targeting
increased consumption of healthy foods (fruits, vegetables and low-fat dairy)
versus reducing intake of high energy-dense foods within the context of a family-
based behavioural weight management programme in the USA (Epstein, Paluch
et al. 2008). Traditionally, the approach of lowering energy intake has centred on
102
reducing energy-dense, low nutrient-dense foods. Epstein hypothesised that an
alternative or complementary approach may be to target increased consumption
of healthy foods, thereby leading to a reduction in energy intake. Forty-one
obese children (>85th BMI centile) aged between 8 and 12 years (mean BMI z-
score = 2.3) were randomly assigned to the 24-month intervention study.
In Epstein's approach, the Traffic Light Diet, the most commonly reported dietary
intervention strategy (Collins, Warren et al. 2006), was used to decrease energy
intake and promote healthy eating habits for children and their parents. Traffic
Light Diet foods are categorised as Green, Yellow, and Red, based on amounts
of fat and sugar per serving. Green foods are high in nutrient density and low in
energy density (fat = 0-1 g or sugar <10% calories/serving). Most Green foods
belong to the fruit and vegetable groups. Yellow foods are higher in energy
density than Green foods (fat = 2-5 g or sugar 10-25% calories/serving), while
Red foods are higher than Yellow or Green foods (fat > 5 g or sugar > 25%
calories/serving). Red foods are usually derived from fats, oils, and sweets, and
should be consumed sparingly. Modified foods from the fat, oil, and sweet
groups are considered Red foods, even if their fat and/or energy levels are low.
These food types contribute few nutrients to the diet and compete with healthier
food consumption. In addition to the Traffic Light Diet, participants were
instructed to consume between 1,000 and 1,500 calories per day, but the way in
which this was achieved is unclear. Families were additionally educated on the
merits of reading food labels and healthy shopping.
Both groups were instructed to follow the Traffic Light Diet to reduce energy
intake, and provided with information on the positive effects of physical activity.
Parents and children were additionally awarded points for meeting dietary goals
103
as a method of positive reinforcement. Additional points could be earned for
parent weight loss of 1 pound per week and child weight loss of ½ a pound per
week. The goal for normal weight parents was to maintain their weight within a 5
pound range. Parents and children were instructed to weigh themselves at home
(Epstein, Paluch et al. 2008).
The intervention between groups differed in a number of respects. One group
was instructed to replace energy-dense foods with fruits, vegetables and low-fat
dairy (Group A). The second group focused on meeting the calorie goal and
decreasing Red foods by at least two a day below their normal consumption
(Group B).
No significant differences in obesity reduction were observed between the two
groups. The mean age of children in the study was 10.5 years. Children in Group
A displayed reduced BMI z-scores by -0.25 (±0.09), -0.26 (±0.15) and -0.27
(±0.41) at 0-6, 0-12 and 0-24 months, respectively. The BMI z-scores of children
in Group B were reduced by -0.31 (±0.05), -0.21 (±0.17) and -0.11 (±0.21) at 0-6,
0-12 and 0-24 months, respectively. Between-group differences were significant
(p < 0.001) at 12 and 24 months. Children from both groups showed a significant
(p < 0.05) reduction in consumption of red foods up to one year, with better long-
term maintenance in Group A. Between-group differences were observed only at
24 months (P = 0.03). No significant changes in low-fat dairy consumption were
observed. Older, female children with lower baseline BMI z-scores assigned to
Group A displayed greater sustained reductions in BMI z-score over the two
years than children assigned to Group B. Parent BMI changes showed a similar
linear pattern to that observed in children, with Group A parents displaying
significant linear reductions in BMI (P < 0.05). Significant between-group
104
differences in parental BMI were observed at 24 months (P = 0.017) (Epstein,
Paluch et al. 2008).
Epstein and colleagues concluded that in the context of a comprehensive family-
based behavioural weight management programme that encourages reduction in
energy intake, increase in physical activity and changes in parenting behaviour,
targeting an increase in fruit and vegetable intake and low-fat dairy products is
associated with significantly greater reduction in BMI z-score over two years for
both children and parents than focusing on reducing energy-dense foods.
Interestingly, Group A was associated with no relapse in weight regain from 6
months of treatment through the 2-year follow-up. However, no details were
available in terms of actual intensity of the treatment and follow-up. Moreover, no
information about the qualifications of the research team delivering the
intervention was provided, although previous Epstein studies have employed
highly specialised health care professionals. A limitation of this study was the
use of questionnaires to measure dietary intake, which may not have been
sufficiently accurate or sensitive to detect changes in diet between groups,
particularly as the numbers in each group were small (Group A, n= 21, Group B,
n=20). A significant loss in the number of subjects at 24 months was additionally
reported (Group A, n= 14, Group B, n=13). Due to these low numbers and
methods of dietary assessment, conclusive results were not obtained from this
study. However, the data indicate that improvement in healthy eating habits is an
important target in childhood weight management programmes (Epstein, Paluch
et al. 2008).
In summary, dietary recommendations for the management of childhood obesity
support the promotion of a healthy diet within a multicomponent intervention, but
105
do not advocate any particular dietary approach alone, given the lack of strong
evidence to date (NICE 2006; SIGN 2010).
Effectiveness of physical activity interventions
Engaging in regular physical activity during childhood is widely accepted as an
effective preventive measure for a variety of health risk factors across all ages,
genders, ethnic and socioeconomic groups (Jannsen 2010). However, across all
age groups, levels of physical activity remain low (HSE 2008), while obesity rates
continue to rise (Bridges and Thompson 2010). Increasing energy expenditure
while maintaining or decreasing energy intake is the mainstay of any successful
childhood weight management programme. In this section, we specifically
examine interventions with a focus on increasing physical activity levels and/or
decreasing sedentary activities.
An Australian research team conducted a systematic review examining the
efficacy of exercise for treating overweight in children and adolescents (Atlantis,
Barnes et al. 2006). This report was the first aiming to establish the isolated
effects of exercise on obesity among children and adolescents. Studies were
only included if the specific effects of exercise could be determined. In total, 14
studies were examined, including a pooled sample of 481 boys and girls with a
mean age of 10.9 ±1.5 years. Exercise led to a significant reduction in percent
body fat in obese boys and girls aged 12 years. The investigators additionally
noted that the current recommended doses of exercise/physical activity for
treating overweight in children published by several expert committees (30-60
minutes/day at moderate intensity, most days of the week: 210-360
106
minutes/week) (Daniels, Arnett et al. 2005; NICE 2006) are substantially higher
than those tested in RCTs of obese children. In fact, no randomised trial
prescribed a dose of more than 200 minutes per week of aerobic exercise to
obese children. These findings suggest that significant effects on percent body
fat are achievable with a lower dose of prescribed exercise than that currently
recommended.
The Cochrane review (2009) on childhood obesity management identified nine
studies focusing mainly on the physical activity component of a childhood obesity
intervention. Only four of these studies fulfilled the inclusion criteria, but were not
pooled for meta-analysis due to non-comparable study designs and interventions
(Oude Luttikhuis, Baur et al. 2009).
A study by Gutin and colleagues in the USA comparing the effects of physical
training intensity on cardiovascular fitness, percentage body fat and visceral
adipose tissue in obese adolescents was included in the review (Gutin, Barbeau
et al. 2002). Eighty 13-16 year olds were assigned to 8 months of either: i)
lifestyle education plus moderate-intensity physical training, ii) lifestyle education
plus high-intensity physical training or iii) lifestyle education only. Physical
training was offered 5 days per week, with target energy expenditure of 250
calories per day for all subjects in physical training groups.
The investigators reported an increase in cardiovascular fitness in the high-
intensity physical training group, but not the moderate-intensity group, which was
considerably greater than that in the lifestyle education only group. No other
significant differences were evident among the three groups. Adolescents
attending physical training for 2 or more days per week showed marked
improvements in cardiovascular fitness, as well as reduction in percentage body
107
fat and visceral adipose tissue. Although the study was only conducted in
adolescents, the results demonstrated that high-intensity physical training is
more effective than moderate-intensity training in enhancing body composition
(Gutin, Barbeau et al. 2002). This may also be relevant for younger children, as
high-intensity physical activity is known to be more effective in reducing adiposity
by promoting fat burning and cardiovascular fitness improvement.
The review did not include the study by Owens and co-workers in the USA, as
body composition was selected as primary outcome versus BMI. This analysis
provided important information on the role of physical activity alone in improving
body composition in obese children. The researchers assessed the effects of
physical training without dietary intervention on visceral adipose tissue and
percentage body fat in obese children (Owens, Gutin et al. 1999). Seventy-four
obese 7-11 year-old children were randomly assigned to physical training and
control groups. The intervention involved 4 months of controlled physical training,
5 days per week for 40 minutes per session. The estimated energy expenditure
was 220 calories per training session. The physical training group showed a
significant decrease in percentage body fat and increase in fat-free mass,
compared to the control group. Moreover, the increase in visceral adipose tissue
was markedly lower in the physical training group. The authors concluded that
regular exercise induces a significantly greater decline in adiposity, compared to
the control group, after 8 months of intervention.
Another group of investigators in the USA examined the use of resistance
training to treat pre-adolescent obese children (Sothern, Loftin et al. 2000). This
older study was additionally excluded in the review (Oude Luttikhuis, Baur et al.
2009), as it did not meet the inclusion criteria, but nevertheless, provides a useful
108
insight into the roles of different types of exercise on programme retention. In this
study, 19 subjects (7-12 years of age) were enrolled in a 10-week weight
management programme, which included diet, behaviour modification, and
aerobic and flexibility exercises. An additional 48 control subjects participated in
diet, behaviour modification, and a walking programme three times a week.
Fifteen treatment subjects completed the 10-week programme (retention rate =
79%). BMI was reduced at 10 weeks, and did not increase significantly at one-
year follow-up in both treatment and control groups. In the treatment group,
percent body fat was considerably decreased, but no changes in fat-free mass
were observed. The authors concluded that the addition of specific exercise
regimes, such as resistance training, improves programme retention, particularly
in severely obese children (Sothern, Loftin et al. 2000).
Sedentary and physically active behaviours are the principal options for leisure
time activities (Epstein, Paluch et al. 2000). Adiposity is likely to result in cases
where inactive pursuits predominate. Westernised lifestyles are associated with
an increase in sedentary behaviour, and consequently, higher obesity rates. The
incorporation of physical activity into daily life is important for many reasons.
Physical activity is crucial to produce greater energy expenditure than energy
intake, and should include both organised and incidental activities (NICE 2006).
In order to prevent children from perceiving exercise as an unpleasant
experience, fun, non-competitive activities are encouraged. Moreover, beneficial
effects on energy expenditure can be achieved by providing trivial everyday
opportunities for activity, e.g., walking (Levine 2004).
Despite the finding that exercise does not seem to have significant effects on
weight reduction (Jakicic and Otto 2005), the overall associated health benefits
109
necessitate its incorporation in childhood weight management interventions
(Summerbell, Ashton et al. 2003). The proven benefits of physical activity in the
prevention of weight gain, along with its positive effects on psychology and self-
esteem further support its inclusion in programmes to control obesity (ADA 2006;
NICE 2006; SIGN 2010).
Reduction in sedentary activities, such as time spent watching television or
playing computer games, can also have beneficial effects on weight control. A
recent systematic review examined the effect of sedentary behaviour and health
indicators in school-aged children (Tremblay, LeBlanc et al. 2011). Based on this
review of 232 studies, sedentary behaviour (primarily TV viewing) for more than
2 hours per day was associated with unfavourable body composition, decreased
fitness, lower self-esteem and decreased academic achievement in children
aged 5–17 years. This finding was true for all study designs and across all
countries. The authors concluded that reducing sedentary behaviour can
improve body composition. Moreover, both increased physical activity and
reduced sedentary activities are necessary to improve health outcomes in
children (Tremblay, LeBlanc et al. 2011).
To date, interventions aimed at reducing sedentary behaviours have generally
been more successful than those promoting physical activity (Epstein, Paluch et
al. 2000; Ritchie, Welk et al. 2005; Salmon, Ball et al. 2005). This finding
highlights the importance of targeting sedentary habits, rather than focusing
solely on promotion of physical activity.
In conclusion, there is sufficient evidence to support the routine recommendation
of increased physical and decreased sedentary activities within childhood obesity
weight management interventions. However, it is not clear whether inclusion of
110
actual physical activity sessions within the intervention offers any benefit over
education to increase physical activity or reduce sedentary behaviours outside of
the intervention.
Effectiveness of behavioural interventions
Behavioural counselling has been advocated as an important element of child
obesity treatment since 1987 (Epstein and Wing 1987). In the Cochrane review,
24 studies incorporated interventions with a large behavioural component, but
only 8 reported analyses based on intention-to-treat principles (Oude Luttikhuis,
Baur et al. 2009). Of these, 4 (Golan, Kaufman et al. 2006; Golley, Magarey et
al. 2007; Kalavainen, Korppi et al. 2007; Hughes, Stewart et al. 2008) meeting all
the criteria were pooled in meta-analysis aiming to establish the effect of a
behavioural family programme, compared to standard or minimal care, on
changes in BMI z-score. The meta-analysis of 301 participants revealed a small
positive change of -0.06 (95% CI: -0.12 to -0.01) on BMI z-score in the parent-
focused behavioural group intervention, compared to standard care.
Golan and colleagues in Israel examined the reduction in overweight and
changes in eating-related behaviours in 60 obese 6 to 11-yearolds subjected to a
family-based approach (Golan, Weizman et al. 1999). Children were randomly
assigned to one of two groups. The intervention group used parents as the
agents of change (a family-based health-centred approach), whereas in the
control group, children acted as their own agents. All children were followed up
for one year from baseline. Parents received 14 one-hour support/educational
sessions from a dietitian, whereas children in the control group received 30
111
sessions. Individual sessions were also held for members of both groups where
necessary.
Significant differences were evident between the two groups in terms of
reduction of exposure to food stimuli and changes in eating habits (eating while
standing, watching television, reading or doing homework, following stress and
between meals). Mean weight reduction (by percentile only) was significantly
greater in the intervention group, compared to the control group.
The researchers concluded that treatment of childhood obesity with parents as
the exclusive agents of change promotes greater behavioural changes and
weight loss than using children as their own agents. However, it must be noted
that the group did not compare parents alone with parents and children together
as agents of change (Golan, Weizman et al. 1999)
A 7-year follow-up study of the children from the previous investigation where
only parents were targeted, compared with a control intervention solely focusing
on children as targets, was performed (Golan and Crow 2004). Fifty of 60
children that had participated in the study 7 years previously were located, and
their weights and heights re-measured. At the 7-year follow-up period, children
were 14 to 19 years of age. Mean reduction in overweight was greater at all
follow-up points in children of the parent-only group, compared with those of the
children-only group. Seven years after the original programme was terminated,
mean reduction in children’s overweight was 29% in the parent-only group
versus 20.2% in the children-only group (p < 0.05) (Golan and Crow 2004).
An Israeli research team conducted a RCT to evaluate the relative efficacy of
treating childhood obesity via a family-based health-centred intervention
112
targeting parents alone versus parents and obese children together (Golan,
Kaufman et al. 2006). Thirty-two families with obese children 6 to 11 years of age
were randomised into groups, whereby participants were provided with a 6-
month comprehensive healthy lifestyle educational and behavioural programme.
In both groups, parents were encouraged to foster authoritative parenting styles.
The intervention aimed at parents only resulted in a significant reduction in BMI
z-score at the end of the programme (-0.4, P < 0.05) as well as one-year follow-
up (-0.5, P = 0.025), compared with that aimed at parents and children. The
differences between the groups at both times were significant (P < 0.05). In both
groups, the parents' weight status did not change. These results suggest that
omitting obese children from active participation in the health-centred
programme may be beneficial for weight loss and promotion of a healthy lifestyle.
Golan’s research suggests that parent-only treatment of childhood obesity is
more effective than combined parent and child treatment (Golan, Kaufman et al.
2006). A possible reason for these findings is that many topics, including
parenting skills, are sensitive subjects that are not appropriate for discussion in
front of children. If parents and children are always together during the
intervention, the topics of discussion are limited. However, another interesting
comparison is the evaluation of a parent-only versus parent and child
intervention that includes parent-only periods, for example, where children are
provided exercise time while their parents discuss sensitive or adult-focused
issues. Using this approach, both types of intervention could be incorporated and
subsequently evaluated.
In Australia, a research team compared parent-centred with child-centred
lifestyle therapy in 165 participants aged 8 years (BMI 24.4 to 25.2) (Okely,
113
Collins et al. 2010). The parent intervention focused on diet and the child
intervention on physical activity. All groups received 10 weekly face-to-face
sessions, followed by three-monthly relapse-prevention phone calls to 12 months
post-intervention. The mean reduction in BMI z-score at 12 months was 0.4 in
the parent group (95% CI: 0.3 to 0.5), 0.2 in the child group (95% CI: 0.1 to 0.3)
and 0.3 in the combined intervention group (parent + child) (95% CI: 0.2 to 0.4).
This trial demonstrates that all three combinations of parent only, child only and
parent and child interventions are effective. A parent skills training component
may have provided a useful addition to the parent only and parent and child
interventions to determine whether additional benefits are achievable over diet
and activity alone.
An Australian RCT evaluating the relative effectiveness of parenting skills
training as a key strategy for the treatment of overweight children was published
(Golley, Magarey et al. 2007).This study included 111 parents of overweight pre-
pubertal children (aged 6 to 9 years) assigned to parenting skills, parenting plus
intensive lifestyle intervention or a waiting list control. After 12 months, the BMI
z-score of children in the parenting skills plus lifestyle intervention group was
reduced by 10%, compared to 5% reported in the group with parenting skills
alone and 5% reduction in wait list controls.
Hughes et al. (2008) conducted a UK RCT with 134 children aged 5 to 11 years
that assessed a family-centred counselling and behavioural therapy program to
modify diet, physical activity and sedentary behaviour, compared with standard
care (Hughes, Stewart et al. 2008). After 12 months, the median BMI z-score
decreased in both groups (intervention = -0.07, 95% CI: -0.22 to -0.04; control =
114
-0.19, 95% CI: -0.26 to -0.08). No significant differences in BMI reduction were
observed between the two groups.
In the USA, Kalarchian et al. (2009) conducted a RCT with 192 children aged 8
to 12 years (BMI ≥ 97th centile) who participated independently in the parent and
child group, and involved individual behaviour therapy and lifestyle coaching that
focused on calorie control, increased physical activity and reduced sedentary
behaviour (Kalarchian, Levine et al. 2009). In contrast, the control group only
received brief advice. After 18 months, the intervention was associated with a
non-significant 1.2% decrease in child percent overweight, compared with 0.2%
reduction in the control group (p = 0.62).
A RCT in Finland comparing family-based group treatment with routine
counselling in 70 participants aged 7 to 9 years with weight for height >115%
was reported (Kalavainen, Korppi et al. 2007). The family-centred group
programme included diet, physical activity and reduction in sedentary behaviour.
Parents received the programme intervention, while the control group received a
brief intervention and written advice. The intervention resulted in a loss of weight
for height of 7% at 6 months, compared with a corresponding loss of 2% in the
control group. At 6 months after the programme had ended, percentage weight
loss was 3% in the intervention group, compared with a gain of 2% in the control
group.
The USA Dietary Intervention Study in Children (DISC) was a multi-centre,
collaborative, randomised trial involving 663 8 to 10-year old children (363 boys
and 300 girls) with elevated low-density lipoprotein cholesterol (1995). The
investigation was designed to test the efficacy and safety of dietary and
115
behavioural interventions to lower saturated fat and cholesterol intake while
promoting a healthy eating pattern.
Children were randomised into intervention and usual care groups. The study
aimed to promote adherence to a healthy diet using intervention strategies based
on social-learning theory and social-action theory constructs, according to which
children learn behaviours through observation and imitation of models, such as
parents, siblings, other family members, peers, and celebrities. Intensive
intervention included 6 weekly sessions during the first 6 months, followed by 5
biweekly group sessions led by nutritionists and behaviourists during which
dietary information and practical tips for following the diet were provided. Group
sessions were followed by two individual sessions with the nutritionist.
During the subsequent 6-month period, 4 group and 2 individual sessions were
additionally held. These relatively intensive intervention sessions were followed
by maintenance sessions 4 to 6 times per year during the second and third
years, with monthly telephone contacts between group sessions. The usual care
group was provided with publications on healthy eating and assessed annually.
At 3 years, dietary total fat, saturated fat, and dietary cholesterol levels had
decreased significantly in the intervention group, compared with the usual care
group (-4.2%, -2.1%, -18.1 mg for % total dietary fat, % saturated fat and mg of
dietary cholesterol, all P < 0.001). These results indicate that a behavioural
approach to dietary modification leads to sustainable changes in dietary intake in
8 to 10-year old children.
In the US, researchers randomised 67 obese children into 3 groups receiving a
6-month family-based behavioural weight control programme alone or with
116
parent or child problem-solving (Epstein, Paluch et al. 2000). All 3 groups
showed significant BMI z-score decreases at 2 years. Almost 50% of the children
in the standard group displayed marked (> 1.0) BMI z-score decreases. Across
all groups, mean BMI z-score was reduced from 2.7 to 1.9 at 2 years. However,
to date, no other group has managed to replicate Epstein’s interventions or
findings.
In the meta-analysis by Oude Luttikhuis et al. (2009), the intervention target was
the family or the child with a parent in 40 of the 64 studies, while the rest
examined either the child alone, parent alone (1 study) or the effects of different
levels of parent and/or child participation. In children less than 12 years of age,
parent-focused lifestyle interventions were more effective than standard care in
reducing BMI z-score at 6 months (effect size -0.06, 95% CI: -0.12 to -0.01), but
this reduction was non-significant by 12 months (effect size -0.04, 95% CI: -0.12
to 0.04).
Family involvement is generally the core element of a successful weight
management programme, as the main aim of intervention is adoption of healthy
lifestyle habits for the whole family. The behavioural change component needs to
involve the whole family in order to achieve successful changes, provide support,
and be sustainable and applicable to the child. Targeting lifestyle treatments for
the parent or parent and child appear more effective than targeting the child
alone. Parental involvement in treatment of children with overweight or obesity
increases the likelihood of improvements in anthropometry (Oude Luttikhuis,
Baur et al. 2009). This is not surprising, since parents serve as role models and
determine their children’s physical and social environments (Ritchie, Welk et al.
2005). Depending on the age of the child, parents can be more or less involved
117
in the programme. For instance, programmes aimed at preschool and pre-
pubertal children should focus on parents, as they constitute the primary agents
of change within a family. Conversely, for pubertal and adolescent groups,
parents and children can attend common and/or separate sessions, but it is
important for the children to be engaged and actively involved in the process.
Peer contribution becomes central in adolescence, although school and friends
are also important for younger children. However, pre-adolescent children are
primarily influenced by their family in terms of behaviour and attitude. As many
parents of obese children are overweight or obese themselves, they may have a
history of repeatedly making unsuccessful attempts to change their own
behaviour. These factors make parental inclusion challenging for those designing
and delivering childhood obesity programmes.
Consequently, inclusion of parents is essential for a successful childhood obesity
intervention programme, especially for younger children (ADA 2006; NICE 2006;
SIGN 2010). Although crucial, parental involvement requires motivation and
commitment, which may not be present.
In summary, current recommendations state that there is limited evidence to
support the use of behavioural counselling alone for reducing overweight in
children or adolescents. However, there are sufficient indications to routinely
recommend the inclusion of a behaviour modification component within a
multicomponent, family-based group intervention, along with dietary counselling
and physical activity for reducing overweight in school-aged children.
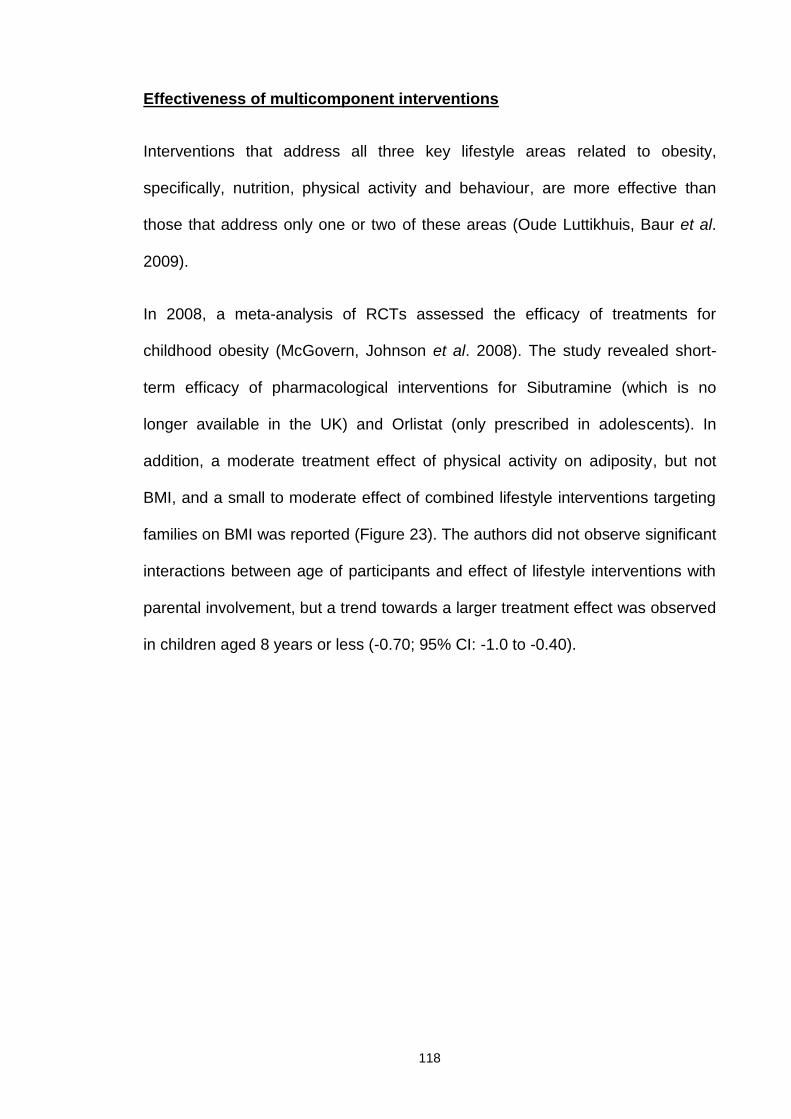
118
Effectiveness of multicomponent interventions
Interventions that address all three key lifestyle areas related to obesity,
specifically, nutrition, physical activity and behaviour, are more effective than
those that address only one or two of these areas (Oude Luttikhuis, Baur et al.
2009).
In 2008, a meta-analysis of RCTs assessed the efficacy of treatments for
childhood obesity (McGovern, Johnson et al. 2008). The study revealed short-
term efficacy of pharmacological interventions for Sibutramine (which is no
longer available in the UK) and Orlistat (only prescribed in adolescents). In
addition, a moderate treatment effect of physical activity on adiposity, but not
BMI, and a small to moderate effect of combined lifestyle interventions targeting
families on BMI was reported (Figure 23). The authors did not observe significant
interactions between age of participants and effect of lifestyle interventions with
parental involvement, but a trend towards a larger treatment effect was observed
in children aged 8 years or less (-0.70; 95% CI: -1.0 to -0.40).
119
Figure 23. Summary of meta-analysis results from RCTs of treatments forpaediatric obesity
Taken from McGovern, Johnson et al. (2008). Plot shows meta-analytic point estimates (▄) and95% CI (horizontal lines). SMD, standardised mean difference
A US evidence report analysed 20 studies conducted in children aged between 4
and 18years (Whitlock, O'Connor et al. 2008). Their results demonstrated that
comprehensive lifestyle interventions that included nutrition, physical activity and
behavioural components produced short-term improvements in weight. BMI
reduction of 1.9 to 3.3 kg/m2 over 6 to 12 months, respectively, was achieved,
compared with control group participants.
The most recent meta-analysis of childhood obesity interventions included trials
that specifically evaluated any combination of lifestyle (dietary, physical activity,
behavioural therapy), drug or surgical intervention, compared with no treatment
(Oude Luttikhuis, Baur et al. 2009). RCTs specifically designed to treat obesity in
120
children less than 18 years of age and included at least 6 months of follow-up
were included. The rationale for introducing this criterion arose from the
observation that many interventions appear effective in the short term (up to 3
months), but not the long term (Glenny, O'Meara et al. 1997). However, as
obesity is a chronic condition, evaluation of longer-term effectiveness is crucial.
The lifestyle interventions ranged in duration from 1 to 24 months, with 14 having
a duration of less than 6 months. The majority (29) of studies occurred in the
USA, while only 2 of the 54 were conducted in the UK. Thirty-seven studies were
conducted in children with a mean age less than 12 years, while the rest focused
on adolescents. Fifty-four lifestyle interventions were further subdivided into 3
categories: activity-based, dietary interventions and behavioural.
In children under 12 years, family-targeted behavioural lifestyle interventions led
to a greater reduction BMI z-score than standard care at 6 months follow-up. The
effect size was small (-0.06, 95% CI: -0.12 to -0.01), but statistically significant,
and possibly clinically relevant. In children 12 years and older, lifestyle
interventions were more effective than standard care in reducing BMI z-score at
6 and 12 months (effect size -0.14, 95% CI: -0.17 to -0.12 at 6 months and effect
size -0.14, 95% CI: -0.18 to -0.10 at 12 months).
This review highlighted the importance of a combined dietary, physical activity
and behavioural approach in pre- and post-adolescent weight management
interventions. One-third of the lifestyle intervention studies included in the review
reported measures of harm. However, no adverse effects on linear growth,
eating behaviour or psychological well-being were noted.
121
Influence of intensity of intervention in multicomponent interventions
The intensity of interventions, including the duration over which the intervention
is provided and frequency of contact between provider and participants, appears
to influence the success of childhood weight management programmes.
A meta-analysis of 20 studies in children showed that programmes incorporating
medium-intensity (26 to 75 contact hours) or high-intensity (over 75 contact
hours) intervention achieved greater BMI reduction than those with lower
intensity (Whitlock, O'Connor et al. 2008).
A similar meta-analysis of studies aimed to assess lifestyle interventions in the
management of overweight and obese adolescents (Collins, Warren et al. 2006).
Daily versus weekly frequency of contact between the provider and caregiver
was compared. Daily contact was associated with significantly greater weight
reduction than weekly contact at 6 months follow-up (average of 9% versus 5%
weight reduction, respectively).
A systematic review of 17 studies in 3,086 children and adolescents that
assessed the components of primary care interventions to treat childhood
overweight and obesity was recently conducted (Sargent, Pilotto et al. 2011). In
eight of the 17 studies, positive changes in anthropometry were observed,
including reduction in BMI between 0.8 kg/m2 and 3.3 kg/m2 and reduction in BMI
z-score between 0.10 and 0.11. The monthly rate of contacts in effective
interventions ranged from 0.2 (one contact in 6 months) to 11.3 (34 contacts in 3
months). The six interventions with a contact rate of monthly or less (rate < 2)
reported one to three significant outcomes in either anthropometry or behaviour
122
change. In contrast, each of the six effective interventions with higher intensity
(at least one contact every 2 weeks) reported two or more significant outcomes.
Overall, it appears that greater intervention intensity is likely to be an important
factor for predicting success following a childhood weight management
intervention. Unfortunately current evidence does not provide accurate guidance
on intensity of interventions.
Influence of the role of health education in multicomponent interventions
The majority of studies aiming to treat obese children incorporate a health
education component designed to promote understanding of the role of specific
elements of obesity management or teach children and/or their parents or carers
specific prevention and/or treatment strategies. Common topics include nutrition,
increasing physical activity, reducing sedentary behaviour and behavioural
change components.
The majority of studies have been conducted in clinic-based or community
settings, for e.g., schools and leisure centres (Oude Luttikhuis, Baur et al. 2009;
Sargent, Pilotto et al. 2011). In the clinic-based setting, health education is
generally delivered face-to-face to the parent or child with or without inclusion of
the child, with written materials used to reinforce key messages. In the school
setting, the child is usually the recipient of group-based face-to-face health
education. This may be supplemented with written material, including pamphlets
or a workbook. Health education can be provided by a broad range of health
care professionals, including dietitians, clinicians (e.g., GPs), school or practice
nurses, psychologists and teachers (including physical education teachers).
123
A systematic review of 22 school-based intervention studies (16 RCTs and 6
controlled clinical trials) involved over 6,997 participants (Li, Li et al. 2008). In
total, 17 studies were conducted among overweight and/or obese Chinese
children aged between 3 and 19 years. The majority of studies focused on
improving the level of knowledge, physical activity levels, and/or diet of
overweight children and adolescents. Four studies used an intervention focusing
on health education, two on health education and physical activity, seven on
health education, physical activity and diet, three on physical activity alone, and
the remaining six on physical activity and diet. The majority of investigations
reported improvement in one of many outcomes. However, there were major
methodological weaknesses that did not allow direct comparisons, as different
measures for intervention effectiveness were used across studies (Li, Li et al.
2008).
Another meta-analysis that included a number of primary studies assessing
health education was performed in the US in 2007 (DeMattia, Lemont et al.
2007). The first study reported the results of a RCT testing a 2-year curriculum to
promote healthy eating and limit television watching in preschool children. BMI
decreased in the intervention group and increased in the control group. Point
estimates were not provided. However, the differences did not reach statistical
significance. Television viewing decreased by 24% and increased by 12% in the
intervention and control groups, respectively. A second study reported the results
of an 18-lesson, 6-month classroom curriculum for 8 to 10-year olds to reduce
screen time. At follow-up, BMI of the treatment group increased by 0.3 kg/m2
versus 0.7 kg/m2 in the control group. A third study provided health education
over 2 years in students from Grades 6 to 7. Excess body weight decreased from
124
24% to 20% in the intervention group and increased from 22% to 24% in the
control groups.
In summary, these studies collectively demonstrate that the degree to which the
health education component is responsible for improvements in outcomes of
multicomponent interventions is uncertain. As a stand-alone intervention, patient
education is not usually associated with significant weight reduction. Currently,
insufficient evidence is available to recommend a specific type of education or
provide guidance on the most effective setting or format for education or
frequency of sessions.
Influence of parental involvement in multicomponent interventions
Despite the well-reported positive effects of parental involvement in childhood
obesity treatment programmes, more recent research has begun to incorporate
parental perception of child overweight as a key variable in determining the
family's readiness to modify the child's environment and lifestyle (Doolen, Alpert
et al. 2009; Tschamler, Conn et al. 2010).
In younger age groups, increased weight is often dismissed by parents who
believe that the child is either well-fed or will grow leaner with age. At a young
age, weight management is more preventive than interventional. However, the
need exists for establishing healthy eating and activity habits as early as
possible, as habits acquired at a young age tend to persist in later childhood and
adolescence. Parents of overweight and obese children commonly
underestimate their child's weight status. This is especially true for at-risk
populations and boys, possibly due to social norms that "allow" males to be
125
larger than females, but require females to be slim to gain social acceptance
(Doolen, Alpert et al. 2009).
The underlying reasons of this phenomenon have not yet been specified, and
most available evidence is based on theory, rather than solid scientific data. In a
study, results from a focus group were assessed in an effort to understand the
causes underlying the observed discrepancy between perceived and actual
weight status of children. Possible reasons include parental mistrust of growth
charts, often perceived as having little relevance to their child, limited
understanding of the real definition of overweight (for instance, the belief that
only severely obese children belong to this category), and fear of being judged
as bad parents or their child being stigmatised and labelled as "fat" (especially
for younger ages) (Jain, Sherman et al. 2001). Another possible explanation is
that the increasing prevalence of childhood obesity has caused confusion in
terms of what may be normal and higher than normal, hence leading parents to
judge their overweight child as 'normal' by comparison to their (also overweight)
counterparts (Young-Hyman, Herman et al. 2000). Parental denial, "optimistic
bias" (i.e., the tendency to view things more optimistically than one should),
cultural beliefs, and low education and/or socioeconomic status are additionally
thought to contribute to this phenomenon (Doolen, Alpert et al. 2009).
Screening programmes organised to identify at-risk children at schools often do
not communicate the message of childhood overweight and obesity in a
culturally appropriate way, therefore failing to increase awareness in ethnic
minority groups that are disproportionally affected by increased adiposity
(Fitzgibbon and Beech 2009).
126
Influence of group versus individual treatment
Another important consideration when developing childhood weight management
interventions is group versus individual treatment, which has been extensively
researched (Braet and Wydhooge 2000; Kalavainen, Korppi et al. 2007;
Garipagaoglu, Sahip et al. 2009).
Group interventions have more therapeutic benefits and are more cost-effective
than individual treatments (Barlow 2007). For this reason, this model is widely
used in research-based childhood obesity treatments (Braet and Wydhooge
2000; Goldfield, Epstein et al. 2001; Epstein, Paluch et al. 2007; Kalavainen,
Korppi et al. 2007; Garipagaoglu, Sahip et al. 2009).
Community group interventions have also been shown to be effective in the
treatment of other childhood problems, such as disruptive behavioural disorders
(Cunningham, Bremner et al. 1995). Importantly, group-based interventions not
only improve outcomes on target variables, but also have the potential to provide
additional therapeutic outcomes (Robinson 1999; Barlow 2007).
More precisely, community group interventions are more beneficial in a number
of areas, since they: i) provide greater access to families from minority groups,
as venues are more convenient and travel expenses for attending are reduced,
ii) counter the stigma and participation barriers often associated with individual
sessions in a hospital, iii) extend limited resources, and therefore have the
potential to reach a greater number of children, and iv) facilitate improved
outcomes and maintenance of behaviours (Cunningham, Bremner et al. 1995).
A review of behavioural treatments for childhood and adolescent obesity showed
that group treatments are more effective than individual treatment sessions.
127
Group interventions were established as being more efficient, providing greater
therapeutic interactions between participants, improved attendance rates, and
higher cost-effectiveness (Robinson 1999; Goldfield, Epstein et al. 2001).
Interestingly, a recent study examining whether individualised counselling by a
dietitian trained in behavioural changes aids in managing childhood obesity
disclosed no effects on BMI reduction (Hughes, Stewart et al. 2008).
The clinical benefits of community groups include group discussion of problem-
solving processes, which enhances understanding of management of the
presenting problem, group discussion of goals and homework improving
adherence (Meichenbaum 1987; Pedrosa, Oliveira et al. 2011), and the
development of social support networks (i.e., links with other families and
community resources), which can be utilised after programme completion
(Cunningham, Bremner et al. 1995).
However, group-based treatment may not be appropriate for all obese children.
Some children may have complex medical and/or psychosocial needs, which
cannot be adequately dealt with in a group environment. These types of families
require specialist individualised care and support. In addition, some childhood
obesity interventions are provided directly to families by non-specialist staff, for
e.g., health trainers with no specialist medical or psychosocial knowledge or
treatment skills (Rudolf, Christie et al. 2006). Moreover, some families prefer the
privacy afforded by individualised treatment and fail to engage with group-based
interventions.
In conclusion, both group-based and individualised treatment options should be
available to meet the needs of all families with overweight or obese children.
128
Influence of the role of GP delivery in multicomponent interventions
In a study published in BMJ, an Australian research team conducted a GP-
delivered intervention programme. This RCT with 258 paediatric participants
(aged 5 to 9 years, BMI z-score < 3) assessed a GP-based family orientated
lifestyle intervention for weight loss (Wake, Baur et al. 2009). GPs attended two
2½-hour group training sessions for instruction in stages of change and training
in brief, solution-focused family therapy, and received a 30-minute DVD, which
role-modelled scenarios using solution-focused therapy in consultations. Each
GP conducted two simulated patient sessions appraised by an actor playing the
role of the ‘parent’. GPs who did not receive a pass grade were offered additional
training. The intervention involved four standard consultations over 12 weeks
targeting changes in lifestyle, supported by purpose-designed written materials.
Control group participants did not receive any intervention. Subjects in both
groups did not display reduced BMI or improvement in anthropometric indices.
After 12 months, adjusted mean difference in BMI between intervention and
control groups was -0.11 kg/m2 (95% CI, -0.45 to 0.22).
Another RCT involved 163 participants aged 5 to 9 years (BMI z-score < 3)
randomised to education materials and four standard GP consultations over 12
weeks targeting nutrition, physical activity and sedentary behaviour or a control
group (McCallum, Wake et al. 2007). GPs received an education package
regarding delivery of the intervention, comprising three evening group sessions
on brief solution-focused therapy techniques. This approach was used by GPs to
set and record appropriate, healthy lifestyle goals with the family, assisted by a
written, personalised 20-page behaviour change resource designed at a 12-year
old reading level. However, the intervention did not result in weight loss in either
129
the intervention or control groups. BMI z-score from baseline to 15 months
decreased by 0.03 (95% CI: -0.17 to 0.10).
Studies examining the role of GPs are important, as doctors are responsible for
the primary health care of children and potentially play a very important role in
effective management of the childhood obesity epidemic. Therefore, the GP
practice is the most sensible place to assess children's weight status in the
presence of parents (McCallum, Wake et al. 2007; Wake, Baur et al. 2009).
Parents often seek or accept advice from their doctor and take their opinions
seriously. Accordingly, doctors need to be appropriately trained to assess
childhood obesity and communicate with families in order to offer feasible
solutions (Lumeng, Castle et al. 2010). Another limitation of the GP-led approach
is that GP practices often lack the resources to provide systematic and multi-
disciplinary support to families with obese children. However, with appropriate
networking, GPs may be able to liaise with other health or non-health
professionals to offer solutions that effectively help families address weight
problems in their children. As a stand-alone intervention, clinician education does
not appear to significantly improve patient outcomes, and remains an important
area for further research.
Effectiveness of UK multicomponent trials
Four RCTs have been conducted in the UK to evaluate the effects of 4 different
interventions for treating childhood obesity (Hughes, Stewart et al. 2008; Ford,
Bergh et al. 2009; Sacher, Kolotourou et al. 2010; Croker, Viner et al. 2012).
Three of these will be reviewed in detail, and the fourth presented and discussed

130
as part of this PhD thesis (Sacher, Kolotourou et al. 2010). An additional
intervention, designated WATCH IT, has been developed and assessed in the
form of a process evaluation, with a future RCT planned (Rudolf, Christie et al.
2006).
A number of investigators aimed to test the generalisability of the most widely
cited intervention (FBBT: Family-Based Behavioural Treatment) originally
developed in the USA to target families with obese 8 to 12-year olds (Epstein,
Valoski et al. 1994; Croker, Viner et al. 2012). The generalisability of the efficacy
of FBBT is uncertain, as previous studies have been conducted in academic
settings and no other RCTs are available for FBBT evaluation. Therefore, Croker
and co-workers examined the acceptability and effectiveness of FBBT in an
ethnically and socially diverse group of children in a UK children’s hospital (Great
Ormond Street Hospital for Children NHS Trust).
FBBT is a structured intervention comprising advice on whole family lifestyle
change with a behavioural weight control programme for the obese child.
Children attend with one parent or carer, with a maximum of 8-10 families per
group. The aims of FBBT are to reduce fat and energy intake, increase physical
activity and change parent-child interactions. The behavioural programme is
based on the social learning theory and employs behaviour modification
techniques, such as self-monitoring (daily food and activity diaries), goal setting,
positive reinforcement, stimulus control, and relapse prevention. In the study by
Crocker et al. (2012), parents were instructed in behaviour management
principles to support their child’s behaviour change and make changes to the
home environment to encourage family-wide uptake of healthy lifestyle
behaviours. Cognitive components of the programme included advice on
131
managing teasing and general problem-solving. The key dietary targets were to
follow a regular eating pattern, reduce snacking to no more than two occasions
per day, and consume a balanced diet (as described in Section 3.5.1, the
‘Eatwell plate’) (DH 2011) and the ‘Traffic Light’ system (Epstein 1996) in
appropriate quantities. Key physical activity targets were to reduce time spent in
sedentary behaviours and increase time spent in lifestyle or structured activity, in
keeping with the current UK recommendation of 60 minutes a day (O'Donovan,
Blazevich et al. 2010). The authors delivered the FBBT as described by Epstein
and colleagues, with minimal adaptation for use with British families (Epstein
1996).
The intervention consisted of 15 x 1.5 h sessions delivered over 6 months (10
weekly, 3 fortnightly, 2 monthly). Children and parents were split into two groups.
Interventions to the parent groups were delivered by clinicians with experience
working with parents and families (psychologist, family therapist or experienced
dietitian) and to the children’s groups by a dietitian experienced in working with
children as well as a research assistant.
The primary outcome of the trial was BMI z-score at 6 months. Secondary
outcomes included waist circumference z-score, body composition and self-
esteem. Children in the treatment group only were followed up at 12 months.
Thirty-seven children (mean BMI z-score = 3.2 ± 0.6) were allocated to the
intervention group. However, 15 (41%) of the children dropped out and were lost
to follow-up. Overall, 43% of children were non-white, with significantly more girls
than boys (70:30). The median number of sessions attended was 9 (IQR 10.5).
No significant differences were recorded between groups for BMI z-score, waist
circumference z-score, cardiovascular or psychosocial outcomes. Within-group
132
analysis revealed marked reductions in BMI z-score for both groups
(intervention: -0.11, control: -0.10). No overall change in BMI z-score at 12
months follow-up was observed, possibly due to significant weight gain between
6 and 12 months (+5.7 kg). These results are inconsistent with the conclusions of
the Cochrane review, which showed a significant pooled treatment effect of -0.06
BMI z-score from behavioural interventions, compared to controls (Oude
Luttikhuis, Baur et al. 2009). The author’s explanations for the reduced effect of
the intervention, compared to other evaluations of FBBT, included minor
changes to the programme, for e.g., elimination of daily weighing, replacement of
calorie goals with those on food types and portion size and lack of incentives for
participation. The group additionally suggested that some differences can be
explained by ethnically diverse samples and the clinical setting, in comparison to
many of the other academic settings. The results of this trial raise issues over the
generalisability of FBBT and the use of expensive treatment when other less
expensive options are available.
Researchers at the Bristol Care of Childhood Obesity Clinic (COCO) evaluated
the effect of a novel eating device, known as the Mandometer, compared with
standard care in the clinic in children aged 9 to 17 (Ford, Bergh et al. 2009). The
Mandometer was developed at the Section of Applied Neuroendocrinology and
Mandometer Clinic, Karolinska Institutet, Stockholm, Sweden. This is a portable
weighing scale connected to a small computer that can generate a graph
representing food removal from the plate. The user puts a measured portion of
food determined by a therapist on the scale and the computer records and
displays weight loss from the plate as the user eats in real-time graphics.
Removal of food from the plate generates a gradually developing line on a
screen that can be compared and matched to a pre-set eating line displaying the
133
speed at which the therapist wants the user to eat. Deviation from the training
line by eating too quickly or slowly elicits a spoken request from the Mandometer
to slow down or eat faster. At regular intervals, a rating scale appears on the
screen, and the user rates their level of fullness from 0 (no satiety) to 100
(maximum satiety), which yields “development of satiety” curve and allows
comparison of the development of fullness to a “normal” fullness curve again pre-
set on screen. During training, the user gradually adopts a more normal pattern
of eating and satiety by following these training lines and curves. The
Mandometer was originally developed for treating eating disorders, such as
anorexia and bulimia nervosa, but in this publication, it was evaluated as a
method for increasing satiety by reducing eating speed and therefore decreasing
energy intake.
Children above the 95th BMI centile with no underlying medical problems were
eligible for the study. Children in the intervention group saw a specialist
Mandometer nurse once a week for 6 weeks, every second week for a further six
weeks, and once every sixth week thereafter (a total of 15 individual
appointments). In addition, the research nurse telephoned the children to offer
support and encouragement every second week from week 12 onwards.
Children also received four dietetic consultations from a paediatric dietitian plus 3
clinician visits. Children in the control group were offered four appointments with
a multidisciplinary team consisting of a clinician, paediatric dietitian and an
exercise specialist. The primary outcome was change in BMI z-score at 12
months, with further follow-up at 18 months (no contact with clinical staff
between 12 and 18 months). The study was powered for 40 children in each
group, and 106 participants were recruited. Mean age at baseline was 12.7 years
(±2.2) and mean BMI was 34.4 (range: 24.2 to 46.6) (BMI z-score not provided).
134
Ninety-three of the children were classified as white. Assessment of 91 children
at 12 months revealed that those in the intervention group had a significantly
lower mean BMI z-score (-0.27, 95% CI: -0.14 to -0.41). This significant
difference was sustained at 18 months (BMI z-score -0.27, 95% CI: -0.11 to
-0.36). Children in the intervention arm reduced their speed of eating by 11%,
compared to a gain of 4% in the control group. Measures of quality of life
improved in both arms of the study, with no reported adverse events. Mean
attendance of the 15 appointments was 83% for children in the intervention
group, with 86% retention at 12 months.
The positive effects of the study suggest that modification of eating behaviours
offers additional benefits to standard lifestyle modification in treating childhood
obesity. However, it is worth noting that there was significant contact time
between research and/or clinical staff and participants. Some evidence suggests
that treatment intensity affects outcomes in weight loss interventions (Digenio,
Mancuso et al. 2009). Another important consideration not discussed in the
publication is the cost-effectiveness of this intervention using novel technology. It
is assumed that the cost of clinical care plus the Mandometer may not allow this
type of clinical intervention to be offered to many obese children considering the
current financial climate in the UK, but nonetheless, provides an innovative
promising approach.
Hughes and colleagues (2008) designed a behavioural intervention based on
recommendations from systematic reviews and expert committee guidance
(Barlow and Dietz 1998; Hughes, Stewart et al. 2008). The intervention was
designed to treat obese children within a UK health care setting (Royal Hospitals
for Sick Children in Glasgow and Edinburgh) with limited resources (e.g., staff
135
and time) using a family-centred approach combined with behaviour change
techniques. The trial, designated SCOTT (Scottish Childhood Overweight
Treatment Trial), was the first RCT in the UK to implement best practice
recommendations in a relatively low-intensity office-based setting using a single
health professional.
The study was designed to test the efficacy of the intervention, compared to
standard dietetic care (control group), in reducing BMI z-score in obese children
between 5 and 11 years of age. The intervention was delivered individually to
families by an experienced paediatric dietitian trained in behaviour change
counselling. Families received 8 appointments (7 outpatient visits and 1 home
visit) over 26 weeks, with a total patient contact time of 5 hours. The programme
included dietary advice using a modified traffic light diet and guidance on how to
increase physical activity and restrict sedentary behaviours. Full details of the
intervention have been published previously (Stewart, Houghton et al. 2005).
Table 4 provides a summary of the intervention, compared to control (standard
care).
Table 4. Comparison of best-practice individualised behaviouralintervention with standard dietetic care used in the SCOTT trial
Taken from Hughes, Stewart et al. (2008)
136
One hundred and thirty-four children (BMI z-score = 3.3, IQR: 2.8 to 3.6) were
randomly assigned to the intervention or control group (powered for 34 per
group, based on a between-group difference of -0.25 in primary outcome, i.e.,
BMI z-score at 6 months). Overall, 72% of children were measured at 6 months
and 64% at 12 months. A proportion (68%) of participants assigned to the
intervention group complied with the treatment, which was defined as attendance
at ≥ 75% of appointments. Moreover, 70% of those assigned to the control group
attended ≥ 75% of their appointments. BMI z-score decreased significantly within
groups from baseline to 6 months (intervention: 95% CI: -0.18 to -0.07; control
95% CI: -0.16 to -0.03) and baseline to 12 months (intervention: 95% CI: -0.22 to
-0.04; control: 95% CI: -0.26 to -0.08). There were no significant differences
between groups for BMI z-score at 6 (0.03, 95% CI: -0.05 to 0.11) and 12
months (-0.04, 95% CI: -0.17 to 0.07). Analysis of secondary outcomes revealed
no significant between-group changes for waist circumference at 6 or 12 months,
compared to significant between-group differences for physical activity levels and
sedentary behaviours at 6 months only. Changes in quality of life scores for the
child self-report and parent proxy report were not significantly different.
Results from this study highlighted that when treatment for childhood obesity is
provided individually in a clinical setting using well-trained staff, outcomes are
unsatisfactory. Clinical settings, such as hospitals, may medicalise the problem
and therefore disempower families from making the necessary lifestyle changes.
Similar results were obtained with the LEAP trial in Australia when GPs provided
advice on nutrition, physical activity and sedentary behaviours (McCallum, Wake
et al. 2007). These studies highlight the need for more intensive, group-based
interventions that may be more suitably delivered in non-medical settings.
137
Rudolf and co-workers (2006) conducted an evaluation of the WATCH IT
intervention in a socially disadvantaged areas of Leeds, UK (Table 5) (Rudolf,
Christie et al. 2006). The WATCH IT intervention is a multicomponent lifestyle
programme including counselling (motivational and solution-focused approach),
provision of physical activity, reduction of sedentary behaviours, healthy eating
advice and appetite regulation. The programme has three components: weekly
individual family appointments (30 minutes) for encouragement, support and
motivational counselling, weekly one-hour group physical activity sessions (it is
unclear whether parents are included), and group parenting sessions
(presumably while children are exercising alone). Parents are a key target of the
intervention, which lasts for 3 months to 1 year. The intervention was delivered
by health trainers with ongoing support and supervision from a multidisciplinary
team, including a dietitian and psychologist.
Ninety-four children participated in the intervention. Pre- and post-longitudinal
data were available for 68 (72%) children at 3 months and 48 (51%) children at 6
months. At 3 months, 54% children, and at 6 months, 71% children displayed a
decrease in BMI z-score. Change in mean BMI z-score at 3 months was -0.01
(SD 0.12, p > 0.05). By 6 months, mean BMI showed a significant decrease
(mean change -0.07, SD 0.16, p = 0.01). The mean change in BMI z-score at 6
months was greater for girls (-0.07, SD 0.14, p = 0.02) and participants aged 13
years or over (-0.13, SD 0.14, p = 0.01). The authors confirmed that funding was
available to conduct a randomised controlled trial, which is crucial for
determining the efficacy of this intervention.
In summary, systematic reviews (Collins, Warren et al. 2006; Whitlock, O'Connor
et al. 2008; Oude Luttikhuis, Baur et al. 2009; SIGN 2010) demonstrated that
138
earlier RCTs evaluating childhood obesity trials had methodological flaws, such
as small sample sizes, high dropout rates, short-term follow-up, lack of detail
about the randomisation process, lack of blinding, and failure to use intention-to-
treat analysis. Intensive behavioural treatment programs have proved successful
in clinical studies from one centre in the USA (Epstein, Valoski et al. 1994).
However, these interventions were intense, requiring a number of specialist
health professionals, and therefore may not be generalisable to all health care
systems. Importantly, a specialist multidisciplinary team recently failed to
replicate these findings in a UK setting (Croker, Viner et al. 2012). Another UK
trial has also failed to show significant reductions in childhood weight status
(Hughes, Stewart et al. 2008), and therefore, high-quality studies that establish
more generalisable interventions to treat childhood obesity are urgently required.
Table 5 provides a summary of selected UK and international interventions and
additional trial details.
139
Table 5. Comparison of childhood obesity weight management interventions
Organisation,country, study
design
Target group,attendance
and retention
Format / intervention design, intensity Delivery details Content /professional time
Comprehensivenessand
outcomes / evidenceSkill level Number ofstaff
Delivery site
PEACH (Parenting,Eating and Activityfor Child Health)
Sydney andAdelaide, Australia
RCT comparingparenting skills plushealthy lifestyleeducation versushealthy lifestyleeducation alone.
(Golley, Magarey etal. 2007)
5 – 9 yearsoverweight orobese(exclusion BMIz-score >4)
N = 111
12 – 14parents pergroup
83 - 69%retention rateat 12 and 24months.
‘Parents only’ intervention.
Nutrition information, problem solving approach for the wholefamily, not individual child.
Children offered supervised physical activity (PA) as a childcareoption but not considered part of intervention.
Healthy Lifestyle (HL) + Parenting4 x 2 hours (hrs) healthy lifestyle sessions + 8 parentingsessions90 min. fortnightly then tapered to monthly over 7 months.+ 4 telephone support calls per childTotal time = 20 hrs + phone calls
HL only8 sessions90 min fortnightly then tapered to monthly over 6 months+ 4 x15 min support calls per childTotal time = 12 hrs + phone call
Conducted bydietitians whohad completedaccreditedparenting skillstraining in TripleP.
Triple P trainingconsists of 3day course.
1 – 2 perprogramme
(+ PAleaders forchild care)
Paediatric unit ofFlinders MedicalCentre +WestmeadHospital,Sydney.
Space donatedby the hospitals.
Content time
20 hrs + phone calls
OR
12 hrs + phone calls
BMI Z score results:HL + Parenting2.77±0.58 at baseline2.48±0.70 at 6 months2.46±0.65 at 12 months2.38±0.67 at 24 months
HL only2.68±0.65 at baseline2.46±0.70 at 6 months2.44±0.71 at 12 months2.26±0.84 at 24 months
10% relative weight lossachieved andmaintained at 2 years forthe HL + P programme.
BMI z-score change:-0.09
Dietitians, nofurther trainingrequired.
Professional Time
40 hrs or 24 hrs+ PA leaders time+ Triple P training time+ phone callsIntensity level ofintervention:
Moderate intensity.

140
Organisation,country, study
design
Targetgroup,
attendanceand retention
Format / intervention design, intensityDelivery details Content /
professional timeComprehensiveness
andoutcomes / evidenceSkill level Number of
staffDelivery site
HIKCUPSHunter & IllawarraKids Challengeusing ParentSupport
Newcastle andWollongong inNSW, Australia
RCT comparing 3formats of delivery.PRAISE vs. SHARKvs. combination ofboth.
(Okely, Collins et al.2010)
6 – 9 yearsoverweight orobese(exclusion BMIz-score >4)
Total sample216 children atinitial, 165 at12 months.
108 per site,36 childrenper group.
64% retentionrate at 12months
PRAISE –PositiveReinforcement andIncentives for Smart Eating.-Parent centered dietarymodification programme-Parent only-26 week programme +follow-up (F/U)
10 week core curriculum –2hrs sessions
16 week follow upcurriculum, parent led athome.
2 x 2 hrs sessions at 26weeks and 2 months withfacilitator
Telephone follow up callsmonthly, 3 months post 26weeks.
SHARK – Skills Honing &Active Recreation for Kids.-Child centered physicalactivity-Skill development programmeChild only-26 week programme + F/U
10 week core curriculum – 2hrssessions+ weekly homework challenge
16 week follow up curriculum,parent led at home.2 x 2 hrs sessions at 26 weeksand 2 months with facilitator
Telephone follow up callsmonthly, 3 months post 26weeks.
In RCT PRAISEsessions led bydietitians andSHARK PAleaders were PEteachers.
5 day trainingrequired toqualify assession leaders.
2 leadersperprogramme.
1 x trainedfacilitator1 x physicalactivityspecialist
Universitycampuses ofNewcastle andWollongong.
But programmedesigned forimplementationin communitysettings such asschools, healthand leisurecentres.
Content Time
Combinedprogramme SHARK+ PRAISE= 44 hrs + phonecalls.
Baseline to 12monthpublished results.
Results across all groupsat 12 months:BMI z-score decreased2.81±0.71 to 2.45±0.69 (p<0.001)
Energy intake decreased261±108 kJ/kg to 204±69kJ/kg (p < 0.001)
LDL/HDL decreased2.08±0.64 to 1.99±0.64(NS)
Waist circumference nochange (76.6±9.4cm to76.2±9.7cm (p = 0.11)
No significant differencebetween the 3 formats.
BMI z-score change:-0.32
Professional Time
88 hours of directprofessional time.
+ 5 day training time
Intensity Level ofIntervention:
Moderate intensity
141
Organisation,country, study
design
Targetgroup,
attendanceand retention
Format / intervention design, intensityDelivery details Content /
professional timeComprehensiveness
andoutcomes / evidenceSkill level Number of
staffDelivery site
Golan et al.
Israel.
Parent onlysessions vs.parents and theirchild.
(Golan, Kaufman etal. 2006)
6 – 11 years
32 families
BMI >85th
percentile.
Retention notreported
16 x 1 hour education sessionsInitially weekly for 10 weeks, then 4 sessions deliveredfortnightly, the last 2 sessions once per month.+ 40 – 50 min. one to one appointments held monthly for eachfamily.
Total intervention time 6 months
Both programmes covered same content, but parent + childprogramme was adapted to include child in activities.
Family based, but with parents providing authoritative direction.Content emphasized healthy eating habits, and increased PAand a decrease in sedentary activities.
DietitianFamily therapist
2 persession
Unknown Content Time
24 hours
Results published at 6, 12,18 months
Parent only group:mean BMI z-score changeof -0.4 (P <0.05)9.5% reduction inoverweight.
Parent and Child group:mean BMI z-score changeof 0.1 (NS)2.4% reduction inoverweight.
BMI z-score change:-0.30
Professional Time
46 hours
Intensity Level ofIntervention :
Low intensity
Traffic Light Diet
RCT comparingParent only (PO)vs. Parent + Child(P+C)
Minneapolis andSan Diego,USA
(Boutelle, Cafri etal. 2011)
8 – 12 yrs
80 familiesacross 5groups
BMI >85th
percentile.
PO retentionat 6 months60%; P+Cretention at 6months 70%
Based on behavioral treatment intervention developed byEpstein et al.(Traffic Light Diet)
Total intervention time 5 months
Parent and Child – 2 x 1hr sessions delivered to child andparent separately.+ weekly 10 minutes per family one to one sessions for goalplanning
Parent only – 1 hour sessions
Group sizes 6 -10 participants
Clinicalpsychologists oradvancedclinicalpsychologystudents.
All leaderscompleted 3 daybehavioralinterventiontraining.
2 persession
University ofMinnesota andUniversity ofCalifornia
Content Time
30 hours
Parent only results for BMIz-scoreBaseline 2.29±0.385 months 2.16±0.5411 months 2.10±0.68
Parent + child results forBMI z-scoreBaseline 2.25±0.345 months 2.06±0.4011 months 2.08±0.41
BMI-Z change: -0.17
Professional Time
60 hours
Intensity Level ofIntervention :
Moderate intensity
142
Organisation,country, study
design
Targetgroup,
attendanceand retention
Format / intervention design, intensityDelivery details Content /
professional timeComprehensiveness
andoutcomes / evidenceSkill level Number of
staffDelivery site
Lifestyle Triple PPositive ParentingProgramme
The University ofQueensland.
RCT in 2003-06compared 12 weeksof intervention withcontrol group.
(West, Sanders etal. 2010)
5 – 10 yrs
(RCT samplewere 4-11 yrsold, 101families intotal).
Self-referral
Retention notreported
Parents only intervention/ prevention programme
Total intervention time 4 months.
16 sessions – 10 group sessions of 90 mins. delivered weekly,followed by 6 telephone sessions with 15-30mins individualphone calls, fortnightly.
Children attend session 1 and 16 for measurements, PAfocused games are played at these two sessions.
Group sizes 8 – 10 families
Informative presentations centered on new nutritionalknowledge and parenting skills are delivered, followed by groupdiscussion, role plays, group problem solving and role modelingexercises.
Sessionsdelivered by aclinicalpsychologistwith Triple Ptraining.
Proposeddelivery team ofhealthprofessionalswith Triple Ptraining, withsupport staffwith nutrition,PA background.
Moderate – highskill level
1 mainfacilitatorplus supportstaff.
RCT sites usedwere primaryschools,teachinghospital, anduniversity clinic.
Content Time
18 hours
Measurements taken atbaseline, 12 weeks and 12month follow up.
Other outcomes; self-reported checklistsmeasured parenting skillsand self-efficacy, as wellas lifestyle behavior scale
BMI z-score change:-0.19
Professional Time
45 hours
Intensity Level ofIntervention :
Low intensity
Watch it
Leeds, UK
Evaluation of pilotphase, prior to RCTto assess clinicaleffectiveness.
(Rudolf, Christie etal. 2006)
8 – 16 yrs,mean age12.2
94 children
BMI >98th
percentile
Self-referral orhealthprofessionalreferral.
77% retentionat 3 months.
Community based ‘clinics’, across 8 sites.Developed from HELP programme.
Weekly individual appointments, 30mins with child and parent –using HELP manual.+ weekly group sessions for 60 mins.+ weekly parent only group sessions (implemented later)+ weekly 60 mins. physical activity sessions.
Total intervention time 3 months, with option to renew each 3months for one year.
“Trainers” noprofessionalqualificationsbut trainedHELP content.
Recruited forpersonalqualities andcommunicationskills.
Supervised bydietitian andpsychologistmonthly, andinput for apaediatrician asneeded.
Minimum of2 per clinictime + PAtrainers.
Local sports andcommunitycentres, afterschool.
Available 4 daysa week 3.30 –6.30pm
Content Time
Minimum of 30hours
Qualitative outcomes;Evaluation by surveyingstaff and conducting afocus group discussionwith user families.
Quantitative outcomes;change in BMI Z score.Baseline 3.09±0.453 months 3.08±0.12 (NS)6 months 3.02±0.16 (p<0.001)
BMI z-score change:-0.07 (6 months)
Professional Time
72 hours
Intensity Level ofIntervention :
Moderate intensity

143
Organisation,country, study
design
Targetgroup,
attendanceand retention
Format / intervention design, intensityDelivery details Content /
professional timeComprehensiveness
andoutcomes / evidenceSkill level Number of
staffDelivery site
Reinehr et al.
Investigating thechanges in weightstatus (BMI z-score)and CVD riskfactors, 12 monthspost intervention.
Germany
(Reinehr,Temmesfeld et al.2007)
6 – 14 yrs
203 children
BMI >97th
percentile.
86% retention
Obeldicks outpatient programme.3 phases of intervention;Intensive phase – 3 months, 90 mins. sessions fortnightly over6 sessions, child only. Nutrition and behavior change focus.+ parents attended 6 x parent only sessions.Total intervention time 12 months.+ Weekly exercise sessions
Establishing phase – 6 months, 6 x 30 mins. individualpsychology sessions, 1 per month.+ weekly exerciseWeekly exercise sessions then continued for the entire 12months.
Total intervention time 12 months.
High level ofskill required.
Unknown Hospitaloutpatientdepartment
Content Time
52 hours
BMI z scoresBaseline 2.412 months 2.124 months 2.1Change -0.3 andmaintained over 2 years.
Also measured systolicand diastolic BP, lipidprofile, glucose and insulinlevels.
BMI z-score change:-0.30
Professional Time
52 hours
Intensity Level ofIntervention:
Moderate intensity
144
Effect sizes required for clinical significance
While the core elements of successful childhood obesity interventions are generally
agreed on (ADA 2006; NICE 2006; SIGN 2010), there is less consensus about the
parameters by which such interventions should be judged as clinically effective.
Since childhood obesity affects several body functions and systems, markers that
reflect this diverse range should be applied for evaluation of interventions. Apart
from anthropometry, the most common markers relate to cardiovascular health (e.g.,
lipid profile, blood pressure), metabolic functioning (e.g., insulin resistance),
psychological wellbeing (e.g., self-esteem) and behaviour (e.g., diet and physical
activity).
As discussed, anthropometric measures, such as BMI z-score and waist
circumference, are reliably associated with adiposity and other indices of obesity-
related health impairment, and therefore widely used to evaluate the impact of
childhood obesity interventions. Associations between the degree of BMI z-score
change and markers of metabolic and cardiovascular health have been examined in
an attempt to establish thresholds at which an intervention can be claimed as
clinically effective (Reinehr and Andler 2004; Reinehr, de Sousa et al. 2006; Hunt,
Ford et al. 2007; Ford, Hunt et al. 2010). Reinehr et al. (2004) showed that weight
loss following an outpatient childhood weight management programme in Germany
was associated with improvement in the atherogenic profile and insulin resistance
when BMI z-score decreased by at least 0.5 over a one-year period. In the UK, Ford
and colleagues reported similar results, but also found significant improvements in
body fat and insulin sensitivity at a lower BMI z-score reduction (-0.25). The group
further suggested the use of this score as the minimum threshold for evaluating
clinical effectiveness (Ford, Hunt et al. 2010).
145
The BMI z-score is undoubtedly valuable and constitutes an important tool for the
assessment of childhood obesity interventions. However, the reliability of a BMI z-
score threshold as a sole measure of an intervention's effectiveness may be
unsatisfactory. The threshold of -0.25 was primarily defined by association with
metabolic health parameters, which while important, represent only one of many
body systems affected by obesity. Several interventions in the published literature
have reported smaller BMI z-core reductions and achieved significant improvements
in other parameters, such as quality of life, behaviour, self-esteem and physical
activity levels (Hughes, Stewart et al. 2008; Farpour-Lambert, Aggoun et al. 2009).
Indeed, additional health benefits affecting children's eating and activity habits,
psychology and family functioning have been observed in individuals who do not
achieve greater than -0.25 BMI z-score changes (Kirk, Zeller et al. 2005; Nowicka,
Pietrobelli et al. 2007; Cummings, Henes et al. 2008; Kolsgaard, Joner et al. 2012).
Guidelines for management of childhood obesity
Evidence-based guidelines are crucial for the management of childhood obesity.
Treatment of obesity in childhood shares the same fundamental principle as that for
adult obesity, i.e., decrease in energy intake and increase in energy expenditure.
However, the primary goal of treatment (i.e., weight reduction or deceleration of
weight gain) and recommended mode of intervention are variable, dependent on the
child’s age and initial level of overweight, amongst other considerations.
To assist clinicians in determining the most appropriate form of treatment, paediatric
weight management guidelines exist in many countries, with a view to promoting

146
best practice. However, at present, many of these recommendations are based on
low-grade scientific evidence (Oude Luttikhuis, Baur et al. 2009).
Comprehensive international paediatric weight management guidelines have only
been published in recent years (NICE 2006; Barton 2010; SIGN 2010), and
recommend multicomponent interventions. Prior to 2006, the only guidelines
available in the UK were those published by the Royal College of Paediatrics and
Child Health, in collaboration with the National Obesity Forum and the Scottish
Intercollegiate Guidelines Network (SIGN 2010). However, these were based mainly
on best practice and not evidence, and provided very little practical guidance.
UK guidelines
Clinical guidelines for the prevention, identification, assessment and management of
overweight and obesity in adults and children have been produced for England and
Scotland (NICE 2006; SIGN 2010).
The National Institute for Health and Clinical Excellence (NICE) guidelines
The National Institute for Health and Clinical Excellence guidelines have been
developed using a complex and comprehensive methodology involving experts in
the topic, systematic reviews and public consultations. In 2006, NICE produced a
guidance document entitled “Obesity: the prevention, identification, assessment and
management of overweight and obesity in adults and children.” The aim of these
guidelines was to present the first comprehensive and integrated approach to
147
prevention, treatment and maintenance, and provide preliminary national
recommendations for the management of childhood obesity in England and Wales.
Safety and effectiveness are the cornerstones of paediatric weight management
programmes. In contrast to adults, weight reduction in children is not the ultimate
objective. In children, the aim is weight maintenance (for BMI ≥ 91st centile) or
weight loss between 0.5 and 1 kg per month (for BMI ≥ 98 th centile) (Cole, Freeman
et al. 1995). Greater weight reduction may be considered in cases of serious health
problems or severe obesity, provided the child is closely supervised by an
appropriately trained health professional (NICE 2006).
NICE recommended multicomponent interventions as the treatment of choice, and
stipulated that weight management programmes should include behaviour change
strategies to increase children’s physical activity levels or decrease inactivity,
improve eating behaviour and quality of diet, and reduce energy intake (NICE 2006).
The Scottish Intercollegiate Guidelines Network (SIGN) guidelines
SIGN produced the first set of UK guidelines on the management of obesity in 2003,
which was subsequently updated in 2010 (SIGN 2010). SIGN guidelines were
produced using standard methodology, including systematic reviews and gradation
of evidence.
SIGN guidelines recommend treatment of childhood obesity in subjects with BMI
values ≥ 98th centile, family-based approaches targeting changes in diet, physical
activity and sedentary behaviours, and use of behavioural change tools within
childhood weight management programmes. SIGN highlights that lifestyle
interventions, compared to standard care or self-help, can produce significant and
148
clinically meaningful reductions in overweight and obesity in children and
adolescents. Generally, the most effective weight management treatments for young
people are both intensive and long-lasting, with an intervention period of at least six
months. They also raise the concern of parents and health professionals that
treating childhood obesity increases the risk of developing eating disorders.
However, this has been discounted in the most recent Cochrane review (Oude
Luttikhuis, Baur et al. 2009). SIGN additionally highlights that quality of life and self-
esteem are improved in children and young people participating in weight
management programmes. Finally, the guidelines recommend that treatment
programmes for managing childhood obesity should incorporate behaviour change
components and be family-based involving at least one parent/carer, and aim to
change the whole family’s lifestyle. Programmes should promote a decrease in
overall dietary energy intake, increased levels of physical activity and reduced time
spent in sedentary behaviours (screen time). Furthermore, staff involved with
management of childhood obesity should undertake training on the necessary
lifestyle changes and use of behavioural modification techniques.
Conclusions
Current guidelines are based on low-grade scientific evidence, as the majority of
studies for the treatment of childhood obesity have several biases or do not report
long-term results (Summerbell, Ashton et al. 2003; Oude Luttikhuis, Baur et al.
2009). These limitations pose a serious practical problem for families seeking
effective local treatments, and thus represent an important focus for future research.
149
However, guidelines consistently state that interventions for school-aged children
should include parental involvement, nutrition education, increased physical activity,
decreased sedentary behaviours and behavioural modification.
In conclusion, features of a successful childhood obesity intervention have been
specified, based on research findings and best-practice recommendations.
However, there is an urgent need for the development of a uniform, flexible
treatment programme that incorporates all these features for successful
management of the alarmingly high rates of childhood obesity in the UK and
universally.
Other methods used for the secondary prevention of childhood obesity
Residential weight loss camps
Weight loss camps are generally suitable for adolescents and not younger children.
However, due to high running costs, these types of interventions are generally not
available for the majority of obese adolescents.
Currently, no RCTs supporting the effectiveness of residential programmes for
childhood obesity management in reducing adiposity are available (NICE 2006;
SIGN 2010).
Non-randomised studies assessing the effectiveness of such camps for obese
children have shown that these interventions are successful in reducing adiposity
during the supervised period, but children regain the weight lost in the long-term
(Gately, Cooke et al. 2000; Christiansen, Bruun et al. 2007).
150
A possible reason for unsuccessful long-term weight loss is that these interventions
are intensive and the residential environment very well-controlled and thus effective
in the short-term. However, adolescents need additional support back in their home
environment where the problem arises in the first place.
2.1.3 Tertiary prevention
Pharmacotherapy
Previous studies have suggested the use of drugs and surgical approaches as
possible solutions in the management of childhood obesity (Treadwell, Sun et al.
2008; Wald and Uli 2009). The most well-characterised pharmacological agents
used to treat childhood obesity include:
Orlistat: Orlistat can be used for children above 12 years and has modest effects in
BMI reduction, ranging from 0.6 to 0.7 kg/m2 (Oude Luttikhuis, Baur et al. 2009).
Safety concerns include fat-soluble vitamin deficiencies due to steatorrhoea (Wald
and Uli 2009). Another consideration is the psychosocial effects of this medication,
which may induce incontinence if a low-fat diet is not followed. Thus, in general, this
medication is not employed due to side-effects.
Sibutramine: Sibutramine was initially approved for children above the age of 16
years under supervised conditions (Wald and Uli 2009). However, the drug has
recently been withdrawn from the market, owing to significant safety concerns (FDA
2010).
Metformin: Metformin is only approved for children aged 10 and above with diabetes
or insulin resistance (FDA 2010).
151
Thus, only a couple of anti-obesity medications are currently available for older
obese children. The problem with pharmacological agents is that the positive effects
are modest and short-term, and no long-term data are available on their efficacy and
safety in children. Therefore, the use of these agents should be limited, and suitable
candidates for obesity drug-therapy cautiously selected and rigorously monitored
(Wald and Uli 2009).
Given that all drugs have side-effects and are only effective if combined with a
healthy diet and physical activity, which, on their own, can be sufficient to cause BMI
reduction, the overall benefit of pharmacological treatments on childhood obesity is
questionable.
Bariatric surgery
Similar to pharmacological treatment, surgery for the management of childhood
obesity should be seriously considered. Firstly, as with any surgery, there are
potentially serious post-surgical complications, including death in severe cases.
Secondly, children rarely have the decisional capacity to provide informed consent
about whether they want to undergo surgery or not. Thirdly, there is no confirmed
evidence that bariatric surgery operations do not affect maturation and growth in
children. Finally, compared to adults, children comply very poorly with post-
operative instructions (including diet, activity advice, and vitamin and mineral
prescription). Therefore, the success of surgery is greatly jeopardised, while at the
same time, there are concerns about the post-operational nutritional status of these
patients, since in most cases, the capacity of the gastrointestinal system to digest
and absorb nutrients is reduced (Treadwell, Sun et al. 2008). The NICE guidelines
152
for the management of childhood obesity do not recommend bariatric surgery in
children or young people (NICE 2006).
Conclusions
The findings of studies to date indicate that residential weight loss camps,
pharmacotherapy and bariatric surgery are not effective long-term strategies for
managing childhood obesity.
153
Chapter 3 Development of the MEND intervention
The UK Medical Research Council (MRC) document 'A Framework for the
Development and Evaluation of Randomised Controlled Trials for Complex
Interventions' was used as a basis for the development, evaluation and
implementation of the MEND intervention (Craig, Dieppe et al. 2008).
3.1 Defining MEND as a complex intervention
Complex interventions are built up from a number of components, which may act
both independently and interdependently. The components usually include
behaviours, parameters of behaviours (e.g., frequency, timing), and methods of
organising and delivering those behaviours (e.g. type(s) of practitioner, setting and
location) (May, Mair et al. 2007).The MRC framework for the development and
evaluation of RCTs for complex interventions argues that "the greater the difficulty in
defining precisely what the ‘active ingredients' of a therapeutic healthcare
intervention are, and how they relate to each other, the greater the likelihood that
you are dealing with a complex intervention" (Craig, Dieppe et al. 2008).
Owing to little clarity on the precise definition of a ‘complex intervention’, these
interventions can be defined as educational or psychosocial aimed at changing
knowledge, beliefs or behaviours (Redfern, McKevitt et al. 2006).
Based on these definitions, the MEND intervention can be defined as a complex
intervention, due to the following factors: (i) MEND is a multicomponent intervention,
based on the best evidence available. However, the outcomes influenced by
components, are unclear, e.g., is BMI influenced by changes in diet, physical activity
154
or both? (ii) Different families respond in different ways to the same intervention. (iii)
MEND is an educational and behaviour change programme aimed at improving
dietary, physical activity and sedentary behaviours. (iv) Factors, such as intensity,
delivery staff, venues and financial resources needed for effective provision of the
programme add to the complexity of MEND.
3.2 The MRC complex intervention process
The MRC has developed a framework for complex interventions, which incorporates
key elements of the development and evaluation process. The four stages are:
development, feasibility/piloting, evaluation and implementation (Figure 24).
Figure 24. Key elements of the MRC development and evaluation process
Taken from Craig, Dieppe et al. 2008.
Interventions should be developed systematically using the best available evidence
and appropriate theory, and subsequently tested with a carefully phased approach,
155
starting with a series of pilot studies targeted at each of the key uncertainties in
design and progressing to an exploratory, and subsequently, definitive evaluation.
Results should be disseminated as widely and persuasively as possible, and further
research performed to assist and monitor the process of implementation (Craig,
Dieppe et al. 2008).
3.3 Development of the intervention
According to the MRC framework, prior to undertaking a thorough evaluation, an
intervention should be developed to the point where it is reasonably expected to
have a positive effect (Craig, Dieppe et al. 2008). The MRC identifies the following
three steps for the development of a complex intervention: (i) identification of the
evidence base, (ii) identification/development of the appropriate theory, and (iii)
modelling process and outcomes.
The evidence and theories underpinning child obesity interventions have been
presented in Section 2.1.2. It is important to note that the majority of this evidence
was not available prior to the MEND feasibility trial in 2002. Therefore, development
of the MEND intervention has been an iterative process, with continual evolvement
from conception to evaluation and implementation. This is a positive process, as it
has ensured constant improvement of the curriculum in order to reflect feedback
from participants and delivery staff as well as emerging research and Government
guidelines. The current MEND curriculum is the 7th edition and has undergone
significant refinement since its initial development in 2001.
However, closer reflection of the changes within the curriculum reveals that the core
intervention has remained largely the same as that used in the RCT. Changes to the
156
curriculum have generally occurred due to the inclusion of additional supportive
information (e.g., sleep, bullying) and not major changes to the structure, intensity,
underlying behaviour change theories or dietary principles.
The third step in the development stage is the modelling process and outcomes.
This step was not included in the development of the MEND intervention, as
modelling is a sophisticated form of statistical analysis and not deemed necessary
for the relatively straightforward feasibility and RCT evaluations.
However this process is currently being utilised to determine the population-level
effects of the UK implementation of the MEND programme (Section 8.9.2) (Law
2010). It is possible that findings from this research will lead to further refinement of
the programme content, for e.g., additional supportive material for specific cultures,
particularly black and minority ethnic (BME) groups or operational methods of
delivery.
Goals of the intervention
The aims of the MEND intervention were to promote a mild negative energy balance
by reducing energy intake and/or increasing energy expenditure in a way that would
support children's growth covering their nutritional needs. To this effect, efforts were
made to enhance dietary and physical activity behaviours, thereby improving
measures of anthropometry and psychosocial outcomes.
157
3.3.1 Dietary component
Successful treatment of childhood obesity requires a sustained negative energy
balance. Modification of dietary intake is one method to achieve this goal. The
majority of childhood weight management interventions documented in the literature
contain a dietary component. A systematic review by Collins et al. (2006) on the role
of dietary intake in children’s weight management interventions concluded that
reduction in total energy intake is necessary for effective weight loss to occur in
obese children. However, no evidence was obtained to suggest that any particular
dietary or macronutrient manipulation, e.g., low carbohydrate or high protein, is
more effective.
A number of studies have demonstrated that a structured dietary management
component is effective when provided as a single component within a
multicomponent weight management programme (Epstein, Myers et al. 1998;
Epstein, Paluch et al. 2007; Oude Luttikhuis, Baur et al. 2009). However, there is
insufficient evidence to recommend one particular dietary approach over another.
In children, severe restriction of food intake is prohibited for physiological and
psychological reasons. A considerable reduction in energy and nutrient intake can
adversely affect growth in children. Therefore, since for some children, weight
maintenance has similar effects on weight status to weight reduction with increasing
height, this approach is considered safer and more preferable. Evidently, this also
depends on the child's age and initial BMI, as there are occasions where weight
reduction is essential to gradually reduce adiposity, especially in older children with
very high BMI or those with co-morbidities, such as insulin resistance and
hypertension.
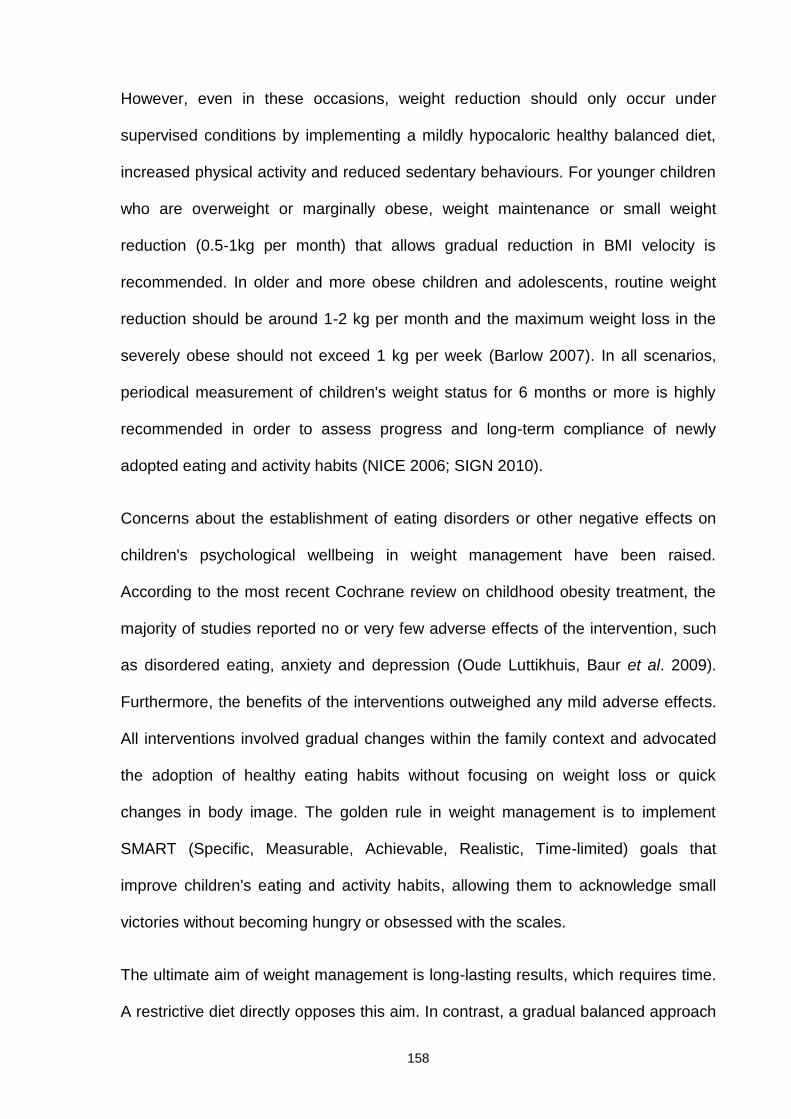
158
However, even in these occasions, weight reduction should only occur under
supervised conditions by implementing a mildly hypocaloric healthy balanced diet,
increased physical activity and reduced sedentary behaviours. For younger children
who are overweight or marginally obese, weight maintenance or small weight
reduction (0.5-1kg per month) that allows gradual reduction in BMI velocity is
recommended. In older and more obese children and adolescents, routine weight
reduction should be around 1-2 kg per month and the maximum weight loss in the
severely obese should not exceed 1 kg per week (Barlow 2007). In all scenarios,
periodical measurement of children's weight status for 6 months or more is highly
recommended in order to assess progress and long-term compliance of newly
adopted eating and activity habits (NICE 2006; SIGN 2010).
Concerns about the establishment of eating disorders or other negative effects on
children's psychological wellbeing in weight management have been raised.
According to the most recent Cochrane review on childhood obesity treatment, the
majority of studies reported no or very few adverse effects of the intervention, such
as disordered eating, anxiety and depression (Oude Luttikhuis, Baur et al. 2009).
Furthermore, the benefits of the interventions outweighed any mild adverse effects.
All interventions involved gradual changes within the family context and advocated
the adoption of healthy eating habits without focusing on weight loss or quick
changes in body image. The golden rule in weight management is to implement
SMART (Specific, Measurable, Achievable, Realistic, Time-limited) goals that
improve children's eating and activity habits, allowing them to acknowledge small
victories without becoming hungry or obsessed with the scales.
The ultimate aim of weight management is long-lasting results, which requires time.
A restrictive diet directly opposes this aim. In contrast, a gradual balanced approach

159
is sustainable, and provides positive messages around healthy eating and activity
patterns. The child needs to understand that in practice, the lifestyle advice provided
should be the same for all children, regardless of weight status, and is applicable for
the rest of their life. The only difference is that for overweight and obese children,
this approach also results in amelioration of their weight status.
In conclusion, restrictive diets are strictly prohibited in children and adolescents, as
these can impair growth and psychological wellbeing. The appropriate approach
should advocate healthy eating and activity habits without focusing on weight loss.
The health professional is responsible for periodically assessing and providing
feedback on weight status in a way that prioritises behaviour changes and only
monitors weight loss as an additional tool.
National healthy eating guidelines for children have been designed to improve the
general nutrition and health of the population. It should be noted that these
guidelines are not specifically aimed at managing childhood obesity in children. The
Eatwell Plate is a recent policy tool devised by the UK Department of Health (DH),
with a view to helping the public follow a healthier diet (Figure 25) (DH 2011). It
adheres to the government’s recommendations for healthy eating and provides a
visual representation of the proportions of foods needed daily for a healthy,
balanced diet. The Eatwell Plate consists of five food groups: bread, rice, potatoes,
pasta and other starchy foods (33% of plate size), fruit and vegetables (33% of plate
size), milk and dairy foods (15% of plate size), meat, fish, eggs, beans and other
non-dairy sources of protein (12% of plate size), and foods and drinks high in fat
and/or sugar (8% of plate size).

160
Figure 25. The Eatwell plate
Source: DH 2011
The Eatwell plate applies to adults and children above the age of two years from all
ethnic and cultural groups. The relative contribution of each food group is presented
in a visual way, with each part of the pie displaying the appropriate size and a
different colour. It is important to highlight that the Eatwell Plate does not refer to a
particular meal, but an overall healthy balanced diet.
Frequency of servings and portion sizes are deliberately omitted, as individual
requirements vary. The only exceptions are the 5-a-day recommendation (for fruit
and vegetables) and the 2-a-week recommendation for fish (one of which needs to
be oily). Health professionals are advised to tailor portion sizes and frequency to
individual patient needs.
The current recommendations for the management of childhood obesity include
promotion of a healthy diet within a multicomponent intervention, but do not
advocate the sole use of specific dietary approaches (NICE 2006; SIGN 2010).
Therefore the aim of dietary treatment within a multicomponent childhood obesity

161
intervention should be promotion of healthy eating using appropriate health
education methods and behaviour change techniques.
MEND dietary component
Based on the available evidence and current national healthy eating guidelines, the
MEND dietary component was designed to steer families towards a healthier, more
balanced diet. A ‘non-dieting’ philosophy was advocated throughout the intervention.
Therefore, children were discouraged from weighing themselves and encouraged to
make lifestyle changes to improve health, rather than achieve rapid weight loss
(Summerbell, Ashton et al. 2003; Oude Luttikhuis, Baur et al. 2009).
The nutrition component of the MEND programme was designed to raise awareness
and educate parents and children to encourage healthier daily choices. Nutrition
sessions were devised for delivery to both children and parents, and suited to the
reading and comprehension ages of primary school children.
Nutrition sessions consisted of healthy eating advice for obese children and their
families, and included simple healthy eating tips in the form of achievable weekly
targets (nutrition targets), education on reading and understanding “back of pack”
food and drinks nutrition information, fat and sugar cut-offs, differences between
refined (processed) and unrefined (unprocessed) carbohydrates, portion sizes, and
other simple advice aimed at producing gradual improvements in dietary intake and
habits. In addition, families participated in practical sessions involving a guided
supermarket tour, cooking of healthy recipes and learning coping strategies to deal
with birthday parties, school meals, eating out, holidays and other special occasions
(Table 6, nutrition sessions are italicised).
162
Table 6. MEND programme curriculum (theory sessions only)
Session (week) Session title Summarised content
1(1) Introduction Introduction to trainers, ice-breaker, what happens at each session, MEND healthand safety rules and procedures.
2 (1) Food groups and healthyeating
The causes and consequences of being overweight with an introduction to dietaryguidelines and healthy eating.
3 (2) Goals and rewards(parents only)
Basic concepts and effective behaviour modification techniques showing parentshow to set goals and give rewards as a way to motivate their children to develophealthier eating and activity patterns.
4 (2) Refined versus unrefinedcarbohydrates The benefits and importance of following a diet high in unrefined carbohydrates.
5 (3) Goals and rewards Children learn how to set purposeful goals to help improve their dietary andphysical activity behaviours.
6 (3) Fats and sugarsParents and children learn about the harmful short- and long-term effects of dietshigh in saturated and hydrogenated fats and added sugars e.g. glucose andsucrose.
7 (4) External triggers (parentsonly)
Parents shown that certain triggers in their children’s environment encourage theconsumption of unhealthy foods and inactivity.
8 (4) Food labels and portionsizes
The group learns how to read and understand food and drink nutrition labels.Portion sizes are also examined.
9 (5) Modelling (parents only) Parents learn how to identify some of their own behaviour patterns that could bepreventing their children from achieving their goals.

163
10 (5) Menu planning Practical ideas for menu planning. Simple suggestions for healthy meals.
11 (6) Internal triggers (parentsonly)
Parents learn how internal triggers (feelings, hunger, thoughts and cravings) cancause their children to overeat.
12 (7) Supermarket tour The group tests their practical skills at picking healthy foods off the shelf andattends a fruit and vegetable preparing and tasting session.
13 (7)Internal Triggers – “whowants to be ahealthionnaire?”
Game-based session designed to help children identify their internal triggers andmeans to deal with them.
14 (7) Food presentation andtasting Parents and children cook and sample a variety of healthy meals.
15 (8) Problem solving(parents only)
An open forum designed to allow parents to discuss and identify any problemareas they may be experiencing.
16 (8) Eating out, parties andother tempting occasions
Families learn effective ways to follow healthy guidelines at the most tempting oftimes e.g. birthday parties, holidays, eating out and at school.
17 (9) Improving self- esteem Self-esteem and confidence building session.
18 (9) Farewell Summing up, farewell, certificates of achievement.
Note: five of the behaviour modification sessions were delivered to parents only while children participated in an exercise class.
164
The aim of the nutrition sessions was to support families in modifying their diets
and eating habits in an achievable and sustainable manner. Creation of a
nutritional rationale that accommodates exact classification for all foods and
drinks is a dietetic challenge. The nutrition guidelines of MEND were based on a
combination of healthy eating dietary principles. More specifically, the curriculum
promoted increased consumption of unrefined carbohydrates and dietary fibre
and reduced saturated and hydrogenated fatty acids and added sugars. Foods
were grouped to create a child- and family-friendly system that encouraged
healthier food choices. The nutrition guidelines were designed to be simple and
practical for families to adopt. Application of these principles thus allowed
children and families to make informed dietary decisions in a simple and effective
way3.
No foods or drinks were classified as ‘forbidden’, ‘good’ or ‘bad’ during the
intervention, as this type of practice does not encourage long-term eating habits,
reduces adherence, and stigmatises the ‘forbidden’ or ‘bad’ items, making them
more desirable to children (Wardle 2005). Instead, the terms “MEND-Friendly”
and “MEND-Unfriendly” were used to guide families toward dietary components
that met healthy eating criteria.
A third category was included, which allowed the classification of foods and
drinks that did not strictly fit into either the healthy or unhealthy category (MEND-
Friendly*). Inclusion of a third dietary classification category is quite common in
dietary management approaches for children, including the Traffic Light Diet that
3At the time of the feasibility trial and RCT, national healthy eating guidelines incorporated the“Balance of Good Health – Food Standards Agency” which has subsequently changed to“EatWell Plate – Department of Health.

165
has green, orange and red categories, and the USA National Heart, Lung and
Blood Institute’s “Go, Slow, Whoa” dietary classification system (NHLBI 2012).
Table 7 summarises the dietary classification system of MEND.
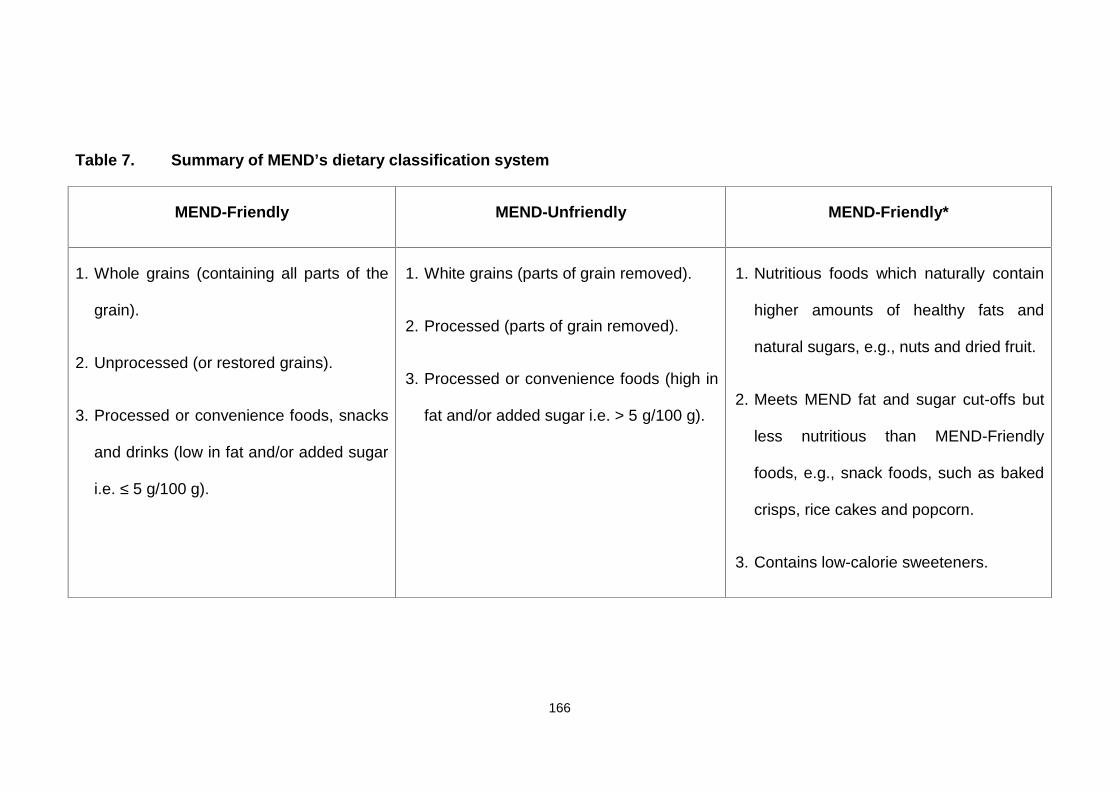
166
Table 7. Summary of MEND’s dietary classification system
MEND-Friendly MEND-Unfriendly MEND-Friendly*
1. Whole grains (containing all parts of the
grain).
2. Unprocessed (or restored grains).
3. Processed or convenience foods, snacks
and drinks (low in fat and/or added sugar
i.e. ≤ 5 g/100 g).
1. White grains (parts of grain removed).
2. Processed (parts of grain removed).
3. Processed or convenience foods (high in
fat and/or added sugar i.e. > 5 g/100 g).
1. Nutritious foods which naturally contain
higher amounts of healthy fats and
natural sugars, e.g., nuts and dried fruit.
2. Meets MEND fat and sugar cut-offs but
less nutritious than MEND-Friendly
foods, e.g., snack foods, such as baked
crisps, rice cakes and popcorn.
3. Contains low-calorie sweeteners.
167
Although there is no evidence to support the use of one dietary approach over
another, consumption of foods and drinks low in sugar and fat and high in dietary
fibre is an effective way to reduce energy intake via decreasing energy density
(Johnson, Mander et al. 2008). During the MEND programme, families were
encouraged to swap MEND-Unfriendly foods and drinks with MEND-Friendly
alternatives, and instructed to aim for a maximum of five MEND-Unfriendly
“treats” per week. This technique helped children and parents to incorporate
small amounts of unhealthy “treat” foods/snacks within a healthier balanced diet,
supporting the ‘no forbidden foods’ philosophy (Wardle 2005).
Over the course of the programme, families were educated on the different types
of fat, i.e., monounsaturated and polyunsaturated fats were classified as MEND-
Friendly, whereas saturated and hydrogenated fats were MEND-Unfriendly.
Thus, consumption of healthy fats was encouraged in a way that was easy for
families to understand and implement in everyday life.
Prior to the MEND feasibility trial, I developed a nutrition label reading method to
enable children and parents to easily read and understand “back of pack”
nutrition information (Sacher, Chadwick et al. 2005). This method was designed
to support families in making appropriate choices and additionally allowed
nutrition comparison between products.
In the UK, back of pack nutrition information is standardised, whereas front of
pack information varies with respect to the food manufacturer and retailer. This
method was tested prior to and during the feasibility trial using focus groups and
questionnaires, and generated highly positive feedback from dietitians, members
of the public, children and parents. On average, the system could be introduced
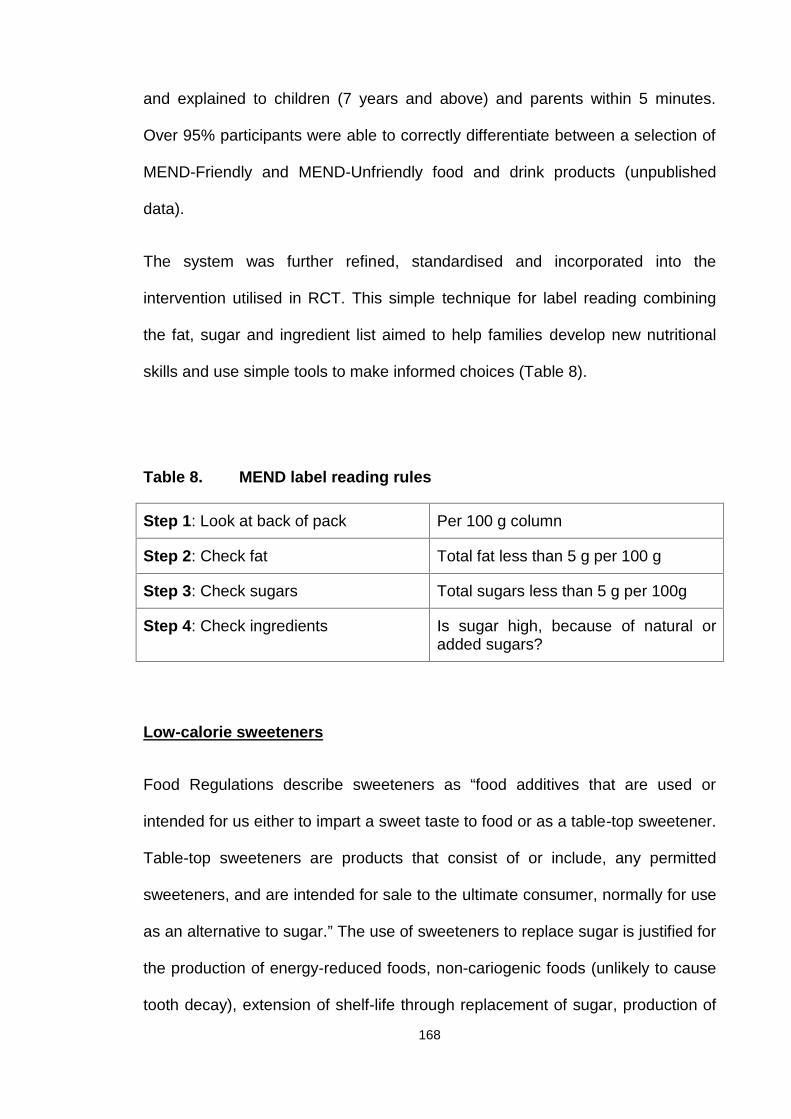
168
and explained to children (7 years and above) and parents within 5 minutes.
Over 95% participants were able to correctly differentiate between a selection of
MEND-Friendly and MEND-Unfriendly food and drink products (unpublished
data).
The system was further refined, standardised and incorporated into the
intervention utilised in RCT. This simple technique for label reading combining
the fat, sugar and ingredient list aimed to help families develop new nutritional
skills and use simple tools to make informed choices (Table 8).
Table 8. MEND label reading rules
Step 1: Look at back of pack Per 100 g column
Step 2: Check fat Total fat less than 5 g per 100 g
Step 3: Check sugars Total sugars less than 5 g per 100g
Step 4: Check ingredients Is sugar high, because of natural oradded sugars?
Low-calorie sweeteners
Food Regulations describe sweeteners as “food additives that are used or
intended for us either to impart a sweet taste to food or as a table-top sweetener.
Table-top sweeteners are products that consist of or include, any permitted
sweeteners, and are intended for sale to the ultimate consumer, normally for use
as an alternative to sugar.” The use of sweeteners to replace sugar is justified for
the production of energy-reduced foods, non-cariogenic foods (unlikely to cause
tooth decay), extension of shelf-life through replacement of sugar, production of
169
dietetic products, or foods with minimal effect on blood sugar (most sweeteners
produce a very small glycaemic response due to non-carbohydrate structure,
partial metabolism or use in very small quantities).
Low-calorie sweeteners can be divided into two broad categories.
1. Non-nutritive, high-intensity sweeteners. These are used in very small
quantities, as their sweetening effect is very strong and caloric value
negligible. The most well-known of these products include aspartame,
saccharin, cyclamate, sucralose, acesulfame K and stevia. Currently, the
majority of organisations (national and international) approve their use as
sweeteners (FSA, FDA, JECFA, FAO). However, the previous UK Food
Standards Agency advised parents to give young children no more than
three beakers (180ml each) a day of dilutable soft drinks or squash
containing cyclamate in order to avoid exceeding the acceptable daily
intake.
2. Reduced-calorie bulk sweeteners. These are sugar alcohols (polyols) that
sweeten with less energy per gram, compared to table sugar
(approximately 2 kcal/g, relative to 4 kcal/g for table sugar). Examples of
polyols include erythritol, mannitol, xylitol, sorbitol, isomalt and
hydrogenated starch hydrolysates. Since these compounds are not fully
absorbed from the gut, polyols are less available for energy metabolism.
However, they are used in similar amounts as sugar, in contrast to intense
sweeteners that are used in very small quantities, thus adding bulk and
texture to food. Excessive intake of polyols (>50 g/day of sorbitol, >20
g/day of mannitol) may cause diarrhoea, which is indicated on the packs
by law.

170
The safety of low-calorie sweeteners is a matter of debate, mainly due to their
previous link to some types of cancer (in most cases in experimental animals
rather than humans) and other diseases (e.g., autism). No sound scientific
evidence has been obtained to validate the above theories, despite extensive
research. Nevertheless, some members of the public are highly concerned about
the potential negative effects of low-calorie sweeteners on current and future
health. Notably, before authorisation for use in food or drink, all sweeteners are
extensively investigated by The Joint FAO/WHO Expert Committee on Food
Additives (JECFA) at the international level, the European Food Safety Authority
(EFSA) at the European level, and national agencies (previously the Food
Standards Agency in the UK).
Despite the apparent safety of low-calorie sweeteners, the British Dietetic
Association states that “in the UK, the consumption of intense sweeteners is
monitored to ensure that typical intakes do not exceed safe levels. Their use is
not permitted in foods specifically prepared for babies and young children, and
as a precautionary measure, the diets of healthy children should not contain
large quantities of foods containing artificial sweeteners”.
Justification for the use of low-calorie sweeteners as part of the dietary
component of the MEND intervention
Consumption of sugar-sweetened beverages, which include soft drinks, fruit
drinks, energy drinks and flavoured and vitamin waters has increased worldwide
(Malik, Popkin et al. 2010). Strong evidence has been obtained showing that
consumption of 1-2 servings per day of sugar-sweetened beverages is
171
associated with weight gain, dental caries in children and adults, metabolic
syndrome and type 2 diabetes (Malik, Schulze et al. 2006; Dubois, Farmer et al.
2007; Malik, Popkin et al. 2010). Moreover, recent research supports the use of
artificially sweetened soft drinks as an effective tool in reducing obesity and
preventing dental caries (Bellisle and Drewnowski 2007; de Ruyter, Olthof et al.
2012).
The health of obese children is far more likely to suffer in the long-term due to
regular consumption of added sugars and subsequent increase in energy intake,
compared to regular intake of low-calorie sweeteners. In view of the recognition
that the optimal beverages for children’s health are water, low-fat milk and small
quantities of pure fruit juice, combined with the lack of long-term studies
evaluating the effects of low-calorie sweetener intake in children, guidelines for
the inclusion of artificially sweeteners were temporary, applied only for the
duration of programme, and excluded healthy weight siblings. Families were
instructed to gradually wean their children off low-calorie sweeteners after
completion of the programme. Unfortunately, intake of low-calorie sweeteners
was not measured as part of the feasibility or RCT dietary evaluation, and
therefore no conclusions can be reached in terms of family compliance with
these recommendations.
In summary, sugar-sweetened beverages are linked to obesity and other
negative health outcomes. There is strong evidence that replacement of sugar-
sweetened with sugar-free beverages can reduce obesity, and no links between
consuming low-calorie sweeteners and health risks have been established to
date. Therefore, substitution of sugar with low-calorie sweeteners was

172
recommended as part of the MEND dietary component as a temporary aid to
reduce energy intake.
3.3.2 Behaviour modification component
The use of behaviour modification techniques is effective as part of a
multicomponent intervention (Section 2.1.2) (NICE 2006; Oude Luttikhuis, Baur
et al. 2009). The behavioural part of the MEND programme included techniques
designed to involve the whole family and help parents to improve their children's
overall dietary habits, activity patterns and self-confidence (Table 9).
These protocols followed the principles of cognitive behaviour therapy, and
aimed at gradual, permanent changes in the children’s lifestyle habits (Epstein,
Myers et al. 1998; Cole, Waldrop et al. 2006). Behaviour modification sessions
consisted of eight sessions designed by Dr. Paul Chadwick, as presented in
Table 6 (not italicised).
Table 9. Behaviour modification principles used in the MENDprogramme
Behaviourmodification
principleMEND programme
Positiveparenting
Positive parenting themes run throughout, e.g., settingboundaries, consistency, behaviour management.
Habitdevelopment(goals)
Nutrition theory sessions: families received 2 weekly nutritiontargets at each session (16 nutrition targets in total).Behaviour theory sessions: families set two individualisedweekly goals focused on both nutrition and physical activity.

173
Learningtheory –triggers
Two parent workshop discussions covered internal andexternal triggers.
Learningtheory –rewards
Using praise & attention (informal rewards) to rewardpositive behaviour was incorporated in parent’s session.A goals and reward star chart (formal rewards) was operatedthroughout the programme. Children also received both anindividual reward (agreed with and provided by their parent),as well as a group reward at the end of the programme.
Social learningtheory An entire parent’s session was dedicated to role modelling.
Problemsolving
Parents were encouraged to solve problems during parent-only sessions. In addition, an entire session was dedicatedto the topic of problem solving.
MonitoringParents were encouraged to monitor their children’s weeklygoals and the MEND Leaders monitored group goals andrewards using a star chart.
Motivation Peer group support, goals & rewards and informationprovision collectively promoted parent and child motivation.
Taken from Baur and O'Connor (2004); Berkel, Poston et al. (2005) and Wardle and Cooke(2005)
3.3.3 Physical activity component
As noted in Section 2.1.2, systematic reviews of child obesity exercise/physical
activity interventions has confirmed that regular physical activity is associated
with reduction of adiposity in overweight and obese children and adolescents
(Atlantis, Barnes et al. 2006; Collins 2007). Physical activity is undoubtedly
important, since decreased activity in children and consequent energy
expenditure are major factors in the development of obesity (NICE 2009).
Health benefits of increasing the level of physical activity in childhood include
effective weight control, lower blood pressure and improved psychological well-
174
being (NICE 2009). Data from a large sample of men and women showed that
physical activity levels in primary school years have a significant long-term effect
on the activity habits of women (Trudeau, Laurencelle et al. 1999).
Healthy levels of physical fitness (4 to 5 times per week) require regular
participation in activities that generate significantly higher energy expenditure
than the resting level (DH 2011). Thus, strategies to promote physical activity in
children and adolescents should be incorporated into all child obesity
interventions (Goran and Treuth 2001).
Unstructured moderate-intensity activities facilitate the majority of disease-
preventing and health-promoting benefits of exercise in obese children (Sothern,
Loftin et al. 2000). Physical activity can be increased in different ways, for
instance, by increasing active pursuits and/or decreasing sedentary behaviours,
such as watching television, internet and computer games. An increase in
lifestyle physical activity levels, such as walking to school, has been shown to
have a better long-term effect on weight than structured exercise (Whitlock,
O'Connor et al. 2010). Unfortunately, no precise guidelines on the type, dose and
intensity of physical activity required to manage childhood obesity are available
at present.
Pre-adolescent children find periods of defined exercise (aerobic classes or
videos, stationary bicycles or treadmills) boring or punitive (Barlow and Dietz
1998), which has presented a major obstacle in other childhood obesity
management programmes, resulting in poor attendance and retention rates.
Additionally, there is no consensus on whether childhood obesity interventions
should include an exercise component as part of the programme or simply
175
promote lifestyle activity or a combination of both. The only recommendations
available are the current UK government guidelines for the general childhood
population, which stipulate at least 60 minutes of physical activity per day (NICE
2006).
Based on the lack of clear recommendations, a multi-pronged approach was
used for the formulation of the MEND physical activity component. Four
strategies comprised the physical activity component of the intervention: (i)
moderate to vigorous physical activity provided at each session (60 minutes,
twice per week), (ii) behaviour change strategies for parents to increase their
own children’s physical activity levels in everyday life, (iii) encouragement of
parents to become more effective role models by participating in physical activity
with their children, and (iv) strategies for parents and children to reduce screen
time and other common sedentary behaviours (ADA 2006; NICE 2006; Barlow
2007; SIGN 2010; DH 2011).
The MEND programme exercise sessions comprised alternating land and water-
based multi-skills activities, which focused on non-competitive group play
previously shown to facilitate safe and effective weight management in obese
children (Sothern, Loftin et al. 2000). The 18 physical activity sessions consisted
of fun activities and group play, both on land and water, to increase strength,
fitness, balance, agility and coordination. Sessions were graded, structured and
non-competitive.
Experts in the field of child physical activity designed and implemented a
physical activity curriculum that was not only fun but also specifically designed
176
for overweight and obese children and reinforced the nutrition and behaviour
modification principles from the theory sessions.
3.3.4 Maintenance phase
Whilst it is widely recognised that ongoing support is required for successful
behaviour change in paediatric obesity treatment (NICE 2006), limited
information is available on how to help families maintain behavioural changes
and sustain improvements in weight status following initial treatment (Oude
Luttikhuis, Baur et al. 2009).
A RCT conducted in 2007, included 150 paediatric overweight and obese
participants aged 7 to 12 years and aimed to assess the efficacy of maintenance
treatment approaches for childhood overweight (Wilfley, Stein et al. 2007). All
participants initially received a 5-month weight loss treatment that focused on
dietary modification, increased physical activity and behaviour change skills.
Participants were subsequently randomised to either weight maintenance via
behavioural skills maintenance (BSM), social facilitation maintenance (SFM) or
no intervention control. BSM was a family-based, cognitive-behavioural approach
that emphasised self-regulation behaviour and relapse prevention. SFM helped
parents develop child peer networks that supported healthy eating and physical
activity. Both BSM and SFM were delivered as 16 weekly sessions. The weight
loss intervention resulted in a BMI z-score reduction of 0.22 (SD 0.17). BSM and
SFM interventions promoted improved weight maintenance, relative to the
controls, at 2 years follow-up. Mean changes in BMI z-score were -0.04 (BSM),
-0.04 (SFM) and 0.05 (control). The authors concluded that the addition of
177
maintenance-targeted treatment improves the short-term efficacy of weight loss
treatment for children, relative to no maintenance treatment (Wilfley, Stein et al.
2007).
An analysis of 20 studies on paediatric patients (aged 4 to 18 years) showed
limited evidence of treatment maintenance in behavioural intervention trials
(Whitlock, O'Connor et al. 2010). Multicomponent interventions that included
behaviour therapy were associated with BMI or weight change improvement over
48 months and for at least 12 months after completion of the intervention. To
date, the majority of childhood obesity interventions have focused on relatively
short-term follow-up, i.e., 12-24 months (Oude Luttikhuis, Baur et al. 2009).
Limited studies have evaluated the effects of different weight maintenance
strategies on long-term outcomes. Available evidence suggests that
multicomponent interventions that include behavioural components promote
maintenance of BMI reduction at 2 years follow-up. Moreover, continuation of
increased physical activity levels post-intervention leads to longer-term weight
maintenance (DH 2011).
In the absence of specific guidelines on types of effective support following a
childhood weight management intervention, no maintenance support was offered
to families attending the MEND feasibility trial. For families participating in the
MEND RCT, free swimming passes were provided during the post-intensive
phase. Specifically, after the intensive phase, participants received a 3-month
free family swim pass at the leisure centre where the programme was delivered,
with the aim of promoting sustainability of increased physical activity behaviours
for the whole family. Families were only allowed to use the swimming pool, as

178
children less than 16 years of age were not permitted access to the gym.
Frequency of visits was self-monitored using a provided diary.
179
Chapter 4 Feasibility and piloting methods
Introduction
The feasibility and piloting methods stages of the MEND intervention (Appendix
2) (Sacher, Chadwick et al. 2005) were used to inform the MEND RCT
evaluation described in Chapter 6. It should be noted that the feasibility trial was
conducted in 2002, prior to my registration to undertake a PhD. Rigorous
methodology was not employed for the formulation and completion of the
feasibility trial.
MRC guidance on assessing feasibility and piloting methods
According to the MRC framework for developing and evaluating complex
interventions, the feasibility and piloting stage includes testing procedures for
acceptability, estimating the likely rates of recruitment and retention of subjects,
and calculation of appropriate sample sizes. Evaluations are often undermined
due to problems of acceptability, compliance, delivery of the intervention,
recruitment and retention and smaller-than-expected effect sizes that could be
anticipated by effective piloting. Pilot study results should be interpreted
cautiously when making assumptions for larger-scale evaluations. A combination
of qualitative and quantitative methods may be needed, for example, to
understand barriers to participation and estimate response rates (Craig, Dieppe
et al. 2008).
180
4.1 MEND feasibility and piloting methods trial
The MEND feasibility and piloting methods trial (hereafter referred to as the
MEND feasibility trial) was an uncontrolled, pre-post design study. The aim of the
MEND feasibility trial was to assess its acceptability, feasibility and compliance in
a small group of obese children and their families (Appendix 2). A secondary aim
was to pilot the methods employed in the delivery of the MEND intervention and
to provide data for calculation of the RCT sample size.
4.1.1 Methods
The MEND intervention was designed as a programme for 7-12 year-old obese
children and their families, aimed at promoting the development of healthy
lifestyle patterns and managing excessive weight gain. The programme focused
on five key areas: parenting, emotional well-being, eating behaviours, physical
activity and nutrition, as described in Section 3.3.
In 2001, prior to developing the intervention, a thorough literature review was
undertaken to collect evidence of factors related to the development of childhood
obesity and approaches to managing this condition. The literature revealed
limited high-quality and many international studies with heterogeneous design,
often uncontrolled, and with small sample sizes. Review of these studies
provided little generalisable data.
One sole systematic review was available at the time, which focused on
childhood obesity prevention and management programmes. The review
concluded that “there is a lack of good quality evidence on the effectiveness of

181
interventions on which to base national strategies or inform clinical practice.” In
general, family-based programmes that involve parents, increase physical
activity, provide dietary education and target reduction in sedentary behaviour
were found to be the most promising strategies to reduce childhood obesity
(NHS Centre for Reviews and Dissemination & The University of York 2002).
In addition, the Royal College of Paediatrics and Child Health and the National
Obesity Forum produced guidelines for the management of childhood obesity in
primary care, stating that rapid weight loss and strict dieting were not appropriate
for children (Royal College of Paediatrics and Child Health 2002). The majority of
the scant evidence used to develop the original MEND intervention has been
superseded by more recent literature, as described in Section 2.1.2.
In order to ascertain perceptions and views concerning effective childhood
weight management, semi-structured interviews were conducted with parents,
academics and health care professionals (including dietitians, an eating disorder
specialist and clinical psychologist, school nurses and GPs).
Once the above stages above were complete, Dr. Paul Chadwick and I devised
the contents of the curriculum based on the limited available evidence, combined
with best clinical practice. A draft manual was developed which included a
session outline for each of the nutrition and behavioural modification sessions.
The session outline included topics for discussions, activities and timings for
each component. This manual was further developed and standardized in
preparation for the RCT as described in Section 6.2 and 6.5.
Although the feasibility intervention was devised by a specialist clinical team
including a dietitian and psychologist, due to the scale of the childhood obesity
182
epidemic and knowledge that specialist health care professionals were under
resourced, the aim from the outset was to develop a generalisable intervention
that could be delivered by a wide range of non-specialists.
4.1.2 Recruitment
Obese children aged 7–11 years were recruited through local professional
networks in primary and secondary care. An information pack was designed for
health care professionals (GPs, dietitians and school nurses) working in a 1-2
mile radius of the trial venue (London Boroughs of Camden and Islington). Packs
contained BMI charts, parent and child information sheets and referral letters for
use by GPs, dietitians and school nurses. In addition, posters were produced for
placement in GP practice waiting areas. I attended health care professional
meetings to present the aims and details of the trial in order to raise awareness.
A further recruitment strategy included use of the media and internet. An
advertisement was placed in a local newspaper, which provided brief details of
the trial and a request for participants. An additional advertisement was placed
on the website of Great Ormond Street Hospital NHS Trust. A local radio
interview was conducted by myself, discussing the issues of childhood obesity
and details of the trial, with a contact number for interested parents.
There were no inclusion criteria apart from child’s age range (7-11 years) nor
where there any exclusion criteria. All families who self-referred were requested
to seek a referral from their GP to ensure that the intervention was properly
integrated within their health care. Referred children were asked to bring their
183
health care professional referral form. All families were invited to an assessment
appointment with the trial researchers.
4.1.3 Assessment
The main aims of the assessment were to provide the families with further
information about the study, assess motivation and practicalities for attending
(e.g., travel, care for other children), establish eligibility (as per the inclusion
criteria), and collect baseline anthropometric, medical and psychometric data.
Families in receipt of state benefits were reimbursed travel expenses for
assessment appointments and treatment sessions. Once the assessments were
completed, the eligible families were invited back for the baseline measurement
session.
4.1.4 Intervention
The MEND intervention consisted of 20 twice-weekly sessions, each lasting up
to 2 hours, over 3 months (included additional assessment and measurement
sessions). All sessions were group-based, and consisted of eight nutrition-
focused, eight behavioural modification, 18 physical activity and 2 measurement
sessions (Table 6).
Nutrition and behavior modification sessions alternated weekly, so that families
were provided with one nutrition and one behavior modification session per
week. Five of the behavior modification sessions were designed specifically to
allow delivery to parents without the children being present due to the adult
184
nature of the topics. All sessions were prepared in advance and recorded on a
voice recorder for transcription purposes. The physical activity sessions
alternated between land- and water-based activities.
The programme was held in the early evening (5-7pm) on Monday and
Wednesday at a central London sports centre (Oasis Sports Centre, 32, Endell
Street, Covent Garden, London, WC2H 9AG). The intervention was delivered by
a paediatric dietitian (Paul Sacher), a clinical psychologist (Dr. Paul Chadwick)
and a physiotherapist (Lisa Hogan).
4.1.5 Outcomes
The primary outcome measure was waist circumference z-score, and secondary
outcomes included BMI z-score (see Section 6.9.6), diastolic blood pressure
(see Section 6.9.8) and self-esteem (see 6.9.10). Results of a step test were
reported in the publication of this trial, but have not been included, since the test
was not validated (Sacher, Chadwick et al. 2005). Where possible, the weights
and heights of parents were measured, and BMI calculated (see Section 6.9.6).
Assessments were carried out at baseline, 3 and 6 months. Attendance was also
taken during the programme sessions.
4.1.6 Results
All families assessed were eligible for the trial. Eleven subjects (6 girls) with a
mean age of 9.6 years consented to participate in the trial. Medical histories and
health care professional referrals noted no evidence of illness or comorbidities.
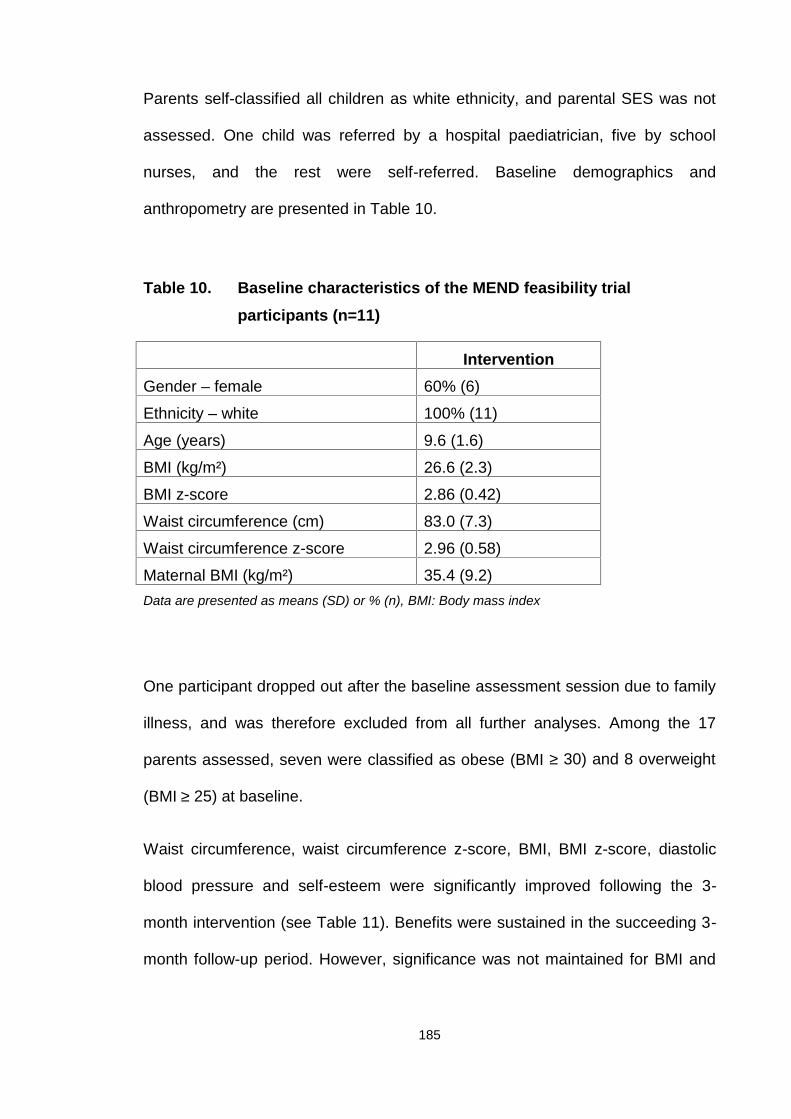
185
Parents self-classified all children as white ethnicity, and parental SES was not
assessed. One child was referred by a hospital paediatrician, five by school
nurses, and the rest were self-referred. Baseline demographics and
anthropometry are presented in Table 10.
Table 10. Baseline characteristics of the MEND feasibility trialparticipants (n=11)
InterventionGender – female 60% (6)
Ethnicity – white 100% (11)
Age (years) 9.6 (1.6)
BMI (kg/m²) 26.6 (2.3)
BMI z-score 2.86 (0.42)
Waist circumference (cm) 83.0 (7.3)
Waist circumference z-score 2.96 (0.58)
Maternal BMI (kg/m²) 35.4 (9.2)Data are presented as means (SD) or % (n), BMI: Body mass index
One participant dropped out after the baseline assessment session due to family
illness, and was therefore excluded from all further analyses. Among the 17
parents assessed, seven were classified as obese (BMI ≥ 30) and 8 overweight
(BMI ≥ 25) at baseline.
Waist circumference, waist circumference z-score, BMI, BMI z-score, diastolic
blood pressure and self-esteem were significantly improved following the 3-
month intervention (see Table 11). Benefits were sustained in the succeeding 3-
month follow-up period. However, significance was not maintained for BMI and
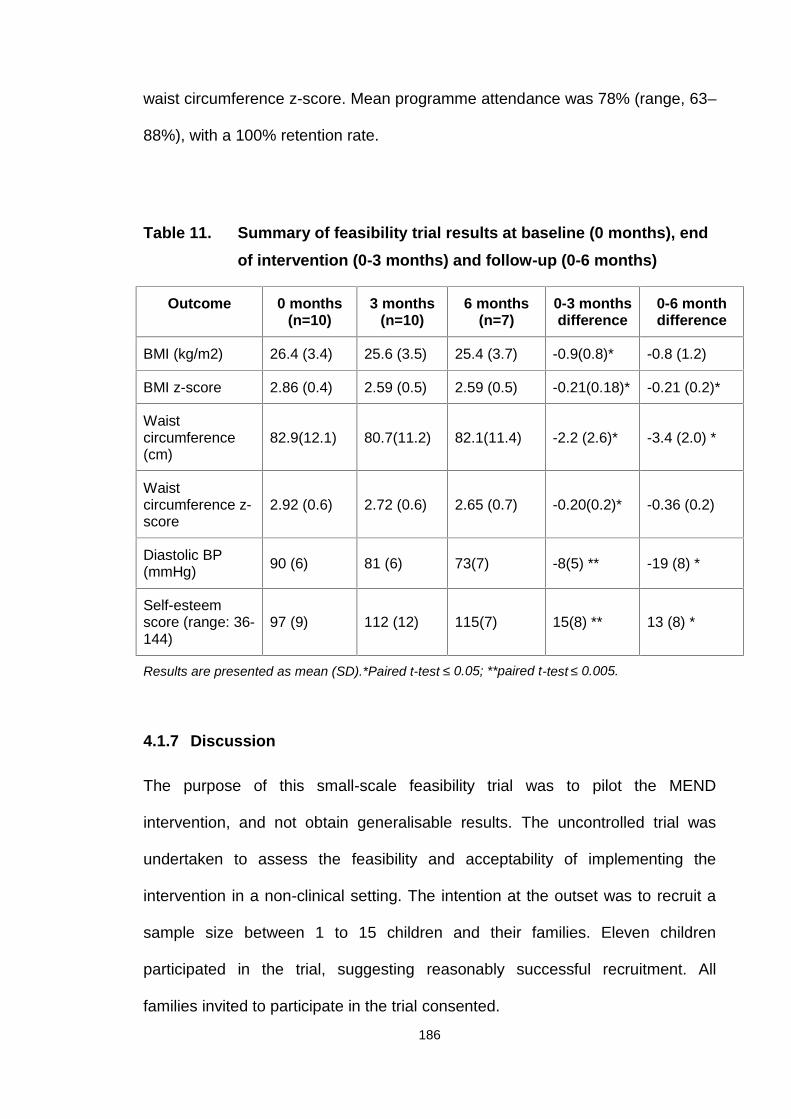
186
waist circumference z-score. Mean programme attendance was 78% (range, 63–
88%), with a 100% retention rate.
Table 11. Summary of feasibility trial results at baseline (0 months), endof intervention (0-3 months) and follow-up (0-6 months)
Outcome 0 months(n=10)
3 months(n=10)
6 months(n=7)
0-3 monthsdifference
0-6 monthdifference
BMI (kg/m2) 26.4 (3.4) 25.6 (3.5) 25.4 (3.7) -0.9(0.8)* -0.8 (1.2)
BMI z-score 2.86 (0.4) 2.59 (0.5) 2.59 (0.5) -0.21(0.18)* -0.21 (0.2)*
Waistcircumference(cm)
82.9(12.1) 80.7(11.2) 82.1(11.4) -2.2 (2.6)* -3.4 (2.0) *
Waistcircumference z-score
2.92 (0.6) 2.72 (0.6) 2.65 (0.7) -0.20(0.2)* -0.36 (0.2)
Diastolic BP(mmHg) 90 (6) 81 (6) 73(7) -8(5) ** -19 (8) *
Self-esteemscore (range: 36-144)
97 (9) 112 (12) 115(7) 15(8) ** 13 (8) *
Results are presented as mean (SD).*Paired t-test ≤ 0.05; **paired t-test ≤ 0.005.
4.1.7 Discussion
The purpose of this small-scale feasibility trial was to pilot the MEND
intervention, and not obtain generalisable results. The uncontrolled trial was
undertaken to assess the feasibility and acceptability of implementing the
intervention in a non-clinical setting. The intention at the outset was to recruit a
sample size between 1 to 15 children and their families. Eleven children
participated in the trial, suggesting reasonably successful recruitment. All
families invited to participate in the trial consented.
187
Considering the intensity of the programme sessions (20 sessions over 10
weeks), the high attendance (mean sessions attended: 78%) and retention
(percentage of participants who finished the intervention: 91%) rates
demonstrated high acceptability of the delivery format, intensity and content of
the programme. In addition, all parents who were offered the opportunity to
participate accepted, suggesting a willingness to commit to the intervention and
make an investment for their children’s health. Ideally, qualitative evaluation
should have been included in order to draw firm conclusions, particularly to
clarify the barriers to participation and how families regarded the programme
content. Additionally, it would have been useful to determine which components
of the intervention families felt were most helpful and how they viewed the level
of information provided. Unfortunately, no formal process evaluation or
qualitative feedback was obtained due to lack of resources and time. Notably,
this trial was not undertaken as part of my PhD. All three researchers were
engaged in full-time employment at the time and conducted the feasibility trial
outside of formal working hours.
At 3 and 6 months from baseline, all outcomes changed in a positive direction,
and unexpectedly, given the small sample size, reached statistical significance in
most cases (Table 11). As this was a small trial and not powered to achieve
statistical significance, these changes suggested an association with
improvements in weight status and health. BMI z-score was reduced by 0.21 at 3
months, which was maintained at 6 months. This magnitude of change is 3.5
times that recorded in the Cochrane review of parent-focused lifestyle
interventions (effect size at 6 months -0.06, 95% CI: -0.12 to -0.01) (Oude
Luttikhuis, Baur et al. 2009).
188
Waist circumference z-score was also reduced at 3 and 6 months. A decreased
waist circumference indicates reduced intra-abdominal fat, associated with
improvements in metabolic complications of obesity and cardiovascular risk
(Shelton, Le Gros et al. 2007; Hughes, Stewart et al. 2008). Other interesting
findings were improved diastolic blood pressure, which was unexpected, as all
children were normotensive at baseline. Reduction in diastolic blood pressure
provides some indication that the physical activity component of the intervention
may improve cardiovascular fitness (Kirk, Zeller et al. 2005; Farpour-Lambert,
Aggoun et al. 2009). Finally, the observed improvements in self-esteem, a risk
factor for the development of impaired psychological status in obese children,
suggested that the programme also improves psychological health (Griffiths,
Parsons et al. 2010).
As stated earlier, statistically significant findings were unexpected due to the
small sample size, but suggested potential for the intervention if replicated when
delivered at scale. However, without a control group, it is not possible to attribute
any of these improvements to the programme, as simply participating in the trial
itself may produce positive findings. The trial also provided data that were used
to inform the power/sample size calculation for the RCT.
The initial small trial had significant limitations, including uncontrolled study
design, lack of blinding, small sample size and lack of qualitative process
evaluations. Furthermore, the intervention was delivered by a specialist clinical
team, which provided no indication of whether analogous results could be
obtained when delivered by other non-specialist professionals. As all parents
classified their children as white ethnicity, the sample did not reflect the ethnic
diversity of the UK population.
189
Our preliminary findings warranted further investigation to determine whether
similar results could be achieved under controlled trial conditions, and the trial
was subsequently used to inform the MEND RCT (Appendix 3).
4.2 Findings that informed the MEND RCT
Evaluation of the feasibility of this novel intervention, as well as piloting its
methods provided useful findings that were incorporated in the planning of the
controlled trial.
Some of the lessons learnt included the realisation that there was a lack of solid
evidence on which to base childhood weight management interventions, and that
close attention to the emerging literature was important. Another positive
outcome that aided in continuation of the development and evaluation process
was that the feasibility trial provided some indication of potential benefits
associated with a multicomponent, community-based approach. No UK-based
evidence was available showing that this type of combined, multidisciplinary
approach could be successful at the time, and historically, many studies have
focused on only one or two components, i.e., nutrition and/or physical activity
and/or behavioural modifications (Summerbell, Ashton et al. 2003; Summerbell,
Waters et al. 2005). This presented the opportunity to continue development of
the intervention and conduct an adequately powered, controlled trial.
The MEND feasibility trial provided an opportunity to pilot methods and outcomes
for evaluation of the RCT. The following outcomes and their methods proved
feasible and provided valuable data for analysis: BMI (children and mothers),
190
BMI z-score, waist circumference, waist circumference z-score, blood pressure
and self-esteem. These outcomes and their methods were then considered for
evaluation of the RCT.
The method for conducting the step test proved feasible. However, the method
for measurement of recovery heart rate itself, following the step test, was not
validated in a paediatric population. For this reason, results of the step test were
not included in this thesis. However, the methods for conducting the step test
proved feasible in a community-setting and were therefore considered for
inclusion in the RCT.
Another positive finding of the feasibility trial was that the intervention, although
not well explored, appeared acceptable to families and produced significant
improvements in health outcomes. Thus, no fundamental changes were made to
the core structure of the programme. Use of the core structure, experience of
delivering the feasibility intervention, transcripts of the sessions, and a
professional writer's skills and experience facilitated manualisation of the
programme, leading to publication of the 1st edition of the MEND Programme
Manual (Section 6.5).
An observation during the feasibility trial was that obese children thoroughly
enjoyed both the land- and water-based physical activity sessions. It was
important to evaluate whether obese children engage and participate in twice-
weekly physical activity sessions, in view of earlier evidence demonstrating that
obese children are typically less active than their healthy weight peers (HSE
2008; NICE 2009; DH 2011). In addition, other multicomponent approaches to
child weight management have not provided/incorporated physical activity
191
sessions within the interventions (Hughes, Stewart et al. 2008; Ford, Bergh et al.
2009; Oude Luttikhuis, Baur et al. 2009; Croker, Viner et al. 2012). The high
attendance and retention rates, combined with the observed improvements in
cardiovascular fitness, supported the maintenance of this component in the RCT.
4.3 Reflection on the research process
This small, uncontrolled trial was designed to assess the feasibility of
implementing an intensive community-based intervention for the management of
childhood obesity. On reflection, although the selected study design was
appropriate for this stage of evaluation, additional validated quantitative and
qualitative outcomes would have provided richer data. Use of non-validated tools
is not recommended when alternatives exist. The step test conducted by our
physiotherapist was not validated, and therefore did not allow sound conclusions
on changes in cardiovascular fitness. Fortunately, blood pressure data provided
an indication that cardiovascular fitness had indeed moved in a positive direction.
Other useful outcomes would have included a reliable measure of dietary intake
(Section 1.6.2) and physical activity levels (accelerometers). Unfortunately, at the
time of the trial, accelerometers were scarce, impractical, bulky and very
expensive, and therefore not employed. Alternatively, questionnaires may have
provided some information on physical and sedentary activity behaviours, but
validated and accurate questionnaires for measuring physical activity in children
were not available at the time of the intervention development (Reilly and
McDowell 2003; NOO 2011).

192
Additionally, qualitative evaluation would have provided valuable information
regarding children and parent acceptability and perceptions of the intervention,
along with feedback on logistical issues, such as timing, venues, length of
sessions as well as programme content.
Follow-up was reasonably short, and ideally, would have extended to at least 12
months from baseline in order to provide insights into the sustainability of the
outcomes noted at 3 and 6 months. However, there were insufficient resources
to conduct the follow-up study.
Despite methodological flaws, the trial provided some useful outcomes to
support the application of funding for conduction of a larger controlled trial.
Feasibility was also invaluable for developing and trialling the actual intervention,
and provided data for the RCT power calculation.
193
Chapter 5 Hypotheses and aims
5.1 Trial hypotheses
The trial hypotheses were as follows:
5.1.1 Hypothesis 1
The MEND programme will reduce waist circumference and BMI z-scores by
clinically significant amounts at 6 and 12 months in a group of obese 8-12 year
old children, thereby improving their weight status.
5.1.2 Hypothesis 2
Levels of self-esteem will improve as body composition and cardiovascular
fitness improve.
Secondary hypothesis
A secondary hypothesis, which was not conducted formally as part of my PhD,
but which has been included for completeness was:
5.1.3 Hypothesis 3
Outcomes of the MEND trial will be similar to those achieved when the MEND
intervention is implemented under service-level conditions across the UK.

194
5.2 Aims
The aims of the trial were:
1. To undertake a randomised, controlled, clinical trial to evaluate the MEND
childhood obesity intervention.
2. To compare changes in primary and secondary outcomes at 6 months
between groups.
3. To determine if waist circumference and BMI z-score changes at 6 and 12
months were clinically significant, compared with other childhood weight
management interventions.
4. To compare intra-participant changes in primary and secondary outcomes
for determining whether individual changes were sustained at one year
from baseline
5. The aim of the secondary data analysis was to investigate physiological,
behavioural and psychological benefits associated with different levels of
BMI z-score in children who participated in the RCT.
6. The aim of further research following the trial was to determine if the
MEND intervention was generalisable when implemented in diverse
communities across the UK.
To achieve all the above aims and substantiate the trial hypotheses, a number of
outcomes were collected. These included (i) anthropometrical indices: body
weight, height, BMI waist circumference, (ii) body composition, (iii)
cardiovascular health: fitness test, blood pressure, (iv) physical activity and

195
sedentary behaviours, (v) self-esteem, (vi) dietary intake, (vii) socioeconomic and
ethnicity data, (viii) puberty staging.
These outcomes and the methodologies implemented for assessment are
explained in detail in the next Chapter.
196
Chapter 6 Methods
6.1 Identification of reviewed literature
The majority of literature searches used PubMed Central as the main portal.
Google search was additionally utilised for the identification of governmental
reports and/or national and international recommendations that were not
published in peer reviewed journals. Books and manuals were used wherever
applicable.
Publications on the background, introduction, prevention, management,
development of the intervention, and Discussion chapters were included in
preference if they were meta-analyses, systematic reviews, reviews, practice
guidelines, RCTs or large clinical trials with objectives corresponding to the
outline of each chapter or section, or with similar characteristics to the current
trial when used for comparison purposes. Supporting literature was selected
based on study design, sample size, journal impact factor, study research centre,
and author reliability. All efforts were made to include the most recent available
literature (after 2005 or 2000, depending on availability), with the exception of
key references with multiple citations that are routinely used to justify specific
statements (e.g., growth chart reference, dietary assessment tool description
references). Wherever research findings were ambiguous or inconclusive, all
scenarios were presented and referenced, and the findings critically appraised.
Small uncontrolled studies on populations with different profiles (e.g., those from
developing countries and on pre-schoolers or children in late adolescence) were
excluded from the literature search, along with non-English publications.

197
The following keywords were used to conduct the literature review:
Prevalence: childhood, obesity, overweight, prevalence, cost, review, parental
obesity, maternal obesity, age, gender, ethnicity, social class, socioeconomic
status, income, urban, rural, deprivation, physical activity, sedentary activity,
transportation, international worldwide, Europe, United Kingdom, Health Survey
for England, National Child Measurement Programme, obesity projections,
obesity plateau, International Association for the Study of Obesity, developed
countries, developing countries, future projections, forecast.
Assessment: childhood obesity, assessment, z-score, growth charts, BMI, waist
circumference, body composition, assessment, validity, central adiposity, weight
loss, childhood obesity screening, abdominal obesity, central obesity, adiposity in
children, skinfold thickness, bioelectrical impedance, underwater weighing, Air
Displacement Plethysmography, dilution techniques, doubly labelled water, Dual
Energy X-Ray Absorptiometry.
Causes: childhood obesity, causes, aetiology, genes, genetic, medical disorders,
drugs, parental obesity, parental eating behaviour, parental perception, family,
dietary intake, physical activity, television, sedentary, computer, perinatal
nutrition, pregnancy, gestational diabetes, breastfeeding, early feeding practices,
nutrition programming, adiposity rebound, socioeconomic status, inactivity,
psychology, self-esteem, depression, built environment, advertisements, role
models, junk food, sugary drinks, soft drinks.
Consequences: childhood obesity, consequences, short-term, long-term, health,
psychology, self-esteem, bullying, depression, body dissatisfaction, body image,
eating disorders, metabolic syndrome, insulin resistance, diabetes, adult obesity,

198
cardiovascular disease, risk factors, economic consequences, cost, health
system, socioeconomic status.
Dietary intake: childhood obesity, diet, macronutrients, energy intake, energy
expenditure, underreporting, misreporting, intervention, treatment, dietary
assessment, dietary reference values, recommended nutrient intake, 24-hour
recall, food diary, food frequency questionnaire.
Prevention: childhood obesity, prevention, schools, community, parents, family,
health promotion, health promotion, health education, diet, physical activity,
television, sedentary, inactivity, behavioural intervention, multi-disciplinary,
multicomponent.
Management: childhood obesity, management, treatment, group treatment,
individual treatment, intervention, recommendation, health education, best
practice, diet, physical activity, television, sedentary, behavioural intervention,
multi-disciplinary, multicomponent, bariatric surgery, pharmacological treatment,
cardiovascular fitness, blood pressure, heart rate, physical activity, exercise,
sedentary activities, inactivity, television, self-esteem, psychology, attendance,
retention, dropout, effectiveness, effect size, follow-up, Traffic Light Diet, parents
as exclusive agents, GP, doctor, weight loss camps.
The remainder of this chapter discusses the methods for evaluation of the MEND
intervention informed by findings of the feasibility trial described in Chapter 4. It
should be noted that the MEND RCT was conducted for the purposes of this
PhD.
199
6.2 Standardisation
In 2003 to 2004, following the feasibility trial, Dr. Paul Chadwick and I
standardised and manualised the programme to make it generalisable for
delivery by other non-obesity specialist professionals in a variety of community
settings.
6.3 Training
To ensure standardised delivery across multiple trial sites, all theory and
exercise leaders received identical training (4 days) and materials, specifically,
theory (nutrition and behaviour modification) and exercise manuals, children’s
handouts, programme resources, and teaching aids. The manuals contained
detailed guidance for the delivery methods for all sessions (Section 6.5). The
importance of standardised delivery of the intervention was highlighted
throughout the training, and involved practical role plays to ensure effective and
consistent delivery.
6.4 Intervention resources
A programme kit was created with the dual aim of standardising the intervention
and supporting the leaders (Figure 26). The kit additionally contained resources
for participants (backpack, binder and handouts). Resources were referenced in
the manuals, and the leaders provided with detailed guidance on their usage to
ensure the appropriate learning outcomes for each session. The kit was also
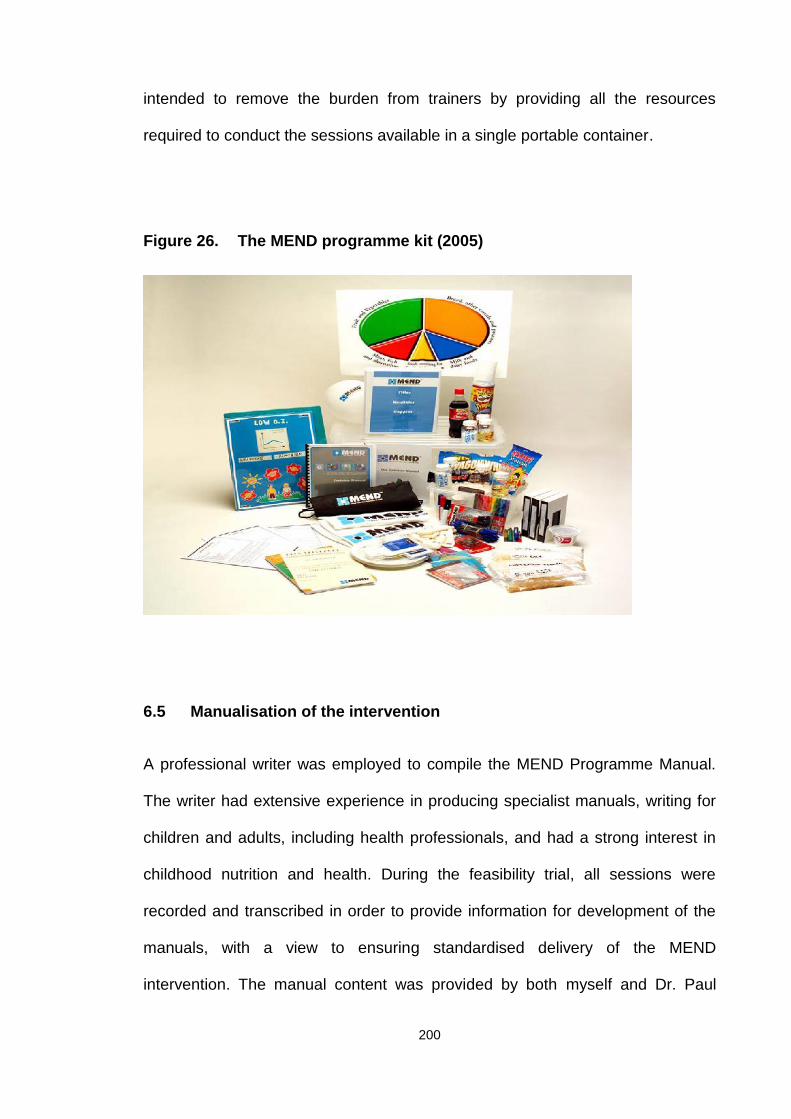
200
intended to remove the burden from trainers by providing all the resources
required to conduct the sessions available in a single portable container.
Figure 26. The MEND programme kit (2005)
6.5 Manualisation of the intervention
A professional writer was employed to compile the MEND Programme Manual.
The writer had extensive experience in producing specialist manuals, writing for
children and adults, including health professionals, and had a strong interest in
childhood nutrition and health. During the feasibility trial, all sessions were
recorded and transcribed in order to provide information for development of the
manuals, with a view to ensuring standardised delivery of the MEND
intervention. The manual content was provided by both myself and Dr. Paul

201
Chadwick in both written and verbal forms, which were combined with the
transcripts of the feasibility trial to produce draft sessions. All draft sessions were
reviewed and amended as necessary, until final approval from myself and Dr.
Paul Chadwick.
The format and structure of the manual was developed by the writer, based on
individual research and experience of the most effective formats for
dissemination of a health education programme by a wide range of professionals
aimed at families. The aim of the manual was to promote quality assurance and
standardisation between research sites. A 216-page manual was produced after
14 months of consultations, discussions and development, consisting of the
following sections: Introduction, 8 Mind (behaviour modification), 8 Nutrition,
Farewell, and appendices containing sources of further reading, useful
addresses, resources, and 25 healthy recipes. Each session contained
supporting material for parents and children (handouts) written specifically to
meet the reading requirements of the average age of primary school children. A
separate exercise manual was compiled by Fitpro Ltd. to standardise the
exercise sessions.
Manuals were written with the aim of being culturally appropriate, and this was
primarily expressed by the inclusion of guidelines for eating during religious
holidays, such as Ramadan, Christmas, Easter and Passover. During the
manualisation process, feedback was obtained from a variety of professionals
and incorporated into the final version. No formal evaluation or testing of the
manuals was performed.

202
6.6 Intervention delivery teams and locations
A Principal Investigator was assigned for each research site, and provided
guidance on selecting intervention delivery teams. Evidence suggests that the
type of health professional providing advice to families is not critical, as long as
they have the appropriate training and experience, are enthusiastic and able to
motivate, and provide long-term support (NICE 2006).
A minimum of 3 trained professionals was required for each research site team.
Teams comprised a nutrition theory leader, a behavioural theory leader, an
exercise leader and an optional assistant. The nutrition and behavioural theory
leader was the same person at all but one site. The professional backgrounds of
the MEND leaders at each site are summarised in Table 12.
Table 12. Locations and professional backgrounds of MEND leaders
LocationNutrition
theory leaderBehaviouraltheory leader
Exercise leader Assistant
Bromley PCT Dietitian Dietitian Exercise trainer Nutritionist
Lewisham
PCT (1)*Dietitian Dietitian
Physiotherapist
and Exercise
trainer
Dietitian and
Nutritionist
Lewisham
PCT (2)Dietitian Dietitian Exercise trainer Nutritionist
Southwark
PCTNutritionist Nutritionist Exercise trainer Nutritionist

203
* Paul Sacher fulfilled the role of nutrition and behavioural theory leader at this site
6.7 Training
Training for the intervention took place over 4 days, consisting of one day on
nutrition, one day on behaviour modification, and two days on physical activity
(one day of land- and one day of water-based activities). All training was
developed specifically for this trial. I developed and delivered the first day of
training, Dr. Paul Chadwick the second, and Fitpro Ltd. provided the third and
fourth days of physical activity training.
Training took place at Ladywell Leisure Centre (261 Lewisham High Street,
London, SE13 6NJ), and was attended by all teams, except Waveney PCT.
Training for Waveney PCT took place in Suffolk due to the high costs associated
with travel to London and accommodation.
The training modules were not designed as a general guidance for nutrition,
behaviour modification and physical activity, but aimed to specifically instruct
teams on delivering these components of the intervention using the trial
resources provided (Figure 26).
Day 1 consisted of introduction to the trial and an overview of the research
protocol. This included roles and responsibilities of the principal investigators and
their respective delivery teams (i.e., theory and exercise leaders). Information
was provided on the aims of the trial and the background for creation of the
Waveney
PCTDietitian Social worker PE teacher Nutritionist
204
MEND programme. Details of the structure of the programme and methods for
delivery of all sessions were provided. Delivery teams were also instructed that
this was a group-based intervention and no individualised advice was to be
provided during the programme sessions. Teams were advised to report adverse
events and refer back to the families’ GPs in cases of medical concerns. The
remainder of the day was spent discussing the nutrition component of the
intervention in detail.
Day 2 consisted of an overview on the psychosocial consequences of childhood
obesity, including self-esteem and eating disorders. Guidance on raising the
weight issue and detailed discussions on effective delivery of the behaviour
change sessions were included. The day ended with role plays to evaluate the
competency of the theory leaders. There were opportunities throughout days 1
and 2 of training for issues, concerns and questions to be addressed. Qualitative
feedback from training participants was obtained.
Days 3 and 4 consisted of land and water-based exercise training, which was
delivered to both theory and exercise leaders. The training involved
demonstrations of manualised exercise sessions plus education on physiological
considerations when delivering physical activity to obese children.
In addition to the above training, I provided one-to-one training for principal
investigators, which focused on their roles and responsibilities and recruitment
strategies for individual research sites and programmes.

205
6.8 The MEND RCT intervention
The intervention consisted of two phases: intensive (0-9 weeks) and post-
intensive (10-24 weeks). The intensive phase of the MEND intervention
consisted of 18 group sessions delivered over 9 weeks. The sessions comprised
an introductory meeting, 8 theory sessions focusing on behaviour modification, 8
theory sessions providing nutrition education, 18 physical activity sessions, and a
final closing (graduation) session.
Weekly theory sessions alternated between nutrition and behaviour modification.
Children participated in physical activity sessions twice weekly after the theory
sessions, while parents participated in parent-only unstructured, facilitated,
problem solving discussions. Table 6 provides details of the 18 sessions.
Group sessions lasted for 2 hours, and were held twice weekly in leisure centres
and school venues. Each group consisted of 8-15 children plus an
accompanying parent/carer. Sessions were delivered after school and work
hours, typically from 5:30-7:30 p.m., with a view to improving attendance of both
children and parents/carers.
The post-intensive phase consisted of the provision of a free pass for the entire
family to attend a local leisure centre swimming pool. Ideally, the post-intensive
phase of the trial would have included on-going structured physical activity
sessions, similar to those provided during the programme, however resources
did not allow for this. In addition, children were not allowed to exercise in the
leisure centre gyms or classes as they were under the age of 16. We therefore
aimed to evaluate whether provision of the free swimming pass would encourage
families to exercise together and promote sustained physical activity behaviours.
206
6.9 Study design
6.9.1 MRC guidance on evaluating a complex intervention
According to the MRC framework for developing and evaluating complex
interventions, several study designs are available to assess different types of
interventions, and randomisation should always be considered to avoid selection
bias (Craig, Dieppe et al. 2008).
A RCT was selected as the most appropriate study design to evaluate the
efficacy of MEND for the management of childhood obesity. This RCT was
designed to assess the effectiveness of a 6-month intervention, compared to a
delayed intervention group. The intervention was delivered at 5 separate
community sites by teams with no previous experience of delivery. All eligible
participants were assessed at baseline and randomly allocated to start the
intervention (immediate intervention group) or receive the intervention 6 months
later (control group or delayed intervention group).
Ideally, a period of 12 months would have been selected over 6 months for the
delayed intervention group. However, the ethics committee approving this trial
felt that it was not ethical to make treatment-seeking families wait longer than 6
months. In addition, it was hoped that offering the control group the intervention
at 6 months from randomisation would aid in recruitment and retention.
Measurements were performed at baseline, 3, 6, 9 and 12 months from
randomisation (Figure 27). It is important to note that baseline and 6 month
measurements were performed before and after the intervention for the
immediate intervention group. After 6 months, the control group received the
(delayed) intervention. Therefore, for these children, 6 month and 12 month
207
measurements were the 'before' and 'after' intervention measurements. In the
within-subject analysis presented in the Results section, children from both
groups were included.
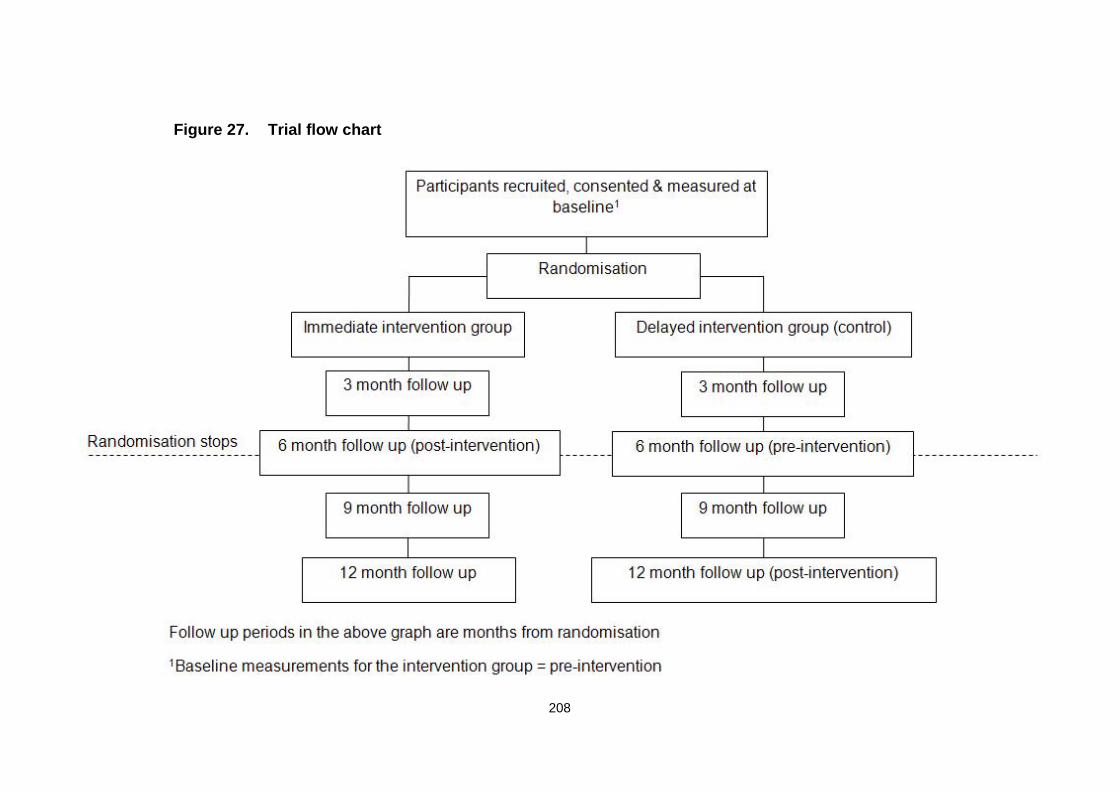
208
Figure 27. Trial flow chart

209
6.9.2 Participants
Eligibility criteria
The following inclusion and exclusion criteria were applied to select participants
in the trial:
Inclusion criteria
1. Children referred by a health professional or self-referred.
2. Children between 8-12 years of age.
3. Obese, defined as BMI above the 98th centile on the BMI chart for boys/girls
(UK reference data) (Cole, Freeman et al. 1995).
4. At least one parent or carer able to attend each session.
5. Clinically well with no chronic illness.
Exclusion criteria
1. Children with physical disabilities that would exclude their participation in
exercise sessions.
2. Those with significant developmental delay or psychiatric diagnosis
(children with these conditions need a more specific, tailored intervention,
and are unlikely to obtain maximum benefit from the trial).
3. GP advised unsuitability for the trial.

210
4. Children with conditions that clinically cause obesity, e.g., steroid use,
specific syndromes.
A letter was sent to the GPs of all children excluded from the trial, which
included information on their weight status and reason for unsuitability, leaving
clinical management at the discretion of the respective doctors.
Recruitment
Obese children were identified using two methods that had been successfully
evaluated and refined in the feasibility trial (Sacher, Chadwick et al. 2005).
Principal investigators were encouraged to develop an individualised
recruitment strategy for their trial site with my support. The strategies varied
among sites, depending on their experience and local networks and contacts.
Each principal investigator had a local number for families to call where they
could obtain more information on the locally delivered programme, e.g., time,
day, and venue. In addition, all families were given a number on the information
sheets for the researchers based at the Institute of Child Health, where they
were provided with specific information verbally and by post.
Methods of recruitment were broadly divided into 2 categories.
1. Health professional referral: local paediatric dietitians, school nurses, GPs
and paediatricians were informed of the trial by the Principal Investigators.
These professionals were provided with trial information packs (boys and
girls BMI charts, poster and leaflets, parent and child information sheets),
211
with a view to identifying families meeting the trial eligibility criteria and
providing them with the information sheets (Appendix 4). In some cases,
health professionals conducted a patient record review to identify suitable
children for the study who were then sent a letter containing an introduction
to the trial as well as the parent and child information sheets. Families
interested in participating were provided with contact details to obtain
further information. No personal data was provided to the research team
from health professionals without the families' consent.
2. Self-referral: the trial was advertised in local newspapers (editorials and
paid) and on the internet. The advertisement and editorials requested
interested parents to contact a designated local telephone number or the
Institute of Child Health for more information. The information sheets clearly
stated that parents and children interested in participating in the trial should
contact the research team via telephone. During the first call, parents were
asked to provide the age and estimated height and weight of their child,
along with information on any medical conditions, with the intention of pre-
screening children who did not meet the inclusion criteria.
If children did not meet the inclusion and exclusion criteria (e.g., outside the age
range and/or not above the 98th centile for age and gender (i.e., not obese) or
with a medical diagnosis), they were not invited for baseline measurements. It
was politely explained to parents or carers that their child was not eligible.
Those who fulfilled the age and weight status criteria and had no medical
conditions were offered an appointment for baseline measurements.
At the time of baseline measurement, all children meeting the eligibility criteria
were invited to participate in the trial. Consent and assent forms (for parents
212
and children, respectively) were signed by both researchers and families to
confirm trial entry (Appendices 5 and 6). Both forms included permission for the
researchers to contact the child’s GP. Children who did not meet the inclusion
criteria were not invited to participate, and permission from the parent was
requested in order to notify their GP.
Families that were unsure about participation were given the forms to take
home, along with a self-addressed, stamped envelope to return if they decided
to participate. Once consent and assent forms were signed, letters were sent to
the respective GPs informing them of patient inclusion in the trial and requesting
contact in case there was any reason to preclude them from participation
(Appendix 7). Participants were free to withdraw from the trial at any stage.
6.9.3 Randomisation
Participants were randomised by an independent researcher using a random
permuted block design with size 6 blocks. The randomisation schedule was
computer-generated. An administrative staff member notified the families of the
group to which they had been assigned to ensure that the researchers
collecting outcome data were blinded to group allocation. Following participant
consent, it was explained that it was important not to reveal their group
allocation to the researcher performing measurements.
However, owing to the delayed intervention and intensive interactions between
families and researchers, and because participants were keen to discuss their
measurements with the research team, blinding to the randomisation was not
eventually possible.
213
6.9.4 Sample size
Based on the feasibility trial (Sacher, Chadwick et al. 2005), analysis of
covariance (ANCOVA) was used to detect a 3 cm difference in waist
circumference (primary outcome) between randomised groups. Assuming 5%
significance and 80% power, 40 children needed to be recruited to each group.
Taking into account 20% dropout (10% dropout during the feasibility trial), 48
children per group were required, making a total of 96. The trial also had 80%
power to detect a 0.45 standard deviation change in individual subjects at 3, 6,
9 and 12 months from randomisation.
6.9.5 Outcome measurements
Data were collected at baseline, 3, 6, 9 and 12 months by two researchers (PS,
MK) with the assistance of the local Principal Investigators. All measurements
were observed or checked by the Principle Investigator at each site.
6.9.6 Anthropometry
Body weight was measured using electronic scales with an accuracy of 0.1
kg. Scales were positioned on a firm level surface away from any
encumbrances and automatically calibrated. Subjects were asked to remove
shoes and outer clothing and to stand on the centre of the scale, keeping still,
while facing forwards with their hands at their sides. This procedure was
repeated twice and weight was recorded in kilograms to one decimal place
(Heyward 1998).
214
Standing height was measured to the nearest 1 mm using a stadiometer.
Subjects were asked to remove shoes and outer clothing. Subjects stood
straight with feet flat, back, shoulders, head, buttocks and calves against the
stadiometer backboard, heels against the heel plate, and head in the horizontal
Frankfurt (orbito-meatal) plane. Subjects were asked to breathe normally and
remain still. The head-plate was then placed on top of subject's head and the
measurement recorded in metres to two decimal places (Heyward 1998).
The above indices were measured for both children and parents, and
subsequently used to calculate the BMI by dividing weight (kg) by height
squared (m2). Children were classified as obese at BMI ≥ 98th centile for age
and gender (Cole, Freeman et al. 1995). Parents with BMI values between 25
and 29.99 kg/m2 were classified as overweight, while those with a BMI above
30 kg/m2 were classified as obese (NICE 2006).
Waist circumference was measured by the same researcher using a non-flexible
tape measure. Subjects were asked to stand straight. The researcher identified
the narrowest girth of the waist, usually about 4 cm above the umbilicus. If this
proved to be difficult then the subject was asked to bend to the side and the
researcher then identified the point at which the trunk folded, and used this as
the landmark. The waist circumference was then measured and recorded at this
point with the tape horizontal (Rudolf, Walker et al. 2007).
Detailed description of the Standard Operating Procedures (SOP) for weight,
height and waist circumference measurements are provided in Appendix 8 and
9.
215
6.9.7 Body composition
Body composition was based on the hydrometry two-component model. Total
body water (TBW) content was measured via deuterium oxide dilution, with 2-
hydrogen as the isotope of choice (deuterium) (Wells, Fuller et al. 1999).
According to this model, body weight is divided into fat-free mass (FFM) and fat
mass (FM). FFM was calculated using the equation: FFM = TBW/HFFM, whereby
HFFM represents the fraction of FFM that is water, according to the
corresponding age- and sex-specific values.
Based on the principles of the two-component model and values for FFM, fat
mass (FM) was calculated as follows: FM = wt – FFM. Body fat (BF%) was
estimated using the equation: BF% = (FM/wt) x 100.
In order to prepare the deuterium, sample tubes and salivettes were labelled
with subject reference details and the date. Deuterium doses according to body
weight were prepared for each participant. On site, a saliva sample was
obtained prior to dosing. The deuterium solution was then drunk by the subject.
The dosing time was recorded and instructions provided to families which
detailed procedures for obtaining a subsequent saliva sample and recording of
fluid intake between samples. Samples were posted to the researcher's address
and analysed in the laboratory in order to derive FFM and FM. Detailed
description of the SOP is provided in Appendix 10.
216
6.9.8 Cardiovascular health
Cardiovascular fitness was assessed based on the recovery in heart rate one
minute after a validated 3-minute step test standardised for rate and height.
Before conducting the test the platform height was adjusted according to the
child’s height. Resting pulse was recorded for 15 seconds followed by 3 minutes
of stepping at the rate indicated by metronome. After 3 minutes, stepping
ceased and the subject sat down on the step. The researcher then recorded
immediate post-exercise pulse rate for 15 seconds. Following this, the subject
remained resting for another minute and resting pulse rate was recorded for 15
seconds. (Francis and Feinstein 1991). The SOP for measurement of heart rate
recovery following the step test is included in Appendix 11.
Systolic and diastolic blood pressures were measured in the supine position,
from the left arm with an appropriately sized cuff and automated blood pressure
monitor. Three blood pressure measurements were taken after a 10-minute
rest, and the average of the last two measurements used for analysis (Sanchez-
Bayle, Munoz-Fernandez et al. 1999). Detailed description of the SOP for
measuring blood pressure is provided in Appendix 12. Blood pressures
recorded above the 91st centile were reported to the respective GPs.
6.9.9 Physical activity and inactivity
Levels of physical activity and sedentary behaviours were assessed using a
non-validated questionnaire adapted from Slemenda et al. (1991). This included
the number and duration of physical education lessons, as well as time spent on

217
different types of vigorous activities (e.g., sports) and sedentary activities (e.g.,
television, computer).
The procedure described below was used to complete the exercise
questionnaire.
Parents and children were asked to provide information on:
1. How many Physical Education (PE) lessons they took part in per week. If
the assessment took place during school holidays, children were asked
about the number of PE lessons they participated in during the previous
school term.
2. The duration of each PE lesson.
Parents were asked to estimate:
1. The number of hours per week their child spent watching TV and videos,
on the computer and playing video games (school days and nights).
3. The number of hours their child spent watching TV and videos, on the
computer and playing video games at weekends.
4. The number of hours per week their child spent on the following activities
(excluding physical education): cycling, swimming, running, football,
aerobics or dancing, gymnastics, walking, tennis or badminton, netball,
hockey, basketball, rugby, skating or any other sport.
5. The total number of hours their child spent in vigorous activity (defined as
activity leading to the child getting out of breath or sweating) per week.
218
6. Their child’s activity level, compared to peers, for classification as:
significantly lower than peers, lower than peers, same as peers, more
than peers, or significantly more than peers.
Time spent in each activity was summed up to generate total physical activity
time per week. Time spent watching TV and videos, on the computer and
playing video games on weekdays and weekends was summed up to derive
sedentary activity time. A copy of the exercise questionnaire for children can be
found in Appendix 13.
6.9.10 Self-esteem
Self-esteem was evaluated using the Harter Self-Perception Profile, a common
assessment tool validated for UK children of this age group (Harter 1985). A
modified version of the questionnaire was used for the current trial (Hoare, Elton
et al. 1993) (Appendix 14). This questionnaire was completed by the child with
the researcher’s assistance if needed, and consisted of 36 statements divided
into the following categories: scholastic competence, social acceptance, athletic
competence, physical appearance, behavioural conduct, and global self-worth.
Once completed, the questionnaire was checked for omissions and scored
according to the author’s instructions. More precisely, the 36 questions
corresponded to six sub-scales: global self-esteem, scholastic competence,
social acceptance, athletic competence, physical appearance and behaviour. A
score ranging from 1 to 4 was allocated to each response and the average
score (score range 1-4) for each sub-scale was generated. For the purposes of
the current study, only global self-esteem was used.

219
To minimise errors and facilitate data processing at follow-up, a system for rapid
and safe scoring of the above questionnaire was developed. This system
enabled the entry of raw data exactly as it appeared in the completed
questionnaires. Subsequently, by running an appropriately developed SPSS
syntax file, scores were automatically calculated, and children classified in the
corresponding categories. The syntax file and commands were based on the
scoring instructions in the questionnaire.
6.9.11 Dietary intake
The most common methods for assessing children's habitual dietary intake are
dietary recalls and food diaries. Seven-day diet records are commonly assumed
to provide accurate estimates of habitual energy intake. Three day diet records
were selected as the method for assessing dietary intake in the RCT. Parents
were asked to maintain a 3-day (two weekdays and one weekend day) diary of
all foods and drinks consumed by their child.
The majority of records were completed by the parent, but in many cases,
children contributed to the recording of their dietary intake. Parents and children
were shown how to complete the diary by the two research dietitians (PS, MK).
The procedure below was followed to instruct families on how to complete the
3-day food diaries.
1. Participants were asked to record everything they had eaten and drunk
for 3 days. They had to select 2 weekdays and one weekend day when
the child was eating and drinking normally.
220
2. The importance of accuracy for the food diary was explained, and
children and parents declared a ‘peace pact’ for the 3 days, whereby the
child was encouraged to reveal all food and drink consumed over this
period to parents without any repercussions.
3. Families were instructed to record all meals, snacks and drinks during
the 3 days.
4. A completed example day was used to demonstrate how to record foods
and drinks, as well as the amounts offered to children and left over.
5. Families were asked to weigh all foods and drinks, if possible, and failing
that, use household measures to describe quantities. A diagram with
household measures was used to explain this clearly.
6. Families were additionally requested to send food wrappers and
packaging back to the research team to increase the accuracy of the
analysis.
Data entry was performed by a trained dietitian and food selection was
performed in an effort to match foods recorded as accurately as possible. In
order to standardise the results, a “shopping list” was compiled of all unknown
items from the food diaries, and details of these products obtained from
supermarket visits. The data collected for each item included nutritional
information (energy, carbohydrate, sugar and fat content) and packet weight
and/or portion size to ensure selection of the most appropriate item available in
the Microdiet database and enable future use of the list as a reference.
221
Recipes were also analysed and all ingredients included in the analysis. Once
data entry was complete, the software generated daily energy, macronutrien
and micronutrient results for each participant. These were subsequently used to
derive the group daily averages.
6.9.12 Socioeconomic and ethnic group classification
Social classification was based on the occupation of the parent providing the
main financial support for the family, in accordance with the UK Registrar
General's Classification system. Ethnic background information was obtained
from parents, based on the UK census categorization (1993). Families were
grouped as social classes I, II, III (Manual and Non-Manual), IV, V or
unemployed. A social data collection form was created to record the data
(Appendix 15).
6.9.13 Puberty staging
A validated self-assessed Tanner line drawing puberty staging form was used
(Bonat, Pathomvanich et al. 2002). All children over the age of 9 years
completed a puberty staging questionnaire at each measurement session,
following verbal permission from parents. Boys and girls were left alone to
complete the form, which was returned in a sealed envelope to ensure privacy,
as no physician was present to perform the Tanner stage assessment.
222
6.9.14 Attendance and retention
An accurate record of attendance for each child participating in the intervention
was maintained. Individual attendance (%) was calculated for each participant
by averaging the number of MEND sessions attended as number of sessions
attended by the participant multiplied by 100 and divided by 18 (total number of
MEND sessions).
Group attendance (%) was calculated by averaging the individual attendance
for all participants receiving the intervention (immediate and delayed
intervention group). Children who were invited and agreed to participate in the
intervention but never attended any of the sessions or completed the
intervention were defined as 'dropouts'.
Retention rate was calculated at each follow-up time-point to assess the
percentage of children attending the measurement sessions. Retention rate was
solely based on presence at the measurement and not intervention sessions.
There was only one measurement opportunity for each family at all time-points,
due to restrictions with regard to availability of the community venues used to
perform the measurements.
Following the MEND programme, families were provided a free pass to attend
their local leisure centre swimming pool, as well as an attendance diary to self-
monitor the frequency of visits. Parents were asked to obtain a signature and
date from the attending receptionist to validate attendance. Unfortunately, there
was no mechanism to record whether parents and children or children alone
actually swam. Families were asked to submit their paper-based card at the
223
measurement session 3 months after receiving the swimming pass, once it had
expired.
6.9.15 Data
Primary data analysis
All variables were assessed for normality using the One-Sample Kolmogorov-
Smirnov non-parametric test. Randomised groups were compared at baseline,
3 and 6 months using an independent sample t-test for normally distributed
variables and Fisher’s exact test for categorical variables. Groups were
analysed as randomised. Secondary analysis included adjustment of trial
outcomes for differences between groups at baseline, i.e., follow-up
measurements were subtracted from baseline measurements and the
differences used in analysis. This was performed to eliminate baseline
differences that may have influenced the unadjusted results.
Paired comparisons of data from children from both groups collected before the
intervention and at 6 months were conducted using the appropriate
measurement time-points (baseline and 6 months for the intervention group,
and 6 and 12 months for the delayed intervention group). Paired comparisons
between data obtained at baseline and 12 months to assess the effectiveness
of the intervention were only conducted for subjects randomised to the
(immediate) intervention group, as no 12-month follow-up was available for the
control/ delayed intervention group (see also Section 6.9.1). Univariate analysis
was used to check for associations between changes in BMI and waist
224
circumference and their z-scores at 6 and 12 months and several predictors of
success. The results did not indicate the need for further multivariate analysis.
Statistical significance was set at p < 0.05. All analyses were conducted using
the SPSS 13.0 statistical software package for Windows (SPSS, Inc., Chicago,
IL).
Secondary data analysis
Secondary data analyses were carried out on two sub-samples of children
participating in the RCT. The first sub-sample consisted of a group of 71
participants from both arms from the original RCT who completed the 6-month
intervention (Figure 35). The second included a group of 42 participants
assessed at 12 months (6 months following the intervention). The delayed
intervention design of the original RCT meant that only participants who initially
received the intervention (arm 1 or immediate intervention group) were
assessed at 12 months (Figure 35). Analyses were performed using available
data, discarding records with missing measurements.
Data from 79 children from both groups were used in the analysis. Differences
in outcomes after 6 and 12 months from baseline were investigated using a t-
test.
Subjects were split into four subgroups on the basis of changes in the BMI z-
score as follows:
225
Group A: participants with an increase in BMI z-score of > 0
Group B: participants with a decrease in BMI z-score of ≥ 0 to <0.25
Group C: participants with a decrease in BMI z-score of ≥ 0.25 to <0.5
Group D: participants with a decrease in BMI z-score of ≥ 0.5
For all BMI z-score subgroups and each outcome variable, pre-intervention
levels and changes between ‘initial’ and ‘final’ measurements were summarised
as mean values and standard errors.
Differences in outcomes across the four BMI z-score subgroups were
investigated at two time-points, specifically, 6 and 12 months from baseline. For
each time-point, analysis of variance (ANOVA) was performed to determine
whether there were significant differences in the ‘initial’ means and mean
change of outcomes across the four BMI z-score subgroups.
A test for linear trend in the change of outcome variables after baseline using
linear regression was performed at 6 and at 12 months post-intervention to
assess whether BMI z-score change as a continuous variable predicted
outcome change. The test for linear trend at 6 months was adjusted for the
randomisation group. Assumptions of normality and homogeneity were
assessed post-hoc by examining QQ plots of the residuals of the fitted models.
Statistical significance was set at p < 0.05 two-tailed. All analyses were
conducted using SPSS 18.0 for Windows (SPSS, Chicago, IL).
226
Data handling
Apart from the dietary intake and self-esteem questionnaires, all other data
were collated by scanning data collection forms using Teleform version 10.2
desktop software and reader. Details on dietary intake and self-esteem data
handling are available in Sections 6.9.10 and 6.9.11.
Data cleaning
During form scanning or manual entry, data were assessed for obvious errors.
In cases where data were clearly wrong, values were discarded and handled as
missing. However, this occurred very rarely, as all measurements were double-
checked by researchers and the Principal Investigator during data collection.
Data storage and protection
Participant records (measurement sheets and questionnaires collected for all
visits) were grouped per site and stored in individual folders at the UCL Institute
of Child Health in locked cabinets. The trial was covered by UCL Data
Protection Registration (reference No Z6364106, section 19, research: health
research).
227
6.9.16 Ethical, safety and other considerations
Ethical considerations
Ethical approval for this trial was obtained from the Metropolitan Multi-Centre
Research Ethics Committee (MREC) on 2nd February, 2005 (Appendix 16). In
addition, site-specific ethical approval was obtained for all trial sites. Each trial
site had a Principal Investigator approved by MREC.
Local R&D approval was also required and therefore obtained for the Lewisham
PCT, Waveney PCT and Southwark PCT trial sites.
The trial was officially concluded on 13th January, 2007, and the Southampton
and South West Hampshire Research Ethics Committee (which replaced the
Metropolitan Multi-Centre Research Ethics Committee on 12th September 2006)
was duly informed (Appendix 17).
Safety considerations
Each venue of intervention delivery recorded incidents in an accident log book.
Insurance
No-fault compensation insurance cover was obtained for the trial (Appendix 18).
In addition, all trial sites were required to hold their own public liability
insurance, and copies of these were obtained for confirmation.

228
Trial registration
The trial was registered with the International Standard Randomised Controlled
Trial Number Register (www.isrctn.org) (ISRCTN30238779).
Trial sponsors
Great Ormond Street Hospital for Children NHS Trust and UCL Institute of Child
Health were the sponsors for the current trial.
Research staff involved in the trial
Paul Sacher was the Chief Investigator for this trial. Dr. Paul Chadwick,
Professor Tim Cole, Dr. Jonathan Wells, Professor Atul Singhal, Professor Alan
Lucas and Dr. Margaret Lawson approved the final RCT protocol. Professor
Atul Singhal, a paediatrician, was responsible for the medical care of
participants. Maria Kolotourou was the trial Research Assistant.
229
Chapter 7 Primary data analysis results
7.1 Trial flow chart
Figure 28 outlines the trial flow chart. One hundred and seventeen children
were recruited, among whom 116 were randomised (60 to the intervention and
56 to the control group). Among the 60 children randomised to the intervention
group, 54 completed the intervention. At 6 months, children in the control group
received the 6-month intervention.
7.2 Dates of recruitment and follow-up
Recruitment took place between March 2005 and January 2006. Twelve month
measurements were completed in January 2007.
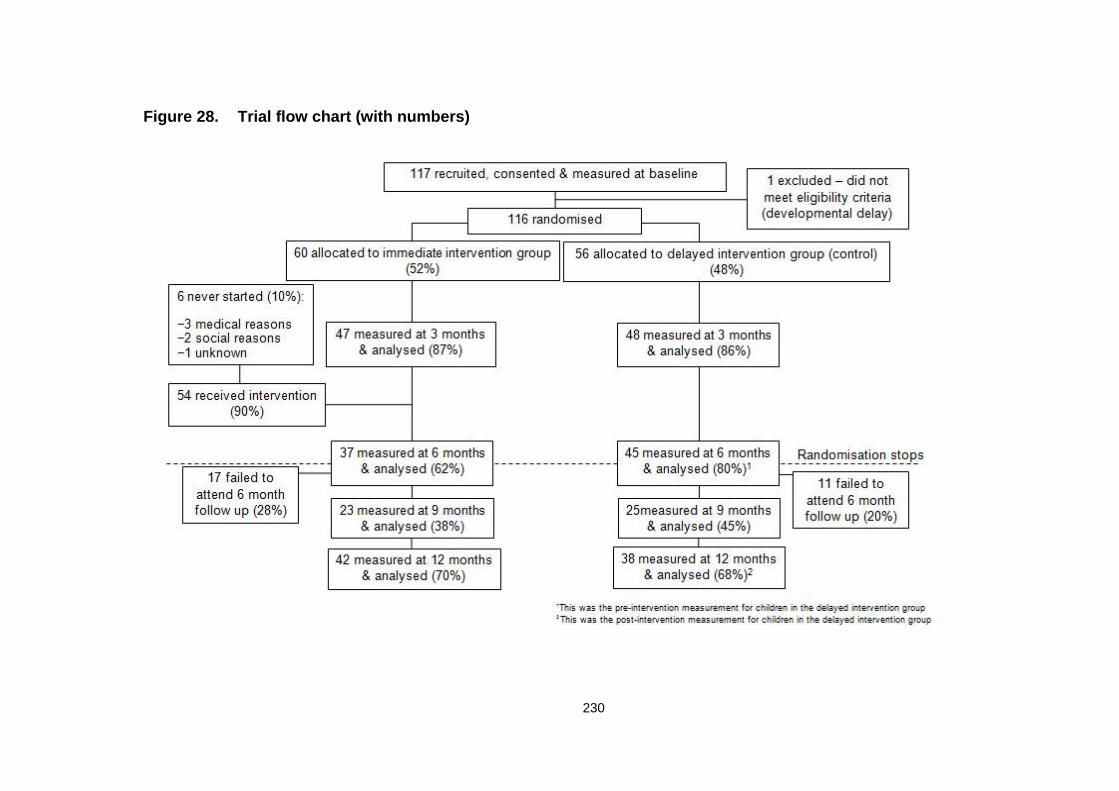
230
Figure 28. Trial flow chart (with numbers)
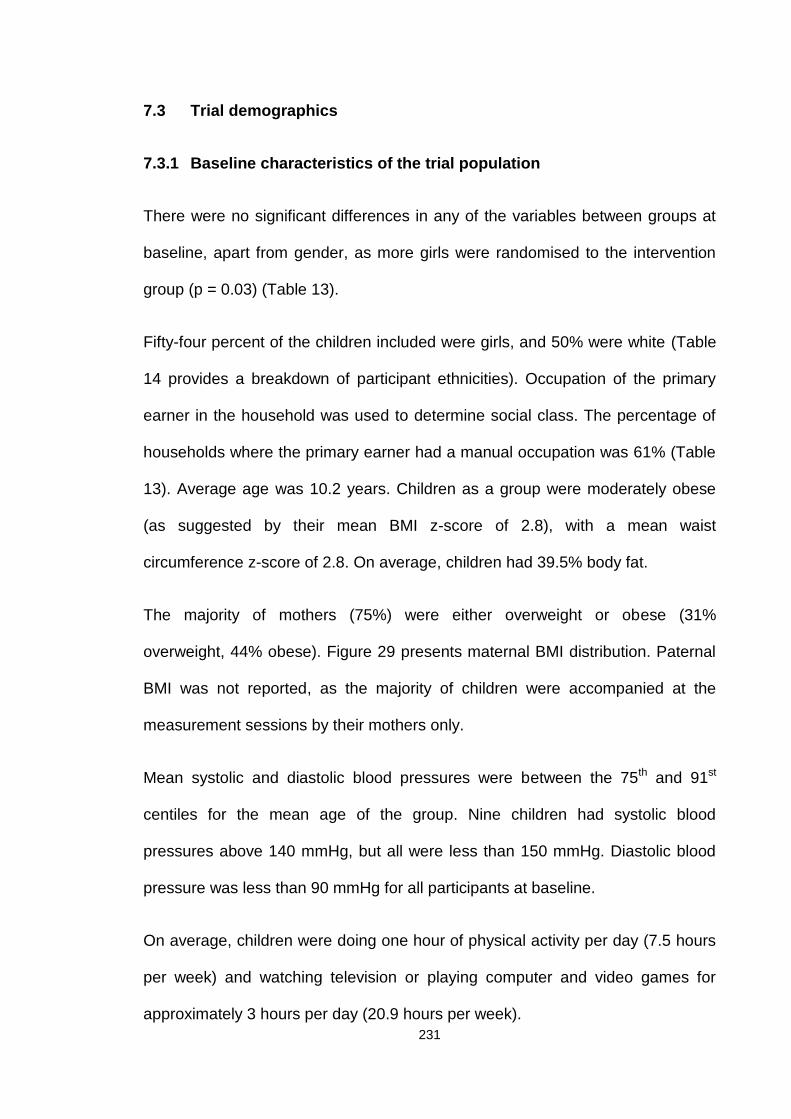
231
7.3 Trial demographics
7.3.1 Baseline characteristics of the trial population
There were no significant differences in any of the variables between groups at
baseline, apart from gender, as more girls were randomised to the intervention
group (p = 0.03) (Table 13).
Fifty-four percent of the children included were girls, and 50% were white (Table
14 provides a breakdown of participant ethnicities). Occupation of the primary
earner in the household was used to determine social class. The percentage of
households where the primary earner had a manual occupation was 61% (Table
13). Average age was 10.2 years. Children as a group were moderately obese
(as suggested by their mean BMI z-score of 2.8), with a mean waist
circumference z-score of 2.8. On average, children had 39.5% body fat.
The majority of mothers (75%) were either overweight or obese (31%
overweight, 44% obese). Figure 29 presents maternal BMI distribution. Paternal
BMI was not reported, as the majority of children were accompanied at the
measurement sessions by their mothers only.
Mean systolic and diastolic blood pressures were between the 75th and 91st
centiles for the mean age of the group. Nine children had systolic blood
pressures above 140 mmHg, but all were less than 150 mmHg. Diastolic blood
pressure was less than 90 mmHg for all participants at baseline.
On average, children were doing one hour of physical activity per day (7.5 hours
per week) and watching television or playing computer and video games for
approximately 3 hours per day (20.9 hours per week).
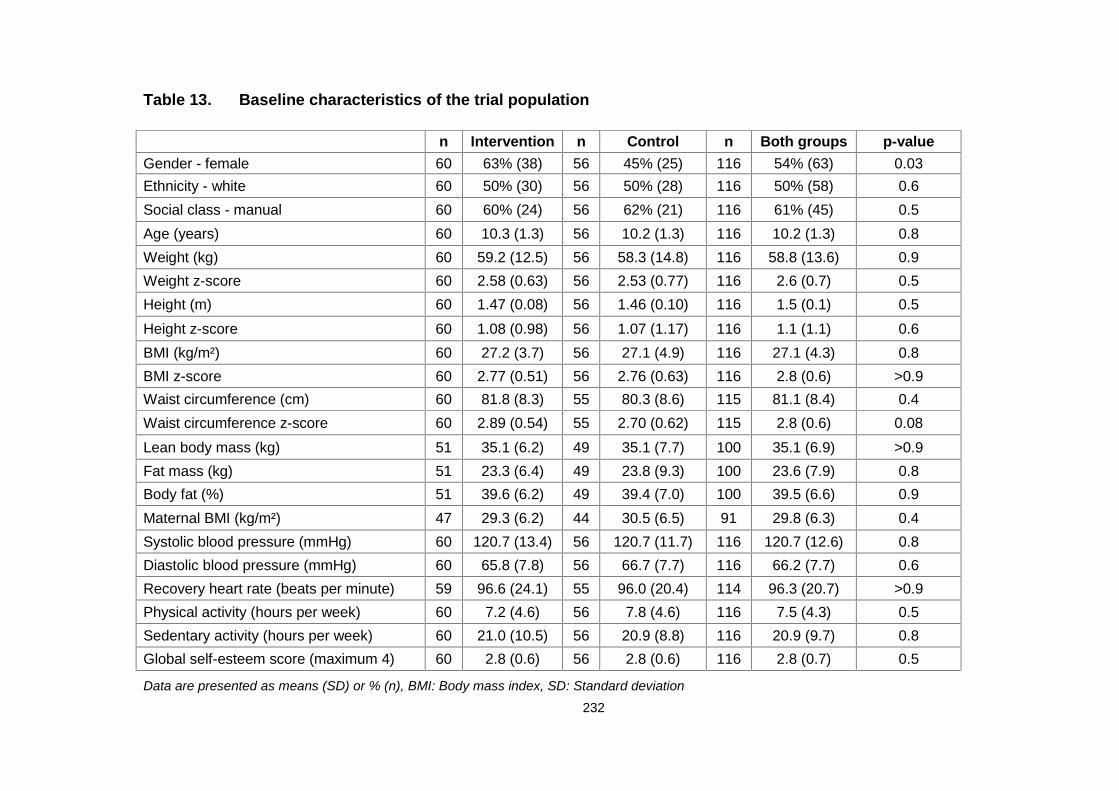
232
Table 13. Baseline characteristics of the trial population
n Intervention n Control n Both groups p-valueGender - female 60 63% (38) 56 45% (25) 116 54% (63) 0.03Ethnicity - white 60 50% (30) 56 50% (28) 116 50% (58) 0.6Social class - manual 60 60% (24) 56 62% (21) 116 61% (45) 0.5Age (years) 60 10.3 (1.3) 56 10.2 (1.3) 116 10.2 (1.3) 0.8Weight (kg) 60 59.2 (12.5) 56 58.3 (14.8) 116 58.8 (13.6) 0.9Weight z-score 60 2.58 (0.63) 56 2.53 (0.77) 116 2.6 (0.7) 0.5Height (m) 60 1.47 (0.08) 56 1.46 (0.10) 116 1.5 (0.1) 0.5
Height z-score 60 1.08 (0.98) 56 1.07 (1.17) 116 1.1 (1.1) 0.6BMI (kg/m²) 60 27.2 (3.7) 56 27.1 (4.9) 116 27.1 (4.3) 0.8BMI z-score 60 2.77 (0.51) 56 2.76 (0.63) 116 2.8 (0.6) >0.9Waist circumference (cm) 60 81.8 (8.3) 55 80.3 (8.6) 115 81.1 (8.4) 0.4Waist circumference z-score 60 2.89 (0.54) 55 2.70 (0.62) 115 2.8 (0.6) 0.08
Lean body mass (kg) 51 35.1 (6.2) 49 35.1 (7.7) 100 35.1 (6.9) >0.9Fat mass (kg) 51 23.3 (6.4) 49 23.8 (9.3) 100 23.6 (7.9) 0.8Body fat (%) 51 39.6 (6.2) 49 39.4 (7.0) 100 39.5 (6.6) 0.9Maternal BMI (kg/m²) 47 29.3 (6.2) 44 30.5 (6.5) 91 29.8 (6.3) 0.4Systolic blood pressure (mmHg) 60 120.7 (13.4) 56 120.7 (11.7) 116 120.7 (12.6) 0.8Diastolic blood pressure (mmHg) 60 65.8 (7.8) 56 66.7 (7.7) 116 66.2 (7.7) 0.6Recovery heart rate (beats per minute) 59 96.6 (24.1) 55 96.0 (20.4) 114 96.3 (20.7) >0.9Physical activity (hours per week) 60 7.2 (4.6) 56 7.8 (4.6) 116 7.5 (4.3) 0.5Sedentary activity (hours per week) 60 21.0 (10.5) 56 20.9 (8.8) 116 20.9 (9.7) 0.8Global self-esteem score (maximum 4) 60 2.8 (0.6) 56 2.8 (0.6) 116 2.8 (0.7) 0.5
Data are presented as means (SD) or % (n), BMI: Body mass index, SD: Standard deviation
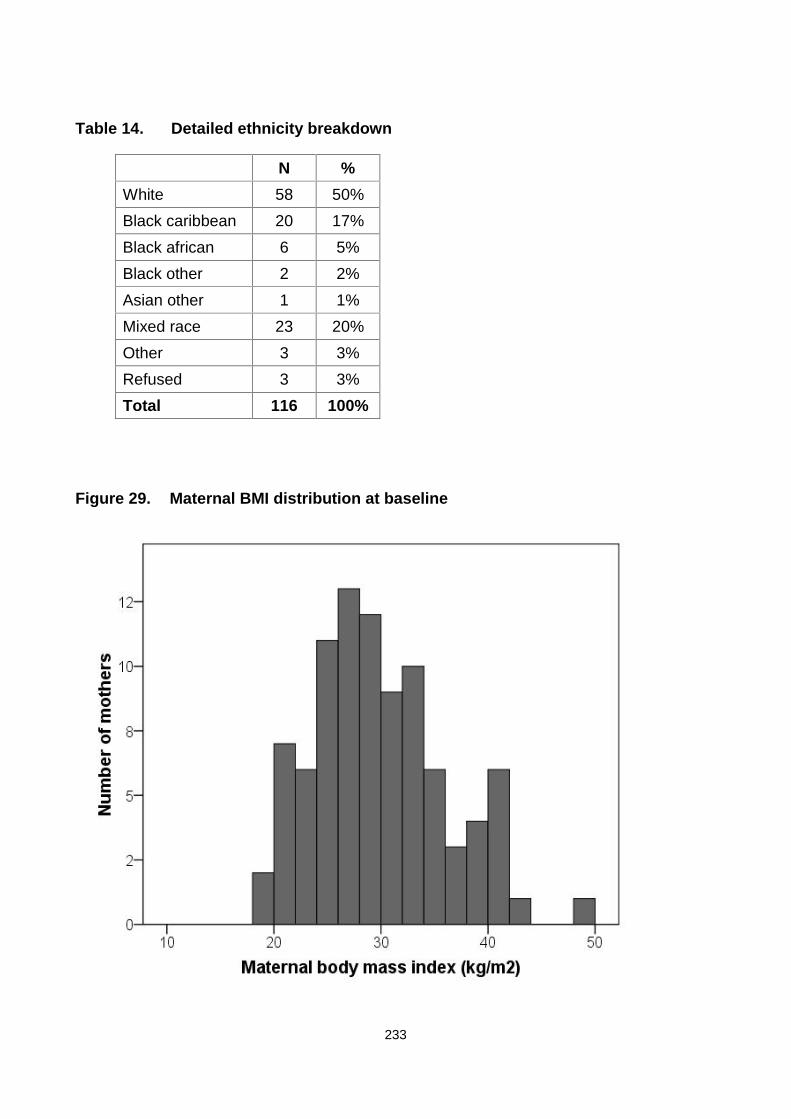
233
Table 14. Detailed ethnicity breakdown
N %White 58 50%Black caribbean 20 17%Black african 6 5%Black other 2 2%Asian other 1 1%Mixed race 23 20%Other 3 3%Refused 3 3%Total 116 100%
Figure 29. Maternal BMI distribution at baseline

234
7.3.2 Baseline dietary intake
According to Table 15, children consumed a mean 1922 kcal/day at baseline. The
macronutrient composition of children’s diets was 53% carbohydrate (21% sugars, of
which 14% non-milk extrinsic sugars), 15% protein, 36% fat (13% saturated fatty acids,
11% monounsaturated fatty acids and 6% polyunsaturated fatty acids). Sodium intake was
2659 mg/day. There were no significant differences in dietary data between groups at
baseline. Table 15 presents the dietary reference values for children aged 10 years for
comparison.
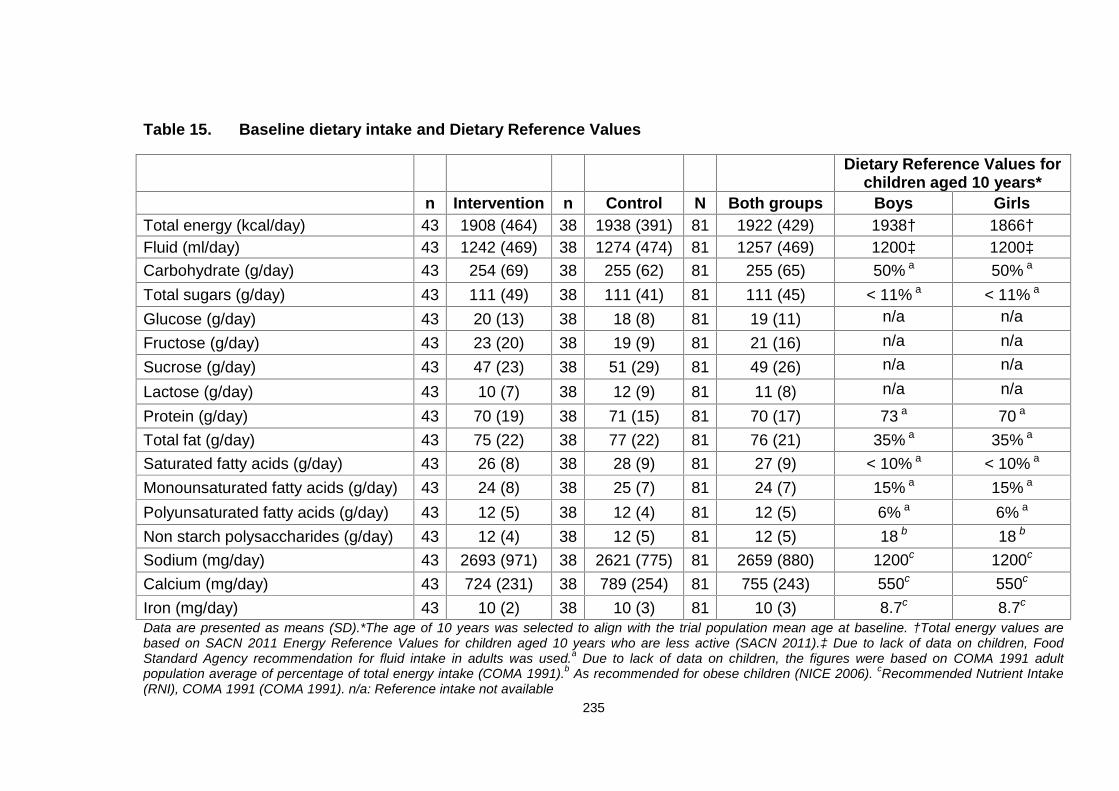
235
Table 15. Baseline dietary intake and Dietary Reference Values
Dietary Reference Values forchildren aged 10 years*
n Intervention n Control N Both groups Boys GirlsTotal energy (kcal/day) 43 1908 (464) 38 1938 (391) 81 1922 (429) 1938† 1866†Fluid (ml/day) 43 1242 (469) 38 1274 (474) 81 1257 (469) 1200‡ 1200‡Carbohydrate (g/day) 43 254 (69) 38 255 (62) 81 255 (65) 50% a 50% a
Total sugars (g/day) 43 111 (49) 38 111 (41) 81 111 (45) < 11% a < 11% a
Glucose (g/day) 43 20 (13) 38 18 (8) 81 19 (11) n/a n/a
Fructose (g/day) 43 23 (20) 38 19 (9) 81 21 (16) n/a n/aSucrose (g/day) 43 47 (23) 38 51 (29) 81 49 (26) n/a n/a
Lactose (g/day) 43 10 (7) 38 12 (9) 81 11 (8) n/a n/a
Protein (g/day) 43 70 (19) 38 71 (15) 81 70 (17) 73 a 70 a
Total fat (g/day) 43 75 (22) 38 77 (22) 81 76 (21) 35% a 35% a
Saturated fatty acids (g/day) 43 26 (8) 38 28 (9) 81 27 (9) < 10% a < 10% a
Monounsaturated fatty acids (g/day) 43 24 (8) 38 25 (7) 81 24 (7) 15% a 15% a
Polyunsaturated fatty acids (g/day) 43 12 (5) 38 12 (4) 81 12 (5) 6% a 6% a
Non starch polysaccharides (g/day) 43 12 (4) 38 12 (5) 81 12 (5) 18 b 18 b
Sodium (mg/day) 43 2693 (971) 38 2621 (775) 81 2659 (880) 1200c 1200c
Calcium (mg/day) 43 724 (231) 38 789 (254) 81 755 (243) 550c 550c
Iron (mg/day) 43 10 (2) 38 10 (3) 81 10 (3) 8.7c 8.7c
Data are presented as means (SD).*The age of 10 years was selected to align with the trial population mean age at baseline. †Total energy values arebased on SACN 2011 Energy Reference Values for children aged 10 years who are less active (SACN 2011).‡ Due to lack of data on children, FoodStandard Agency recommendation for fluid intake in adults was used.a Due to lack of data on children, the figures were based on COMA 1991 adultpopulation average of percentage of total energy intake (COMA 1991).b As recommended for obese children (NICE 2006). cRecommended Nutrient Intake(RNI), COMA 1991 (COMA 1991). n/a: Reference intake not available
236
7.4 Comparison of randomised groups at 3 months
After adjusting for baseline values, the differences between groups for BMI and
waist circumference and their z-scores were highly significant (p-value < 0.0001
for both variables) (Table 16).
Recovery heart rate and physical activity levels were improved in the intervention
group, compared to controls (adjusted and unadjusted values). Moreover, the
global self-esteem score adjusted for baseline was improved. All remaining
variables were altered favourably in the intervention group, but this improvement
did not reach statistical significance.
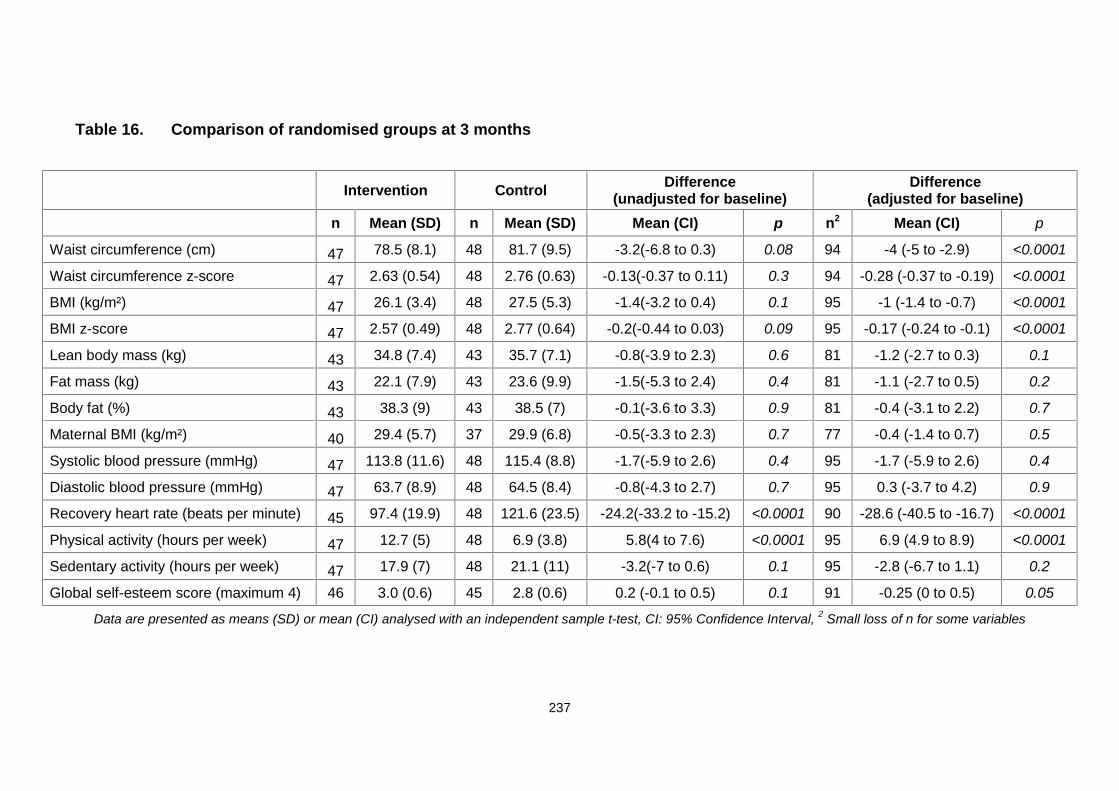
237
Table 16. Comparison of randomised groups at 3 months
Intervention Control Difference(unadjusted for baseline)
Difference(adjusted for baseline)
n Mean (SD) n Mean (SD) Mean (CI) p n2 Mean (CI) p
Waist circumference (cm) 47 78.5 (8.1) 48 81.7 (9.5) -3.2(-6.8 to 0.3) 0.08 94 -4 (-5 to -2.9) <0.0001
Waist circumference z-score 47 2.63 (0.54) 48 2.76 (0.63) -0.13(-0.37 to 0.11) 0.3 94 -0.28 (-0.37 to -0.19) <0.0001
BMI (kg/m²) 47 26.1 (3.4) 48 27.5 (5.3) -1.4(-3.2 to 0.4) 0.1 95 -1 (-1.4 to -0.7) <0.0001
BMI z-score 47 2.57 (0.49) 48 2.77 (0.64) -0.2(-0.44 to 0.03) 0.09 95 -0.17 (-0.24 to -0.1) <0.0001
Lean body mass (kg) 43 34.8 (7.4) 43 35.7 (7.1) -0.8(-3.9 to 2.3) 0.6 81 -1.2 (-2.7 to 0.3) 0.1
Fat mass (kg) 43 22.1 (7.9) 43 23.6 (9.9) -1.5(-5.3 to 2.4) 0.4 81 -1.1 (-2.7 to 0.5) 0.2
Body fat (%) 43 38.3 (9) 43 38.5 (7) -0.1(-3.6 to 3.3) 0.9 81 -0.4 (-3.1 to 2.2) 0.7
Maternal BMI (kg/m²) 40 29.4 (5.7) 37 29.9 (6.8) -0.5(-3.3 to 2.3) 0.7 77 -0.4 (-1.4 to 0.7) 0.5
Systolic blood pressure (mmHg) 47 113.8 (11.6) 48 115.4 (8.8) -1.7(-5.9 to 2.6) 0.4 95 -1.7 (-5.9 to 2.6) 0.4
Diastolic blood pressure (mmHg) 47 63.7 (8.9) 48 64.5 (8.4) -0.8(-4.3 to 2.7) 0.7 95 0.3 (-3.7 to 4.2) 0.9
Recovery heart rate (beats per minute) 45 97.4 (19.9) 48 121.6 (23.5) -24.2(-33.2 to -15.2) <0.0001 90 -28.6 (-40.5 to -16.7) <0.0001
Physical activity (hours per week) 47 12.7 (5) 48 6.9 (3.8) 5.8(4 to 7.6) <0.0001 95 6.9 (4.9 to 8.9) <0.0001
Sedentary activity (hours per week) 47 17.9 (7) 48 21.1 (11) -3.2(-7 to 0.6) 0.1 95 -2.8 (-6.7 to 1.1) 0.2
Global self-esteem score (maximum 4) 46 3.0 (0.6) 45 2.8 (0.6) 0.2 (-0.1 to 0.5) 0.1 91 -0.25 (0 to 0.5) 0.05
Data are presented as means (SD) or mean (CI) analysed with an independent sample t-test, CI: 95% Confidence Interval, 2 Small loss of n for some variables
238
Comparison of randomised groups at 3 months (dietary data)
Table 17 shows that total sugar, sucrose, total fat, saturated fat,
monounsaturated fat, and polyunsaturated fat intakes were significantly reduced
for the intervention group, compared to controls at 3 months, for both unadjusted
comparisons and after adjustment for baseline variables.
Over this period, the dietary fibre intake (non-starch polysaccharides) was
significantly increased among children in the intervention group, compared to
controls. Protein, calcium and iron intakes were not significantly different
between groups.
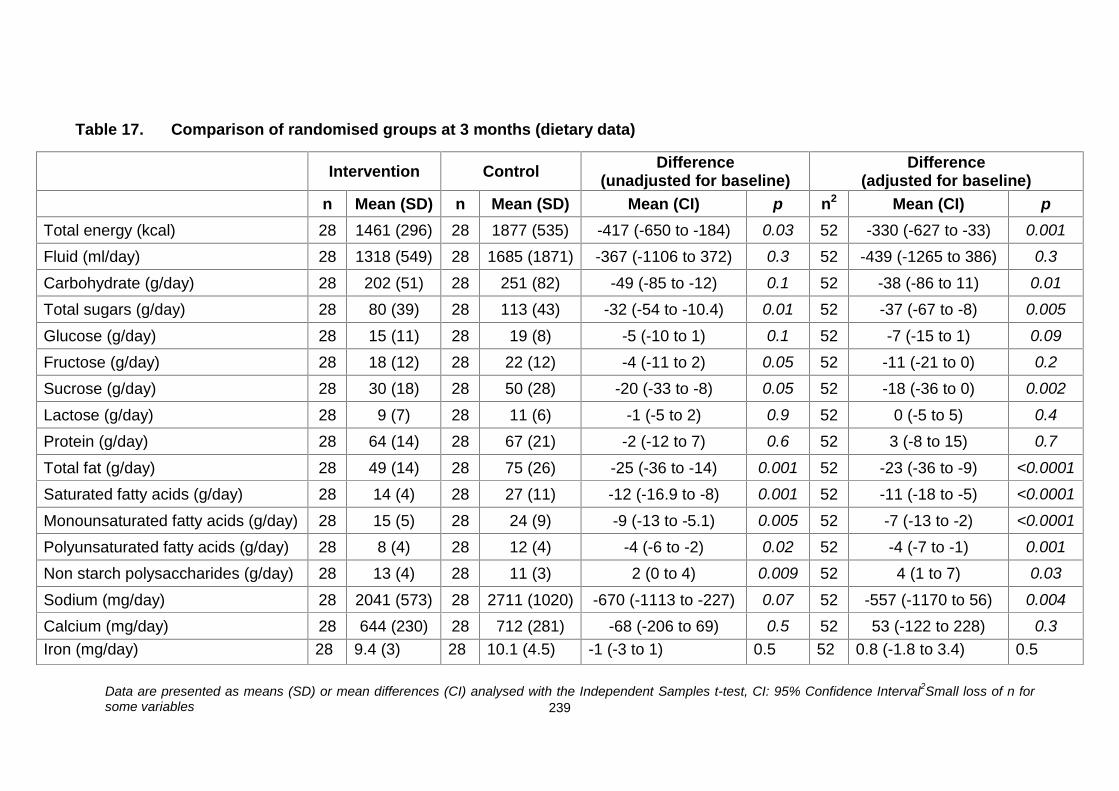
239
Table 17. Comparison of randomised groups at 3 months (dietary data)
Intervention Control Difference(unadjusted for baseline)
Difference(adjusted for baseline)
n Mean (SD) n Mean (SD) Mean (CI) p n2 Mean (CI) pTotal energy (kcal) 28 1461 (296) 28 1877 (535) -417 (-650 to -184) 0.03 52 -330 (-627 to -33) 0.001
Fluid (ml/day) 28 1318 (549) 28 1685 (1871) -367 (-1106 to 372) 0.3 52 -439 (-1265 to 386) 0.3
Carbohydrate (g/day) 28 202 (51) 28 251 (82) -49 (-85 to -12) 0.1 52 -38 (-86 to 11) 0.01
Total sugars (g/day) 28 80 (39) 28 113 (43) -32 (-54 to -10.4) 0.01 52 -37 (-67 to -8) 0.005
Glucose (g/day) 28 15 (11) 28 19 (8) -5 (-10 to 1) 0.1 52 -7 (-15 to 1) 0.09
Fructose (g/day) 28 18 (12) 28 22 (12) -4 (-11 to 2) 0.05 52 -11 (-21 to 0) 0.2
Sucrose (g/day) 28 30 (18) 28 50 (28) -20 (-33 to -8) 0.05 52 -18 (-36 to 0) 0.002
Lactose (g/day) 28 9 (7) 28 11 (6) -1 (-5 to 2) 0.9 52 0 (-5 to 5) 0.4
Protein (g/day) 28 64 (14) 28 67 (21) -2 (-12 to 7) 0.6 52 3 (-8 to 15) 0.7
Total fat (g/day) 28 49 (14) 28 75 (26) -25 (-36 to -14) 0.001 52 -23 (-36 to -9) <0.0001
Saturated fatty acids (g/day) 28 14 (4) 28 27 (11) -12 (-16.9 to -8) 0.001 52 -11 (-18 to -5) <0.0001
Monounsaturated fatty acids (g/day) 28 15 (5) 28 24 (9) -9 (-13 to -5.1) 0.005 52 -7 (-13 to -2) <0.0001
Polyunsaturated fatty acids (g/day) 28 8 (4) 28 12 (4) -4 (-6 to -2) 0.02 52 -4 (-7 to -1) 0.001
Non starch polysaccharides (g/day) 28 13 (4) 28 11 (3) 2 (0 to 4) 0.009 52 4 (1 to 7) 0.03
Sodium (mg/day) 28 2041 (573) 28 2711 (1020) -670 (-1113 to -227) 0.07 52 -557 (-1170 to 56) 0.004
Calcium (mg/day) 28 644 (230) 28 712 (281) -68 (-206 to 69) 0.5 52 53 (-122 to 228) 0.3Iron (mg/day) 28 9.4 (3) 28 10.1 (4.5) -1 (-3 to 1) 0.5 52 0.8 (-1.8 to 3.4) 0.5
Data are presented as means (SD) or mean differences (CI) analysed with the Independent Samples t-test, CI: 95% Confidence Interval2Small loss of n forsome variables
240
7.5 Comparison of randomised groups at 6 months
Table 18 summarised the 6 month between group results. Overall, at 6 months,
children in the intervention group displayed improvements in all trial variables,
compared to controls (including anthropometry, body composition,
cardiovascular health, activity patterns and self-esteem).
7.5.1 Anthropometry
The primary outcome (waist circumference at 6 months) was 4.3 cm (95 % CI:
-7.8 to -0.8) lower in the intervention group, compared to the control group.
Additionally, BMI was significantly lower in the intervention than the control group
(-1.9 kg/m2; p = 0.05 and -1.2 kg/m2; p < 0.0001 for unadjusted and adjusted
BMI, respectively).
Similar patterns were observed for adjusted BMI and waist z-scores (-0.24;
p < 0.0001 and -0.37; p < 0.0001 for adjusted BMI z-score and waist z-score,
respectively) and unadjusted BMI z-scores (-0.28; p = 0.03), but not for
unadjusted waist z-score (-0.23; p = 0.09).
7.5.2 Body composition
There were no significant changes in body composition, with the exception of
body fat mass adjusted for baseline, which was 2.4 kg less in the intervention
group, compared to control (p = 0.05).
241
7.5.3 Cardiovascular health, physical and sedentary activity levels, and
self-esteem
Cardiovascular health improved in the intervention group, as indicated by the
differences in the recovery heart rate and diastolic blood pressure, relative to the
control group. Activity patterns improved, as evident from the +3.9 and -5.1
hours/week between-group differences in favour of the intervention group for
physical activity adjusted for baseline and sedentary behaviours, respectively.
Global self-esteem was higher for the intervention group.
7.5.4 Swimming pass use
At the end of the intensive phase of the MEND programme, children were
provided with a swimming pass lasting an additional 12 weeks. Results showed
that 32% of the families used the free swimming pass for an average of 5 times
in 12 weeks (i.e., 1-2 times a month).
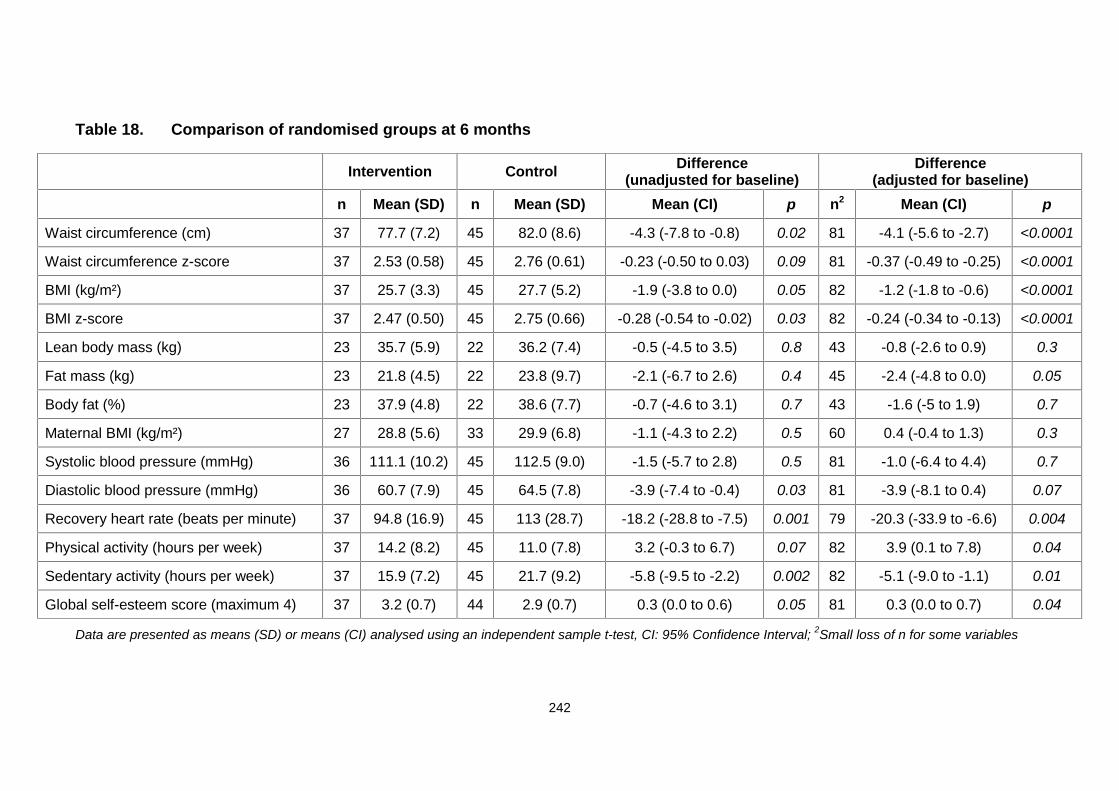
242
Table 18. Comparison of randomised groups at 6 months
Data are presented as means (SD) or means (CI) analysed using an independent sample t-test, CI: 95% Confidence Interval; 2Small loss of n for some variables
Intervention Control Difference(unadjusted for baseline)
Difference(adjusted for baseline)
n Mean (SD) n Mean (SD) Mean (CI) p n2 Mean (CI) p
Waist circumference (cm) 37 77.7 (7.2) 45 82.0 (8.6) -4.3 (-7.8 to -0.8) 0.02 81 -4.1 (-5.6 to -2.7) <0.0001
Waist circumference z-score 37 2.53 (0.58) 45 2.76 (0.61) -0.23 (-0.50 to 0.03) 0.09 81 -0.37 (-0.49 to -0.25) <0.0001
BMI (kg/m²) 37 25.7 (3.3) 45 27.7 (5.2) -1.9 (-3.8 to 0.0) 0.05 82 -1.2 (-1.8 to -0.6) <0.0001
BMI z-score 37 2.47 (0.50) 45 2.75 (0.66) -0.28 (-0.54 to -0.02) 0.03 82 -0.24 (-0.34 to -0.13) <0.0001
Lean body mass (kg) 23 35.7 (5.9) 22 36.2 (7.4) -0.5 (-4.5 to 3.5) 0.8 43 -0.8 (-2.6 to 0.9) 0.3
Fat mass (kg) 23 21.8 (4.5) 22 23.8 (9.7) -2.1 (-6.7 to 2.6) 0.4 45 -2.4 (-4.8 to 0.0) 0.05
Body fat (%) 23 37.9 (4.8) 22 38.6 (7.7) -0.7 (-4.6 to 3.1) 0.7 43 -1.6 (-5 to 1.9) 0.7
Maternal BMI (kg/m²) 27 28.8 (5.6) 33 29.9 (6.8) -1.1 (-4.3 to 2.2) 0.5 60 0.4 (-0.4 to 1.3) 0.3
Systolic blood pressure (mmHg) 36 111.1 (10.2) 45 112.5 (9.0) -1.5 (-5.7 to 2.8) 0.5 81 -1.0 (-6.4 to 4.4) 0.7
Diastolic blood pressure (mmHg) 36 60.7 (7.9) 45 64.5 (7.8) -3.9 (-7.4 to -0.4) 0.03 81 -3.9 (-8.1 to 0.4) 0.07
Recovery heart rate (beats per minute) 37 94.8 (16.9) 45 113 (28.7) -18.2 (-28.8 to -7.5) 0.001 79 -20.3 (-33.9 to -6.6) 0.004
Physical activity (hours per week) 37 14.2 (8.2) 45 11.0 (7.8) 3.2 (-0.3 to 6.7) 0.07 82 3.9 (0.1 to 7.8) 0.04
Sedentary activity (hours per week) 37 15.9 (7.2) 45 21.7 (9.2) -5.8 (-9.5 to -2.2) 0.002 82 -5.1 (-9.0 to -1.1) 0.01
Global self-esteem score (maximum 4) 37 3.2 (0.7) 44 2.9 (0.7) 0.3 (0.0 to 0.6) 0.05 81 0.3 (0.0 to 0.7) 0.04

243
7.5.5 Dietary data
According to Table 19, at 6 months differences in dietary data were not
statistically significant.
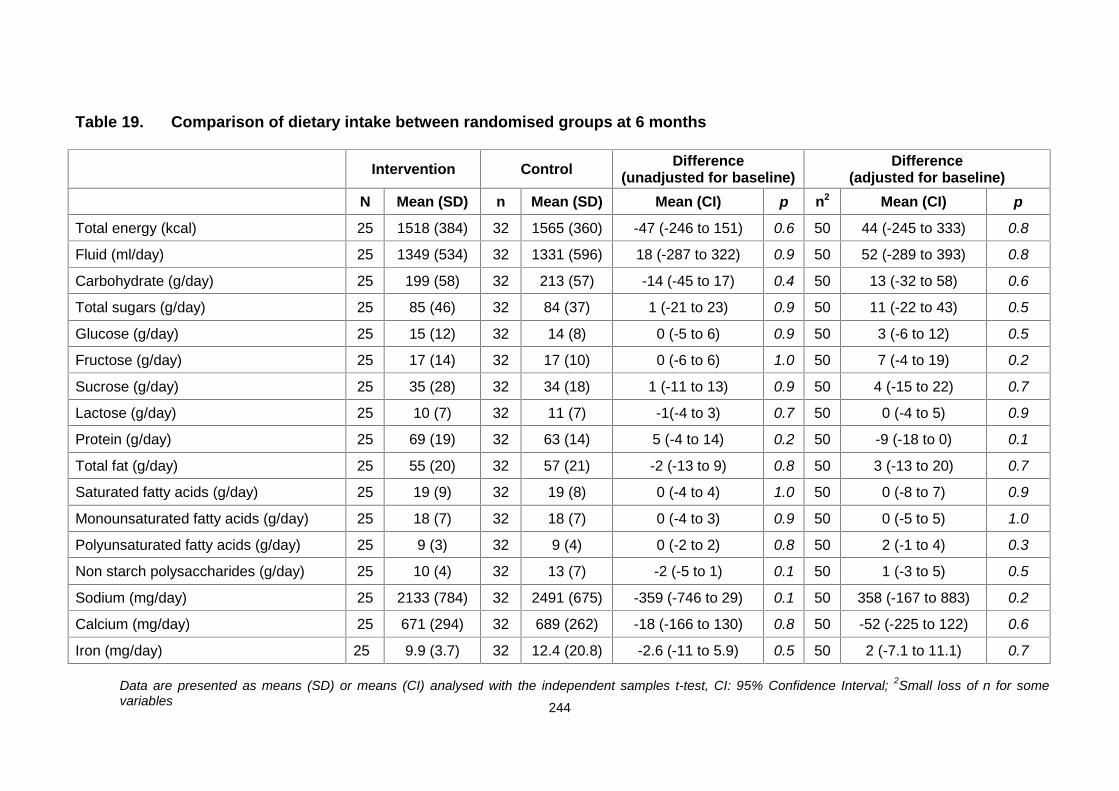
244
Table 19. Comparison of dietary intake between randomised groups at 6 months
Intervention Control Difference(unadjusted for baseline)
Difference(adjusted for baseline)
N Mean (SD) n Mean (SD) Mean (CI) p n2 Mean (CI) p
Total energy (kcal) 25 1518 (384) 32 1565 (360) -47 (-246 to 151) 0.6 50 44 (-245 to 333) 0.8
Fluid (ml/day) 25 1349 (534) 32 1331 (596) 18 (-287 to 322) 0.9 50 52 (-289 to 393) 0.8
Carbohydrate (g/day) 25 199 (58) 32 213 (57) -14 (-45 to 17) 0.4 50 13 (-32 to 58) 0.6
Total sugars (g/day) 25 85 (46) 32 84 (37) 1 (-21 to 23) 0.9 50 11 (-22 to 43) 0.5
Glucose (g/day) 25 15 (12) 32 14 (8) 0 (-5 to 6) 0.9 50 3 (-6 to 12) 0.5
Fructose (g/day) 25 17 (14) 32 17 (10) 0 (-6 to 6) 1.0 50 7 (-4 to 19) 0.2
Sucrose (g/day) 25 35 (28) 32 34 (18) 1 (-11 to 13) 0.9 50 4 (-15 to 22) 0.7
Lactose (g/day) 25 10 (7) 32 11 (7) -1(-4 to 3) 0.7 50 0 (-4 to 5) 0.9
Protein (g/day) 25 69 (19) 32 63 (14) 5 (-4 to 14) 0.2 50 -9 (-18 to 0) 0.1
Total fat (g/day) 25 55 (20) 32 57 (21) -2 (-13 to 9) 0.8 50 3 (-13 to 20) 0.7
Saturated fatty acids (g/day) 25 19 (9) 32 19 (8) 0 (-4 to 4) 1.0 50 0 (-8 to 7) 0.9
Monounsaturated fatty acids (g/day) 25 18 (7) 32 18 (7) 0 (-4 to 3) 0.9 50 0 (-5 to 5) 1.0
Polyunsaturated fatty acids (g/day) 25 9 (3) 32 9 (4) 0 (-2 to 2) 0.8 50 2 (-1 to 4) 0.3
Non starch polysaccharides (g/day) 25 10 (4) 32 13 (7) -2 (-5 to 1) 0.1 50 1 (-3 to 5) 0.5
Sodium (mg/day) 25 2133 (784) 32 2491 (675) -359 (-746 to 29) 0.1 50 358 (-167 to 883) 0.2
Calcium (mg/day) 25 671 (294) 32 689 (262) -18 (-166 to 130) 0.8 50 -52 (-225 to 122) 0.6
Iron (mg/day) 25 9.9 (3.7) 32 12.4 (20.8) -2.6 (-11 to 5.9) 0.5 50 2 (-7.1 to 11.1) 0.7
Data are presented as means (SD) or means (CI) analysed with the independent samples t-test, CI: 95% Confidence Interval; 2Small loss of n for somevariables
245
7.6 Within-subject changes at 3 months from baseline
Waist circumference, BMI and z-scores were significantly reduced at 3 months.
Maternal BMI was markedly reduced by 0.4 kg/m2 (p ≤ 0.0001). Systolic blood
pressure was significantly reduced (-4.6 mmHg; p ≤ 0.0001), while no notable
changes in diastolic blood pressure were observed. Other measures of
cardiovascular fitness that were significantly improved included recovery heart
rate, physical and sedentary activity levels (Table 20).
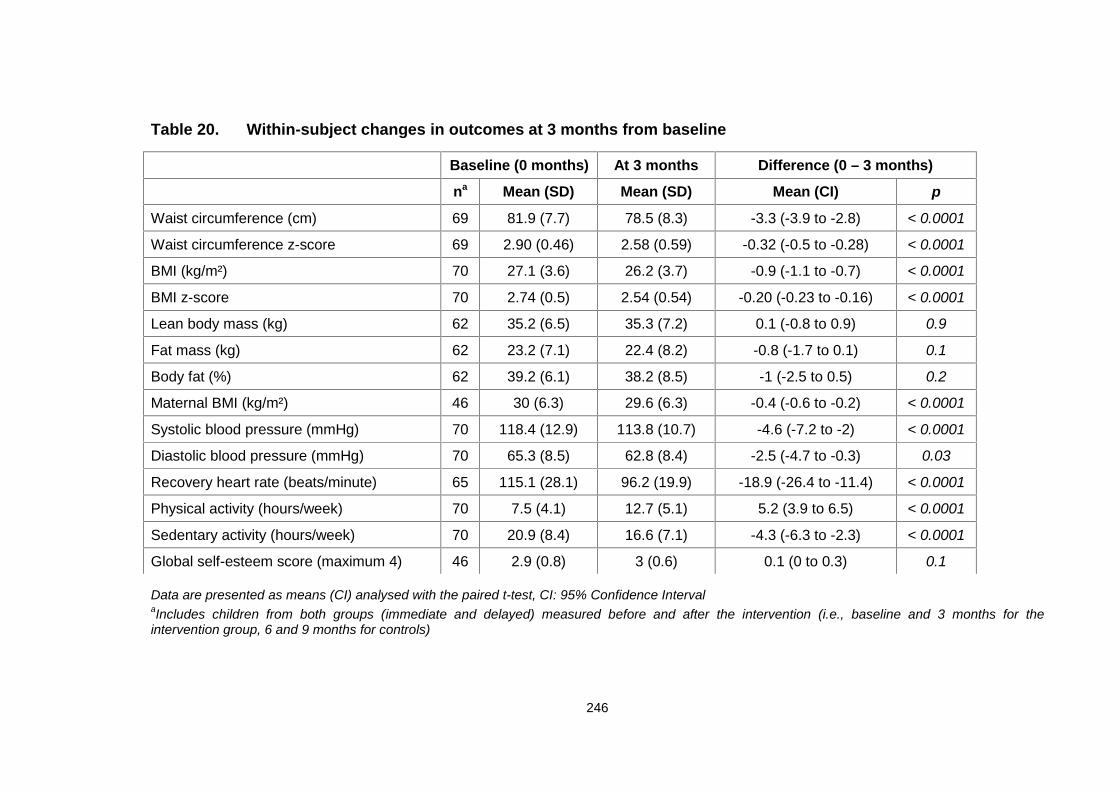
246
Table 20. Within-subject changes in outcomes at 3 months from baseline
Data are presented as means (CI) analysed with the paired t-test, CI: 95% Confidence IntervalaIncludes children from both groups (immediate and delayed) measured before and after the intervention (i.e., baseline and 3 months for theintervention group, 6 and 9 months for controls)
Baseline (0 months) At 3 months Difference (0 – 3 months)
na Mean (SD) Mean (SD) Mean (CI) p
Waist circumference (cm) 69 81.9 (7.7) 78.5 (8.3) -3.3 (-3.9 to -2.8) < 0.0001
Waist circumference z-score 69 2.90 (0.46) 2.58 (0.59) -0.32 (-0.5 to -0.28) < 0.0001
BMI (kg/m²) 70 27.1 (3.6) 26.2 (3.7) -0.9 (-1.1 to -0.7) < 0.0001
BMI z-score 70 2.74 (0.5) 2.54 (0.54) -0.20 (-0.23 to -0.16) < 0.0001
Lean body mass (kg) 62 35.2 (6.5) 35.3 (7.2) 0.1 (-0.8 to 0.9) 0.9
Fat mass (kg) 62 23.2 (7.1) 22.4 (8.2) -0.8 (-1.7 to 0.1) 0.1
Body fat (%) 62 39.2 (6.1) 38.2 (8.5) -1 (-2.5 to 0.5) 0.2
Maternal BMI (kg/m²) 46 30 (6.3) 29.6 (6.3) -0.4 (-0.6 to -0.2) < 0.0001
Systolic blood pressure (mmHg) 70 118.4 (12.9) 113.8 (10.7) -4.6 (-7.2 to -2) < 0.0001
Diastolic blood pressure (mmHg) 70 65.3 (8.5) 62.8 (8.4) -2.5 (-4.7 to -0.3) 0.03
Recovery heart rate (beats/minute) 65 115.1 (28.1) 96.2 (19.9) -18.9 (-26.4 to -11.4) < 0.0001
Physical activity (hours/week) 70 7.5 (4.1) 12.7 (5.1) 5.2 (3.9 to 6.5) < 0.0001
Sedentary activity (hours/week) 70 20.9 (8.4) 16.6 (7.1) -4.3 (-6.3 to -2.3) < 0.0001
Global self-esteem score (maximum 4) 46 2.9 (0.8) 3 (0.6) 0.1 (0 to 0.3) 0.1
247
7.7 Within-subject changes at 6 months from baseline
As shown in Table 21, all outcomes, except maternal BMI, were significantly
improved at 6 months from baseline. Also, univariate analyses revealed that 6-
month changes in BMI, waist circumference and their z-scores were not affected
by gender, single parenthood, accommodation status (owned/rented),
employment status and age. Ethnicity was the only parameter that influenced
BMI change and its z-score at 6 month, with non-white children being more likely
to do worse. More precisely, BMI was reduced on average by 1.5 units in white
children and by 0.5 units in non-white children (p = 0.06) and BMI z-score was
reduced by 0.38 in white children and by 0.21 in non-white children (p = 0.01) at
6 months.
248
Table 21. Within-subject changes in outcome variables at 6 months from baseline
Baseline (0 months) At 6 months Difference (0 – 6 months)
na Mean (SD) Mean (SD) Mean (CI) p
Waist circumference (cm) 71 80.8 (7.6) 76.6 (8.1) -4.2 (-5.1 to -3.4) < 0.0001
Waist circumference z-score 71 2.82 (0.54) 2.34 (0.74) -0.48 (0.33 to 0.04) < 0.0001
BMI (kg/m²) 71 26.9 (4.3) 25.9 (4.6) -1 (-1.4 to -0.6) < 0.0001
BMI z-score 71 2.7 (0.57) 2.41 (0.66) -0.3 (0.29 to 0.03) < 0.0001
Lean body mass (kg) 22 34.7 (5.4) 36 (5.9) 1.3 (0.3 to 2.2) 0.01
Fat mass (kg) 22 23.4 (4.6) 22 (4.4) -1.4 (-2.5 to -0.2) 0.02
Body fat (%) 22 40.2 (4.6) 38 (4.8) -2.2 (-3.6 to -0.7) 0.005
Maternal BMI (kg/m²) 49 29.6 (6.4) 29.6 (6.5) 0 (-0.3 to 0.3) 0.995
Systolic blood pressure (mmHg) 70 116.8 (12.8) 111.8 (9.4) -5 (-7.9 to -2.2) 0.001
Diastolic blood pressure (mmHg) 70 65.2 (8.5) 60.9 (8) -4.3 (-6.6 to -2) < 0.0001
Recovery heart rate (beats/minute) 70 112.7 (25.5) 94.7 (19.2) -17.9 (-24.7 to -11.2) < 0.0001
Physical activity (hours/week) 71 8.8 (5.4) 13 (7.2) 4.2 (2.2 to 6.2) < 0.0001
Sedentary activity (hours/week) 71 20.6 (8.3) 15.8 (7.7) -4.8 (-6.8 to -2.9) < 0.0001
Global self-esteem score (maximum 4) 67 2.9 (0.7) 3.2 (0.7) 0.2 (0.1 to 0.4) 0.007
Data are presented as means (CI) analysed with the paired t-test, CI: 95% Confidence IntervalaIncludes children from both groups measured before and after the intervention (i.e., baseline and 6 months for the intervention group, 6and 12 months for controls)
249
7.8 Within-subject changes for waist circumference z-score and BMI z-
scores at 3 and 6 months
Figures 30 and 31 present the progressive changes in waist circumference and
BMI z-scores from baseline to 3 and 6 months for the intervention and control
groups, respectively. Waist circumference z-score was significantly decreased in
the intervention group, but not the control group (Figure 30). A similar pattern
was observed for the BMI z-score (Figure 31).
Figure 30. Within-subject changes for waist circumference z-score atbaseline, 3 and 6 months
2.92
2.63
2.53
2.732.76 2.76
2.30
2.40
2.50
2.60
2.70
2.80
2.90
3.00
Baseline 3 months 6 months
Wai
st c
ircu
mfe
ren
ce z
-sco
re
Intervention group Control group(n = 54)
(n = 47) (n = 44)(n = 47)
(n = 47)
(n = 37)
250
The intervention group in Figure 30 consists of children in the immediate
intervention group only. Average z-scores are presented for all available children
at each time-point (non-matched data).
Figure 31. Within-subject changes for BMI z-score at baseline, 3 and 6months
2.79
2.57
2.47
2.802.77 2.75
2.30
2.40
2.50
2.60
2.70
2.80
2.90
Baseline 3 months 6 months
BM
I z-s
core
Intervention group Control group
(n = 50)(n = 48)
(n = 45)
(n = 54)
(n = 47)
(n = 37)
The intervention group above consists of children in the immediate intervention
group only. Average z-scores are presented for all available children at each
time-point (non-matched data).
251
7.9 Within-subject changes at 12 months from baseline
Table 22 summarises the 12 month within-subject changes. Waist circumference
and BMI z-scores were significantly (p ≤ 0.0001) reduced at 12 months from
baseline. Systolic blood pressure was reduced by 6.5 mmHg (p ≤ 0.004), while
diastolic blood pressure was not significantly affected.
Recovery heart rate and physical activity levels were markedly improved,
whereas sedentary activities did not change significantly. Global self-esteem was
significantly improved. Body composition data were not available at 12 months,
due to lack of resources for sample analysis.
Similarly to 6-month results from univariate analyses, 12-month changes in BMI,
waist circumference and their z-scores were not affected by gender, single
parenthood, accommodation status (owned/rented), employment status and age.
Ethnicity was the only parameter that affected BMI change at 12 month (but not
its z-score), with non-white children being more likely to do worse. More
precisely, BMI at 12 months was reduced by 0.7 units in white children and was
increased by 0.4units in non-white children (p = 0.04).
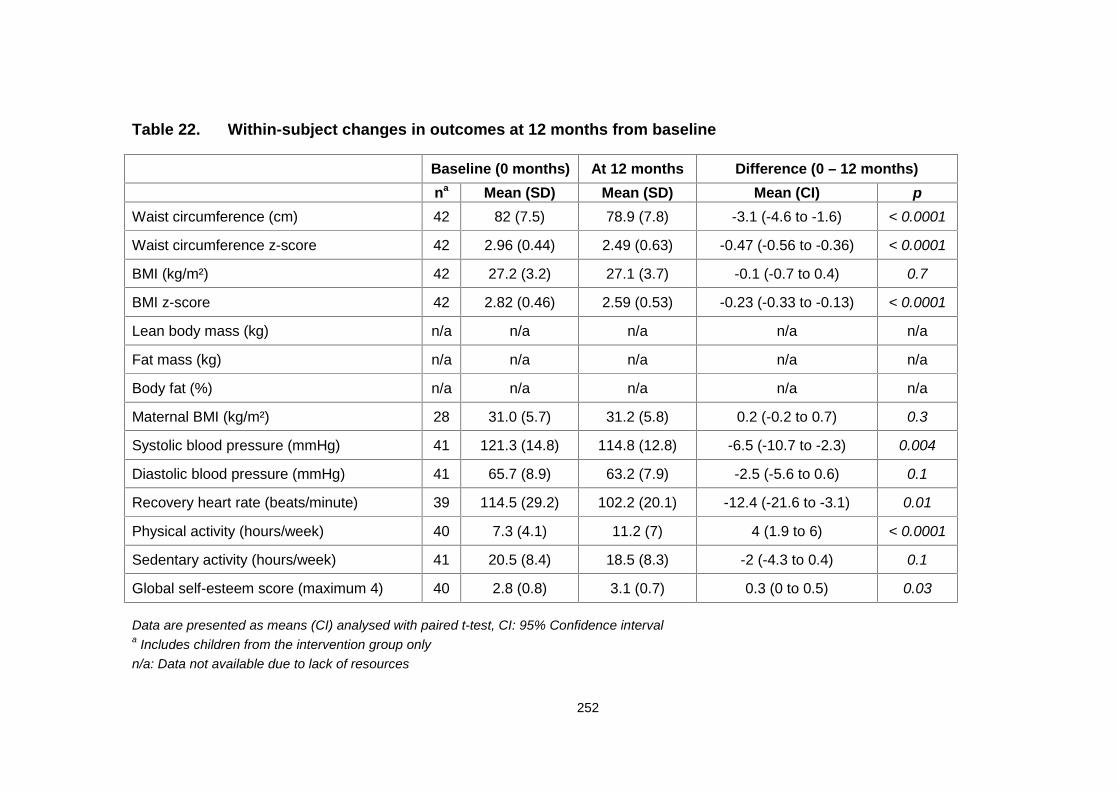
252
Table 22. Within-subject changes in outcomes at 12 months from baseline
Data are presented as means (CI) analysed with paired t-test, CI: 95% Confidence intervala Includes children from the intervention group onlyn/a: Data not available due to lack of resources
Baseline (0 months) At 12 months Difference (0 – 12 months)na Mean (SD) Mean (SD) Mean (CI) p
Waist circumference (cm) 42 82 (7.5) 78.9 (7.8) -3.1 (-4.6 to -1.6) < 0.0001
Waist circumference z-score 42 2.96 (0.44) 2.49 (0.63) -0.47 (-0.56 to -0.36) < 0.0001
BMI (kg/m²) 42 27.2 (3.2) 27.1 (3.7) -0.1 (-0.7 to 0.4) 0.7
BMI z-score 42 2.82 (0.46) 2.59 (0.53) -0.23 (-0.33 to -0.13) < 0.0001
Lean body mass (kg) n/a n/a n/a n/a n/a
Fat mass (kg) n/a n/a n/a n/a n/a
Body fat (%) n/a n/a n/a n/a n/a
Maternal BMI (kg/m²) 28 31.0 (5.7) 31.2 (5.8) 0.2 (-0.2 to 0.7) 0.3
Systolic blood pressure (mmHg) 41 121.3 (14.8) 114.8 (12.8) -6.5 (-10.7 to -2.3) 0.004
Diastolic blood pressure (mmHg) 41 65.7 (8.9) 63.2 (7.9) -2.5 (-5.6 to 0.6) 0.1
Recovery heart rate (beats/minute) 39 114.5 (29.2) 102.2 (20.1) -12.4 (-21.6 to -3.1) 0.01
Physical activity (hours/week) 40 7.3 (4.1) 11.2 (7) 4 (1.9 to 6) < 0.0001
Sedentary activity (hours/week) 41 20.5 (8.4) 18.5 (8.3) -2 (-4.3 to 0.4) 0.1
Global self-esteem score (maximum 4) 40 2.8 (0.8) 3.1 (0.7) 0.3 (0 to 0.5) 0.03
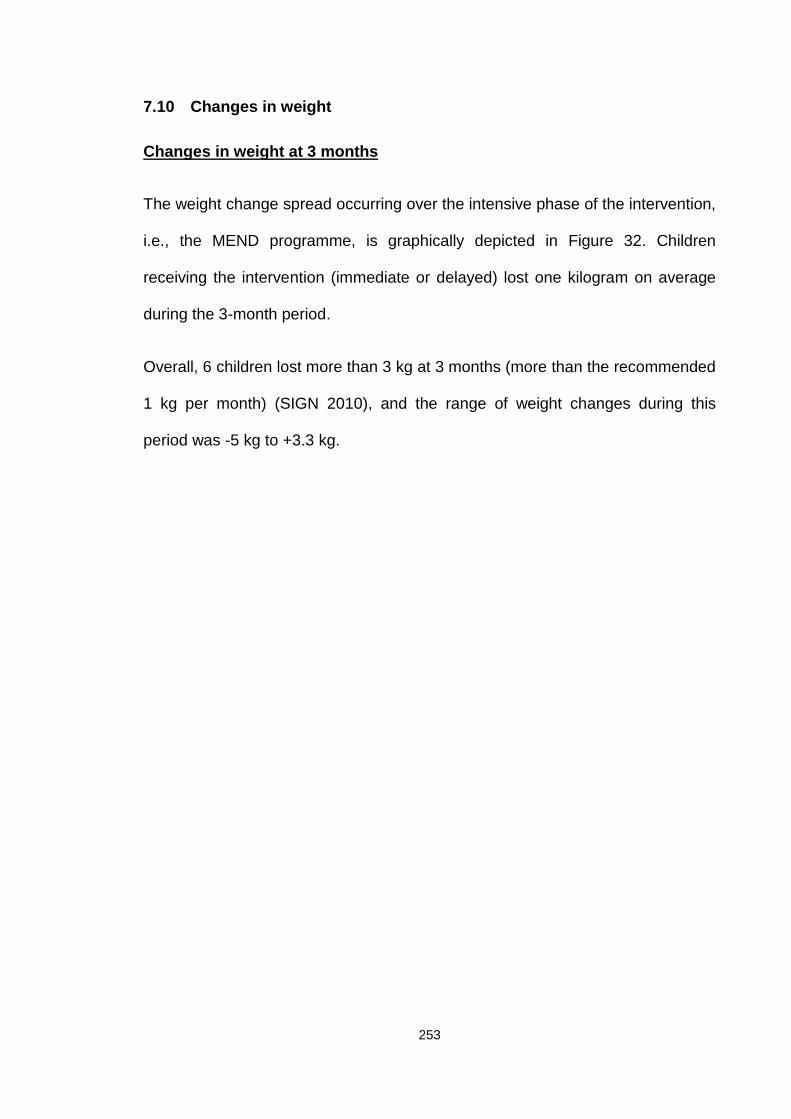
253
7.10 Changes in weight
Changes in weight at 3 months
The weight change spread occurring over the intensive phase of the intervention,
i.e., the MEND programme, is graphically depicted in Figure 32. Children
receiving the intervention (immediate or delayed) lost one kilogram on average
during the 3-month period.
Overall, 6 children lost more than 3 kg at 3 months (more than the recommended
1 kg per month) (SIGN 2010), and the range of weight changes during this
period was -5 kg to +3.3 kg.
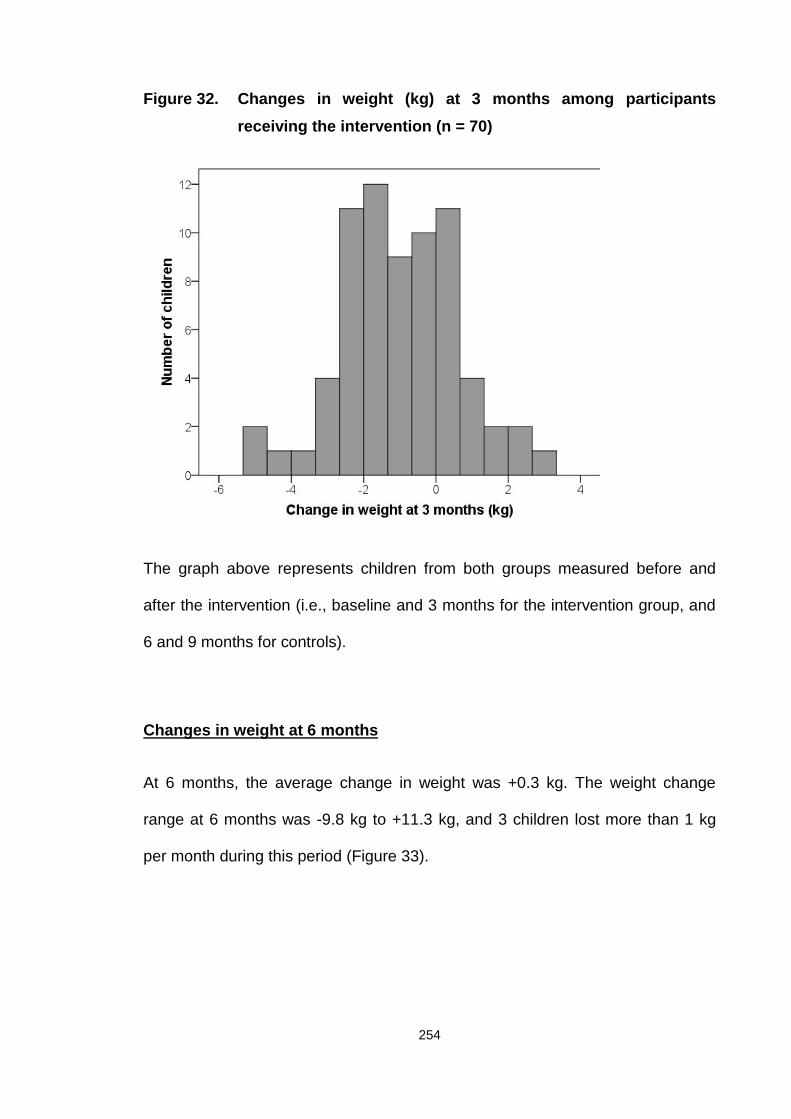
254
Figure 32. Changes in weight (kg) at 3 months among participantsreceiving the intervention (n = 70)
The graph above represents children from both groups measured before and
after the intervention (i.e., baseline and 3 months for the intervention group, and
6 and 9 months for controls).
Changes in weight at 6 months
At 6 months, the average change in weight was +0.3 kg. The weight change
range at 6 months was -9.8 kg to +11.3 kg, and 3 children lost more than 1 kg
per month during this period (Figure 33).
255
Figure 33. Changes in weight (kg) at 6 months among participantsreceiving the intervention (n = 71)
The graph above represents children from both groups measured before and
after the intervention (i.e., baseline and 6 months for the intervention group, and
6 and 12 months for controls).
Changes in weight at 12 months
At 12 months, weight change was, on average, +4.9 kg, and the maximum
weight reduction observed was -7.2 kg (range from -7.2 kg to + 14.5 kg) (Figure
34).
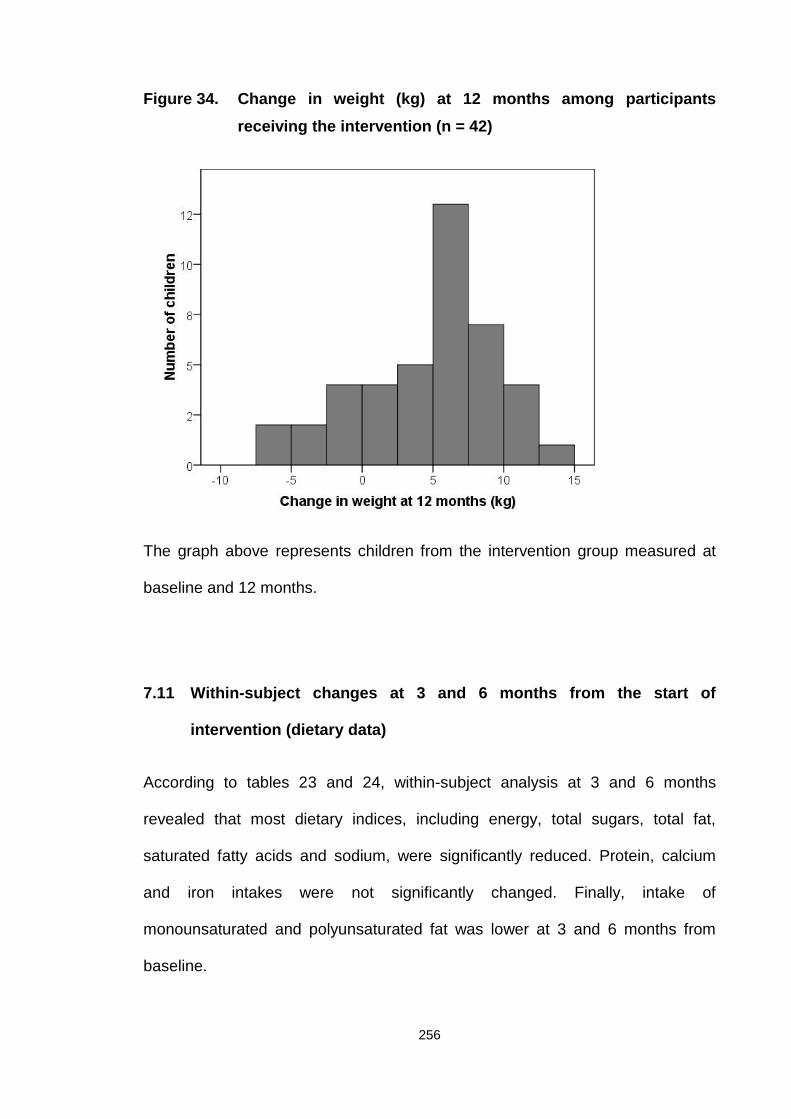
256
Figure 34. Change in weight (kg) at 12 months among participantsreceiving the intervention (n = 42)
The graph above represents children from the intervention group measured at
baseline and 12 months.
7.11 Within-subject changes at 3 and 6 months from the start of
intervention (dietary data)
According to tables 23 and 24, within-subject analysis at 3 and 6 months
revealed that most dietary indices, including energy, total sugars, total fat,
saturated fatty acids and sodium, were significantly reduced. Protein, calcium
and iron intakes were not significantly changed. Finally, intake of
monounsaturated and polyunsaturated fat was lower at 3 and 6 months from
baseline.
257
Only 4 sets of dietary data were obtained at 12 months due to participant non-
compliance with completion of food diaries. Owing to the small sample size,
statistical analysis was not performed.
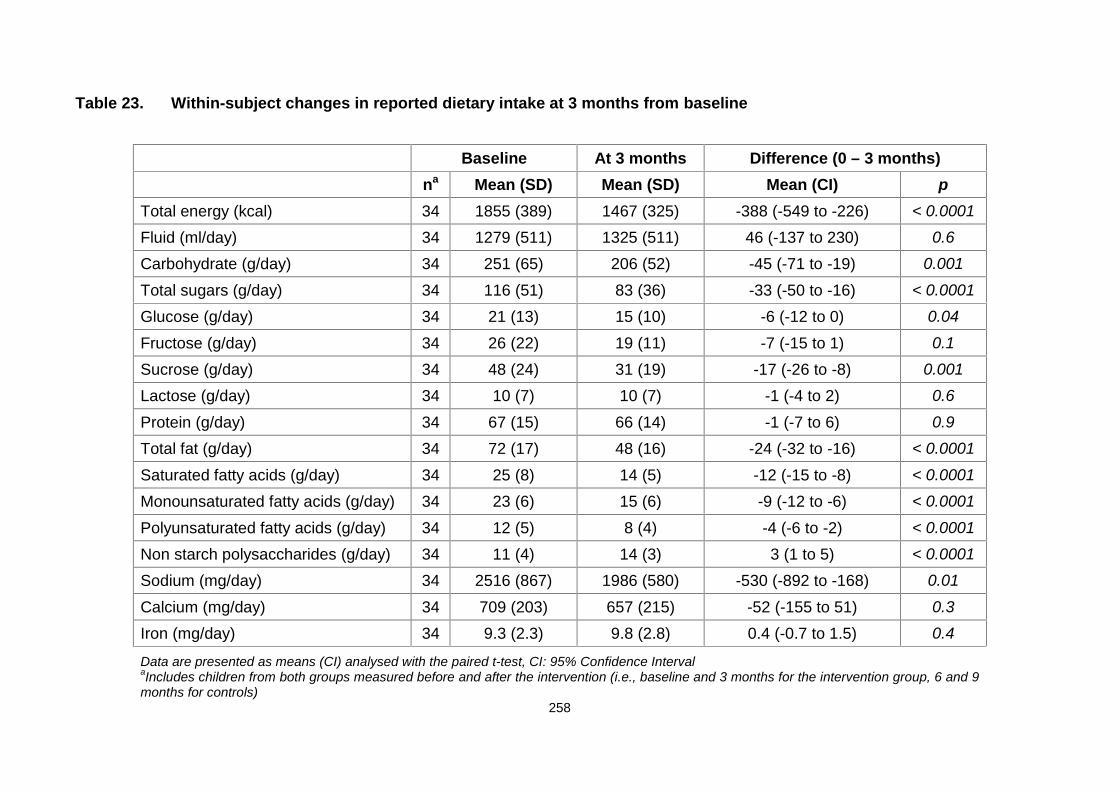
258
Table 23. Within-subject changes in reported dietary intake at 3 months from baseline
Baseline At 3 months Difference (0 – 3 months)na Mean (SD) Mean (SD) Mean (CI) p
Total energy (kcal) 34 1855 (389) 1467 (325) -388 (-549 to -226) < 0.0001
Fluid (ml/day) 34 1279 (511) 1325 (511) 46 (-137 to 230) 0.6
Carbohydrate (g/day) 34 251 (65) 206 (52) -45 (-71 to -19) 0.001
Total sugars (g/day) 34 116 (51) 83 (36) -33 (-50 to -16) < 0.0001
Glucose (g/day) 34 21 (13) 15 (10) -6 (-12 to 0) 0.04
Fructose (g/day) 34 26 (22) 19 (11) -7 (-15 to 1) 0.1
Sucrose (g/day) 34 48 (24) 31 (19) -17 (-26 to -8) 0.001
Lactose (g/day) 34 10 (7) 10 (7) -1 (-4 to 2) 0.6
Protein (g/day) 34 67 (15) 66 (14) -1 (-7 to 6) 0.9
Total fat (g/day) 34 72 (17) 48 (16) -24 (-32 to -16) < 0.0001
Saturated fatty acids (g/day) 34 25 (8) 14 (5) -12 (-15 to -8) < 0.0001
Monounsaturated fatty acids (g/day) 34 23 (6) 15 (6) -9 (-12 to -6) < 0.0001
Polyunsaturated fatty acids (g/day) 34 12 (5) 8 (4) -4 (-6 to -2) < 0.0001
Non starch polysaccharides (g/day) 34 11 (4) 14 (3) 3 (1 to 5) < 0.0001
Sodium (mg/day) 34 2516 (867) 1986 (580) -530 (-892 to -168) 0.01
Calcium (mg/day) 34 709 (203) 657 (215) -52 (-155 to 51) 0.3
Iron (mg/day) 34 9.3 (2.3) 9.8 (2.8) 0.4 (-0.7 to 1.5) 0.4
Data are presented as means (CI) analysed with the paired t-test, CI: 95% Confidence IntervalaIncludes children from both groups measured before and after the intervention (i.e., baseline and 3 months for the intervention group, 6 and 9months for controls)
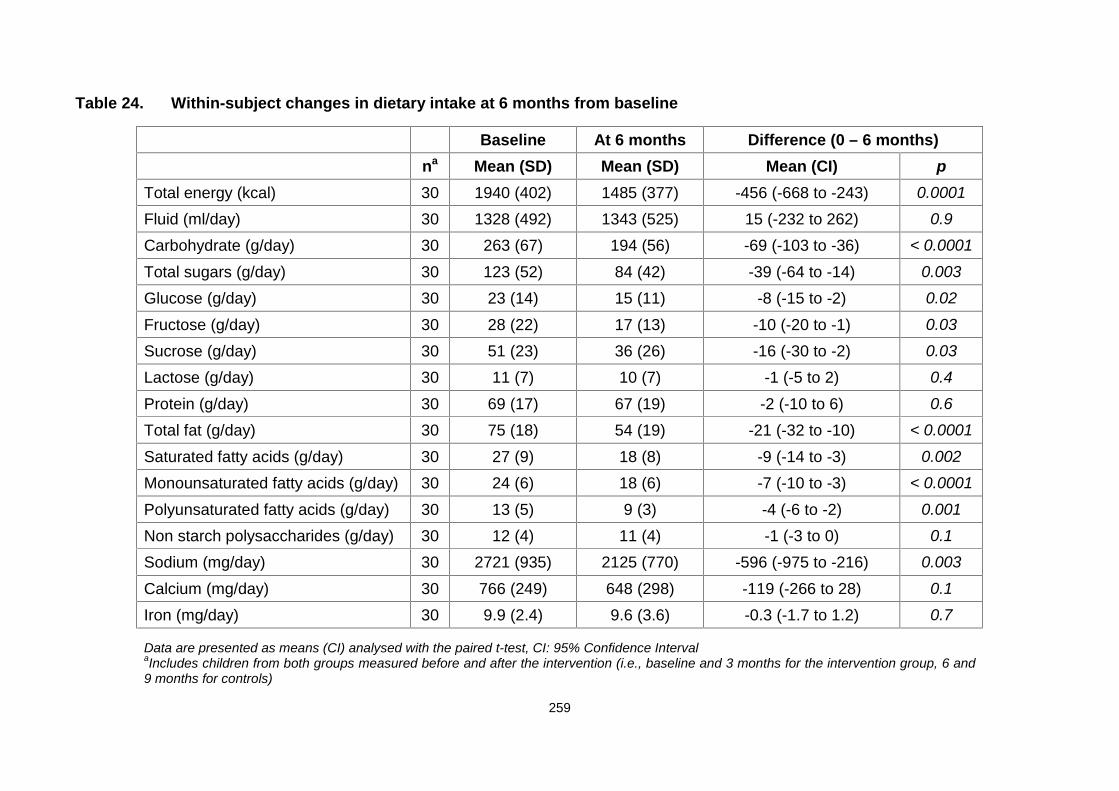
259
Table 24. Within-subject changes in dietary intake at 6 months from baseline
Baseline At 6 months Difference (0 – 6 months)na Mean (SD) Mean (SD) Mean (CI) p
Total energy (kcal) 30 1940 (402) 1485 (377) -456 (-668 to -243) 0.0001
Fluid (ml/day) 30 1328 (492) 1343 (525) 15 (-232 to 262) 0.9
Carbohydrate (g/day) 30 263 (67) 194 (56) -69 (-103 to -36) < 0.0001
Total sugars (g/day) 30 123 (52) 84 (42) -39 (-64 to -14) 0.003
Glucose (g/day) 30 23 (14) 15 (11) -8 (-15 to -2) 0.02
Fructose (g/day) 30 28 (22) 17 (13) -10 (-20 to -1) 0.03
Sucrose (g/day) 30 51 (23) 36 (26) -16 (-30 to -2) 0.03
Lactose (g/day) 30 11 (7) 10 (7) -1 (-5 to 2) 0.4
Protein (g/day) 30 69 (17) 67 (19) -2 (-10 to 6) 0.6
Total fat (g/day) 30 75 (18) 54 (19) -21 (-32 to -10) < 0.0001
Saturated fatty acids (g/day) 30 27 (9) 18 (8) -9 (-14 to -3) 0.002
Monounsaturated fatty acids (g/day) 30 24 (6) 18 (6) -7 (-10 to -3) < 0.0001
Polyunsaturated fatty acids (g/day) 30 13 (5) 9 (3) -4 (-6 to -2) 0.001
Non starch polysaccharides (g/day) 30 12 (4) 11 (4) -1 (-3 to 0) 0.1
Sodium (mg/day) 30 2721 (935) 2125 (770) -596 (-975 to -216) 0.003
Calcium (mg/day) 30 766 (249) 648 (298) -119 (-266 to 28) 0.1
Iron (mg/day) 30 9.9 (2.4) 9.6 (3.6) -0.3 (-1.7 to 1.2) 0.7
Data are presented as means (CI) analysed with the paired t-test, CI: 95% Confidence IntervalaIncludes children from both groups measured before and after the intervention (i.e., baseline and 3 months for the intervention group, 6 and9 months for controls)
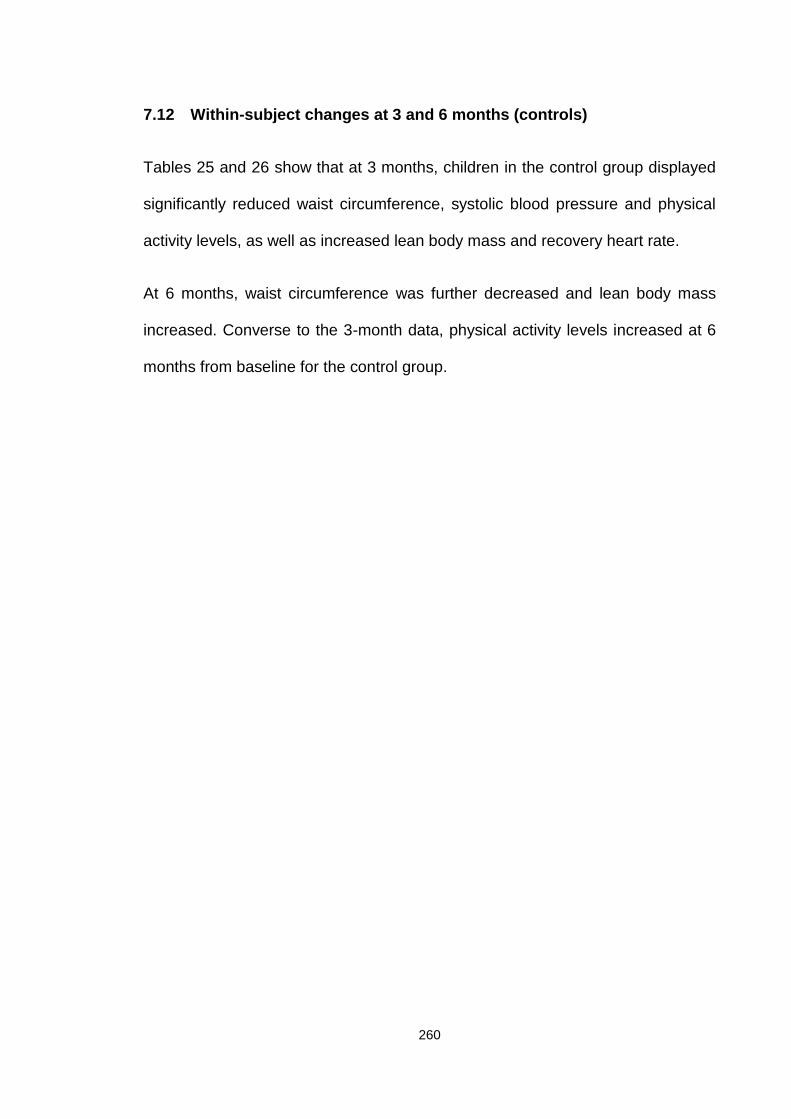
260
7.12 Within-subject changes at 3 and 6 months (controls)
Tables 25 and 26 show that at 3 months, children in the control group displayed
significantly reduced waist circumference, systolic blood pressure and physical
activity levels, as well as increased lean body mass and recovery heart rate.
At 6 months, waist circumference was further decreased and lean body mass
increased. Converse to the 3-month data, physical activity levels increased at 6
months from baseline for the control group.
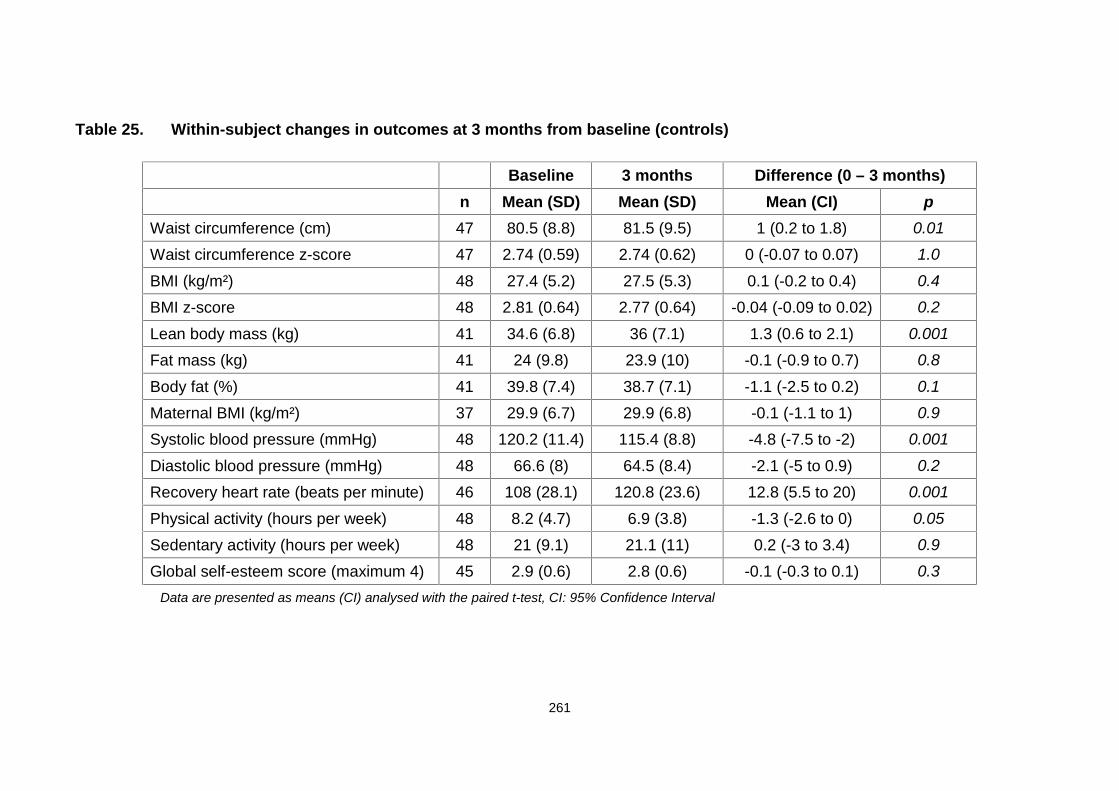
261
Table 25. Within-subject changes in outcomes at 3 months from baseline (controls)
Baseline 3 months Difference (0 – 3 months)n Mean (SD) Mean (SD) Mean (CI) p
Waist circumference (cm) 47 80.5 (8.8) 81.5 (9.5) 1 (0.2 to 1.8) 0.01
Waist circumference z-score 47 2.74 (0.59) 2.74 (0.62) 0 (-0.07 to 0.07) 1.0
BMI (kg/m²) 48 27.4 (5.2) 27.5 (5.3) 0.1 (-0.2 to 0.4) 0.4
BMI z-score 48 2.81 (0.64) 2.77 (0.64) -0.04 (-0.09 to 0.02) 0.2
Lean body mass (kg) 41 34.6 (6.8) 36 (7.1) 1.3 (0.6 to 2.1) 0.001
Fat mass (kg) 41 24 (9.8) 23.9 (10) -0.1 (-0.9 to 0.7) 0.8
Body fat (%) 41 39.8 (7.4) 38.7 (7.1) -1.1 (-2.5 to 0.2) 0.1
Maternal BMI (kg/m²) 37 29.9 (6.7) 29.9 (6.8) -0.1 (-1.1 to 1) 0.9
Systolic blood pressure (mmHg) 48 120.2 (11.4) 115.4 (8.8) -4.8 (-7.5 to -2) 0.001
Diastolic blood pressure (mmHg) 48 66.6 (8) 64.5 (8.4) -2.1 (-5 to 0.9) 0.2
Recovery heart rate (beats per minute) 46 108 (28.1) 120.8 (23.6) 12.8 (5.5 to 20) 0.001
Physical activity (hours per week) 48 8.2 (4.7) 6.9 (3.8) -1.3 (-2.6 to 0) 0.05
Sedentary activity (hours per week) 48 21 (9.1) 21.1 (11) 0.2 (-3 to 3.4) 0.9
Global self-esteem score (maximum 4) 45 2.9 (0.6) 2.8 (0.6) -0.1 (-0.3 to 0.1) 0.3Data are presented as means (CI) analysed with the paired t-test, CI: 95% Confidence Interval
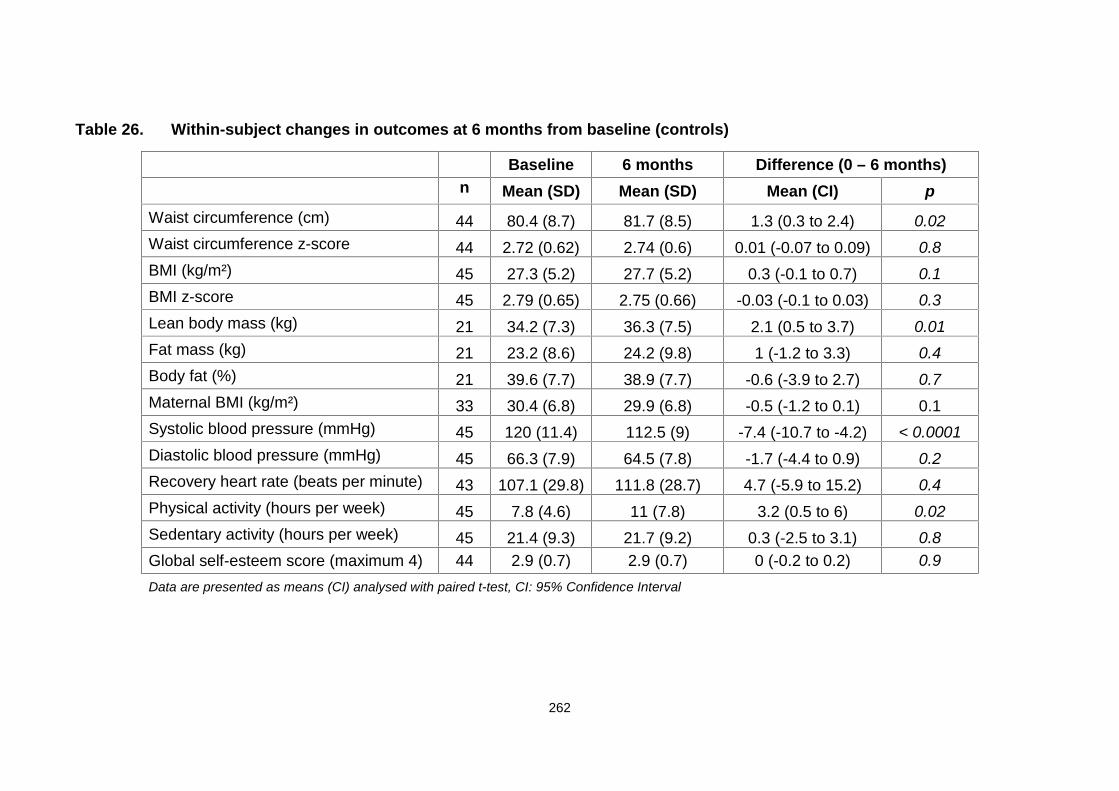
262
Table 26. Within-subject changes in outcomes at 6 months from baseline (controls)
Baseline 6 months Difference (0 – 6 months)n Mean (SD) Mean (SD) Mean (CI) p
Waist circumference (cm) 44 80.4 (8.7) 81.7 (8.5) 1.3 (0.3 to 2.4) 0.02Waist circumference z-score 44 2.72 (0.62) 2.74 (0.6) 0.01 (-0.07 to 0.09) 0.8BMI (kg/m²) 45 27.3 (5.2) 27.7 (5.2) 0.3 (-0.1 to 0.7) 0.1BMI z-score 45 2.79 (0.65) 2.75 (0.66) -0.03 (-0.1 to 0.03) 0.3Lean body mass (kg) 21 34.2 (7.3) 36.3 (7.5) 2.1 (0.5 to 3.7) 0.01Fat mass (kg) 21 23.2 (8.6) 24.2 (9.8) 1 (-1.2 to 3.3) 0.4Body fat (%) 21 39.6 (7.7) 38.9 (7.7) -0.6 (-3.9 to 2.7) 0.7Maternal BMI (kg/m²) 33 30.4 (6.8) 29.9 (6.8) -0.5 (-1.2 to 0.1) 0.1Systolic blood pressure (mmHg) 45 120 (11.4) 112.5 (9) -7.4 (-10.7 to -4.2) < 0.0001Diastolic blood pressure (mmHg) 45 66.3 (7.9) 64.5 (7.8) -1.7 (-4.4 to 0.9) 0.2Recovery heart rate (beats per minute) 43 107.1 (29.8) 111.8 (28.7) 4.7 (-5.9 to 15.2) 0.4Physical activity (hours per week) 45 7.8 (4.6) 11 (7.8) 3.2 (0.5 to 6) 0.02Sedentary activity (hours per week) 45 21.4 (9.3) 21.7 (9.2) 0.3 (-2.5 to 3.1) 0.8Global self-esteem score (maximum 4) 44 2.9 (0.7) 2.9 (0.7) 0 (-0.2 to 0.2) 0.9Data are presented as means (CI) analysed with paired t-test, CI: 95% Confidence Interval

263
7.13 Within-subject changes in reported dietary intake at 3 months from
the start of intervention (controls)
Longitudinal analysis revealed no significant changes in reported dietary
outcomes at 3 months, except for calcium, which was reduced by 123 mg/day
(Table 27).
264
Table 27. Within subject changes in outcomes at 3 months from baseline (dietary data, controls)
Baseline At 3 months Difference (0 – 3 months)n Mean (SD) Mean (SD) Mean (CI) p
Total energy (kcal) 26 1949 (354) 1843 (537) -106 (-335 to 123) 0.4
Fluid (ml/day) 26 1244 (443) 1724 (1938) 480 (-332 to 1292) 0.2
Carbohydrate (g/day) 26 260 (55) 247 (84) -13 (-50 to 24) 0.5
Total sugars (g/day) 26 113 (41) 112 (44) -1 (-23 to 20) 0.9
Glucose (g/day) 26 19 (9) 19 (8) 0 (-4 to 4) 1.0
Fructose (g/day) 26 20 (10) 22 (13) 3 (-2 to 7) 0.3
Sucrose (g/day) 26 52 (27) 50 (29) -2 (-17 to 13) 0.8
Lactose (g/day) 26 12 (9) 10 (6) -1 (-5 to 2) 0.5
Protein (g/day) 26 70 (13) 64 (18) -6 (-15 to 3) 0.2
Total fat (g/day) 26 77 (19) 74 (26) -4 (-14 to 7) 0.5
Saturated fatty acids (g/day) 26 28 (9) 26 (12) -2 (-8 to 4) 0.5
Monounsaturated fatty acids (g/day) 26 25 (7) 24 (9) -2 (-6 to 3) 0.5
Polyunsaturated fatty acids (g/day) 26 12 (4) 11 (4) -1 (-3 to 1) 0.6
Non starch polysaccharides (g/day) 26 12 (5) 11 (3) -1 (-4 to 1) 0.2
Sodium (mg/day) 26 2623 (596) 2678 (1045) 55 (-399 to 509) 0.8
Calcium (mg/day) 26 797 (240) 673 (249) -123 (-246 to -1) 0.05
Iron (mg/day) 26 10.1 (3.7) 9.7 (4.4) -0.4 (-2.7 to 1.8) 0.7Data are presented as means (CI) analysed with paired t-test, CI: 95% Confidence Interval
Data are presented as means (CI) analysed with paired t-test, CI: 95% Confidence Interval
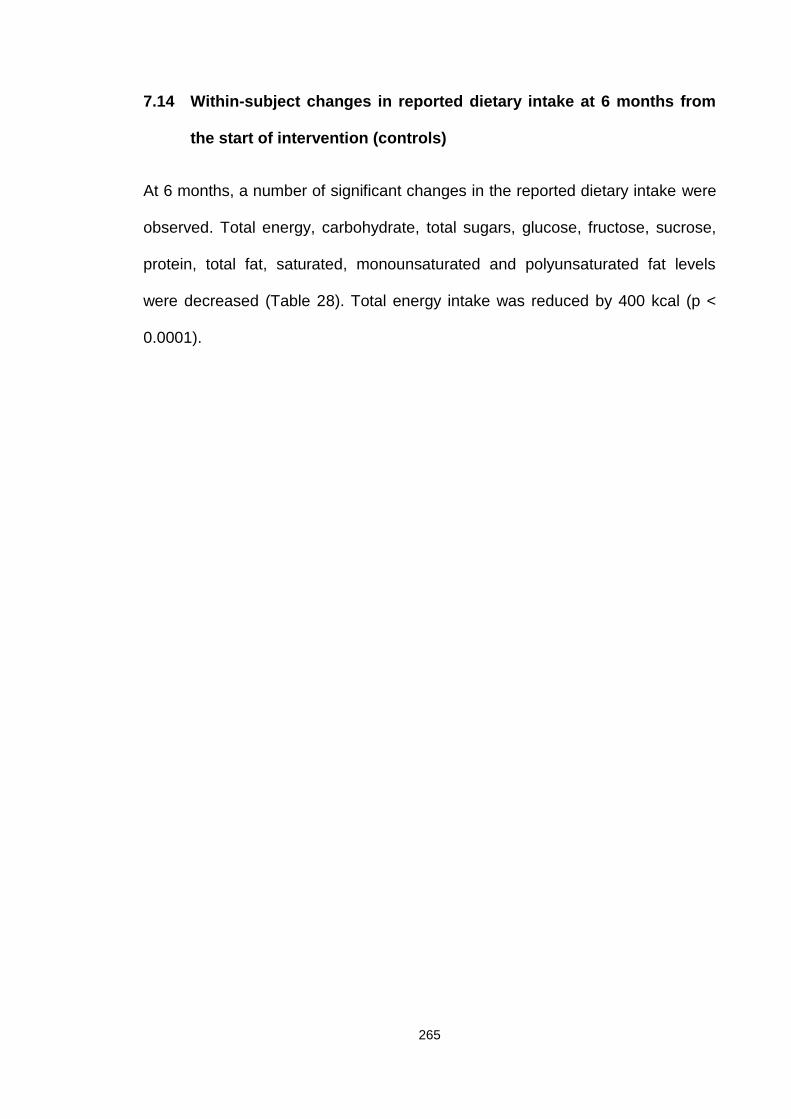
265
7.14 Within-subject changes in reported dietary intake at 6 months from
the start of intervention (controls)
At 6 months, a number of significant changes in the reported dietary intake were
observed. Total energy, carbohydrate, total sugars, glucose, fructose, sucrose,
protein, total fat, saturated, monounsaturated and polyunsaturated fat levels
were decreased (Table 28). Total energy intake was reduced by 400 kcal (p <
0.0001).
266
Table 28. Within subject changes in outcomes at 6 months from baseline (dietary data, controls)
Baseline At 6 months Difference (0 – 6 months)n Mean (SD) Mean (SD) Mean (CI) p
Total energy (kcal) 27 1958 (351) 1557 (333) -400 (-568 to -232) < 0.0001
Fluid (ml/day) 27 1257 (435) 1320 (595) 63 (-155 to 281) 0.6
Carbohydrate (g/day) 27 265 (58) 211 (53) -55 (-78 to -31) < 0.0001
Total sugars (g/day) 27 113 (40) 82 (34) -31 (-46 to -16) < 0.0001
Glucose (g/day) 27 19 (9) 14 (8) -6 (-9 to -2) 0.002
Fructose (g/day) 27 20 (10) 16 (9) -4 (-7 to 0) 0.03
Sucrose (g/day) 27 50 (28) 34 (18) -16 (-25 to -6) 0.002
Lactose (g/day) 27 11 (9) 11 (7) 0 (-4 to 3) 0.8
Protein (g/day) 27 70 (13) 62 (11) -9 (-14 to -4) 0.002
Total fat (g/day) 27 75 (17) 58 (21) -18 (-29 to -6) 0.004
Saturated fatty acids (g/day) 27 28 (9) 19 (8) -9 (-14 to -4) 0.001
Monounsaturated fatty acids (g/day) 27 25 (7) 18 (7) -7 (-10 to -3) < 0.0001
Polyunsaturated fatty acids (g/day) 27 11 (4) 9 (3) -2 (-4 to -1) 0.005
Non starch polysaccharides (g/day) 27 13 (5) 13 (7) 0 (-3 to 4) 0.99
Sodium (mg/day) 27 2675 (764) 2484 (614) -191 (-564 to 181) 0.3
Calcium (mg/day) 27 795 (259) 670 (218) -125 (-239 to -12) 0.03
Iron (mg/day) 27 10.7 (3.8) 12.8 (22.6) 2.2 (-6.7 to 11) 0.6
Data are presented as means (CI) analysed with paired t-test, CI: 95% Confidence Interval
267
7.15 Response rates
Response rate was calculated using the number of participants in each group
(intervention or control) with valid data at each time point (3, 6 or 12 months)
versus the number of participants with valid data at baseline.
At 3 months, response rates for the intervention group varied from 58% for the
dietary data, to 76% - 85% for the remaining outcomes. The corresponding
response rates for the control group varied from 80% to 88%.
At 6 months, the intervention group response rate was 45% for body composition
and for the remaining outcomes varied from 59% to 63%. The corresponding
figures for the control group were 45% for body composition and 75% to 84% for
the remaining outcomes.
At 12 months when due to the study design only data for the intervention group
were available, response rates varied from 60% to 70%, with the exception of
dietary data as there were no data for this metric at 12 months.
7.1.6 Measurement retention and trial dropout rates
Overall, 62% children in the intervention group were measured at 6 months and
70% at 12 months. Measurements were performed on 83% of children of the
intervention group at either 6 or 12 months. In the control group, 80% children
were measured at 6 months and 68% at 12 months.
268
7.17 Programme attendance and dropout rates
Mean attendance for the MEND programme was 86% (including children from
both immediate and delayed intervention groups), with 94% and 68% of children
attending more than 9 and 15 of the 18 sessions, respectively. There were no
dropouts in the intervention group and 2 (4%) in the control group.
7.18 Adverse effects
No adverse effects of the intervention were reported.
7.19 Secondary data analysis results
Table 29 summarises the pre-intervention variables for the 79 participants with
either post intervention (groups 1 and 2, 6 months from pre-intervention, different
time-points for each group) or 6 month post-intervention data (group 1 only, 12
months from baseline) (for more information on the sample definition, please see
Table 29 footnote and Figure 35). Among these, 71 (90%) were followed up at 6
months and 42 (53%) (from arm 1 only) at 12 months (Figure 35). The mean BMI
z-score reduction at 6 and 12 months was -0.30 and -0.23, respectively (p <
0.001) (Table 30). Over the 6-month period of the intervention, BMI z-scores
were increased in 9 children, and reduced by ≥ 0 to < 0.25 in 29, ≥ 0.25 to < 0.5
in 17 and ≥ 0.5 in 16 children. The initial mean and mean changes 6 months after
baseline for these subgroups are shown in Table 31. Among the 42 participants
followed up 12 months after baseline, BMI z-score was increased in 9, and
reduced by ≥ 0 to < 0.25 in 18, ≥ 0.25 to < 0.5 in 8 and ≥ 0.5 in 7 individuals. The
269
corresponding initial mean values and mean changes 12 months after baseline
in relation to subgroup are shown in Table 32.
Overall, changes over 6 and 12 months were significant for all variables except
diastolic blood pressure and sedentary activities at 12 months (Table 30). Waist
circumference and its z-score over 6 and 12 months showed significant
differences between the four BMI z-score subgroups, and positive linear trends
were observed between reduction and BMI z-score loss (Tables 31 and 32).
However, for systolic and diastolic blood pressure, recovery heart rate, physical
activity, sedentary activities and global self-esteem, no statistically significant
differences or trends were evident across the BMI z-score subgroups at 6 or 12
months from baseline (Tables 31 and 32).
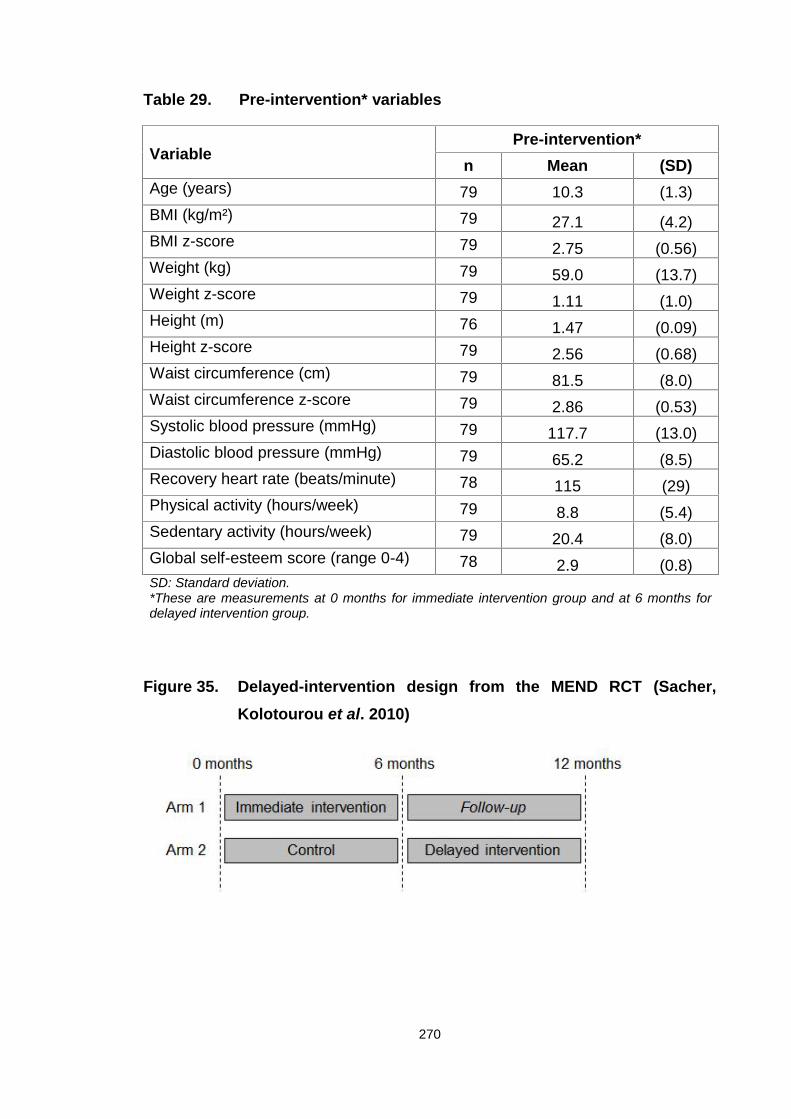
270
Table 29. Pre-intervention* variables
VariablePre-intervention*
n Mean (SD)Age (years) 79 10.3 (1.3)BMI (kg/m²) 79 27.1 (4.2)BMI z-score 79 2.75 (0.56)Weight (kg) 79 59.0 (13.7)Weight z-score 79 1.11 (1.0)Height (m) 76 1.47 (0.09)Height z-score 79 2.56 (0.68)Waist circumference (cm) 79 81.5 (8.0)Waist circumference z-score 79 2.86 (0.53)Systolic blood pressure (mmHg) 79 117.7 (13.0)Diastolic blood pressure (mmHg) 79 65.2 (8.5)Recovery heart rate (beats/minute) 78 115 (29)Physical activity (hours/week) 79 8.8 (5.4)Sedentary activity (hours/week) 79 20.4 (8.0)Global self-esteem score (range 0-4) 78 2.9 (0.8)SD: Standard deviation.*These are measurements at 0 months for immediate intervention group and at 6 months fordelayed intervention group.
Figure 35. Delayed-intervention design from the MEND RCT (Sacher,Kolotourou et al. 2010)
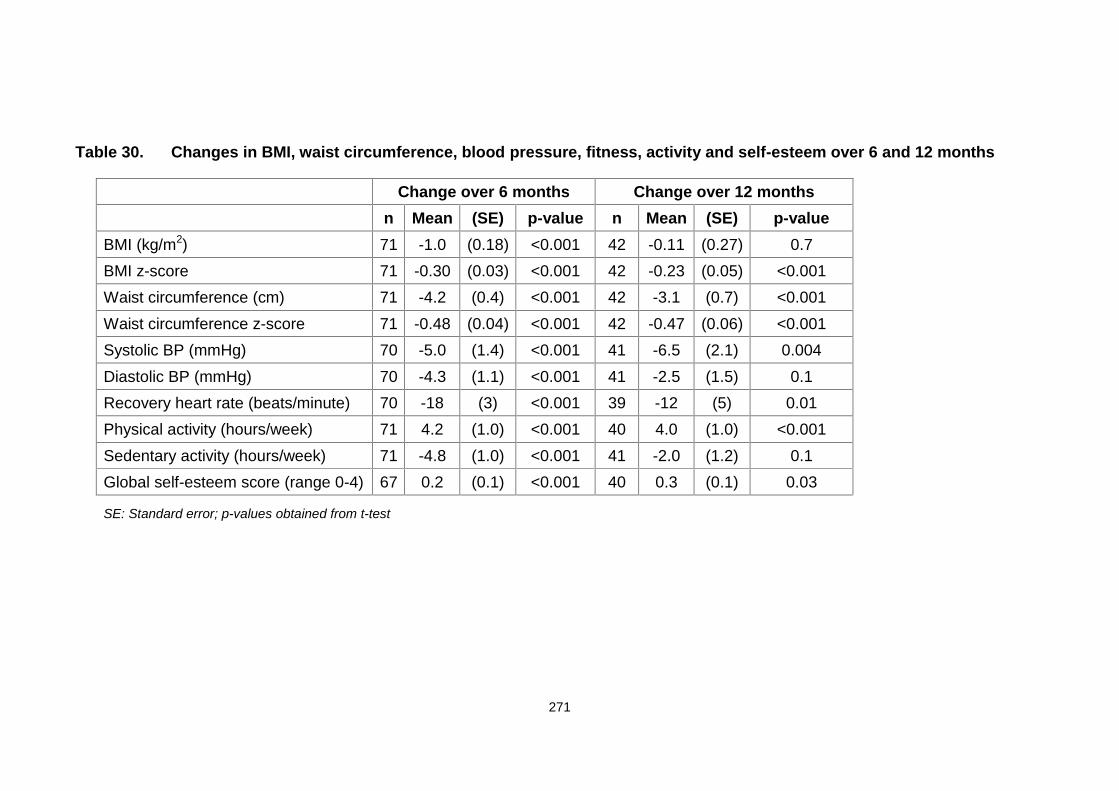
271
Table 30. Changes in BMI, waist circumference, blood pressure, fitness, activity and self-esteem over 6 and 12 months
Change over 6 months Change over 12 monthsn Mean (SE) p-value n Mean (SE) p-value
BMI (kg/m2) 71 -1.0 (0.18) <0.001 42 -0.11 (0.27) 0.7BMI z-score 71 -0.30 (0.03) <0.001 42 -0.23 (0.05) <0.001Waist circumference (cm) 71 -4.2 (0.4) <0.001 42 -3.1 (0.7) <0.001Waist circumference z-score 71 -0.48 (0.04) <0.001 42 -0.47 (0.06) <0.001Systolic BP (mmHg) 70 -5.0 (1.4) <0.001 41 -6.5 (2.1) 0.004Diastolic BP (mmHg) 70 -4.3 (1.1) <0.001 41 -2.5 (1.5) 0.1Recovery heart rate (beats/minute) 70 -18 (3) <0.001 39 -12 (5) 0.01Physical activity (hours/week) 71 4.2 (1.0) <0.001 40 4.0 (1.0) <0.001Sedentary activity (hours/week) 71 -4.8 (1.0) <0.001 41 -2.0 (1.2) 0.1Global self-esteem score (range 0-4) 67 0.2 (0.1) <0.001 40 0.3 (0.1) 0.03
SE: Standard error; p-values obtained from t-test
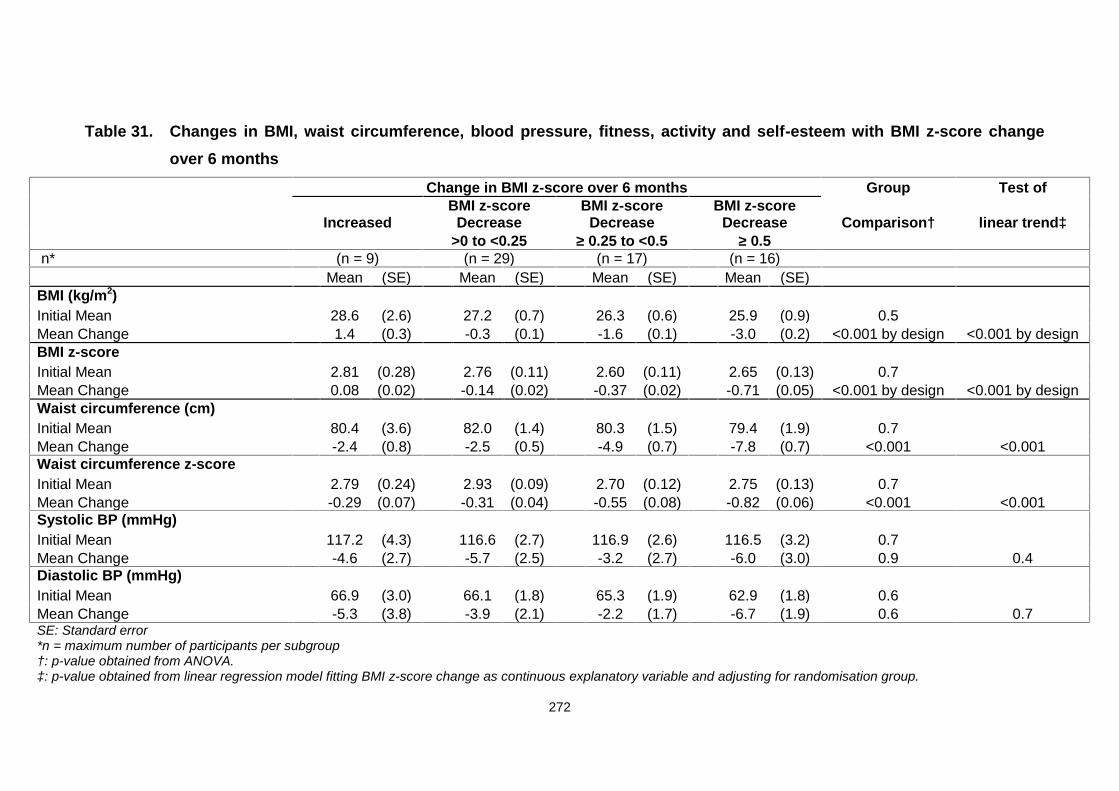
272
Table 31. Changes in BMI, waist circumference, blood pressure, fitness, activity and self-esteem with BMI z-score changeover 6 months
Change in BMI z-score over 6 months Group Test of
IncreasedBMI z-score
DecreaseBMI z-score
DecreaseBMI z-score
Decrease Comparison† linear trend‡>0 to <0.25 ≥ 0.25 to <0.5 ≥ 0.5
n* (n = 9) (n = 29) (n = 17) (n = 16)Mean (SE) Mean (SE) Mean (SE) Mean (SE)
BMI (kg/m2)Initial Mean 28.6 (2.6) 27.2 (0.7) 26.3 (0.6) 25.9 (0.9) 0.5Mean Change 1.4 (0.3) -0.3 (0.1) -1.6 (0.1) -3.0 (0.2) <0.001 by design <0.001 by designBMI z-scoreInitial Mean 2.81 (0.28) 2.76 (0.11) 2.60 (0.11) 2.65 (0.13) 0.7Mean Change 0.08 (0.02) -0.14 (0.02) -0.37 (0.02) -0.71 (0.05) <0.001 by design <0.001 by designWaist circumference (cm)Initial Mean 80.4 (3.6) 82.0 (1.4) 80.3 (1.5) 79.4 (1.9) 0.7Mean Change -2.4 (0.8) -2.5 (0.5) -4.9 (0.7) -7.8 (0.7) <0.001 <0.001Waist circumference z-scoreInitial Mean 2.79 (0.24) 2.93 (0.09) 2.70 (0.12) 2.75 (0.13) 0.7Mean Change -0.29 (0.07) -0.31 (0.04) -0.55 (0.08) -0.82 (0.06) <0.001 <0.001Systolic BP (mmHg)Initial Mean 117.2 (4.3) 116.6 (2.7) 116.9 (2.6) 116.5 (3.2) 0.7Mean Change -4.6 (2.7) -5.7 (2.5) -3.2 (2.7) -6.0 (3.0) 0.9 0.4Diastolic BP (mmHg)Initial Mean 66.9 (3.0) 66.1 (1.8) 65.3 (1.9) 62.9 (1.8) 0.6Mean Change -5.3 (3.8) -3.9 (2.1) -2.2 (1.7) -6.7 (1.9) 0.6 0.7SE: Standard error*n = maximum number of participants per subgroup†: p-value obtained from ANOVA.‡: p-value obtained from linear regression model fitting BMI z-score change as continuous explanatory variable and adjusting for randomisation group.

273
Table 31 (continued)
Change in BMI z-score over 6 months Group Test of
IncreasedBMI z-score
DecreaseBMI z-score
DecreaseBMI z-score
Decrease Comparison† linear trend‡>0 to <0.25 ≥ 0.25 to <0.5 ≥ 0.5
n* (n = 9) (n = 29) (n = 17) (n = 16)Mean (SE) Mean (SE) Mean (SE) Mean (SE)
Recovery Heart Rate (beats/minute)Initial Mean 125 (12) 111 (4) 115 (6) 107 (6) 0.99Mean Change -28 (13) -13 (5) -19 (5) -21 (7) 0.5 >0.9Physical activity (hours/week)Initial Mean 8.8 (1.8) 7.8 (1.0) 11.4 (1.6) 8.1 (0.9) 0.2Mean Change 1.3 (2.1) 5.1 (1.5) 2.4 (2.3) 6.2 (1.8) 0.4 0.12Sedentary activity (hours/week)Initial Mean 20.6 (2.4) 22.9 (1.5) 17.1 (1.8) 20.3 (2.2) 0.9Mean Change -8.7 (2.2) -4.9 (1.8) -2.7 (1.8) -4.8 (1.7) 0.4 0.3Global self-esteem score (range 0-4)Initial Mean 2.8 (0.3) 2.8 (0.2) 3.2 (0.1) 3.0 (0.1) 0.7Mean Change 0.1 (0.3) 0.3 (0.1) 0.2 (0.2) 0.3 (0.2) 0.8 >0.9SE: Standard error*n = maximum number of participants per subgroup†: p-value obtained from ANOVA.‡: p-value obtained from linear regression model fitting BMI z-score change as continuous explanatory variable and adjusting for randomisation group.
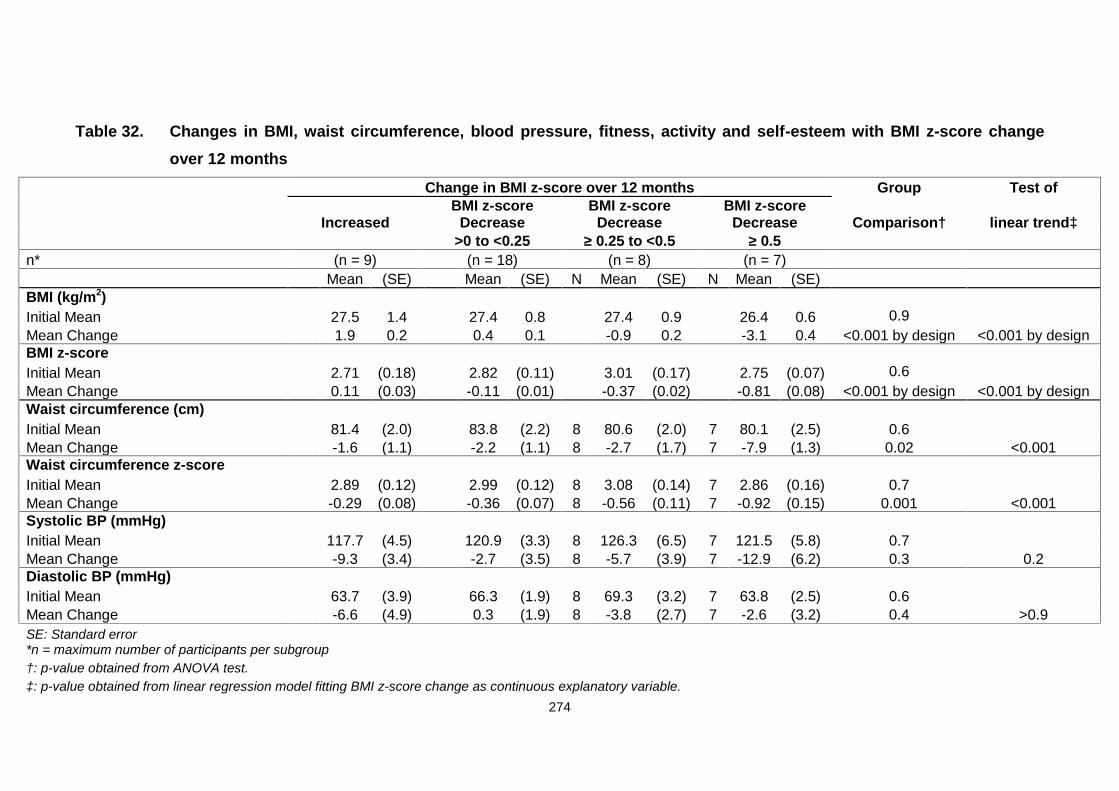
274
Table 32. Changes in BMI, waist circumference, blood pressure, fitness, activity and self-esteem with BMI z-score changeover 12 months
Change in BMI z-score over 12 months Group Test of
IncreasedBMI z-score
DecreaseBMI z-score
DecreaseBMI z-score
Decrease Comparison† linear trend‡>0 to <0.25 ≥ 0.25 to <0.5 ≥ 0.5
n* (n = 9) (n = 18) (n = 8) (n = 7)Mean (SE) Mean (SE) N Mean (SE) N Mean (SE)
BMI (kg/m2)Initial Mean 27.5 1.4 27.4 0.8 27.4 0.9 26.4 0.6 0.9Mean Change 1.9 0.2 0.4 0.1 -0.9 0.2 -3.1 0.4 <0.001 by design <0.001 by designBMI z-scoreInitial Mean 2.71 (0.18) 2.82 (0.11) 3.01 (0.17) 2.75 (0.07) 0.6Mean Change 0.11 (0.03) -0.11 (0.01) -0.37 (0.02) -0.81 (0.08) <0.001 by design <0.001 by designWaist circumference (cm)Initial Mean 81.4 (2.0) 83.8 (2.2) 8 80.6 (2.0) 7 80.1 (2.5) 0.6Mean Change -1.6 (1.1) -2.2 (1.1) 8 -2.7 (1.7) 7 -7.9 (1.3) 0.02 <0.001Waist circumference z-scoreInitial Mean 2.89 (0.12) 2.99 (0.12) 8 3.08 (0.14) 7 2.86 (0.16) 0.7Mean Change -0.29 (0.08) -0.36 (0.07) 8 -0.56 (0.11) 7 -0.92 (0.15) 0.001 <0.001Systolic BP (mmHg)Initial Mean 117.7 (4.5) 120.9 (3.3) 8 126.3 (6.5) 7 121.5 (5.8) 0.7Mean Change -9.3 (3.4) -2.7 (3.5) 8 -5.7 (3.9) 7 -12.9 (6.2) 0.3 0.2Diastolic BP (mmHg)Initial Mean 63.7 (3.9) 66.3 (1.9) 8 69.3 (3.2) 7 63.8 (2.5) 0.6Mean Change -6.6 (4.9) 0.3 (1.9) 8 -3.8 (2.7) 7 -2.6 (3.2) 0.4 >0.9SE: Standard error*n = maximum number of participants per subgroup†: p-value obtained from ANOVA test.‡: p-value obtained from linear regression model fitting BMI z-score change as continuous explanatory variable.
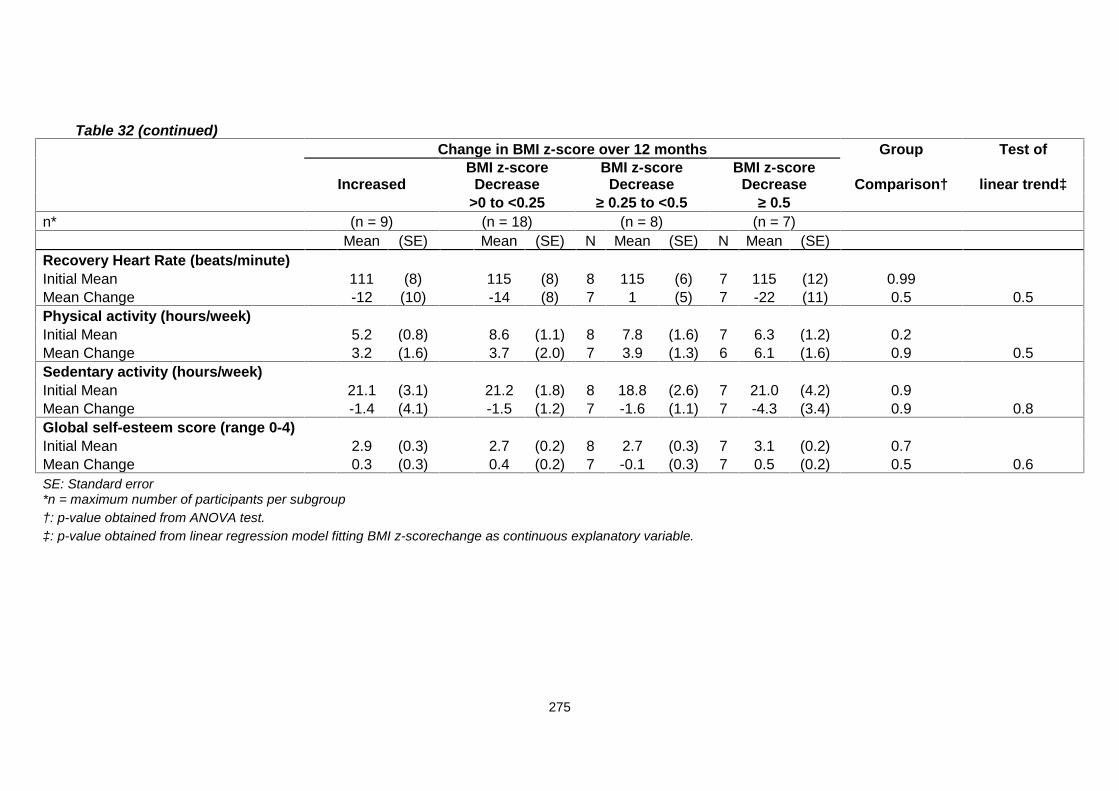
275
Table 32 (continued)Change in BMI z-score over 12 months Group Test of
IncreasedBMI z-score
DecreaseBMI z-score
DecreaseBMI z-score
Decrease Comparison† linear trend‡>0 to <0.25 ≥ 0.25 to <0.5 ≥ 0.5
n* (n = 9) (n = 18) (n = 8) (n = 7)Mean (SE) Mean (SE) N Mean (SE) N Mean (SE)
Recovery Heart Rate (beats/minute)Initial Mean 111 (8) 115 (8) 8 115 (6) 7 115 (12) 0.99Mean Change -12 (10) -14 (8) 7 1 (5) 7 -22 (11) 0.5 0.5Physical activity (hours/week)Initial Mean 5.2 (0.8) 8.6 (1.1) 8 7.8 (1.6) 7 6.3 (1.2) 0.2Mean Change 3.2 (1.6) 3.7 (2.0) 7 3.9 (1.3) 6 6.1 (1.6) 0.9 0.5Sedentary activity (hours/week)Initial Mean 21.1 (3.1) 21.2 (1.8) 8 18.8 (2.6) 7 21.0 (4.2) 0.9Mean Change -1.4 (4.1) -1.5 (1.2) 7 -1.6 (1.1) 7 -4.3 (3.4) 0.9 0.8Global self-esteem score (range 0-4)Initial Mean 2.9 (0.3) 2.7 (0.2) 8 2.7 (0.3) 7 3.1 (0.2) 0.7Mean Change 0.3 (0.3) 0.4 (0.2) 7 -0.1 (0.3) 7 0.5 (0.2) 0.5 0.6SE: Standard error*n = maximum number of participants per subgroup†: p-value obtained from ANOVA test.‡: p-value obtained from linear regression model fitting BMI z-scorechange as continuous explanatory variable.
276
7.20 MEND UK implementation (Roll-out) results
Between 2007 and 2010, 7-13 year old overweight and obese children
participated in 2063 MEND programmes across the UK. The intervention was
delivered by a wide range of professionals in community venues. Outcomes
were assessed pre- and post-intervention. The baseline characteristics and
pre-post analysis data are presented in Tables 33 and 35.
Demographics of the implementation phase revealed that 24% of families
were BME (UK average: 7.9%) (Table 34), 34% were single parents (UK
average: 24%) and 47% did not own their own home (UK average: 31%), a
proxy for SEC (2011).
From 2010 onwards, parents attending the UK programmes were measured
(height and weight) and their BMI calculated. The data revealed that at
baseline, 0.4% of parents were classified as underweight (BMI ≤ 18.49 kg/m2),
17.9% of parents were healthy weight (BMI 18.5-24.99 kg/m2), 29.8% were
overweight (BMI 25- 29.99 kg/m2) and 52% were obese (BMI ≥ 30 kg/m2). The
BMI distribution for parents is depicted in Figure 36. The mean parental
baseline BMI was 31.5 kg/m2 (SD 7.2), and percentage weight change for all
parents following the intervention was -1%.
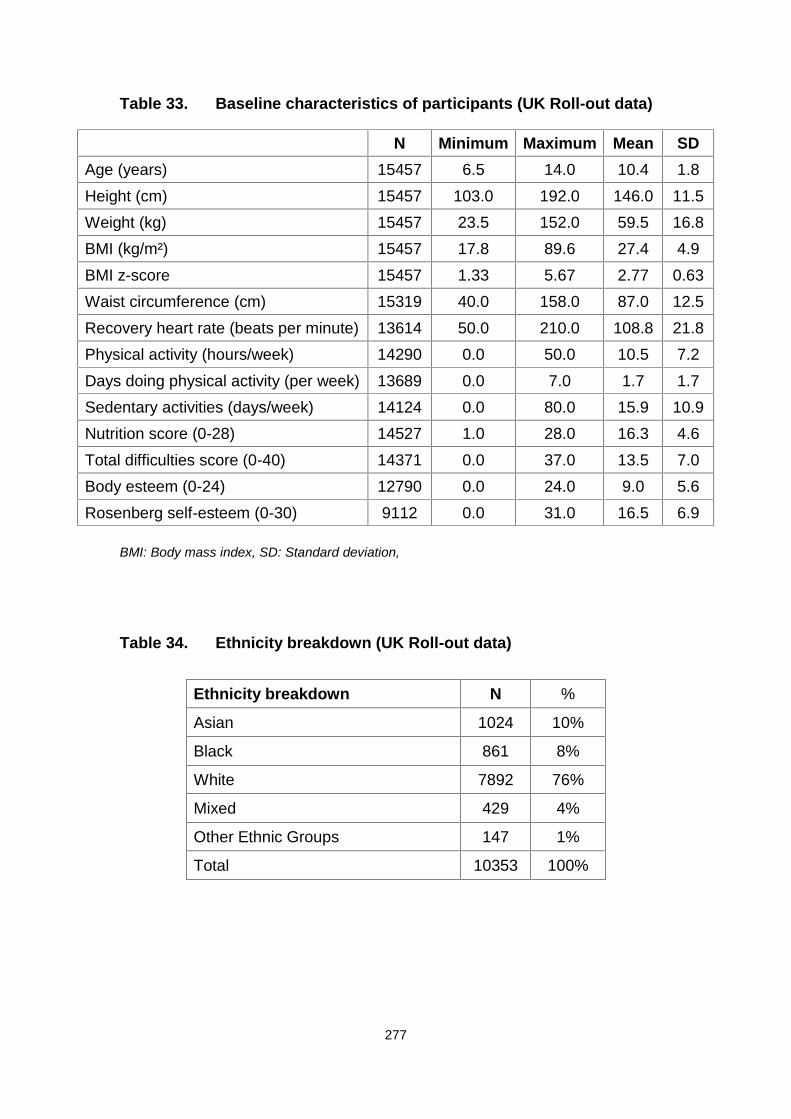
277
Table 33. Baseline characteristics of participants (UK Roll-out data)
N Minimum Maximum Mean SDAge (years) 15457 6.5 14.0 10.4 1.8Height (cm) 15457 103.0 192.0 146.0 11.5Weight (kg) 15457 23.5 152.0 59.5 16.8BMI (kg/m²) 15457 17.8 89.6 27.4 4.9BMI z-score 15457 1.33 5.67 2.77 0.63Waist circumference (cm) 15319 40.0 158.0 87.0 12.5Recovery heart rate (beats per minute) 13614 50.0 210.0 108.8 21.8Physical activity (hours/week) 14290 0.0 50.0 10.5 7.2Days doing physical activity (per week) 13689 0.0 7.0 1.7 1.7Sedentary activities (days/week) 14124 0.0 80.0 15.9 10.9Nutrition score (0-28) 14527 1.0 28.0 16.3 4.6Total difficulties score (0-40) 14371 0.0 37.0 13.5 7.0Body esteem (0-24) 12790 0.0 24.0 9.0 5.6Rosenberg self-esteem (0-30) 9112 0.0 31.0 16.5 6.9
BMI: Body mass index, SD: Standard deviation,
Table 34. Ethnicity breakdown (UK Roll-out data)
Ethnicity breakdown N %
Asian 1024 10%
Black 861 8%
White 7892 76%
Mixed 429 4%
Other Ethnic Groups 147 1%
Total 10353 100%
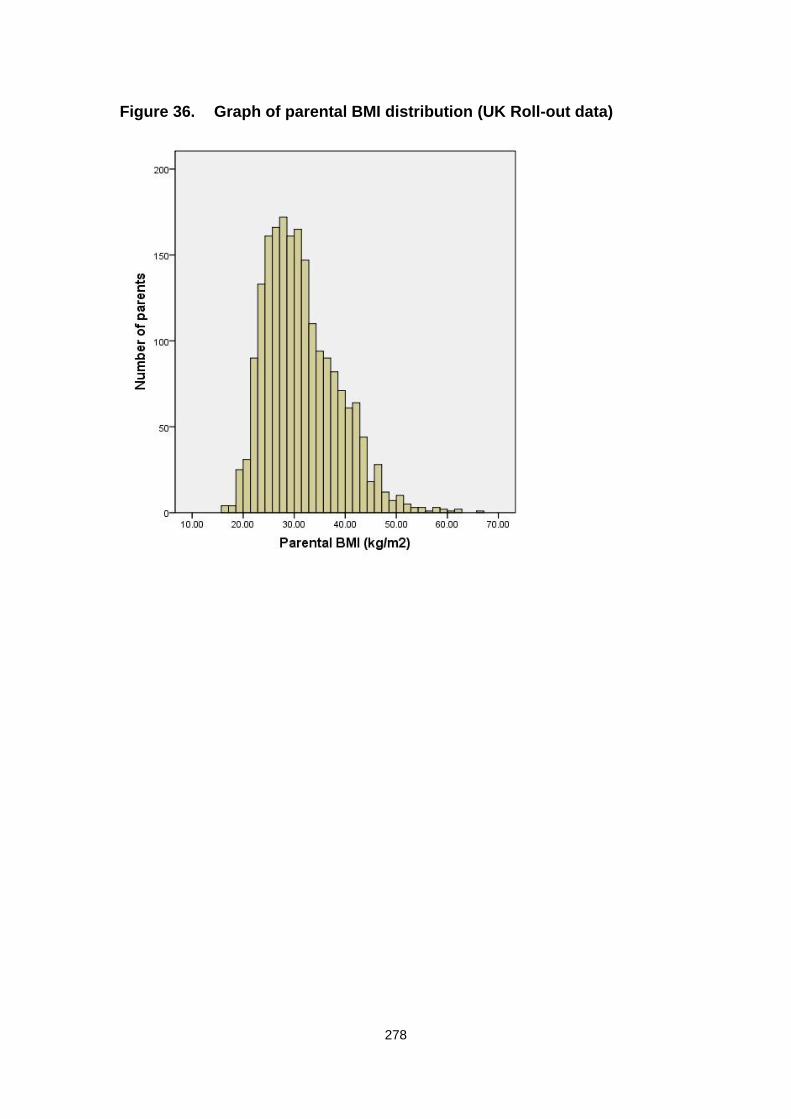
278
Figure 36. Graph of parental BMI distribution (UK Roll-out data)
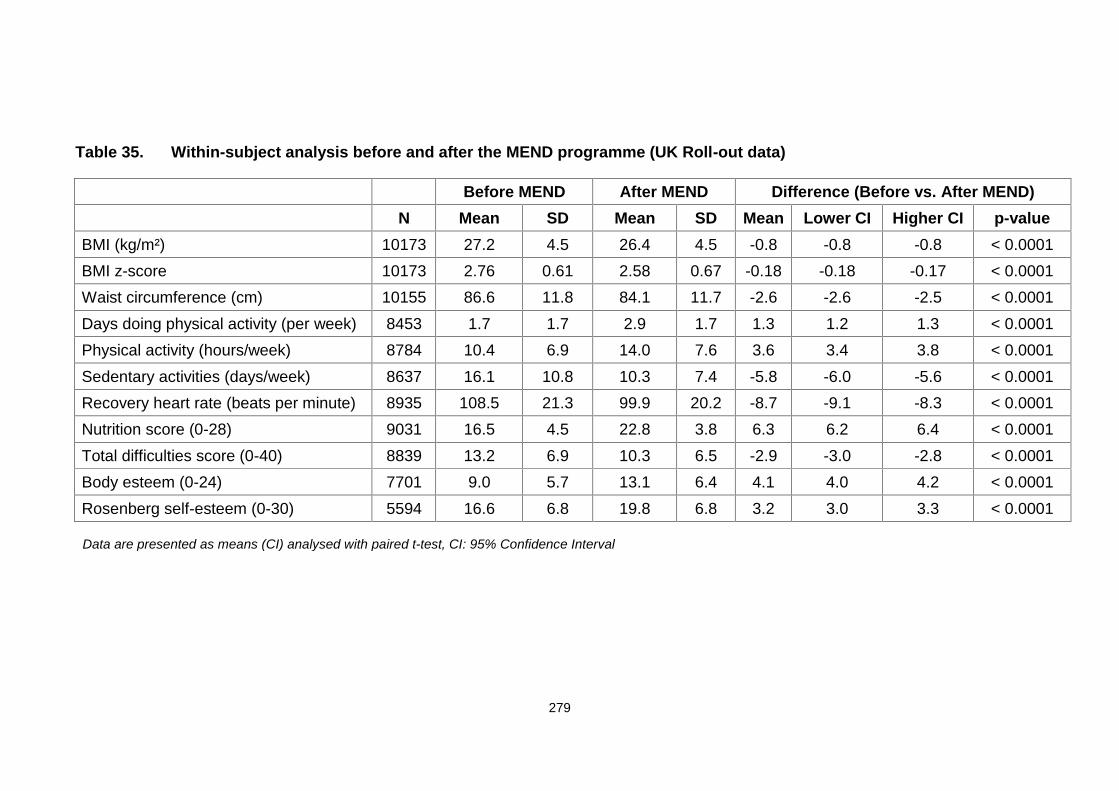
279
Table 35. Within-subject analysis before and after the MEND programme (UK Roll-out data)
Before MEND After MEND Difference (Before vs. After MEND)N Mean SD Mean SD Mean Lower CI Higher CI p-value
BMI (kg/m²) 10173 27.2 4.5 26.4 4.5 -0.8 -0.8 -0.8 < 0.0001BMI z-score 10173 2.76 0.61 2.58 0.67 -0.18 -0.18 -0.17 < 0.0001Waist circumference (cm) 10155 86.6 11.8 84.1 11.7 -2.6 -2.6 -2.5 < 0.0001Days doing physical activity (per week) 8453 1.7 1.7 2.9 1.7 1.3 1.2 1.3 < 0.0001Physical activity (hours/week) 8784 10.4 6.9 14.0 7.6 3.6 3.4 3.8 < 0.0001Sedentary activities (days/week) 8637 16.1 10.8 10.3 7.4 -5.8 -6.0 -5.6 < 0.0001Recovery heart rate (beats per minute) 8935 108.5 21.3 99.9 20.2 -8.7 -9.1 -8.3 < 0.0001Nutrition score (0-28) 9031 16.5 4.5 22.8 3.8 6.3 6.2 6.4 < 0.0001Total difficulties score (0-40) 8839 13.2 6.9 10.3 6.5 -2.9 -3.0 -2.8 < 0.0001Body esteem (0-24) 7701 9.0 5.7 13.1 6.4 4.1 4.0 4.2 < 0.0001Rosenberg self-esteem (0-30) 5594 16.6 6.8 19.8 6.8 3.2 3.0 3.3 < 0.0001
Data are presented as means (CI) analysed with paired t-test, CI: 95% Confidence Interval
280
Chapter 8 Discussion
At the time of development and evaluation of the MEND intervention, no published
childhood obesity intervention programmes that were both efficacious and
generalisable in a UK community setting were available. However, a growing number
of government initiatives to improve childhood health and prevent the increase in
childhood obesity, e.g., the 'fruit at school' scheme and two hours of compulsory
physical education for all children at school, were implemented. Although
commendable, these initiatives were not evidence-based or specifically designed for
the management of children who were already overweight or obese. At this time,
interventions introduced in the school setting generally showed poor results in terms
of reducing child BMI (Summerbell, Ashton et al. 2003).
The purpose of the development, evaluation and implementation of the MEND
intervention was to determine whether: i) health and wellbeing could be improved in
obese children attending a novel, multicomponent intervention outside of a clinical
setting in the UK, ii) families would engage and attend an intensive programme, iii)
the intervention was efficacious in a controlled trial when delivered by professionals
other than the original specialist programme developers, iv) changes in
anthropometry were clinically significant, and v) the intervention was effective when
implemented under service-level conditions across the UK.
Thus, the primary aim of MEND RCT was to test the hypothesis that an intensive
family-based programme of nutrition education, exercise and behaviour modification,
followed by free access to swimming facilities, can improve anthropometry,
cardiovascular fitness and self-esteem in obese school-aged children, compared to a
waiting list control group. The secondary purpose of the trial was to evaluate whether
281
positive health outcomes could be sustained at 12 months and replicated when
implemented under service-level conditions across the UK.
8.1 Trial population baseline measures
8.1.1 Ethnicity and socioeconomic circumstances (SEC)
Ethnicity and SEC are relevant factors when developing and evaluating childhood
weight management interventions, owing to known socio-demographic inequalities in
the distribution of childhood overweight and obesity (El-Sayed, Scarborough et al.
2012). For example, studies over the past 20 years have shown reasonably
consistent evidence that children in disadvantaged circumstances are more likely to
be overweight or obese than their more advantaged peers (Shrewsbury and Wardle
2008). Ethnic minority children are at increased risk of adult obesity, cardiovascular
disease risk and insulin resistance, and therefore present important targets for
childhood obesity interventions (El-Sayed, Scarborough et al. 2012). Several studies
have shown that children from ethnic minorities are generally more overweight than
Caucasian children, with lower fitness levels, poorer diets, and higher levels of
television viewing (HSE 2006; Singh, Kogan et al. 2008; El-Sayed, Scarborough et
al. 2012). In the 2004 Health Survey of England (HSE) that focused on the health of
ethnic minorities (HSE 2006), the proportion of overweight (including obese) children
aged 2-15 ranged from 22% (Chinese boys) to 42% (Black African boys). Research
suggests that this variation may be partly explained by some types of families (such
as those with better SEC) being more likely to access services that support health
and behaviour change (Marmot and Bell 2012).
282
Interestingly, in developed countries, children from lower SEC households appear
more prone to increased body weight, whereas in developing countries, the opposite
trend is evident (Wang and Lobstein 2006). An inverse association between low SEC
in childhood and adult obesity, cardiovascular disease risk and overall mortality has
been reported (Senese, Almeida et al. 2009). Additionally, children from lower SEC
groups appear less physically active and fit, compared to their higher SEC
counterparts, and these features persist into adulthood (Cleland, Ball et al. 2009).
The current trial was characterised by a high proportion of children from black and
minority ethnic group (BME) backgrounds and low socio-economic circumstances
(SEC). In total, 47% of children were classified as BME, compared to the overall UK
population, which is predominantly white (national average, 91.9%) (Table 14)
(2011). This was not unexpected, considering that 4 of the 5 trial sites were located
in inner London areas containing higher proportions of non-white families.
In the present trial, the occupation of the primary earner of the child’s household was
used as an indicator of SEC. The primary earner had a manual occupation in 61% of
participating families (Table 13), leading to the classification of many households as
low SEC (1993).
8.1.2 Anthropometry and body composition
Height and weight measurements of children were used to calculate their BMI and
corresponding weight status. In addition, waist circumference and body composition
were evaluated. The majority of children were classified as moderately obese (BMI
z-scores 2 to 3.5; mean, 2.8) (Table 13), 8 as severely obese (BMI z-scores 3.5 to 4)
283
and 2 extremely obese (BMI z-score greater than 4) (SIGN 2010). Similar trials have
reported BMI z-scores at baseline ranging from 2.0 (SD not reported) (Golan,
Kaufman et al. 2006), 2.4 (SD 0.1) (Reinehr, de Sousa et al. 2006), and 2.75 (SD
0.52) (Golley, Magarey et al. 2007) to as high as 3.7 (SD 1.1) (Epstein, Paluch et al.
2007). Significant discrepancies in BMI z-score at baseline may not allow objective
comparison of outcomes between studies. Moreover, for the development of a
community-based intervention targeting the majority of children with increased
adiposity, a moderately obese sample provides more generalisable results and
expectations than an intervention addressing severely obese participants.
The mean waist circumference z-score in the current trial was above the 99.6th
centile (McCarthy, Jarrett et al. 2001). Mean total body fat percentage was 39.5%,
which is above the 98th centile for both genders for children between 8-12 years,
according to the UK reference curves for body fat (McCarthy, Cole et al. 2006).
Waist circumference is not commonly measured in other trials, particularly in the
USA, where there are no reference values for childhood waist circumference.
Therefore, the current trial population was characterised by both general and central
adiposity leading to increased risk of several health problems, both in the short and
long term (Barlow 2007; Oude Luttikhuis, Baur et al. 2009).
8.1.3 Parental obesity
Weight and height measurements of parents were obtained to calculate BMI and
weight status. The majority of children attended the baseline measurement sessions
with their mothers. Overall, 75% of the parents were overweight or obese (Figure 29)
284
with a mean BMI at baseline of 29.8 kg/m² (Table 13). This finding is similar to data
from the feasibility trial (88% of overweight or obese parents), and strongly supports
earlier literature linking parental and childhood obesity (Zaninotto, Wardle et al.
2006) (Table 2).
The proportions of overweight and obese parents have rarely been reported in
similar trials, which is surprising, considering that family is increasingly recognised as
an important contributor to the growing problem of childhood obesity (Patrick and
Nicklas 2005; West, Sanders et al. 2010; Keane, Layte et al. 2012). Children are
likely to adopt their parents’ eating habits as a result of environmental exposure,
rather than heredity of ‘food choice genes’. In this way, obesity is passed from one
generation to the next (Patrick and Nicklas 2005; NICE 2006).
The correlation between parental and child obesity necessitates the targeting of
either parents alone or entire families with obesity interventions, and not just obese
children. Accordingly, the current intervention trial included the obese child and at
least one parent or carer.
8.1.4 Cardiovascular fitness
Cardiovascular fitness was measured using systolic and diastolic blood pressure and
a non-validated step test method in the feasibility trial. This was addressed in the
RCT as cardiovascular fitness, assessed using validated methods consisting of both
recovery heart rate following a 3-minute validated step test as well as systolic and
diastolic blood pressure. The mean recovery heart rate at baseline was 96.3 beats
per minute (Table 13). Unfortunately, no reference values were available for
285
children’s recovery heart rates following the 3-minute step test, which would have
facilitated comparisons and provided some indication of baseline fitness.
Blood pressure is an indicator of vascular health and cardiovascular fitness.
Hypertension has been reported in obese children, and linked to subsequent
cardiovascular disease (Stabouli, Papakatsika et al. 2011; Tybor, Lichtenstein et al.
2011). The majority of children in the trial population had blood pressure values at
baseline within the normotensive range according to the UK blood pressure centiles
(Jackson, Thalange et al. 2007).
Poor cardiovascular fitness is an important contributor to the development of co-
morbidities in obese children (Reinehr, de Sousa et al. 2006). Recent evidence has
shown that decreasing cardiovascular fitness from childhood into adulthood
increases the risk of obesity and insulin resistance (Dwyer, Magnussen et al. 2009).
On the other hand, improving fitness early in life can help reduce cardiovascular
disease risk factors (insulin resistance, abdominal obesity, blood pressure), even if
the child remains within the overweight or obese category (Nassis, Papantakou et al.
2005; Ortega, Ruiz et al. 2010). Interventions aimed at improving cardiovascular
fitness can potentially aid in preventing the onset of cardiovascular disease and type
2 diabetes in adults, as well as the persistence of obesity in later life (Nassis, Psarra
et al. 2005; Dwyer, Magnussen et al. 2009).
For these reasons, children included in the trial intervention participated in twice-
weekly exercise sessions in order to promote and evaluate effects on cardiovascular
fitness. Earlier groups have evaluated parent-only interventions (Golan, Kaufman et
al. 2006; Boutelle, Cafri et al. 2011) with positive weight status results but have
rarely reported changes in children’s cardiovascular fitness.
286
8.1.5 Physical and sedentary activity levels
In the current trial, the average time spent doing physical activity at baseline was 7.5
hours/week (Table 13). This level appeared to meet the current recommendation that
children should participate in a minimum of one hour of physical activity per day
(NICE 2009; DH 2011). However the figure was lower than the average physical
activity levels reported in the most recent Health Survey for England (13.8 and 10.9
hours/week for boys and girls, respectively) (DH 2011). Generally, low physical
activity levels are reported in obese children (Froberg and Andersen 2005),
especially among older girls (DH 2011).
Time spent in sedentary activities was 50% higher than the current recommendation
(3 hours/day vs. the recommended maximum of 2 hours/day (NICE 2006; Barlow
2007; SIGN 2010).
Accelerometers are the gold standard method for measuring physical activity
(Rowlands, Stone et al. 2007). However, due to their high cost at the time of the trial,
the appropriate resources were not available. Instead, a questionnaire assessing
physical activity levels was used, based on the validated physical activity survey
developed by Slemenda et al. (1991) (Appendix 13). Measurement of physical and
sedentary activities using questionnaires is a common problem in childhood studies
(Barton 2010), and the results are not always consistent, mostly due to the
methodological limitations in assessing physical activity in the young (Dollman,
Norton et al. 2005; NOO 2011). Accordingly, physical and sedentary activity results
should be interpreted with caution.
287
8.1.6 Global self-esteem
In this study, global self-esteem at baseline was lower than that of the general
population (2.8 vs. 2.9 – 3.1 in the current and general population, respectively)
(Table 13). Low self-esteem values during childhood have been reported in obese
populations (Strauss 2000). According to Wang and colleagues, obese children have
almost twice the odds of low self-esteem, compared to healthy weight children
(Wang, Wild et al. 2009).
Interestingly, no differences in global self-esteem scores were evident between boys
and girls, in contrast to earlier literature showing that global self-esteem reduces with
age to a greater extent for girls than boys (Hoare and Cosgrove 1998). Moreover,
weight status has been reported to affect self-esteem in different UK ethnic
populations. For instance, overweight or obese white and Bangladeshi boys have
lower self-esteem, compared to other ethnicities, whereas in black boys and girls,
this pattern of association is not evident (Viner, Haines et al. 2006). Here, we
observed no differences in self-esteem at baseline in various ethnic groups.
8.1.7 Dietary intake
In the current study, the average energy intake of the trial population at baseline was
1922 kcal/day (Table 15). This figure is similar to the UK Energy Reference Value
(ERV) of 1902 (average ERV for boys and girls aged 10 years with low physical
activity levels) (Table 15) (SACN 2011). However, ERV is derived using median
values for weight in the basal metabolic rate equation, and therefore, the current
population would have higher values if increased (or corrected) weight is used. This
288
creates a conflicting picture for energy balance in these children, as the issue of how
this population is obese with such an energy intake is paradoxical. One explanation
of this phenomenon is a potential lower activity level leading to lower energy
requirements or high rate of underreporting (see Section 1.6.2), which is common
among overweight and obese children and results in misleading low levels of energy
intake (Fisher, Johnson et al. 2000; Bandini, Must et al. 2003; Lambert, Agostoni et
al. 2004).
Underreporting of energy intake does not seem to be macronutrient-specific, i.e.,
children seem to equally underreport all macronutrients (Rodriguez and Moreno
2006; Collins, Watson et al. 2010; Agostoni, Braegger et al. 2011; Elliott, Truby et al.
2011). Therefore, the percentage of energy intake from macronutrients can be
assessed with more confidence. In the current population, total carbohydrate and fat
intake were close to the recommended levels (50% and 35%, respectively).
However, saturated fat and non milk extrinsic sugar intake were higher in the current
sample, as saturated fatty acids accounted for 13% of energy intake, relative to the
recommendation of no more than 11% of total energy intake. Moreover, dietary fibre
(non-starch polysaccharides) intake was 12 grams per day, similar to the individual
minimum for adults recommended by COMA 1991, but lower than the
recommendation for obese children (NICE 2006). Fluid, calcium and iron intake were
found to be within the recommended levels. However, sodium intake (2659 mg/day)
was significantly higher than the recommended 1200 mg per day. Sodium intake is
often underestimated in dietary assessment (Koopman 1992), which is rather
worrying in terms of children's health, given the well-known concerns about
increased consumption of sodium (Morrison and Ness 2011; Stabouli, Papakatsika
et al. 2011). In summary, even though energy intake in children appeared to fall
289
within the recommended range, macronutrient quality indicated poor overall diet
quality (Eisenberg, Neumark-Sztainer et al. 2003).
8.2 Changes in indicators of adiposity
Adiposity was measured using three separate parameters, specifically, waist
circumference, BMI and body composition. Results at 3 and 6 months are based on
controlled data. Due to the trial design, after 6 months, the control group received the
intervention, and therefore, all future analyses became uncontrolled.
Sustainability of outcomes is crucial in assessing the success of a weight
management programme. However, available literature for childhood obesity
interventions with long-term (greater than 12 months) follow-up is limited (Oude
Luttikhuis, Baur et al. 2009). Sustainability of outcomes in the current trial was
evaluated by analysing the 12-month longitudinal data only in the intervention group
(Figure 28 and Table 22).
8.2.1 Waist circumference and waist circumference z-score
Waist circumference was selected as the primary outcome measure, an unusual
parameter of choice in child obesity intervention studies. Since the MEND
intervention targeted both diet and physical activity, the primary outcome was
selected in expectation of simultaneous changes in body fat and lean body mass,
which could not be detected with routinely used BMI. As BMI does not distinguish
between fat and lean mass, it would be possible for an increase in lean tissue to
290
mask a fall in adipose tissue content. Waist circumference does not depend on lean
mass, and is thus not susceptible to this limitation.
Waist circumference increases naturally with growth (McCarthy, Cole et al. 2006),
and this parameter was thus adjusted for age and gender (z-score) to determine the
true effects of the intervention. The exact clinical significance of reduced waist
circumference in children is currently unknown, owing to the long period between its
measurement and clinical manifestations of the disease. However, researchers
currently encourage its application to better assess the effectiveness of obesity
treatment programmes (Janssen, Katzmarzyk et al. 2005; McCarthy, Jarrett et al.
2005), given that excess abdominal fat in children is associated with several
cardiovascular disease risk factors (McCarthy 2006).
At 3 and 6 months post-randomisation, waist circumference decreased by 3.2 cm
(Table 16) and 4.3 cm (Table 18), respectively, among children in the intervention
group, compared to controls. The corresponding figures for waist circumference z-
score reduction were 0.13 and 0.23 at 3 and 6 months, respectively. The changes
within groups for waist circumference z-score are presented in Figure 30.
These results compare favourably with those from two other randomised studies on
multidisciplinary lifestyle intervention for paediatric obesity (Shelton, Le Gros et al.
2007; Hughes, Stewart et al. 2008) and three studies on the effects of
pharmaceutical management of obesity (Chanoine, Hampl et al. 2005; Klein,
Cottingham et al. 2006; Srinivasan, Ambler et al. 2006).
At 12 months, waist circumference and waist circumference z-score were reduced by
3.1 cm (p < 0.0001) and 0.47 (p < 0.0001), respectively, compared to baseline
(Table 22). The decrease in waist circumference z-score was larger than 3-month
291
and similar to 6-month results (Table 18). This finding indicates a sustained
reduction in waist circumference z-score from the end of the intervention (6 months)
until 12 months post-randomisation.
Determination of the precise elements of the intervention that led to sustained
reduction in waist circumference z-score at 12 months is difficult. One possible factor
is the increased cardiovascular fitness (as indicated by increased physical activity
levels and reduced recovery heart rate and systolic blood pressure) observed at both
6 and 12 months. A number of studies have disclosed lower levels of visceral
adiposity in overweight and obese children and adolescents who exercise (Gutin,
Barbeau et al. 2002; Nassis, Papantakou et al. 2005; Nassis and Sidossis 2006).
To date, few childhood obesity interventions have employed waist circumference as
a complementary index for assessing effectiveness, despite increasing evidence
supporting the advantages of its inclusion in trial protocols (Rudolf, Greenwood et al.
2004; Tybor, Lichtenstein et al. 2011), making comparisons difficult.
In adults, large waist circumference (men > 102 cm, women > 88 cm) is associated
with 20% increased mortality risk (Koster, Leitzmann et al. 2008) and its reduction
with significant health benefits (Han, Richmond et al. 1997; de Koning, Merchant et
al. 2007).
A study by Schmidt et al. (2010) showed that elevated waist circumference in
childhood is a strong predictor of metabolic syndrome in adulthood. Moreover, the
effects are mostly associated with increased triglyceride and glucose levels and
higher blood pressure (Schmidt, Dwyer et al. 2011).
292
Shalitin and co-workers (2009) additionally revealed favourable effects of modest
waist circumference reductions following a 12-week intervention period. The authors
reported improvements in a variety of biochemical markers, including LDL
cholesterol, HDL cholesterol, triglyceride and insulin levels (Shalitin, Ashkenazi-
Hoffnung et al. 2009). This is particularly important for overweight and obese
children with increased central adiposity, as visceral fat is highly correlated with
decreased insulin sensitivity (Krekoukia, Nassis et al. 2007), and in particular, waist
circumference is a predictor of insulin resistance (Manios, Moschonis et al. 2008).
Overall, the potential advantages of waist circumference may outweigh the known
disadvantages, such as greater measurement error and variability over time,
compared to BMI (Rudolf, Walker et al. 2007).
8.2.2 BMI and BMI z-score
In view of the limitations of waist circumference, BMI was used as a secondary
outcome measure. Similar to waist circumference, BMI naturally increases over time
in children due to growth (Cole, Freeman et al. 1995). Accordingly, z-scores were
used to adjust for age and gender when assessing changes in BMI.
Positive health outcomes have been obtained following BMI reduction. Shalitin et al.
(2009) reported a positive correlation between BMI z-score reduction and
improvements in LDL cholesterol and insulin sensitivity in their sample of obese pre-
pubertal children (Shalitin, Ashkenazi-Hoffnung et al. 2009). Studies have shown that
insulin sensitivity is substantially improved with weight loss in obese children,
consequently reducing the risk of complications, such as type 2 diabetes and liver fat
293
accumulation (Reinehr, de Sousa et al. 2006; Savoye, Shaw et al. 2007; Ben Ounis,
Elloumi et al. 2008).
In the current trial, at 3 and 6 months post-randomisation, BMI decreased by 1.4
kg/m2 (Table 16) and 1.9 kg/m2 (Table 18), respectively, among children in the
intervention group, compared to controls. The corresponding figures for BMI z-score
reduction were 0.2 and 0.28 at 3 and 6 months, respectively. BMI z-score was
reduced by 0.23 at 12 months, compared to baseline (Table 22).
BMI z-score is an indicator of treatment effectiveness, as it allows for comparisons
despite age and gender variations. Notably, in the current trial, the BMI z-score
change in favour of the intervention group occurred in the absence of an expected
increase in the control group (Tables 25 and 26) (Nader, O'Brien et al. 2006).
A few studies have attempted to quantify the magnitude of BMI z-score reduction
required to positively influence metabolic health in obese children (Reinehr, de
Sousa et al. 2006; Hunt, Ford et al. 2007; Ford, Hunt et al. 2010). Reinehr and
colleagues published results suggesting that a 0.5 BMI z-score reduction is required
for improved metabolic health (systolic and diastolic blood pressure, LDL and HDL
cholesterol, triglycerides, insulin resistance) one year after an obesity intervention
(Reinehr and Andler 2004).
A UK research team subsequently examined the effects of different levels of BMI z-
score reduction on several cardiovascular disease risk factors in obese children
(Ford, Hunt et al. 2010). The group observed metabolic benefits for insulin
sensitivity, TC/HDL cholesterol ratio and blood pressure with a BMI z-score reduction
of only 0.25 units (less than Reinehr’s cutoff), suggesting that 0.25 is the minimum
for metabolic benefits.
294
Very few multicomponent lifestyle interventions have achieved BMI z-score
reductions at the levels recommended by Reinehr (2004) and Ford et al. (2010).
Some trials have led to a reduction in BMI z-score by ≥ 0.25 (Golan, Kaufman et al.
2006; Reinehr, de Sousa et al. 2006; Okely, Collins et al. 2010) recommended by
Ford et al. (2010), but less than Reinehr’s recommendation of 0.5 (Reinehr and
Andler 2004). In the most recent Cochrane review on childhood obesity treatment,
four studies (Golan, Kaufman et al. 2006; Golley, Magarey et al. 2007; Kalavainen,
Korppi et al. 2007; Hughes, Stewart et al. 2008) were included in the meta-analysis
for BMI z-score at 6 months post lifestyle intervention in children younger than 12
years (Oude Luttikhuis, Baur et al. 2009). The mean difference in BMI z-score for the
four studies was -0.06 (95% CI: -0.12 to -0.01). Three studies (Golley, Magarey et al.
2007; Kalavainen, Korppi et al. 2007; Hughes, Stewart et al. 2008) were included in
the meta-analysis for BMI z-score at 12 months, with a mean difference of -0.04
(95% CI: -0.12 to 0.04) (Oude Luttikhuis, Baur et al. 2009).
The observed BMI z-score reduction of 0.23 in the current trial is almost six-fold
higher than the average decrease of 0.06 observed for lifestyle interventions (Oude
Luttikhuis, Baur et al. 2009). It is difficult to establish the reasons for the differences
in BMI z-score changes between different childhood weight management
interventions (Table 36). Even when sufficient levels of BMI z-score reduction are
achieved, one cannot assume that these results are generalisable to different
countries or populations. One example is the Traffic Light Diet intervention, whereby
significant variations in BMI z-score change have been observed upon delivery by
different groups: -1.07 (Epstein, Paluch et al. 2007), -0.17 (Boutelle, Cafri et al.
2011) and -0.11 (not significant between groups) upon replication in the UK (Croker,
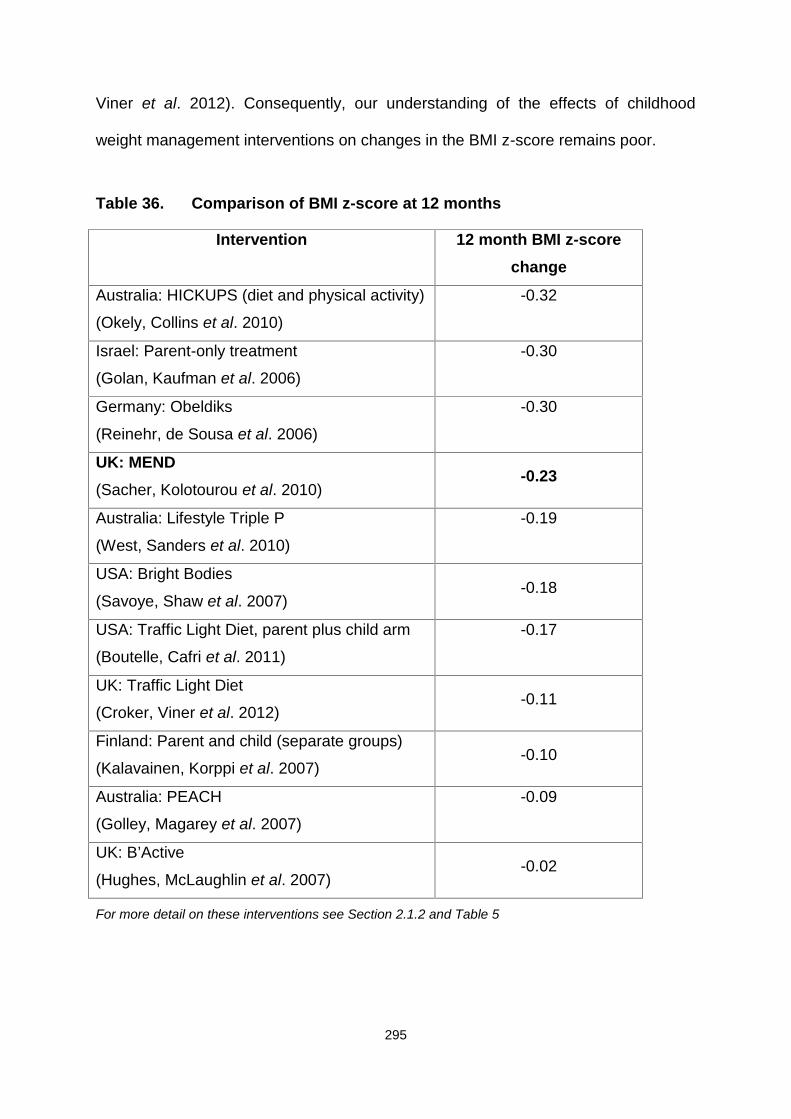
295
Viner et al. 2012). Consequently, our understanding of the effects of childhood
weight management interventions on changes in the BMI z-score remains poor.
Table 36. Comparison of BMI z-score at 12 months
Intervention 12 month BMI z-scorechange
Australia: HICKUPS (diet and physical activity)
(Okely, Collins et al. 2010)
-0.32
Israel: Parent-only treatment
(Golan, Kaufman et al. 2006)
-0.30
Germany: Obeldiks
(Reinehr, de Sousa et al. 2006)
-0.30
UK: MEND(Sacher, Kolotourou et al. 2010)
-0.23
Australia: Lifestyle Triple P
(West, Sanders et al. 2010)
-0.19
USA: Bright Bodies
(Savoye, Shaw et al. 2007)-0.18
USA: Traffic Light Diet, parent plus child arm
(Boutelle, Cafri et al. 2011)
-0.17
UK: Traffic Light Diet
(Croker, Viner et al. 2012)-0.11
Finland: Parent and child (separate groups)
(Kalavainen, Korppi et al. 2007)-0.10
Australia: PEACH
(Golley, Magarey et al. 2007)
-0.09
UK: B’Active
(Hughes, McLaughlin et al. 2007)-0.02
For more detail on these interventions see Section 2.1.2 and Table 5
296
Despite these interesting, albeit inconclusive findings, research in this area is limited.
It appears premature to recommend BMI z-score thresholds to define intervention
effectiveness, especially in light of several studies suggesting that improvements in
glucose and lipid profile and positive metabolic effects can be achieved with smaller
reductions or even maintenance of the BMI z-score (Kirk, Zeller et al. 2005; Nowicka,
Pietrobelli et al. 2007; Cummings, Henes et al. 2008; Hughes, Stewart et al. 2008;
Farpour-Lambert, Aggoun et al. 2009; Pedrosa, Oliveira et al. 2011; Kolsgaard,
Joner et al. 2012).
Another important point is that while BMI and BMI z-score are simple and convenient
tools to assess the effectiveness of childhood obesity interventions, they have
several limitations. These indices do not take into account body composition or
provide information about other aspects of health, behavioural change and
psychology (Janssen, Craig et al. 2004; McCarthy, Cole et al. 2006). For instance, in
interventions with an exercise component, small reductions in BMI z-score may be
masked due to positive changes in body composition, for e.g., increased lean body
mass (Lazaar, Aucouturier et al. 2007; Farpour-Lambert, Aggoun et al. 2009).
8.2.3 Body composition
Measurement of body composition using deuterium dilution was a third mode of
evaluation of the intervention effects on adiposity. No significant changes were
observed at either 3 or 6 months, except for adjusted fat mass, which was markedly
reduced at 6 months (-2.4 kg; p ≤ 0.05) (Table 18). Fat mass reduction was
supported by decreased waist circumference observed in the intervention group at 6
months. This is significant, given that visceral fat, which is more accurately predicted
297
from waist circumference (Brambilla, Bedogni et al. 2006), is the tissue associated
with cardiovascular disease risk factors in children (Savva, Tornaritis et al. 2000).
We observed no significant reduction in body fat (%), in accordance with the findings
of Hunt et al. (2007), who showed that due to wide variations in body fat (%) loss, a
BMI z-score reduction greater than 0.5 is required for definite body fat (%) reduction,
mainly representing loss of subcutaneous rather than visceral fat (Hunt, Ford et al.
2007).
Body fat re-distribution and reduction in abdominal fat that did not result in total body
fat decrease may explain the lack of significant changes in overall body composition,
which may need more time to appear in a moderately obese population (Nassis and
Sidossis 2006).
Unexpectedly, children in the control group displayed increased lean body mass,
which may further complicate our interpretation of body composition data (Tables 25
and 26). This increase is possibly linked to the higher physical activity levels in the
control group at both 3 and 6 months. Unfortunately, body composition was not
assessed at 12 months, owing to a lack of resources.
8.2.4 Weight loss
As children are growing, change in weight is not used as an outcome to assess the
effectiveness of childhood obesity interventions. Rapid weight loss in children can
lead to poor growth and other medical or psychological problems, and is therefore
not recommended (NICE 2006). The SIGN Guidelines recommend weight
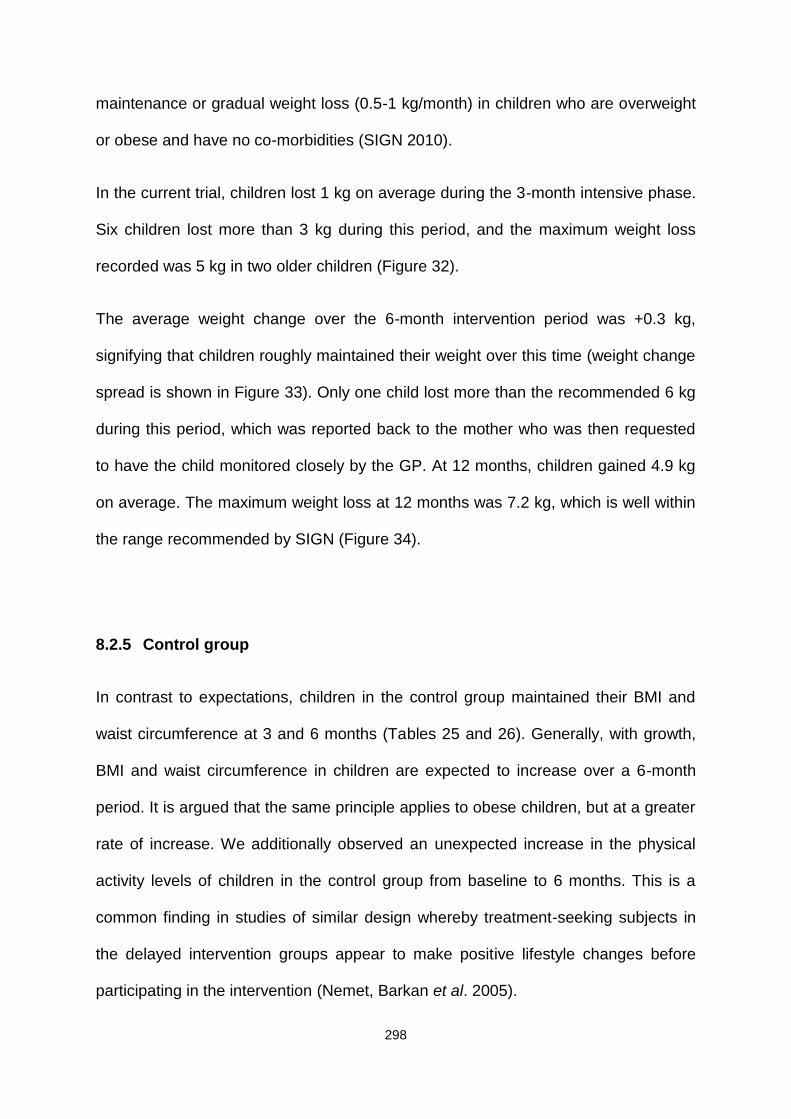
298
maintenance or gradual weight loss (0.5-1 kg/month) in children who are overweight
or obese and have no co-morbidities (SIGN 2010).
In the current trial, children lost 1 kg on average during the 3-month intensive phase.
Six children lost more than 3 kg during this period, and the maximum weight loss
recorded was 5 kg in two older children (Figure 32).
The average weight change over the 6-month intervention period was +0.3 kg,
signifying that children roughly maintained their weight over this time (weight change
spread is shown in Figure 33). Only one child lost more than the recommended 6 kg
during this period, which was reported back to the mother who was then requested
to have the child monitored closely by the GP. At 12 months, children gained 4.9 kg
on average. The maximum weight loss at 12 months was 7.2 kg, which is well within
the range recommended by SIGN (Figure 34).
8.2.5 Control group
In contrast to expectations, children in the control group maintained their BMI and
waist circumference at 3 and 6 months (Tables 25 and 26). Generally, with growth,
BMI and waist circumference in children are expected to increase over a 6-month
period. It is argued that the same principle applies to obese children, but at a greater
rate of increase. We additionally observed an unexpected increase in the physical
activity levels of children in the control group from baseline to 6 months. This is a
common finding in studies of similar design whereby treatment-seeking subjects in
the delayed intervention groups appear to make positive lifestyle changes before
participating in the intervention (Nemet, Barkan et al. 2005).
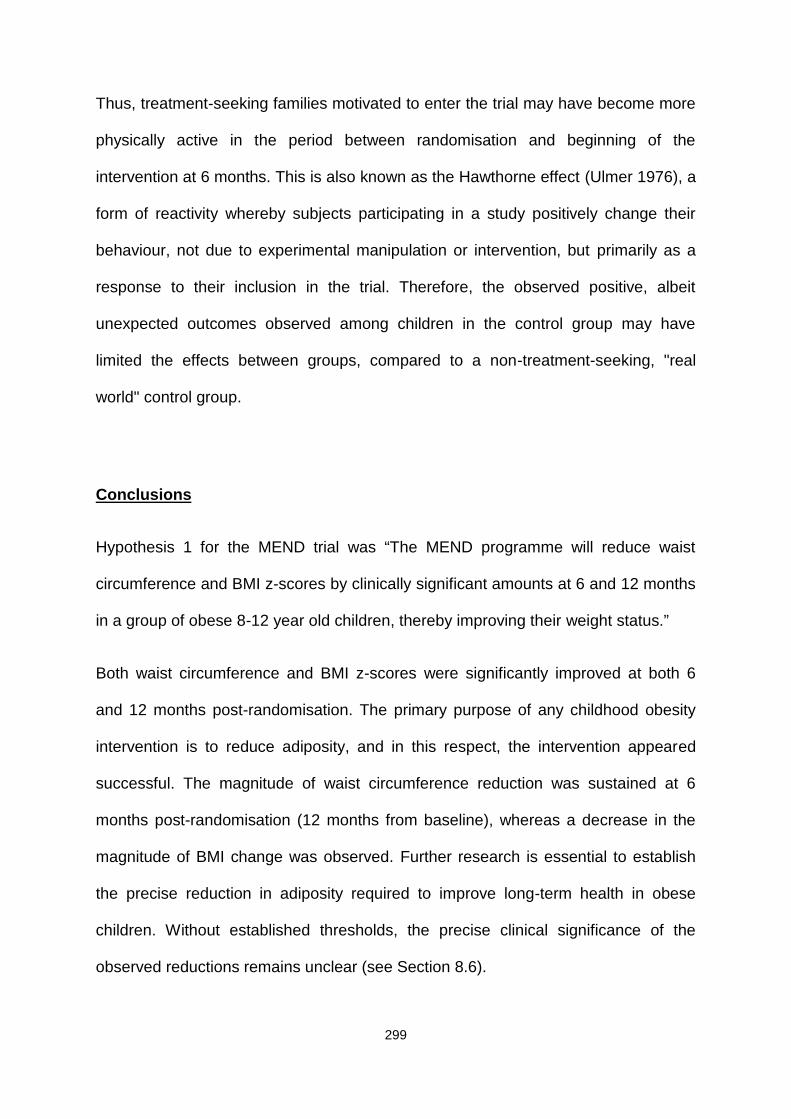
299
Thus, treatment-seeking families motivated to enter the trial may have become more
physically active in the period between randomisation and beginning of the
intervention at 6 months. This is also known as the Hawthorne effect (Ulmer 1976), a
form of reactivity whereby subjects participating in a study positively change their
behaviour, not due to experimental manipulation or intervention, but primarily as a
response to their inclusion in the trial. Therefore, the observed positive, albeit
unexpected outcomes observed among children in the control group may have
limited the effects between groups, compared to a non-treatment-seeking, "real
world" control group.
Conclusions
Hypothesis 1 for the MEND trial was “The MEND programme will reduce waist
circumference and BMI z-scores by clinically significant amounts at 6 and 12 months
in a group of obese 8-12 year old children, thereby improving their weight status.”
Both waist circumference and BMI z-scores were significantly improved at both 6
and 12 months post-randomisation. The primary purpose of any childhood obesity
intervention is to reduce adiposity, and in this respect, the intervention appeared
successful. The magnitude of waist circumference reduction was sustained at 6
months post-randomisation (12 months from baseline), whereas a decrease in the
magnitude of BMI change was observed. Further research is essential to establish
the precise reduction in adiposity required to improve long-term health in obese
children. Without established thresholds, the precise clinical significance of the
observed reductions remains unclear (see Section 8.6).
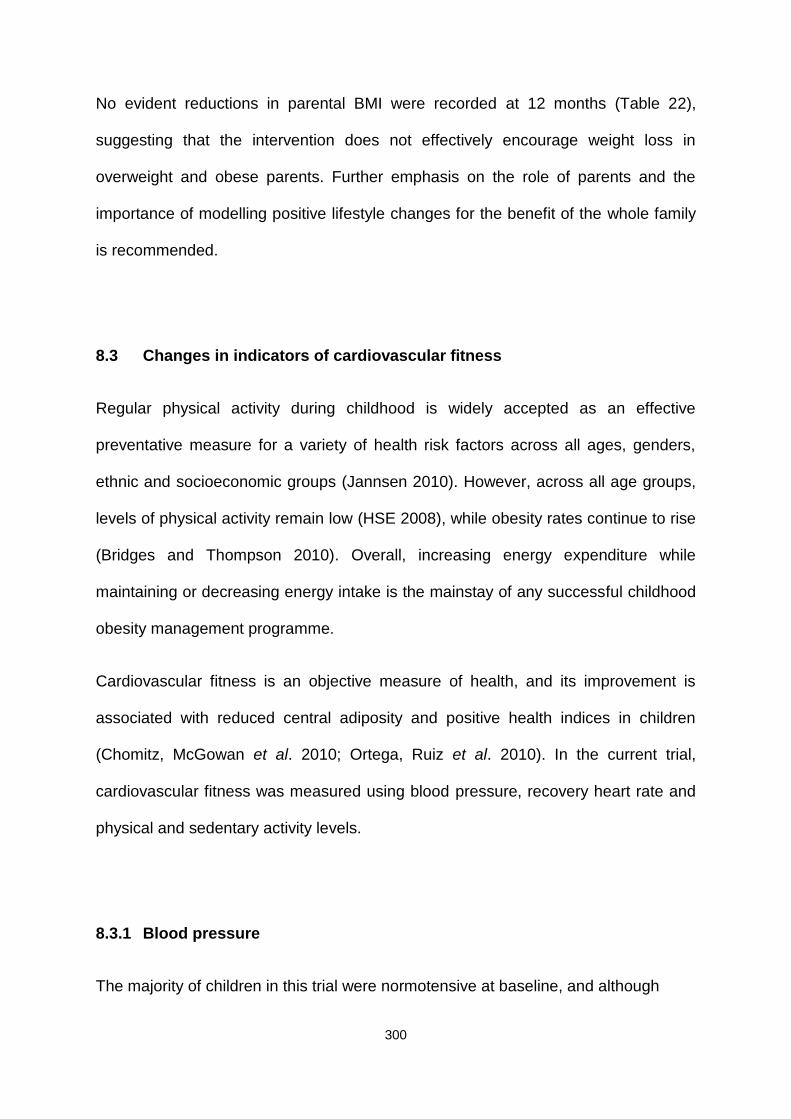
300
No evident reductions in parental BMI were recorded at 12 months (Table 22),
suggesting that the intervention does not effectively encourage weight loss in
overweight and obese parents. Further emphasis on the role of parents and the
importance of modelling positive lifestyle changes for the benefit of the whole family
is recommended.
8.3 Changes in indicators of cardiovascular fitness
Regular physical activity during childhood is widely accepted as an effective
preventative measure for a variety of health risk factors across all ages, genders,
ethnic and socioeconomic groups (Jannsen 2010). However, across all age groups,
levels of physical activity remain low (HSE 2008), while obesity rates continue to rise
(Bridges and Thompson 2010). Overall, increasing energy expenditure while
maintaining or decreasing energy intake is the mainstay of any successful childhood
obesity management programme.
Cardiovascular fitness is an objective measure of health, and its improvement is
associated with reduced central adiposity and positive health indices in children
(Chomitz, McGowan et al. 2010; Ortega, Ruiz et al. 2010). In the current trial,
cardiovascular fitness was measured using blood pressure, recovery heart rate and
physical and sedentary activity levels.
8.3.1 Blood pressure
The majority of children in this trial were normotensive at baseline, and although
301
blood pressure was reduced, no significant differences in systolic and diastolic blood
pressure were observed between groups at 6 months (Tables 16 and 18).
However, systolic blood pressure was reduced at 3, 6 and 12 months (Tables 20, 21
and 23), and the magnitude of reduction increased over the 12-month period. There
were no significant reductions in diastolic blood pressure.
One possible reason for the lack of significant differences between groups is that
systolic blood pressure was unexpectedly reduced by 4.8 and 7.4 mmHg at 3 and 6
months, respectively, in the control group (Tables 25 and 26). This improvement in
systolic blood pressure in the absence of intervention may be caused by a false
increase in the baseline value due to the anxiety of being subjected to blood
pressure measurements for the first time. Increased physical activity levels at 6
months (3.2 hours/week) may also be responsible for the improvements in
cardiovascular fitness and systolic blood pressure in the control group.
Other studies have reported conflicting results. Shalitin and co-workers (2009)
reported no changes in systolic blood pressure between groups in their sample of
obese children (Shalitin, Ashkenazi-Hoffnung et al. 2009), while other researchers
showed a reduction in systolic blood pressure in groups of obese children attending
regular physical activity sessions (Weigel, Kokocinski et al. 2008; Farpour-Lambert,
Aggoun et al. 2009).
Nonetheless, if accurate, this persistent reduction in systolic blood pressure at 3, 6
and 12 months within groups may be an important finding, given the health benefits
of blood pressure reduction, even in children within the normotensive range
(Berenson, Srinivasan et al. 1998; Kelishadi, Malekahmadi et al. 2012).
302
8.3.2 Recovery heart rate, physical and sedentary activity levels
Increased physical activity and reduced sedentary behaviours are essential
components of multicomponent childhood obesity lifestyle interventions (NICE 2006).
In the present trial, after the intervention (6 months), children appeared more
physically active, with reduced sedentary activities and improved fitness (Table 18).
Analysis of physical activity data revealed that children performed 4.0 hours more
physical activity per week at 12 months on average, compared to baseline (Table
22). However, the significant reduction in sedentary activity levels at 3 and 6 months
was not maintained at 12 months, suggesting compliance issues with the
intervention strategies to reduce screen time. This remains a target area for
improvement in future applications of the intervention.
Recovery heart rate, measured using a validated step test, is a useful and
convenient estimate of cardiovascular fitness. This parameter was significantly
improved in the intervention group at 3 and 6 months, compared to controls (Tables
17 and 19), which was sustained at 12 months (Table 22). Our findings clearly
suggest that the exercise component of the intervention improves cardiovascular
fitness. However, we observed a small reduction in the magnitude of change at 12
months, compared to that at 6 months. This finding suggests that without ongoing
support and provision of opportunities for children to exercise, the fitness benefits
are lost, at least in part.
The types of fun-based physical and lifestyle activities promoted within the MEND
programme seem more effective in helping children to maintain a healthy weight,
compared to other studies evaluating structured exercises, such as calisthenics or
aerobics (Epstein, Wing et al. 1985). Indeed, anecdotal evidence showed that
303
children particularly enjoyed the exercise element of the intervention and looked
forward to participating in the land and water-based activities at every session.
Interestingly, the control group also displayed increased physical activity levels at 6
months (Tables 25), possibly a seasonal effect, as 6-month measurements were
mostly obtained in the summer when children had increased opportunity to be active.
Another plausible explanation is that the group consisted of treatment-seeking
families motivated to enter the trial who may have become more physically active in
the period between randomisation and beginning of the intervention.
Reduction of sedentary behaviours can have long-term positive effects on
overweight (DeMattia, Lemont et al. 2007). We found that children in the intervention
group were spending almost 6 hours less in sedentary activities than controls at 6
months (Table 18).
Several studies have established the effectiveness of increasing physical activity and
improving fitness in reducing overweight in children (Steele, van Sluijs et al. 2009).
Notably, reduction of sedentary activities may additionally aid in promoting a more
active lifestyle and positive health behaviours, even though the effects on weight
itself are modest (DeMattia, Lemont et al. 2007). Central and total adiposity are
lower in overweight and obese children with high cardiovascular fitness as a result of
increased physical activity levels (Gutin, Barbeau et al. 2002; Nassis, Papantakou et
al. 2005; Stigman, Rintala et al. 2009). However, the magnitude of physical activity
required to achieve a significant change in body composition is yet to be determined
(Gutin, Barbeau et al. 2002).
Aerobic exercise has a positive effect on visceral fat in obese children in the absence
of total adiposity changes (Owens, Gutin et al. 1999; Gutin, Barbeau et al. 2002).
304
The findings that adjusted fat mass, BMI and waist circumference (an indicator of
abdominal fat) are reduced, even in the absence of total % body fat reduction,
suggest a beneficial effect of increased physical activity on levels of adiposity in this
cohort, supporting current evidence (Nassis, Papantakou et al. 2005; Stigman,
Rintala et al. 2009; Ortega, Ruiz et al. 2010).
However, due to the poor accuracy of the questionnaires used to measure physical
and sedentary activity levels, no firm conclusions can be drawn from these results.
Ideally, accelerometers (a more objective means of measuring physical and
sedentary activities) should have been used, but this was not possible due to the
lack of resources and high cost of these devices at the time of the trial.
Conclusions
Children in this trial participated in twice-weekly exercise sessions during the first 3
months and were provided with a family swimming pass to encourage continued
physical activity until 6 months. In addition, parents were equipped with behavioural
strategies to support them in reducing their children’s levels of sedentary behaviours
and encourage lifestyle activity.
Recovery heart rate was significantly improved, providing firm evidence of enhanced
cardiovascular fitness. Sedentary activity levels were reduced at 6 months, but not
maintained at 12 months, suggesting possible compliance issues with the
intervention strategies to reduce screen time. Therefore, this was identified as an
area for improvement in future applications of the intervention. Overall, in terms of
physical and sedentary activities, results were promising, but potentially inaccurate
due to methodological limitations.
305
Finally, blood pressure was not significantly reduced, which is unusual in this type of
trial. However, it is important to note that the current population was normotensive at
baseline. Overall, cardiovascular fitness was improved in children. The loss of
significance in sedentary activity levels and reduced magnitude of change in
recovery heart rates suggest that children may benefit from additional support to
maintain the improvements seen at 6 months.
8.4 Changes in self-esteem
Self-esteem is an important element in the health and behaviour of growing children.
Social adjustment, activity engagement, goal direction and self-confidence are
factors in a child’s development and functioning influenced by their self-esteem
(Bandura 1986). Low self-esteem is related to a variety of psychological difficulties
and personal problems, including substance abuse, loneliness, academic failure,
teenage pregnancy, and criminal behaviour (Leary, Haupt et al. 1998; Leary, Tate et
al. 2007). Thus, the issue of whether childhood weight management interventions
cause adverse psychological consequences needs to be addressed (O'Dea 2005).
In the current trial, hypothesis 2 aimed to evaluate whether improvements in body
composition and cardiovascular fitness lead to higher self-esteem. Our results
showed that the global self-esteem score increased during the intervention and
remained raised at 12 months (Tables 16, 18 and 22), suggesting that participation is
associated with psychological benefits, rather than harm. These findings add to a
small, but growing body of literature indicating that responsibly conducted paediatric
weight management interventions effectively improve the emotional health of obese
306
children (NICE 2006; Lowry, Sallinen et al. 2007; Shalitin, Ashkenazi-Hoffnung et al.
2009).
These positive findings support data from the systematic review conducted by
Griffiths and co-workers, who concluded that multicomponent interventions produce
significant improvements in global self-esteem (Griffiths, Parsons et al. 2010).
Results from the current trial suggest that global self-esteem is improved at least 6
months post-intervention (i.e., 12 months after randomisation).
8.5 Changes in dietary intake
Successful treatment of childhood obesity requires a sustained negative energy
balance. Modification of dietary intake is one method to achieve this goal. A meta-
analysis examining dietetic interventions for the treatment of childhood obesity found
that programmes including a dietary component were effective in achieving relative
weight loss in overweight or obese children (Collins, Warren et al. 2006).
The most common methods for assessing children's habitual dietary intake are
dietary recalls and food diaries. From ages 7-8 years onwards, children's contribution
to the process is essential. However the best estimates are obtained in cases of
cooperation between parents (home food consumption) and children (school/out of
home food consumption) (Livingstone and Robson 2000; Livingstone, Robson et al.
2004). Owing to the considerable contribution of children in their assessment of
dietary intake, retrospective methods, such as dietary recalls, may conceal memory
bias, since children do not tend to recall events as well as adults.
307
Seven-day diet records are commonly used to provide accurate estimates of habitual
energy intake. In children, a 9-10 day record is often required to ensure accuracy,
owing to increased variability in food intake (Nelson, Black et al. 1989). However, the
feasibility of maintaining such long-term food diaries for children is low, and in most
studies, shorter versions are routinely used (3-7 days) (Livingstone and Robson
2000). Examples of studies implementing this method are detailed below.
Interestingly, recent evidence supports the use of multiple pass dietary recalls for the
dietary assessment of 4-11 year old children (Burrows, Martin et al. 2010). However
until recently, food diaries were considered the method of choice for children's
populations, as recalls were found to be poor at the individual level and
recommended mostly for groups (Nelson, Black et al. 1989; Livingstone and Robson
2000; Livingstone, Robson et al. 2004).
The majority of researchers in the childhood obesity field continue to use food diaries
for dietary assessment. Most commonly, diaries are recorded for 3-4 days, including
weekdays and weekends (Johnson, Mander et al. 2008; Waling, Lind et al. 2010;
Jennings, Welch et al. 2011; Raynor, Van Walleghen et al. 2011; Banks, Williams et
al. 2012; Coppinger, Jeanes et al. 2012; Looney and Raynor 2012; Ritchie 2012) or
longer, e.g., 7-day diaries in adolescents (Hart, Jelalian et al. 2010) and UK national
studies (Gibson, Peto et al. 2006; McCaffrey, Rennie et al. 2008), while recalls are
employed in larger population studies (Keast, Nicklas et al. 2010; Diethelm, Jankovic
et al. 2012).
In view of the above evidence, a 3-day diet record was selected in preference to a
longer period in the current trial, with the aim of increasing compliance and reducing
the time spent on data analysis. Parents and children were asked to maintain a 3-
308
day (two weekdays and one weekend day) diary of all foods and drinks consumed by
the young participant.
At 3 months, children in the intervention group of the current trial had significantly
reduced energy, total sugar, total fat, saturated fat and sodium intake, and
maintained intake of protein, calcium and iron, compared to controls (Table 17).
These effects were not sustained at 6 months (Table 19). However, unexpected
significant within-group positive dietary changes were observed in the control group
from baseline to 6 months, suggesting that children in this group also made positive
changes to their diets (Table 28). As stated earlier, this finding may be explained by
the fact that the control group consisted of treatment-seeking families motivated to
enter the trial, who may have implemented dietary changes within the period
between randomisation and beginning of the intervention at 6 months.
As the majority of internationally available childhood weight management
programmes contain a dietary component, additional research would be invaluable
for determining the most effective dietary treatment. It must be acknowledged that
dietary assessment is inherently challenging, particularly in obese subjects, and
therefore, dietary analysis data should be interpreted with caution (Nelson, Black et
al. 1989; Livingstone and Robson 2000).
8.6 Assessment of clinical effectiveness
Researchers agree on the core elements of successful childhood obesity
interventions (NICE 2006; SIGN 2010), but consensus about the outcomes by which
such interventions are judged as clinically effective is low. Since childhood obesity
309
affects several body functions and systems, evaluation of effective interventions
requires markers that reflect this diverse range. In addition to anthropometry, the
most common markers are related to cardiovascular health (e.g., lipid profile, blood
pressure), metabolic functioning (e.g., insulin resistance), psychological wellbeing
(e.g., self-esteem) and behaviour (e.g., diet and physical activity).
The aim of secondary data analysis (Table 30) was to investigate whether
physiological, behavioural and psychological changes are associated with different
levels of BMI z-score change in children participating in the trial. In the current
evaluation, the benefits of the intervention on cardiovascular fitness, blood pressure,
physical and sedentary activities and self-esteem over 6 and 12 months did not differ
according to the degree of BMI z-score reduction. Notably, even children with
increased BMI z-score showed improvements in the majority of outcomes (Tables 31
and 32).
The only parameters associated with degree of BMI z-score reduction were waist
circumference and its z-score. This was an expected finding, as BMI and waist
circumference are correlated as measures of body composition (Tompkins, Moran et
al. 2011). Overall, the results suggest that regardless of the magnitude and direction
of change in BMI z-score, the intervention had beneficial effects on other important
health outcomes.
These findings are supported by previous data showing improved health and
psychosocial outcomes, even when small BMI z-score reductions are observed (Kirk,
Zeller et al. 2005; Nowicka, Pietrobelli et al. 2007; Cummings, Henes et al. 2008;
Hughes, Stewart et al. 2008; Farpour-Lambert, Aggoun et al. 2009; Pedrosa, Oliveira
et al. 2011; Kolsgaard, Joner et al. 2012). More precisely, a 3-month physical activity
310
intervention in obese pre-pubertal children has been shown to improve blood
pressure and arterial stiffness at 6 months, regardless of body weight or fat reduction
(Kolsgaard, Joner et al. 2012). Another intervention targeting obese children
revealed no significant effect on BMI z-score, compared to standard care, but
resulted in marked improvements in objectively measured physical activity and
sedentary behaviours (Hughes, Stewart et al. 2008).
A recent multidisciplinary family intervention led to improvements in lipid profile and
insulin resistance, although the average BMI z-score reduction was only -0.13
(Kolsgaard, Joner et al. 2012). In a similar study, a significant percentage of children
displayed a shift from abnormal values for lipids and glucose metabolism indicators
to normal while experiencing only a modest reduction in BMI z-score (-0.15) (Kirk,
Zeller et al. 2005). Pedrosa and colleagues (2011) showed that a one-year
intervention for overweight and obese pre-pubertal children reduced BMI z-score to a
modest extent (-0.18), but improved metabolic syndrome indicators, such as
triglycerides and HDL cholesterol (Pedrosa, Oliveira et al. 2011). Similar benefits in
lipid profile and insulin resistance indicators, such as glucose and insulin levels and
HOMA, have also been reported with only a moderate or no decrease in BMI z-score
(Cummings, Henes et al. 2008; Tompkins, Moran et al. 2011; Kolsgaard, Joner et al.
2012).
In terms of psychological health, positive effects on self-esteem of 6 - 17 year-old
obese children attending a low-intensity family therapy intervention and achieving a
mean BMI z-score change of -0.12 was reported (Nowicka, Pietrobelli et al. 2007).
The authors suggested that the beneficial effect in self-esteem is not correlated with
the degree of BMI z-score reduction. Hence, in keeping with findings from the current
trial, Nowicka et al. (2007) showed that psychological status is positively affected by
311
the intervention, regardless of the degree of BMI z-score change. Moreover, the
beneficial effects on behaviour and quality of life (improved physical activity levels,
sedentary activities and self-esteem) cannot be measured by a single indicator of
weight status.
Consistent with the available literature, our findings indicate that several important
parameters (cardiovascular fitness, physical activity level, sedentary behaviours,
blood pressure and self-esteem) improve in children participating in the current trial,
regardless of the degree of BMI z-score change. Based on these results, it is
apparent that setting a BMI z-score reduction cutoff solely to assess the
effectiveness of childhood obesity interventions could be misleading, considering the
value of other outcomes that may improve in the absence of BMI z-score change. As
yet, we are uncertain of the optimal outcomes to assess the effectiveness of
interventions (Oude Luttikhuis, Baur et al. 2009; Klesges, Williams et al. 2012), but
propose that focusing on the single outcome of BMI z-score and neglecting other
important health and psychosocial factors is premature and may undermine the
evaluation of childhood obesity interventions, leading to the inappropriate exclusion
of beneficial approaches.
8.7 Potential factors influencing outcomes
Several factors may influence outcomes following a childhood weight management
intervention, as discussed below.
312
8.7.1 Socio-demographics
Interventions may operate less well for some groups than others, which could
exacerbate existing inequalities through differential effectiveness (Lorenc, Petticrew
et al. 2012). Many childhood weight management interventions have been evaluated
in relatively small randomised control trials, which were not originally designed to
investigate whether effects vary by gender, ethnicity or socio-economic status.
In our trial, BMI z-score and waist circumference z-score were not affected by
gender, single parenthood, accommodation status (owned/rented), employment
status and age. However, ethnicity affected BMI z-score, which was reduced by 0.38
in white and 0.21 in non-white children (p = 0.01) at 6 months, indicating that the
intervention is more effective among white participants. Notably, this difference
between white and non-white children was not significant at 12 months. The reasons
underlying these differences are difficult to determine in the current trial, owing to
lack of power for more in-depth analysis. A current population-level evaluation of the
MEND UK implementation with sufficient power aims to examine the differential
effects of MEND on different groups (Section 8.9.2) (Law 2010).
8.7.2 Intensity of multicomponent interventions
The intensity of interventions, including duration and frequency of contact between
provider and participants, appears to influence the success of childhood weight
management interventions. In the meta-analysis conducted in 2010, programmes
that incorporated medium intensity (26 to 75 contact hours) or high intensity (over 75
contact hours) intervention achieved greater BMI reduction than those with lower
313
intensity (Whitlock, O'Connor et al. 2010). Collins and co-workers observed that daily
contact is associated with significantly greater weight reduction than weekly contact
at 6 months follow-up. However, daily sessions would not be practical for many
families (Collins, Warren et al. 2006). Researchers in Australia found that the rate of
contact in effective interventions ranged from 0.2 (one contact in 6 months) to 11.3
(34 contacts in 3 months) (Sargent, Pilotto et al. 2011). Interventions with a monthly
or less contact rate reported one to three significant outcomes in either
anthropometry or behaviour change, while those with higher intensity (at least one
contact every 2 weeks) led to two or more significant outcomes (Whitlock, O'Connor
et al. 2010).
Table 37 presents a summary of the hours of contact, professional time and physical
activity for samples of UK, USA and Australian childhood weight management
interventions. Contact hours for the interventions ranged from 18 to 52, with an
average of 35 hours. In terms of professional contact time with children and/or
parents, total hours ranged from 45-104, with an average of 68 hours.
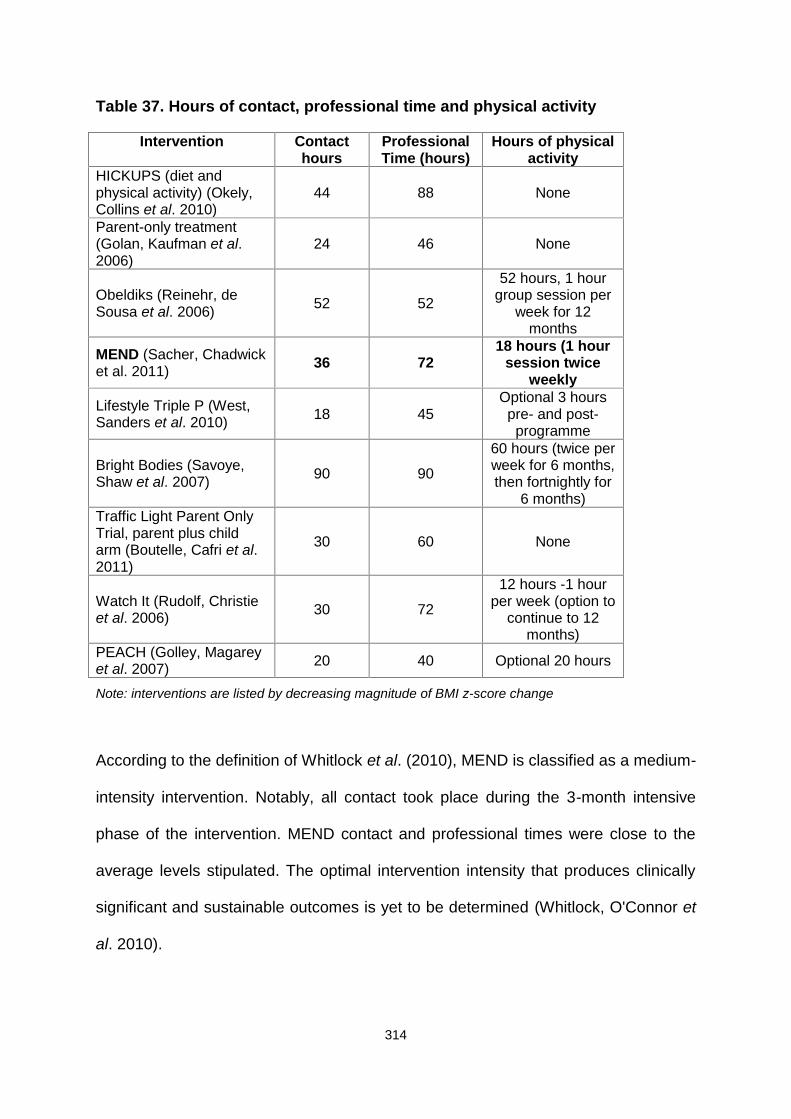
314
Table 37. Hours of contact, professional time and physical activity
Intervention Contacthours
ProfessionalTime (hours)
Hours of physicalactivity
HICKUPS (diet andphysical activity) (Okely,Collins et al. 2010)
44 88 None
Parent-only treatment(Golan, Kaufman et al.2006)
24 46 None
Obeldiks (Reinehr, deSousa et al. 2006) 52 52
52 hours, 1 hourgroup session per
week for 12months
MEND (Sacher, Chadwicket al. 2011) 36 72
18 hours (1 hoursession twice
weekly
Lifestyle Triple P (West,Sanders et al. 2010) 18 45
Optional 3 hourspre- and post-
programme
Bright Bodies (Savoye,Shaw et al. 2007) 90 90
60 hours (twice perweek for 6 months,then fortnightly for
6 months)Traffic Light Parent OnlyTrial, parent plus childarm (Boutelle, Cafri et al.2011)
30 60 None
Watch It (Rudolf, Christieet al. 2006) 30 72
12 hours -1 hourper week (option to
continue to 12months)
PEACH (Golley, Magareyet al. 2007) 20 40 Optional 20 hours
Note: interventions are listed by decreasing magnitude of BMI z-score change
According to the definition of Whitlock et al. (2010), MEND is classified as a medium-
intensity intervention. Notably, all contact took place during the 3-month intensive
phase of the intervention. MEND contact and professional times were close to the
average levels stipulated. The optimal intervention intensity that produces clinically
significant and sustainable outcomes is yet to be determined (Whitlock, O'Connor et
al. 2010).
315
8.7.3 Role of parents
Parental involvement is generally the core element of a successful childhood weight
management programme, as the main aim of interventions is adoption of healthy
lifestyle habits by the whole family. The behavioural change component needs to
involve the whole family in order to achieve successful changes, provide support,
and be sustainable and applicable to the child. Parental involvement in the treatment
of children with overweight or obesity has been shown to increase the likelihood of
improvements in anthropometry (Oude Luttikhuis, Baur et al. 2009).
In the current trial, parental BMI was measured where possible, due to the finding
that parental and child obesity are linked (Zaninotto, Wardle et al. 2006). This is not
surprising, since parents serve as role models and determine their children’s
physical and social environments (Ritchie, Welk et al. 2005). Five of the eight
behaviour modification sessions were for parents alone (Table 6). These sessions
focused on enabling parents to change their own children’s behaviours. Children
learn by modelling those around them, particularly their parents (Ritchie, Welk et al.
2005). Modelling was a key component of the intervention, whereby parents were
encouraged to modify their own dietary and physical activity behaviours, with a view
to encouraging the same in their child.
The degree of family engagement in obesity interventions appears to increase when
parents perceive improvements in children's behaviour and psychosocial wellbeing,
regardless of weight or BMI reduction. This finding has been verified in studies
showing that parents seek obesity interventions that are significantly related to
psychosocial outcomes, such as children's wellbeing, quality of life, and support for
lifestyle changes, which are not necessarily related to weight loss or metabolic
316
benefits (Stewart, Chapple et al. 2008; Stewart, Chapple et al. 2008). Moreover, the
elements perceived by parents as important increase the chances of their
involvement and commitment to the intervention, which is replicated in growing
children, leading to an increase in their autonomy and active involvement (Stewart,
Chapple et al. 2008). Indeed, according to anecdotal evidence from the current
intervention, parents regarded the MEND programme as a 'safe haven for obese
children', a factor that no research analysis could quantify or measure.
In the present trial, parental BMI was not reduced at 6 or 12 months (Tables 21 and
22), suggesting that although the intervention was directed at the whole family, this
did not translate into a significant BMI reduction in our group of largely overweight
and obese parents. It is possible that parents did attempt lifestyle change
themselves, but this was not assessed. Strategies to strengthen parental lifestyle
change within a multicomponent childhood weight management programme are
crucial for future studies, since family modelling is critical to support children's efforts
to reach a healthy weight, and as many parents are also overweight or obese, their
support would serve a dual purpose.
8.7.4 Attendance and retention
One of the main problems in childhood obesity trials is high intervention dropout
rates (NICE 2006). Several factors contribute to high dropout rates. i) Many
interventions are delivered in hospitals or other medical settings, thereby
‘medicalising’ the problem, creating an expectation for a medical and not lifestyle
solution. ii) Some childhood weight management programmes take place in schools
and during school hours, which can lead to stigmatisation of overweight and obese
317
children. iii) The location of the intervention site is an important factor, especially if
the intervention is intensive, i.e., 1-2 visits per week (locations that are not easily
accessible by families and require frequent visits lead to low attendance and high
dropout rates). iv) Finally, interventions are often delivered by researchers who do
not have the necessary group facilitation and social skills to engage with and
motivate children and parents to continue attendance.
In the MEND trial, programme attendance and retention rates were very high (86%
mean attendance and 4% dropouts, i.e., 2 children from the delayed intervention
group), despite the fact that the intensive phase of the intervention involved 2-hour
sessions twice weekly for 9 weeks.
Unfortunately, qualitative methods were not employed to establish whether and why
families found the intervention beneficial, and the motivational factors that
encouraged continuation of attendance. Future research would benefit from
exploring these issues in greater detail.
8.7.5 Inclusion of physical activity
Earlier, a systematic review examining the efficacy of exercise for treating
overweight in children and adolescents was conducted (Atlantis, Barnes et al. 2006),
with the aim of establishing the isolated effects of exercise on obesity among
children and adolescents. The authors concluded that exercise significantly reduced
percent body fat in obese boys and girls aged 12 years. The current recommended
doses of exercise/physical activity for treating overweight in children (30 to 60
minutes/day at moderate intensity most days of the week; 210 to 360 minutes/week)
318
(Daniels, Arnett et al. 2005; NICE 2006) are substantially higher than those tested in
RCTs of obese children (Atlantis, Barnes et al. 2006). The findings suggest that
significant effects on percent body fat are achievable, even with a lower dose of
prescribed exercise than that currently recommended.
Interventions vary in their provision of physical activity, which is either included in the
programme, not provided at all or optional. For interventions specifying the amounts
of physical activity, hours of activity ranged from 18 – 60 hours, with an average of
43 hours (Table 37). In the current trial, children participated in 2 hours of moderate
to vigorous physical activity per week and were encouraged to perform physical
activity outside of the intervention. Similar to the findings of an Australian review, a
reduction in fat mass (but not percent body fat) between groups was noted at 6
months, suggesting that twice-weekly exercise sessions are adequate to reduce fat
mass (Atlantis, Barnes et al. 2006). Interestingly, both fat mass and percent body fat
were reduced within groups at 6 months. In addition, the high attendance and
retention rates suggest that the exercise sessions were enjoyed by children, but this
was not confirmed, due to lack of qualitative evaluation.
The proven benefits of physical activity in prevention of weight gain, along with its
positive effects on psychology and self-esteem, support its inclusion in intervention
programmes (ADA 2006; NICE 2006; Barlow 2007; SIGN 2010).
8.7.6 Physical activity versus sedentary behaviour
Reducing sedentary behaviour can improve body composition, and both increased
physical and reduced sedentary activity are necessary to improve health outcomes
in children (Tremblay, LeBlanc et al. 2011). To date, interventions aimed at reducing
319
sedentary behaviours have generally been more successful than those promoting
physical activity (Epstein, Paluch et al. 2000; Ritchie, Welk et al. 2005; Salmon, Ball
et al. 2005). This observation highlights the importance of targeting sedentary habits,
rather than focusing solely on promotion of physical activity.
The main focus of the current study was on physical activity, due to the provision of
exercise sessions. Additional information on reducing sedentary activities, such as
television viewing time, was provided to parents. As the reduction in sedentary
activity was not maintained at 12 months, additional focus on reducing screen time
and other sedentary behaviours is recommended for future iterations of the
intervention. Reducing inactivity among children is a challenging target, as their daily
habits are closely tied with sedentary activities. Television, computer and video
games, in particular, appear to be the most popular and easily accessible pursuits
during leisure hours, which become increasingly prevalent as children grow into
adolescents.
In conclusion, there is sufficient evidence to support the routine recommendation of
increased physical and decreased sedentary activities within childhood obesity
weight management interventions. The issue of whether inclusion of actual physical
activity sessions within the intervention offers any benefit over education to increase
physical activity or reduce sedentary behaviours outside of the intervention remains
an important area for future research.
8.7.7 Types of maintenance strategies
Sustainability of positive lifestyle behaviour is the ultimate aim of childhood weight
management interventions. Considering the importance of maintaining this type of
320
lifestyle, relatively limited information is available on how to help families sustain
changes and improvements in weight status following initial treatment (Oude
Luttikhuis, Baur et al. 2009; Whitlock, O'Connor et al. 2010). To date, limited studies
have evaluated the effects of different weight maintenance strategies on long-term
outcomes. Available information suggests that multicomponent interventions
including behavioural components can result in maintenance of BMI reductions at 2
years follow-up (Oude Luttikhuis, Baur et al. 2009). Additionally, continuation of
increased physical activity levels post-intervention is suggested to promote weight
maintenance over a longer term (DH 2011).
In the absence of specific guidelines on types of effective support following a
childhood weight management intervention, no maintenance support was offered to
families attending the MEND intervention, other than a free swimming pass. This
was provided to encourage sustained family physical activity after the intensive
phase. However, the pass was minimally used (on average, 5 times in 12 weeks,
i.e., 1-2 times per month). Informal feedback from families on the reasons for poor
use revealed: i) lack of planned swimming activities following the intensive structured
programme, ii) lack of motivation, since individualised swimming was not as
enjoyable as swimming with peers, and iii) inconvenience of the leisure centre
location where free swimming was offered for the parent. Parents further expressed
a willingness to travel further for the intensive programme, but not necessarily for
free swimming.
Poor response to this part of the intervention suggests that sustained effects are
largely attributable to the intensive phase, rather than provision of free access to
swimming for 3 months. Following MEND RCT, further qualitative evaluation has
321
been undertaken to develop effective maintenance strategies for families (Section
8.9.3) (Woolcock 2010).
Conclusions
Some of the factors possibly influencing outcomes of childhood weight management
intervention have been discussed previously. Due to the complexity of generalising
interventions and associating specific factors with specific outcomes, it is not
possible to compare interventions for preferential selection.
Authoritative syntheses of evidence, both international (Oude Luttikhuis, Baur et al.
2009; Whitlock, O'Connor et al. 2010) and applied to UK settings (Kopelman, Jebb et
al. 2007 ; NICE 2006; SIGN 2010), for treatment of childhood overweight and obesity
have concluded that there is insufficient evidence to recommend one intervention
over another.
8.8 Comparison of MEND RCT with MEND feasibility trial
The MEND feasibility trial programme conducted in 2002 was acceptable to
participants, and positive health outcomes were achieved following a
multicomponent lifestyle intervention (Sacher, Chadwick et al. 2005).
The feasibility trial consisted of the MEND programme, followed by a 3-month follow-
up period during which no contact was made with the families. Feasibility and RCT
included similar intervention programmes. However, in the RCT study design, an
additional 3 months of intervention (consisting of a 3-month free family swimming
322
pass) was included. It was anticipated that sustainability of outcome would be
improved at 6 months by provision of free physical activity for the whole family.
Comparative analyses revealed the same mean BMI z-score at baseline (2.8) in both
trials. The mean age of children in the feasibility trial was lower, specifically, 9.6
years, compared to 10.2 years in RCT. Children in the feasibility trial displayed
reduced BMI by 0.9 kg/m2 at 3 months and 0.8 kg/m2 at 6 months (Table 11),
compared to 0.9 kg/m2 and 1.0 kg/m2 (Tables 16 and 18) in RCT.
Waist circumference in the feasibility trial was reduced by 2.2 and 3.4 cm, and 3.3
and 4.2 cm at 3 and 6 months in RCT, respectively. Mean attendance in the
feasibility trial was 78%, relative to 86% in RCT. Dropout rates were very low in both
studies (10% for feasibility and 4% for RCT). Due to the small sample size of the
feasibility trial, it was not possible to reach conclusions regarding additional benefits
attributable to the extended RCT intervention.
Notably, the team delivering the intervention during the feasibility trial consisted of
clinicians with a specialist background and interest in childhood obesity
management, whereas some of the healthcare professionals delivering the RCT
intervention had very limited, if any, experience in the treatment of childhood obesity.
In fact, the majority of MEND leaders (dietitians and nutritionists) had little
experience in managing childhood obesity using a lifestyle, group-based,
multicomponent approach.
Thus, while the skills and expertise of the RCT delivery team were not as highly
developed, the results obtained were comparable. This finding is significant,
suggesting that even when delivered by non-specialists, the intervention appears to
323
achieve similar results as those obtained by the specialist team who originally
developed the programme.
8.9 Further research since completion of MEND RCT
Research should be generalisable in order to be applicable to a wide variety of
settings. This research was performed with the intention that if the RCT revealed
positive, sustained outcomes, the intervention could be implemented under service-
level conditions and evaluated to determine whether it could fill the void of effective
childhood obesity treatments in the UK. There are several examples of interventions
that have produced positive outcomes in clinical trials but never been implemented
(translated) and evaluated in real-life settings. A number of factors may explain this
situation, one being insufficient planning to make the intervention generalisable prior
to the evaluation stage. It is far more difficult to make an intervention generalisable
after formalised assessment in a clinical trial and before assessment of its effects
when implemented in a real-life setting.
Further research is in progress to determine the effects of the MEND intervention
when implemented in UK community settings, internationally, and in the longer-term.
Additional research was not formally conducted as part of my PhD, but has been
included for completeness and to fully describe the entire process from development
to evaluation and implementation of the MEND complex intervention (Craig, Dieppe
et al. 2008).
324
8.9.1 Implementation: evaluation of a scaled-up intervention
Publication of trial results is essential, but only forms part of an implementation
strategy. The fourth and final stage in the MRC Framework for the development and
evaluation of complex interventions is implementation (Craig, Dieppe et al. 2008).
Another term for implementation is “scaling up”, defined as a series of processes
introducing innovations (such as weight management programmes) that are effective
under research conditions, with the aim of improving coverage and equitable access
(Mangham and Hanson 2010). There is a general lack of information about what
happens when public health interventions deemed effective under research
conditions are “scaled up” for delivery under service conditions, partly because
outcome data are often not collected and/or collated.
Following the RCT, due to significant grant funding, the MEND programme was
implemented widely across the UK. This provided a unique opportunity to determine
whether results of the clinical trials could be replicated under service-level conditions
(Sacher, Chadwick et al. 2011). The methods used were similar, but concessions
were made due to measurements not being performed by trained researchers and
lack of budget availability for expensive equipment and tests, such as electronic
sphygmomanometers and deuterium dilution. Outcome measures for the RCT and
UK implementation are compared in Table 38. In addition, the age range was
widened to include 7- and 13-year olds as well as overweight children (91st ≤ BMI <
98th centiles).
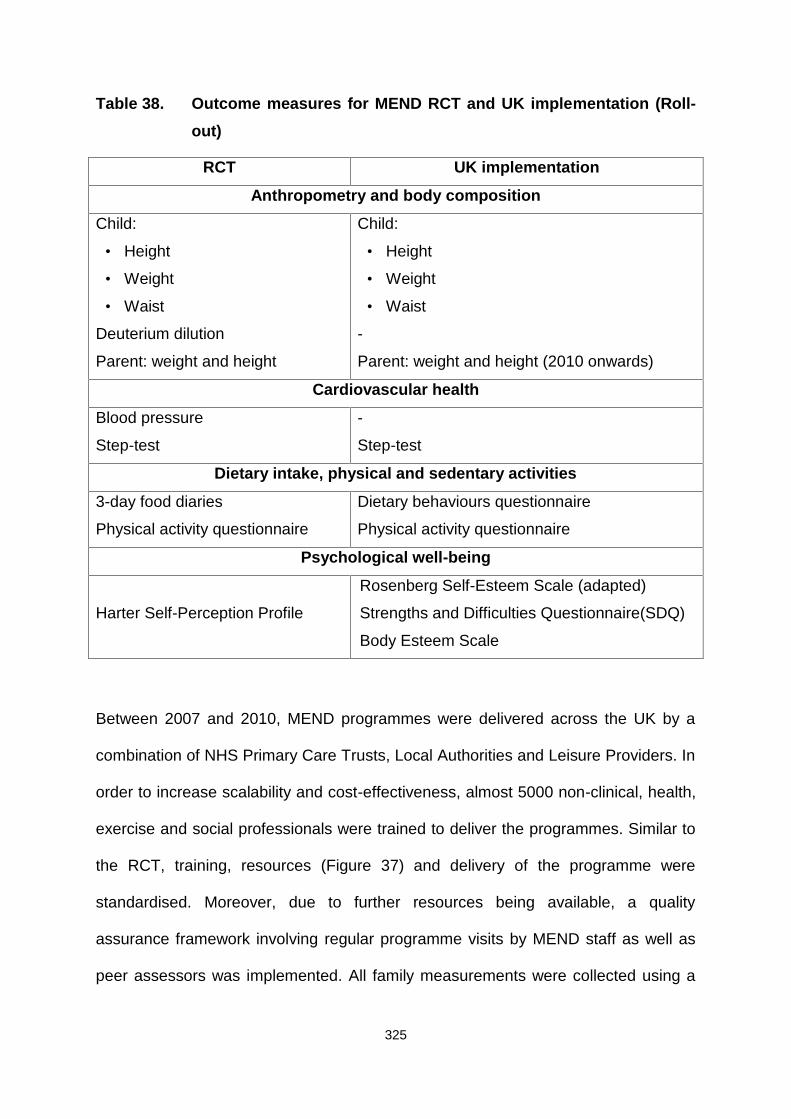
325
Table 38. Outcome measures for MEND RCT and UK implementation (Roll-out)
RCT UK implementation
Anthropometry and body composition
Child:
• Height
• Weight
• Waist
Deuterium dilution
Parent: weight and height
Child:
• Height
• Weight
• Waist
-
Parent: weight and height (2010 onwards)
Cardiovascular health
Blood pressure
Step-test
-
Step-test
Dietary intake, physical and sedentary activities
3-day food diaries
Physical activity questionnaire
Dietary behaviours questionnaire
Physical activity questionnaire
Psychological well-being
Harter Self-Perception Profile
Rosenberg Self-Esteem Scale (adapted)
Strengths and Difficulties Questionnaire(SDQ)
Body Esteem Scale
Between 2007 and 2010, MEND programmes were delivered across the UK by a
combination of NHS Primary Care Trusts, Local Authorities and Leisure Providers. In
order to increase scalability and cost-effectiveness, almost 5000 non-clinical, health,
exercise and social professionals were trained to deliver the programmes. Similar to
the RCT, training, resources (Figure 37) and delivery of the programme were
standardised. Moreover, due to further resources being available, a quality
assurance framework involving regular programme visits by MEND staff as well as
peer assessors was implemented. All family measurements were collected using a
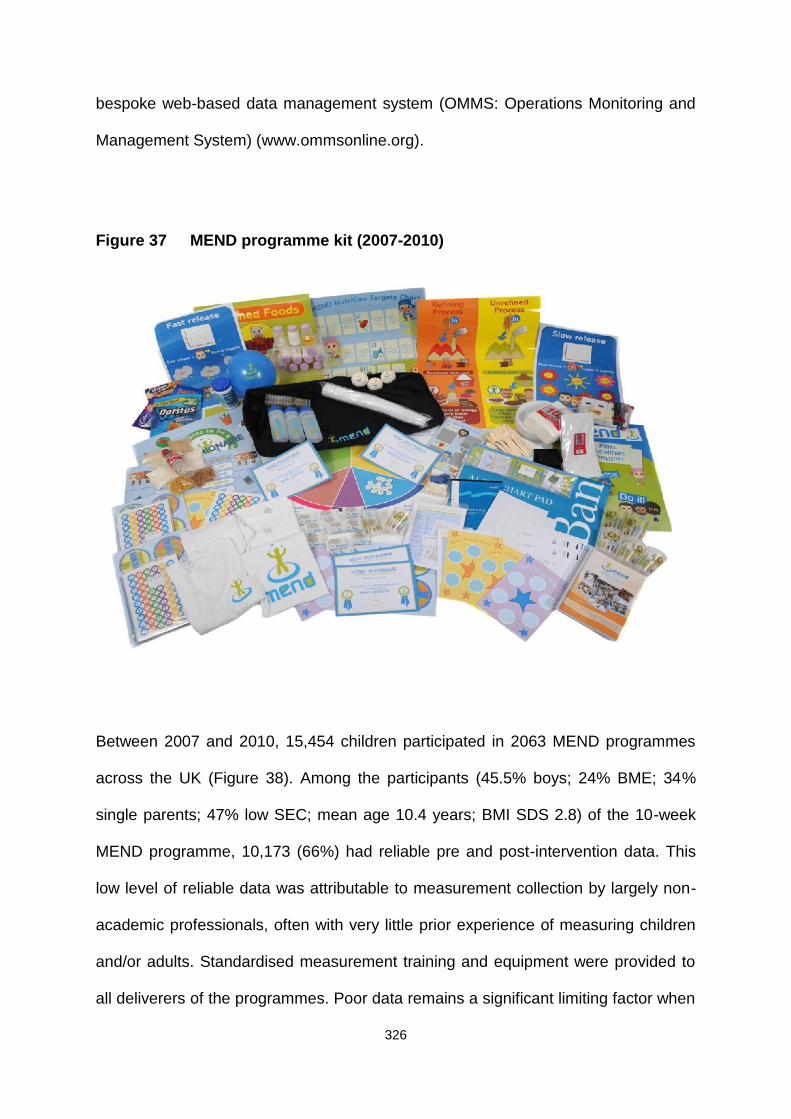
326
bespoke web-based data management system (OMMS: Operations Monitoring and
Management System) (www.ommsonline.org).
Figure 37 MEND programme kit (2007-2010)
Between 2007 and 2010, 15,454 children participated in 2063 MEND programmes
across the UK (Figure 38). Among the participants (45.5% boys; 24% BME; 34%
single parents; 47% low SEC; mean age 10.4 years; BMI SDS 2.8) of the 10-week
MEND programme, 10,173 (66%) had reliable pre and post-intervention data. This
low level of reliable data was attributable to measurement collection by largely non-
academic professionals, often with very little prior experience of measuring children
and/or adults. Standardised measurement training and equipment were provided to
all deliverers of the programmes. Poor data remains a significant limiting factor when
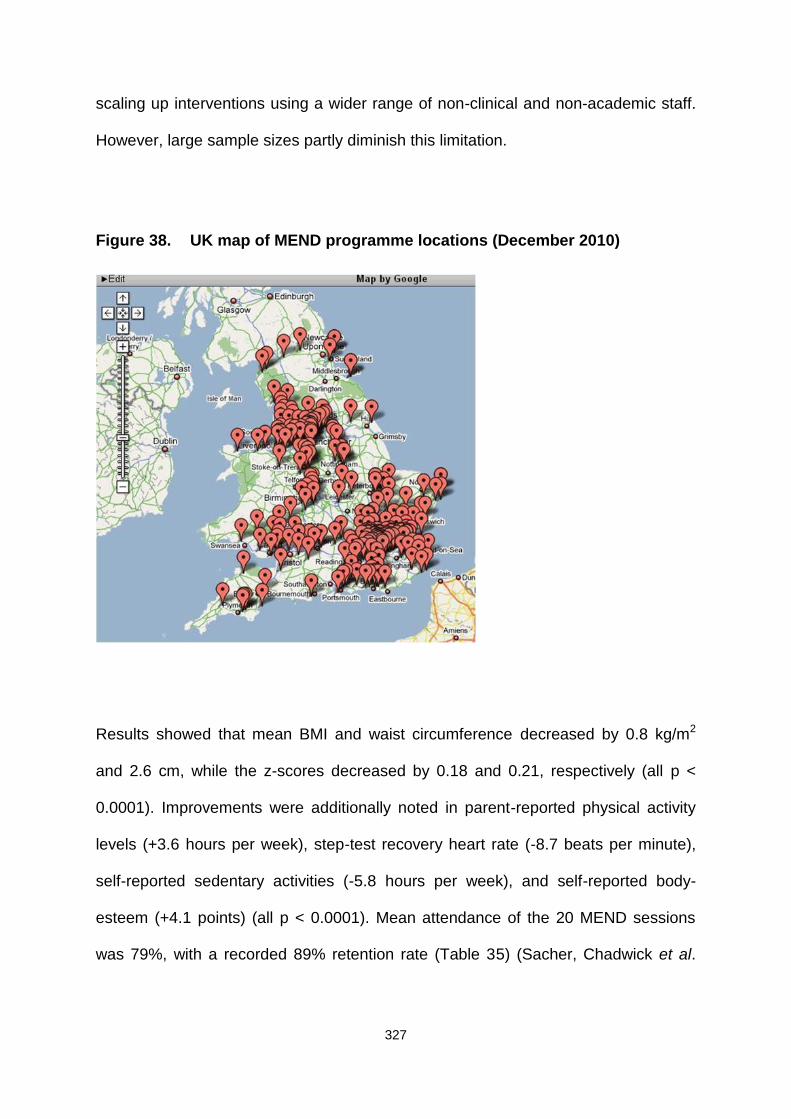
327
scaling up interventions using a wider range of non-clinical and non-academic staff.
However, large sample sizes partly diminish this limitation.
Figure 38. UK map of MEND programme locations (December 2010)
Results showed that mean BMI and waist circumference decreased by 0.8 kg/m2
and 2.6 cm, while the z-scores decreased by 0.18 and 0.21, respectively (all p <
0.0001). Improvements were additionally noted in parent-reported physical activity
levels (+3.6 hours per week), step-test recovery heart rate (-8.7 beats per minute),
self-reported sedentary activities (-5.8 hours per week), and self-reported body-
esteem (+4.1 points) (all p < 0.0001). Mean attendance of the 20 MEND sessions
was 79%, with a recorded 89% retention rate (Table 35) (Sacher, Chadwick et al.
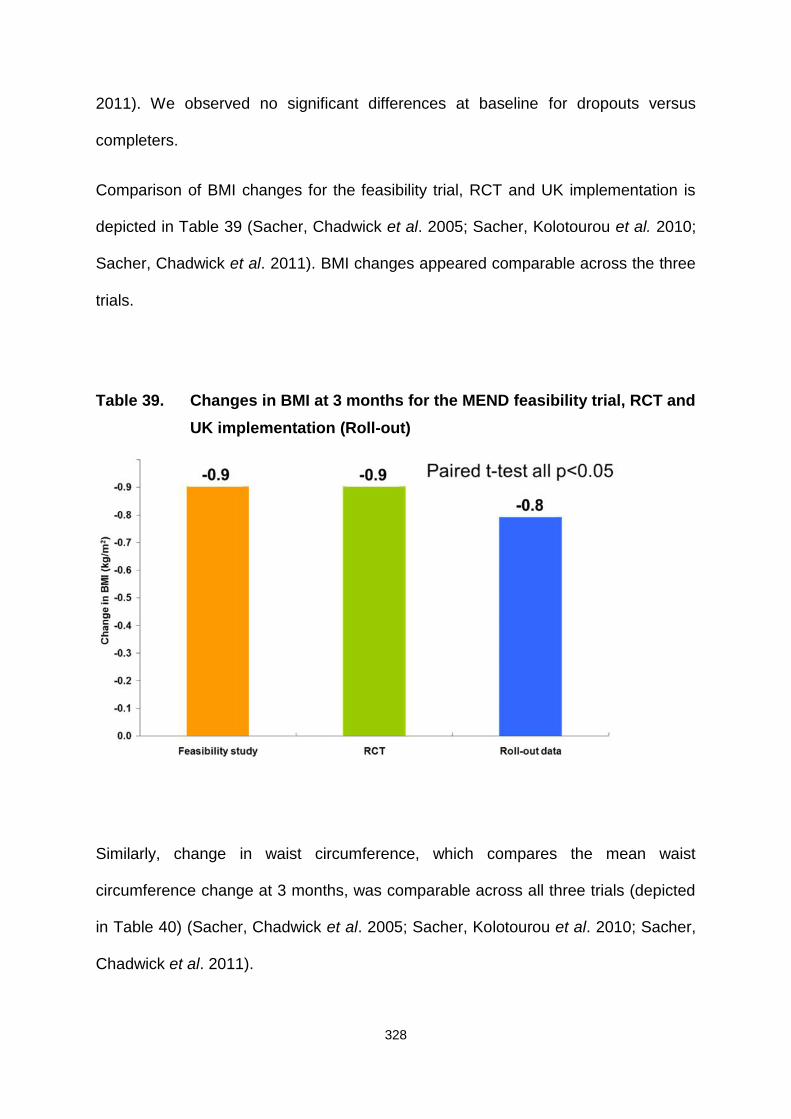
328
2011). We observed no significant differences at baseline for dropouts versus
completers.
Comparison of BMI changes for the feasibility trial, RCT and UK implementation is
depicted in Table 39 (Sacher, Chadwick et al. 2005; Sacher, Kolotourou et al. 2010;
Sacher, Chadwick et al. 2011). BMI changes appeared comparable across the three
trials.
Table 39. Changes in BMI at 3 months for the MEND feasibility trial, RCT andUK implementation (Roll-out)
Similarly, change in waist circumference, which compares the mean waist
circumference change at 3 months, was comparable across all three trials (depicted
in Table 40) (Sacher, Chadwick et al. 2005; Sacher, Kolotourou et al. 2010; Sacher,
Chadwick et al. 2011).
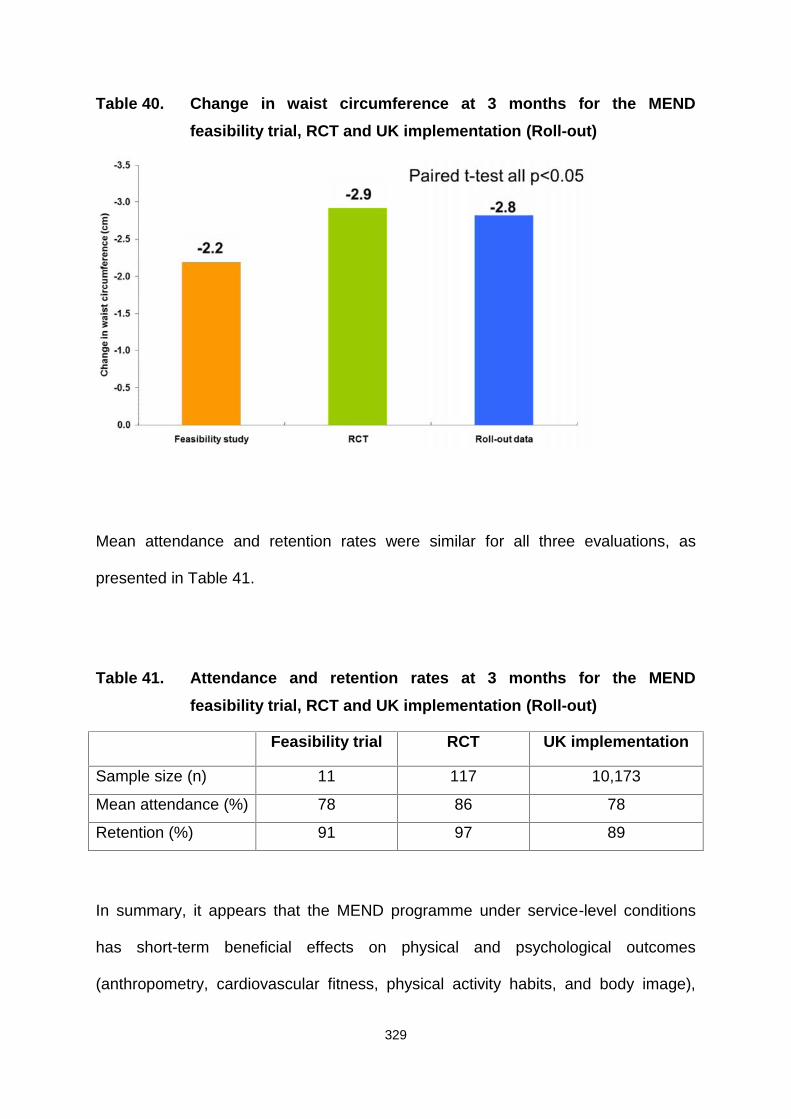
329
Table 40. Change in waist circumference at 3 months for the MENDfeasibility trial, RCT and UK implementation (Roll-out)
Mean attendance and retention rates were similar for all three evaluations, as
presented in Table 41.
Table 41. Attendance and retention rates at 3 months for the MENDfeasibility trial, RCT and UK implementation (Roll-out)
Feasibility trial RCT UK implementation
Sample size (n) 11 117 10,173
Mean attendance (%) 78 86 78
Retention (%) 91 97 89
In summary, it appears that the MEND programme under service-level conditions
has short-term beneficial effects on physical and psychological outcomes
(anthropometry, cardiovascular fitness, physical activity habits, and body image),
330
suggesting that the intervention is replicable and scalable in UK community settings.
However, these early findings need to be examined in greater detail before positive
conclusions can be reached.
8.9.2 Independent evaluation
In December 2010, an independent population-level evaluation was initiated to
assess the contribution of MEND in tackling childhood obesity, effectiveness in
different contexts, the specific individuals affected, and the reasons underlying these
effects (Law 2010). This evaluation aims to clarify the following specific research
questions:
1. What are the characteristics of children participating in MEND when implemented
at scale and under service conditions?
2. How do the outcomes associated with MEND vary, based on characteristics of
children (sex, socio-economic circumstances and ethnicity), MEND centres (type
of facility, funding source and programme group size) and areas of residence (in
relation to area-level deprivation and the obesogenic environment)?
3. What is the cost of providing MEND per participant to the NHS and personal
social services, how does this vary, and how is it related to variations in
outcome?
4. What is the salience and acceptability of MEND for individuals who commission
it, participate in full, participate but drop out, and those who may benefit but do
not take up the intervention?
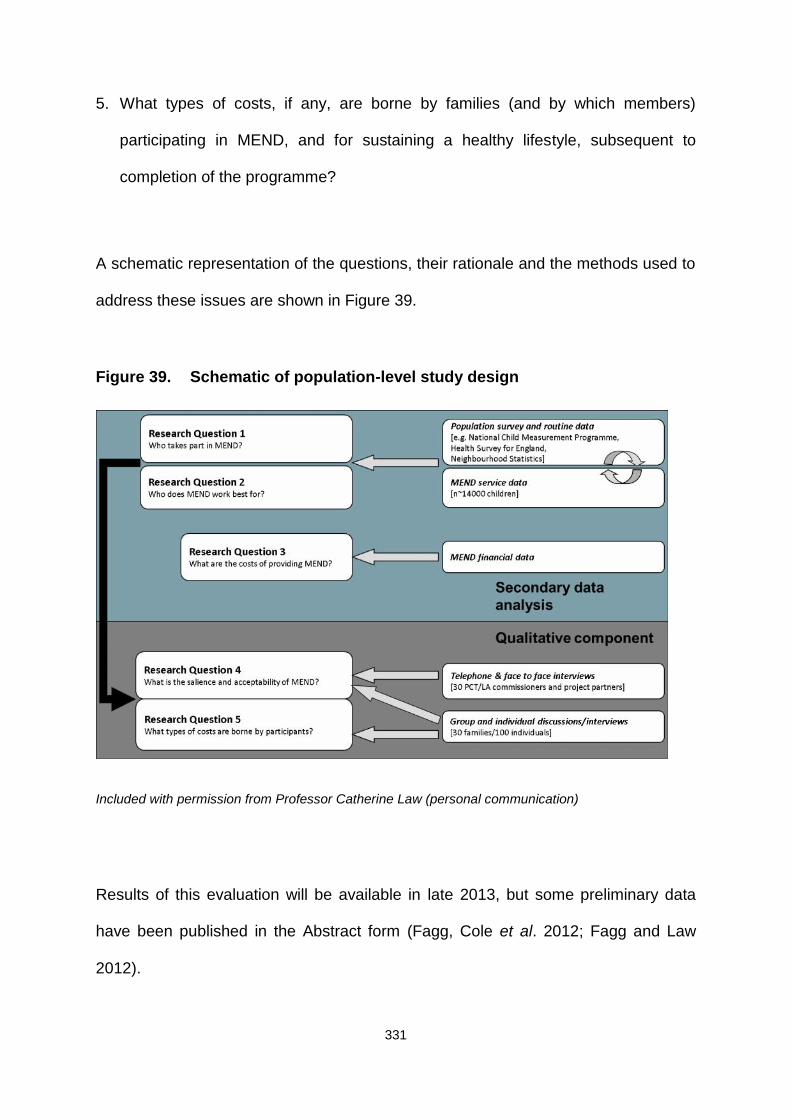
331
5. What types of costs, if any, are borne by families (and by which members)
participating in MEND, and for sustaining a healthy lifestyle, subsequent to
completion of the programme?
A schematic representation of the questions, their rationale and the methods used to
address these issues are shown in Figure 39.
Figure 39. Schematic of population-level study design
Included with permission from Professor Catherine Law (personal communication)
Results of this evaluation will be available in late 2013, but some preliminary data
have been published in the Abstract form (Fagg, Cole et al. 2012; Fagg and Law
2012).
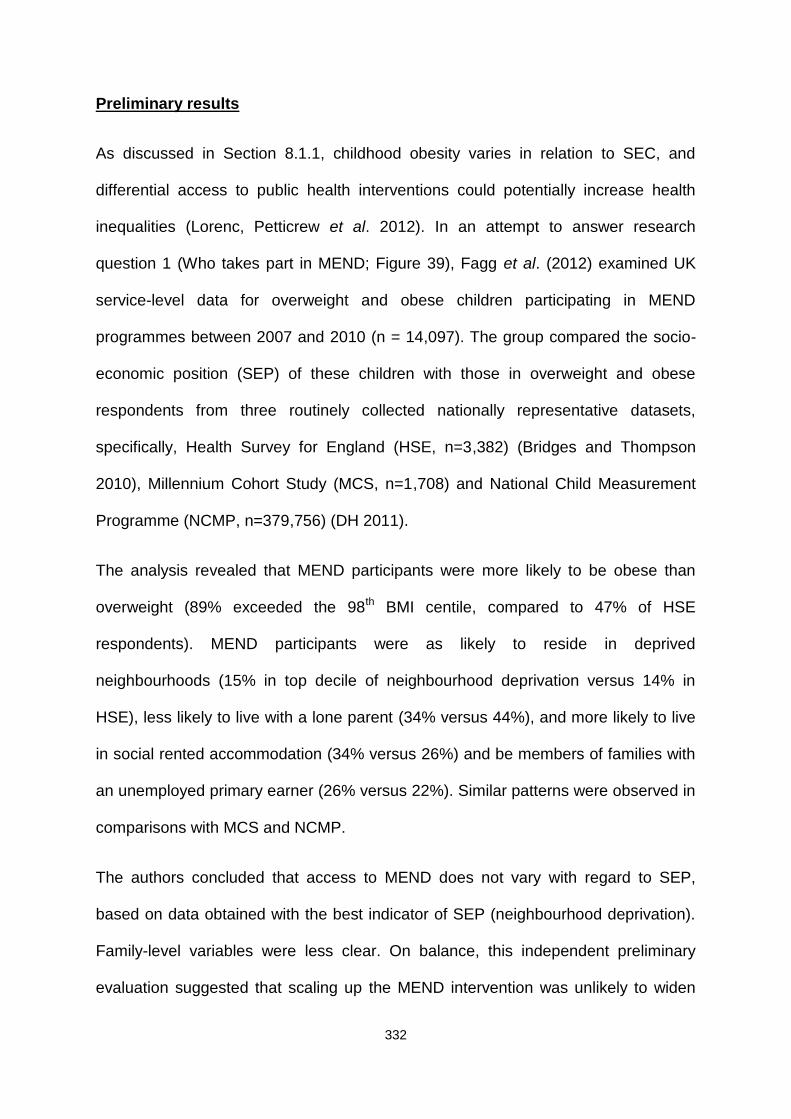
332
Preliminary results
As discussed in Section 8.1.1, childhood obesity varies in relation to SEC, and
differential access to public health interventions could potentially increase health
inequalities (Lorenc, Petticrew et al. 2012). In an attempt to answer research
question 1 (Who takes part in MEND; Figure 39), Fagg et al. (2012) examined UK
service-level data for overweight and obese children participating in MEND
programmes between 2007 and 2010 (n = 14,097). The group compared the socio-
economic position (SEP) of these children with those in overweight and obese
respondents from three routinely collected nationally representative datasets,
specifically, Health Survey for England (HSE, n=3,382) (Bridges and Thompson
2010), Millennium Cohort Study (MCS, n=1,708) and National Child Measurement
Programme (NCMP, n=379,756) (DH 2011).
The analysis revealed that MEND participants were more likely to be obese than
overweight (89% exceeded the 98th BMI centile, compared to 47% of HSE
respondents). MEND participants were as likely to reside in deprived
neighbourhoods (15% in top decile of neighbourhood deprivation versus 14% in
HSE), less likely to live with a lone parent (34% versus 44%), and more likely to live
in social rented accommodation (34% versus 26%) and be members of families with
an unemployed primary earner (26% versus 22%). Similar patterns were observed in
comparisons with MCS and NCMP.
The authors concluded that access to MEND does not vary with regard to SEP,
based on data obtained with the best indicator of SEP (neighbourhood deprivation).
Family-level variables were less clear. On balance, this independent preliminary
evaluation suggested that scaling up the MEND intervention was unlikely to widen
333
socio-economic inequalities in childhood overweight and obesity, due to differential
access. SEP and related social inequalities will be further explored in the qualitative
element of the population-level evaluation (Fagg and Law 2012).
Question 2 (Who does MEND work for; Figure 39) examined whether results from
the MEND RCT can be generalised to service delivery settings and how the
intervention impacts health inequalities. Published preliminary data (Fagg, Cole et al.
2012) showed that BMI is reduced by similar amounts in the RCT and service
delivery (RCT BMI change = –0.91 [95% CI: –1.13 to –0.68]), service BMI change =
–0.75 [–0.78 to –0.73]. Service BMI reductions were clinically significant in all the
socio-demographic groups analysed. However, in multilevel models, pre-BMI, age,
ethnicity, unemployment status and programme attendance were independently
associated with BMI change. For example, compared with white children, reductions
in BMI were statistically significantly smaller for black and ethnic minority group
children (Asian b=0.29, p <0.001, Black b=0.20, p <0.001) (positive coefficients
indicate smaller BMI reduction). Similarly, BMI fell to a lower extent in children whose
parents were unemployed (b=0.14, p <0.001, baseline employed parent). No
significant differences were observed in relation to sex or neighbourhood factors.
These results suggest that clinically significant BMI changes, similar to those
achieved under research conditions, may be replicable in service delivery settings for
children of all socio-demographic groups analysed. However, at the population level,
scaled-up programmes may have better effects on specific groups (Fagg, Cole et al.
2012).
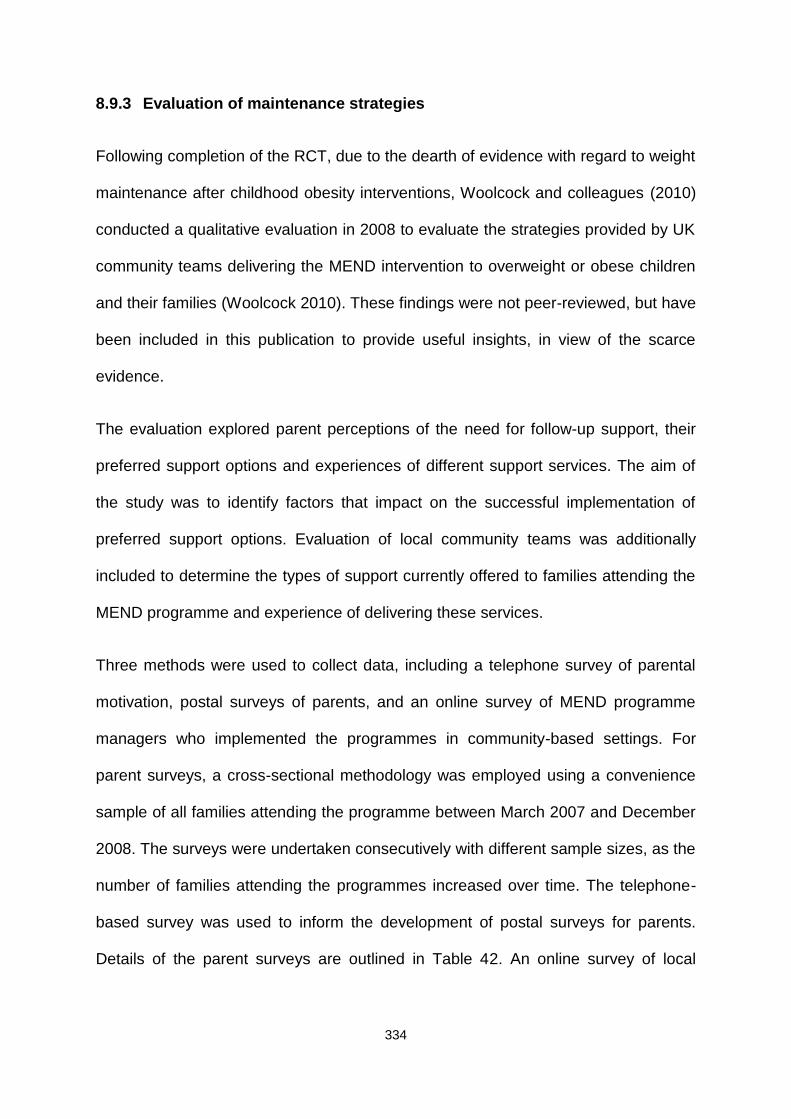
334
8.9.3 Evaluation of maintenance strategies
Following completion of the RCT, due to the dearth of evidence with regard to weight
maintenance after childhood obesity interventions, Woolcock and colleagues (2010)
conducted a qualitative evaluation in 2008 to evaluate the strategies provided by UK
community teams delivering the MEND intervention to overweight or obese children
and their families (Woolcock 2010). These findings were not peer-reviewed, but have
been included in this publication to provide useful insights, in view of the scarce
evidence.
The evaluation explored parent perceptions of the need for follow-up support, their
preferred support options and experiences of different support services. The aim of
the study was to identify factors that impact on the successful implementation of
preferred support options. Evaluation of local community teams was additionally
included to determine the types of support currently offered to families attending the
MEND programme and experience of delivering these services.
Three methods were used to collect data, including a telephone survey of parental
motivation, postal surveys of parents, and an online survey of MEND programme
managers who implemented the programmes in community-based settings. For
parent surveys, a cross-sectional methodology was employed using a convenience
sample of all families attending the programme between March 2007 and December
2008. The surveys were undertaken consecutively with different sample sizes, as the
number of families attending the programmes increased over time. The telephone-
based survey was used to inform the development of postal surveys for parents.
Details of the parent surveys are outlined in Table 42. An online survey of local

335
delivery teams was conducted between June and August 2008. The survey was sent
to all 146 Programme Managers involved in MEND programme delivery at the time.
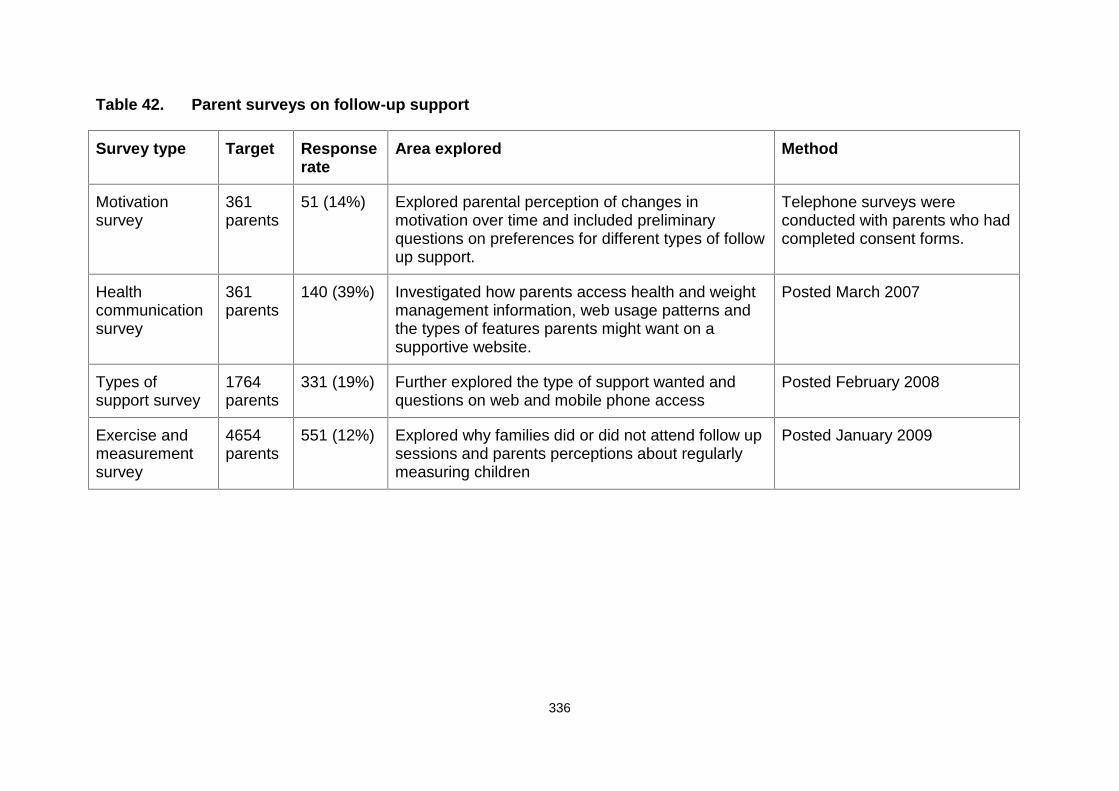
336
Table 42. Parent surveys on follow-up support
Survey type Target Responserate
Area explored Method
Motivationsurvey
361parents
51 (14%) Explored parental perception of changes inmotivation over time and included preliminaryquestions on preferences for different types of followup support.
Telephone surveys wereconducted with parents who hadcompleted consent forms.
Healthcommunicationsurvey
361parents
140 (39%) Investigated how parents access health and weightmanagement information, web usage patterns andthe types of features parents might want on asupportive website.
Posted March 2007
Types ofsupport survey
1764parents
331 (19%) Further explored the type of support wanted andquestions on web and mobile phone access
Posted February 2008
Exercise andmeasurementsurvey
4654parents
551 (12%) Explored why families did or did not attend follow upsessions and parents perceptions about regularlymeasuring children
Posted January 2009
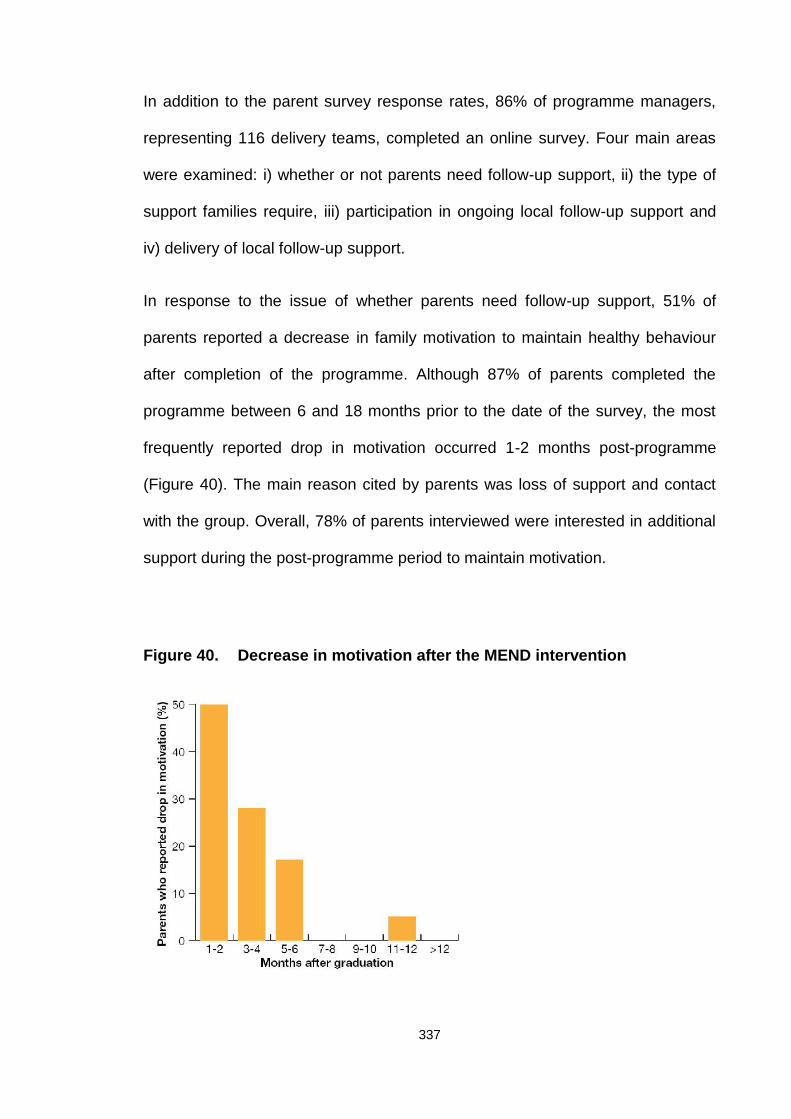
337
In addition to the parent survey response rates, 86% of programme managers,
representing 116 delivery teams, completed an online survey. Four main areas
were examined: i) whether or not parents need follow-up support, ii) the type of
support families require, iii) participation in ongoing local follow-up support and
iv) delivery of local follow-up support.
In response to the issue of whether parents need follow-up support, 51% of
parents reported a decrease in family motivation to maintain healthy behaviour
after completion of the programme. Although 87% of parents completed the
programme between 6 and 18 months prior to the date of the survey, the most
frequently reported drop in motivation occurred 1-2 months post-programme
(Figure 40). The main reason cited by parents was loss of support and contact
with the group. Overall, 78% of parents interviewed were interested in additional
support during the post-programme period to maintain motivation.
Figure 40. Decrease in motivation after the MEND intervention
338
In terms of the types of support required by families, parents expressed high
interest in receiving a broad range of options (Figure 41). Among these, parents
were most likely to use a website, refresher course, exercise sessions,
magazines and interactive challenges. Most families had or planned to have
internet access at home (95%), and a high rate of mobile access (96%) was
recorded. The features most likely to be used on a website were healthy recipes
(81%), tracking healthy measurements, such as height and weight (74%), an
online reference guide for healthy food products (70%), and simple games to
refresh programme concepts (68%).
Figure 41. Types of follow-up support of interest to parents
Note: parents could select multiple types of support
The third area examined was participation in the exercise sessions provided.
Overall, 60% of families attended the exercise sessions offered. In cases where
families had not been offered sessions, 97% of parents expressed an interest in
339
attending exercise sessions if they became available. For families that were
offered exercise sessions, the main reasons underlying attendance are outlined
in Figure 42. The key reasons for not attending sessions included participation in
other non-MEND exercise sessions (52%) or inconvenience of travel to the
sessions (36%). Over 80% of parents claimed they would attend regular follow-
up measurement sessions by MEND leaders, if offered.
Figure 42. Parental reasons for attending MEND post-programmeexercise sessions
The final area to be evaluated was actual delivery of local follow-up support by
programme providers. Local follow-up support was provided to families by 92%
of programme managers. Most programmes provided multiple activities for
families after the intervention period (Figure 43). Lack of staff availability (79%),
funding (71%), poor family participation in follow-up activities (57%) and issues
with access to venues (55%) were the most commonly cited barriers to providing
340
post-programme support. Lack of participation was cited as the main reason for
support services being withdrawn and the main barrier to providing follow-up
measurements. Higher rates of family participation were reported by programme
managers who used a planned, rather than ad hoc approach to providing follow-
up support and those consulting with families during the development process.
Figure 43. Follow-up support by local programme providers
In summary, the majority of parents required post-programme support.
Magazines, refresher courses, a website and exercise sessions were the most
popular choices. The significant interest expressed in a wide range of support
options suggests that a suite of follow-up services may be the best way to meet
the varying needs of families after the programme. However, it should not be
assumed that high interest will definitely translate into high levels of resource or
service usage.
341
Discrepancies were evident between parental expression of interest in attending
support services and actual attendance when services were offered. Provision of
local opportunities for ongoing contact of families with providers of childhood
weight management programmes or families, particularly in the months directly
after the intensive phase of the programme, may be an effective way to address
the reported loss of motivation. While parental views and needs are important in
selecting post-programme strategies, potential issues with staffing, funding and
partnerships should also be taken into account.
Based on these findings, a revised post-programme support structure for the
MEND programme was proposed in 2010, whereby families were offered a
combination of centralised and local services to meet their needs. This suite of
services included a website, quarterly magazines, and interactive challenges
provided by MEND, combined with the local provision of weekly exercise
sessions, follow-up measurements and locally developed strategies to promote
ongoing contact with families. Further feasibility testing and piloting of
components of this strategy are currently underway. These findings may facilitate
our understanding of how to support long-term behaviour maintenance in
children following initial treatment of childhood obesity.
8.9.4 Evaluation of long-term follow-up
Surveillance, monitoring and long-term outcomes are crucial to determine the
effectiveness of the intervention outside of an experimental study (Craig, Dieppe
et al. 2008). Long-term follow up is particularly important for a childhood obesity
intervention to determine the sustainability of outcomes. Further research is in
342
progress to evaluate the longer-term effects of the MEND intervention (Table
43).
8.10 Research in progress
In addition to UK, MEND has been adapted and implemented in Australia, USA
and Canada. Currently, major research trials are underway in the four countries
to evaluate different aspects of MEND (efficacy, population level effectiveness,
scale-up and spread, and long-term outcomes) (Table 43). These studies are
expected to contribute to a deeper understanding of the effects of the
intervention and provide additional valuable evidence on managing childhood
obesity.
Table 43. Current independent clinical trials to evaluate the MENDintervention
Study titleLead
organisationFunder
A population-level evaluation of a family-based
community intervention for childhood overweight
and obesity (MEND) (Chief Investigator:
Catherine Law) (Law 2010)
University
College
London, UK
National Institute
of Health
Research (UK)
Scale-up and spread of MEND programs in
Canada (Principal investigator: Diane Finegood)
Simon Fraser
University,
Canada
Canadian
Institute of Health
Research
US Childhood Obesity Research Demonstration
Project (CORD). A RCT evaluation of MEND for
children in underserved communities in Texas
Baylor
College of
Medicine and
USA Centers for
Disease Control
and Prevention

343
(Principal investigators: Nancy Butte and
Deanna Hoelscher)
University of
Texas, USA
(CDC)
Healthy eating and obesity prevention for
preschoolers: a randomised controlled trial of
the MEND programme for 2 to 4 year olds
(Principal Investigator: Helen Skouteris)
(Skouteris, McCabe et al. 2010)
Deakin
University,
Australia
Australian
Research Council
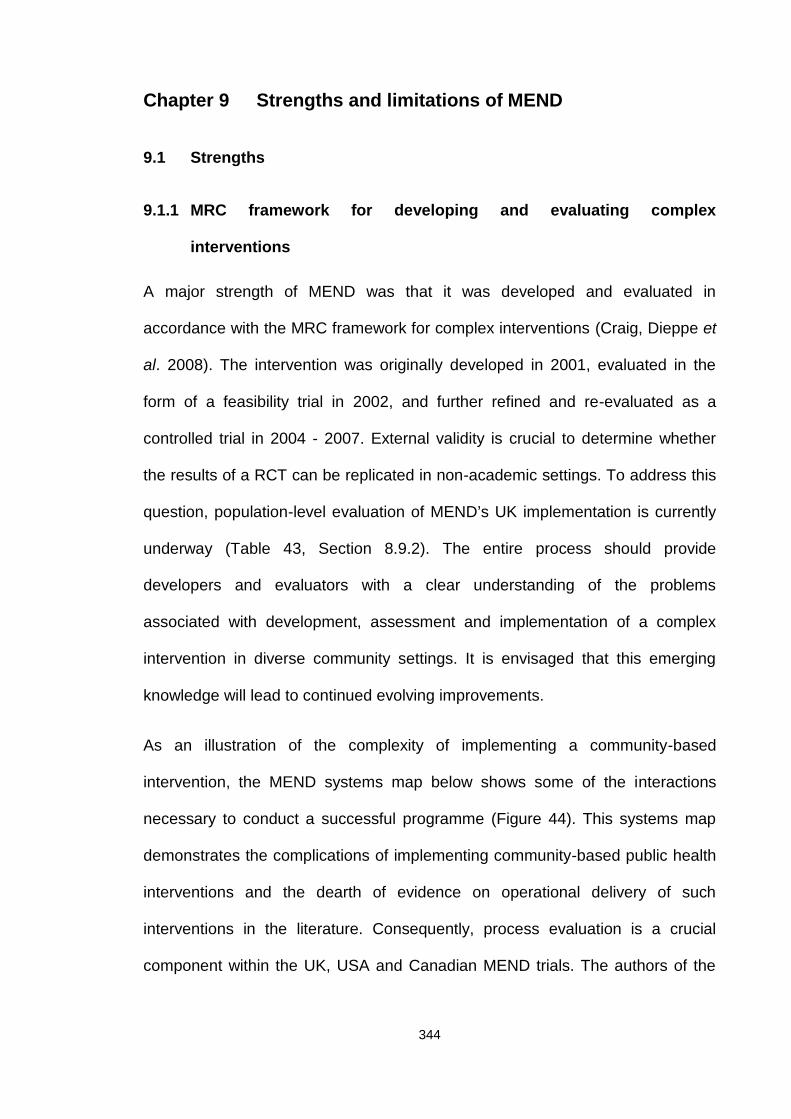
344
Chapter 9 Strengths and limitations of MEND
9.1 Strengths
9.1.1 MRC framework for developing and evaluating complex
interventions
A major strength of MEND was that it was developed and evaluated in
accordance with the MRC framework for complex interventions (Craig, Dieppe et
al. 2008). The intervention was originally developed in 2001, evaluated in the
form of a feasibility trial in 2002, and further refined and re-evaluated as a
controlled trial in 2004 - 2007. External validity is crucial to determine whether
the results of a RCT can be replicated in non-academic settings. To address this
question, population-level evaluation of MEND’s UK implementation is currently
underway (Table 43, Section 8.9.2). The entire process should provide
developers and evaluators with a clear understanding of the problems
associated with development, assessment and implementation of a complex
intervention in diverse community settings. It is envisaged that this emerging
knowledge will lead to continued evolving improvements.
As an illustration of the complexity of implementing a community-based
intervention, the MEND systems map below shows some of the interactions
necessary to conduct a successful programme (Figure 44). This systems map
demonstrates the complications of implementing community-based public health
interventions and the dearth of evidence on operational delivery of such
interventions in the literature. Consequently, process evaluation is a crucial
component within the UK, USA and Canadian MEND trials. The authors of the
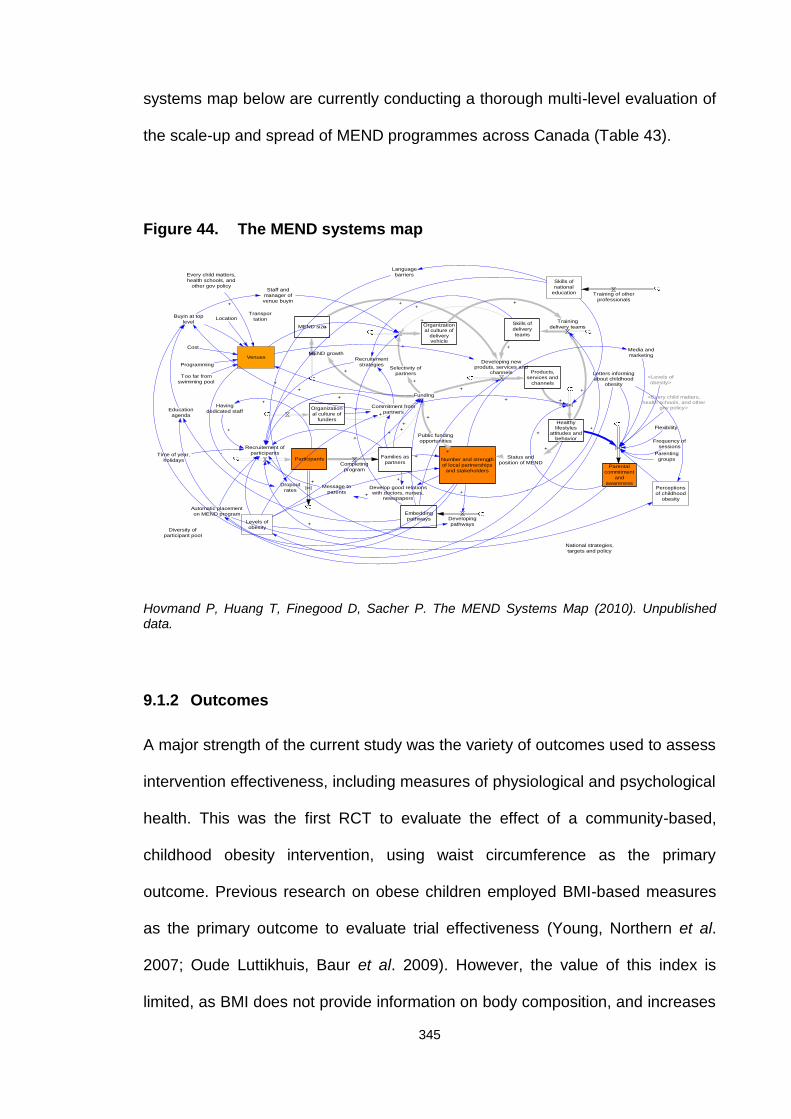
345
systems map below are currently conducting a thorough multi-level evaluation of
the scale-up and spread of MEND programmes across Canada (Table 43).
Figure 44. The MEND systems map
+
+
MEND size
Products,services and
channels
Healthylifestyles
attitudes andbehavior
Organizational culture of
deliveryvehicle
Organizational culture of
funders
Selectivity ofpartners
+
Skills ofdeliveryteams
+
Participants
Recruitement ofparticipants
Public fundingopportunities
Number and strengthof local partnerships
and stakeholders
Status andposition of MEND
+
+
+
Funding
+
+
+
+
MEND growth
+
Trainingdelivery teams
+
Developing newproduts, services and
channels
+
+
+
Time of year,holidays
-
Recruitementstrategies
+
+
Develop good relationswith doctors, nurses,
newspapers
Message toparents +
+
Commitment frompartners
++
+
Embeddingpathways
+
+
Developingpathways
+
Families aspartnersCompleting
program
+
+
+
+
+
Venues
Staff andmanager ofvenue buyin
+
Havingdedicated staff
+
+
Levels ofobesity
-
Location
Cost
Programming
Too far fromswimming pool
Buyin at toplevel
+
Educationagenda
+
Transportation
Dropoutrates
Parentalcommitment
andawareness
Every child matters,health schools, and
other gov policy
Flexibility
Frequency ofsessions
+
Parentinggroups
<Levels ofobesity>
<Every child matters,health schools, and other
gov policy>
Letters informingabout childhood
obesity
Media andmarketing
Perceptionsof childhood
obesity
Automatic placementon MEND program
Skills ofnational
education Training of otherprofessionals
National strategies,targets and policy
Languagebarriers
Diversity ofparticipant pool
Hovmand P, Huang T, Finegood D, Sacher P. The MEND Systems Map (2010). Unpublisheddata.
9.1.2 Outcomes
A major strength of the current study was the variety of outcomes used to assess
intervention effectiveness, including measures of physiological and psychological
health. This was the first RCT to evaluate the effect of a community-based,
childhood obesity intervention, using waist circumference as the primary
outcome. Previous research on obese children employed BMI-based measures
as the primary outcome to evaluate trial effectiveness (Young, Northern et al.
2007; Oude Luttikhuis, Baur et al. 2009). However, the value of this index is
limited, as BMI does not provide information on body composition, and increases
346
in BMI in childhood due to growth are mainly attributed to lean mass, rather than
fat mass (Maynard, Wisemandle et al. 2001).
Accumulating evidence has shown that waist circumference is a superior
predictor of CVD risk factors in children, compared to BMI (Savva, Tornaritis et
al. 2000; Wells, Coward et al. 2002; McCarthy and Ashwell 2006), mainly due to
the fact that waist circumference is an indicator of abdominal fat, which is
associated with CVD risk factors and metabolic abnormalities in children
(Flodmark, Sveger et al. 1994; Freedman, Serdula et al. 1999; Janssen,
Katzmarzyk et al. 2005; McCarthy 2006; Despres 2007).
Over the last two decades, abdominal obesity in children has increased to a
higher level than general fatness, as assessed using BMI. This finding further
reinforces the use of waist circumference as a clinically useful tool for this group,
as it provides an indication of abdominal fat, which appears to be a serious
health hazard for children (Janssen, Katzmarzyk et al. 2004; McCarthy, Jarrett et
al. 2005; Rudolf, Walker et al. 2007).
9.1.3 Acceptability to families
Many community-based interventions are unsuccessful due to poor uptake as
well as low attendance and retention rates. Another key strength of the MEND
intensive phase intervention was its acceptability to families. The majority (96%)
of children starting the intervention completed the programme, with only two
dropouts recorded in the delayed intervention group.
347
Moreover, the mean 86% programme attendance was higher than that for the
feasibility trial and data reported for other childhood obesity interventions
(Denzer, Reithofer et al. 2004; Golley, Magarey et al. 2007; Robertson, Friede et
al. 2008).
An important consideration in terms of acceptability to families was that
children’s physical activity sessions were included in the multicomponent
intervention. This appeared to increase cardiovascular fitness, which is
associated with significant health benefits (Kirk, Zeller et al. 2005; Mota, Flores
et al. 2006; Mitchell, Moore et al. 2012) and rarely reported in parent-only
interventions. However, as mentioned previously, without conducting a thorough
qualitative evaluation of family perceptions of the intervention, it is not possible to
establish the specific components of the intervention that are acceptable.
Nonetheless, the intensive phase of the intervention appeared acceptable and
well tolerated by participating families in general.
9.1.4 Ethnicity and SEC
Ethnicity and SEC are relevant factors when developing and evaluating
childhood weight management interventions, as socio-demographic inequalities
exist in the distribution of childhood overweight and obesity. In total, 47% of
children in the trial were classified as BME, compared to the overall UK
population, which is predominantly white (national average, 91.9%) (Table 14)
(2011).Therefore it could be argued that results of the trial are not applicable to
most UK settings.
348
Children from ethnic minorities are generally more overweight than white
children, and reported to have lower fitness levels and poorer diets, with more
hours of television viewing (HSE 2008; DH 2011). For these reasons, it can be
argued that improving weight status in BME children may be more challenging
than that in white children.
Demographics of the implementation phase revealed that 24% of families were
BME (UK average: 7.9%) (Table 34), 34% were single parents (UK average:
24%) and 47% did not own their own home (UK average: 31%), a proxy for SEC.
Preliminary evaluations of the UK implementation data in over 14,000 children
suggested that scaling up the MEND intervention is unlikely to widen socio-
economic inequalities in childhood overweight and obesity, due to differential
access (Fagg and Law 2012). Moreover, clinically significant BMI changes
similar to those achieved in the RCT appear to be replicable in service delivery
settings for children from all socio-demographic groups analysed. However, at
the population level, scaled-up programmes may be more effective for some
groups than others (Fagg and Law 2012). Overall, despite the RCT comprising a
non-generalisable population of UK children, it appears that results may be
generalised across the UK, at least in the short-term.
9.1.5 Community and group-based intervention
We further examined the efficacy of a community-based intervention for the
management of childhood obesity. Several earlier interventions designed
specifically for the management of childhood obesity have been delivered in
hospitals and healthcare settings (Oude Luttikhuis, Baur et al. 2009).
349
Clinical or hospital-based delivery of these types of interventions is expensive
and medicalises the problem. Moreover, the frequency of visits required makes
hospital settings difficult for families living long distances away. Bearing in mind
the scale and spread of the obesity epidemic, community-based interventions
are preferable due to their reduced cost, ease of access for families, and
reduced burden on the NHS (ADA 2006; NICE 2006; Barlow 2007; SIGN 2010).
Finally, the intervention was delivered to groups of children and their parents,
making the programme more social for participants as well as cost-effective in
terms of reaching multiple families simultaneously. Group therapy can facilitate
the adoption of healthy habits as a result of positive peer pressure, role
modelling and copying that simultaneously allows participants to feel that they
are not facing the challenge alone, the whole process is a team project, and
each "player's" performance affects everybody (Flodmark, Ohlsson et al. 1993;
Bonet Serra, Quintanar Rioja et al. 2007).
9.1.6 Internal validity
Sustainability of health and psychosocial outcomes are the ultimate aims of a
childhood obesity intervention. Lack of long-term controlled data is problematic
within the entire field of childhood weight management (Oude Luttikhuis, Baur et
al. 2009), but remains the most crucial element necessary to draw definitive
conclusions regarding long-term effectiveness.
Due to the randomised, controlled design of this trial, a major strength of the
RCT was high confidence regarding the internal validity of the intervention,
particularly at 6 months from baseline. As the control group received the
350
intervention at 6 months, it is more difficult to draw conclusions regarding the
longer-term effects. The trial design included follow-up of the intervention group
alone at 12 months in order to provide some indication of the sustainability of the
intervention, but without controlled data, definitive conclusions could not be
obtained. Consequently, a trial evaluating MEND in the USA has incorporated
more intensive maintenance strategies as well as controlled follow-up at 12
months (Table 43). In addition, a planned evaluation is in progress to monitor
children who completed the MEND programme in the Greater London area 2 to 3
years previously.
Further studies evaluating differing weight maintenance strategies are currently
in progress in the UK (Woolcock 2010). These strategies aim to improve the
maintenance of short-term behaviour changes following the MEND intervention
(Section 8.9.3). Ultimately, until the evidence base evolves, it remains difficult to
establish the optimal method for sustaining outcomes following a childhood
weight management intervention. However, results of MEND remain the most
positive, compared to other UK community-based, multicomponent interventions
to date.
9.2 Limitations
9.2.1 Study design and methods
A major limitation of the feasibility and RCT evaluations was the lack of
qualitative methodology. This type of evaluation is essential to provide additional
insights into the study dynamics, which cannot be obtained from quantitative
methodologies alone. Qualitative evaluation should provide information on the
351
acceptability of the programme as well as the professionals delivering the
intervention to families. In addition, process evaluation was not utilised to
document and analyse the development and actual implementation of the
programme. This approach would have assessed whether strategies were
implemented as planned and the expected output was actually produced. A
process evaluation would have allowed explanation of discrepancies between
expected and observed outcomes and provided insights to aid implementation.
Without process evaluation, it is not possible to determine the extent to which
programme fidelity was maintained during the RCT. A quality assurance
framework was established during implementation of MEND in the UK to
facilitate the evaluation and reporting of programme fidelity to programme
deliverers, commissioners/funders and MEND staff.
Despite the lack of process evaluation that did not provide confirmatory
evidence, training and programme materials were standardised in order to
promote programme fidelity. Standardisation of the programme materials and
training were implemented to support successful delivery by community and
hospital-based healthcare professionals with no significant expertise in the
management of paediatric obesity or experience delivering a community-based
child weight management programme. Moreover, standardisation allowed the
intervention to be delivered at 5 sites, including one rural site during the RCT and
hundreds more during the UK implementation stage. This limitation is being
addressed in current evaluations of the MEND intervention taking place
internationally (Table 43).
Another limitation was the relatively short follow-up (12 months from
randomisation for the intervention group only), which limits conclusions about the
352
long-term effects and sustainability of the intervention. Ideally the period of
controlled comparison should be maximised to obtain data on the long-term
effects of a childhood weight management intervention. Unfortunately, due to
ethical committee constraints, the maximum period allowed for withholding
intervention from treatment-seeking families in the current trial was 6 months.
Other childhood weight management interventions have varied in terms of length
of the delayed intervention group, generally from 6 to 12 months (Savoye, Shaw
et al. 2007; Hughes, Stewart et al. 2008; Okely, Collins et al. 2010). Ideally, a
longer period of delay for provision of intervention to the control group would
have been preferable from an evaluation perspective, but needs to be balanced
with ethical considerations. Within-group analysis was the only alternative
method for determining changes at 12 months.
9.2.2 Recruitment
Families had to volunteer to take part in the trial, which may have
introduced volunteer or referral bias, as people choosing to participate in a study
(or referred) are often different to non-volunteers/non-referrals. This bias usually,
but not always, favours the treatment group, as volunteers tend to be more
motivated and concerned about their health. However, since all clinical or non-
academic childhood weight management programmes rely on families
volunteering, this bias should not affect the external validity of the trial results.
Moreover, the same bias would have been present in the control group, which
also included treatment-seeking or referred families, and therefore, volunteer or
referral bias should, at least in theory, be systematic in both groups.
353
9.2.3 Measurements
Researchers conducting the measurements did not manage to successfully
implement a fully blinded measurement process, since families were very
interested in discussing their children's progress, and therefore, in most cases,
intentionally or unintentionally revealed their group allocation. To some extent,
this may have created some expectation bias, whereby observers were
influenced when measuring data towards the expected outcome. Such bias
usually favours the treatment group. To reduce this bias, repeated
measurements were performed in the presence of each site’s Principal
Investigator to ensure accuracy of the recorded measures. However, it is highly
recommended that future trials include strict blinding procedures to diminish bias.
In addition, some measurement bias in this trial may have been attributed to
systematic errors that occur during collection of relevant data. Self-reported
dietary intake and physical activity levels may have been inaccurate due to recall
or memory bias.
9.2.4 Baseline demographics
We observed no differences between groups at baseline, except for gender. This
may have caused some selection bias, as the groups compared were statistically
different. However, there were no differences in relation to gender at 6 or 12
months within groups, and therefore, this difference was unlikely to have
influenced the outcomes.
354
9.2.5 Contamination bias
Some contamination bias in this trial was possible, as families in the control
group were motivated to seek treatment and may therefore have made changes
to their dietary and physical activity behaviours on their own accord. This may
explain the unexpected positive changes in the trial control group. The bias may
have minimised the differences in outcomes between the 2 groups. It is thus
extremely difficult to eliminate contamination bias in treatment-seeking trial
subjects.
9.2.6 Compliance bias
As the intervention involved lifestyle changes, it is likely that families responded
to advice to varying degrees. This introduces compliance bias into the trial,
whereby families responded to the components of the intervention in a
heterogeneous manner. This bias is unavoidable, as all human beings respond
differently to behavioural interventions, and this is similar in academic and real-
world settings.
9.2.7 Waist circumference as a primary outcome
It is important to recognise that whilst BMI is a simple and convenient tool to
assess the effectiveness of childhood obesity interventions, it has several
limitations (Janssen, Katzmarzyk et al. 2004; McCarthy 2006). Accordingly, waist
circumference was selected as a primary outcome measure, which was both a
strength and limitation. A strength is that waist circumference provides additional
355
information on body composition which is not obtained from BMI, and a
drawback that few childhood obesity interventions have employed waist
circumference as a complementary index for assessing effectiveness to date,
despite increasing evidence supporting advantages of its inclusion in trial
protocols (Rudolf, Greenwood et al. 2004; Tybor, Lichtenstein et al. 2011),
making comparisons with other studies difficult.
9.2.8 Clinical significance of BMI
A limitation that applies to both this trial and the wider field of childhood obesity
management is the lack of clarity over thresholds for determining clinical
significance of reductions in BMI and BMI z-score. In the absence of these
thresholds, it is difficult to establish benchmarks for success and compare
effectiveness between interventions. Further research is required to address this
important factor. Until then, the aim of childhood weight management
interventions should be to reduce BMI and waist circumference z-scores and
improve other measures of health and wellbeing, such as cardiovascular fitness,
levels of physical activity, diet quality, quality of life and self-esteem.
9.2.9 Secondary data analysis
An important limitation of the secondary data analysis was that the trial was not
originally powered to detect differences in outcomes according to levels of BMI z-
score change. However, there was sufficient power to show the trend for waist
circumference and its z-score. Therefore, if the trends had been as large for the
other outcomes, the corresponding differences according to BMI z-score
356
subgroup would have been significant. A related weakness of the study was that
due to loss of follow-up data, the number of participants per group was small in
some cases.
9.2.10 Physical and sedentary activities
A drawback of the trial was the use of non-validated physical and sedentary
activity questionnaires, which are a common problem in studies with children,
due to the nature of self-reported physical activity data (Jakicic and Otto 2005).
Ideally, accelerometers should be used, but at the time of the trial, these devices
were extremely expensive (approximately £400 each), and their purchase not
possible within the trial budget. Consequently, firm conclusions could not be
drawn from physical and sedentary activity level data.
However, physical and sedentary behaviours are important targets in childhood
weight management. In this trial, it appeared that significant reductions in
sedentary activity levels at 3 and 6 months were not maintained at 12 months,
suggesting compliance issues with the intervention strategies to reduce screen
time. This was identified as a target area for improvement following the RCT, and
more emphasis on reducing sedentary behaviours has been incorporated in
current programmes. These strategies will be more thoroughly evaluated in the
USA evaluation of the MEND intervention (Table 43).
9.2.11 Poor dietary data
Dietary data were poor, particularly at 12 months. This is a common finding in
357
studies involving dietary assessment, as completion of food diaries is laborious
and requires the cooperation of both parents and children to obtain an accurate
record (Livingstone and Robson 2000; Burrows, Martin et al. 2010; Collins,
Watson et al. 2010). A method that has improved compliance in alternative trials
is the provision of financial incentives to motivate families to complete the food
diaries. However, insufficient resources were available to implement this
strategy.
9.2.12 Poor quality puberty data
Children completed the puberty questionnaires themselves with no parental
oversight. Unfortunately, this resulted in several cases of missing data (blank
entries) and errors (changes in puberty that were not physiologically possible
during the study period), and therefore, the data collected were judged as
inaccurate and could not be used.
Based on current experience and other studies in children 6 to 12 years of age,
we concluded that the self-assessment method was unsuitable for reliable
determination of the breast Tanner stage of obese girls or pubic hair stage of
boys (Bonat, Pathomvanich et al. 2002). This meant that the results could not be
adjusted for puberty, which would have been ideal.
In future studies, this limitation will need to be addressed, especially if older
children are included. One option is to employ a trained physician to perform
puberty assessments in private. However, this action may affect trial cost as well
as recruitment and retention.
358
9.2.13 Selective measurement dropout
Selective measurement dropout was another serious drawback, which may have
influenced the results. At 6 months, 68% of children in the intervention group and
80% of children in the control group were measured. Interestingly, 83% of
children in the intervention group were assessed either at 6 or 12 months. All
children who missed 6-month measurements were assessed at 12 months, and
had reduced or maintained their BMI and waist circumference z-scores,
indicating that measurement avoidance was not due to poor adherence and fear
of being measured.
The current trial measurement dropout rates were lower than those in earlier
studies, including that reported by a research team at Yale University (Savoye,
Shaw et al. 2007) (40% and 47% dropout rates at 6 and 12 months follow-up),
who performed a similar childhood obesity management intervention. Shalitin
and colleagues (2009) reported significantly higher dropout rates, as only 47% of
their samples were followed up 9 months after the intervention and 26% of
children withdrew from the study (Shalitin, Ashkenazi-Hoffnung et al. 2009).
Several factors may have contributed to the non-attendance of measurement
sessions by families. One apparent and critical reason in the present trial was
that only one opportunity existed to attend measurement sessions held at a
single weekend at each community site. Conversations with families revealed
that many were unable to attend due to other commitments, such as church
attendance or illness.
359
This limitation will be addressed in future studies by offering additional
opportunities for families to attend measurement sessions as well as conducting
measurements at homes.
9.2.14 Economic evaluation
Economic evaluation of interventions is important to establish their cost-
effectiveness. It is crucial that public health interventions are both efficacious and
cost-effective. Unfortunately, cost-effectiveness analysis was not performed
during this trial. However, since completion of the trial, an economic evaluation
has been conducted in the form of a PhD thesis. The author of this thesis
conducted a cost-effectiveness analysis and economic modelling technique as
the subject of a PhD thesis in 2011 (Techakehakij 2011). It was calculated that if
the MEND intervention was made available to all overweight and obese children
in England in 2010, the intervention and medical costs saved would be £551.2
million and £216 million, respectively. The incremental cost-effectiveness ratio
(ICER) of the programme was estimated to be £1,668 per quality adjusted life
year (QALY) gained. The NICE threshold for assessing cost-effectiveness for
public health interventions is £20,000 - £30,000 (NICE 2009). An ICER below
this threshold is considered a cost-effective public health intervention. It was
concluded from this evaluation that MEND is a cost-effective intervention.
360
9.3 Conclusions
The first trial hypothesis was that the MEND programme would reduce waist
circumference and BMI z-scores by clinically significant amounts at 6 and 12
months in a group of obese 8-12 year old children, thereby improving their
weight status. Waist circumference and BMI z-scores were reduced at 6 and 12
months, but determination of their clinical significance was not possible due to
insufficient supportive literature. Additional research may establish thresholds for
clinical effectiveness following childhood weight management interventions. The
secondary data analysis presented raises the issue regarding assessment of
effectiveness solely through use of BMI z-score. It is my belief that benefits to
children attending a childhood weight management intervention cannot be
captured using a single outcome, such as BMI. A more holistic approach is
required to measure success based on a wider range of measures, such as
cardiovascular fitness and psychosocial wellbeing.
The second hypothesis was that levels of self-esteem would improve with body
composition and fitness. The results demonstrated an improvement in self-
esteem at 6 and 12 months. It was not possible to determine the specific factors
causing this increase in self-esteem. Nevertheless, this positive finding illustrates
that childhood weight management programmes can improve children’s
psychological well-being.
A third hypothesis, which was not part of the current PhD, but a question that
arose during the trial execution, was whether outcomes achieved in the MEND
trial are similar to those achieved when the MEND intervention was implemented
under service-level conditions across the UK. An independent evaluation is in
361
progress to determine the generalisability of the MEND intervention, and in
particular, its effects on health inequalities. In view of the promising preliminary
data, conclusive results are eagerly awaited.
A weakness of the MEND evaluation to date is the lack of qualitative evaluation.
However, trials in Australia and the USA are utilising both quantitative and
qualitative methodologies to gain a deeper understanding of the full effects.
Research in Canada is focusing on the actual process of scale-up and spread
using the MEND intervention as a case study. It is envisaged that the findings
from this study will help to inform the underdeveloped field of scale-up and
provide useful lessons for public health interventions.
This thesis aimed to document 11 years of dedication to the development and
evaluation of an effective and scalable childhood weight management
programme. By the beginning of the 21st century, strong data demonstrating the
global rise in childhood obesity were present. However, limited published
evidence for interventions aimed at preventing or reversing this serious condition
was available. Moreover, there were no clinical guidelines detailing effective
treatment modalities.
Clinical guidelines have subsequently been published. Organisations, such as
NICE and SIGN, have produced guidance documents for the treatment of
childhood obesity, which is a positive step. Unfortunately, these guidelines have
generally not been utilised adequately by providers of services within the NHS.
NICE clinical guidelines state that “the prevention and management of obesity
should be a priority for all” (NICE 2006). However, the majority of obese children
in the UK do not have access to a NICE/SIGN compliant childhood weight
362
management intervention due to a number of factors, including the financial
climate, possible discrimination against obese individuals, negative
governmental attitude and belief that obesity is a personal responsibility, lack of
implementation and support of policies, lack of effective commissioning skills in
NHS Primary Care Trusts and Local Authorities, transition of public health
services from the NHS to Local Authorities, and the sheer complexity of the
obesity system.
Unacceptably, over 4 million overweight and obese children do not have access
to services, as recommended by NICE and SIGN. Questions about the inequity
of services remain unanswered. Prevention and treatment are both crucial for
addressing the childhood obesity epidemic, but in order to prevent all children
progressing to adult obesity, a more equitable balance between prevention and
treatment is necessary.
Results presented in this thesis represent the first peer-reviewed RCT of a
complex, family-based treatment for childhood obesity designed to be run by
non-obesity specialists in community settings within the UK. The intervention,
which proved effective in families from low SEC and minority ethnic
backgrounds, conforms to national guidelines.
The aim from the outset was to provide a detailed account of the intervention as
well as a standard report of the evaluation methods and findings, to facilitate
replication studies and larger scale implementation. It is envisaged that these
results will be presented in the context of an updated systematic review at the
time of the next update.
363
It is expected that by following the recommended steps for the development,
evaluation and implementation of a complex intervention, as presented in the
current thesis, sufficient evidence can be accumulated to provide both
commissioners of childhood weight management services and families with
obese children a potentially effective intervention.
To the best of my knowledge, the published results describe the most thoroughly
evaluated and widely implemented community-based, childhood weight
management intervention internationally.
9.4 Recommendations – future directions
MEND is currently one of many international childhood weight management
interventions showing promising results in an academic setting. As confirmed by
systematic reviews, multicomponent lifestyle interventions can improve weight
status and other indicators of physiological and psychological health in the short-
term.
Future research should focus on establishing the elements and drivers essential
for generalising interventions and explore the ability to scale up interventions.
Without this capacity, many interventions will remain on the pages of scientific
journals and never be disseminated.
The MEND evaluation and early stage implementation results suggest that
childhood weight management interventions can be delivered effectively by a
wide range of professionals. This is crucial, since health professionals, such as
dietitians and psychologists, often do not have capacity to deliver such
364
interventions, and their relatively high salaries increase the cost of interventions.
It is also crucial in times of financial austerity that interventions are assessed on
the basis of cost as well as clinical effectiveness. Funders of childhood weight
management services should balance the costs of interventions with the benefits
and not simply focus on cost alone. Further studies are required to explore the
long-term effects of childhood weight management interventions that are
essential to convince policy makers to invest in such services. A positive cost-
benefit analysis relies on long-term data, which supports the business case for
intervening early to prevent obese children developing into obese adults.
In the UK, the majority of childhood weight management interventions are funded
through the NHS, but outcomes confirming effectiveness have never been
published. One cause for concern is that for many families, engagement in a
weight management intervention, may only occur once, and therefore, it is the
responsibility of all providers of childhood weight management services to
ensure that these interventions are effective and provide families with the best
chance of success.
365
References
(1993). "Social Trends: A Publication of the Government Statistical Service."
(1995). "Efficacy and safety of lowering dietary intake of fat and cholesterol in
children with elevated low-density lipoprotein cholesterol. The Dietary
Intervention Study in Children (DISC). The Writing Group for the DISC
Collaborative Research Group." Jama. 273 (18):1429-1435.
(2011). "Census Key Statistics." Available at: http://www.ons.gov.uk/ons/guide-
method/census/2011/index.html.
(2011). "Tipping the scales: Childhood obesity in London." Available at
http://www.london.gov.uk/publication/tipping-scales.
ADA (2006). "Position of the American Dietetic Association: individual-, family-,
school-, and community-based interventions for pediatric overweight." J
Am Diet Assoc. 106 (6): 925-945.
Aeberli, I., M. Gut-Knabenhans, et al. (2012). "A composite score combining
waist circumference and body mass index more accurately predicts body
fat percentage in 6- to 13-year-old children." Eur J Nutr. Feb 10 [Epub].
Aeberli, I., G. A. Spinas, et al. (2009). "Diet determines features of the metabolic
syndrome in 6- to 14-year-old children." Int J Vitam Nutr Res. 79 (1): 14-
23.
Agostoni, C., C. Braegger, et al. (2011). "Role of dietary factors and food habits
in the development of childhood obesity: a commentary by the ESPGHAN
Committee on Nutrition." J Pediatr Gastroenterol Nutr. 52 (6): 662-669.
Amed, S., D. Daneman, et al. (2010). "Type 2 diabetes in children and
adolescents." Expert Rev Cardiovasc Ther. 8 (3): 393-406.
Andersen, L. F., H. Tomten, et al. (2003). "Validation of energy intake estimated
from a food frequency questionnaire: a doubly labelled water study." Eur J
Clin Nutr. 57 (2): 279-284.
Atlantis, E., E. H. Barnes, et al. (2006). "Efficacy of exercise for treating
overweight in children and adolescents: a systematic review." Int J Obes
(Lond). 30 (7): 1027-1040.
Bandini, L. G., A. Must, et al. (2003). "Longitudinal changes in the accuracy of
reported energy intake in girls 10-15 years of age." Am J Clin Nutr. 78 (3):
480-484.
366
Bandini, L. G., D. A. Schoeller, et al. (1990). "Validity of reported energy intake in
obese and nonobese adolescents." Am J Clin Nutr. 52 (3): 421-425.
Bandura, A. (1986). "Social Foundations of Thought and Action: A Social
Cognitive Theory."
Banks, J., J. Williams, et al. (2012). "Is healthy eating for obese children
necessarily more costly for families?" Br J Gen Pract. 62 (594): e1-5.
Baranowski, T. and S. B. Domel (1994). "A cognitive model of children's
reporting of food intake." Am J Clin Nutr. 59 (Suppl 1): 212S-217S.
Barlow, S. E. (2007). "Expert committee recommendations regarding the
prevention, assessment, and treatment of child and adolescent
overweight and obesity: summary report." Pediatrics. 120 (Suppl 4): S164-
192.
Barlow, S. E. and W. H. Dietz (1998). "Obesity evaluation and treatment: Expert
Committee recommendations. The Maternal and Child Health Bureau,
Health Resources and Services Administration and the Department of
Health and Human Services." Pediatrics. 102 (3): E29.
Barton, M. (2010). "Screening for obesity in children and adolescents: US
Preventive Services Task Force recommendation statement." Pediatrics.
125 (2): 361-367.
Batch, J. A. and L. A. Baur (2005). "Management and prevention of obesity and
its complications in children and adolescents." Med J Aust. 182 (3): 130-
135.
Baur, L. A. and J. O'Connor (2004). "Special considerations in childhood and
adolescent obesity." Clin Dermatol. 22 (4): 338-344.
Bautista-Castano, I., J. Doreste, et al. (2004). "Effectiveness of interventions in
the prevention of childhood obesity." Eur J Epidemiol. 19 (7): 617-622.
Beaglehole, R., R. Bonita, et al. (2003). "Basic Epidemiology. WHO, Geneva."
85-88.
Belanger, M., K. Gray-Donald, et al. (2009). "When adolescents drop the ball:
sustainability of physical activity in youth." Am J Prev Med. 37 (1): 41-49.
Bell-Anderson, K. S. and J. M. Bryson (2004). "Leptin as a potential treatment for
obesity: progress to date." Treat Endocrinol. 3 (1): 11-18.
Bellisle, F. and A. Drewnowski (2007). "Intense sweeteners, energy intake and
the control of body weight." Eur J Clin Nutr. 61 (6): 691-700.
367
Ben Ounis, O., M. Elloumi, et al. (2008). "Effects of two-month physical-
endurance and diet-restriction programmes on lipid profiles and insulin
resistance in obese adolescent boys." Diabetes Metab. 34 (6 Pt 1): 595-
600.
Benfield, L. L., K. R. Fox, et al. (2008). "Magnetic resonance imaging of
abdominal adiposity in a large cohort of British children." Int J Obes
(Lond). 32 (1): 91-99.
Berenson, G. S., S. R. Srinivasan, et al. (1998). "Association between multiple
cardiovascular risk factors and atherosclerosis in children and young
adults. The Bogalusa Heart Study." N Engl J Med. 338 (23): 1650-1656.
Berkel, L. A., W. S. Poston, et al. (2005). "Behavioral interventions for obesity." J
Am Diet Assoc. 105 (5 Suppl 1): S35-43.
Bibbins-Domingo, K., P. Coxson, et al. (2007). "Adolescent overweight and
future adult coronary heart disease." N Engl J Med. 357 (23): 2371-2379.
Biro, F. M. and M. Wien (2010). "Childhood obesity and adult morbidities." Am J
Clin Nutr. 91(5): 1499S-1505S.
Bonat, S., A. Pathomvanich, et al. (2002). "Self-assessment of pubertal stage in
overweight children." Pediatrics. 110(4): 743-747.
Bonet Serra, B., A. Quintanar Rioja, et al. (2007). "Group therapy for the
treatment of obesity in children and adolescents." An Pediatr (Barc). 67(1): 51-56.
Boonpleng, W., C. G. Park, et al. (2012). "Timing of adiposity rebound: a step
toward preventing obesity." Pediatr Nurs. 38 (1): 37-42.
Borys, J. M., Y. Le Bodo, et al. (2012). "EPODE approach for childhood obesity
prevention: methods, progress and international development." Obes Rev.
13 (4): 299-315.
Bosy-Westphal, A., C. A. Booke, et al. (2010). "Measurement site for waist
circumference affects its accuracy as an index of visceral and abdominal
subcutaneous fat in a Caucasian population." J Nutr. 140 (5): 954-961.
Boutelle, K. N., G. Cafri, et al. (2011). "Parent-only treatment for childhood
obesity: a randomized controlled trial." Obesity. 19 (3): 574-580.
Braet, C. and K. Wydhooge (2000). "Dietary restraint in normal weight and
overweight children. A cross-sectional study." Int J Obes Relat Metab
Disord. 24 (3): 314-318.
368
Brambilla, P., G. Bedogni, et al. (2006). "Crossvalidation of anthropometry
against magnetic resonance imaging for the assessment of visceral and
subcutaneous adipose tissue in children." Int J Obes (Lond). 30 (1): 23-
30.
Branscum, P. and M. Sharma (2012). "After-school based obesity prevention
interventions: a comprehensive review of the literature." Int J Environ Res
Public Health. 9 (4): 1438-1457.
Bridges, S. and J. Thompson (2010). "HSE: Children's BMI, overweight and
obesity."
Buijzen, M., J. Schuurman, et al. (2008). "Associations between children's
television advertising exposure and their food consumption patterns: a
household diary-survey study." Appetite. 50 (2-3): 231-239.
Burrows, T. L., R. J. Martin, et al. (2010). "A systematic review of the validity of
dietary assessment methods in children when compared with the method
of doubly labeled water." J Am Diet Assoc. 110 (10): 1501-1510.
Campbell, M. W., J. Williams, et al. (2011). "Is the adiposity rebound a rebound
in adiposity?" Int J Pediatr Obes. 6 (2-2): e207-215.
Chanoine, J. P., S. Hampl, et al. (2005). "Effect of orlistat on weight and body
composition in obese adolescents: a randomized controlled trial." JAMA.
293 (23): 2873-2883.
Chiavaroli, V., C. Giannini, et al. (2012). "Weight Loss in Obese Prepubertal
Children: The Influence of Insulin Resistance." Endocr Res. Aug 22
[Epub].
Chomitz, V. R., R. J. McGowan, et al. (2010). "Healthy Living Cambridge Kids: a
community-based participatory effort to promote healthy weight and
fitness." Obesity (Silver Spring). 18 (Suppl 1): S45-53.
Christiansen, T., J. M. Bruun, et al. (2007). "Weight loss maintenance in severely
obese adults after an intensive lifestyle intervention: 2- to 4-year follow-
up." Obesity (Silver Spring). 15 (2): 413-420.
Cleland, V. J., K. Ball, et al. (2009). "Socioeconomic position and the tracking of
physical activity and cardiorespiratory fitness from childhood to
adulthood." Am J Epidemiol. 170 (9): 1069-1077.
369
Cole, K., J. Waldrop, et al. (2006). "An integrative research review: effective
school-based childhood overweight interventions." J Spec Pediatr Nurs.
11 (3): 166-177.
Cole, T. J., M. C. Bellizzi, et al. (2000). "Establishing a standard definition for
child overweight and obesity worldwide: international survey." BMJ. 320(7244): 1240-1243.
Cole, T. J., J. V. Freeman, et al. (1995). "Body mass index reference curves for
the UK, 1990." Arch Dis Child. 73 (1): 25-29.
Cole, T. J., M. S. Faith, et al. (2005). "What is the best measure of adiposity
change in growing children: BMI, BMI %, BMI z-score or BMI centile?" Eur
J Clin Nutr 59(3): 419-425.
Collins, C. E., J. Warren, et al. (2006). "Measuring effectiveness of dietetic
interventions in child obesity: a systematic review of randomized trials."
Arch Pediatr Adolesc Med. 160 (9): 906-922.
Collins, C. E., J. Watson, et al. (2010). "Measuring dietary intake in children and
adolescents in the context of overweight and obesity." Int J Obes (Lond).
34 (7): 1103-1115.
Collins, J. (2007). "Indicators, trends, and recommendations for living a longer,
healthier life." J Am Coll Radiol. 4 (11): 832-840.
COMA (1991). "Dietary Reference Values for Food Energy and Nutrients for the
United Kingdom."
Cook, S., M. Weitzman, et al. (2003). "Prevalence of a metabolic syndrome
phenotype in adolescents: findings from the third National Health and
Nutrition Examination Survey, 1988-1994." Arch Pediatr Adolesc Med.
157 (8): 821-827.
Cooper, T. V., L. M. Klesges, et al. (2006). "An assessment of obese and non
obese girls' metabolic rate during television viewing, reading, and resting."
Eat Behav. 7 (2): 105-114.
Coppinger, T., Y. M. Jeanes, et al. (2012). "Body mass, frequency of eating and
breakfast consumption in 9-13-year-olds." J Hum Nutr Diet. 25 (1): 43-49.
Cox, R., H. Skouteris, et al. (2012). "Television viewing, television content, food
intake, physical activity and body mass index: a cross-sectional study of
preschool children aged 2-6 years." Health Promot J Austr. 23 (1): 58-62.
370
Craig, P., P. Dieppe, et al. (2008). "Developing and evaluating complex
interventions: the new Medical Research Council guidance." BMJ. 29(337).
Craigie, A. M., A. A. Lake, et al. (2011). "Tracking of obesity-related behaviours
from childhood to adulthood: A systematic review." Maturitas. 70 (3): 266-
284.
Croker, H., R. M. Viner, et al. (2012). "Family-based behavioural treatment of
childhood obesity in a UK National Health Service setting: randomized
controlled trial." Int J Obes. 36 (1): 16-26.
Cummings, D. M., S. Henes, et al. (2008). "Insulin resistance status: predicting
weight response in overweight children." Arch Pediatr Adolesc Med. 162(8): 764-768.
Cunningham, C. E., R. Bremner, et al. (1995). "Large group community-based
parenting programs for families of preschoolers at risk for disruptive
behaviour disorders: utilization, cost effectiveness, and outcome." J Child
Psychol Psychiatry. 36 (7): 1141-1159.
Daniels, S. R., D. K. Arnett, et al. (2005). "Overweight in children and
adolescents: pathophysiology, consequences, prevention, and treatment."
Circulation. 111 (15): 1999-2012.
Das, U. N. (2008). "Perinatal nutrition and obesity." Br J Nutr. 99 (6): 1391-1392.
Daviglus, M. L., K. Liu, et al. (2004). "Relation of body mass index in young
adulthood and middle age to Medicare expenditures in older age." JAMA.
292 (22): 2743-2749.
De Craemer, M., E. De Decker, et al. (2012). "Correlates of energy balance-
related behaviours in preschool children: a systematic review." Obes
Rev.13 (Suppl 1): 13-28.
de Koning, L., A. T. Merchant, et al. (2007). "Waist circumference and waist-to-
hip ratio as predictors of cardiovascular events: meta-regression analysis
of prospective studies." Eur Heart J. 28 (7): 850-856.
de Onis, M., M. Blossner, et al. (2010). "Global prevalence and trends of
overweight and obesity among preschool children." Am J Clin Nutr. 92 (5):
1257-1264.
371
de Onis, M., A. W. Onyango, et al. (2007). "Development of a WHO growth
reference for school-aged children and adolescents." Bull World Health
Organ. 85 (9): 660-667.
de Ruyter, J. C., M. R. Olthof, et al. (2012). "A trial of sugar-free or sugar-
sweetened beverages and body weight in children." N Engl J Med. 367(15): 1397-1406.
DeMattia, L., L. Lemont, et al. (2007). "Do interventions to limit sedentary
behaviours change behaviour and reduce childhood obesity? A critical
review of the literature." Obes Rev. 8 (1): 69-81.
Denzer, C., E. Reithofer, et al. (2004). "The outcome of childhood obesity
management depends highly upon patient compliance." Eur J Pediatr. 163(2): 99-104.
Despres, J. P. (2007). "Cardiovascular disease under the influence of excess
visceral fat." Crit Pathw Cardiol. 6 (2): 51-59.
DH (2011). "Department of Health in association with the Welsh Government, the
Scottish Government and the Food Standards Agency in Northern Ireland:
The eatwell plate resources."
DH (2011). "Department of Health: National Child Measurement Programme:
England, 2010/11 school year."
DH (2011). "Healthy Weight, Healthy lives: A Cross-Government strategy for
England. Available at: http://webarchive.nationalarchives.gov.uk/
+/www.dh.gov.uk/en/Publichealth/Healthimprovement/Obesity/HealthyWei
ght/index.htm."
DH (2011). "UK physical activity guidelines. Available at: http://www.dh.gov.uk/
en/Publicationsandstatistics/Publications/PublicationsPolicyAndGuidance/
DH_127931."
Diethelm, K., N. Jankovic, et al. (2012). "Food intake of European adolescents in
the light of different food-based dietary guidelines: results of the HELENA
(Healthy Lifestyle in Europe by Nutrition in Adolescence) Study." Public
Health Nutr. 15 (3): 386-398.
Digenio, A. G., J. P. Mancuso, et al. (2009). "Comparison of methods for
delivering a lifestyle modification program for obese patients: a
randomized trial." Ann Intern Med. 150 (4): 255-262.
372
Dollman, J., K. Norton, et al. (2005). "Evidence for secular trends in children's
physical activity behaviour." Br J Sports Med. 39 (12): 892-897; discussion
897.
Doolen, J., P. T. Alpert, et al. (2009). "Parental disconnect between perceived
and actual weight status of children: a metasynthesis of the current
research." J Am Acad Nurse Pract. 21(3): 160-166.
Dubois, L., A. Farmer, et al. (2007). "Regular sugar-sweetened beverage
consumption between meals increases risk of overweight among
preschool-aged children." J Am Diet Assoc. 107 (6): 924-934.
Dwyer, T., C. G. Magnussen, et al. (2009). "Decline in physical fitness from
childhood to adulthood associated with increased obesity and insulin
resistance in adults." Diabetes Care. 32 (4): 683-687.
Eisenberg, M. E., D. Neumark-Sztainer, et al. (2003). "Associations of weight-
based teasing and emotional well-being among adolescents." Arch
Pediatr Adolesc Med. 157 (8): 733-738.
Ekelund, U., G. Tomkinson, et al. (2011). "What proportion of youth are
physically active? Measurement issues, levels and recent time trends." Br
J Sports Med. 45 (11): 859-865.
El-Sayed, A. M., P. Scarborough, et al. (2011). "Ethnic inequalities in obesity
among children and adults in the UK: a systematic review of the
literature." Obes Rev. 12 (5): 516-34.
El-Sayed, A. M., P. Scarborough, et al. (2012). "Socioeconomic Inequalities in
Childhood Obesity in the United Kingdom: A Systematic Review of the
Literature." Obes Facts. 5 (5): 671-692.
Elliott, S. A., H. Truby, et al. (2011). "Associations of body mass index and waist
circumference with: energy intake and percentage energy from
macronutrients, in a cohort of Australian children." Nutr J. 10: 58.
Ellis, K. J. (2000). "Human body composition: in vivo methods." Physiol Rev. 80(2): 649-680.
Epstein, L. H. (1996). "Family-based behavioural intervention for obese children."
Int J Obes Relat Metab Disord. 20 (1): S14-21.
Epstein, L. H., M. D. Myers, et al. (1998). "Treatment of pediatric obesity."
Pediatrics. 101 (3 Pt 2): 554-570.
373
Epstein, L. H., R. A. Paluch, et al. (2008). "Increasing healthy eating vs. reducing
high energy-dense foods to treat pediatric obesity." Obesity (Silver
Spring). 16 (2): 318-326.
Epstein, L. H., R. A. Paluch, et al. (2000). "Decreasing sedentary behaviors in
treating pediatric obesity." Arch Pediatr Adolesc Med. 154 (3): 220-226.
Epstein, L. H., R. A. Paluch, et al. (2000). "Problem solving in the treatment of
childhood obesity." J Consult Clin Psychol . 8 (4): 717-721.
Epstein, L. H., R. A. Paluch, et al. (2007). "Family-based obesity treatment, then
and now: twenty-five years of pediatric obesity treatment." Health Psychol.
26(4): 381-391.
Epstein, L. H., A. Valoski, et al. (1994). "Ten-year outcomes of behavioral family-
based treatment for childhood obesity." Health Psychol. 13 (5): 373-383.
Epstein, L. H. and R. R. Wing (1987). "Behavioral treatment of childhood
obesity." Psychol Bull. 101 (3): 331-342.
Epstein, L. H., R. R. Wing, et al. (1985). "Effect of diet and controlled exercise on
weight loss in obese children." J Pediatr. 107 (3): 358-361.
Fagg, J., T. J. Cole, et al. (2012). "From trial to population: effect of a weight
management intervention on body mass index when scaled up." J
Epidemiol Community Health. 66: A2-A3.
Fagg, J. and C. Law (2012). "Does scaling up a family-based community
intervention for childhood overweight and obesity impact socio-economic
inequalities in health?" Obes Facts. 5 (Suppl 1): 1-280.
Farpour-Lambert, N. J., Y. Aggoun, et al. (2009). "Physical activity reduces
systemic blood pressure and improves early markers of atherosclerosis in
pre-pubertal obese children." J Am Coll Cardiol. 54 (25): 2396-2406.
FDA (2010). "Meridia (sibutramine): Market Withdrawal Due to Risk of Serious
Cardiovascular Events. Available at: http://www.fda.gov/safety/medwatch/
safetyinformation/safetyalertsforhumanmedicalproducts/ucm228830.htm."
Finegood, D. T., T. D. Merth, et al. (2010). "Implications of the foresight obesity
system map for solutions to childhood obesity." Obesity. 18 (1): S13-16.
Fisher, J. O., R. K. Johnson, et al. (2000). "Influence of body composition on the
accuracy of reported energy intake in children." Obes Res. 8 (8): 597-603.
Fitzgibbon, M. L. and B. M. Beech (2009). "The role of culture in the context of
school-based BMI screening." Pediatrics. 124 (Suppl 1): S50-62.
374
Flodmark, C. E., T. Ohlsson, et al. (1993). "Prevention of progression to severe
obesity in a group of obese schoolchildren treated with family therapy."
Pediatrics. 91 (5): 880-884.
Flodmark, C. E., T. Sveger, et al. (1994). "Waist measurement correlates to a
potentially atherogenic lipoprotein profile in obese 12-14-year-old
children." Acta Paediatr. 83 (9): 941-945.
Flynn, M. A., D. A. McNeil, et al. (2006). Reducing obesity and related chronic
disease risk in children and youth: a synthesis of evidence with 'best
practice' recommendations. Obes Rev. 7 (Suppl 1): 7-66.
Ford, A. L., C. Bergh, et al. (2009). "Treatment of childhood obesity by retraining
eating behaviour: randomised controlled trial." BMJ. 5 (340).
Ford, A. L., L. P. Hunt, et al. (2010). "What reduction in BMI SDS is required in
obese adolescents to improve body composition and cardiometabolic
health?" Arch Dis Child. 95 (4): 256-261.
Francis, K. and R. Feinstein (1991). "A simple height-specific and rate-specific
step test for children." South Med J. 84 (2): 169-174.
Frank, L. and S. Kavage (2009). "A national plan for physical activity: the
enabling role of the built environment." J Phys Act Health. 6 (Suppl 2):
S186-195.
Freedman, D. S., W. H. Dietz, et al. (1999). "The relation of overweight to
cardiovascular risk factors among children and adolescents: the Bogalusa
Heart Study." Pediatrics. 103 (6 Pt 1): 1175-1182.
Freedman, D. S., M. K. Serdula, et al. (1999). "Relation of circumferences and
skinfold thicknesses to lipid and insulin concentrations in children and
adolescents: the Bogalusa Heart Study." Am J Clin Nutr. 69 (2): 308-317.
Freedman, D. S., J. Wang, et al. (2007). "The prediction of body fatness by BMI
and skinfold thicknesses among children and adolescents." Ann Hum Biol.
34 (2): 183-194.
Froberg, K. and L. B. Andersen (2005). "Mini review: physical activity and fitness
and its relations to cardiovascular disease risk factors in children." Int J
Obes (Lond). 29 (Suppl 2): S34-39.
Galcheva, S. V., V. M. Iotova, et al. (2009). "Waist circumference percentile
curves for Bulgarian children and adolescents aged 6-18 years." Int J
Pediatr Obes. 4 (4): 381-388.
375
Garipagaoglu, M., Y. Sahip, et al. (2009). "Family-based group treatment versus
individual treatment in the management of childhood obesity: randomized,
prospective clinical trial." Eur J Pediatr. 168 (9): 1091-1099.
Gately, P. J., C. B. Cooke, et al. (2000). "The effects of a children's summer
camp programme on weight loss, with a 10 month follow-up." Int J Obes
Relat Metab Disord. 24 (11): 1445-1452.
Gibson, L. J., J. Peto, et al. (2006). "Lack of evidence on diets for obesity for
children: a systematic review." Int J Epidemiol. 35 (6): 1544-1552.
Gibson, S. (2010). "Trends in energy and sugar intakes and body mass index
between 1983 and 1997 among children in Great Britain." J Hum Nutr
Diet. 23 (4): 371-381.
Glasser, N., K. Zellner, et al. (2011). "Validity of body mass index and waist
circumference to detect excess fat mass in children aged 7-14 years." Eur
J Clin Nutr. 65 (2): 151-159.
Glenny, A. M., S. O'Meara, et al. (1997). "The treatment and prevention of
obesity: a systematic review of the literature." Int J Obes Relat Metab
Disord. 21 (9): 715-737.
Golan, M. and S. Crow (2004). "Targeting parents exclusively in the treatment of
childhood obesity: long-term results." Obes Res. 12 (2): 357-361.
Golan, M., V. Kaufman, et al. (2006). "Childhood obesity treatment: targeting
parents exclusively v. parents and children." Br J Nutr. 95 (5): 1008-1015.
Golan, M., A. Weizman, et al. (1999). "Impact of treatment for childhood obesity
on parental risk factors for cardiovascular disease." Prev Med. 29 (6 Pt 1):
519-526.
Goldfield, G. S., L. H. Epstein, et al. (2001). "Cost-effectiveness of group and
mixed family-based treatment for childhood obesity." Int J Obes Relat
Metab Disord. 25 (12): 1843-1849.
Golley, R. K., A. M. Magarey, et al. (2007). "Twelve-month effectiveness of a
parent-led, family-focused weight-management program for prepubertal
children: a randomized, controlled trial." Pediatrics. 119 (3): 517-525.
Goran, M. I. and M. S. Treuth (2001). "Energy expenditure, physical activity, and
obesity in children." Pediatr Clin North Am. 48 (4): 931-953.
376
Gortmaker, S. L., A. Must, et al. (1993). "Social and economic consequences of
overweight in adolescence and young adulthood." N Engl J Med. 329 (14):
1008-1012.
Gortmaker, S. L., B. A. Swinburn, et al. (2011). "Changing the future of obesity:
science, policy, and action." Lancet. 378 (9793): 838-847.
Griffiths, L. J., T. J. Parsons, et al. (2010). "Self-esteem and quality of life in
obese children and adolescents: a systematic review." Int J Pediatr Obes.
5 (4): 282-304.
Guinhouya, B. C. (2012). "Physical activity in the prevention of childhood
obesity." Paediatr Perinat Epidemiol. 26 (5): 438-447.
Guran, T. and A. Bereket (2011). "International epidemic of childhood obesity
and television viewing." Minerva Pediatr. 63 (6): 483-490.
Gutin, B., P. Barbeau, et al. (2002). "Effects of exercise intensity on
cardiovascular fitness, total body composition, and visceral adiposity of
obese adolescents." Am J Clin Nutr. 75 (5): 818-826.
Halford, J. C., E. J. Boyland, et al. (2008). "Beyond-brand effect of television food
advertisements on food choice in children: the effects of weight status."
Public Health Nutr. 11 (9): 897-904.
Han, T. S., P. Richmond, et al. (1997). "Waist circumference reduction and
cardiovascular benefits during weight loss in women." Int J Obes Relat
Metab Disord. 21 (2): 127-134.
Haroun, D., S. J. Taylor, et al. (2010). "Validation of bioelectrical impedance
analysis in adolescents across different ethnic groups." Obesity (Silver
Spring). 18 (6): 1252-1259.
Harris, K. C., L. K. Kuramoto, et al. (2009). "Effect of school-based physical
activity interventions on body mass index in children: a meta-analysis."
CMAJ. 180 (7): 719-726.
Hart, C. N., E. Jelalian, et al. (2010). "Early patterns of food intake in an
adolescent weight loss trial as predictors of BMI change." Eat Behav.
11(4): 217-222.
Harter, S. (1985). "Harter's Self-perception Profile for Children."
Herman, K. M., C. L. Craig, et al. (2009). "Tracking of obesity and physical
activity from childhood to adulthood: the Physical Activity Longitudinal
Study." Int J Pediatr Obes. 4 (4): 281-288.
377
Heyward, V. H. (1998). "Practical body composition assessment for children,
adults, and older adults." Int J Sport Nutr. 8 (3): 285-307.
Hoare, P. and L. Cosgrove (1998). "Eating habits, body-esteem and self-esteem
in Scottish children and adolescents." J Psychosom Res. 45 (5): 425-431.
Hoare, P., R. Elton, et al. (1993). "The modification and standardisation of the
Harter self-esteem questionnaire with Scottish school children." Eur Child
Adolesc Psychiatry. 2 (1): 19-33.
Holmes, B., K. Dick, et al. (2008). "A comparison of four dietary assessment
methods in materially deprived households in England." Public Health
Nutr. 11 (5): 444-456.
Hosking, J., B. S. Metcalf, et al. (2006). "Validation of foot-to-foot bioelectrical
impedance analysis with dual-energy X-ray absorptiometry in the
assessment of body composition in young children: the Early Bird cohort."
Br J Nutr. 96 (6): 1163-1168.
HSE (2006). "Health Survey for England 2004: Health of Ethnic Minorities - Full
Report."
HSE (2006). "Health Survey for England 2006: Obesity and other risk factors in
children."
HSE (2008). "Physical activity and fitness: Summary of key findings."
Hughes, A. R., R. McLaughlin, et al. (2007). "The B'Active programme for
overweight primary school children in Glasgow: determining the
prevalence of overweight and obesity and piloting an activity intervention."
Br J Nutr. 97 (1): 204-209.
Hughes, A. R., L. Stewart, et al. (2008). "Randomized, controlled trial of a best-
practice individualized behavioral program for treatment of childhood
overweight: Scottish Childhood Overweight Treatment Trial (SCOTT)."
Pediatrics. 121 (3): e539-546.
Hunt, L. P., A. Ford, et al. (2007). "Clinical measures of adiposity and percentage
fat loss: which measure most accurately reflects fat loss and what should
we aim for?" Arch Dis Child. 92 (5): 399-403.
Huybrechts, I., C. Vereecken, et al. (2010). "Reproducibility and validity of a diet
quality index for children assessed using a FFQ." Br J Nutr. 104 (1): 135-
144.
378
Jackson, D. M., K. Djafarian, et al. (2009). "Increased television viewing is
associated with elevated body fatness but not with lower total energy
expenditure in children." Am J Clin Nutr. 89 (4): 1031-1036.
Jackson, L. V., N. K. Thalange, et al. (2007). "Blood pressure centiles for Great
Britain." Arch Dis Child. 92 (4): 298-303.
Jain, A., S. N. Sherman, et al. (2001). "Why don't low-income mothers worry
about their preschoolers being overweight?" Pediatrics. 107 (5): 1138-
1146.
Jakicic, J. M. and A. D. Otto (2005). "Physical activity considerations for the
treatment and prevention of obesity." Am J Clin Nutr. 82 (1 Suppl): 226S-
229S.
Jannsen, I. L., A (2010). "Systematic review of the health benefits of physical
activity and fitness in school-aged children and youth." Int J Behav Nutr
Phys Act. 7 (40): 1-16.
Janssen, I., W. M. Craig, et al. (2004). "Associations between overweight and
obesity with bullying behaviors in school-aged children." Pediatrics. 113(5): 1187-1194.
Janssen, I., P. T. Katzmarzyk, et al. (2004). "Waist circumference and not body
mass index explains obesity-related health risk." Am J Clin Nutr. 79 (3):
379-384.
Janssen, I., P. T. Katzmarzyk, et al. (2005). "Combined influence of body mass
index and waist circumference on coronary artery disease risk factors
among children and adolescents." Pediatrics. 115 (6): 1623-1630.
Janz, K. F., S. Kwon, et al. (2009). "Sustained effect of early physical activity on
body fat mass in older children." Am J Prev Med. 37 (1): 35-40.
Jennings, A., A. Welch, et al. (2011). "Diet quality is independently associated
with weight status in children aged 9-10 years." J Nutr. 141 (3): 453-459.
Johnson, L., A. P. Mander, et al. (2008). "A prospective analysis of dietary
energy density at age 5 and 7 years and fatness at 9 years among UK
children." Int J Obes (Lond). 32 (4): 586-593.
Kalarchian, M. A., M. D. Levine, et al. (2009). "Family-based treatment of severe
pediatric obesity: randomized, controlled trial." Pediatrics. 124 (4): 1060-
1068.
379
Kalavainen, M. P., M. O. Korppi, et al. (2007). "Clinical efficacy of group-based
treatment for childhood obesity compared with routinely given individual
counseling." Int J Obes (Lond). 31 (10): 1500-1508.
Kamath, C. C., K. S. Vickers, et al. (2008). "Clinical review: behavioral
interventions to prevent childhood obesity: a systematic review and
metaanalyses of randomized trials." J Clin Endocrinol Metab. 93 (12):
4606-4615.
Keane, E., R. Layte, et al. (2012). "Measured parental weight status and familial
socio-economic status correlates with childhood overweight and obesity at
age 9." PLoS One. 7 (8): e43503.
Keast, D. R., T. A. Nicklas, et al. (2010). "Snacking is associated with reduced
risk of overweight and reduced abdominal obesity in adolescents: National
Health and Nutrition Examination Survey (NHANES) 1999-2004." Am J
Clin Nutr. 92 (2): 428-435.
Kelishadi, R., M. Malekahmadi, et al. (2012). "Can a trial of motivational lifestyle
counseling be effective for controlling childhood obesity and the
associated cardiometabolic risk factors?" Pediatr Neonatol. 53 (2): 90-97.
Kelly, C., L. A. Ricciardelli, et al. (1999). "Problem eating attitudes and behaviors
in young children." Int J Eat Disord. 25 (3): 281-286.
Khambalia, A. Z., S. Dickinson, et al. (2012). "A synthesis of existing systematic
reviews and meta-analyses of school-based behavioural interventions for
controlling and preventing obesity." Obes Rev. 13 (3): 214-233.
Kim, S. Y., J. L. England, et al. (2011). "Gestational diabetes mellitus and risk of
childhood overweight and obesity in offspring: a systematic review." Exp
Diabetes Res. 2011: 541308.
Kirk, S., M. Zeller, et al. (2005). "The relationship of health outcomes to
improvement in BMI in children and adolescents." Obes Res. 13 (5): 876-
882.
Klein, D. J., E. M. Cottingham, et al. (2006). "A randomized, double-blind,
placebo-controlled trial of metformin treatment of weight gain associated
with initiation of atypical antipsychotic therapy in children and
adolescents." Am J Psychiatry. 163 (12): 2072-2079.
380
Klesges, L. M., N. A. Williams, et al. (2012). "External validity reporting in
behavioral treatment of childhood obesity: a systematic review." Am J
Prev Med. 42 (2): 185-192.
Klesges, R. C., M. L. Shelton, et al. (1993). "Effects of television on metabolic
rate: potential implications for childhood obesity." Pediatrics. 91 (2): 281-
286.
Kobayashi, T., M. Kamimura, et al. (2011). "Reproducibility and validity of the
food frequency questionnaire for estimating habitual dietary intake in
children and adolescents." Nutr Ju. 10: 27.
Kolsgaard, M. L., G. Joner, et al. (2012). "Reduction in BMI z-score and
improvement in cardiometabolic risk factors in obese children and
adolescents. The Oslo adiposity intervention study - a hospital/public
health nurse combined treatment." BMC Pediatr. 12 (77): 1471-2431.
Koopman, H. (1992). "Assessment of sodium and potassium intake by 24-hour
recall." Br J Gen Practu. 42 (355): 77-78.
Kopelman, P., S. A. Jebb, et al (2007). Executive summary: Foresight 'Tackling
Obesities: Future Choices' project, Obes Rev. Mar;8 Suppl 1:vi-ix.
Koster, A., M. F. Leitzmann, et al. (2008). "Waist circumference and mortality."
Am J Epidemiol. 167 (12): 1465-1475.
Krekoukia, M., G. P. Nassis, et al. (2007). "Elevated total and central adiposity
and low physical activity are associated with insulin resistance in
children." Metabolism. 56 (2): 206-213.
Kuczmarski, R. J., C. L. Ogden, et al. (2002). "2000 CDC Growth Charts for the
United States: methods and development." Vital Health Stat 11. (246): 1-
190.
l'Allemand-Jander, D. (2010). "Clinical diagnosis of metabolic and cardiovascular
risks in overweight children: early development of chronic diseases in the
obese child." Int J Obes (Lond). 34 (Suppl 2): S32-36.
Lambert, J., C. Agostoni, et al. (2004). "Dietary intake and nutritional status of
children and adolescents in Europe." Br J Nutr. 92 (Suppl 2): S147-211.
Lambiase, M. (2009). "Treating pediatric overweight through reductions in
sedentary behavior: a review of the literature." J Pediatr Health Care. 23(1): 29-36.
381
Lamichhane, A. P., R. Puett, et al. (2012). "Associations of built food
environment with body mass index and waist circumference among youth
with diabetes." Int J Behav Nutr Phys Act. 9: 81.
Law, C. (2010) "A population-level evaluation of a family-based community
intervention for childhood overweight and obesity." Protocol available at:
http://www.phr.nihr.ac.uk/funded_projects/09_3005_05.asp.
Lazaar, N., J. Aucouturier, et al. (2007). "Effect of physical activity intervention on
body composition in young children: influence of body mass index status
and gender." Acta Paediatr. 96 (9): 1315-1320.
Leary, M. R., A. L. Haupt, et al. (1998). "Calibrating the sociometer: the
relationship between interpersonal appraisals and state self-esteem." J
Pers Soc Psychol. 74 (5): 1290-1299.
Leary, M. R., E. B. Tate, et al. (2007). "Self-compassion and reactions to
unpleasant self-relevant events: the implications of treating oneself
kindly." J Pers Soc Psychol. 92 (5): 887-904.
Lee, S. Y. and D. Gallagher (2008). "Assessment methods in human body
composition." Curr Opin Clin Nutr Metab Care. 11 (5): 566-572.
Leibowitz, K. L., R. H. Moore, et al. (2009). "Cardiovascular disease risk factor
(CVDRF) associated waist circumference patterns in obese-prone
children." Int J Pediatr Obes. 4 (3): 150-159.
Levine, J. A. (2004). "Nonexercise activity thermogenesis (NEAT): environment
and biology." Am J Physiol Endocrinol Metab. 286 (5): E675-685.
Li, M., S. Li, et al. (2008). "A systematic review of school-based intervention
studies for the prevention or reduction of excess weight among Chinese
children and adolescents." Obes Rev. 9 (6): 548-559.
Livingstone, M. B., A. M. Prentice, et al. (1990). "Accuracy of weighed dietary
records in studies of diet and health." BMJ. 300 (6726): 708-712.
Livingstone, M. B. and P. J. Robson (2000). "Measurement of dietary intake in
children." Proc Nutr Soc. 59 (2): 279-293.
Livingstone, M. B., P. J. Robson, et al. (2003). "An evaluation of the sensitivity
and specificity of energy expenditure measured by heart rate and the
Goldberg cut-off for energy intake: basal metabolic rate for identifying mis-
reporting of energy intake by adults and children: a retrospective
analysis." Eur J Clin Nutr. 57 (3): 455-463.
382
Livingstone, M. B., P. J. Robson, et al. (2004). "Issues in dietary intake
assessment of children and adolescents." Br J Nutr. 92 (Suppl 2): S213-
222.
Lloyd, L. J., S. C. Langley-Evans, et al. (2010). "Childhood obesity and adult
cardiovascular disease risk: a systematic review." Int J Obes (Lond). 34(1): 18-28.
Lloyd, L. J., S. C. Langley-Evans, et al. (2012). "Childhood obesity and risk of the
adult metabolic syndrome: a systematic review." Int J Obes (Lond). 36 (1):
1-11.
Lobstein, T., L. Baur, et al. (2004). "Obesity in children and young people: a
crisis in public health." Obes Rev. 5 (Suppl 1): 4-104.
Looney, S. M. and H. A. Raynor (2012). "Are changes in consumption of
"healthy" foods related to changes in consumption of "unhealthy" foods
during pediatric obesity treatment?" Int J Environ Res Public Health. 9 (4):
1368-1378.
Lorenc, T., M. Petticrew, et al. (2012). "What types of interventions generate
inequalities? Evidence from systematic reviews." J Epidemiol Community
Health. Aug. 8 [Epub].
Lowry, K. W., B. J. Sallinen, et al. (2007). "The effects of weight management
programs on self-esteem in pediatric overweight populations." J Pediatr
Psychol. 32 (10): 1179-1195.
Lumeng, J. C., V. P. Castle, et al. (2010). "The role of pediatricians in the
coordinated national effort to address childhood obesity." Pediatrics. 126(3): 574-575.
Maffeis, C. (2000). "Aetiology of overweight and obesity in children and
adolescents." Eur J Pediatr. 159 (Suppl 1): S35-44.
Food and Nutrition Board; Institute of Medicine (2010). Bridging the Evidence
Gap in Obesity Prevention: A Framework to Inform Decision Making. The
National Academies Press.
Malik, V. S., B. M. Popkin, et al. (2010). "Sugar-sweetened beverages and risk of
metabolic syndrome and type 2 diabetes: a meta-analysis." Diabetes
Care. 33 (11): 2477-2483.
Malik, V. S., M. B. Schulze, et al. (2006). "Intake of sugar-sweetened beverages
and weight gain: a systematic review." Am J Clin Nutr. 84 (2): 274-288.
383
Mangham, L. J. and K. Hanson (2010). "Scaling up in international health: what
are the key issues?" Health Policy Plan. 25 (2): 85-96.
Manios, Y., G. Moschonis, et al. (2008). "Prevalence and independent predictors
of insulin resistance in children from Crete, Greece: the Children Study."
Diabet Med. 25 (1): 65-72.
Manus, H. E. and M. R. Killeen (1995). "Maintenance of self-esteem by obese
children." J Child Adolesc Psychiatr Nurs. 8 (1): 17-27.
Marmot, M. and R. Bell (2012). "Fair society, healthy lives." Public Health.
126(1): 10.
Marshall, S. J. (2009). "Dropping the ball and picking up fat: youth physical
activity, body fatness, and the conundrum of causality." Am J Prev Med.
37 (1): 84-86.
Martinez, J. A., P. Cordero, et al. (2012). "Interplay of early-life nutritional
programming on obesity, inflammation and epigenetic outcomes." Proc
Nutr Soc. 71 (2): 276-283.
Mason, C. and P. T. Katzmarzyk (2009). "Effect of the site of measurement of
waist circumference on the prevalence of the metabolic syndrome." Am J
Cardiol. 103 (12): 1716-1720.
Mason, C. and P. T. Katzmarzyk (2009). "Variability in waist circumference
measurements according to anatomic measurement site." Obesity (Silver
Spring). 17 (9): 1789-1795.
Matheson, D. M., J. D. Killen, et al. (2004). "Children's food consumption during
television viewing." Am J Clin Nutr. 79 (6): 1088-1094.
May, C., F. Mair, et al. (2007). "Process evaluation for complex interventions in
primary care: understanding trials using the normalization process model."
BMC Family Practice. 8 (1): 42.
Maynard, L. M., W. Wisemandle, et al. (2001). "Childhood body composition in
relation to body mass index." Pediatrics. 107 (2): 344-350.
McCaffrey, T. A., K. L. Rennie, et al. (2008). "Energy density of the diet and
change in body fatness from childhood to adolescence; is there a
relation?" Am J Clin Nutr. 87 (5): 1230-1237.
McCallum, Z., M. Wake, et al. (2007). "Outcome data from the LEAP (Live, Eat
and Play) trial: a randomized controlled trial of a primary care intervention
for childhood overweight/mild obesity." Int J Obes (Lond). 31 (4): 630-636.
384
McCarthy, H. D. (2006). "Body fat measurements in children as predictors for the
metabolic syndrome: focus on waist circumference." Proc Nutr Soc. 65(4): 385-392.
McCarthy, H. D. and M. Ashwell (2006). "A study of central fatness using waist-
to-height ratios in UK children and adolescents over two decades
supports the simple message- 'keep your waist circumference to less than
half your height'." Int J Obes (Lond). 30 (6): 988-992.
McCarthy, H. D., T. J. Cole, et al. (2006). "Body fat reference curves for
children." Int J Obes (Lond). 30 (4): 598-602.
McCarthy, H. D., S. M. Ellis, et al. (2003). "Central overweight and obesity in
British youth aged 11-16 years: cross sectional surveys of waist
circumference." BMJ. 326 (7390): 624.
McCarthy, H. D., K. V. Jarrett, et al. (2001). "The development of waist
circumference percentiles in British children aged 5.0-16.9 y." Eur J Clin
Nutr. 55 (10): 902-907.
McCarthy, H. D., K. V. Jarrett, et al. (2005). "Trends in waist circumferences in
young British children: a comparative study." Int J Obes (Lond). 29 (2):
157-162.
McGovern, L., J. N. Johnson, et al. (2008). "Clinical review: treatment of pediatric
obesity: a systematic review and meta-analysis of randomized trials." J
Clin Endocrinol Metab. 93 (12): 4600-4605.
Mei, Z., L. M. Grummer-Strawn, et al. (2007). "Do skinfold measurements
provide additional information to body mass index in the assessment of
body fatness among children and adolescents?" Pediatrics. 119 (6):
e1306-1313.
Meichenbaum, D. (1987). "Facilitating treatment adherence: A practitioner's
guidebook."
Misra, A. and L. Khurana (2009). "The metabolic syndrome in South Asians:
epidemiology, determinants, and prevention." Metab Syndr Relat Disord. 7(6): 497-514.
Misra, A. and L. Khurana (2011). "Obesity-related non-communicable diseases:
South Asians vs White Caucasians." Int J Obes (Lond). 35 (2): 167-187.
385
Mitchell, N. G., J. B. Moore, et al. (2012). "Cardiovascular fitness moderates the
relations between estimates of obesity and physical self-perceptions in
rural elementary school students." J Phys Act Health. 9 (2): 288-294.
Molnar, D., K. Torok, et al. (2000). "Safety and efficacy of treatment with an
ephedrine/caffeine mixture. The first double-blind placebo-controlled pilot
study in adolescents." Int J Obes Relat Metab Disord. 24 (12): 1573-1578.
Morrison, A. C. and R. B. Ness (2011). "Sodium intake and cardiovascular
disease." Annu Rev Public Health. 32: 71-90.
Mota, J., L. Flores, et al. (2006). "Relationship of single measures of
cardiorespiratory fitness and obesity in young schoolchildren." Am J Hum
Biol. 18 (3): 335-341.
Mushtaq, M. U., S. Gull, et al. (2011). "Family-based factors associated with
overweight and obesity among Pakistani primary school children." BMC
Pediatr. 11: 114.
Nader, P. R., M. O'Brien, et al. (2006). "Identifying risk for obesity in early
childhood." Pediatrics. 118 (3): e594-601.
Nassis, G. P., K. Papantakou, et al. (2005). "Aerobic exercise training improves
insulin sensitivity without changes in body weight, body fat, adiponectin,
and inflammatory markers in overweight and obese girls." Metabolism. 54(11): 1472-1479.
Nassis, G. P., G. Psarra, et al. (2005). "Central and total adiposity are lower in
overweight and obese children with high cardiorespiratory fitness." Eur J
Clin Nutr. 59 (1): 137-141.
Nassis, G. P. and L. S. Sidossis (2006). "Methods for assessing body
composition, cardiovascular and metabolic function in children and
adolescents: implications for exercise studies." Curr Opin Clin Nutr Metab
Care. 9 (5): 560-567.
Nelson, M., A. E. Black, et al. (1989). "Between- and within-subject variation in
nutrient intake from infancy to old age: estimating the number of days
required to rank dietary intakes with desired precision." Am J Clin Nutr. 50(1): 155-167.
Nelson, T. F., S. D. Stovitz, et al. (2011). "Do youth sports prevent pediatric
obesity? A systematic review and commentary." Curr Sports Med Rep. 10(6): 360-370.
386
Nemet, D., S. Barkan, et al. (2005). "Short- and long-term beneficial effects of a
combined dietary-behavioral-physical activity intervention for the
treatment of childhood obesity." Pediatrics. 115 (4): e443-449.
Ness-Abramof, R. and C. M. Apovian (2008). "Waist circumference
measurement in clinical practice." Nutr Clin Pract. 23 (4): 397-404.
NHLBI (1998). "Clinical Guidelines On The Identification, Evaluation, and
Treatment Of Overweight and Obesity In Adults."
NHLBI (2012). "Choosing Foods for Your Family. GO, SLOW, and WHOA
Foods. Available at: http://www.nhlbi.nih.gov/health/public/heart/obesity/
wecan/eat-right/choosing-foods.htm."
NHMRC (2003). "Dietary Guidelines for all Australians."
NICE (2006). "National Institute for Health and Clinical Excellence (NICE)
guidance. Obesity: the prevention, identification, assessment and
management of overweight and obesity in adults and children. Available
at: http://guidance.nice.org.uk/CG43/guidance/section1/word/English."
NICE (2009). "Methods for the development of NICE public health guidance.
Available at: http://www.nice.org.uk/media/2FB/53/PHMethodsManual
110509.pdf."
NICE (2009). "Promoting physical activity, active play and sport for pre-school
and school-age children and young people in family, pre-school, school
and community settings."
NOO (2010). "Determinants of obesity: child physical activity."
NOO (2011). "Measuring diet and physical activity in weight management
interventions."
NOO (2011). "Obesity and ethnicity."
Nova, A., A. Russo, et al. (2001). "Long-term management of obesity in
paediatric office practice: experimental evaluation of two different types of
intervention." Ambulatory Child Health. 7: 239.
Nowicka, P., A. Pietrobelli, et al. (2007). "Low-intensity family therapy
intervention is useful in a clinical setting to treat obese and extremely
obese children." Int J Pediatr Obes. 2 (4): 211-217.
O'Connor, J., E. J. Ball, et al. (2001). "Comparison of total energy expenditure
and energy intake in children aged 6-9 y." Am J Clin Nutr. 74 (5): 643-649.
387
O'Dea, J. A. (2005). "Prevention of child obesity: 'first, do no harm'." Health Educ
Res. 20 (2): 259-265.
O'Donovan, G., A. J. Blazevich, et al. (2010). "The ABC of Physical Activity for
Health: a consensus statement from the British Association of Sport and
Exercise Sciences." J Sports Sci. 28 (6): 573-591.
Ocke, M. C., N. Larranaga, et al. (2009). "Energy intake and sources of energy
intake in the European Prospective Investigation into Cancer and
Nutrition." Eur J Clin Nutr. 63 (Suppl 4): S3-15.
Oddy, W. H. (2012). "Infant feeding and obesity risk in the child." Breastfeed
Rev. 20 (2): 7-12.
OECD (2011). "Health at a Glance 2011: OECD Indicators, OECD Publishing
(http://dx.doi.org/10.1787/health_glance-2011-en)."
Ogden, C. L., M. D. Carroll, et al. (2012). "Prevalence of obesity and trends in
body mass index among US children and adolescents, 1999-2010."
JAMA. 307 (5): 483-490.
Okely, A. D., C. E. Collins, et al. (2010). "Multi-site randomized controlled trial of
a child-centered physical activity program, a parent-centered dietary-
modification program, or both in overweight children: the HIKCUPS
study." J Pediatr. 157 (3): 388-394.
Olds, T., C. Maher, et al. (2011). "Evidence that the prevalence of childhood
overweight is plateauing: data from nine countries." Int J Pediatr Obes. 6(5-6): 342-360.
Ortega, F. B., J. R. Ruiz, et al. (2010). "Cardiovascular fitness modifies the
associations between physical activity and abdominal adiposity in children
and adolescents: the European Youth Heart Study." Br J Sports Med. 44(4): 256-262.
Oude Luttikhuis, H., L. Baur, et al. (2009). "Interventions for treating obesity in
children." Cochrane Database Syst Rev. 21 (1).
Owens, S., B. Gutin, et al. (1999). "Effect of physical training on total and visceral
fat in obese children." Med Sci Sports Exerc. 31 (1): 143-148.
Patrick, H. and T. A. Nicklas (2005). "A review of family and social determinants
of children's eating patterns and diet quality." J Am Coll Nutr. 24 (2): 83-
92.
388
Pearson, N. and S. J. Biddle (2011). "Sedentary behavior and dietary intake in
children, adolescents, and adults. A systematic review." Am J Prev Med.
41 (2): 178-188.
Pedrosa, C., B. M. Oliveira, et al. (2011). "Markers of metabolic syndrome in
obese children before and after 1-year lifestyle intervention program." Eur
J Nutr. 50 (6): 391-400.
Perusse, L., T. Rankinen, et al. (2005). "The human obesity gene map: the 2004
update." Obes Res. 13 (3): 381-490.
Phan, T. L., M. M. Maresca, et al. (2012). "Does body mass index accurately
reflect body fat? A comparison of anthropometric measures in the
longitudinal assessment of fat mass." Clin Pediatr (Phila). 51 (7): 671-677.
Pietrobelli, A., M. S. Faith, et al. (1998). "Body mass index as a measure of
adiposity among children and adolescents: a validation study." J Pediatr.
132 (2): 204-210.
Plagemann, A. (2006). "Perinatal nutrition and hormone-dependent programming
of food intake." Horm Res. 65 (Suppl 3): 83-89.
Poh, B. K., A. N. Jannah, et al. (2011). "Waist circumference percentile curves
for Malaysian children and adolescents aged 6.0-16.9 years." Int J Pediatr
Obes. 6 (3-4): 229-235.
Popkin, B. M. and P. Gordon-Larsen (2004). "The nutrition transition: worldwide
obesity dynamics and their determinants." Int J Obes Relat Metab Disord.
28 (Suppl 3): S2-9.
Powell, L. M. and B. T. Nguyen (2012). "Fast-Food and Full-Service Restaurant
Consumption Among Children and Adolescents: Effect on Energy,
Beverage, and Nutrient Intake." Arch Pediatr Adolesc Med. Nov 5.1-7
[Epub].
Puhl, R. M. and J. D. Latner (2007). "Stigma, obesity, and the health of the
nation's children." Psychol Bull. 133 (4): 557-580.
Raynor, H. A., E. L. Van Walleghen, et al. (2011). "The relationship between
child and parent food hedonics and parent and child food group intake in
children with overweight/obesity." J Am Diet Assoc. 111 (3): 425-430.
Redfern, J., C. McKevitt, et al. (2006). "Development of Complex Interventions in
Stroke Care." Stroke. 37 (9): 2410-2419.
389
Reilly, J. J. (2005). "Descriptive epidemiology and health consequences of
childhood obesity." Best Pract Res Clin Endocrinol Metab. 19 (3): 327-
341.
Reilly, J. J. (2008). "Physical activity, sedentary behaviour and energy balance in
the preschool child: opportunities for early obesity prevention." Proc Nutr
Soc. 67 (3): 317-325.
Reilly, J. J., J. Kelly, et al. (2010). "Accuracy of simple clinical and
epidemiological definitions of childhood obesity: systematic review and
evidence appraisal." Obes Rev. 11 (9): 645-655.
Reilly, J. J. and Z. C. McDowell (2003). "Physical activity interventions in the
prevention and treatment of paediatric obesity: systematic review and
critical appraisal." Proc Nutr Soc. 62 (3): 611-619.
Reinehr, T. and W. Andler (2004). "Changes in the atherogenic risk factor profile
according to degree of weight loss." Arch Dis Child. 89 (5): 419-422.
Reinehr, T., G. de Sousa, et al. (2006). "Long-term follow-up of cardiovascular
disease risk factors in children after an obesity intervention." Am J Clin
Nutr. 84 (3): 490-496.
Reinehr, T., M. Temmesfeld, et al. (2007). "Four-year follow-up of children and
adolescents participating in an obesity intervention program." Int J Obes.
31 (7): 1074-1077.
Ritchie, L. D. (2012). "Less frequent eating predicts greater BMI and waist
circumference in female adolescents." Am J Clin Nutr. 95 (2): 290-296.
Ritchie, L. D., G. Welk, et al. (2005). "Family environment and pediatric
overweight: what is a parent to do?" J Am Diet Assoc. 105 (5 Suppl 1):
S70-79.
Robertson, W., T. Friede, et al. (2008). "Pilot of "Families for Health": community-
based family intervention for obesity." Arch Dis Child. 93 (11): 921-926.
Robinson, S. M. and K. M. Godfrey (2008). "Feeding practices in pregnancy and
infancy: relationship with the development of overweight and obesity in
childhood." Int J Obes (Lond). 32 (Suppl 6): S4-10.
Robinson, T. N. (1999). "Reducing children's television viewing to prevent
obesity: a randomized controlled trial." JAMA. 282 (16): 1561-1567.
390
Rodriguez, G. and L. A. Moreno (2006). "Is dietary intake able to explain
differences in body fatness in children and adolescents?" Nutr Metab
Cardiovasc Dis. 16 (4): 294-301.
Rokholm, B., J. L. Baker, et al. (2010). "The levelling off of the obesity epidemic
since the year 1999--a review of evidence and perspectives." Obes Rev.
11 (12): 835-846.
Ross, R., T. Berentzen, et al. (2008). "Does the relationship between waist
circumference, morbidity and mortality depend on measurement protocol
for waist circumference?" Obes Rev. 9 (4): 312-325.
Rowlands, A. V., M. R. Stone, et al. (2007). "Influence of speed and step
frequency during walking and running on motion sensor output." Med Sci
Sports Exerc. 39 (4): 716-727.
Rudolf, M., D. Christie, et al. (2006). "WATCH IT: a community based
programme for obese children and adolescents." Arch Dis Child. 91 (9):
736-739.
Rudolf, M. C., D. C. Greenwood, et al. (2004). "Rising obesity and expanding
waistlines in schoolchildren: a cohort study." Arch Dis Child. 89 (3): 235-
237.
Rudolf, M. C., J. Walker, et al. (2007). "What is the best way to measure waist
circumference?" Int J Pediatr Obes. 2 (1): 58-61.
Sacher, P. M., P. Chadwick, et al. (2011). "Evaluating the effectiveness of the
scale-up and spread of the MEND 7-13 childhood obesity program: UK
national data (2007-2010)." Obesity (Silver Spring). 19 (Suppl 1): S52.
Sacher, P. M., P. Chadwick, et al. (2005). "Assessing the acceptability and
feasibility of the MEND Programme in a small group of obese 7-11-year-
old children." J Hum Nutr Diet. 18 (1): 3-5.
Sacher, P. M., M. Kolotourou, et al. (2010). "Randomized controlled trial of the
MEND program: a family-based community intervention for childhood
obesity." Obesity (Silver Spring). 18 (Suppl 1): S62-68.
SACN (2011). "Dietary Recommendations for Energy."
Saelens, B. E., J. F. Sallis, et al. (2003). "Environmental correlates of walking
and cycling: findings from the transportation, urban design, and planning
literatures." Ann Behav Med. 25 (2): 80-91.
391
Sallis, J. F. and K. Glanz (2006). "The role of built environments in physical
activity, eating, and obesity in childhood." Future Child. 16 (1): 89-108.
Salmon, J., K. Ball, et al. (2005). "Reducing sedentary behaviour and increasing
physical activity among 10-year-old children: overview and process
evaluation of the 'Switch-Play' intervention." Health Promot Int. 20 (1): 7-
17.
Sanchez-Bayle, M., M. T. Munoz-Fernandez, et al. (1999). "A longitudinal study
of blood pressure in Spanish schoolchildren. Working Group of
Cardiovascular Risk Factors in Childhood and Adolescence." Arch Dis
Child. 81 (2): 169-171.
Sargent, G. M., L. S. Pilotto, et al. (2011). "Components of primary care
interventions to treat childhood overweight and obesity: a systematic
review of effect." Obes Rev. 12 (5).
Savoye, M., M. Shaw, et al. (2007). "Effects of a weight management program
on body composition and metabolic parameters in overweight children: a
randomized controlled trial." JAMA. 297(24): 2697-2704.
Savva, S. C., M. Tornaritis, et al. (2000). "Waist circumference and waist-to-
height ratio are better predictors of cardiovascular disease risk factors in
children than body mass index." Int J Obes Relat Metab Disord. 24 (11):
1453-1458.
Schmidt, M. D., T. Dwyer, et al. (2011). "Predictive associations between
alternative measures of childhood adiposity and adult cardio-metabolic
health." Int J Obes (Lond). 35 (1): 38-45.
Schoeller, D. A. (2002). "Validation of habitual energy intake." Public Health Nutr.
5 (6A): 883-888.
Schwandt, P., R. Kelishadi, et al. (2008). "First reference curves of waist
circumference for German children in comparison to international values:
the PEP Family Heart Study." World J Pediatr. 4 (4): 259-266.
Schwartz, M. B. and R. Puhl (2003). "Childhood obesity: a societal problem to
solve." Obes Rev. 4 (1): 57-71.
Sealy, Y. M. (2010). "Parents' food choices: obesity among minority parents and
children." J Community Health Nurs. 27 (1): 1-11.
392
Semiz, S., E. Ozgoren, et al. (2007). "Comparison of ultrasonographic and
anthropometric methods to assess body fat in childhood obesity." Int J
Obes (Lond). 31 (1): 53-58.
Senese, L. C., N. D. Almeida, et al. (2009). "Associations between childhood
socioeconomic position and adulthood obesity." Epidemiol Rev. 31: 21-51.
Shalitin, S., L. Ashkenazi-Hoffnung, et al. (2009). "Effects of a twelve-week
randomized intervention of exercise and/or diet on weight loss and weight
maintenance, and other metabolic parameters in obese preadolescent
children." Horm Res. 72 (5): 287-301.
Shelton, D., K. Le Gros, et al. (2007). "Randomised controlled trial: A parent-
based group education programme for overweight children." J Paediatr
Child Health. 43 (12): 799-805.
Shrewsbury, V. and J. Wardle (2008). "Socioeconomic status and adiposity in
childhood: a systematic review of cross-sectional studies 1990-2005."
Obesity. 16 (2): 275-284.
SIGN (2010). "Management of Obesity: A national clinical guideline."
Singh, A. S., C. Mulder, et al. (2008). "Tracking of childhood overweight into
adulthood: a systematic review of the literature." Obes Rev. 9 (5): 474-
488.
Singh, G. K., M. D. Kogan, et al. (2008). "Racial/ethnic, socioeconomic, and
behavioral determinants of childhood and adolescent obesity in the United
States: analyzing independent and joint associations." Ann Epidemiol. 18(9): 682-695.
Skouteris, H., M. McCabe, et al. (2010). "Healthy eating and obesity prevention
for preschoolers: a randomised controlled trial." BMC Public Health. 10:
220.
Slemenda, C. W., J. Z. Miller, et al. (1991). "Role of physical activity in the
development of skeletal mass in children." J Bone Miner Res. 6 (11):
1227-1233.
Sothern, M. S., J. M. Loftin, et al. (2000). "Safety, feasibility, and efficacy of a
resistance training program in preadolescent obese children." Am J Med
Sci. 319 (6): 370-375.
Speiser, P. W., M. C. Rudolf, et al. (2005). "Childhood obesity." J Clin Endocrinol
Metab. 90 (3): 1871-1887.
393
Spencer, S. J. (2012). "Early life programming of obesity: the impact of the
perinatal environment on the development of obesity and metabolic
dysfunction in the offspring." Curr Diabetes Rev. 8 (1): 55-68.
Srinivasan, S., G. R. Ambler, et al. (2006). "Randomized, controlled trial of
metformin for obesity and insulin resistance in children and adolescents:
improvement in body composition and fasting insulin." J Clin Endocrinol
Metab. 91 (6): 2074-2080.
Stabouli, S., S. Papakatsika, et al. (2011). "The role of obesity, salt and exercise
on blood pressure in children and adolescents." Expert Rev Cardiovasc
Ther. 9 (6): 753-761.
Stamatakis, E., J. Wardle, et al. (2010). "Childhood obesity and overweight
prevalence trends in England: evidence for growing socioeconomic
disparities." Int J Obes (Lond). 34 (1): 41-47.
Stamatakis, E., P. Zaninotto, et al. (2010). "Time trends in childhood and
adolescent obesity in England from 1995 to 2007 and projections of
prevalence to 2015." J Epidemiol Community Health. 64 (2): 167-174.
Steele, R. M., E. M. van Sluijs, et al. (2009). "Targeting sedentary time or
moderate- and vigorous-intensity activity: independent relations with
adiposity in a population-based sample of 10-y-old British children." Am J
Clin Nutr. 90 (5): 1185-1192.
Stewart, L., J. Chapple, et al. (2008). "Parents' journey through treatment for
their child's obesity: a qualitative study." Arch Dis Child. 93 (1): 35-39.
Stewart, L., J. Chapple, et al. (2008). "The use of behavioural change techniques
in the treatment of paediatric obesity: qualitative evaluation of parental
perspectives on treatment." J Hum Nutr Diet. 21 (5): 464-473.
Stewart, L., J. Houghton, et al. (2005). "Dietetic management of pediatric
overweight: development and description of a practical and evidence-
based behavioral approach." J Am Diet Assoc. 105 (11): 1810-1815.
Stigman, S., P. Rintala, et al. (2009). "Eight-year-old children with high
cardiorespiratory fitness have lower overall and abdominal fatness." Int J
Pediatr Obes. 4 (2): 98-105.
Strauss, R. S. (2000). "Childhood obesity and self-esteem." Pediatrics. 105 (1):
e15.
394
Summerbell, C. D., V. Ashton, et al. (2003). "Interventions for treating obesity in
children." Cochrane Database Syst Rev. (3): CD001872.
Summerbell, C. D., E. Waters, et al. (2005). "Interventions for preventing obesity
in children." Cochrane Database Syst Rev. 20 (3).
Techakehakij, W. (2011). "The cost-effectiveness of child obesity intervention.
Available at: http://etheses.whiterose.ac.uk/1936/."
Tompkins, C. L., K. Moran, et al. (2011). "Physical activity-induced improvements
in markers of insulin resistance in overweight and obese children and
adolescents." Curr Diabetes Rev. 7 (3): 164-170.
Trabulsi, J. and D. A. Schoeller (2001). "Evaluation of dietary assessment
instruments against doubly labeled water, a biomarker of habitual energy
intake." Am J Physiol Endocrinol Metab. 281 (5): E891-899.
Treadwell, J. R., F. Sun, et al. (2008). "Systematic review and meta-analysis of
bariatric surgery for pediatric obesity." Ann Surg. 248 (5): 763-776.
Tremblay, M. S., A. G. LeBlanc, et al. (2011). "Systematic review of sedentary
behaviour and health indicators in school-aged children and youth." Int J
Behav Nutr Phys Act. 8: 98.
Trout, K. K. and L. Wetzel-Effinger (2012). "Flavor learning in utero and its
implications for future obesity and diabetes." Curr Diab Rep. 12 (1): 60-66.
Trudeau, F., L. Laurencelle, et al. (1999). "Daily primary school physical
education: effects on physical activity during adult life." Med Sci Sports
Exerc. 31 (1): 111-117.
Tschamler, J. M., K. M. Conn, et al. (2010). "Underestimation of children's weight
status: views of parents in an urban community." Clin Pediatr (Phila). 49(5): 470-476.
Tybor, D. J., A. H. Lichtenstein, et al. (2011). "Independent effects of age-related
changes in waist circumference and BMI z scores in predicting
cardiovascular disease risk factors in a prospective cohort of adolescent
females." Am J Clin Nutr. 93 (2): 392-401.
Ulmer, F. C. (1976). "The Hawthorne effect." Educ Dir Dent Aux. 1 (2): 28.
Vamosi, M., B. L. Heitmann, et al. (2010). "The relation between an adverse
psychological and social environment in childhood and the development
of adult obesity: a systematic literature review." Obes Rev. 11 (3): 177-
184.
395
van Stralen, M. M., S. J. te Velde, et al. (2012). "Weight status of European
preschool children and associations with family demographics and energy
balance-related behaviours: a pooled analysis of six European studies."
Obes Rev. 13 (Suppl 1): 29-41.
Viner, R. M., M. M. Haines, et al. (2006). "Body mass, weight control behaviours,
weight perception and emotional well being in a multiethnic sample of
early adolescents." Int J Obes (Lond). 30 (10): 1514-1521.
Wake, M., L. A. Baur, et al. (2009). "Outcomes and costs of primary care
surveillance and intervention for overweight or obese children: the LEAP 2
randomised controlled trial." BMJ. 3 (339).
Wald, A. B. and N. K. Uli (2009). "Pharmacotherapy in pediatric obesity: current
agents and future directions." Rev Endocr Metab Disord. 10 (3): 205-214.
Waling, M., T. Lind, et al. (2010). "A one-year intervention has modest effects on
energy and macronutrient intakes of overweight and obese Swedish
children." J Nutr. 140 (10): 1793-1798.
Wang, F., T. C. Wild, et al. (2009). "The influence of childhood obesity on the
development of self-esteem." Health Rep. 20 (2): 21-27.
Wang, Y. and T. Lobstein (2006). "Worldwide trends in childhood overweight and
obesity." Int J Pediatr Obes. 1 (1): 11-25.
Wang, Y. C., D. S. Ludwig, et al. (2009). "Impact of change in sweetened caloric
beverage consumption on energy intake among children and
adolescents." Arch Pediatr Adolesc Med. 163 (4): 336-343.
Wardle, J. (2005). "Understanding the aetiology of childhood obesity:
implications for treatment." Proc Nutr Soc. 64 (1): 73-79.
Wardle, J. and L. Cooke (2005). "The impact of obesity on psychological well-
being." Best Pract Res Clin Endocrinol Metab. 19 (3): 421-440.
Wardle, J., C. Volz, et al. (1995). "Social variation in attitudes to obesity in
children." Int J Obes Relat Metab Disord. 19 (8): 562-569.
Waters, E., A. de Silva-Sanigorski, et al. (2011). "Interventions for preventing
obesity in children." Cochrane Database Syst Rev. (12): CD001871.
Weigel, C., K. Kokocinski, et al. (2008). "Childhood obesity: concept, feasibility,
and interim results of a local group-based, long-term treatment program."
J Nutr Educ Behav. 40 (6): 369-373.
396
Wells, J. C., W. A. Coward, et al. (2002). "The contribution of fat and fat-free
tissue to body mass index in contemporary children and the reference
child." Int J Obes Relat Metab Disord. 26 (10): 1323-1328.
Wells, J. C., N. J. Fuller, et al. (1999). "Four-component model of body
composition in children: density and hydration of fat-free mass and
comparison with simpler models." Am J Clin Nutr. 69 (5): 904-912.
West, F., M. R. Sanders, et al. (2010). "Randomised clinical trial of a family-
based lifestyle intervention for childhood obesity involving parents as the
exclusive agents of change." Behav Res Ther. 48 (12): 1170-1179.
Whitaker, R. C., J. A. Wright, et al. (1997). "Predicting obesity in young
adulthood from childhood and parental obesity." N Engl J Med. 337 (13):
869-873.
Whitlock, E. P., S. B. Williams, et al. (2005). "Screening and interventions forchildhood overweight: a summary of evidence for the US PreventiveServices Task Force." Pediatrics 116(1): e125-144.
Whitlock, E. A., E. P. O'Connor, et al. (2008). "Effectiveness of weight
management programs in children and adolescents." Evid Rep Technol
Assess (Full Rep). 170: 1-308.
Whitlock, E. P., E. A. O'Connor, et al. (2010). "Effectiveness of weight
management interventions in children: a targeted systematic review for
the USPSTF." Pediatrics. 125 (2): e396-418.
Wilfley, D. E., R. I. Stein, et al. (2007). "Efficacy of maintenance treatment
approaches for childhood overweight: a randomized controlled trial."
JAMA. 298 (14): 1661-1673.
Williams, S. M. and A. Goulding (2009). "Patterns of growth associated with the
timing of adiposity rebound." Obesity (Silver Spring). 17 (2): 335-341.
Williamson, D. A., H. Han, et al. (2011). "Longitudinal study of body weight
changes in children: who is gaining and who is losing weight." Obesity
(Silver Spring). 19 (3): 667-670.
Wilson, C. (2012). "Obesity: Sugar-sweetened beverages-fueling the epidemic of
childhood obesity?" Nat Rev Endocrinol. Dec 8: (12). [Epub].
Woolcock, S. L., S.; Kolotourou, M.; Chadwick, P.; Sacher, P. (2010). "Long term
weight maintenance strategies following initial treatment of childhood
obesity." International Journal of Obesity. 5 (S1): 83.
397
Wright, C. M., A. Sherriff, et al. (2008). "Development of bioelectrical impedance-
derived indices of fat and fat-free mass for assessment of nutritional
status in childhood." Eur J Clin Nutr. 62 (2): 210-217.
Young-Hyman, D., L. J. Herman, et al. (2000). "Care giver perception of
children's obesity-related health risk: a study of African American
families." Obes Res. 8 (3): 241-248.
Young, K. M., J. J. Northern, et al. (2007). "A meta-analysis of family-behavioral
weight-loss treatments for children." Clin Psychol Rev. 27 (2): 240-249.
Zametkin, A. J., C. K. Zoon, et al. (2004). "Psychiatric aspects of child and
adolescent obesity: a review of the past 10 years." J Am Acad Child
Adolesc Psychiatry. 43 (2): 134-150.
Zaninotto, P., H. Wardle, et al. (2006). "Forecasting Obesity to 2010."
Zhang, Y., R. Proenca, et al. (1994). "Positional cloning of the mouse obese
gene and its human homologue." Nature. 372 (6505): 425-432.
Zimmermann, M. B. and I. Aeberli (2008). "Dietary determinants of subclinical
inflammation, dyslipidemia and components of the metabolic syndrome in
overweight children: a review." Int J Obes (Lond). 32 (Suppl 6): S11-18.
398
Appendices
Appendix 1 Other contributions to the field of childhood weightmanagement
Peer-reviewed publications
1. Kolotourou M, Radley D, Chadwick P. Smith L, Orfanos S, Kapetanakis V,
Singhal A, Cole TJ, Sacher PM. Is BMI alone a sufficient outcome to
evaluate interventions for child obesity. Childhood Obesity. 2013:9 (4).
2. Smith LR, Chadwick P, Radley D, Kolotourou M, Gammon C, Rosborough J,
Sacher PM. Assessing the short-term outcomes of a community-based
intervention for overweight and obese children: The MEND 5-7 programme.
BMJ Open. 2013: 3:e002607.
3. Skouteris H, McCabe M, Swinburn B, Newgreen V, Sacher P, Chadwick P.
Parental influence and obesity prevention in pre-schoolers: a systematic
review of interventions. Obesity Reviews. 2011:12(5):315-28.
4. Swain C, Sacher PM. Child obesity: a manageable condition. Nurse
Prescribing. 2009:7(1):14-8.
5. Sacher PM, Wolman J, Chadwick P, Swain C. Mini-MEND: MEND’s early
year’s healthy lifestyle programme for 2-4 year olds and their families. British
Nutrition Foundation. 2008:33:364-7.
6. Wolman J, Skelly E, Kolotourou M, Lawson MS, Sacher PM. Tackling toddler
obesity through a pilot community-based family intervention. Community
Practitioner. 2008:81(1):28-31.
7. Chadwick P, Sacher PM, Swain C. Talking to families about overweight
children. British Journal of School Nursing. 2008:3(6):271-6.
8. Sacher PM, Swain C. The MEND Programme: tackling childhood obesity.
British Journal of School Nursing. 2007(2):4.
399
9. Oldham A, Aylott H, Sacher PM. Mending the growing problem of childhood
obesity. The British Journal of Primary Care Nursing. 2007:4(6):297-9.
10. Sacher PM. Childhood obesity: consequences and control measures.
Journal of Family Health Care. 2005:15.4(S1):4-5.
11. Sacher PM, Chadwick P, Hogan L. The obesity epidemic. Journal of Family
Health Care. 2002:12(4):111.
Selected published abstracts
1. Kolotourou M, Radley D, Smith LR, Orfanos S, Chadwick P, Cole TJ, Sacher
PM. Degree of zBMI Change and Health Benefits in Obese Children
Attending a Community Weight Management Program. Obesity [In press].
2. Sacher PM, Lukeis S, Chadwick P, Kolotourou M, Radley D, Cole TJ,
Singhal A. Evaluating the Effectiveness of the MEND 7-13 Childhood Obesity
Program When Delivered at Scale in Community Settings in Australia and
New Zealand. Obesity [In press].
3. Wilson TA, Laine L, Goodgame G, Adolph AL, Puyau MR, Barlow SE,
Sacher PM, Radley D, Chadwick P, Butte NB. Effectiveness of the MEND
Weight Management Program in Ethnically Diverse Children in the US.
Obesity [In press].
4. Sacher PM, Chadwick P, Kolotourou M, Radley D, Cole TJ, Lawson M,
Lucas A, Singhal A. Evaluating the effectiveness of the scale-up and spread
of the MEND 7-13 childhood obesity program: UK national data (2007-2010).
Obesity. 2011;19 (S1): S52.
5. Byrd-Williams C, Austin DM, Butte NF, Barlow SE, Wilson TA, Sacher PM,
Radley R. Behavioral outcomes following a pilot study to test the USA
version of the Mind, Exercise, Nutrition, Do it! (MEND) program to low
income 7-14 year old obese children. Obesity. 2011; 19 (S1): S107.
6. Wilson TA, Butte NF, Barlow SE, Adolph AL, Houston MP, Sacher PM,
Radley D. Predictors of BMI improvement in Hispanic children participating in
400
Mind, Exercise, Nutrition, Do it! (MEND) weight management program.
Obesity. 2011; 19 (S1): S108.
7. Sacher PM, Chadwick P, Kolotourou M, Radley D, Chipperfield A, Stevenson
A, Cole TJ, Lawson M, Lucas A, Singhal A. From clinical trial to large-scale
community implementation: evaluation of the MEND multicomponent, family-
based, child weight management programme in overweight and obese 7-13
year old children in the United Kingdom. Obesity Reviews. 2010; 11 (S1): 88.
8. Chadwick P, Stevenson A, Radley D, Kolotourou M, Sacher PM.
Improvements in psychological health of overweight children during
community-based weight management in the UK: The MEND 7-13
Programme. Obesity Reviews. 2010; 11 (S1): 290.
9. Woolcock S, Lukeis S, Kolotourou M, Chadwick P, Sacher PM. Long-term
weight maintenance strategies following initial treatment of childhood obesity.
International Journal of Pediatric Obesity. 2010; 5 (S1): 4.
10. Sacher PM, Chadwick P, Kolotourou M, Cole TJ, Lawson M, Lucas A,
Singhal A. Preventing and controlling childhood obesity using a family and
community-based approach. Applied Physiology, Nutrition, and Metabolism.
2009; 34 (2).
11. Kolotourou M, Chadwick P, Cole TJ, Lawson M, Singhal A, Sacher PM. The
MEND Programme: national effectiveness data. Obesity Facts. 2009: 2 (S2).
12. Sacher PM, Chadwick P, Kolotourou M, Cole TJ, Lawson MS, Singhal A.
The MEND Trial: Sustained Improvements on Health Outcomes in Obese
Children at One Year. Obesity. 2007; 15: A92.
13. Sacher PM, Kolotourou M, Chadwick P, Singhal A, Cole TJ, Lawson M. The
MEND Programme: effects on waist circumference and BMI in moderately
obese children. Obesity Reviews. 2007; 8: 7-16: 12.
14. Sacher PM, Chadwick P, Kolotourou M, Cole TJ, Lawson M, Singhal A. The
MEND RCT: Effectiveness on Health Outcomes in Obese Children.
International. Journal of Obesity. 2007; 31: S1.

401
15. Sacher PM, Kolotourou M, Chadwick P, Singhal A, Cole TJ, Lawson M. The
MEND Programme: effectiveness on health outcomes in obese children.
Obesity Reviews. 2006; 7 (S2): 89.
16. Sacher PM, Kolotourou M, Chadwick P, Singhal A, Cole TJ, Lawson M. Is
the MEND Programme effective in improving health outcomes in obese
children? International Journal of Obesity. 2006; 30 (2): S41.
17. Sacher PM, Gray C, Lawson M. The MEND Programme is effective in
reducing glycaemic load, total energy intake and waist circumference in a
small group of obese 7-11 year old children. Obesity Reviews. 2005: S6 (1):
410: 121.
18. Sacher PM, Hogan L, Chadwick P, Lawson M. An integrated programme of
nutrition, exercise and behavioural modification in a small group of obese 7-
11 year old children. Proceedings of the Nutrition Society. 2003: 62 (OCA/B):
3A.
Manuals and books
1. Paul Sacher and Paul Chadwick. The MEND 7-13 theory leader’s manual.
Editions 1 – 7. 2001 – 2012.
2. Julia Wolman, Paul Chadwick and Paul Sacher. The MEND 2-4 theory
leader’s manual. 2008.
3. Paul Sacher. From Kid to Superkid. September 2005. Vermillion.
4. Gina Ford and Paul Sacher. The contented child’s food bible. The complete
guide to feeding 0-6 year olds. 2004. Vermilion.
5. Karmel A, Sacher PM. Superfoods for Babies and Children. 2001. Ebury
Press.

402
Scientific presentations
2013
1. Invited speaker. Canadian Obesity Network Conference. 1st May. Canada
2012
1. Invited speaker. Obesity 2012 Conference. 24th October. UK.
2. Oral presentation. The Obesity Society Conference. 23rd September. USA.
3. Invited speaker. Industry Nutrition Strategy Group. 12th June. UK.
4. Invitation to give oral evidence. Academy of Royal Medical Colleges obesity
review oral evidence session. 31st May. UK.
5. Invited speaker. Association of Children’s Hospitals and Related Institutions
(NACHRI) FOCUS on a Fitter Future III Conference. 23rd February. USA.
6. Invited speaker. The Partnership Overweight Netherlands (PON)
Conference. 17th February. Netherlands.
2011
1. Oral presentation. International Diabetes Conference. 7th December. UAE
2. Invited speaker. International Action on Wellness Symposium. 10th October.
Canada.
3. Oral presentation. The Obesity Society Conference. 2nd October. USA.
4. Invited speaker. British Dietetic Conference. 9th May. UK.
5. Invitation to provide oral evidence. House of Lords Behaviour Change
Enquiry. 18th January. UK.

403
2010
1. Oral presentation. International Congress on Obesity. 9th July. Sweden.
2. Invited speaker. Pediatric Satellite of the International Congress on Obesity.
8th July. Sweden.
3. Invited speaker. Childhood Health – Fit for the Future. 26th May. UK
4. Invited speaker. Oxford Health Alliance Summit. 19th April. India.
5. Invited speaker. CMACE/Royal College of Obstetricians Conference. 19th
March. UK.
2009
1. Invited Speaker. Health and Wellbeing in Education Conference. 10th
November. UK.
2. Oral presentation. The Obesity Society Conference. 26th October. USA.
3. Invited speaker. National Obesity Forum Conference. 4-5th October. UK.
4. Oral presentation. Canadian Obesity Network Summit. 9th May. Canada.
5. Invited Speaker. Calgary University. 4th May. Canada.
6. Invited speaker. Oxford University. 11th March. UK.
2008
1. Invited speaker. National Obesity Forum. West Midlands Regional Meeting.
12th November. UK.
2. Invited Speaker. Holyrood Child Obesity Conference. Edinburgh. 10th
November. Scotland.

404
3. Invited Speaker. 4th Annual Healthy Eating in Schools Conference. 29th
October. UK.
4. Invited Speaker. The Obesity Epidemic. Opportunities and Challenges in the
North West. Association for the Study of Obesity. 14th July. UK.
5. Invited Speaker. Public Policy Exchange. Children’s services national
conference: delivering the 2020 vision for children, young people and
families. 18th June. UK.
6. Invited Speaker. National Obesity Forum Obesity Network Meeting. 17th
June. UK.
7. Invited Speaker. British Medical Association. 175th Anniversary Conference.
11th June. UK.
8. Invited Speaker. Westminster Briefing. The new plan for children: delivering
excellence, equity, health and happiness. 21st May. UK.
2007
1. Invited Speaker. British Nutrition Foundation 40th Anniversary
Conference. 6th December. UK.
2. Invited Speaker. BDA Paediatric Group Study Day. 29th November. UK.
3. Invited Speaker. Westminster Diet & Health Forum. Toddlers Diets. 27th
November. UK.
4. Invited Speaker. Royal Society of Medicine. 22nd November. UK.
5. Invited Speaker. National Obesity Forum Conference. 15th October. UK.
6. Invited Speaker. Sainsbury’s Health Event. 11th October. UK.
7. Invited Speaker. Primary Care Live Conference. 10th October. UK.
8. Invited Speaker. 3rd Annual Obesity Conference. 25th June. Belgium.

405
9. Invited Speaker. European Congress on Obesity. 23rd April. Hungary.
10. Invited Speaker. UK Public Health Association. 28th March. UK.
Awards and bursaries
2011 British Dietetic Association: Rose Simmonds Award.
2010 Finalist (on behalf of MEND) Chief Medical Officer’s Public Health
Awards.
2003 Department of Health Nursing and Allied Health Professions
(NIHR) – Researcher Development Award.
2002 British Dietetic Association Nutrition Educational Award.
2001 Great Ormond Street Hospital for Children NHS Trust - Michael
Samuelson Bursary.
406
Appendix 2 MEND feasibility trial peer-reviewed publication
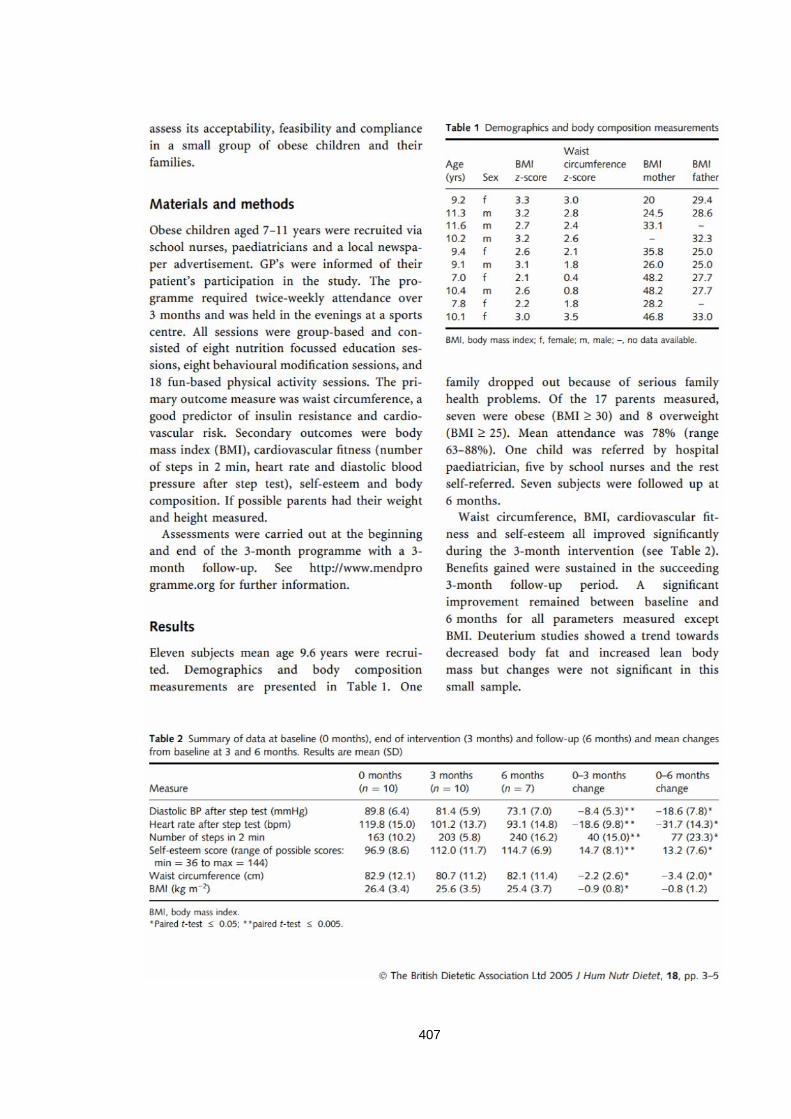
407
408
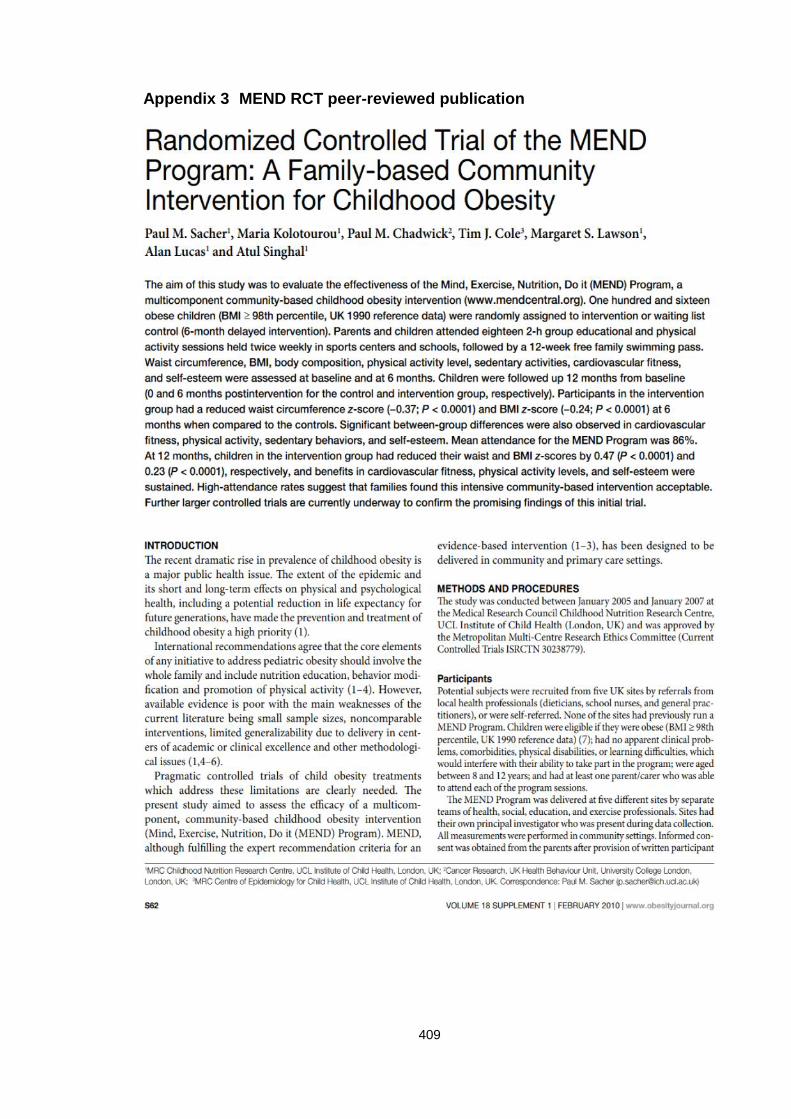
409
Appendix 3 MEND RCT peer-reviewed publication
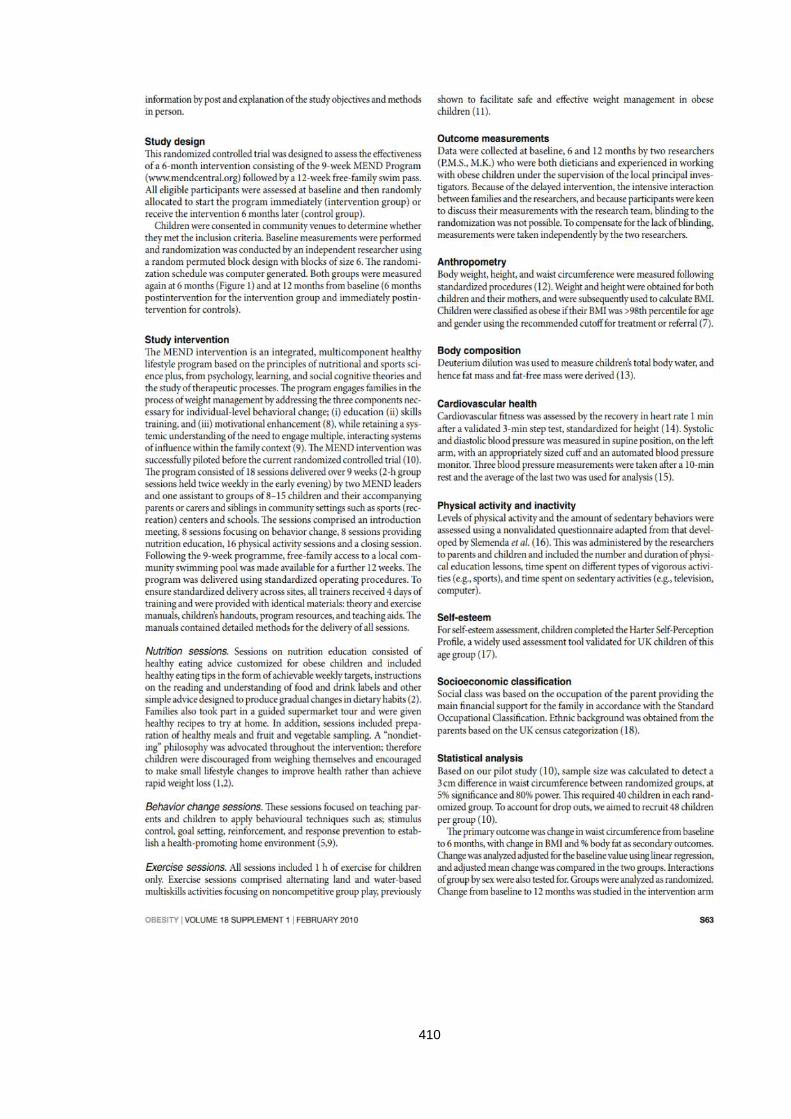
410
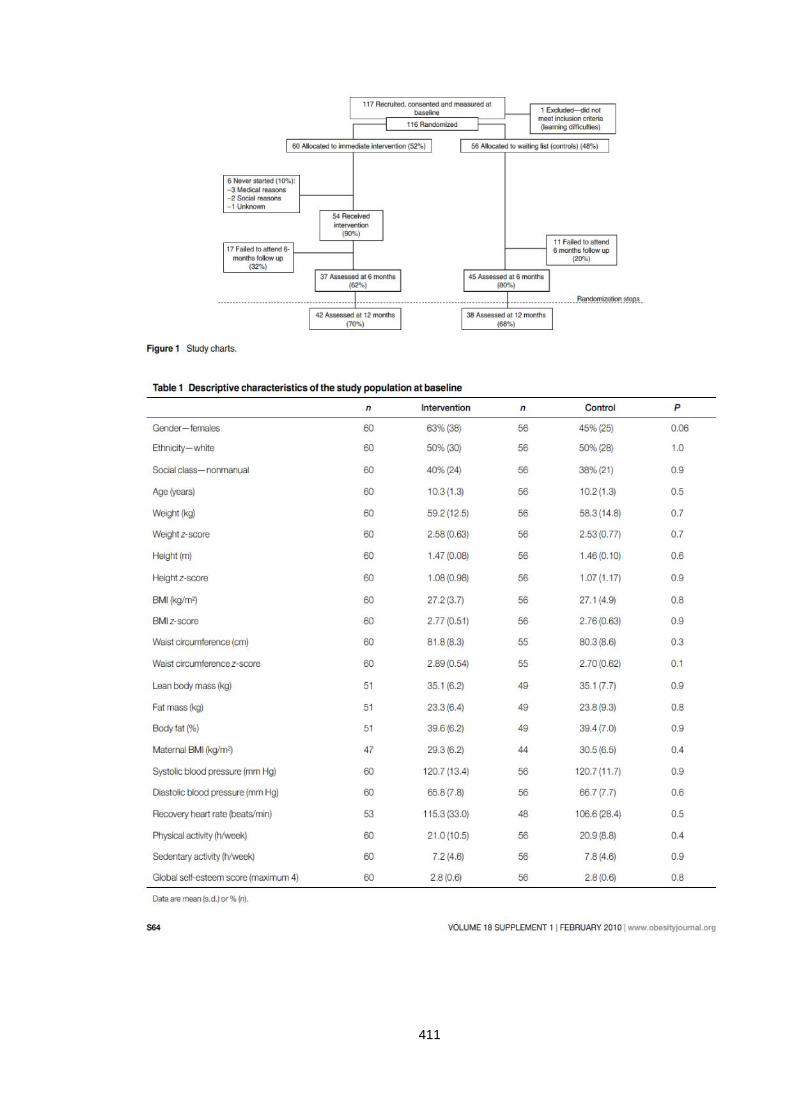
411
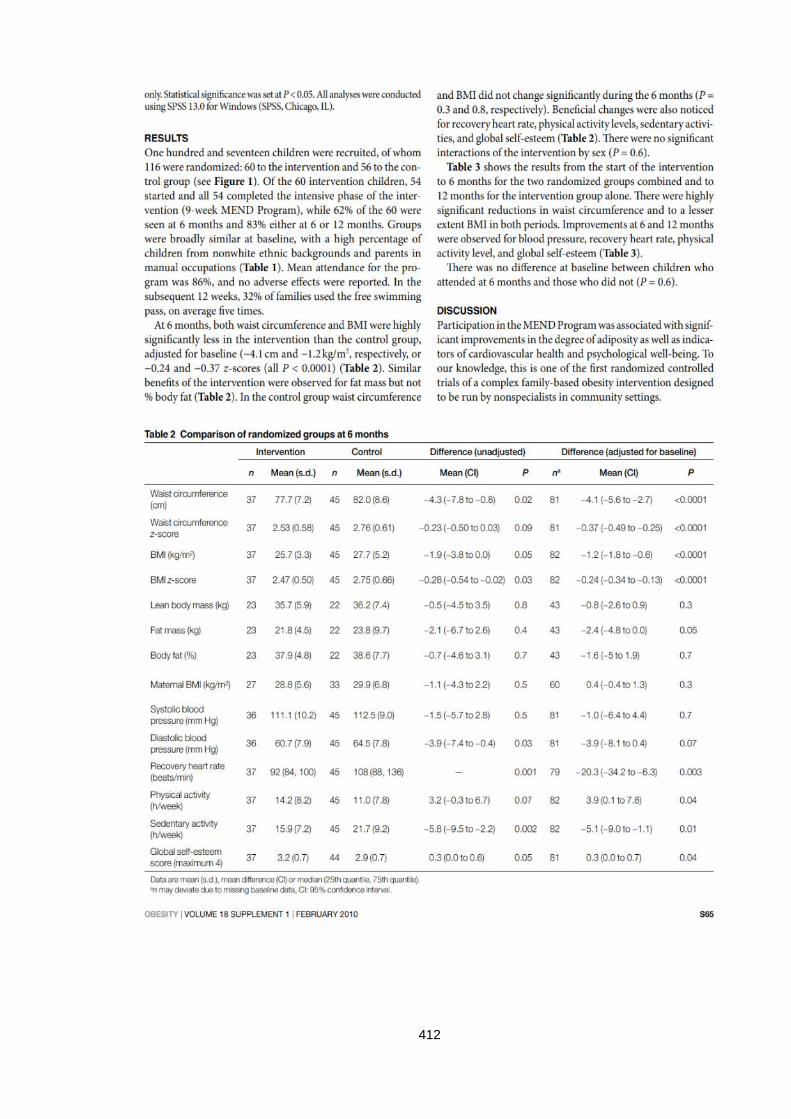
412
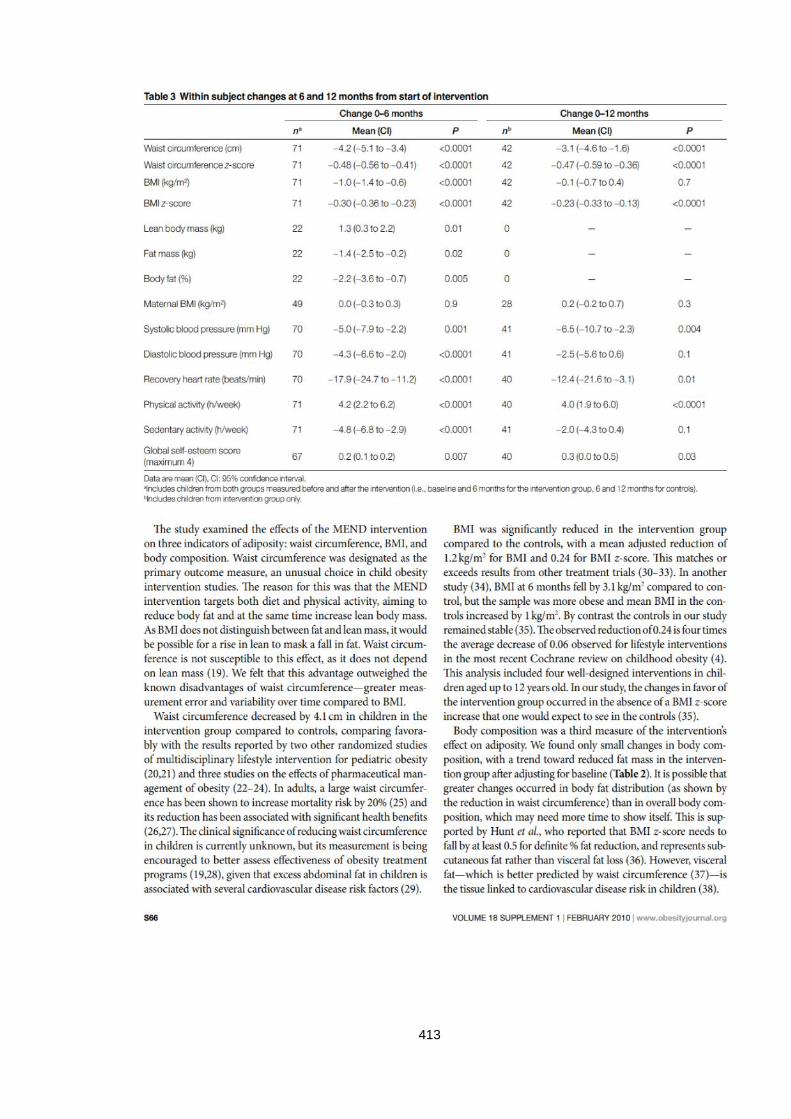
413
414
415

416
Appendix 4 Parent and child information sheets
Parent Information Sheet
The Study
Title of study
Improving health in overweight children – the MEND study.
You and your child are being invited to take part in a research study. Before you bothdecide it is important for you to understand why the research is being done and what itwill involve. Please take time to read the following information carefully and discuss itwith others if you wish. Ask us if there is anything that is not clear or if you would likemore information. Take time to decide whether or not you and your child wish to takepart. Thank you for reading this.
What is the purpose of this study?
MEND stands for Mind, Exercise, Nutrition and Diet and is a lifestyle programmedesigned to improve health and fitness. The purpose of this research is to allow us tostudy the effects of the programme on your child’s health and fitness.
To obtain the best results you and your child will need to attend regular sessions. Thesessions are designed to be fun and easy to understand. They are meant to help youand your child to make small, gradual changes in the types of foods you eat and theamounts of exercise you do. The study will last for one year.
Why have I been chosen?
You and your child have either been referred by a health professional (e.g. GP, schoolnurse or dietitian) who thinks your child may benefit from taking part in this study or youmay have contacted us after seeing our newspaper or website advertisement.
Do I have to take part?
It is up to you and your child to decide whether or not to take part. If you do decide totake part you will be asked to sign a consent form but you are still free to withdraw fromthe study at any time and without giving a reason. A decision to withdraw at any time, ora decision not to take part, will not affect the standard of care you receive.

417
What do I have to do?
You will need to attend twice a week in the evenings (5-7pm) for 3 months, with aweek’s break in the middle for half-term. This works out to 18 visits in total (please seetable on following page). There will be an exercise session at each visit, which willtake place either in a swimming pool or in an exercise studio. Children who cannot swimwill not be excluded. All swimming sessions will be monitored by qualified lifeguards anda MEND team member will be present at all times. At the end of the evening visits youwill be given a further 3 months of free access to your local leisure centre. It is up toyou how many times you visit the leisure centre (note: visits will be recorded by theleisure centre).
Children can eat as much as they like as this is not a diet, but rather we guide them tomake healthy decisions on the foods that they choose to eat. It is important that onceyou have joined the study, you participate in all sessions until the end. This ensures thebest chance of obtaining a good result for you and your child.
What happens at each session?
The table below lists all the sessions and describes what happens at each one.
Session Week Description of content
1 1 Meet the trainers, find out what happens at each session, learnsafety rules and procedures, fun-based educational and exerciseactivity.
2 2 Introduction to the MEND food guidelines.
3 (P) 2 Learn some basic concepts to help you motivate your child toachieve healthy goals.
4 3 How to eat healthy foods that help keep blood sugar levels constant.
5 (C) 3 Children learn to set goals to combat unhealthy eating habits.
6 4 Learn about the harmful effects of eating foods that are high in fatsand sugars and practical ways to improve the diet.
7 (P) 4 Learn how to modify factors that cause children to eat unhealthily.
8 5 Learn how to read food labels and identify at a glance whether afood is healthy.
9 (P) 5 Learn which of your behaviours, may be preventing your child fromachieving their goals.

418
Half-term break
10 7 We demonstrate healthy alternatives for mealtimes and give lots ofsuggestions of foods to buy.
11 (P) 7 Learn how feelings of hunger and cravings can cause children toovereat.
12 8 Supermarket tour. Practice choosing healthy foods off the shelf.
13 8 A game-based session designed to teach children to identify whatfactors cause them to overeat.
14 9 Learn how to prepare healthy meals as a family.
15 9 Group discussion to allow trainers to solve individual problems.
16 10 Learn how to follow MEND guidelines at the most tempting of timese.g. birthday parties, holidays, eating out and at school.
17 10 The group will explore how low self-esteem can prevent childrenfrom achieving their potential.
18 11 Summing up and farewells. Presentation of certificates ofachievement.
(P) = parents only (C) = children only
What will happen to me if I take part?
In order to be able to tell how effective the MEND programme is, we need to makecomparisons. Children will be put into one of two groups and compared. The groups areselected by a computer which has no information about you or your child – i.e. byrandom selection. The only difference between the two groups is that one group will waitapproximately 6 months before starting the programme. The reason for doing this is tocompare children on the programme with those not attending yet. All families will startthe programme within one year of agreeing to participate.
In order for us to evaluate the programme we need to do the followingmeasurements:
a) We will measure your child’s weight, height and waist size.b) We will perform a measurement of body fat using a very low level electrical current
(that can’t be felt), passed between electrodes placed on the hand and foot. Thetest is harmless and painless and used at health clubs.
c) Measure the amount of water in your child’s body. This measurement involvesdrinking some water containing heavy hydrogen molecules. These molecules arenot radioactive, they simply weigh more than most hydrogen molecules and they

419
occur naturally in all of us. Before and after the drink your child will be asked toprovide a saliva sample using chewable cotton wool.
d) To assess your child’s level of physical fitness your child will be asked to step onand off a low bench for 3 minutes and have their heart rate and blood pressuremeasured.
e) You and your child will be asked to fill in some questionnaires which examine self-esteem and behaviour at mealtimes and during physical activity.
f) We will ask you to complete a food diary at home which involves writing downeverything your child eats and drinks for 3 days. We will explain exactly how to dothis.
g) Children above the age of 9 years will be asked to assess their stage of puberty(physical maturity) using pictures as a guide. A room where they can do this inprivate will be provided. Children will be asked to put their completed questionnaireinto an envelope and then seal the envelope. Children will not be asked to undressand the information collected will be strictly confidential and not known to the peopledoing the measurements (optional).
h) We will also collect a DNA sample by rubbing the inside of your child’s cheek withcotton wool. This sample will be used to look at genes and the effect of losingweight. The sample may be stored to look at the effect of genes on obesity andcardiovascular disease. All tests will not have any relevance to you or your child’shealth.
These measurements will be done 4 times in total at 0, 3, 6 and 12 months. All thesemeasurements have no harmful, adverse or side effects and will all take place atLadywell Leisure Centre, 261 Lewisham High Street, Lewisham, London, SE136NJ.
What are the alternatives for treatment?
If you decide not to participate in the study, you may wish to discuss other options withyour GP. These may include seeing a dietitian, doing regular exercise, being referred toa hospital obesity clinic or being put on a diet.
What are the side effects of any treatments received when taking part?
There are no expected side effects of any of the treatments or measurements.
What are the possible disadvantages and risks of taking part?
There are no foreseeable disadvantages or risks in participating in this study.
What are the possible benefits of taking part?
We hope that the MEND programme will help you. However, this cannot beguaranteed. The information we get from this study may help us to treat future

420
overweight patients better. Our small pilot study suggested that the programmebenefits body fat, general health, fitness and self-esteem.
What if new information becomes available?
Sometimes during the course of a research project, new information becomes availableabout the treatment that is being studied. If this happens, a researcher will tell you aboutit and discuss with you whether you want to continue in the study. If you decide towithdraw the researcher will make arrangements for your care to continue. If you decideto continue in the study you will be asked to sign an updated consent form. Also, onreceiving new information the researcher might consider it to be in your best interest towithdraw you from the study. He will explain the reasons and arrange for your care tocontinue.
What happens when the research study stops?
You will receive a letter summarising the findings of the study once the results havebeen analysed and you will also be notified when the results are first published in amedical journal. You will be able to refer to the MEND website for up to date information.
What if something goes wrong?
This research has been approved by an independent Research Ethics Committee whichbelieves that it is of minimal risk to your child. However, research can carry unforeseenrisks and we want you to be informed of your rights in the unlikely event that any harmshould occur as a result of taking part in this study.
This research is covered by a no-fault compensation scheme which may apply in theevent of any significant harm resulting to you or your child from involvement in the study.Under this scheme it would not be necessary for you to prove fault. You also have theright to claim damages in a court of law. This would require you to prove fault on the partof the researchers.
Will my taking part in this study be kept confidential?
All information that is collected about you and your child during the course of theresearch will be kept strictly confidential. Any information about you which leaves theLeisure Centre or research site will have your name and address removed so that youcannot be recognised from it. Regulatory authorities will have access to the studyrecords.

421
If your child is found to be suitable for the study it will be necessary for us to write toyour child’s GP. We will inform the GP of your child’s participation in the study. If the GPdoes not feel they are suitable for the study, then they will not be able to attend theprogramme. If we find your child to be unsuitable then we would also like to notify yourG.P. We will always ask your permission first before contacting your child’s G.P.
What will happen to the results of the research study?
The results of this research will be published in a medical journal. It is possible that theresults of this study may attract media interest; however, you or your child will not beidentified in any report or publication or website. After the conclusion of the study, wemay want to contact you again to see if the changes made during the study haveremained.
Who is organising and funding the research?
The study organiser is the MRC Childhood Nutrition Research Centre, Institute of ChildHealth. The studies sponsors are the Department of Health and Sainsbury’sSupermarkets Ltd. Some of the results of this study will be used as part of a PhDsubmission. Families involved in the study will not be charged for any of the servicesprovided and all travel costs will be reimbursed. Children will receive 2 t-shirts, abackpack and a folder.
Who has reviewed the study?
This project has been reviewed and approved by the Department of Health and hasreceived ethical approval from the Metropolitan Multi-Centre Research EthicsCommittee.
What do I need to do to join the study?
After reading this information, if you and your child would like to participate, then pleasemake an appointment to be assessed for the study (see back page).
Once the assessments are performed, only those children that meet our inclusioncriteria will be recruited for the study. Unfortunately we cannot guarantee inclusion for allchildren.

422
Contact information
For further information, please ring Paul Sacher BSc (Med) Hons RD, Specialist Dietitianon (020) 7905 2258 or email [email protected] or write to The MENDStudy, MRC Childhood Nutrition Research Centre, Institute of Child Health, 30Guilford Street, London, WC1N 1EH.
If you have any complaints about the way in which this research project has been, or isbeing conducted, please, in the first instance, discuss them with Paul Sacher. If theproblems are not resolved, or you wish to comment in any other way, please contact theChairman of the Metropolitan Multi-Centre Research Ethics Committee, by post via theResearch Centre, University Hospital Lewisham, Lewisham High Street, London, SE136LH, or if urgent, by telephone on (020) 8333 3367 and the Committee administratorwill put you in contact with him.
For more information and to see a short movie of the MEND pilot study please seewww.mendprogramme.org. Please retain this copy of the information sheet and youwill also get a copy of the signed consent form to keep.
Thank you for taking the time to read this information sheet.

423
Child Information Sheet
The Project
You are being invited to take part in a project. Take time to decide if you want to say
YES or NO to this. Please read, or have someone read to you, this information. Don’t
worry if you don’t understand it straight away. Your parents have also been told about
this, and you can ask them to help you understand. Thank you for reading this.
Why are we doing this?
We want to see if we can help overweight children to become healthier and fitter by
teaching them about healthy foods and doing fun exercise with them.
Do I have to take part?
It is up to you to decide if you want to take part in the project or not. Even if you
decide to take part, you can still leave the project at any time and you don’t even
have to give us a reason.
What do I have to do?
You will be asked to come to Kirkley Sports College twice a week, for 3 months, with a
break in the middle for half-term. Each time you come we will talk to you and your
parents about healthy foods and you will also get to take part in an exercise class.Some exercise will be indoors and some outdoors (in Summer only). After 3 months you
will be allowed to use a leisure centre for another 3 months.
How can we tell if the programme works?
We will do some measurements to see if the programme works. The measurements will
be done 4 times in one year. None of the measurements are dangerous or hurt:
i) We will weigh you on a scale and measure your height and your waist size.

424
j) We will measure your body fat using a machine that is often used in gyms. It
is completely harmless and you don’t feel a thing.
k) We will ask you to drink a small amount of special water (looks and tastes
like water) which is also completely harmless. We will ask you to roll a piece
of cotton wool in your mouth to collect some spit and this will help us to work
out how much fat is in your body.
l) We will see how many times you can step on and off a low step in 3minutes and measure how fast your heart beats and also your blood
pressure.
m) We will ask you and your parent to answer some questions.n) We will also ask you and your parent to write down everything you eat and
drink for 3 days.
o) If you are over 9 years old, we will ask you to fill in another questionnaire
which tells us how developed your body is. This will be done in a private
room and then put in a sealed envelope so nobody can see. You will not be
asked to undress. You do not have to do this if you do not want to.
p) We will collect a sample of your genes by rubbing inside of your cheek with
some cotton wool. This will help us to study how genes affect your weight.Is anything dangerous?
None of the treatments or measurements are dangerous.
Who will know about me taking part?
The people doing the research will know about you and we will also need to let your GP
know that you are taking part. We will ask your permission first before writing to your
GP. Nobody else will know you have taken part.
Who can I speak to if I have any questions?
You can speak to your parents who have also been given information about this project.
One of the dietitians involved is Paul Sacher. You and your parents can always speak to
him if you have any more questions. If you would prefer to speak to someone other than
the MEND team or your parents, then you can call Louise Diss who is a counsellor on
01279 866010 or email her on [email protected] (Toast stands for The
Obesity Awareness and Solutions Trust). All calls are anonymous and confidential. Your
parents also have some further contact details of people to speak to if they have any
complaints or worries.

425
Contact information
Paul Sacher, Dietitian on (020) 7905 2806 or email [email protected] or
write to The MEND Project, MRC Childhood Nutrition Research Centre, Institute ofChild Health, 30 Guilford Street, London, WC1N 1EH.
To see a short movie of other children doing the MEND programme please see
www.mendprogramme.org.
Please keep this copy of the information sheet and you will also get a copy of the signed
form to keep.
Thank you for taking the time to read this information sheet.

426
Appendix 5 Consent form

427
Appendix 6 Assent form
428
Appendix 7 GP notification form (inclusion)

429
Appendix 8 Weight and height SOP
The Mend Study
Standard operating procedures for measuring weight and height
Weight (digital scales)
1. Operator checks that electronic scales are on level firm surface, away fromany encumbrances and reading is zero.
2. Subject removes shoes and outer clothing, stands on centre of scales,keeping still, facing forwards and hands at sides.
3. Operator records measurement in kilograms to 2 decimal places.
Height (wall-mounted stadiometer)
1. Subject removes shoes and outer clothing. Subject stands straight with
(a) feet flat on floor,
(b) back, shoulders, head, buttocks (and calves if backboard reaches)against backboard of stadiometer,
(c) heels against heel plate, and
(d) head in horizontal Frankfurt (orbito-meatal) plane passing throughupper margins of the external acoustic meatuses and the lowermargin of the left orbit.
2. Subject breathes in normally and remains still.
3. Operator places head-plate on top of subject's head and recordsmeasurement in metres to 2 decimal places.
430
Appendix 9 Waist circumference SOP
The Mend Study
Standard operating procedure for waist circumference
Equipment: waist circumference tape measure
Method
1. Subject stands straight.
2. Operator finds the narrowest girth of the waist, usually about 4cm abovethe umbilicus. If this proves to be difficult then the subject may be askedto bend to the side and the operator then identifies the point at which thetrunk folds, and uses this as the landmark.
3. Operator measures, and records, the waist circumference at this pointwith the tape horizontal.

431
Appendix 10 Body composition (deuterium dilution) SOP
The Mend Study
Standard operating procedure for deuterium preparation
1. Labelling of sample tubes and salivettes with subject reference details anddate:
(a) for aliquot of deuterium dose solution; green pen and add ‘dose’
(b) for pre-dose saliva sample; red pen and add ‘pre’
(c) post-dose saliva samples; blue pen and add ‘post’
2. Make up deuterium dose according to body weight:
(a) use a nominal amount of 0.05g stock deuterium oxide (~ 99.9%) perkg body weight
(b) use a nominal amount of 2g water per kg body weight(for example:100g of water and 2.5g deuterium oxide for a 50kg child)
(c) filter the deuterium dosing solution with 0.45 micropore filter.(d) label bottle with subject reference and date.(e) mix well and, using a clean pipette, obtain a sample (approx 1.5mls)
from the middle of the bottle and place in a plain 2ml sample tube andlabel with subject reference (to correspond with dose bottle) and write'dose' (all in green pen). Place in freezer (-20oC).
3. Place the dosing bottle in a plastic bag with a straw and seal.
4. Weigh dosing bottle (in bag with straw), record all details in the DeuteriumLog Book and place bottle in fridge until use.

432
Deuterium Dosing
1. To obtain a saliva sample prior to dosing:
(a) ensure that the subject has had nothing to eat, drink or teethcleaning for at least 30 minutes prior to sampling
(b) tip the cotton swab from the salivette labelled with subject detailsand ‘pre’ in RED pen into the subject’s hand
(c) the swab should be placed in the mouth and moved around, withoutchewing, until wet and then placed back into salivette.
2. The deuterium dosing solution is then drunk by the subjects, through thestraw ensuring that as much as possible is swallowed with no spillage.
3. Place both the bottle and straw in the plastic bag and seal.
4. Record the time when the dose was given and fill in the time on theinstruction sheet indicating when the post-dose sample should be taken (4hours later for subjects of average weight and 5 hours later for obesesubjects).
5. Give instructions to the subjects for recording any fluid intake betweensamples and for collecting the second saliva sample with the sameprocedure as for the pre-dose sample, but with salivette labelled withsubject details and ‘post’ in BLUE pen.
6. Weigh the plastic bag containing dosing bottle and straw, and record.
7. Centrifuge salivettes at 3000 rpm for 8 mins.
8. Using clean pipettes for each sample, place sample in plain 2ml samplepot, appropriately labelled with RED pen for the pre-dose sample andBLUE pen for the post dose sample, and place in freezer. Dispose of used
433
transfer pipettes and salivettes in the yellow biohazard bags in thelaboratory.
Safety Considerations:
Use of laboratory to prepare samples:
Wear appropriate protective clothing whilst working in the laboratory ie, labcoats, latex/vinyl gloves and eye protection. When storing samples in the -70 freezer wear the blue gauntlet gloves provided to protect from the cold.
All samples should remain in sealed plastic bags during transportation tothe lab.
The centrifuge should only be used by staff who have been trained in itsuse with supervision by the lab manager until deemed competent.Balances should be used as necessary to ensure an equal distribution ofweight in the centrifuge.
Deuterium dilution SOP: May 2003.

434
MRC Childhood Nutrition Research Centre
Participant instructions for taking a saliva sample at home
Subject No:
We need you to take a sample of saliva after you get home and post it back tous in the envelope provided.
…….. hours after your deuterium drink, at …..... pm we would like you to takeanother saliva sample in the same way you did the first. Do not eat, drink orclean your teeth for 30 minutes before taking the sample. Move the swabaround your mouth until wet without chewing on it.
It is very important that you take the sample at this time but if it is not possibleit is better that you tell us the time it was taken.
Record here the time you took the sample ………….....
We also need to know how much you drank in the period between the deuteriumdrink and the saliva sample you have taken at home.
Record the number of drinks you have had: ……….... cups
……........ mugs
……........ small glasses
…………. large glasses
……….... cans (330ml)
………....bottles (500ml)
Place the cotton swab in the tube and replace the lid firmly. Put the tube in theplastic bag and seal carefully.
Please return this sheet and the sample in the stamped addressed envelopeprovided as soon as possible.
THANK YOU FOR TAKING PART IN THIS STUDY
435
Appendix 11 Height-specific and rate-specific step test SOP
The Mend Study
Standard operating procedure for height-specific and rate-specific step test
Ensure beforehand that the platform height is calculated for the specific height ofeach child and that the metronome is set correctly.
Calculation of platform height.
1. Hip angle optimum bend is 73o.
2. Platform height = Lf x Subject height (cm) x (1 - cos 73o):
where; Lf. is femur length / stature, and is assumed to be constant (ie verysmall inter-individual variability).
3. Therefore, Platform height = 0.265 x 0.71 x Ht (cm).
Platform height = 0.188Ht (cm)
4. (a) Each gradation on 'Reebok step' = 5cm.
(b) Each gradation on platform inserts = 1.2cm.
5. (a) Platform height adjustment of 5cm = 26.6cm of subject height.
(b) Platform height adjustment of 1.2cm = 6.38cm of subject height.
(c) There are two 0.6cm inserts for adjustment of 3.2cm of subject height
Set metronome.
1. For males; 96 beats per minute.
2. For females; 88 beats per minute.
Step test.
1. Record subjects resting pulse rate for 15 secs.
2. Start metronome.
3. Subject steps up and down at the rate indicated by metronome, making onestep per beat.
4. Time exercise for 3 minutes, ensuring that subject keeps to the middle of thestep for safety and keeps to time.

436
5. Subject stops test and immediately sits down.
6. Record subjects immediate post-exercise pulse rate for 15 secs, starting asnear to as zero time as possible.
7. Subject remains resting for another minute.
8. Record subjects resting pulse rate after one minute for 15 secs, starting asnear to one minute later as possible.
437
Appendix 12 Blood pressure SOP
The MEND Study
Standard operating procedure for Accutorr Plus NIBP with printer(Datascope)(Automated blood pressure monitor)
1. Have subject sit quietly for several minutes before taking the measurement.2. Select the largest cuff that fits the upper arm comfortably.3. Wrap the cuff around the left arm, placing the circular figure immediately
over the brachial artery.4. Switch the machine on with ‘On/Standby’ switch bottom right – 20 second
warm-up.5. Connect the cuff to the tube from the machine.6. Use ‘patient set-up’ to select patient type.7. Ask subject to rest arm on a surface at level of heart.8. Inflate cuff, using ‘Start NIBP’. Cuff will inflate to pre-set pressures for each
patient group.9. If subject is unable to tolerate the inflation – press ‘deflate’ button
immediately.10. After deflation, machine will give readings for Systolic, Diastolic, Mean
arterial pressure (MAP) and Heart rate (HR).11. If on the first inflation the machine is unable to take a measurement, the
Accutorr will automatically re-inflate to a higher pressure.12. Repeat the measurement 3 times at 2 minute intervals.13. Record the average of the last 2 measurements14. At the end of the sequence of measurements print-out the results using
‘print’ button.15. If the pre-set pressures are not suitable for a particular patient group, the
default pre-set pressures can be altered. For further information refer to‘Accutorr Plus Service Manual’
438
Appendix 13 Children’s physical activity questionnaire

439

440
Appendix 14 Children’s self-esteem questionnaire

441

442

443

444
445
Appendix 15 Social data questionnaire

446

447

448
Appendix 16 Ethical approval letter
449

450

451
Appendix 17 Declaration of end of study letter
452
Appendix 18 No-fault compensation insurance cover letter