Embed Size (px)
DESCRIPTION
Bilangan Random
Citation preview

DEDA at ITU Spring 2010
1
Randomisation in Excel and SPSS
Randomisation is a method to “unsystematise” uncontrolled effects. This will diminish the risk of
false conclusions based on biased results, since unsystematic differences, on average, should cancel
out. Thus, randomisation plays an important part in a carefully designed experiment.
Suppose that we have a group of people (participants in our experiment) and that we want to assign
treatment A to one half of the group and treatment B to the other half. Since this should be done
randomly, we need a method for producing this randomness. We could use classical tools such as
throwing a pair of dice or drawing numbers out of a hat, or we could use a more modern approach
such as some computer software with a random number generator. Both Excel and SPSS have such
functions to produce (almost) random numbers. The procedure is quite similar in both programs.
An example situation
For the sake of simplicity, let us assume that we have six participants, and that we want to give
three of them treatment A, while the rest should have treatment B. Since treatment is a factor
(independent variable) in our experiment, it should be represented by a column in the design matrix
(you can think of the design matrix as the spreadsheet in Excel or data sheet in SPSS which contains
all the factors and their values for each trial that we want to run in our experiment).
Random numbers and randomisation in Excel
So, the first step in Excel will be to create a Treatment column. When this is done, we need an extra
column for random numbers. This extra column is just an auxiliary column which we will use to
shuffle the rows (which represent cases or trials) around in a random way. These preparations are
illustrated in Figure 1.
Figure 1. Excel example with one column for treatments and an extra column prepared for random
numbers.

DEDA at ITU Spring 2010
2
Next, a random number should be put in each cell in the Random column. Excel will do this if we
click the Insert Function button (or just enter = in the selected cell to enter the formula mode) and
then enter the function name RAND() (this function, which, by the way, does not need any
arguments between its parentheses, produces random numbers between zero and one). This step is
illustrated in Figure 2.
Figure 2. Using the RAND() function to produce a random number in the first row of the Random
column.
Now that the formula is in place in the first cell of the Random column, we can just highlight this
cell together with the remaining five cells in the column and use the fill function (or just Ctrl+D) to
copy the formula to the remaining cells.
Figure 3. The Random column filled with random numbers.
As default, Excel will automatically recalculate all formulas as soon as we change anything in the
spreadsheet. This may be useful at times, but it also has the effect that new random numbers will be
generated in the Random column each time we change something in the spreadsheet, and we don’t
want that. To fixate the random numbers just generated, select the Formulas tab in the menu bar at
the top and select Manual in the Calculation Options pull-down menu (see Figure 4). Remember:
as long as Excel is in the manual calculation mode, you will have to click the Calculate Now button
every time you want Excel to recalculate your formulas.

DEDA at ITU Spring 2010
3
Figure 4. Choosing the manual calculation option.
The last step of this randomisation procedure is to make use of the generated random numbers to
shuffle the rows (and thereby also the treatments) around in a random manner. Since the numbers in
the cells were put there at random, the rows will be put in a random order if we sort the rows by the
random numbers. To do this, go to the Sort & Filter pull-down menu in the Home tab (whether
you choose Sort Smallest to Largest or Sort Largest to Smallest doesn’t matter). The result is
shown in Figure 5. As you can see, all cases with treatment B happened to end up together, but this
was purely by chance. If we repeat the procedure, we will get another result.
Figure 5. Rows sorted by the random numbers in the Random column.
Now that we have obtained our goal, namely to reorder the treatments randomly, we really don’t
need the Random column any more – it has fulfilled its task (although we might choose to keep it to
be able to control later on that everything was done correctly).
Random numbers and randomization in SPSS
The procedure in SPSS is very similar to that in Excel. The preparation step is exactly the same,
except that the Treatment variable must be defined with more care, as a string variable on a nominal
scale. We don’t need to make a new column for the random numbers, as it will be created later on.
The picture in Figure 6 is almost a copy of the picture in Figure 1. Before we continue, it may be
necessary to activate the random number generator. To do this, select Random Number
Generators from the Transform pull-down menu. In the Random Number Generators dialogue
DEDA at ITU Spring 2010
4
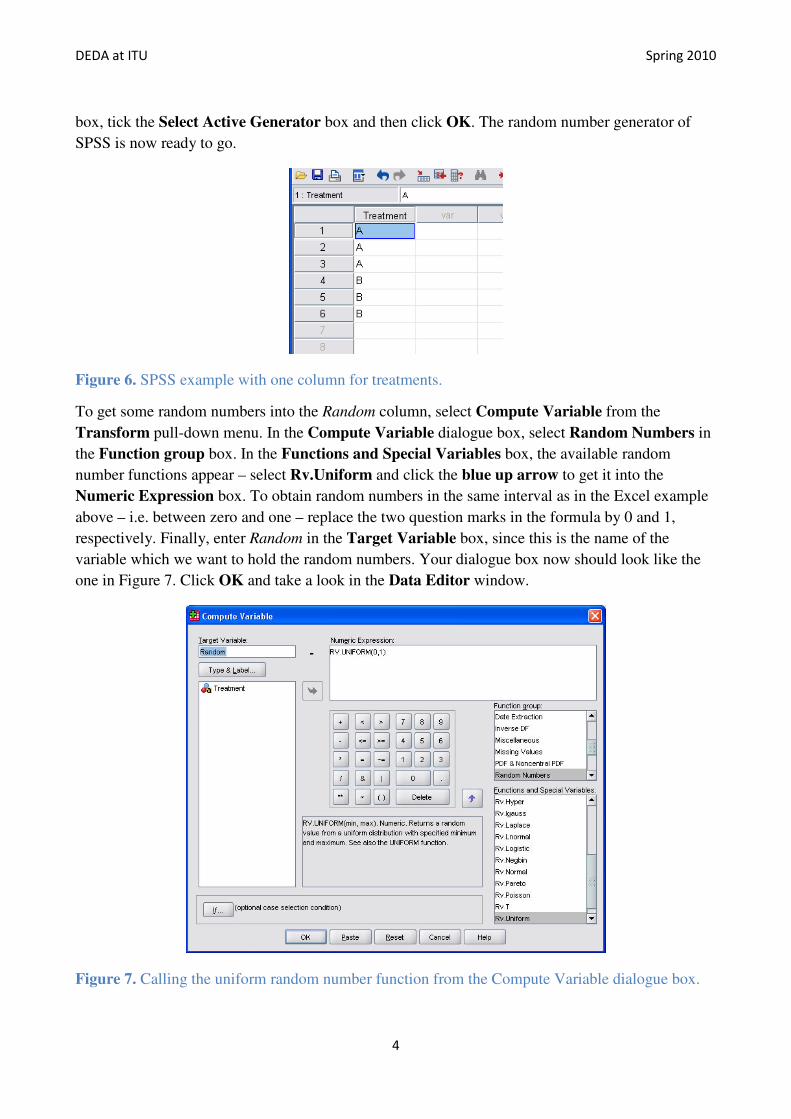
box, tick the Select Active Generator box and then click OK. The random number generator of
SPSS is now ready to go.
Figure 6. SPSS example with one column for treatments.
To get some random numbers into the Random column, select Compute Variable from the
Transform pull-down menu. In the Compute Variable dialogue box, select Random Numbers in
the Function group box. In the Functions and Special Variables box, the available random
number functions appear – select Rv.Uniform and click the blue up arrow to get it into the
Numeric Expression box. To obtain random numbers in the same interval as in the Excel example
above – i.e. between zero and one – replace the two question marks in the formula by 0 and 1,
respectively. Finally, enter Random in the Target Variable box, since this is the name of the
variable which we want to hold the random numbers. Your dialogue box now should look like the
one in Figure 7. Click OK and take a look in the Data Editor window.
Figure 7. Calling the uniform random number function from the Compute Variable dialogue box.

DEDA at ITU Spring 2010
5
In the Data Editor window, you should see something like what you see in Figure 8 (although your
numbers will very likely be different, since they should be random).
Figure 8. A new variable (and corresponding column), called Random, has been created, filled with
random numbers.
As you might guess from the Excel example, it only remains to sort the trials (i.e. the rows) by the
values in the Random column. Right click on the head of the Random column and select Sort
Ascending (actually, whether you choose Sort Ascending or Sort Descending is of no importance
here). The final result for our example is shown in Figure 9.
Figure 9. Rows sorted by the random numbers in the Random column.
As in the Excel example, we really don’t need the Random column any more, now that we have
obtained our goal, but we might as well keep it for the sake of control later on.
Generalising the procedure
The above example situation was kept quite simple for the sake of illustration, but more complex
situations can readily be handled in the same way. The treatment could have more than two levels,
and more than one treatment could be included. Also, what is called a treatment level here could be
a combination of treatment levels in a given order, for instance A = XY and B = YX, just to give an
example (which, by sheer coincidence, resembles the problem of in which order to present the
mouse pads in your mouse experiment).


