Embed Size (px)
Citation preview

1
Identification of Compounds Containing Novel Hydride Ions byNuclear Magnetic Resonance Spectroscopy
Randell L. Mills
Bala Dhandapani
Mark Nansteel
Ji l iang He
Andreas Voigt
BlackLight Power, Inc.
493 Old Trenton Road
Cranbury, NJ 08512
Novel inorganic alkali and alkaline earth hydrides of the formulaMH * , MH2
* , and MH X* wherein M is the metal, X , is a halide, and H *
comprises a novel high binding energy hydride ion were synthesized in ahigh temperature gas cell by reaction of atomic hydrogen with a catalystand MH , MH2 , or MX corresponding to an alkali metal or alkaline ea r th
metal compound, respectively. Novel hydride ions of the correspondingnovel hydride compounds were characterized by an extraordinaryupfield shifted peak observed by 1H nuclear magnetic resonancespectroscopy.

2
INTRODUCTION
Based on the solution of a Schro¨ dinger-type wave equation with anonradiative boundary condition based on Maxwell's equations, Mills [1-31] predicts that atomic hydrogen may undergo a catalytic reaction withcertain atomized elements or certain gaseous ions which singly ormultiply ionize at integer multiples of the potential energy of atomichydrogen, 27 2. eV. For example, potassium atoms ionize at an integermultiple of the potential energy of atomic hydrogen, m eV⋅27 2. . Theenthalpy of ionization of K to K3+ has a net enthalpy of reaction of81.7426 eV, which is equivalent to m = 3 [32]. The reaction involves anonradiative energy transfer to form a hydrogen atom that is lower inenergy than unreacted atomic hydrogen. The product hydrogen atomhas an energy state that corresponds to a fractional principal quantumnumber. Recent analysis of mobility and spectroscopy data of individualelectrons in liquid helium show direct experimental confirmation thatelectrons may have fractional principal quantum energy levels [33]. Thelower-energy hydrogen atom is a highly reactive intermediate whichfurther reacts to form a novel hydride ion. Emission was observedpreviously from a continuum state of Cs2+ and Ar2+ at 53.3 nm and 45 6. nm,respectively [4]. The single emission feature with the absence of theother corresponding Rydberg series of lines from these speciesconfirmed the resonate nonradiative energy transfer of 27 2. eV fromatomic hydrogen to atomic cesium or Ar+ . The catalysis product, alower-energy hydrogen atom, was predicted to be a highly reactiveintermediate which further reacts to form a novel hydride ion. Thepredicted hydride ion of hydrogen catalysis by either cesium atom orAr+ catalyst is the hydride ion H−( )1 2/ . This ion was observed
spectroscopically at 407 nm corresponding to its predicted bindingenergy of 3 05. eV. The catalytic reaction with the formation the hydrideions are given in the Appendix.
Prior studies support the possibility of a novel reaction of atomichydrogen which produces an anomalous discharge and produces novelhydride compounds. Experiments that confirm the novel hydrogenchemistry include extreme ultraviolet (EUV) spectroscopy [2-4, 6-7, 9-17], plasma formation [2-17], power generation [2-3, 5, 10, 31], and
3
analysis of chemical compounds [13, 15-31]. For examples: 1.) Linesobserved by EUV spectroscopy could be assigned to transitions of atomichydrogen to lower energy levels corresponding to lower energyhydrogen atoms and the emission from the excitation of thecorresponding hydride ions [7, 11, 13, 15-17]. 2.) The chemicalinteraction of catalysts with atomic hydrogen at temperatures below1000 K has shown surprising results in terms of the emission of theLyman and Balmer lines [2-17] and the formation of novel chemicalcompounds [13, 15-31]. 3.) An energetic plasma in hydrogen wasgenerated by a catalysis reaction at 1% of the theoretical or prior knownvoltage requirement and with 1000's of times less power input in asystem wherein the plasma reaction was controlled with a weak electricfield [2-3, 10]. 4.) The optically measured output power of gas cells forpower supplied to the glow discharge increased by over two orders ofmagnitude depending on the presence of less than 1% partial pressure ofcertain of catalysts in hydrogen gas or argon-hydrogen gas mixtures [5].5.) A hydrogen plasma formed by reacting a catalyst with hydrogen wasrecorded when there was no electric energy input to the reaction whichconfirms a new chemical source of power [8-9].
Typically the emission of extreme ultraviolet light from hydrogengas is achieved via a discharge at high voltage, a high power inductivelycoupled plasma, or a plasma created and heated to extremetemperatures by RF coupling (e.g. >106 K ) with confinement provided bya toroidal magnetic field. Observation of intense extreme ultraviolet(EUV) emission has been reported at low temperatures (e.g. ≈ 103 K )from atomic hydrogen and certain atomized elements or certain gaseousions [2-17]. The only pure elements that were observed to emit EUVwere those wherein the ionization of t electrons from an atom to acontinuum energy level is such that the sum of the ionization energies ofthe t electrons is approximately m eV⋅27 2. where t and m are each aninteger. Potassium, cesium, and strontium atoms and Rb+ ion ionize atinteger multiples of the potential energy of atomic hydrogen and causedemission. Whereas, the chemically similar atoms, sodium, magnesiumand barium, do not ionize at integer multiples of the potential energy ofatomic hydrogen and caused no emission. An anomalous plasma withhydrogen/potassium mixtures has been reported wherein the plasma
4
decayed with a two second half-life which was the thermal decay time ofthe filament which dissociated molecular hydrogen to atomic hydrogenwhen the electric field was set to zero [8-9]. This experiment showedthat hydrogen line emission was occurring even though the voltagebetween the heater wires was set to and measured to be zero andindicated that the emission was due to a reaction of potassium atomswith atomic hydrogen.
Reports of the formation of novel compounds provide substantialevidence supporting a novel reaction of hydrogen as the mechanism ofthe observed EUV emission and anomalous discharge. Novel hydrogencompounds have been isolated as products of the reaction of atomichydrogen with atoms and ions identified as catalysts in the reported EUVstudies [2-31]. Novel inorganic alkali and alkaline earth hydrides of theformula MH * and MH X* wherein M is the metal, X , is a singlynegatively charged anion, and H * comprises a novel high binding energyhydride ion were synthesized in a high temperature gas cell by reactionof atomic hydrogen with a catalyst such as potassium metal and MH , MX
or MX2 corresponding to an alkali metal or alkaline earth metal
compound, respectively [18, 21]. Novel hydride compounds wereidentified by 1.) time of flight secondary ion mass spectroscopy whichshowed a dominant hydride ion in the negative ion spectrum, 2.) X-rayphotoelectron spectroscopy which showed novel hydride peaks andsignificant shifts of the core levels of the primary elements bound to thenovel hydride ions, 3.) 1H nuclear magnetic resonance spectroscopy(NMR) which showed extraordinary upfield chemical shifts compared tothe NMR of the corresponding ordinary hydrides, and 4.) thermaldecomposition with analysis by gas chromatography, and massspectroscopy which identified the compounds as hydrides [18, 21].
An upfield shifted NMR peak is consistent with a hydride ion with asmaller radius as compared with ordinary hydride since a smaller radiusincreases the shielding or diamagnetism. Thus, the NMR shows that thehydride formed in the catalytic reaction has been reduced in distance tothe nucleus indicating that the electrons are in a lower-energy state.Compared to the shift of known corresponding hydrides the NMRprovides direct evidence of reduced energy state hydride ions. Wereport that novel hydride ions of the corresponding novel hydride

5
compounds of the formula MH * , MH2* , and MH X* were synthesized by a
reaction of potassium or rubidium catalyst and atomic hydrogen. Thecompounds showed extraordinary upfield shifted NMR peaks. Thesynthesis and analysis was shown to be reproducible. Several NMRinstruments at independent centers were used to demonstrate thereproducibility of the unique upfield NMR peaks which corresponded toand identified novel hydride ions.
EXPERIMENTALSynthesis
A series of novel alkali and alkaline earth hydrides and alkalihalido hydrides were synthesized by reaction of atomic hydrogen with acatalyst. The series KH Cl* , KH Br* , and KH I* was synthesized from thecorresponding alkali halide KCl (Alfa Aesar ACS grade 99+%), KBr (AlfaAesar 99.9%), KI (Aldrich Chemical Company 99.9 %) using potassiummetal (Aldrich Chemical Company 99%) as the catalyst. KH * wassynthesized from KH (Aldrich Chemical Company 99%) using potassiummetal as the catalyst. RbH F* was synthesized from RbF (Alfa Aesar99.9%) using potassium metal as the catalyst. RbH I* was synthesizedfrom RbI (Alfa Aesar 99.9%) using rubidium metal (Aldrich ChemicalCompany 99%) which is a catalyst as a hydride having Rb+ . CaH2
* wassynthesized using CaH2 (Alfa Aesar 99.9%) and potassium metal as the
catalyst. In the analytical analyses, each starting compound was alsoused as a control.
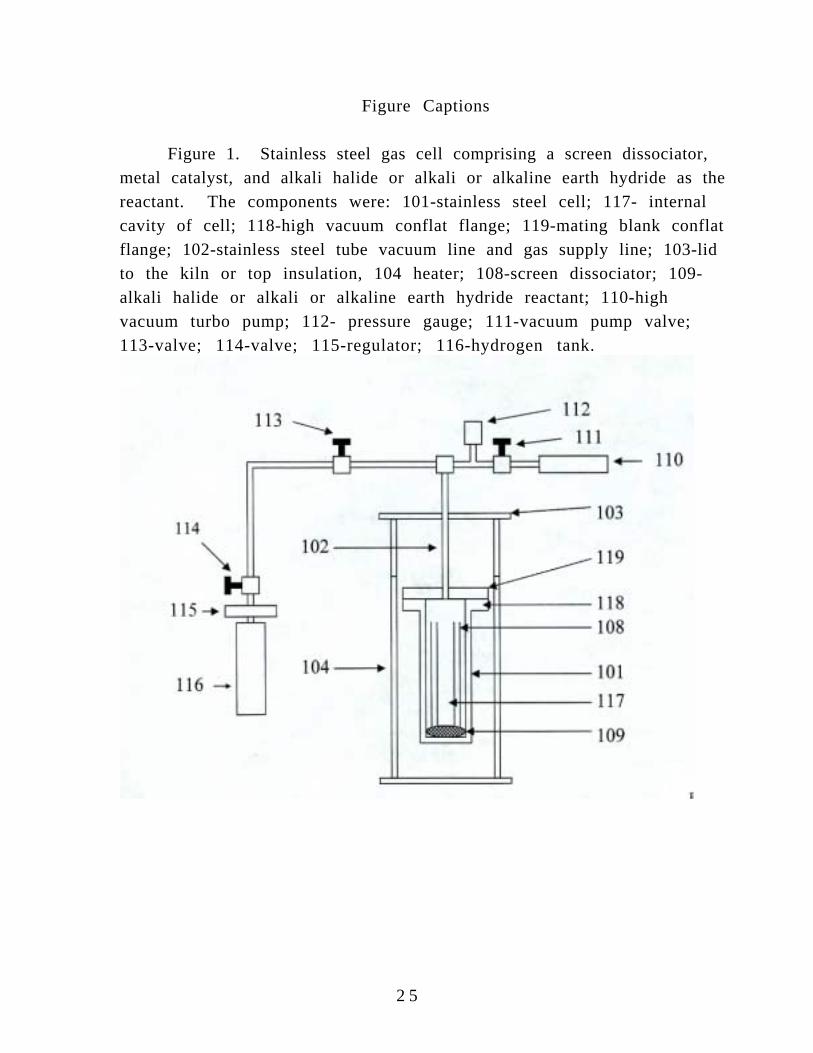
Each compound was prepared in a stainless steel gas cell shown inFigure 1 comprising a Ni screen hydrogen dissociator (Belleville WireCloth Co., Inc.), catalyst, and alkali halide or alkaline earth hydride. The316-stainless steel cell was in the form of a tube having an internalcavity of 375 millimeters in length and 140 millimeters in diameter. Thewall thickness was 6.35 mm. The bottom of the cell was closed by a6.35 mm thick circular plate of 316 stainless steel that was welded tothe cylinder. The top end of the cell was welded to a bored-through 304stainless steel conflat-type flange with 8 in. nominal diameter. A matingblank flange was bolted to the bored-through flange with 20 silver-plated bolts. A flange gasket was silver-plated copper. A 1.27 cm OD

6
tube was welded into a hole at the center of the blank flange. This tubewas closed at one end and extended 20 cm into the reactor, serving as athermowell. A 9.5 mm OD stainless steel tube was welded to the flangeapproximately 4 cm from the flange center. This tube served as thevacuum line from the cell as well as a hydrogen or helium supply line tothe cell.
The reactor was heated in a 10 kW refractory brick kiln (L & L KilnModel JD230). The kiln had three heating zones and a heated floor thatwere each heated by separate radiant elements. The zone temperatureswere independently controlled by a Dynatrol controller. The reactorwas instrumented with 5 type-K thermocouples. Two thermocoupleswere located in the central thermowell at approximately reactor mid-height and at flange-level. Three thermocouples were fixed to theexternal surface of the reactor and were located near the base, at mid-height, and near flange-level. The reactor was connected throughbellows-type valves to a turbo vacuum pump. The vacuum level wasmeasured by a 0 - 100 torr Baratron vacuum gauge. Pressures above100 torr were measured by standard dial-type pressure gauges.Temperature and pressure data was logged to a data acquisition systemat 5 minute intervals.
Approximately 290 g of nickel screen (0.5 mm wire, 2 mm mesh)was placed circumferentially around the reactor inner wall of the cell.In an environmental chamber under argon gas, about 50 mmoles of dryalkali halide or alkaline earth hydride were placed in a stainless steelcrucible on the reactor base. 1 mmole of metallic catalyst was placed ina smaller stainless steel crucible and this crucible was placed in thelarger one with the alkali halide or alkaline earth hydride. The reactorwas sealed and placed in the kiln. The system was evacuated for 2.5hours. The reactor was pressurized with hydrogen gas to a pressure of10 torr and sealed. The kiln was heated to 650 °C at the rate of 300°C/h. The reactor was held at 650 °C for 72 hours. Hydrogen was addedto the system periodically to maintain a pressure level of 10 torr. Thereactor was then evacuated for 1 hour while at 650 °C. The kiln andreactor were cooled to room temperature by forced convection in about2 hours while pumping continued. At room temperature the system wasfilled with helium gas to a pressure of 1.3 bar. The sealed reactor was

7
then opened in the environmental chamber. NMR samples were placedin glass ampules, sealed with a rubber septa, and transferred out of thechamber to be flame sealed in atmosphere.
NMR Spectroscopy1H MAS NMR was performed on solid samples of KH Cl* , KH Br* ,
KH I* , KH * , RbH F* , RbH I* , and CaH2* at Spectral Data Services, Inc.,
Champaign, Illinois. The data was obtained on a custom builtspectrometer operating with a Nicolet 1280 computer. Final pulsegeneration was from a tuned Henry radio amplifier. The 1H NMRfrequency was 270.6196 MHz. A 5 µsec pulse corresponding to a 41°
pulse length and a 3 second recycle delay were used. The window was±20 kHz. The spin speed was 4.0 kHz. (The spin speed was varied toconfirm real peaks versus side bands. The latter changed position withspin speed, the former were independent of spin speed.) The number ofscans was 600. The offset was 1541.6 Hz, and the magnetic flux was6.357 T.
The samples were handled under a inert atmosphere. Chemicalshifts were referenced to external tetramethylsilane (TMS). To eliminatethe possibility that the alkali halide MX influenced the local environmentof the ordinary alkali hydride MH to produce an NMR resonance thatwas shifted upfield relative to MH alone, controls comprising MH and anequimolar MH / MX mixture were run. The reference of each novelhydride comprised the corresponding ordinary hydride MH or MH2
(Aldrich Chemical Company 99%) and equivalent molar mixtures of MH
and MX prepared in a glove box under argon. In the case of thereferences of RbHF and RbH I* , RbH was synthesized by reaction ofrubidium metal (Aldrich Chemical Company 99%) with 2 atmospheres ofhydrogen in the gas cell at 300 °C for 8 hours.
To confirm that the upfield shifted peak of the KH Cl* samples wasreproducible when recorded on different instruments, 1H MAS NMR wasperformed on solid samples of KH Cl* and KH I* at four additionalindependent laboratories The data were recorded on a Bruker DSX-400spectrometer at 400.13 MHz at the National Research Council of Canada,a Bruker DSX-300 spectrometer at 300.132 MHz at the University ofMassachusetts, a Bruker MSL-300 spectrometer at 300.13 MHz at the

8
University of Delaware, and Chemagnetics CMX Infinity 400spectrometer at 359.7539 MHz at Grace Davison.
1H MAS NMR was performed on KH I* (blue crystals) at theNational Research Council of Canada. The data were recorded on aBruker DSX-400 spectrometer at 400.13 MHz. Samples were packed inzirconia rotors and sealed with airtight O-ring caps under an inertatmosphere. The MAS frequency was 4.5 kHz. During data acquisition,the sweep width was 60.06 kHz; the dwell time was 8.325 µsec, and the
acquisition time was 0.03415 sec/scan. The number of scans wastypically 32 or 64. Chemical shifts were referenced to externaltetramethylsilane (TMS). The reference comprised KH (AldrichChemical Company 99%).
1H MAS NMR was performed on solid samples of KH Cl* at theUniversity of Massachusetts. The data were recorded on a Bruker DSX-300 spectrometer at 300.132 MHz. Samples were packed and sealed in5 mm diameter NMR tubes under an inert atmosphere. The sampleswere spun at a MAS frequency of 4.1 kHz. During data acquisition, the90 degree pulse length for a single pulse 1H excitation was 3 4. sec µ ; thesweep width was 147.058 kHz; the dwell time was 5.5 µsec, and the
acquisition time was 0.0139764 sec/scan. The number of scans wastypically 32.
1H MAS NMR was performed on solid samples of KH Cl* and KH I*
(green crystals) at the University of Delaware. The data were recordedon a Bruker MSL-300 spectrometer at 300.13 MHz. Samples werepacked and sealed in 5 mm diameter NMR tubes under an inertatmosphere. The samples were spun at a MAS frequency of 3 kHz.During data acquisition, the 90 degree pulse length for a single pulse 1H
excitation was 4 µsec; the dwell time was 5 µsec, and the acquisition timewas 5120 µsec/scan. The number of scans was typically 540.
1H MAS NMR was performed on solid samples of KH Cl* and KH I*
(blue crystals) at Grace Davison. The data were recorded on aChemagnetics CMX Infinity 400 spectrometer at 359.7539 MHz. Eachsample was packed and sealed in a 4 mm diameter Chemagnetics probeunder an inert atmosphere. The samples were spun at a MAS frequencyof 12 kHz. During data acquisition, the 90 degree pulse length for asingle pulse 1H excitation was 4 0. sec µ ; the spectrum window was ±20 kHz;

9
the dwell time was 50 µsec, the recovery delay was 15 µsec, and theacquisition time was 2930 µsec/scan. The number of scans was typically
1024 .
RESULTS AND DISCUSSION
A. NMR of Potassium Chloro Hydride Sample
The 1H MAS NMR spectra of six KH Cl* samples from independentsyntheses, the control comprising an equal molar mixture of KH andKCl , and the control KH relative to external tetramethylsilane (TMS) areshown in Figures 2A-H, respectively. Ordinary hydride ion has aresonance at 1.1 ppm and 0.8 ppm in the KH / KCl mixture and in KH
alone as shown in Figures 2G and 2H, respectively. The sharp peak at4.3 ppm and the broad peak at 6 ppm shown in Figure 2G are assigned towater in the KCl crystal and to KHCO3 formed from air exposure of K
during sample handling, respectively. The broad peak at 4.6 ppm shownin Figure 2H is assigned KOH formed from air exposure of KH duringsample handling.
The presence of KCl does not shift the resonance of ordinaryhydride as shown in Figure 2G. The resonance at 1.1 ppm which isassigned to ordinary hydride ion was observed in the spectrum of eachKH Cl* sample as shown in Figures 2A-F. The distinct 0.8 and 1.1 ppmresonances could not be resolved if they were present. A large distinctupfield resonance was observed in each case at -4.4 to -4.6 ppm whichwas not observed in either control. The upfield peak in each sample isassigned to a novel hydride ion of KH Cl* .
B. NMR of Potassium Bromo Hydride Sample
The 1H MAS NMR spectra of the KH Br* sample, the controlcomprising an equal molar mixture of KH and KBr , and the control KH
relative to external tetramethylsilane (TMS) are shown in Figures 3A-C,respectively. Ordinary hydride ion has a resonance at 1.1 ppm and 0.8ppm in the KH / KBr mixture and in KH alone as shown in Figures 3B and

1 0
3C, respectively. The additional sharp peaks at 4.3 ppm and 5.9 ppmshown in Figure 3A are assigned to water and KHCO3 formed from air
exposure of K during sample handling. The additional sharp peak at 4.2ppm shown in Figure 3B is assigned to water in the KBr crystals. Theadditional broad peak at 4.6 ppm shown in Figure 3C is assigned KOH
formed from air exposure of KH during sample handling.The presence of KBr does not shift the resonance of ordinary
hydride. The resonance at 1.2 ppm which is assigned to ordinaryhydride ion was observed in the spectrum of the KH Br* sample asshown in Figure 3A. The distinct 0.8 and 1.1 ppm resonances could notbe resolved if they were present. A large distinct upfield resonance wasobserved at -4.1 ppm which was not observed in either control. Thisupfield shifted peak is assigned to a novel hydride ion of KH Br* .
C. NMR of Potassium Iodo Hydride Sample
With an increase of the time of synthesis Mills et al. [18] reportthat a first blue crystalline compound is formed from the reaction ofpotassium catalyst with KI . With an increase in reaction time theproduct becomes increasingly green colored. NMR resonances at -1.209ppm and possibly at -2.5 ppm (See Figure 15) are observed in the case ofthe blue crystals, and the resonance shifts further upfield to -2.5 ppm asthe compound becomes more green colored as shown in Figure 4. TheseNMR results as well as the previously reported [18] liquidchromatography and X-ray photoelectron spectroscopy data support theproduction of two distinct hydride ions with different binding energies.This may be due to the ability of two potassium ions as well as apotassium atom to catalyze atomic hydrogen to different energy statesas shown in the Appendix. In the present study, the NMR was obtainedon blue crystal, light green crystals, and dark green crystals whichformed with a reaction time of progressively longer duration.
The 1H MAS NMR spectra of KH I* samples from separatesyntheses of longer duration relative to external tetramethylsilane (TMS)is shown in Figure 4A-C. Distinguishable upfield resonances wereobserved at -3.2, -2.5, and -1.8 ppm for the dark green crystals, thegreen crystals, and the blue crystals as shown in Figure 4A-C,

1 1
respectively. The upfield peak in each sample is assigned to a novelhydride ion of KH I* . The down field shifted peaks may be ordinaryhydride in a different chemical environment.
The presence of KI does not shift the resonance of ordinaryhydride. Ordinary hydride ion has a resonance at 1.1 ppm and 0.8 ppmin the KH / KI mixture and in KH alone as shown in Figures 4D and 4E,respectively. The additional peaks at 4.5 to 4.6 ppm are assigned toKOH formed from air exposure of KH during sample handling.
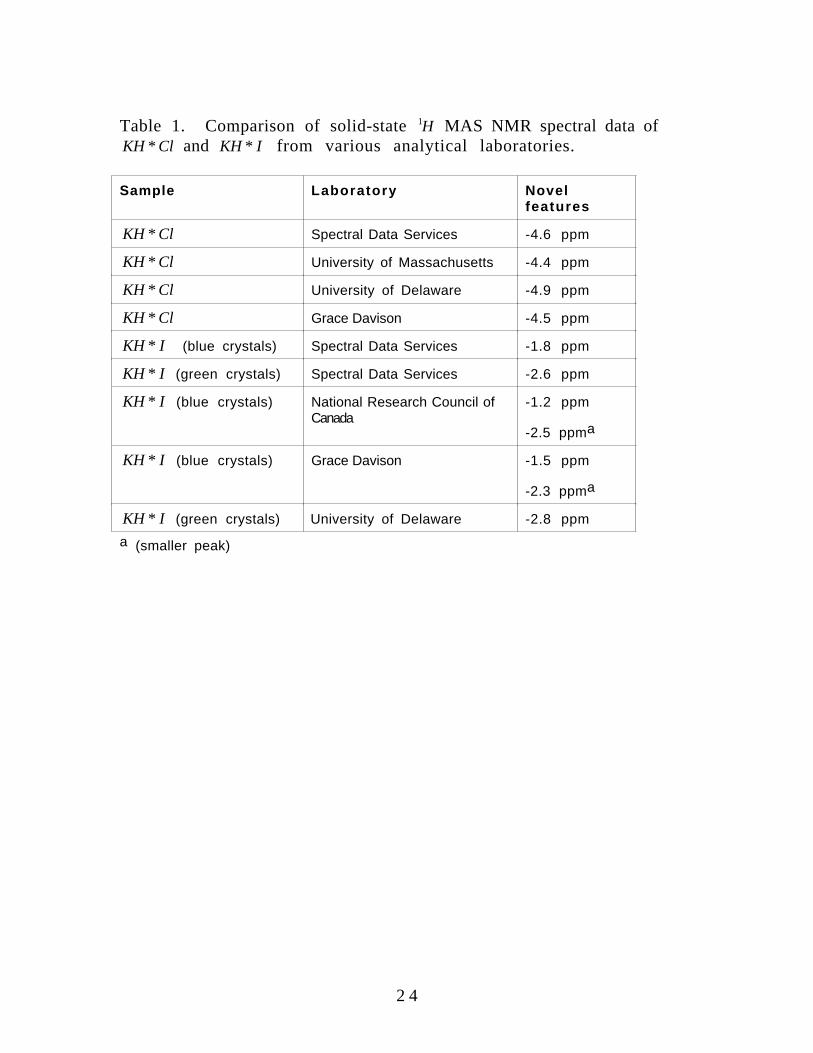
D. Comparison of NMR of Potassium Iodo Hydride and Potassium ChloroHydride Samples at Independent Laboratories
To confirm that the upfield shifted peaks of the KH Cl* and KH I*
samples were reproducible when recorded on different instruments, 1H
MAS NMR was performed on solid samples of KH Cl* and KH I* at fouradditional independent laboratories. The spectra are shown in Figures 9-17 and the results are summarized in Table 1. The 1H MAS NMR spectraof six KH Cl* samples from independent syntheses shown in Figures 2A-Fare in agreement with the independently obtained results run on KH Cl*
samples as given in Table 1. Two different novel hydride ions werereported by Mills et al. [18] in the case of the KH I* samples. The 1HMAS NMR spectra of the KH I* blue crystal sample shown in Figure 4Cand the light green sample shown in Figure 4B are in agreement with theindependently obtained results run on corresponding samples as given inTable 1. These results demonstrate that the upfield shifted peaks arereproducible and that they can not be attributed to instrument artifact.
E. NMR of Potassium Hydride Sample
The 1H MAS NMR spectra of the KH * sample and control KH
relative to external tetramethylsilane (TMS) are shown in Figures 5A and5B, respectively. Ordinary hydride ion has a resonance at 1.1 ppm and0.8 ppm in KH as shown in Figure 5B. The peak at 4.1 ppm shown inFigure 5A is assigned to water. The additional broad peak at 4.6 ppmshown in Figure 5B is assigned KOH formed from air exposure of KH
during sample handling. The spin speed was varied to confirm real
1 2
peaks versus side bands. The latter changed position with spin speed,the former were independent of spin speed. The peaks labeled SB shownin Figure 5A were found to be sidebands.
The resonance at 1.1 ppm which is assigned to ordinary hydrideion was observed in the spectrum of the KH * sample as shown in Figure5A. The distinct 0.8 and 1.1 ppm resonances could not be resolved ifthey were present. A large distinct upfield resonance was observed at -2.8 ppm which was not observed in the control. This upfield shiftedpeak is assigned to a novel hydride ion of KH * .
F. NMR of Rubidium Fluoro Hydride Sample
The 1H MAS NMR spectra of three RbH F* samples from separatesyntheses, the control comprising an equal molar mixture of RbH andRbF, and the control RbH relative to external tetramethylsilane (TMS)are shown in Figures 6A-E, respectively. Ordinary hydride ion has aresonance at about 1 ppm in the RbH/ RbF mixture and in RbH alone asshown in Figures 6D and 6E, respectively. The broad peaks at 4 ppm and4.6 ppm shown in Figures 6D and 6E, respectively, are assigned to RbOH
formed from air exposure of RbH during sample handling. The spinspeed was varied to confirm real peaks versus side bands. The latterchanged position with spin speed, the former were independent of spinspeed. The SB labeled peaks shown in Figure 6D were found to besidebands.
The presence of RbF does not shift the resonance of ordinaryhydride. The resonance at 1.2 ppm which is assigned to ordinaryhydride ion was observed in the spectrum of each RbH F* sample asshown in Figures 6A-C. A large distinct upfield resonance was observedin each case at -4.1 and -4.4 ppm which was not observed in eithercontrol. The upfield peak in each sample is assigned to a novel hydrideion of RbH F* .
G. NMR of Rubidium Iodo Hydride Sample
The 1H MAS NMR spectra of two RbH I* samples from separatesyntheses and the control comprising RbH relative to external

1 3
tetramethylsilane (TMS) are shown in Figures 7A-C, respectively.Ordinary hydride ion has a resonance at about 1 ppm in RbH alone asshown in Figure 7C. The broad peaks at 4 ppm shown in Figures 7A-Care assigned to RbOH formed from air exposure of RbH during samplehandling. The peak at 6 ppm shown in Figures 7A-B are assigned toRbHCO3 formed from air exposure of RbH during sample handling.
The resonance at 1.2 ppm which is assigned to ordinary hydrideion was observed in the spectrum of each RbH I* sample as shown inFigures 7A-B. A large distinct upfield resonance was observed in eachcase at -3.7 ppm which was not observed in either control. The upfieldpeak in each sample is assigned to a novel hydride ion of RbH I* .
H. NMR of Calcium Hydride Sample
The 1H MAS NMR spectra of the CaH2* sample and control CaH2
relative to external tetramethylsilane (TMS) are shown in Figures 8A and8B, respectively. The spin speed was varied to confirm real peaks versusside bands. The latter changed position with spin speed, the formerwere independent of spin speed. The peaks labeled SB shown in Figures8A and 8B were found to be sidebands. Resonances at 1.2 ppm and 4.4ppm were observed in ordinary CaH2 as shown in Figure 8B.
Three distinct resonances were observed in the case of the CaH2*
sample at 5.4 ppm, 1.2 ppm, and -1.2 ppm as shown in Figure 8A. Thelarge distinct upfield resonance observed at -1.2 ppm which was notobserved in the control is assigned to a novel hydride ion of CaH2
* .
CONCLUSIONS
The NMR results confirm the identification of novel hydridecompounds MH X* wherein M is the metal, X , is a halide, and H *
comprises a novel high binding energy hydride ion. Large distinctupfield resonances were observed at -4.5 ppm (KH Cl* ), -4.1 ppm( KH Br* ), -3.2 ppm (KH I* ), -4.4 ppm (RbH F* ), and -3.7 ppm (RbH I* ) .The presence of a halide in each compound MH X* does not explain theupfield shifted NMR peak since the same NMR spectrum was observed
1 4
for an equimolar mixture of the pure hydride and the correspondingalkali halide (MH / MX) as was observed for the pure hydride, MH .
The NMR results further confirm the identification of novelhydride compounds MH * and MH2
* wherein M is the metal and H *
comprises a novel high binding energy hydride ion. Large distinctupfield resonances were observed at -2.8 ppm and -1.2 ppm in the caseof KH * and CaH2
* , respectively. Whereas, the resonances for the
ordinary hydride ion of KH were observed at 0.7 and 1.1 ppm, and theresonances for the ordinary hydride ion of CaH2 were observed at 1.2
ppm and 4.4 ppm. The synthesis of alkaline and alkaline earth hydrides,KH * and CaH2
* , respectively, with upfield shifted peaks prove that the
hydride ion is different from the hydride ion of the correspondingknown compound of the same composition.
The upfield shifted peak observed in each novel hydride sampleidentifies a hydride ion with a smaller radius as compared with ordinaryhydride since a smaller radius increases the shielding or diamagnetism.The peaks are assigned to novel hydride ions that have substantiallysmaller radii than that of ordinary hydride ion since the shift wasextraordinarily far upfield. The reproducibility of the syntheses and theresults from independent laboratories confirm the formation of novelhydride ions.
The identification of compounds containing novel hydride ions isindicative of a new field of hydrogen chemistry. Novel hydride ions maycombine with other cations such as other alkali cations and alkalineearth, rare earth, and transition element cations. Numerous novelcompounds may be synthesized with extraordinary properties relative tothe corresponding compounds having ordinary hydride ions. Thesenovel compounds may have a breath of applications. For example, ahigh voltage battery according to the hydride binding energiespreviously observed by XPS [18-19, 21] may be possible having projectedspecifications that are comparable to those of the internal combustionengine [19]. An exemplary redox reaction is given in the Appendix.
APPENDIX
1 5
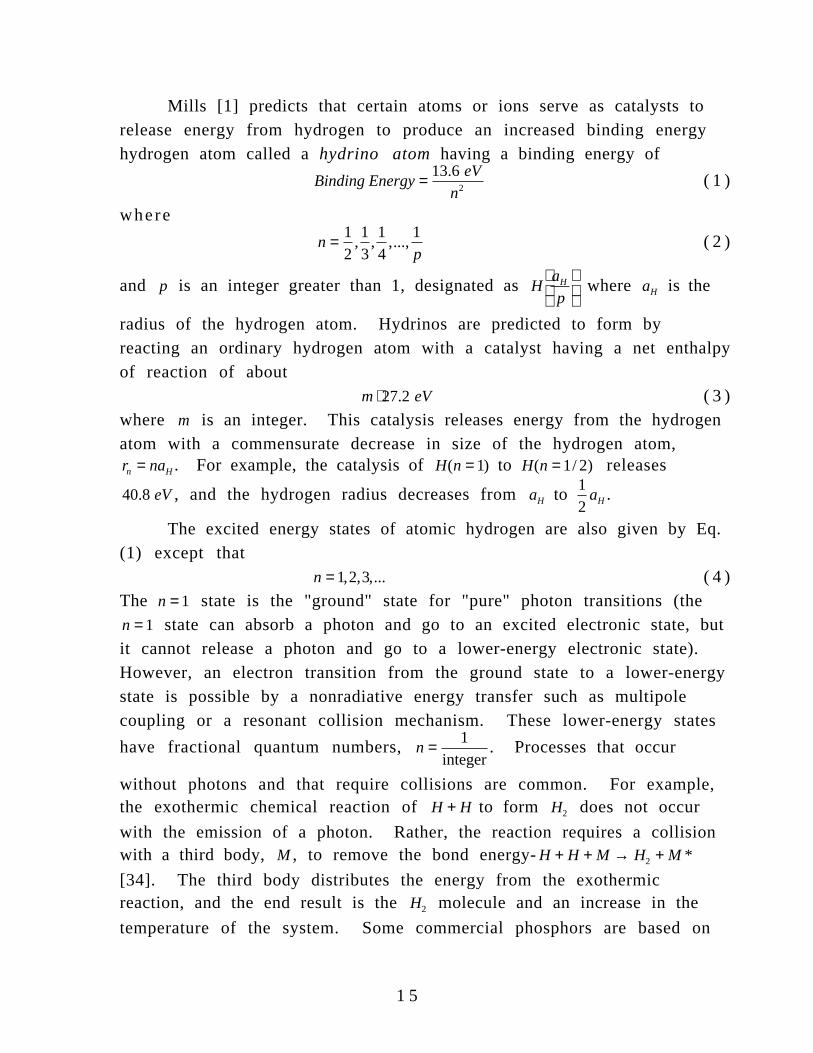
Mills [1] predicts that certain atoms or ions serve as catalysts torelease energy from hydrogen to produce an increased binding energyhydrogen atom called a hydrino atom having a binding energy of
Binding EnergyeV
n
= 13 62
.( 1 )
where
np
= 12
13
14
1, , ,..., ( 2 )
and p is an integer greater than 1, designated as Ha
pH
where aH is the
radius of the hydrogen atom. Hydrinos are predicted to form byreacting an ordinary hydrogen atom with a catalyst having a net enthalpyof reaction of about
m eV⋅27 2. ( 3 )where m is an integer. This catalysis releases energy from the hydrogenatom with a commensurate decrease in size of the hydrogen atom,r nan H= . For example, the catalysis of H n( )=1 to H n( / )=1 2 releases
40 8. eV, and the hydrogen radius decreases from aH to 12
aH .
The excited energy states of atomic hydrogen are also given by Eq.(1) except that
n =1 2 3, , ,... ( 4 )The n =1 state is the "ground" state for "pure" photon transitions (then =1 state can absorb a photon and go to an excited electronic state, butit cannot release a photon and go to a lower-energy electronic state).However, an electron transition from the ground state to a lower-energystate is possible by a nonradiative energy transfer such as multipolecoupling or a resonant collision mechanism. These lower-energy states
have fractional quantum numbers, n = 1integer
. Processes that occur
without photons and that require collisions are common. For example,the exothermic chemical reaction of H + H to form H2 does not occur
with the emission of a photon. Rather, the reaction requires a collisionwith a third body, M , to remove the bond energy-H H M H M+ + → +2 *
[34]. The third body distributes the energy from the exothermicreaction, and the end result is the H2 molecule and an increase in the
temperature of the system. Some commercial phosphors are based on

1 6
nonradiative energy transfer involving multipole coupling. For example,the strong absorption strength of Sb3+ ions along with the efficientnonradiative transfer of excitation from Sb3+ to Mn2+, are responsible forthe strong manganese luminescence from phosphors containing these
ions [35]. Similarly, the n =1 state of hydrogen and the n = 1integer
states
of hydrogen are nonradiative, but a transition between two nonradiativestates is possible via a nonradiative energy transfer, say n =1 to n =1 / 2.In these cases, during the transition the electron couples to anotherelectron transition, electron transfer reaction, or inelastic scatteringreaction which can absorb the exact amount of energy that must beremoved from the hydrogen atom. Thus, a catalyst provides a netpositive enthalpy of reaction of m eV⋅27 2. (i.e. it absorbs m eV⋅27 2. wherem is an integer). Certain atoms or ions serve as catalysts whichresonantly accept energy from hydrogen atoms and release the energy tothe surroundings to effect electronic transitions to fractional quantumenergy levels.
Inorganic Catalysts
Potass iumA catalytic system is provided by the ionization of t electrons from
an atom to a continuum energy level such that the sum of the ionizationenergies of the t electrons is approximately m X eV 27 2. where m is aninteger. One such catalytic system involves potassium. A catalyticsystem is provided by the ionization of 3 electrons from a potassiumatom each to a continuum energy level such that the sum of theionization energies of the 3 electrons is approximately 3 27 2⋅ . eV. Thefirst, second, and third ionization energies of potassium are 4.34066 eV,31.63 eV, 45 806. eV, respectively [32]. The triple ionization (t = 3) reactionof K to K3+, then, has a net enthalpy of reaction of 81.7426 eV, which isequivalent to m = 3 in Eq. (3).
8 33
3 13 63 2 21.7426 eV K m Ha
pK e H
a
pp p X eVH H+ ( ) +
→ + +
+
+ + −+ −
( )[( ) ] . ( 5 )
1 7
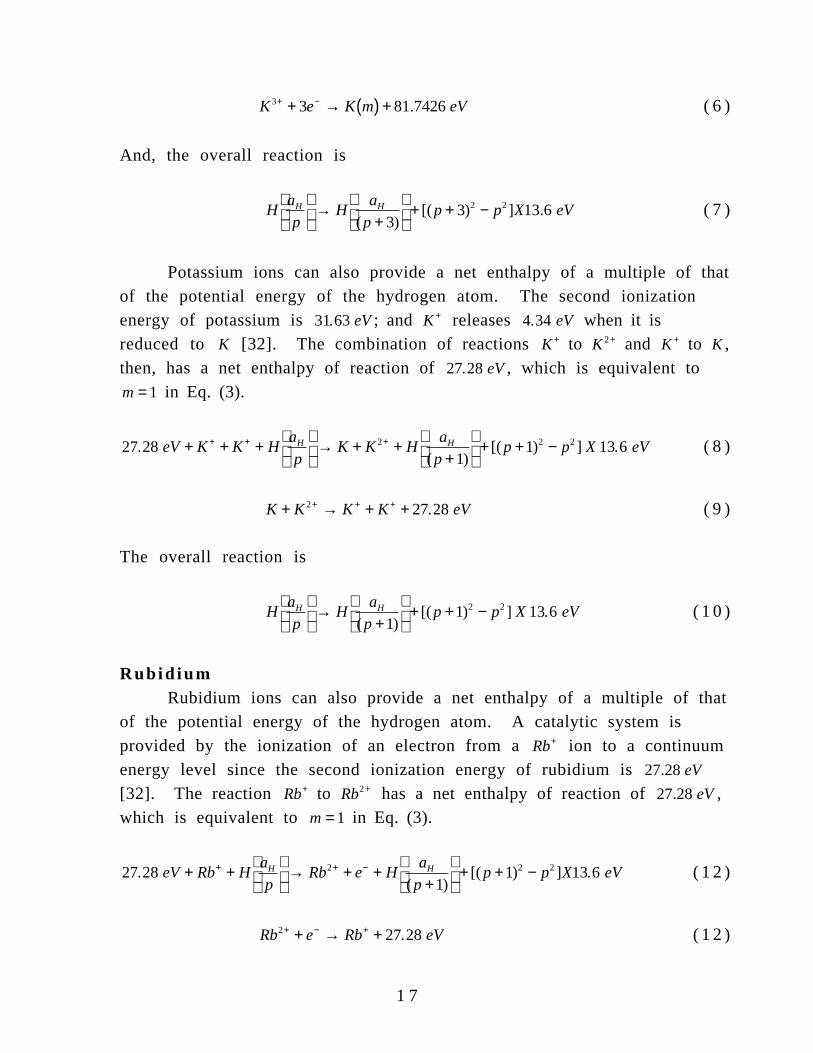
K e K m eV3 3 8+ −+ → ( ) + 1.7426 ( 6 )
And, the overall reaction is
Ha
pH
a
pp p X eVH H
→
+
+ + −
( )[( ) ] .
33 13 62 2 ( 7 )
Potassium ions can also provide a net enthalpy of a multiple of thatof the potential energy of the hydrogen atom. The second ionizationenergy of potassium is 31.63 eV; and K + releases 4.34 eV when it isreduced to K [32]. The combination of reactions K + to K 2+ and K + to K ,then, has a net enthalpy of reaction of 27.28 eV, which is equivalent tom =1 in Eq. (3).
27.28 eV+ K + + K + + HaH
p
→ K + K 2+ + H
aH
(p +1)
+ [( p +1)2 − p2] X 13.6 eV ( 8 )
K + K 2+ → K + + K + + 27.28 eV ( 9 )
The overall reaction is
HaH
p
→ H
aH
(p +1)
+ [( p +1)2 − p2] X 13.6 eV ( 1 0 )
Rub id iumRubidium ions can also provide a net enthalpy of a multiple of that
of the potential energy of the hydrogen atom. A catalytic system isprovided by the ionization of an electron from a Rb+ ion to a continuumenergy level since the second ionization energy of rubidium is 27.28 eV
[32]. The reaction Rb+ to Rb2+ has a net enthalpy of reaction of 27 28. eV,which is equivalent to m =1 in Eq. (3).
27.28 eV+ Rb+ + HaH
p
→ Rb2+ + e− + H
aH
(p +1)
+ [( p +1)2 − p2]X13.6 eV ( 1 2 )
Rb2+ + e− → Rb+ + 27.28 eV ( 1 2 )
1 8
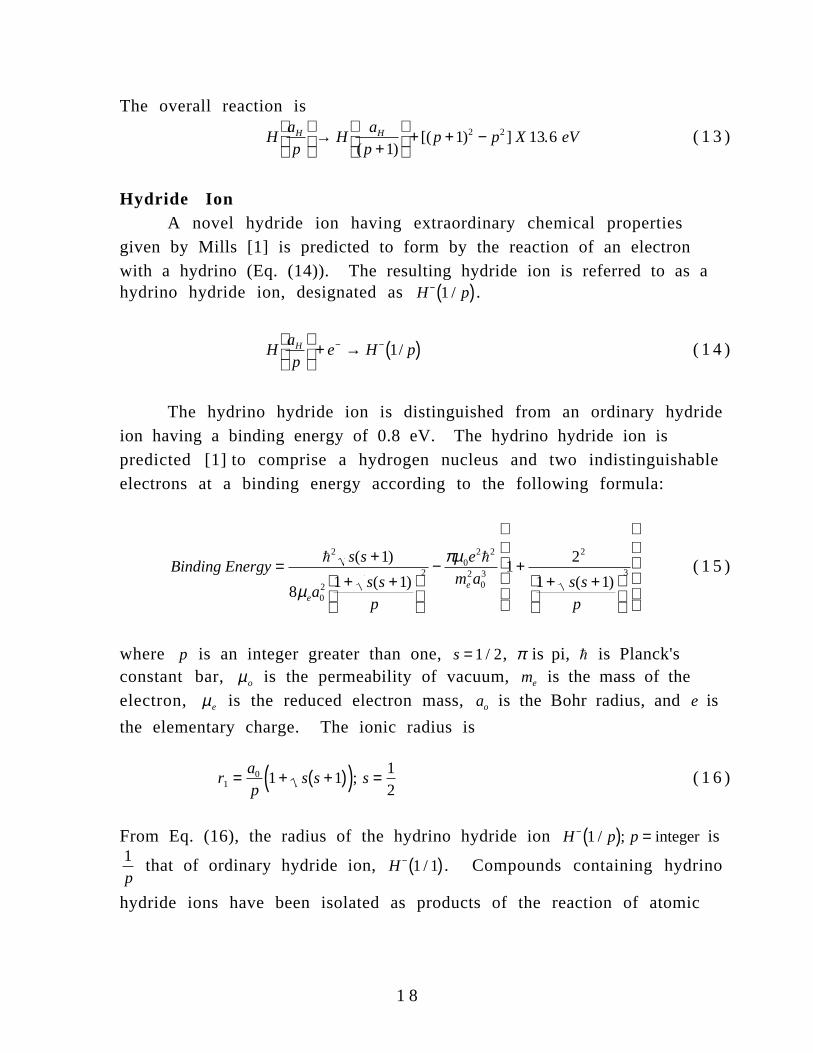
The overall reaction is
HaH
p
→ H
aH
(p +1)
+ [( p +1)2 − p2] X 13.6 eV ( 1 3 )
Hydride IonA novel hydride ion having extraordinary chemical properties
given by Mills [1] is predicted to form by the reaction of an electronwith a hydrino (Eq. (14)). The resulting hydride ion is referred to as ahydrino hydride ion, designated as H− 1 / p( ).
Ha
pe H pH
+ → ( )− − 1/ ( 1 4 )
The hydrino hydride ion is distinguished from an ordinary hydrideion having a binding energy of 0.8 eV. The hydrino hydride ion ispredicted [1] to comprise a hydrogen nucleus and two indistinguishableelectrons at a binding energy according to the following formula:
Binding Energys s
as s
p
e
m a s s
pe
e
= ++ +
− ++ +
h h2
02
20
2 2
203
2
3
1
81 1
12
1 1
( )
( ) ( )µ
πµ( 1 5 )
where p is an integer greater than one, s =1 / 2, π is pi, h is Planck'sconstant bar, µo is the permeability of vacuum, me is the mass of theelectron, µe is the reduced electron mass, ao is the Bohr radius, and e is
the elementary charge. The ionic radius is
r1 = a0
p1+ s s+1( )( ); s = 1
2( 1 6 )
From Eq. (16), the radius of the hydrino hydride ion H− 1 / p( ); p = integer is1p
that of ordinary hydride ion, H− 1 / 1( ). Compounds containing hydrino
hydride ions have been isolated as products of the reaction of atomic

1 9
hydrogen with atoms and ions identified as catalysts by EUV emission [2-31] .
Hydride ions having extraordinary binding energies may stabilize acation M x+ in an extraordinarily high oxidation state such as +2 in thecase of lithium. Thus, these hydride ions may be used as the basis of ahigh voltage battery of a rocking chair design wherein the hydride ionmoves back and forth between the cathode and anode half cells duringdischarge and charge cycles. Exemplary reactions for a cation M x+ are:
Cathode reaction:
MH e MH Hx x+ → +−−
−1 ( 1 7 )
Anode reaction:
MH H MH ex x−−
−−+ → +2 1 ( 1 8 )
Overall reaction:
MH MH MHx x x+ →− −2 12 ( 1 9 )

2 0
REFERENCES
1. R. Mills, The Grand Unified Theory of Classical Quantum Mechanics,January 2000 Edition, BlackLight Power, Inc., Cranbury, New Jersey,Distributed by Amazon.com.
2. R. Mills and M. Nansteel, "Anomalous Argon-Hydrogen-StrontiumDischarge", IEEE Transactions on Plasma Science, submitted.
3. R. Mills, M. Nansteel, and Y. Lu, "Anomalous Hydrogen-StrontiumDischarge", European Journal of Physics D, submitted.
4. R. Mills, "Spectroscopic Identification of a Novel Catalytic Reaction ofAtomic Hydrogen and the Hydride Ion Product", Int. J. HydrogenEnergy, submitted.
5. R. Mills, N. Greenig, S. Hicks, "Optically Measured Power Balances ofAnomalous Discharges of Mixtures of Argon, Hydrogen, andPotassium, Rubidium, Cesium, or Strontium Vapor", Int. J. HydrogenEnergy, submitted.
6. R. Mills, J. Dong, Y. Lu, "Observation of Extreme Ultraviolet HydrogenEmission from Incandescently Heated Hydrogen Gas with CertainCatalysts", Int. J. Hydrogen Energy, Vol. 25, (2000), pp. 919-943.
7. R. Mills, "Observation of Extreme Ultraviolet Emission from Hydrogen-KI Plasmas Produced by a Hollow Cathode Discharge", Int. J. HydrogenEnergy, in press.
8. R. Mills, "Temporal Behavior of Light-Emission in the Visible SpectralRange from a Ti-K2CO3-H-Cell", Int. J. Hydrogen Energy, in press.
9. R. Mills, Y. Lu, and T. Onuma, "Formation of a Hydrogen Plasma froman Incandescently Heated Hydrogen-Catalyst Gas Mixture with anAnomalous Afterglow Duration", Int. J. Hydrogen Energy, in press.
10. R. Mills, M. Nansteel, and Y. Lu, "Observation of Extreme UltravioletHydrogen Emission from Incandescently Heated Hydrogen Gas withStrontium that Produced an Anomalous Optically Measured PowerBalance", Int. J. Hydrogen Energy, in press.
11. R. Mills, J. Dong, Y. Lu, J. Conrads, "Observation of ExtremeUltraviolet Hydrogen Emission from Incandescently Heated HydrogenGas with Certain Catalysts", 1999 Pacific Conference on Chemistry andSpectroscopy and the 35th ACS Western Regional Meeting, OntarioConvention Center, California, (October 6-8, 1999).

2 1
12. R. Mills, J. Dong, N. Greenig, and Y. Lu, "Observation of ExtremeUltraviolet Hydrogen Emission from Incandescently Heated HydrogenGas with Certain Catalysts", National Hydrogen Association, 11 thAnnual U.S. Hydrogen Meeting, Vienna, VA, (February 29-March 2,2000) .
13. R. Mills, B. Dhandapani, N. Greenig, J. He, J. Dong, Y. Lu, and H.Conrads, "Formation of an Energetic Plasma and Novel Hydrides fromIncandescently Heated Hydrogen Gas with Certain Catalysts", NationalHydrogen Association, 11 th Annual U.S. Hydrogen Meeting, Vienna,VA, (February 29-March 2, 2000).
14. Mills, J. Dong, N. Greenig, and Y. Lu, "Observation of ExtremeUltraviolet Hydrogen Emission from Incandescently Heated HydrogenGas with Certain Catalysts", 219 th National ACS Meeting, SanFrancisco, California, (March 26-30, 2000).
15. R. Mills, B. Dhandapani, N. Greenig, J. He, J. Dong, Y. Lu, and H.Conrads, "Formation of an Energetic Plasma and Novel Hydrides fromIncandescently Heated Hydrogen Gas with Certain Catalysts", 219 thNational ACS Meeting, San Francisco, California, (March 26-30, 2000).
16. R. Mills, B. Dhandapani, N. Greenig, J. He, J. Dong, Y. Lu, and H.Conrads, "Formation of an Energetic Plasma and Novel Hydrides fromIncandescently Heated Hydrogen Gas with Certain Catalysts", JuneACS Meeting (29th Northeast Regional Meeting, University ofConnecticut, Storrs, CT, (June 18-21, 2000)).
17. R. Mills, B. Dhandapani, N. Greenig, J. He, J. Dong, Y. Lu, and H.Conrads, "Formation of an Energetic Plasma and Novel Hydrides fromIncandescently Heated Hydrogen Gas with Certain Catalysts", AugustNational ACS Meeting (220th ACS National Meeting, Washington, DC,(August 20-24, 2000)).
18. R. Mills, B. Dhandapani, N. Greenig, J. He, "Synthesis andCharacterization of Potassium Iodo Hydride", Int. J. of HydrogenEnergy, Vol. 25, Issue 12, December, (2000), pp. 1185-1203.
19. R. Mills, "Novel Inorganic Hydride", Int. J. of Hydrogen Energy, Vol.25, (2000), pp. 669-683.
20. R. Mills, "Novel Hydrogen Compounds from a Potassium CarbonateElectrolytic Cell", Fusion Technology, Vol. 37, No. 2, March, (2000),pp. 157-182.

2 2
21. R. Mills, B. Dhandapani, M. Nansteel, J. He, T. Shannon, A. Echezuria,"Synthesis and Characterization of Novel Hydride Compounds", Int. J.of Hydrogen Energy, in press.
22. R. Mills, "Highly Stable Novel Inorganic Hydrides", Journal ofMaterials Research, submitted.
23. R. Mills, "Novel Hydride Compound", 1999 Pacific Conference onChemistry and Spectroscopy and the 35th ACS Western RegionalMeeting, Ontario Convention Center, California, (October 6-8, 1999).
24. R. Mills, B, Dhandapani, N. Greenig, J. He, "Synthesis andCharacterization of Potassium Iodo Hydride", 1999 Pacific Conferenceon Chemistry and Spectroscopy and the 35th ACS Western RegionalMeeting, Ontario Convention Center, California, (October 6-8, 1999).
25. R. Mills, J. He, and B. Dhandapani, "Novel Hydrogen Compounds",1999 Pacific Conference on Chemistry and Spectroscopy and the 35thACS Western Regional Meeting, Ontario Convention Center, California,(October 6-8, 1999).
26. R. Mills, "Novel Hydride Compound", National Hydrogen Association,11 th Annual U.S. Hydrogen Meeting, Vienna, VA, (February 29-March2, 2000).
27. R. Mills, J. He, and B. Dhandapani, "Novel Alkali and Alkaline EarthHydrides", National Hydrogen Association, 11 th Annual U.S.Hydrogen Meeting, Vienna, VA, (February 29-March 2, 2000).
28. R. Mills, "Novel Hydride Compound", 219 th National ACS Meeting,San Francisco, California, (March 26-30, 2000).
29. R. Mills, J. He, and B. Dhandapani, "Novel Alkali and Alkaline EarthHydrides", 219 th National ACS Meeting, San Francisco, California,(March 26-30, 2000).
30. R. Mills, J. He, and B. Dhandapani, "Novel Alkali and Alkaline EarthHydrides", August National ACS Meeting (220 th ACS NationalMeeting, Washington, DC, (August 20-24, 2000)).
31. R. Mills, W. Good, A. Voigt, Jinquan Dong, "Minimum Heat ofFormation of Potassium Iodo Hydride", Int. J. Hydrogen Energy,submit ted.
32. David R. Linde, CRC Handbook of Chemistry and Physics, 79 thEdition, CRC Press, Boca Raton, Florida, (1998-9), p. 10-175 to p. 10-177 .

2 3
33. R. Mills, The Nature of Free Electrons in Superfluid Helium--a Test ofQuantum Mechanics and a Basis to Review its Foundations and Make aComparison to Classical Theory, Int. J. Hydrogen Energy, in press.
34. N. V. Sidgwick, The Chemical Elements and Their Compounds,Volume I, Oxford, Clarendon Press, (1950), p.17.
35. M. D. Lamb, Luminescence Spectroscopy, Academic Press, London,(1978), p. 68.
2 4
Table 1. Comparison of solid-state 1H MAS NMR spectral data ofKH Cl* and KH I* from various analytical laboratories.
Sample Laboratory Novelfeatures
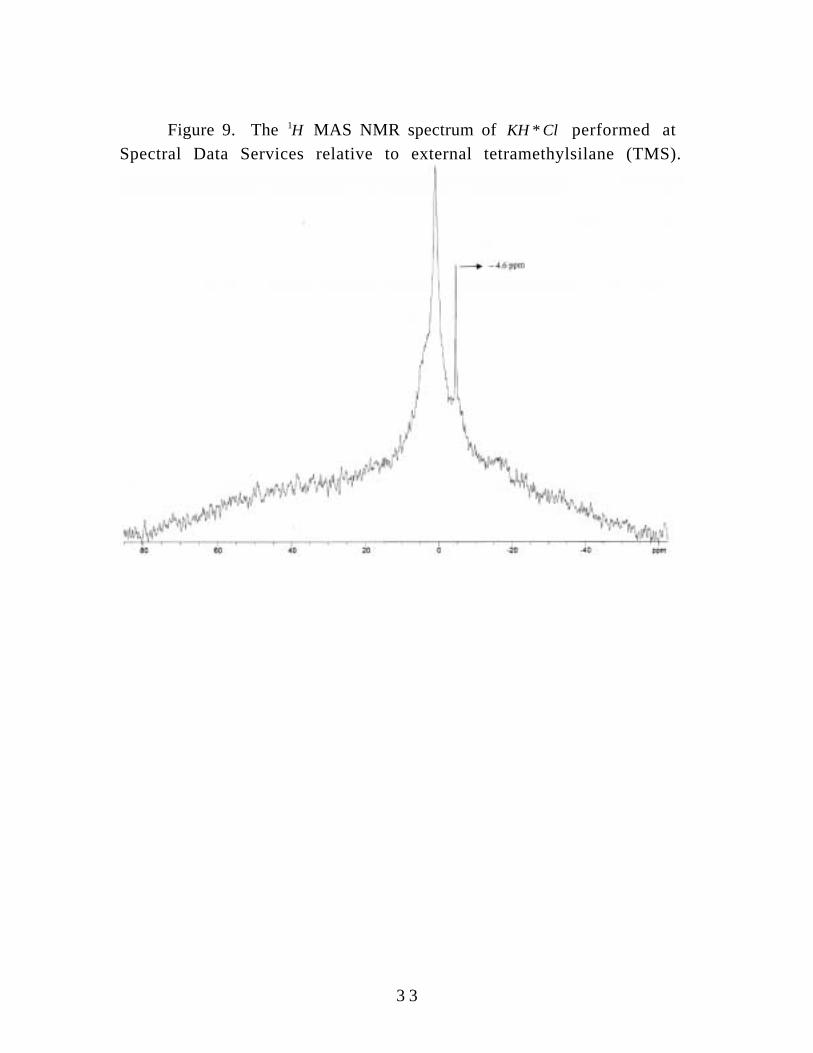
KH Cl* Spectral Data Services -4.6 ppm
KH Cl* University of Massachusetts -4.4 ppm
KH Cl* University of Delaware -4.9 ppm
KH Cl* Grace Davison -4.5 ppm
KH I* (blue crystals) Spectral Data Services -1.8 ppm
KH I* (green crystals) Spectral Data Services -2.6 ppm
KH I* (blue crystals) National Research Council ofCanada
-1.2 ppm
-2.5 ppma
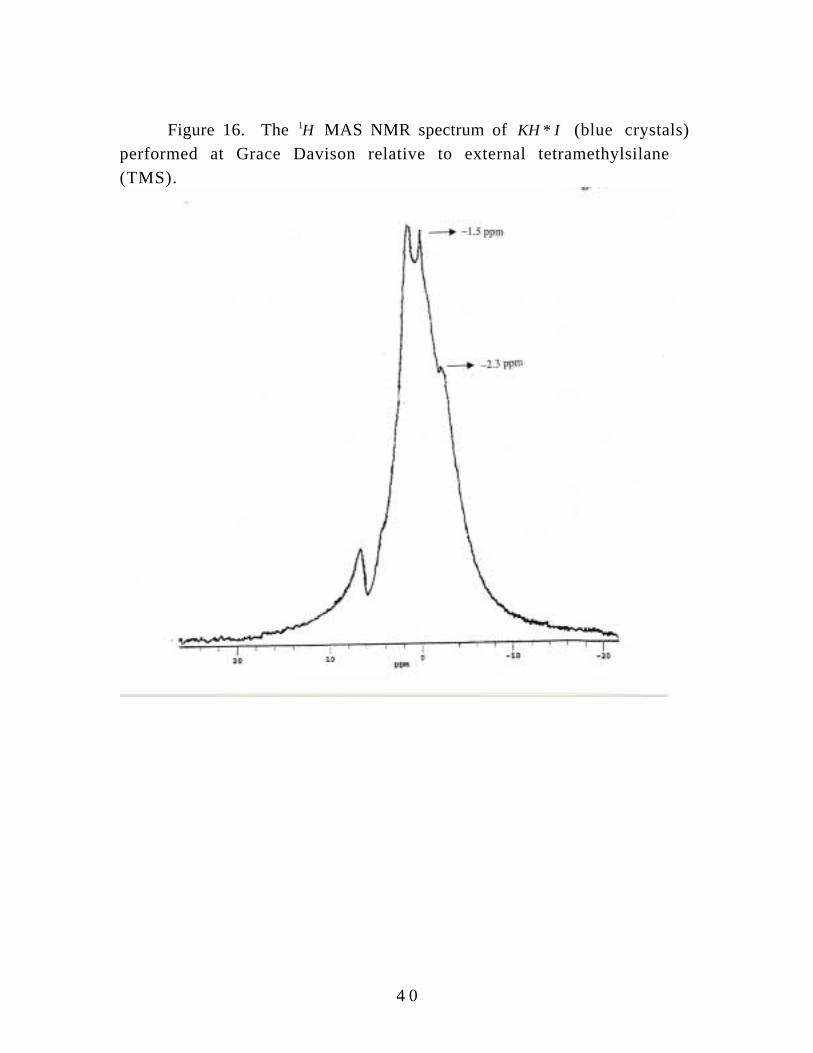
KH I* (blue crystals) Grace Davison -1.5 ppm
-2.3 ppma
KH I* (green crystals) University of Delaware -2.8 ppm
a (smaller peak)
2 5
Figure Captions
Figure 1. Stainless steel gas cell comprising a screen dissociator,metal catalyst, and alkali halide or alkali or alkaline earth hydride as thereactant. The components were: 101-stainless steel cell; 117- internalcavity of cell; 118-high vacuum conflat flange; 119-mating blank conflatflange; 102-stainless steel tube vacuum line and gas supply line; 103-lidto the kiln or top insulation, 104 heater; 108-screen dissociator; 109-alkali halide or alkali or alkaline earth hydride reactant; 110-highvacuum turbo pump; 112- pressure gauge; 111-vacuum pump valve;113-valve; 114-valve; 115-regulator; 116-hydrogen tank.

2 6
Figure 2A-F. The 1H MAS NMR spectra of six KH Cl* samples from independentsyntheses relative to external tetramethylsilane (TMS).Figure 2G. The 1H MAS NMR spectrum of the control comprising anequal molar mixture of KH and KCl relative to externaltetramethylsilane (TMS).Figure 2H. The 1H MAS NMR spectrum of the control KH relative toexternal tetramethylsilane (TMS).

2 7
Figure 3A. The 1H MAS NMR spectrum of KH Br* relative toexternal tetramethylsilane (TMS).Figure 3B. The 1H MAS NMR spectrum of the control comprising anequal molar mixture of KH and KBr relative to externaltetramethylsilane (TMS).Figure 3C. The 1H MAS NMR spectrum of the control KH relative toexternal tetramethylsilane (TMS).

2 8
Figure 4A. The 1H MAS NMR spectrum of KH I* (dark greencrystals) relative to external tetramethylsilane (TMS).
Figure 4B. The 1H MAS NMR spectrum of KH I* (green crystals)relative to external tetramethylsilane (TMS).
Figure 4C. The 1H MAS NMR spectrum of KH I* (blue crystals)relative to external tetramethylsilane (TMS).
Figure 4D. The 1H MAS NMR spectrum of the control comprisingan equal molar mixture of KH and KI relative to externaltetramethylsilane (TMS).
Figure 4E. The 1H MAS NMR spectrum of the control KH relative toexternal tetramethylsilane (TMS).

2 9
Figure 5A. The 1H MAS NMR spectra of KH * relative to externaltetramethylsilane (TMS).
Figure 5B. The 1H MAS NMR spectrum of the control KH relativeto external tetramethylsilane (TMS).

3 0
Figure 6A-C. The 1H MAS NMR spectra of three RbH F* samplesfrom separate syntheses relative to external tetramethylsilane (TMS).Figure 6D. The 1H MAS NMR spectrum of the control comprising anequal molar mixture of RbH and RbF relative to externaltetramethylsilane (TMS).Figure 6E. The 1H MAS NMR spectrum of the control RbH relative toexternal tetramethylsilane (TMS).

3 1
Figure 7A-B. The 1H MAS NMR spectra of two RbH I* samples fromseparate syntheses relative to external tetramethylsilane (TMS).
Figure 7C. The 1H MAS NMR spectrum of the control RbH relativeto external tetramethylsilane (TMS).

3 2
Figure 8A. The 1H MAS NMR spectra of the CaH2* relative to
external tetramethylsilane (TMS).Figure 8B. The 1H MAS NMR spectrum of the control CaH2 relative
to external tetramethylsilane (TMS).
3 3
Figure 9. The 1H MAS NMR spectrum of KH Cl* performed atSpectral Data Services relative to external tetramethylsilane (TMS).

3 4
Figure 10. The 1H MAS NMR spectrum of KH Cl* performed atUniversity of Massachusetts relative to external tetramethylsilane (TMS).

3 5
Figure 11. The 1H MAS NMR spectrum of KH Cl* performed atUniversity of Delaware relative to external tetramethylsilane (TMS).

3 6
Figure 12. The 1H MAS NMR spectrum of KH Cl* performed atGrace Davison relative to external tetramethylsilane (TMS).

3 7
Figure 13. The 1H MAS NMR spectrum of KH I* (blue crystals)performed at Spectral Data Services relative to externaltetramethylsilane (TMS).

3 8
Figure 14. The 1H MAS NMR spectrum of KH I* (green crystals)performed at Spectral Data Services relative to externaltetramethylsilane (TMS).

3 9
Figure 15. The 1H MAS NMR spectrum of KH I* (blue crystals)performed at National Research Council of Canada relative to externaltetramethylsilane (TMS).
4 0
Figure 16. The 1H MAS NMR spectrum of KH I* (blue crystals)performed at Grace Davison relative to external tetramethylsilane(TMS).

4 1
Figure 17. The 1H MAS NMR spectrum of KH I* (blue crystals)performed at National University of Delaware relative to externaltetramethylsilane (TMS).