Embed Size (px)
Citation preview
Basic Biostatistics for Clinical Research
Ramses F Sadek, PhD
GRU Cancer Center
1
Part One
1. Basic Concepts
2. Data & Their Presentation
2
1. Basic Concepts
• Statistics
• Biostatistics
• Populations and samples
• Statistics and parameters
• Statistical inferences
• variables
• Random Variables
• Simple random sample
3
Statistics
Statistics is a field of study concerned with
1- collection, organization, summarization and analysis
of data.
2- drawing of inferences about a population when only a
part of the data is observed.
Statisticians try to interpret and communicate the results
to others. 4
Biostatistics
• Biostatistics can be defined as the application of
the mathematical tools used in statistics to the
fields of biological sciences and medicine.
• Biostatistics is a growing field with applications in
many areas of biology including epidemiology,
medical sciences, health sciences, educational
research and environmental sciences.
5
Variables
• A variable is an object, characteristic or property that can have different values in different places, persons, or things.
• A quantitative variable can be measured in some way.
•Examples: Heart rate, heights, weight, age, size of tumor, volume of a dose.
• A qualitative (categorical) variable is characterized by its inability to be measured but it can be sorted into categories.
•Examples: gender, race, drug name, disease status.6
Populations and Samples
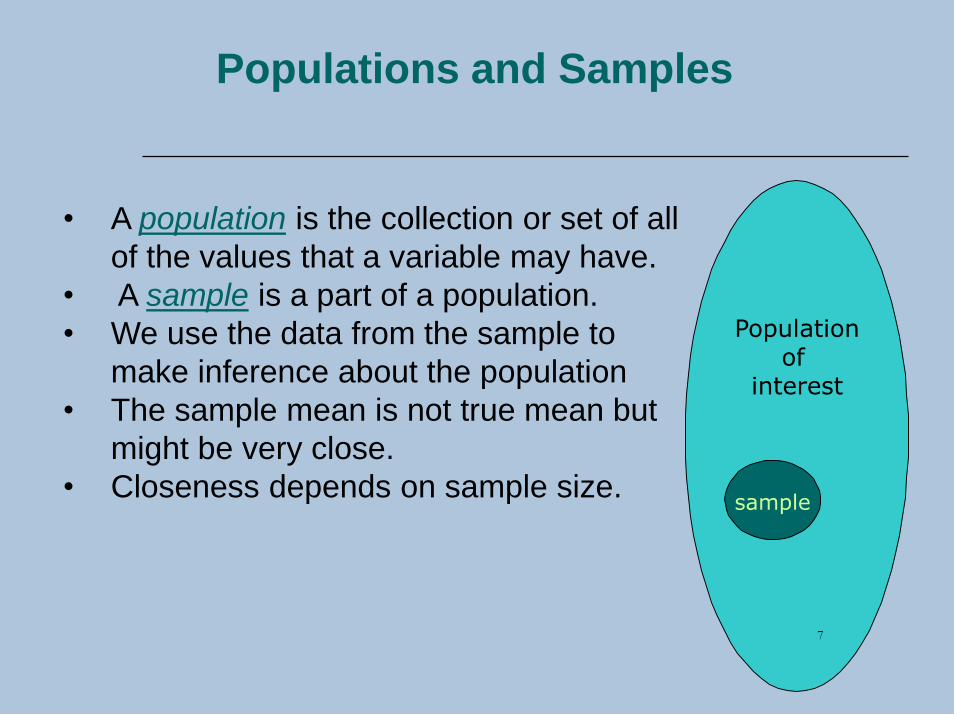
• A population is the collection or set of all
of the values that a variable may have.
• A sample is a part of a population.
• We use the data from the sample to
make inference about the population
• The sample mean is not true mean but
might be very close.
• Closeness depends on sample size.
Population of
interest
sample
7
Sampling Approaches-1
• Convenience Sampling: select the most
accessible and available subjects in target
population. Inexpensive, less time consuming,
but sample is nearly always non-representative
of target population.
• Random Sampling (Simple): select subjects at
random from the target population. Need to
identify all in target population first. Provides
representative sample frequently.
8
Sampling Approaches-2
• Systematic Sampling: Identify all in target
population, and select every xth person as a
subject.
• Stratified Sampling: Identify important sub-
groups in your target population. Sample from
these groups randomly or by convenience.
Ensures that important sub-groups are included
in sample. May not be representative.
• More complex sampling
9
Sampling Error
• The discrepancy between the true population parameter and the
sample statistic
• Sampling error likely exists in most studies, but can be reduced
by using larger sample sizes
• Sampling error approximates 1 / √n
• Note that larger sample sizes also require time and expense to
obtain, and that large sample sizes do not eliminate sampling
error
10
Parameters vs. Statistics
• A parameter is a population characteristic
• A statistic is a sample characteristic
• Example: we estimate the sample mean to tell us
about the true population mean
• the sample mean is a ‘statistic’
• the population mean is a ‘parameter’
11
Descriptive & Inferential Statistics
12
Descriptive Statistics deal with the enumeration, organization
and graphical representation of data from a sample
Inferential Statistics deal with reaching conclusions from
incomplete information, that is, generalizing from the specific
sample
Inferential statistics use available information in a sample to draw
inferences about the population from which the sample was
selected
Random Variables
• A random variable is one that cannot be predicted in advance because it arises by chance. Observations or measurements are used to obtain the value of a random variable.
•A discrete random variable has gaps or interruptions in the values that it can have.
•The values may be whole numbers or have spaces between them.
•A continuous random variable does not have gaps in the values it can assume.
•Its properties are like the real numbers.
13
2- Data and Their Presentation
• Data
• Data sources
• Records
• Surveys
• Experiments
• Types of data
• Categorical variables
• Frequency tables
• Numerical variables
• Categorization
• Bar charts
• Histograms
• Box plots
• Bar charts by another variable
• Histogram by another variable
• Box plots by another variable
• Scatter plots
14
Data
• The raw material of Statistics is data.
• We may define data as figures. Figures result from the process of counting or from taking a measurement.
• Example:
• - When a hospital administrator counts the number of patients (counting).
• - When a nurse weighs a patient (measurement)
15
Sources of Data
Data are obtained from
• Records
• Surveys
• Experiments
16
Data Sources: Records, Reports
and Other Sources
Look for data to serve as the raw material for our investigation.
1- Routinely kept records.
- Hospital medical records contain immense amounts of information on patients.
- Hospital accounting records contain a wealth of data on the facility’s business activities.
2- External sources.
The data needed to answer a question may already exist in the form of published reports, commercially available data banks, or the research literature, i.e. someone else has already asked the same question.
17
Data Sources: Surveys
Survey may be necessary if the data needed is
about answering certain questions.
Example:
If the administrator of a clinic wishes to obtain
information regarding the mode of transportation
used by patients to visit the clinic, then a survey
may be conducted among patients to obtain this
information
18
Data Sources: Experiments
Frequently the data needed to answer a question are
available only as the result of an experiment.
For example:
If a nurse wishes to know which of several strategies is
best for maximizing patient compliance, she might
conduct an experiment in which the different strategies
of motivating compliance are tried with different patients.
Clinical trials is the most obvious example.
19
Types of Data
• Data are made up of a set of variables:
• Categorical variable
• Numerical variables
20
Categorical Variables
• Any variable that is not numerical (values have no numerical meaning) (e.g. gender, race, drug, disease status)
• Nominal variables
• The data are unordered (e.g. RACE: 1=Caucasian, 2=Asian American, 3=African American, 4=others)
• A subset of these variables are Binary or dichotomous variables: have only two categories (e.g. GENDER: 1=male, 2=female)
• Ordinal variables
• The data are ordered (e.g. AGE: 1=10-19 years, 2=20-29 years, 3=30-39 years; likelihood of participating in a vaccine trial). Income: Low, medium, high. 21
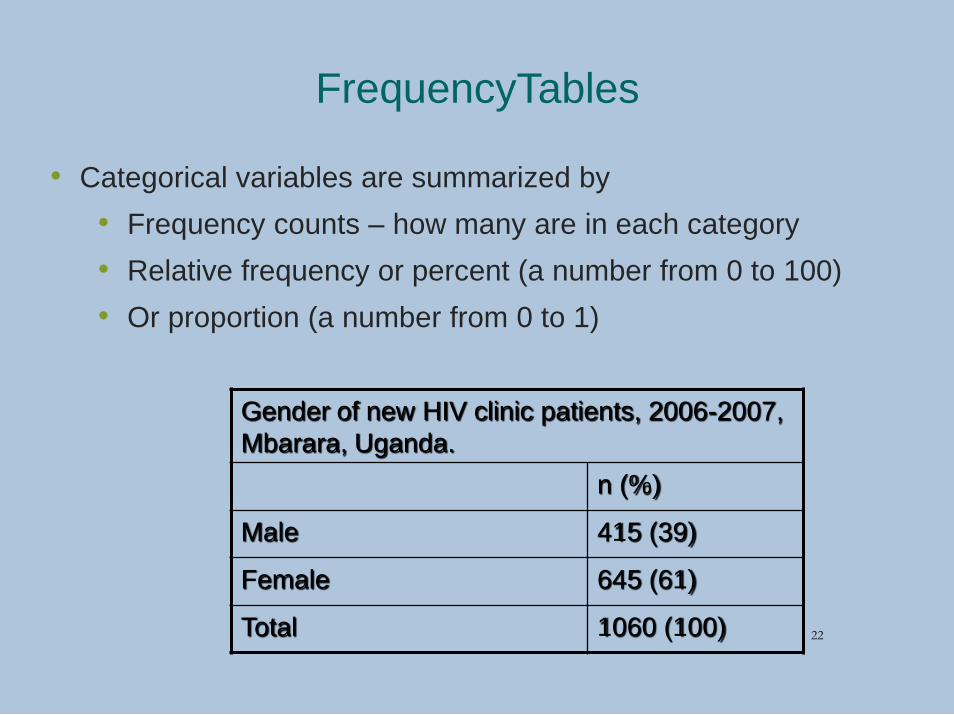
FrequencyTables
• Categorical variables are summarized by
• Frequency counts – how many are in each category
• Relative frequency or percent (a number from 0 to 100)
• Or proportion (a number from 0 to 1)
Gender of new HIV clinic patients, 2006-2007,
Mbarara, Uganda.
n (%)
Male 415 (39)
Female 645 (61)
Total 1060 (100) 22
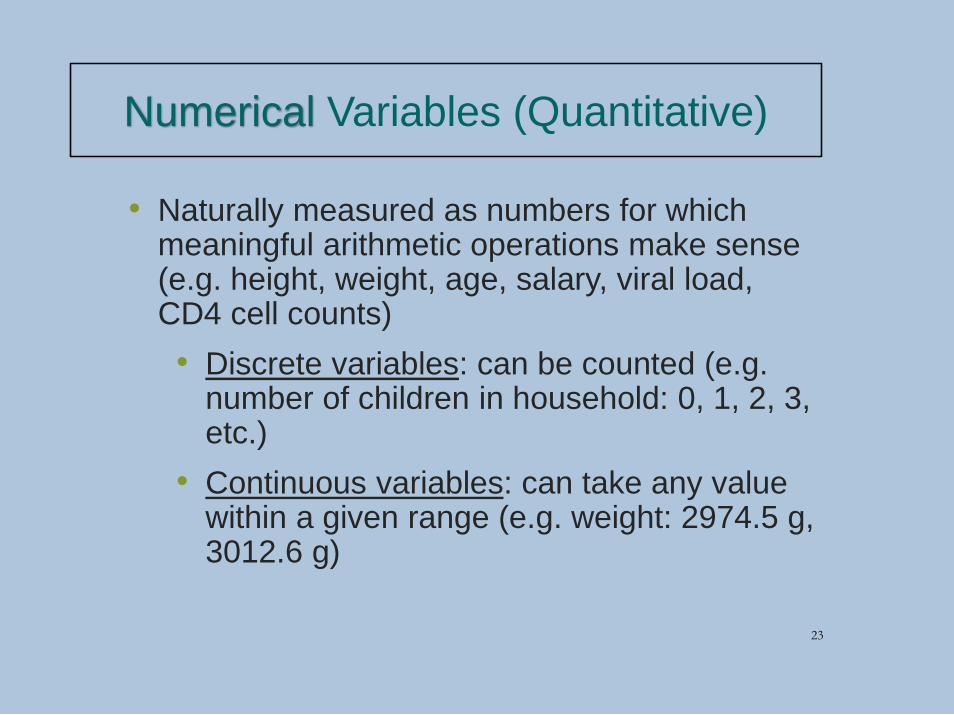
Numerical Variables (Quantitative)
• Naturally measured as numbers for which meaningful arithmetic operations make sense (e.g. height, weight, age, salary, viral load, CD4 cell counts)
• Discrete variables: can be counted (e.g. number of children in household: 0, 1, 2, 3, etc.)
• Continuous variables: can take any value within a given range (e.g. weight: 2974.5 g, 3012.6 g)
23
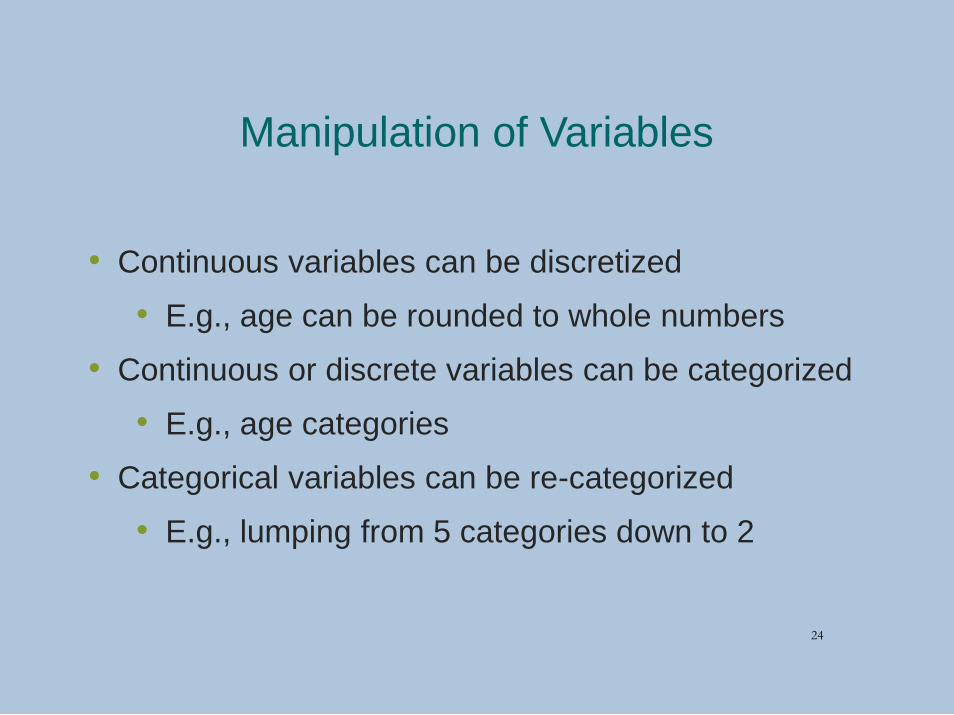
Manipulation of Variables
• Continuous variables can be discretized
• E.g., age can be rounded to whole numbers
• Continuous or discrete variables can be categorized
• E.g., age categories
• Categorical variables can be re-categorized
• E.g., lumping from 5 categories down to 2
24
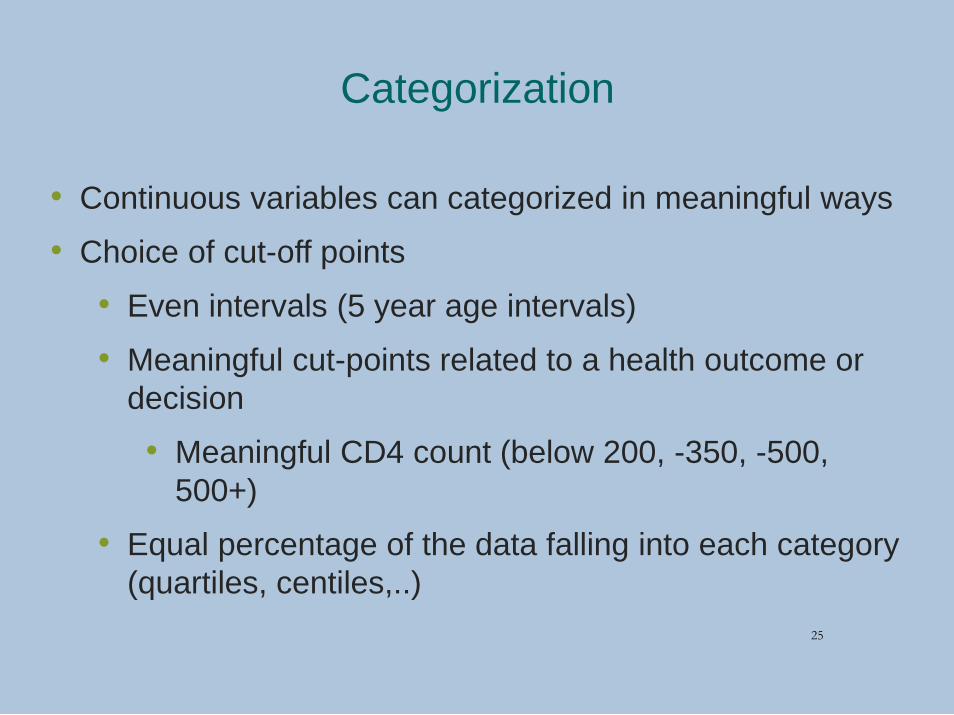
Categorization
• Continuous variables can categorized in meaningful ways
• Choice of cut-off points
• Even intervals (5 year age intervals)
• Meaningful cut-points related to a health outcome or
decision
• Meaningful CD4 count (below 200, -350, -500,
500+)
• Equal percentage of the data falling into each category
(quartiles, centiles,..)
25
Organizing Data and Presentation
Some of common methods:
• Frequency Table
• Frequency Histogram
• Relative Frequency Histogram
• Frequency polygon
• Relative Frequency polygon
• Bar chart
• Pie chart
• Box plot
• Scatter plots.
26
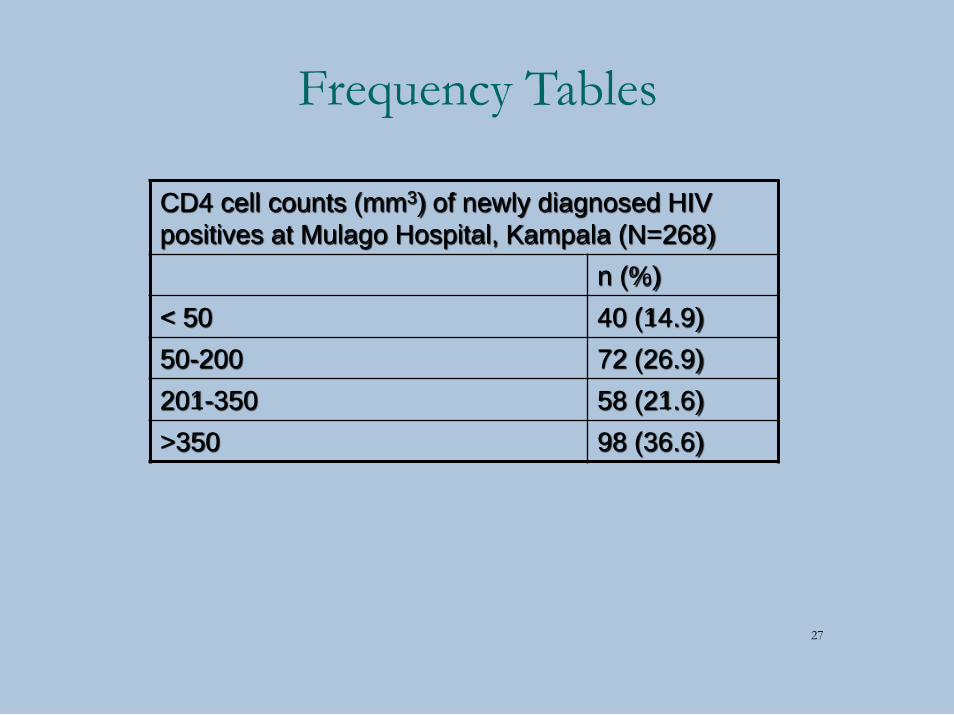
Frequency Tables
CD4 cell counts (mm3) of newly diagnosed HIV
positives at Mulago Hospital, Kampala (N=268)
n (%)
< 50 40 (14.9)
50-200 72 (26.9)
201-350 58 (21.6)
>350 98 (36.6)
27
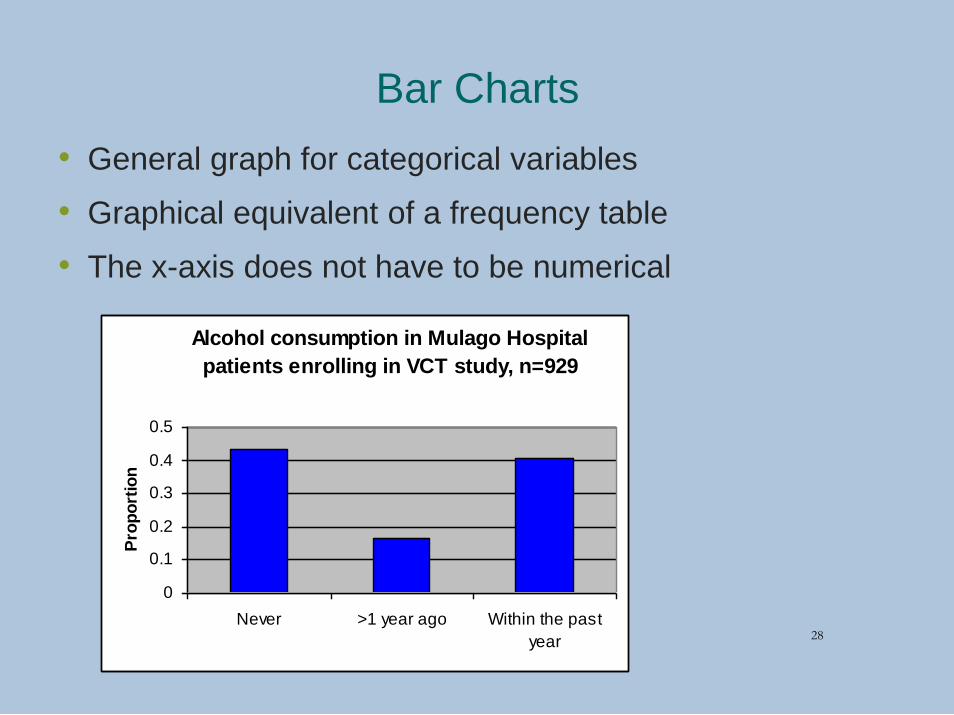
Bar Charts
• General graph for categorical variables
• Graphical equivalent of a frequency table
• The x-axis does not have to be numerical
Alcohol consumption in Mulago Hospital
patients enrolling in VCT study, n=929
0
0.1
0.2
0.3
0.4
0.5
Never >1 year ago Within the past
year
Pro
po
rtio
n
28
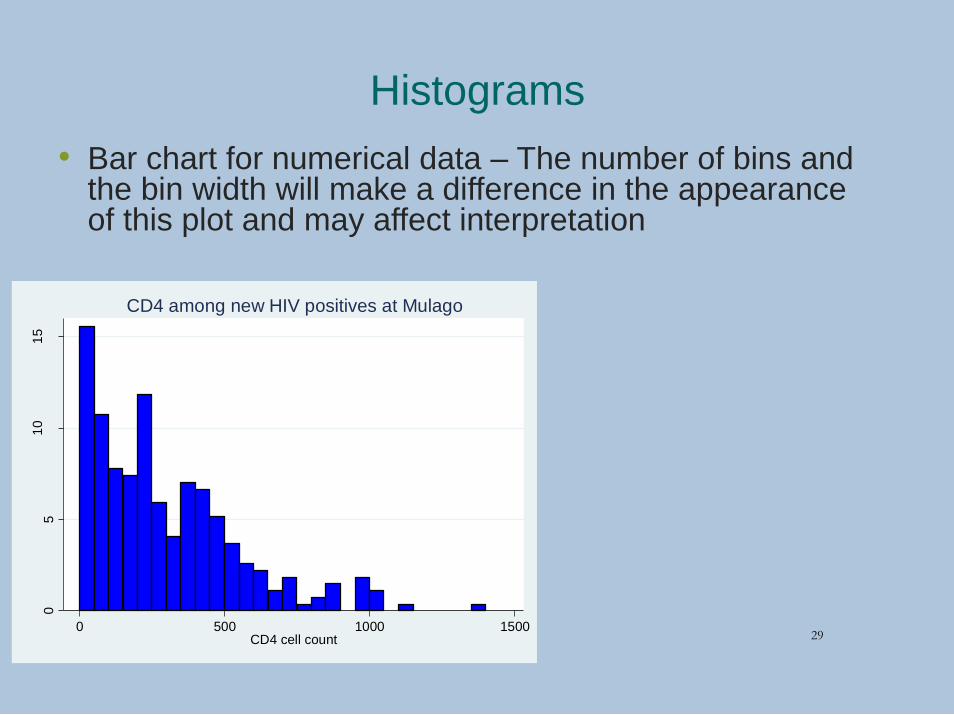
Histograms
• Bar chart for numerical data – The number of bins and the bin width will make a difference in the appearance of this plot and may affect interpretation
05
10
15
Pe
rcen
t
0 500 1000 1500CD4 cell count
CD4 among new HIV positives at Mulago
29
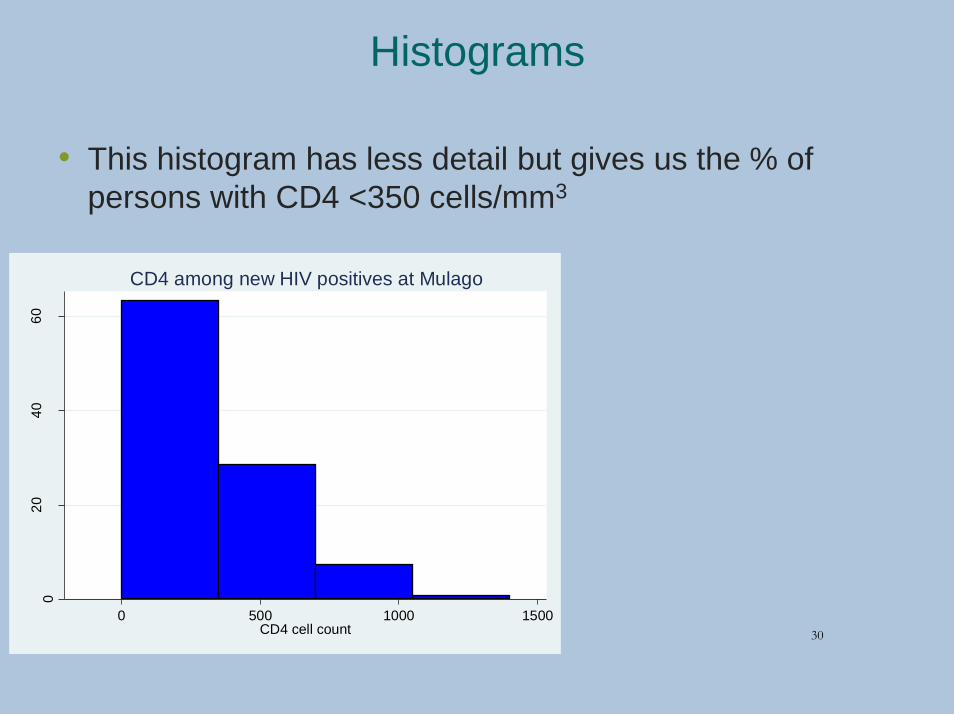
Histograms
• This histogram has less detail but gives us the % of
persons with CD4 <350 cells/mm3
02
04
06
0
Pe
rcen
t
0 500 1000 1500CD4 cell count
CD4 among new HIV positives at Mulago
30
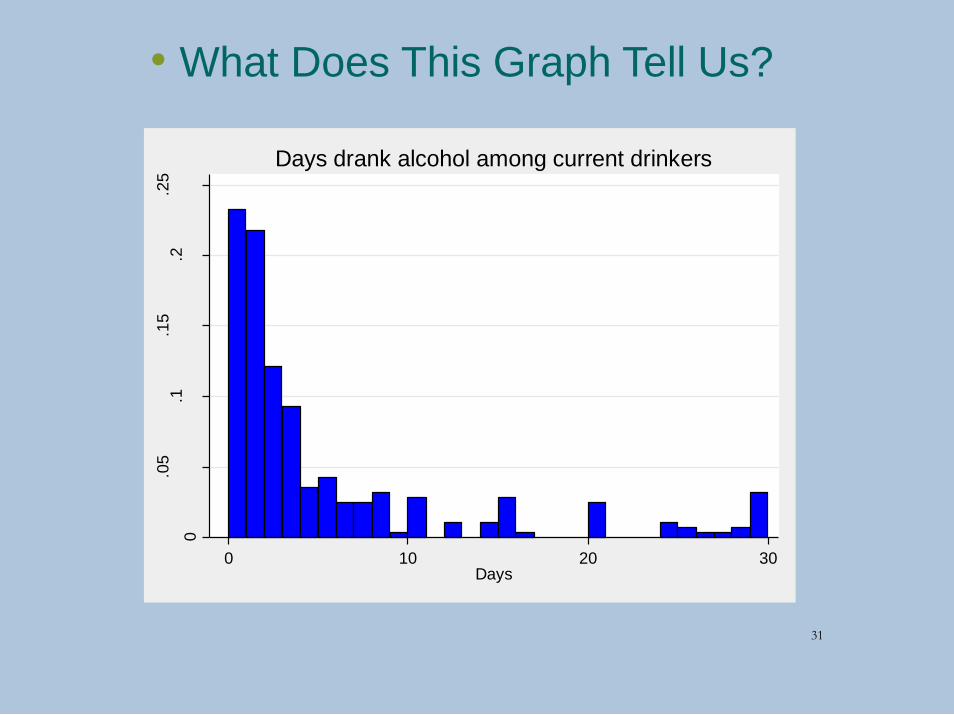
• What Does This Graph Tell Us?
0
.05
.1.1
5.2
.25
Rela
tive fre
q
0 10 20 30Days
Days drank alcohol among current drinkers
31
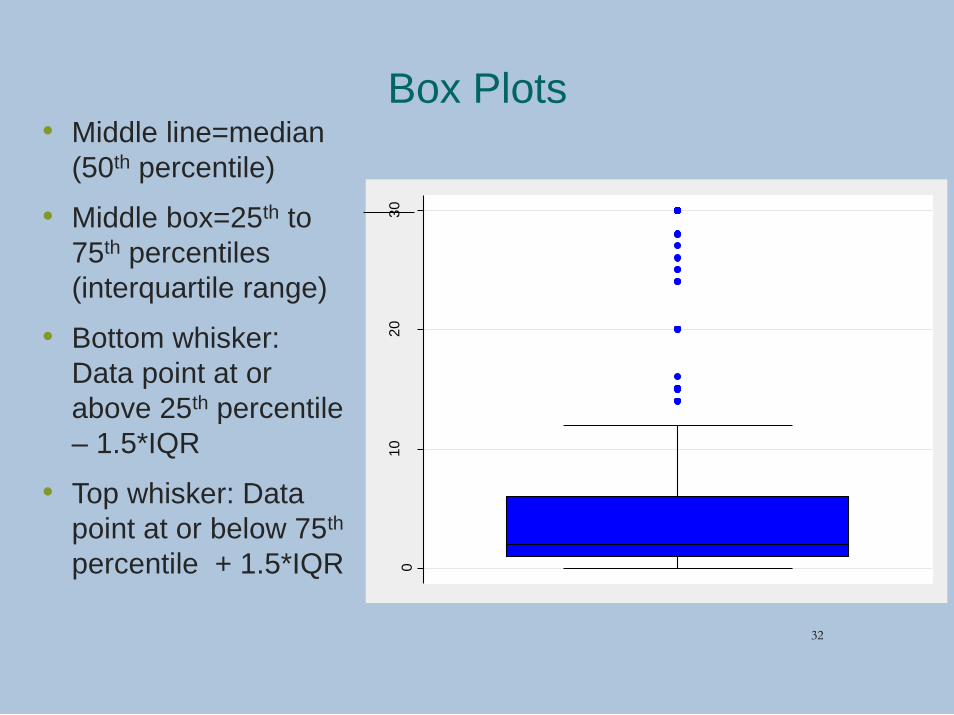
Box Plots• Middle line=median
(50th percentile)
• Middle box=25th to
75th percentiles
(interquartile range)
• Bottom whisker:
Data point at or
above 25th percentile
– 1.5*IQR
• Top whisker: Data
point at or below 75th
percentile + 1.5*IQR 010
20
30
Da
ys d
ran
k a
lco
ho
l
32
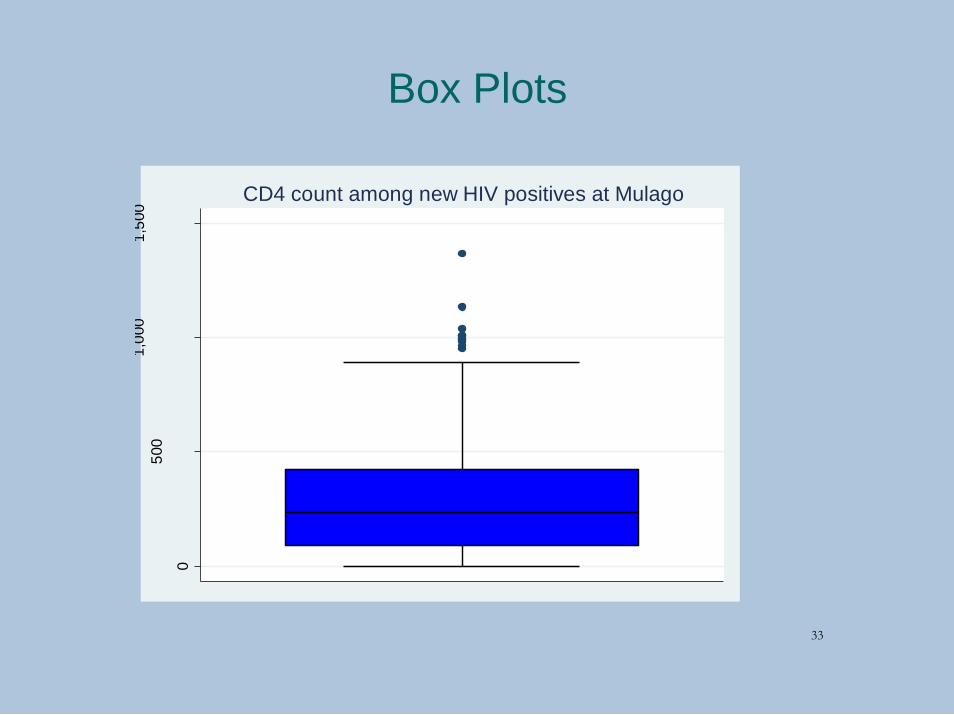
Box Plots
0
500
1,0
00
1,5
00
cd
4co
un
t
CD4 count among new HIV positives at Mulago
33
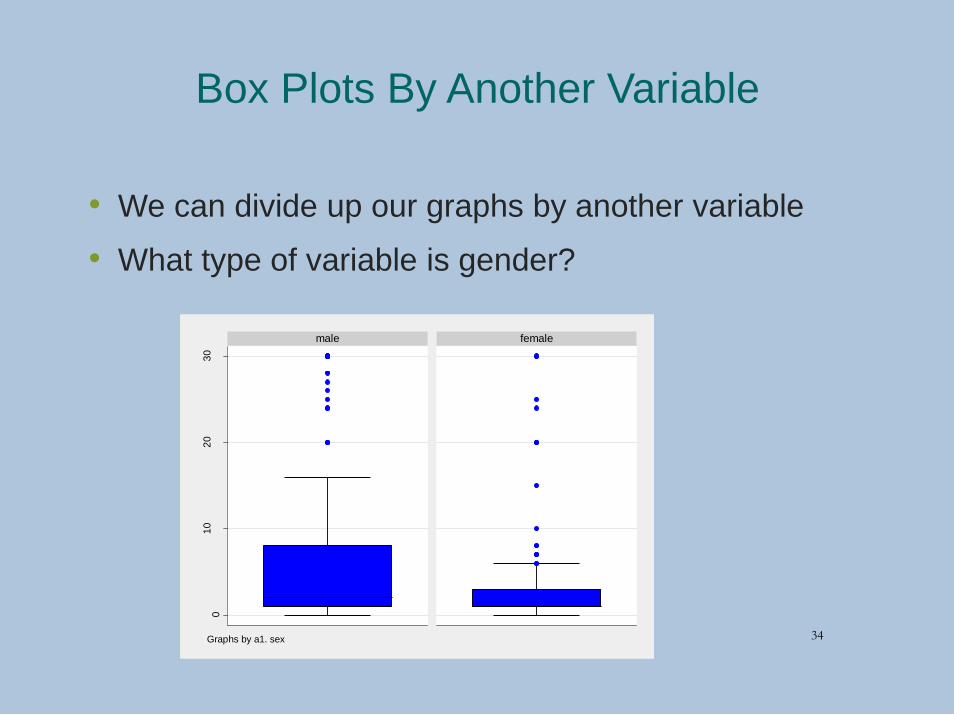
Box Plots By Another Variable
• We can divide up our graphs by another variable
• What type of variable is gender?
01
02
03
0
male female
Da
ys d
ran
k a
lco
ho
l
Graphs by a1. sex 34
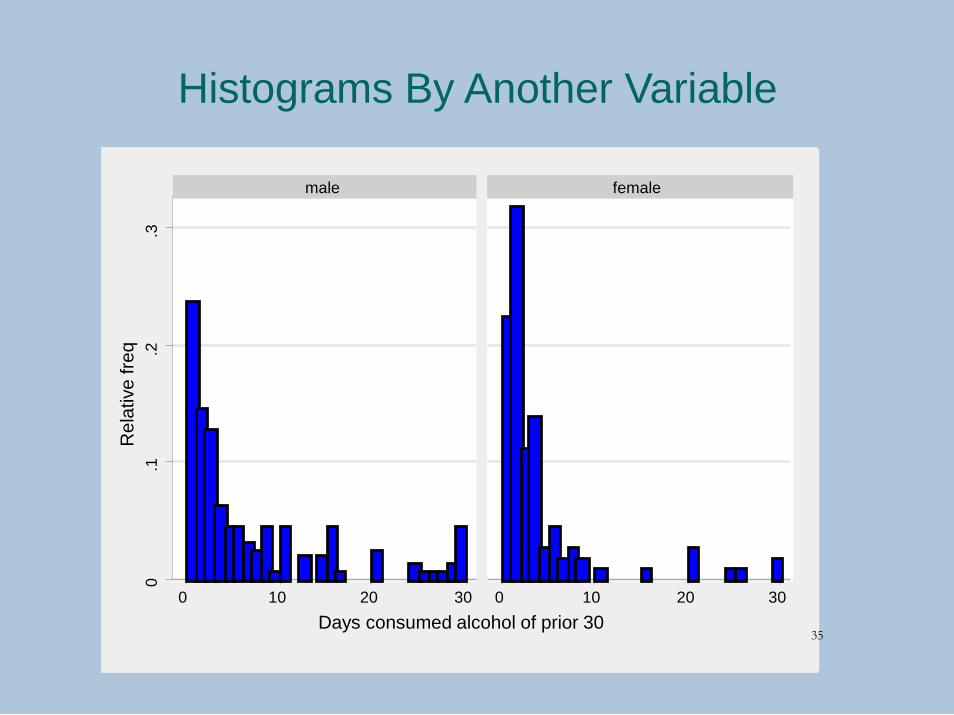
Histograms By Another Variable
0.1
.2.3
0 10 20 30 0 10 20 30
male female
Re
lative
fre
q
Days consumed alcohol of prior 3035
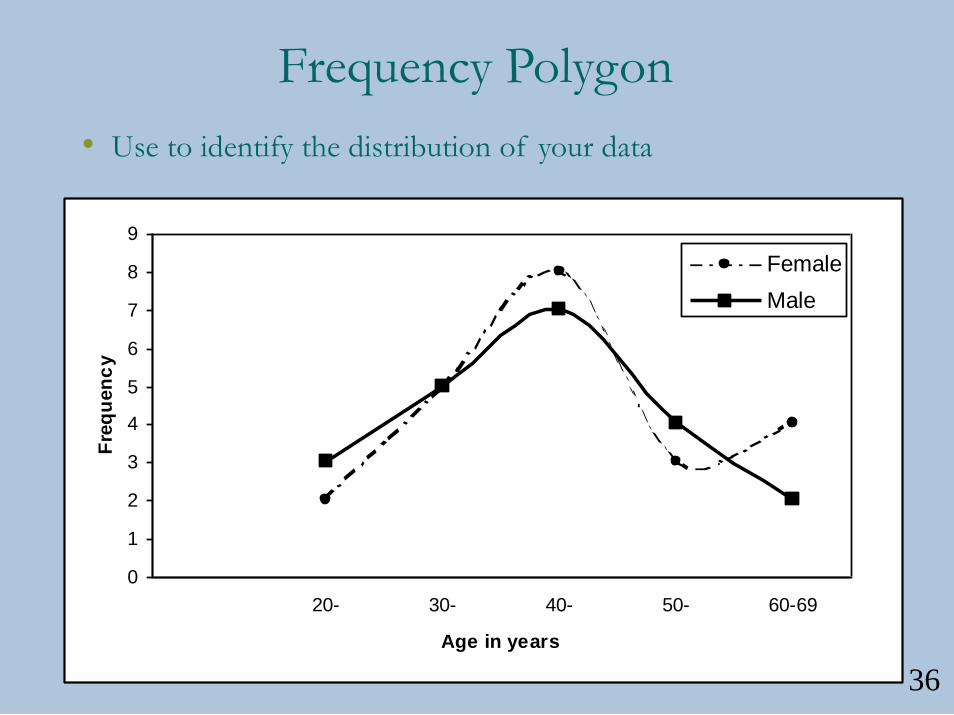
Frequency Polygon
• Use to identify the distribution of your data
0
1
2
3
4
5
6
7
8
9
20- 30- 40- 50- 60-69
Age in years
Fre
qu
en
cy
Female
Male
36
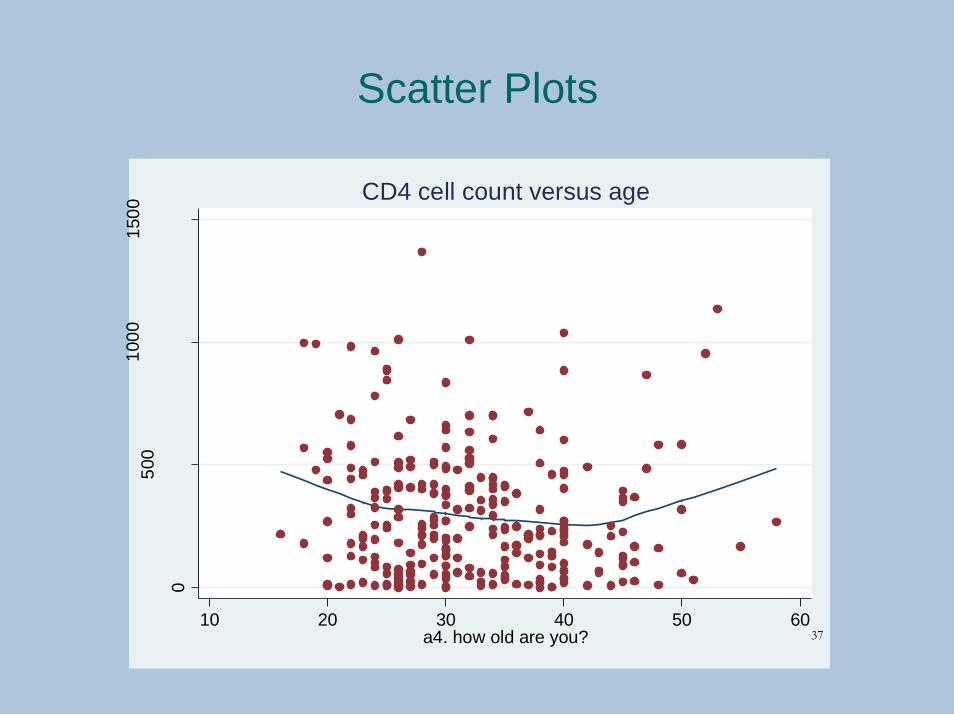
Scatter Plots
0
500
100
01
50
0
CD
4 c
ell
co
un
t
10 20 30 40 50 60a4. how old are you?
CD4 cell count versus age
37
Part Two
Numerical Variable Summaries and
Measures
38
Measures of Central Tendency and
Dispersion
• Where is the center of the data?
• Median
• Mean
• Mode
• How variable the data are?
• Range, Interquartile range
• Variance, Standard Deviation, Standard Error
• Coefficient of variation 39
Measures of Central Tendency: Median
• Median – the 50th percentile = the middle value
• If n is odd: the median is the (n+1)/2
observations (e.g. if n=31 then median is the
16th highest observation)
• If n is even: the median is the average of
the two middle observations (e.g. if n=30
then the median is the average of the 15th
and16th observation
• Example; Median Progression Free Survival in
a cancer Clinical trial sample= 195 days.
40
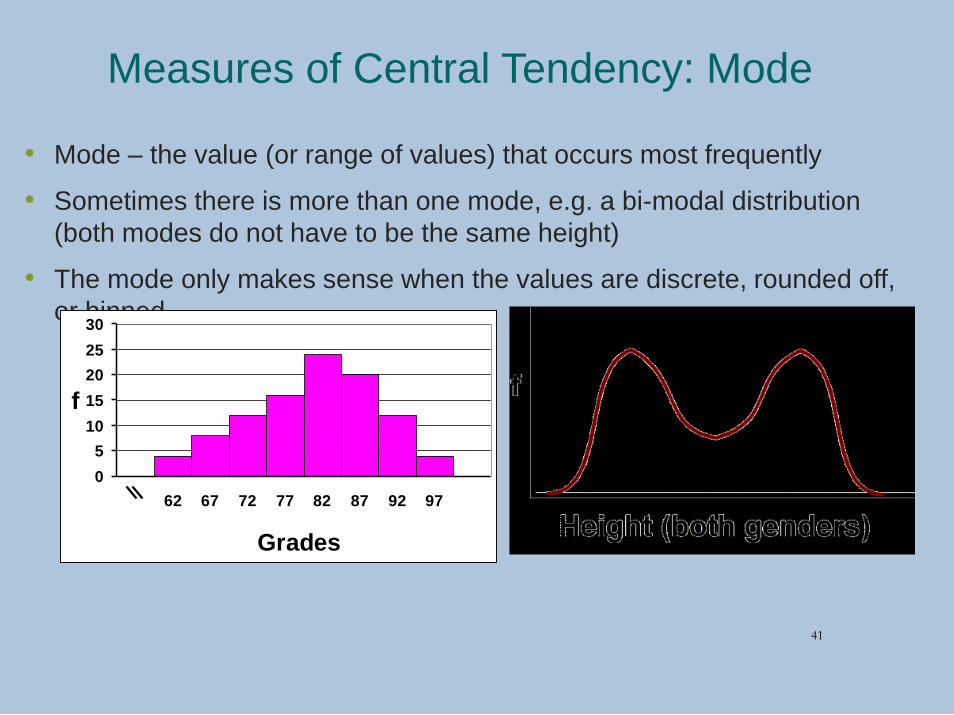
Measures of Central Tendency: Mode
• Mode – the value (or range of values) that occurs most frequently
• Sometimes there is more than one mode, e.g. a bi-modal distribution
(both modes do not have to be the same height)
• The mode only makes sense when the values are discrete, rounded off,
or binned
0
5
10
15
20
25
30
62 67 72 77 82 87 92 97
Grades
f
41
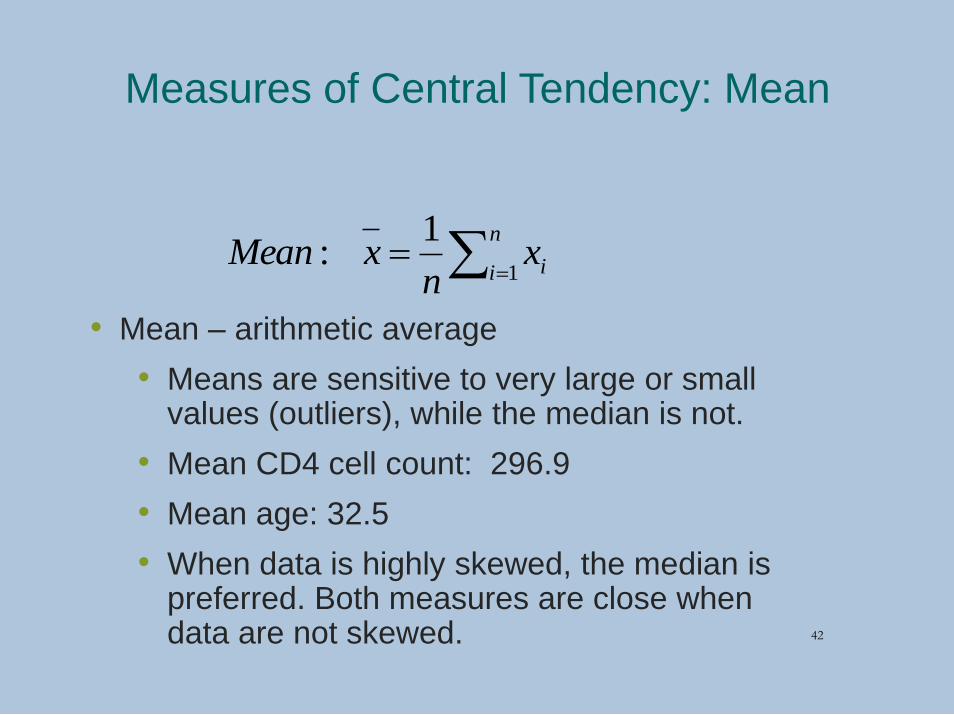
Measures of Central Tendency: Mean
• Mean – arithmetic average
• Means are sensitive to very large or small values (outliers), while the median is not.
• Mean CD4 cell count: 296.9
• Mean age: 32.5
• When data is highly skewed, the median is preferred. Both measures are close when data are not skewed.
n
i ixn
xMean1
1 :
42
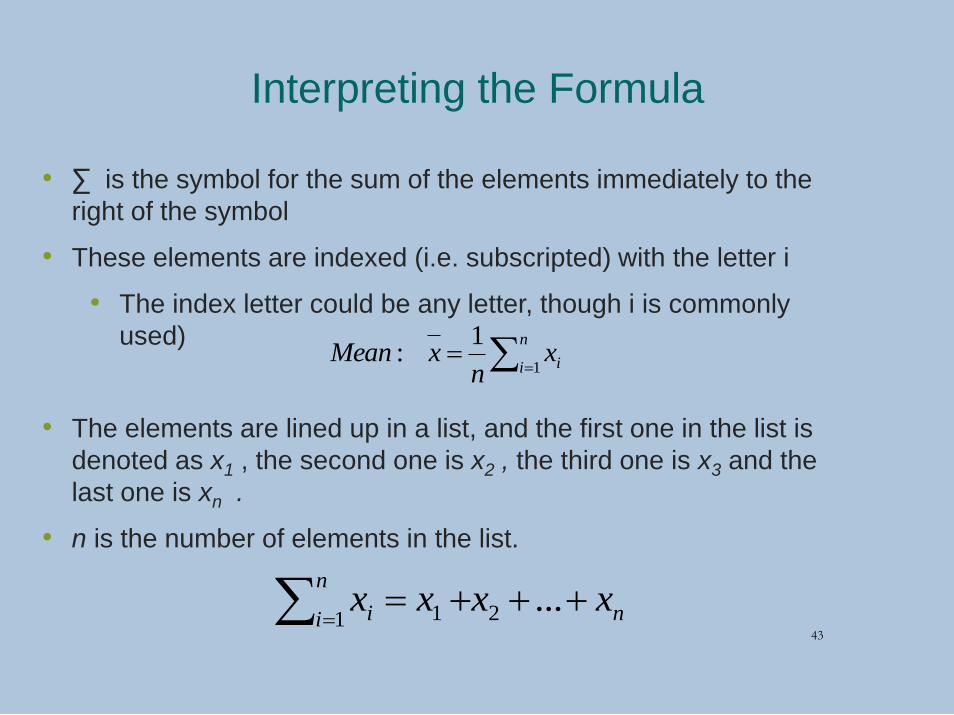
Interpreting the Formula
• ∑ is the symbol for the sum of the elements immediately to the
right of the symbol
• These elements are indexed (i.e. subscripted) with the letter i
• The index letter could be any letter, though i is commonly
used)
• The elements are lined up in a list, and the first one in the list is
denoted as x1 , the second one is x2 , the third one is x3 and the
last one is xn .
• n is the number of elements in the list.
n
i ixn
xMean1
1 :
n
n
i i xxxx ...21 1
43
Measures of Variation: Range , IQR
• 1. Range
• Minimum to maximum or difference (e.g. age
range 15-58 or range=43)
• CD4 cell count range: (0-1368)
• 2. Interquartile range (IQR)
• 25th and 75th percentiles (e.g. IQR for age: 23-
36) or difference (e.g. 13)
• Less sensitive to extreme values
• CD4 cell count IQR: (92-422)
44
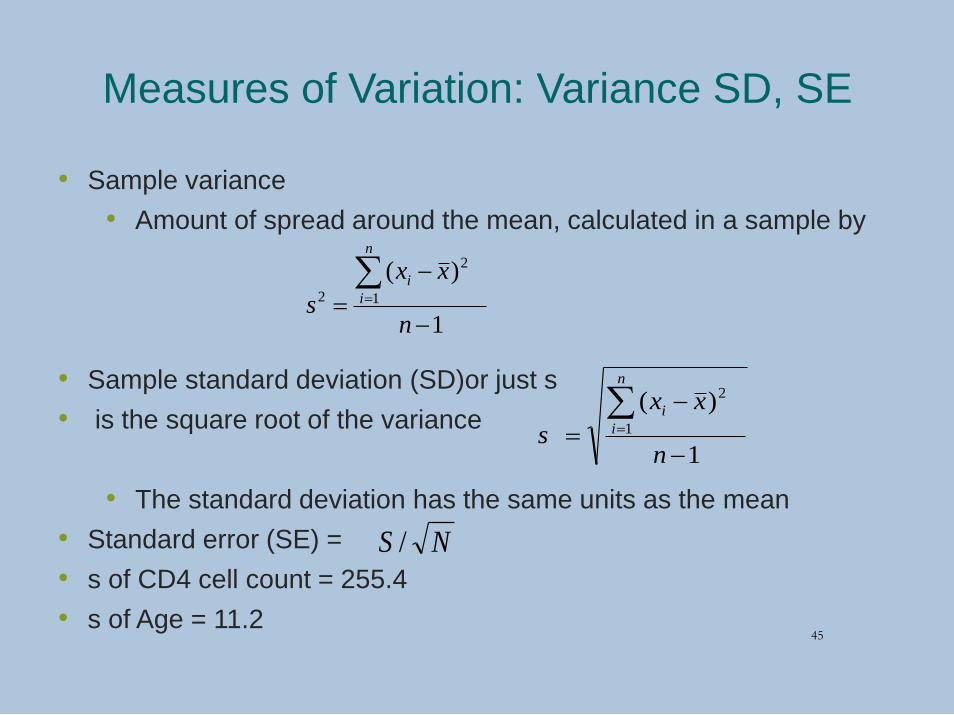
Measures of Variation: Variance SD, SE
• Sample variance
• Amount of spread around the mean, calculated in a sample by
• Sample standard deviation (SD)or just s
• is the square root of the variance
• The standard deviation has the same units as the mean
• Standard error (SE) =
• s of CD4 cell count = 255.4
• s of Age = 11.2
1
)(1
2
2
n
xx
s
n
i
i
1
)(1
2
n
xx
s
n
i
i
NS /
45
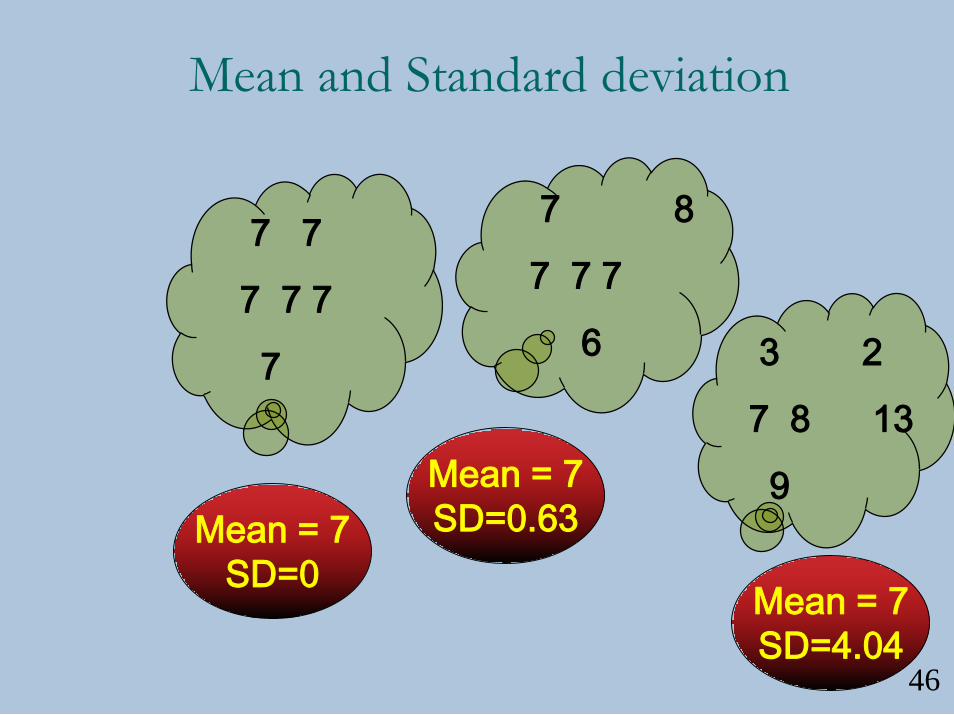
Mean and Standard deviation
7 7
7 7 7
7
7 8
7 7 7
6 3 2
7 8 13
9
Mean = 7
SD=0
Mean = 7
SD=0.63
Mean = 7
SD=4.0446
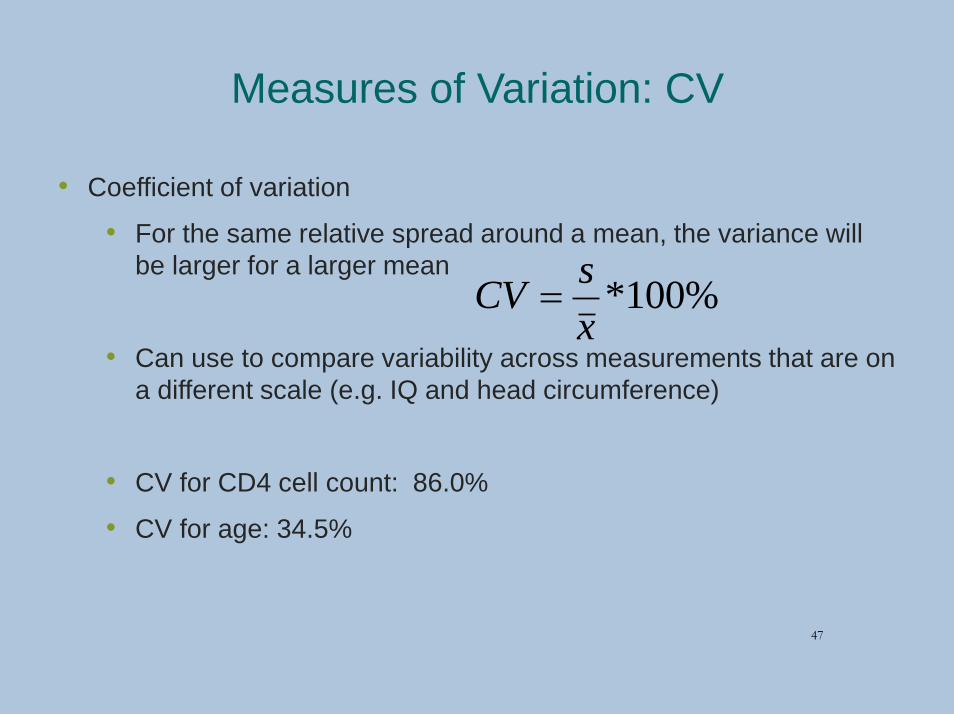
Measures of Variation: CV
• Coefficient of variation
• For the same relative spread around a mean, the variance will
be larger for a larger mean
• Can use to compare variability across measurements that are on
a different scale (e.g. IQ and head circumference)
• CV for CD4 cell count: 86.0%
• CV for age: 34.5%
%100*x
sCV
47
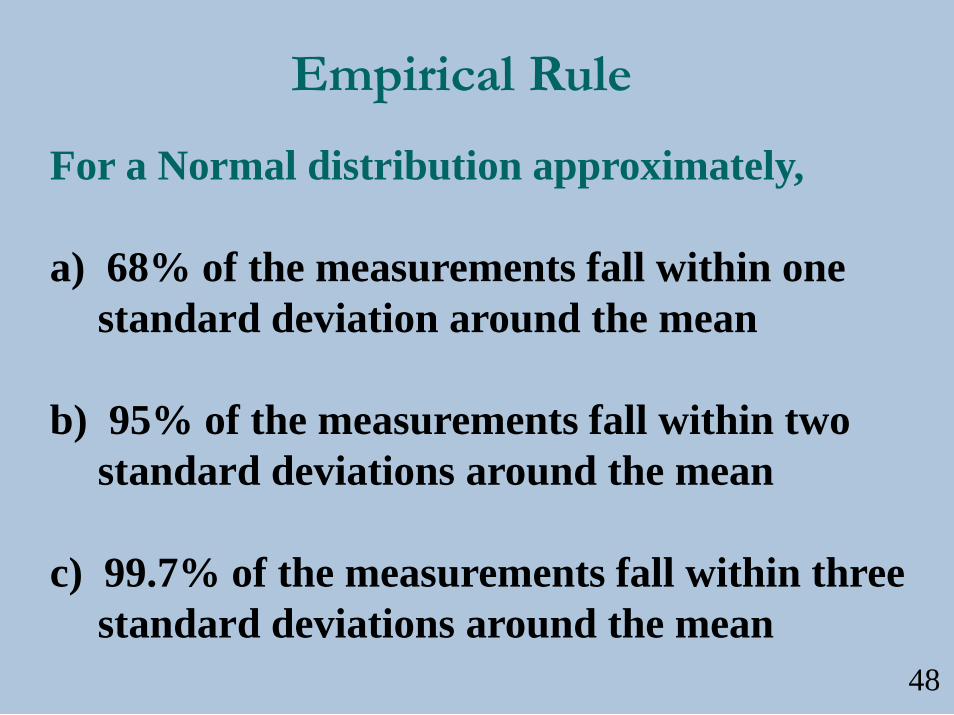
Empirical Rule
For a Normal distribution approximately,
a) 68% of the measurements fall within one
standard deviation around the mean
b) 95% of the measurements fall within two
standard deviations around the mean
c) 99.7% of the measurements fall within three
standard deviations around the mean
48
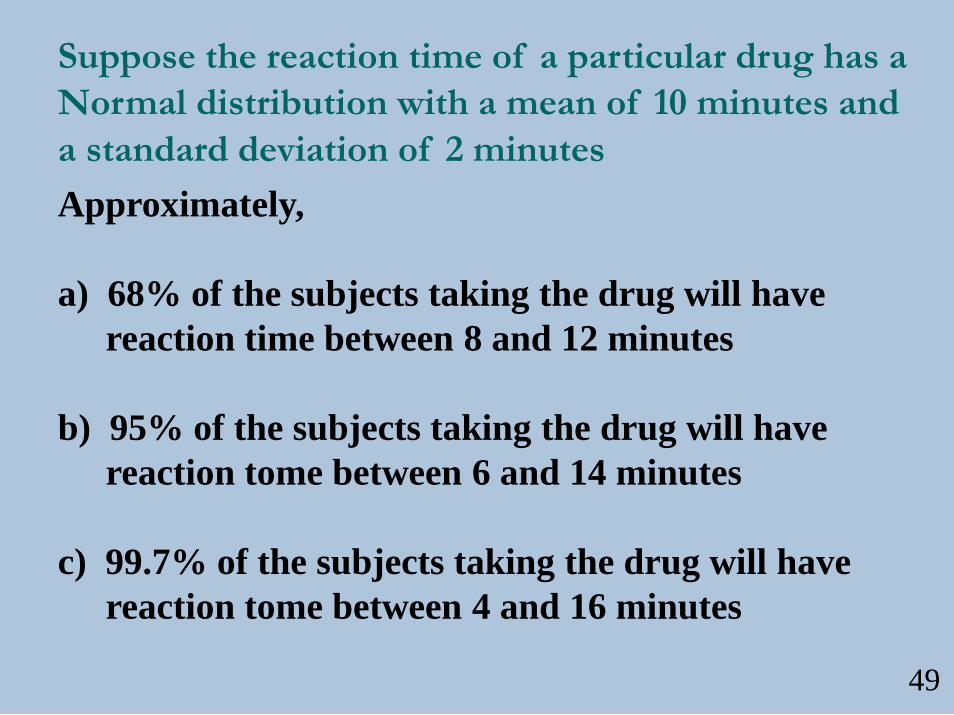
Suppose the reaction time of a particular drug has a
Normal distribution with a mean of 10 minutes and
a standard deviation of 2 minutes
Approximately,
a) 68% of the subjects taking the drug will have
reaction time between 8 and 12 minutes
b) 95% of the subjects taking the drug will have
reaction tome between 6 and 14 minutes
c) 99.7% of the subjects taking the drug will have
reaction tome between 4 and 16 minutes
49
Part Three
Biostatistics in Clinical Research
• Role of statistics
• Statistician role
• In research
• In development
• Study design
• Controlled designs
• Observational studies
• Cohort
• Case-control 50
Role of Statistics
• In general, statistics is a collection of techniques
for extracting information from data, and for
ensuring that the data collected contains the
desired information.
• Statistics provides an objective basis for making
decisions in the presence of uncertainty.
51
Statistician’s Role
• Study design
• Sample size and power calculation
• Protocol development
• Data analysis
• Analysis interpretations
• Reporting
• Publications
52
Statistician’s Role: In Research
• Collaboration
• Design clinical development program
• Design and analyze clinical trials
• Manage the report production process
• Interpret results
• Communicate results
53
Statistician’s Role: In Drug Development
• Develop final statistical statements on the efficacy
and safety for marketing purposes
• Develop publications, package inserts, etc.
• New indications, line extensions, etc.
54
Study Design
• How do we set up the study to answer the scientific
question(s)?
• Two Main categories:
• Controlled designs:
• The experimenter has control “exposure”,
treatments”,
• Randomized Clinical trials.
• Observational Studies:
• Cohort studies
• Case-Control studies55
Controlled Designs
• Not necessarily randomized
e.g. In Cancer research
• Phase I: dose finding
• Phase II: 1 or 2-arm preliminary efficacy
• Phase III: Randomized, efficacy
Choice of gold standard, balancing of treatment arms to
controlling bias.
56
Observational Studies: Cohort
• P r o c e s s :• Identify a cohort• Measure exposure• Follow for a long time
• See who gets disease• Analyze to see if disease is associated with
exposure
• P r o s• Measurement is not biased and usually
measured precisely• Can estimate prevalence and associations, and
relative risks• Cons
• Very expensive• Extremely expensive if outcome of interest is rare• Sometimes we don’t know all of the
exposures to measure
57
Observational Studies: Case-Control
• Process:• Identify a set of patients with disease, and
corresponding set of controls without disease
• Find out retrospectively about exposure
• Analyze data to see if associations exist
• Pros• Relatively inexpensive
• Takes a short time
• Works well even for rare disease
• C o n s• Measurement is often biased and imprecise
(‘recall bias’)
• Cannot estimate prevalence due to sampling 58
Factors Affecting Observation Studies
• Confounders
• a confounding variable (factor)is an extraneous variable in a
statistical model that correlates (directly or inversely) with both
the dependent variable and the independent variable
• Biases
• Self-selection Bias
• self-selection bias arises when individuals select themselves into
a group, causing a biased sample with nonprobability sampling. It
is commonly used to describe situations where the
characteristics of the people which cause them to select
themselves in the group create abnormal or undesirable
conditions in the group.
• Recall bias (next slide)
• Survival bias
• Etc.
59
Recall Bias In Observational Studies
• Recall bias is a systematic error caused by differences in the accuracy or
completeness of the recollections retrieved ("recalled") by study
participants regarding events or experiences from the past
• Sometimes also referred to as response bias, responder bias or reporting
bias.
• This type of measurement bias can be a methodological issue in research
that involves interviews or questionnaires (potentially leading to differential
misclassification of various types of exposure).
• Recall bias can be a particular concern in retrospective studies that use a
case-control design to investigate the etiological causes of a disease or
psychiatric condition. For example, in studies of risk factors for breast
cancer, women who have had the disease may search their memories more
thoroughly than unaffected controls to try to recall exposure to factors that
have been mentioned in the press, such as use of oral contraceptives.60
Survival Bias In Observational Studies
• One analytic bias has persistently appeared in many reported
analyses of observational studies of therapy for HIV infection.
• Longer survival may increase a patient's chance to use treatment
in an observational study.
• Patients who die sooner have less time to select treatment and
thus, by default, are more likely to remain untreated.
• If this is not considered in the data analysis, the estimate of the
treatment effect will be biased.
61
Part Four
Statistical Inference
• Statistical Estimation
• Point estimation
• Confidence Intervals
• Testing of Hypotheses
62
Statistical Estimation
63
1. Point estimation
• Estimating a population parameter by one value: Sample mean, sample
SD, Sample Median
• It is a sample dependent
2. Confidence Interval
• CI for a parameter is a random interval constructed from data in such a
way that the probability that the interval contains the true value of the
parameter can be specified before the data are collected.
3. Estimator.
• An estimator is a rule for "guessing" the value of a population parameter
based on a random sample from the population.
• An estimator is a random variable, because its value depends on which
particular sample is obtained, which is random. A canonical example of
an estimator is the sample mean, which is an estimator of the population
mean.
Confidence level
• The confidence level of a confidence interval is the chance that
the interval that will result once data are collected will contain
the corresponding parameter.
• If one computes confidence intervals again and again from
independent data, the long-term limit of the fraction of
intervals that contain the parameter is the confidence level.
• 95% Confidence interval (95% CI),…
Hypothesis testing
• Forming of Hypothesis
• Null Hypothesis (H0)
• Alternative Hypothesis (H1) or (Ha)
• A null hypothesis (typically that there is no effect) is compared with an alternative hypothesis (typically that there is an effect, or that there is an effect of a particular sign).
• For example, in evaluating whether a new cancer treatment works, the null hypothesis typically would be that the remedy does not work, while the alternative hypothesis would be that the remedy does work.
• .
Hypothesis testing
• When the data are sufficiently improbable under the
assumption that the null hypothesis is true, the null
hypothesis is rejected in favor of the alternative hypothesis.
• This does not imply that the data are probable under the
assumption that the alternative hypothesis is true, nor that
the null hypothesis is false, nor that the alternative
hypothesis is true.
• Statistical hypothesis testing is making a decision between
rejecting or not rejecting a null hypothesis, on the basis of a
set of observations
66
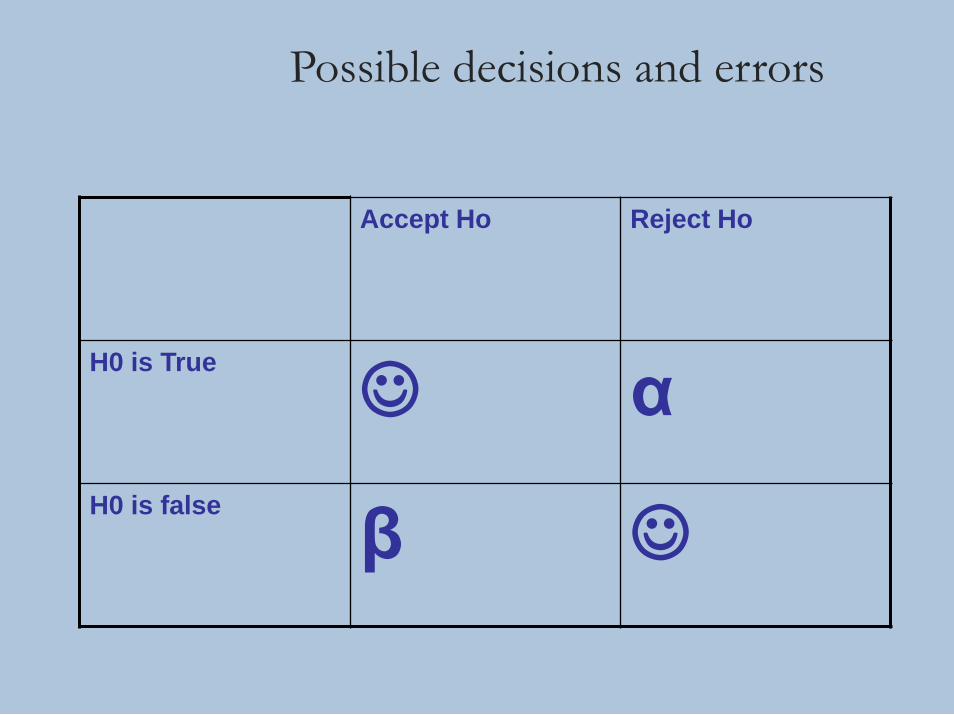
Possible decisions and errors
Accept Ho Reject Ho
H0 is True
α
H0 is false
β
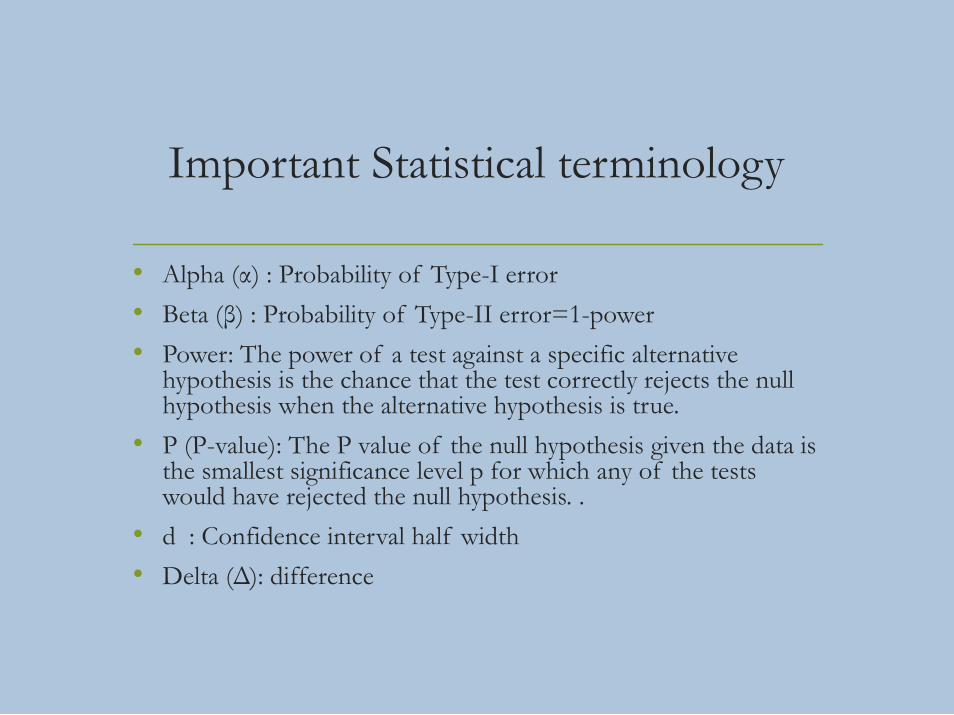
Important Statistical terminology
• Alpha (α) : Probability of Type-I error
• Beta (β) : Probability of Type-II error=1-power
• Power: The power of a test against a specific alternative hypothesis is the chance that the test correctly rejects the null hypothesis when the alternative hypothesis is true.
• P (P-value): The P value of the null hypothesis given the data is the smallest significance level p for which any of the tests would have rejected the null hypothesis. .
• d : Confidence interval half width
• Delta (Δ): difference

QUESTIONS???
Contact Me:
Ramses Sadek
69
![Mohamad Sadek Jouhari , Sinjar Touhmeh2 1 · 2015. 6. 12. · Sadek Jouhari , 2014 et al[6]. make an experimental study of thermal performance in steady- state condition for (FP &](https://img.pdfslide.us/doc/110x75/61220e5310509e2e7c60b952/mohamad-sadek-jouhari-sinjar-touhmeh2-1-2015-6-12-sadek-jouhari-2014-et.jpg)