Embed Size (px)
Citation preview
Aviation HazardsTalking Points, Notes and Extras (Extensive List of Links)
Page 1
Welcome/Intro Page.“Airborne Trailblazer” by Ms. Lane E. Wallace
Page 2
William Henry Dines…famous meteorologist of the late 19th through early 20th century. Developed the Pressure Tube (Dines) Anemometer. Did much of his best and most renown work on upper air meteorology – involving kites, (later) balloons and meteorographs (starting in 1901). His meteorographs where famous for being small, lightweight (2oz.) and economical. Member of the Royal Meteorological Society from 1881 until his death in 1928 (president from 1901 through 1902).
The “difficulties” he refers to are with regard to both pilot and (forecast) meteorologist – and were: Wind, fog, and clouds.
These and other “difficulties” will be addressed throughout the rest of this session.
Page 3
Will start out with an overview to the structure of aviation forecasting and the statistics of the hazards themselves.Will then proceed to the six primary categories of hazards (with sub-categories of course).Will end with a look at new or future products.
Page 4
Including:Wind (included to one extent or another in nearly all the other categories too).
Turbulence - Severe Turbulence, Jet Stream Turbulence, Low Level Wind Shear, New Graphical Turbulence Guidance
Icing – Types and Dangers
Ceilings - Low Cloud Ceilings, Low Cloud Base Product, Cloud Climatology Visibility - Radiation Fog, Advection Fog, Fire Weather and Smoke, Volcanic Weather, Smoke and Ash, Snow Obscuration, Rain Obscuration, Smog/Haze Obscuration, Sand and Dust Storms.
Convection - Convective Downbursts (Micro- and Macro-), Hail, Tornadoes, Lightning
Terrain and Aviation Weather
Other Hazards – Including Tropical Cyclones, Volcanoes, Birds, etc…
Page 5 (Plus 3)
Aviation Weather Center (AWC) – A NOAA/NWS National Support Center that disseminates consistent, timely and accurate weather information for the world airspace system. Disseminates In-flight advisories (AIRMETs, SIGMETs) and provides a portal to much aviation data, such as Aviation Digital Data Service(ADDS).
An AIRMET (AIRman's METeorological Information) advises of weather potentially hazardous to all aircraft but that does not meet SIGMET criteria.
SIGMETS (Significant Meteorological Information) are issued and amended to warn pilots of weather conditions that are potentially hazardous to all size aircraft and all pilots, such as severe icing or severe turbulence. Convective SIGMETS are issued to warn all aircraft and pilots of severe convective activity (severe thunderstorms, low level wind shear, severe turbulence or icing).
Aviation Digital Data Service (ADDS) is available from the Aviation Weather Center (AWC) and makes available to the aviation community text, digital and graphical forecasts, analyses, and observations of aviation-related weather variables. “To provide better information to pilots on the location severity of weather hazard areas, and better methods of using weather information to make safe decisions on how and when to make a flight.”
Center Weather Service Units - The CWSU program was founded by the FAA due to a tragic aircraft accident which was caused by inclement weather! As a direct result of a National Transportation Safety Board (NTSB) examination of the tragedy, the FAA contracted with the NWS for twenty one CWSUs to be placed at each of the Air Route Traffic Control Centers (ARTCC). The goal of CWSU services is to provide critical weather decision support to traffic management personnel to reduce the impact of weather on the safe and efficient flow of air traffic. provide formal weather briefings to FAA supervisors within the Air Route Traffic Control Center (ARTCC) for the day and evening shifts. Verbal briefings are given to individual controllers at the ARTCC and tower control facilities around the airspace, as well as to equipment technicians when weather conditions dictate. Two types of written products are also provided by the CWSU meteorologists. The Meteorological Impact Statement (MIS) is a 4 to 12 hour planning forecast of weather conditions expected to impact the air traffic. The Center Weather Advisory (CWA) is a short-term warning of hazardous weather conditions provided to all aviation interests, including private pilots, towers, flight service stations, and commercial airlines. The input provided by the CWSU meteorologists has resulted in savings to the economy through superior aircraft routes which save flight time, aircraft fuel and other associated costs. Rerouting of aircraft around hazardous weather is based largely on forecasts provided by the CWSU meteorologist. They are in the midst of reorganization which will combine the services of the existing CWSUs (20 + one in Alaska) into two regional centers – Maryland and Kansas City (and leave the one in Alaska alone).
The Center Weather Advisory (CWA) is an aviation weather warning for thunderstorms, icing, turbulence, low cloud ceilings and visibilities.
A Meteorological Impact Statement (MIS) is a 2-12 hour forecast for weather conditions which are expected to impact Air Route Traffic Control Centers
(ARTCC) operations.
National Weather Service -
Terminal Aerodrome Forecast (TAF) is a forecast valid for a 24 (30 hrs for 32 locations in the US – new in November 2008) hour period, and are issued at 6 hour intervals. The TAF is a forecast for a specific airport and includes forecasted wind speed/direction, visibility, ceiling, and type of precipitation or weather phenomenon within 5 statute miles of the center of the airport’s runway complex. (Wind - Visibility - Weather - Sky Condition - Optional Data (e.g. Wind Shear))
For International TAFs, temperature, icing, and turbulence are also forecast. These three elements are not included in National Weather Service (NWS) prepared TAFs. The U.S. has no requirement to forecast temperatures in an aerodrome forecast and the NWS will continue to observe/forecast icing and turbulence in AIRMETs and SIGMETs.
TAF Tactical Decision Aid (NEW) - This product essentially re-codes the TAF into a graphical presentation showing different colors related to impact for each weather parameter (wind, sky, vsby, etc.) See realtime examples here:http://www.srh.noaa.gov/zhu/main/tda_link_page.php?sid=MDW&timeoutput=
Aviation (Area) Forecast DiscussionsThis where the Aviation portion of the NWS Area Forecast Discussion (AFD) comes in…
The AviationFD won’t be (or at least shouldn’t be) a regurgitation of the TAF…rather this is where you will find a basic weather discussion of the wx elements you see on the left (frontal passage, precipitation type, thunderstorms, winds, etc).
The AFD is a true Insight to the forecaster’s thought process…and will (hopefully) give the user a better understanding of the items listed on the left side of the Page.
Many weather enthusiasts, as well as other meteorologists, read the AFD on a daily basis. It truly is one of the NWS’s most valuable products.
(The Hydrometeorological Prediction Center provides the analysis for the Winds and temperature aloft forecasts which the AWC disseminates.)
For more info, go to: http://www.nws.noaa.gov/directives/010/pd01008012d.pdf
Frame 2
ADDS (Aviation Digital Data Service): Became operational in the fall of 2003.Makes available to the aviation community text, digital and graphical forecasts, analyses, and observations of aviation-related weather variables. “Provide better information to pilots on the location severity of weather hazard areas, and better methods of using weather information to make safe decisions on how and when to make a flight.”
The Aviation Digital Data Service (ADDS) makes available to the aviation community through the internet digital and graphical analyses, forecasts and observations of meteorological variables. Developed as the data distribution component of the Aviation Gridded Forecast System (AGFS), ADDS is a joint
effort of NCAR Research Applications Program (RAP), Global Systems Division (GSD) of NOAA's Earth System Research Laboratory (ESRL), and the National Centers for Environmental Prediction (NCEP) Aviation Weather Center (AWC). ADDS makes access to National Weather Service aviation observations and forecasts easy by integrating this information in one location, and by providing visualization tools to assist the application of this information for flight planning.
An AIRMET (AIRman's METeorological Information) advises of weather potentially hazardous to all aircraft but that does not meet SIGMET criteria. AIRMETs are issued by the National Weather Service's Aviation Weather Center (for the lower 48 states and adjacent coastal waters) for the following weather-impacted reasons: Instrument Flight Rules (IFR) or Mountain Obscuration - Ceilings less than 1000 feet and/or visibility less than 3 miles affecting over 50% of the area at one time. Extensive mountain obscuration
Turbulence Moderate Turbulence Sustained surface winds of 30 knots or more at the surface Icing Moderate icing Freezing levels
These AIRMET items are considered to be widespread because they must be affecting or be forecast to affect an area of at least 3000 square miles at any one time. However, if the total area to be affected during the forecast period is very large, it could be that only a small portion of this total area would be affected at any one time. AIRMETs are routinely issued for 6 hour periods beginning at 0245 UTC. AIRMETS are also amended as necessary due to changing weather conditions or issuance/cancellation of a SIGMET.
A SIGMET (SIGnificant METeorological Information) advises of weather potentially hazardous to all aircraft other than convective activity. SIGMETs are issued (for the lower 48 states and adjacent coastal waters) for the following weather-impacted reasons: Severe Icing Severe or Extreme Turbulence Duststorms and sandstorms lowering visibilities to less than three (3)miles Volcanic Ash These SIGMET items are considered to be widespread because they must be affecting or be forecast to affect an area of at least 3000 square miles at any one time. However, if the total area to be affected during the forecast period is very large, it could be that only a small portion of this total area would be affected at any one time.
SIGMETs are issued for 6 hour periods for conditions associated with hurricanes and 4 hours for all other events. If conditions persist beyond the forecast period, the SIGMET is updated and reissued. Convective SIGMETS are issued hourly for thunderstorm-related aviation hazards.
CONVECTIVE SIGMETs are issued in the conterminous U.S. for: Severe surface weather including: surface winds greater than or equal to 50 knots hail at the surface greater than or equal to 3/4 inches in diameter tornadoes Embedded thunderstorms Line of thunderstorms
(Thunderstorms greater than or equal to VIP level 4 affecting 40% or more of an area at least 3000 square miles) Any Convective SIGMET implies severe or greater turbulence, severe icing, and low level wind shear. A Convective SIGMET may be issued for any convective situation which the forecaster feels is hazardous to all categories of aircraft. Bulletins are issued hourly at hour +55 minutes. The text of the bulletin consists of either an observation and a forecast or just a forecast. The forecast is valid for up to 2 hours.
Frame 3
Frame 4
Page 6 (Plus 3)
Frame 2
Frame 3
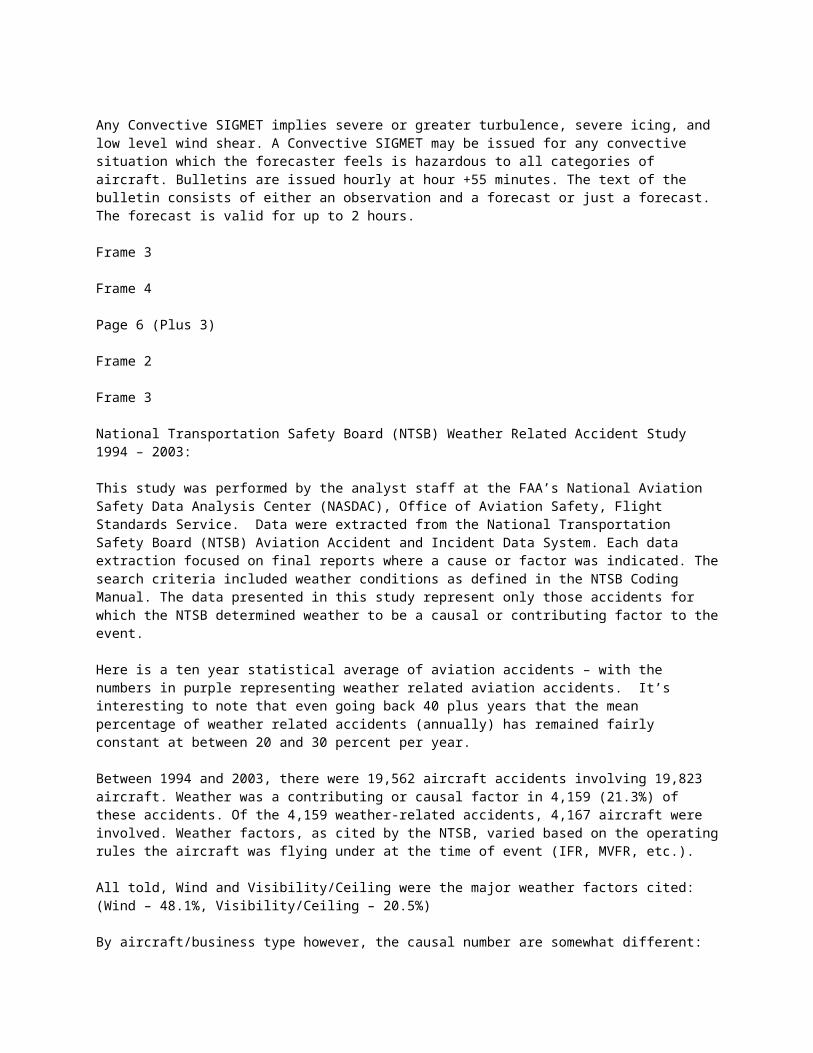
National Transportation Safety Board (NTSB) Weather Related Accident Study1994 – 2003:
This study was performed by the analyst staff at the FAA’s National Aviation Safety Data Analysis Center (NASDAC), Office of Aviation Safety, Flight Standards Service. Data were extracted from the National Transportation Safety Board (NTSB) Aviation Accident and Incident Data System. Each data extraction focused on final reports where a cause or factor was indicated. The search criteria included weather conditions as defined in the NTSB Coding Manual. The data presented in this study represent only those accidents for which the NTSB determined weather to be a causal or contributing factor to the event.
Here is a ten year statistical average of aviation accidents – with the numbers in purple representing weather related aviation accidents. It’s interesting to note that even going back 40 plus years that the mean percentage of weather related accidents (annually) has remained fairly constant at between 20 and 30 percent per year.
Between 1994 and 2003, there were 19,562 aircraft accidents involving 19,823 aircraft. Weather was a contributing or causal factor in 4,159 (21.3%) of these accidents. Of the 4,159 weather-related accidents, 4,167 aircraft were involved. Weather factors, as cited by the NTSB, varied based on the operating rules the aircraft was flying under at the time of event (IFR, MVFR, etc.).
All told, Wind and Visibility/Ceiling were the major weather factors cited: (Wind – 48.1%, Visibility/Ceiling – 20.5%)
By aircraft/business type however, the causal number are somewhat different:
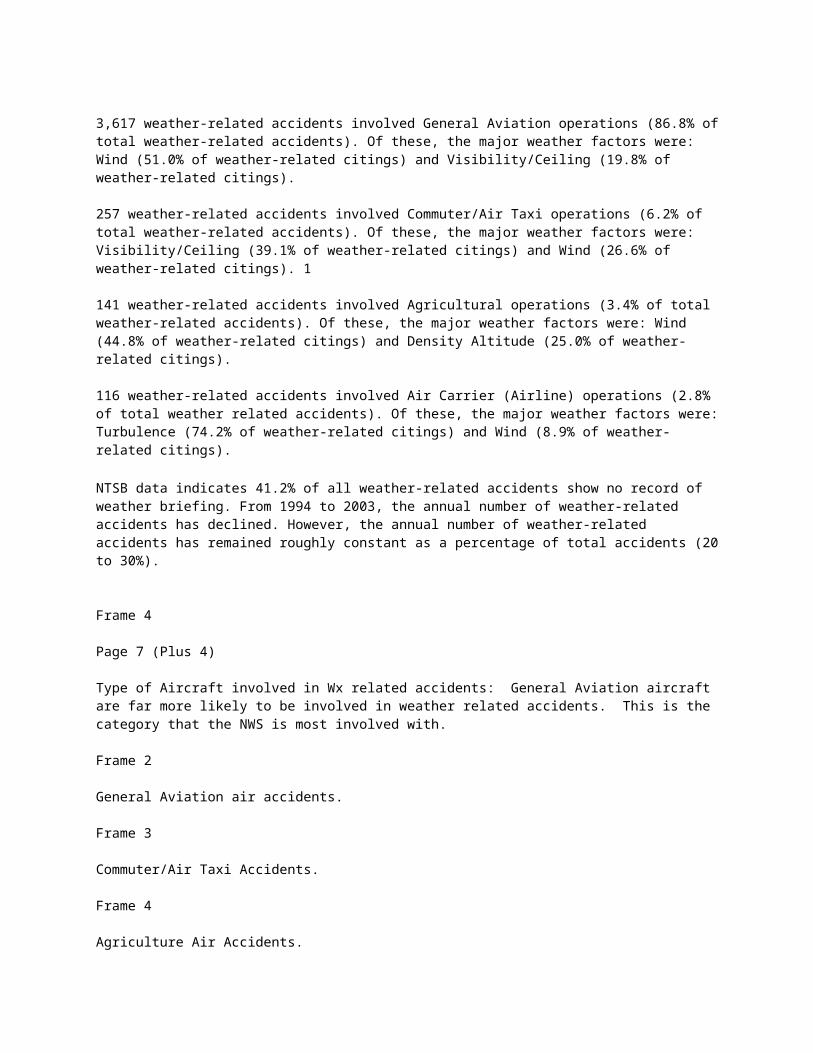
3,617 weather-related accidents involved General Aviation operations (86.8% of total weather-related accidents). Of these, the major weather factors were: Wind (51.0% of weather-related citings) and Visibility/Ceiling (19.8% of weather-related citings).
257 weather-related accidents involved Commuter/Air Taxi operations (6.2% of total weather-related accidents). Of these, the major weather factors were: Visibility/Ceiling (39.1% of weather-related citings) and Wind (26.6% of weather-related citings). 1
141 weather-related accidents involved Agricultural operations (3.4% of total weather-related accidents). Of these, the major weather factors were: Wind (44.8% of weather-related citings) and Density Altitude (25.0% of weather-related citings).
116 weather-related accidents involved Air Carrier (Airline) operations (2.8% of total weather related accidents). Of these, the major weather factors were: Turbulence (74.2% of weather-related citings) and Wind (8.9% of weather-related citings). NTSB data indicates 41.2% of all weather-related accidents show no record of weather briefing. From 1994 to 2003, the annual number of weather-related accidents has declined. However, the annual number of weather-related accidents has remained roughly constant as a percentage of total accidents (20 to 30%).
Frame 4
Page 7 (Plus 4)
Type of Aircraft involved in Wx related accidents: General Aviation aircraft are far more likely to be involved in weather related accidents. This is the category that the NWS is most involved with.
Frame 2
General Aviation air accidents.
Frame 3
Commuter/Air Taxi Accidents.
Frame 4
Agriculture Air Accidents.
Frame 5
Air Carrier (Airline) Accidents.
Page 8 (Plus 4)
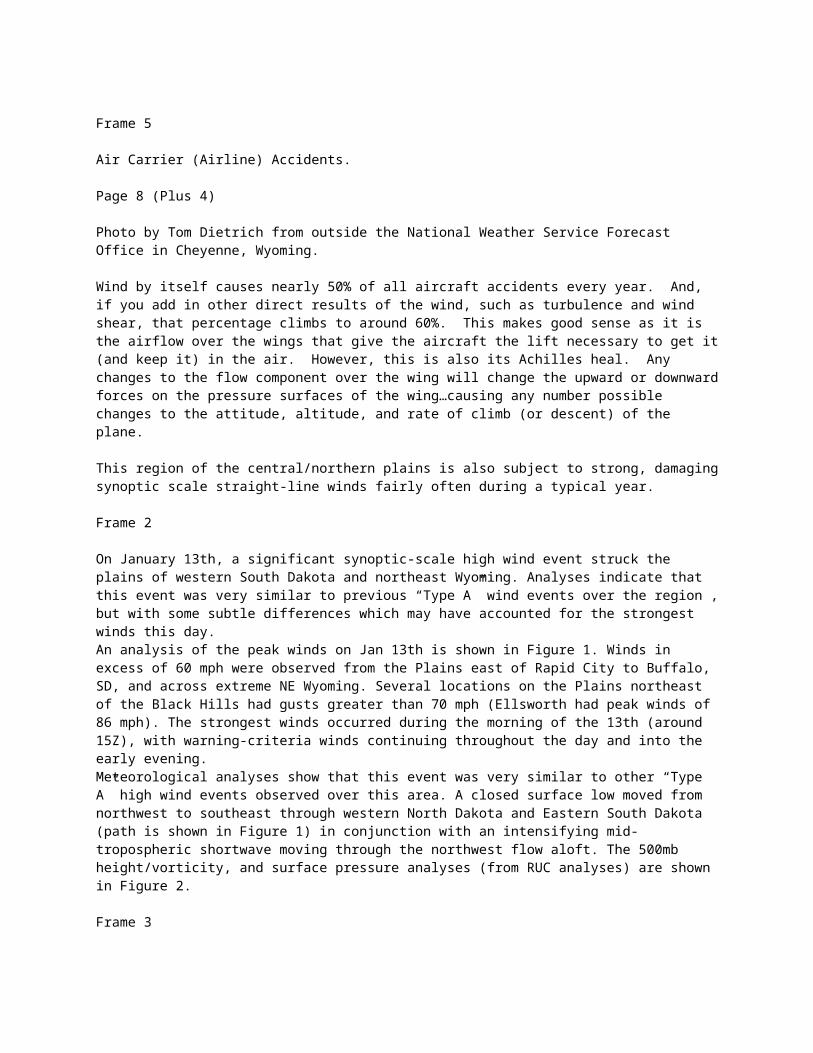
Photo by Tom Dietrich from outside the National Weather Service Forecast
Office in Cheyenne, Wyoming.
Wind by itself causes nearly 50% of all aircraft accidents every year. And, if you add in other direct results of the wind, such as turbulence and wind shear, that percentage climbs to around 60%. This makes good sense as it is the airflow over the wings that give the aircraft the lift necessary to get it (and keep it) in the air. However, this is also its Achilles heal. Any changes to the flow component over the wing will change the upward or downward forces on the pressure surfaces of the wing…causing any number possible changes to the attitude, altitude, and rate of climb (or descent) of the plane.
This region of the central/northern plains is also subject to strong, damaging synoptic scale straight-line winds fairly often during a typical year.
Frame 2
On January 13th, a significant synoptic-scale high wind event struck the plains of western South Dakota and northeast Wyoming. Analyses indicate that this event was very similar to previous “Type A” wind events over the region , but with some subtle differences which may have accounted for the strongest winds this day.An analysis of the peak winds on Jan 13th is shown in Figure 1. Winds in excess of 60 mph were observed from the Plains east of Rapid City to Buffalo, SD, and across extreme NE Wyoming. Several locations on the Plains northeast of the Black Hills had gusts greater than 70 mph (Ellsworth had peak winds of 86 mph). The strongest winds occurred during the morning of the 13th (around 15Z), with warning-criteria winds continuing throughout the day and into the early evening.Meteorological analyses show that this event was very similar to other “Type A” high wind events observed over this area. A closed surface low moved from northwest to southeast through western North Dakota and Eastern South Dakota (path is shown in Figure 1) in conjunction with an intensifying mid-tropospheric shortwave moving through the northwest flow aloft. The 500mb height/vorticity, and surface pressure analyses (from RUC analyses) are shown in Figure 2.
Frame 3
Frame 4
On the morning of March 16 a strong upper level storm system was moving across the northern Rockies. This storm system was pushing a Pacific air mass into the Northern Plains. At the leading edge of this air mass was a strong cold front that extended from the south of a surface low over eastern Montana. Ahead of the front a strong southwest downslope wind developed that pushed warmer air into northeast Wyoming and western South Dakota. Some of the gusts ahead of the front exceeded 60 mph over northeast Wyoming and 40 mph over western South Dakota. Temperatures rose into the lower 70s and even reached 81 at Winner for a high.
By the early afternoon an area of showers developed along the front as it passed through Billings, Montana. These showers produced rain that fell into a dry air mass behind the front and caused winds to increase dramatically. As the front rolled across southeast Montana, several stations reported gusts to 70 mph. These wind gusts prompted the forecasters in Rapid City to issue a High Wind Warning for northwest South Dakota including Rapid City with the
3:00 PM forecast issuance.
The cold front blasted into northwest South Dakota around 4 PM with winds gusting at Buffalo up to 67 mph. As it continued to roar southeastward, it passed Spearfish and then Sturgis with equal vengeance before 5 PM, and then Rapid City Between 5:05 and 5:15 PM. The front continued a steady fast march southeastward through Faith, Wall and Pine Ridge by 6 PM and then into central parts of the South Dakota by 8 PM.
Post analysis indicated that the initial frontal passage contained the strongest winds with gusts of 67 MPH at Buffalo, 61 MPH at Faith and Kadoka, and 72 MPH at Ellsworth Air Force Base.
Frame 5
Page 9 (Plus 4)
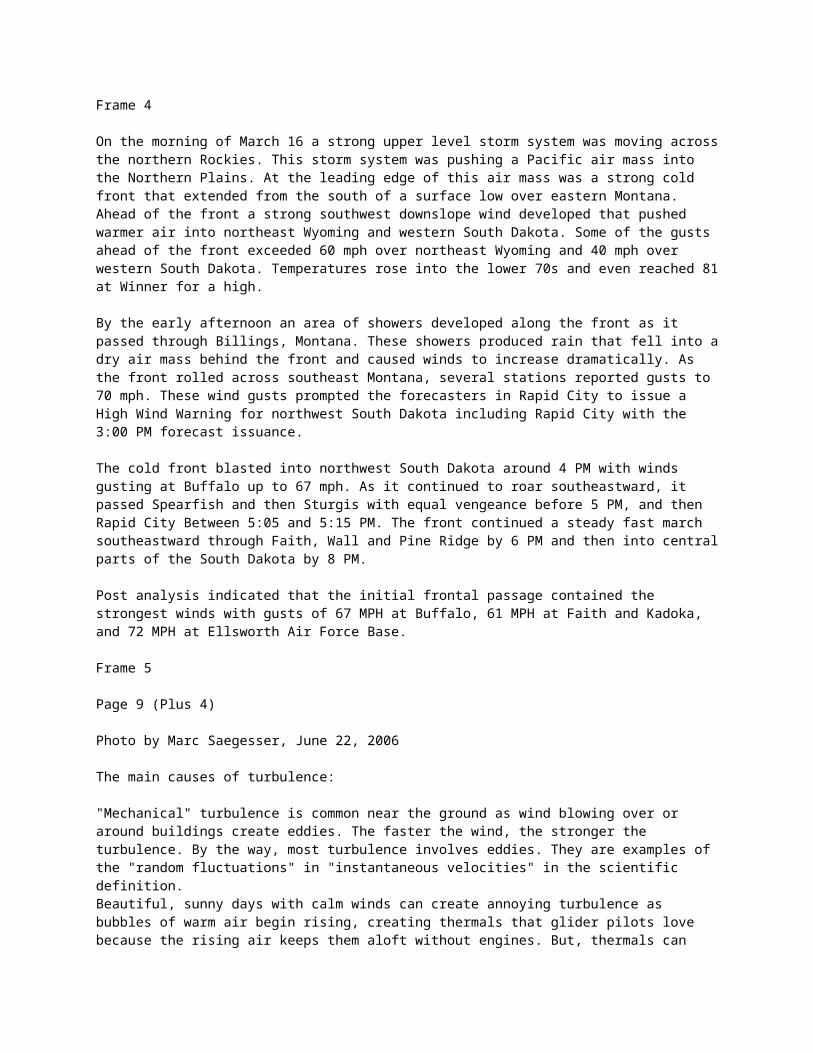
Photo by Marc Saegesser, June 22, 2006
The main causes of turbulence:
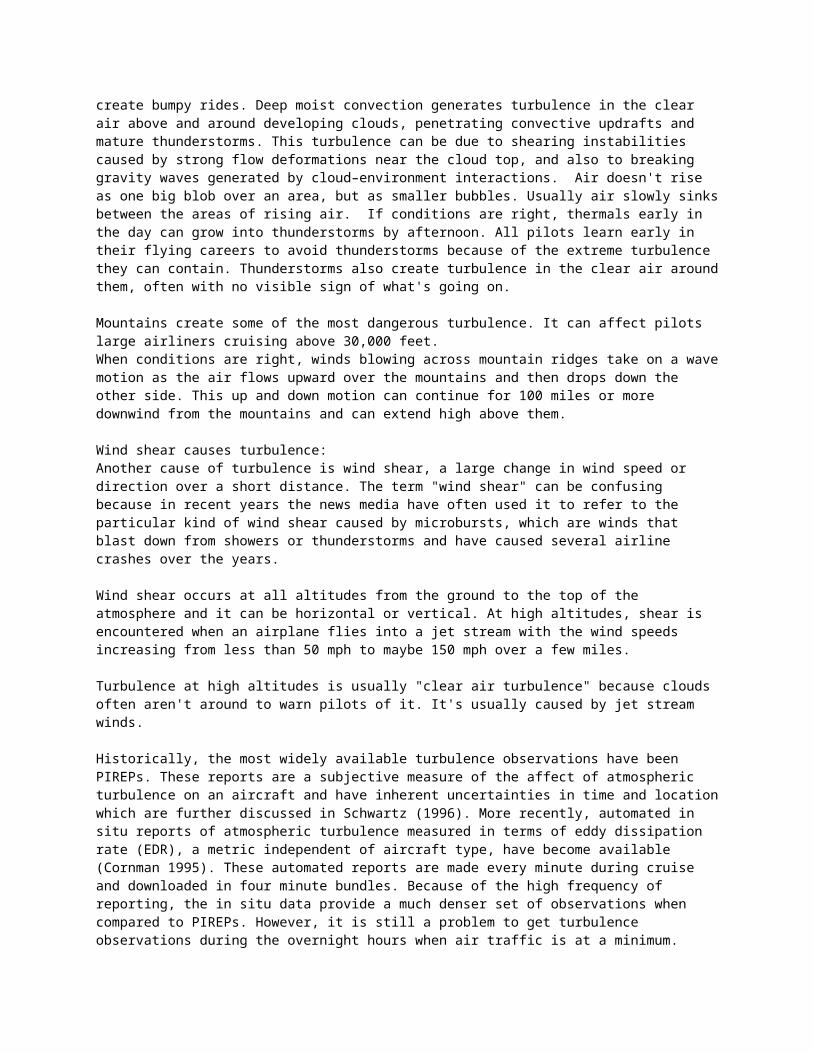
"Mechanical" turbulence is common near the ground as wind blowing over or around buildings create eddies. The faster the wind, the stronger the turbulence. By the way, most turbulence involves eddies. They are examples of the "random fluctuations" in "instantaneous velocities" in the scientific definition. Beautiful, sunny days with calm winds can create annoying turbulence as bubbles of warm air begin rising, creating thermals that glider pilots love because the rising air keeps them aloft without engines. But, thermals can create bumpy rides. Deep moist convection generates turbulence in the clear air above and around developing clouds, penetrating convective updrafts and mature thunderstorms. This turbulence can be due to shearing instabilities caused by strong flow deformations near the cloud top, and also to breaking gravity waves generated by cloud–environment interactions. Air doesn't rise as one big blob over an area, but as smaller bubbles. Usually air slowly sinks between the areas of rising air. If conditions are right, thermals early in the day can grow into thunderstorms by afternoon. All pilots learn early in their flying careers to avoid thunderstorms because of the extreme turbulence they can contain. Thunderstorms also create turbulence in the clear air around them, often with no visible sign of what's going on.
Mountains create some of the most dangerous turbulence. It can affect pilots large airliners cruising above 30,000 feet. When conditions are right, winds blowing across mountain ridges take on a wave motion as the air flows upward over the mountains and then drops down the other side. This up and down motion can continue for 100 miles or more downwind from the mountains and can extend high above them.
Wind shear causes turbulence:Another cause of turbulence is wind shear, a large change in wind speed or direction over a short distance. The term "wind shear" can be confusing because in recent years the news media have often used it to refer to the particular kind of wind shear caused by microbursts, which are winds that blast down from showers or thunderstorms and have caused several airline crashes over the years.
Wind shear occurs at all altitudes from the ground to the top of the
atmosphere and it can be horizontal or vertical. At high altitudes, shear is encountered when an airplane flies into a jet stream with the wind speeds increasing from less than 50 mph to maybe 150 mph over a few miles.
Turbulence at high altitudes is usually "clear air turbulence" because clouds often aren't around to warn pilots of it. It's usually caused by jet stream winds.
Historically, the most widely available turbulence observations have been PIREPs. These reports are a subjective measure of the affect of atmospheric turbulence on an aircraft and have inherent uncertainties in time and location which are further discussed in Schwartz (1996). More recently, automated in situ reports of atmospheric turbulence measured in terms of eddy dissipation rate (EDR), a metric independent of aircraft type, have become available (Cornman 1995). These automated reports are made every minute during cruise and downloaded in four minute bundles. Because of the high frequency of reporting, the in situ data provide a much denser set of observations when compared to PIREPs. However, it is still a problem to get turbulence observations during the overnight hours when air traffic is at a minimum.
Frame 2
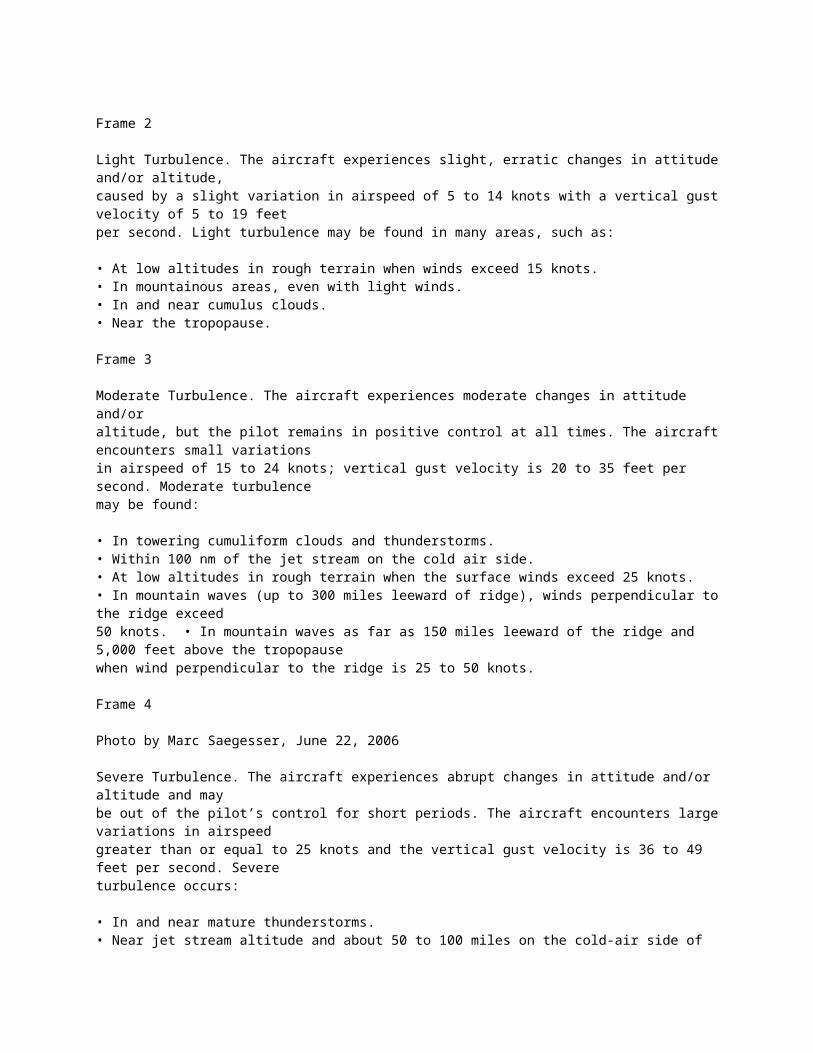
Light Turbulence. The aircraft experiences slight, erratic changes in attitude and/or altitude,caused by a slight variation in airspeed of 5 to 14 knots with a vertical gust velocity of 5 to 19 feetper second. Light turbulence may be found in many areas, such as: • At low altitudes in rough terrain when winds exceed 15 knots.• In mountainous areas, even with light winds.• In and near cumulus clouds.• Near the tropopause. Frame 3
Moderate Turbulence. The aircraft experiences moderate changes in attitude and/oraltitude, but the pilot remains in positive control at all times. The aircraft encounters small variationsin airspeed of 15 to 24 knots; vertical gust velocity is 20 to 35 feet per second. Moderate turbulencemay be found: • In towering cumuliform clouds and thunderstorms.• Within 100 nm of the jet stream on the cold air side.• At low altitudes in rough terrain when the surface winds exceed 25 knots.• In mountain waves (up to 300 miles leeward of ridge), winds perpendicular to the ridge exceed50 knots. • In mountain waves as far as 150 miles leeward of the ridge and 5,000 feet above the tropopausewhen wind perpendicular to the ridge is 25 to 50 knots. Frame 4
Photo by Marc Saegesser, June 22, 2006
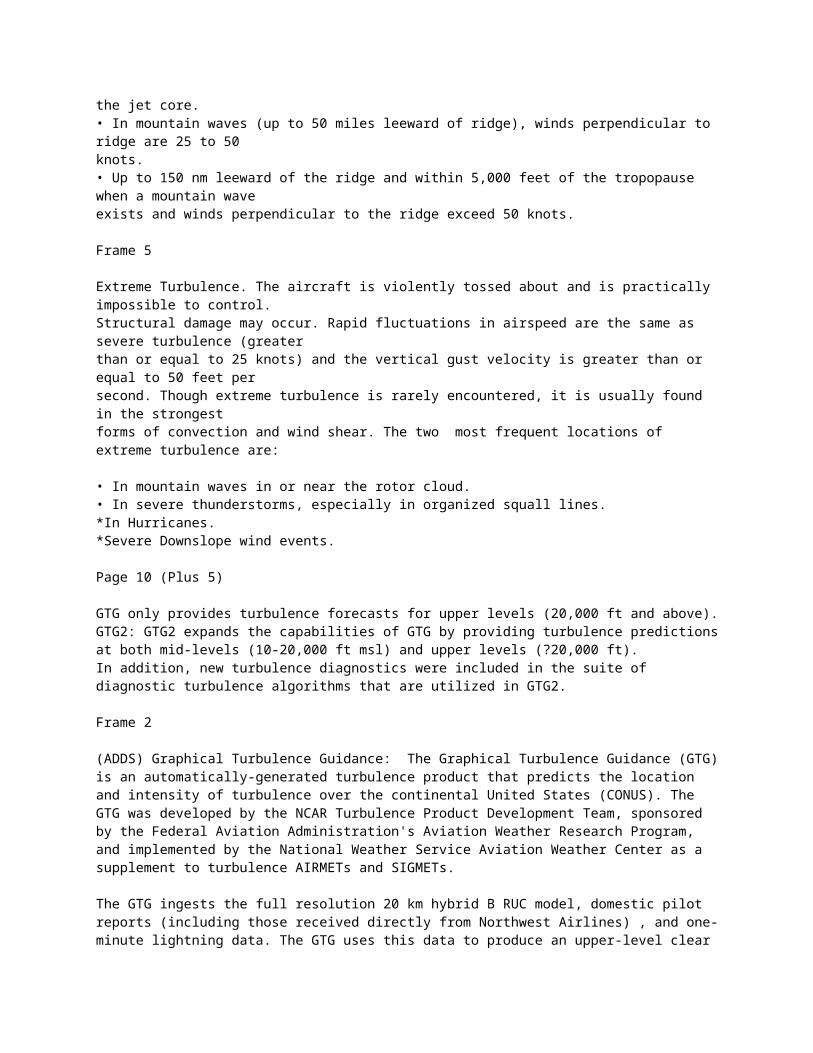
Severe Turbulence. The aircraft experiences abrupt changes in attitude and/or
altitude and maybe out of the pilot’s control for short periods. The aircraft encounters large variations in airspeedgreater than or equal to 25 knots and the vertical gust velocity is 36 to 49 feet per second. Severeturbulence occurs: • In and near mature thunderstorms.• Near jet stream altitude and about 50 to 100 miles on the cold-air side of the jet core.• In mountain waves (up to 50 miles leeward of ridge), winds perpendicular to ridge are 25 to 50knots.• Up to 150 nm leeward of the ridge and within 5,000 feet of the tropopause when a mountain waveexists and winds perpendicular to the ridge exceed 50 knots. Frame 5
Extreme Turbulence. The aircraft is violently tossed about and is practically impossible to control.Structural damage may occur. Rapid fluctuations in airspeed are the same as severe turbulence (greaterthan or equal to 25 knots) and the vertical gust velocity is greater than or equal to 50 feet persecond. Though extreme turbulence is rarely encountered, it is usually found in the strongestforms of convection and wind shear. The two most frequent locations of extreme turbulence are: • In mountain waves in or near the rotor cloud.• In severe thunderstorms, especially in organized squall lines.*In Hurricanes. *Severe Downslope wind events.
Page 10 (Plus 5)
GTG only provides turbulence forecasts for upper levels (20,000 ft and above).GTG2: GTG2 expands the capabilities of GTG by providing turbulence predictions at both mid-levels (10-20,000 ft msl) and upper levels (?20,000 ft). In addition, new turbulence diagnostics were included in the suite of diagnostic turbulence algorithms that are utilized in GTG2.
Frame 2
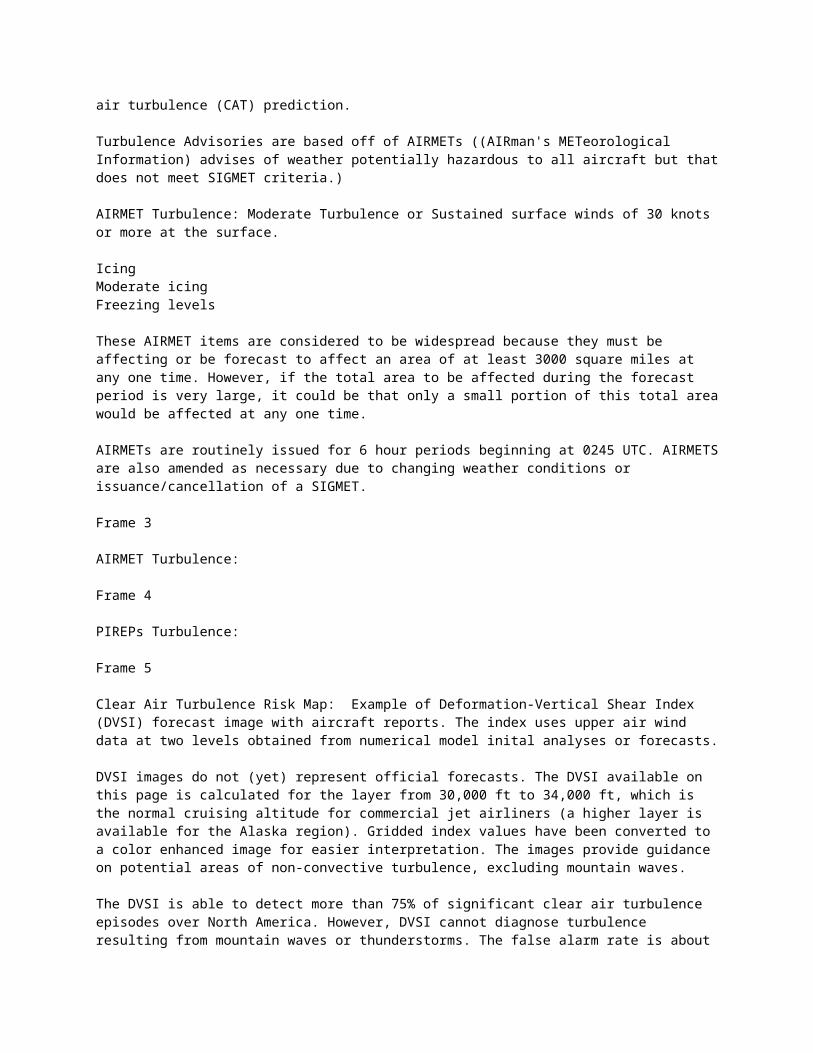
(ADDS) Graphical Turbulence Guidance: The Graphical Turbulence Guidance (GTG) is an automatically-generated turbulence product that predicts the location and intensity of turbulence over the continental United States (CONUS). The GTG was developed by the NCAR Turbulence Product Development Team, sponsored by the Federal Aviation Administration's Aviation Weather Research Program, and implemented by the National Weather Service Aviation Weather Center as a supplement to turbulence AIRMETs and SIGMETs.
The GTG ingests the full resolution 20 km hybrid B RUC model, domestic pilot reports (including those received directly from Northwest Airlines) , and one-minute lightning data. The GTG uses this data to produce an upper-level clear air turbulence (CAT) prediction.
Turbulence Advisories are based off of AIRMETs ((AIRman's METeorological Information) advises of weather potentially hazardous to all aircraft but that does not meet SIGMET criteria.)
AIRMET Turbulence: Moderate Turbulence or Sustained surface winds of 30 knots or more at the surface.
Icing Moderate icing Freezing levels
These AIRMET items are considered to be widespread because they must be affecting or be forecast to affect an area of at least 3000 square miles at any one time. However, if the total area to be affected during the forecast period is very large, it could be that only a small portion of this total area would be affected at any one time. AIRMETs are routinely issued for 6 hour periods beginning at 0245 UTC. AIRMETS are also amended as necessary due to changing weather conditions or issuance/cancellation of a SIGMET.
Frame 3
AIRMET Turbulence:
Frame 4
PIREPs Turbulence:
Frame 5
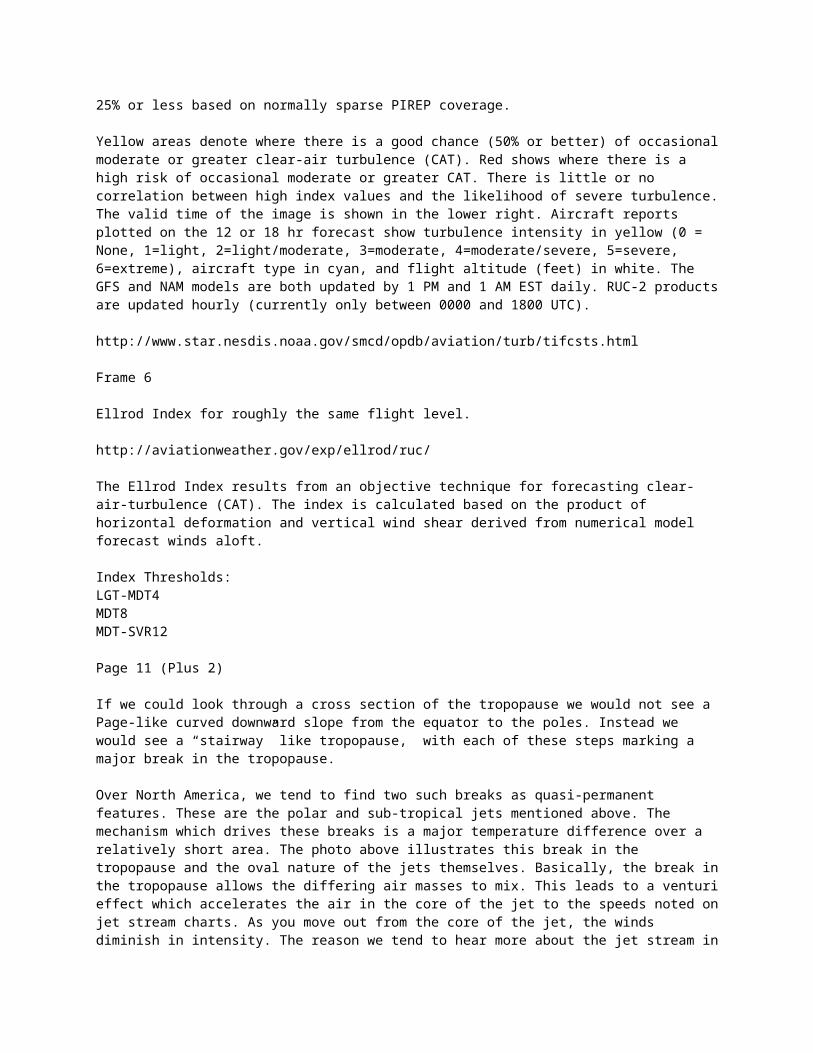
Clear Air Turbulence Risk Map: Example of Deformation-Vertical Shear Index (DVSI) forecast image with aircraft reports. The index uses upper air wind data at two levels obtained from numerical model inital analyses or forecasts.
DVSI images do not (yet) represent official forecasts. The DVSI available on this page is calculated for the layer from 30,000 ft to 34,000 ft, which is the normal cruising altitude for commercial jet airliners (a higher layer is available for the Alaska region). Gridded index values have been converted to a color enhanced image for easier interpretation. The images provide guidance on potential areas of non-convective turbulence, excluding mountain waves.
The DVSI is able to detect more than 75% of significant clear air turbulence episodes over North America. However, DVSI cannot diagnose turbulence resulting from mountain waves or thunderstorms. The false alarm rate is about 25% or less based on normally sparse PIREP coverage.
Yellow areas denote where there is a good chance (50% or better) of occasional moderate or greater clear-air turbulence (CAT). Red shows where there is a high risk of occasional moderate or greater CAT. There is little or no correlation between high index values and the likelihood of severe turbulence. The valid time of the image is shown in the lower right. Aircraft reports plotted on the 12 or 18 hr forecast show turbulence intensity in yellow (0 = None, 1=light, 2=light/moderate, 3=moderate, 4=moderate/severe, 5=severe, 6=extreme), aircraft type in cyan, and flight altitude (feet) in white. The GFS and NAM models are both updated by 1 PM and 1 AM EST daily. RUC-2 products
are updated hourly (currently only between 0000 and 1800 UTC).
http://www.star.nesdis.noaa.gov/smcd/opdb/aviation/turb/tifcsts.html
Frame 6
Ellrod Index for roughly the same flight level.
http://aviationweather.gov/exp/ellrod/ruc/
The Ellrod Index results from an objective technique for forecasting clear-air-turbulence (CAT). The index is calculated based on the product of horizontal deformation and vertical wind shear derived from numerical model forecast winds aloft.
Index Thresholds:LGT-MDT4 MDT8 MDT-SVR12
Page 11 (Plus 2)
If we could look through a cross section of the tropopause we would not see a Page-like curved downward slope from the equator to the poles. Instead we would see a “stairway” like tropopause, with each of these steps marking a major break in the tropopause.
Over North America, we tend to find two such breaks as quasi-permanent features. These are the polar and sub-tropical jets mentioned above. The mechanism which drives these breaks is a major temperature difference over a relatively short area. The photo above illustrates this break in the tropopause and the oval nature of the jets themselves. Basically, the break in the tropopause allows the differing air masses to mix. This leads to a venturi effect which accelerates the air in the core of the jet to the speeds noted on jet stream charts. As you move out from the core of the jet, the winds diminish in intensity. The reason we tend to hear more about the jet stream in winter is that this is the season which provides the greatest contrast in temperatures between the pole and the equator.Obviously, jet stream winds and their formative environs can have a significant effect on aviation. These effects run the gamut from a welcomed west to east speed boost to clear air turbulence severe enough to do major damage to an aircraft.
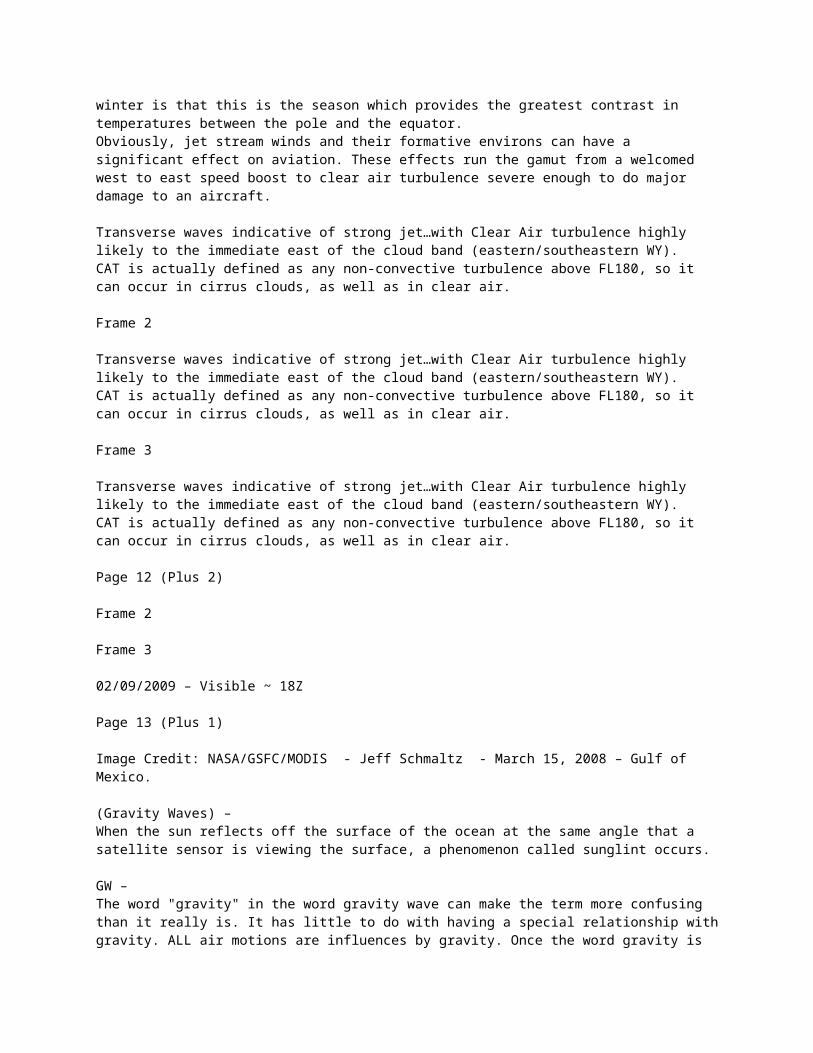
Transverse waves indicative of strong jet…with Clear Air turbulence highly likely to the immediate east of the cloud band (eastern/southeastern WY). CAT is actually defined as any non-convective turbulence above FL180, so it can occur in cirrus clouds, as well as in clear air.
Frame 2
Transverse waves indicative of strong jet…with Clear Air turbulence highly likely to the immediate east of the cloud band (eastern/southeastern WY). CAT is actually defined as any non-convective turbulence above FL180, so it can occur in cirrus clouds, as well as in clear air.
Frame 3
Transverse waves indicative of strong jet…with Clear Air turbulence highly likely to the immediate east of the cloud band (eastern/southeastern WY). CAT is actually defined as any non-convective turbulence above FL180, so it can occur in cirrus clouds, as well as in clear air.
Page 12 (Plus 2)
Frame 2
Frame 3
02/09/2009 – Visible ~ 18Z
Page 13 (Plus 1)
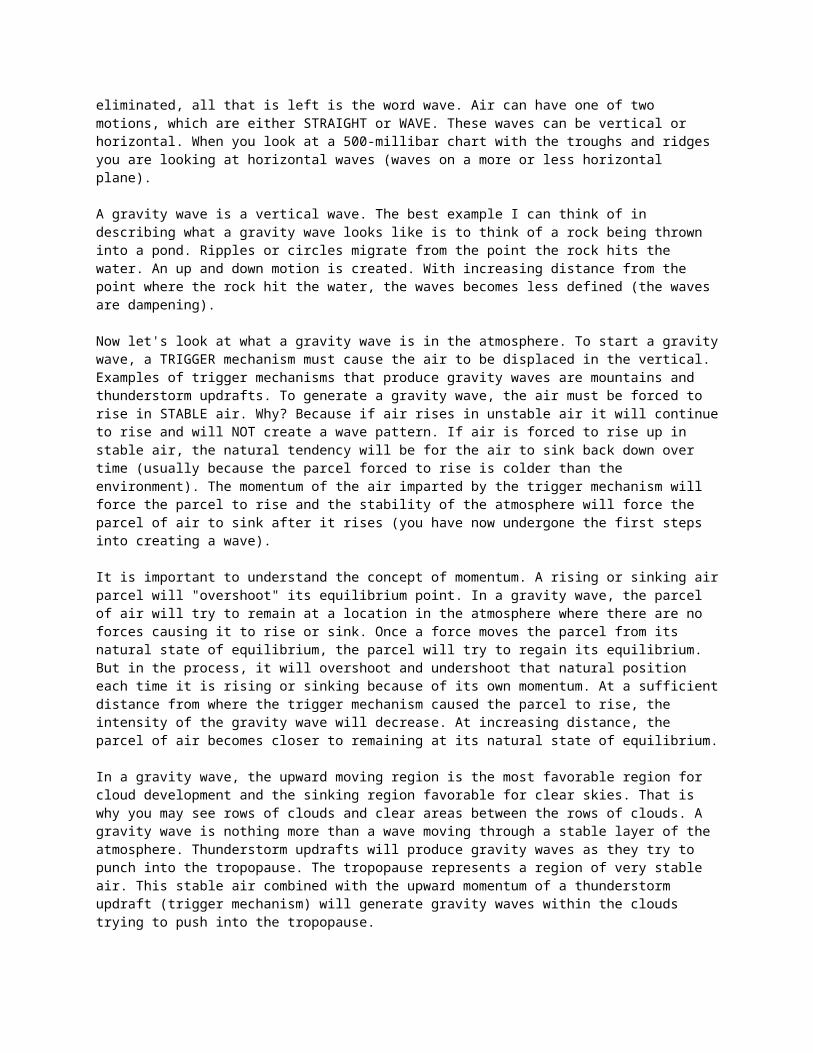
Image Credit: NASA/GSFC/MODIS - Jeff Schmaltz - March 15, 2008 – Gulf of Mexico.
(Gravity Waves) – When the sun reflects off the surface of the ocean at the same angle that a satellite sensor is viewing the surface, a phenomenon called sunglint occurs.
GW –The word "gravity" in the word gravity wave can make the term more confusing than it really is. It has little to do with having a special relationship with gravity. ALL air motions are influences by gravity. Once the word gravity is eliminated, all that is left is the word wave. Air can have one of two motions, which are either STRAIGHT or WAVE. These waves can be vertical or horizontal. When you look at a 500-millibar chart with the troughs and ridges you are looking at horizontal waves (waves on a more or less horizontal plane).
A gravity wave is a vertical wave. The best example I can think of in describing what a gravity wave looks like is to think of a rock being thrown into a pond. Ripples or circles migrate from the point the rock hits the water. An up and down motion is created. With increasing distance from the point where the rock hit the water, the waves becomes less defined (the waves are dampening).
Now let's look at what a gravity wave is in the atmosphere. To start a gravity wave, a TRIGGER mechanism must cause the air to be displaced in the vertical. Examples of trigger mechanisms that produce gravity waves are mountains and thunderstorm updrafts. To generate a gravity wave, the air must be forced to rise in STABLE air. Why? Because if air rises in unstable air it will continue to rise and will NOT create a wave pattern. If air is forced to rise up in stable air, the natural tendency will be for the air to sink back down over time (usually because the parcel forced to rise is colder than the environment). The momentum of the air imparted by the trigger mechanism will force the parcel to rise and the stability of the atmosphere will force the parcel of air to sink after it rises (you have now undergone the first steps into creating a wave).
It is important to understand the concept of momentum. A rising or sinking air parcel will "overshoot" its equilibrium point. In a gravity wave, the parcel of air will try to remain at a location in the atmosphere where there are no forces causing it to rise or sink. Once a force moves the parcel from its natural state of equilibrium, the parcel will try to regain its equilibrium.
But in the process, it will overshoot and undershoot that natural position each time it is rising or sinking because of its own momentum. At a sufficient distance from where the trigger mechanism caused the parcel to rise, the intensity of the gravity wave will decrease. At increasing distance, the parcel of air becomes closer to remaining at its natural state of equilibrium.
In a gravity wave, the upward moving region is the most favorable region for cloud development and the sinking region favorable for clear skies. That is why you may see rows of clouds and clear areas between the rows of clouds. A gravity wave is nothing more than a wave moving through a stable layer of the atmosphere. Thunderstorm updrafts will produce gravity waves as they try to punch into the tropopause. The tropopause represents a region of very stable air. This stable air combined with the upward momentum of a thunderstorm updraft (trigger mechanism) will generate gravity waves within the clouds trying to push into the tropopause.
Frame 2
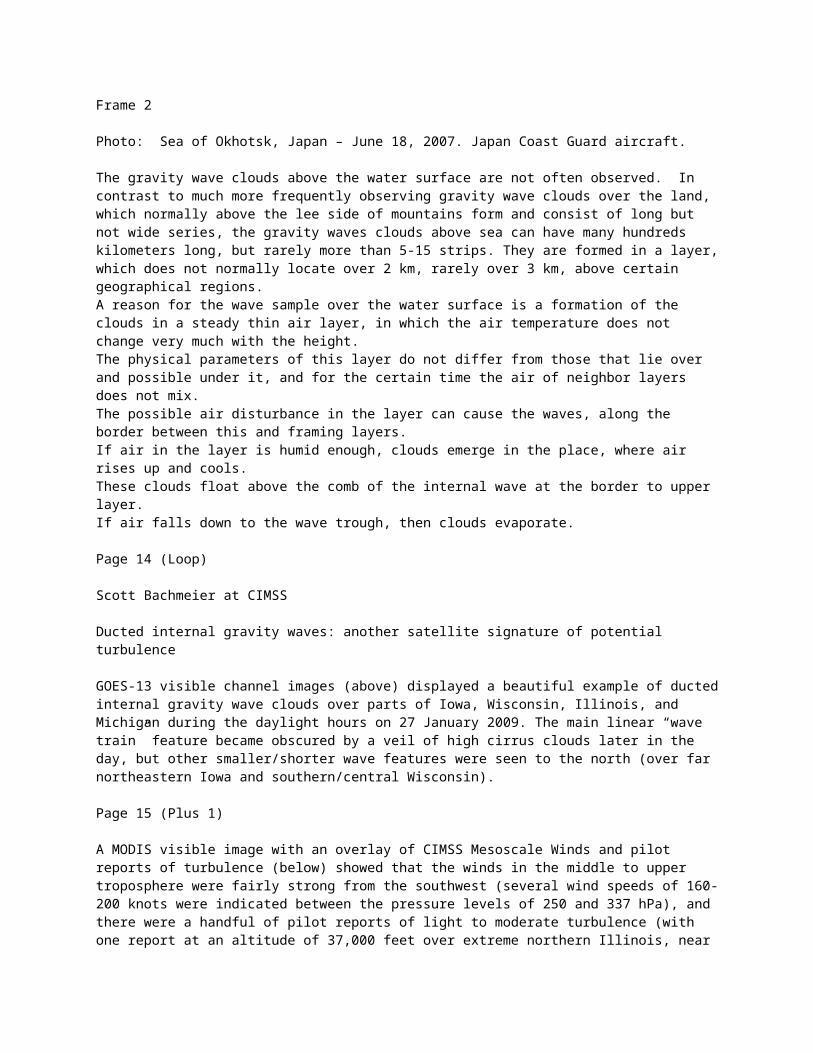
Photo: Sea of Okhotsk, Japan – June 18, 2007. Japan Coast Guard aircraft.
The gravity wave clouds above the water surface are not often observed. In contrast to much more frequently observing gravity wave clouds over the land, which normally above the lee side of mountains form and consist of long but not wide series, the gravity waves clouds above sea can have many hundreds kilometers long, but rarely more than 5-15 strips. They are formed in a layer, which does not normally locate over 2 km, rarely over 3 km, above certain geographical regions.A reason for the wave sample over the water surface is a formation of the clouds in a steady thin air layer, in which the air temperature does not change very much with the height. The physical parameters of this layer do not differ from those that lie over and possible under it, and for the certain time the air of neighbor layers does not mix. The possible air disturbance in the layer can cause the waves, along the border between this and framing layers.If air in the layer is humid enough, clouds emerge in the place, where air rises up and cools. These clouds float above the comb of the internal wave at the border to upper layer. If air falls down to the wave trough, then clouds evaporate.
Page 14 (Loop)
Scott Bachmeier at CIMSS
Ducted internal gravity waves: another satellite signature of potential turbulence
GOES-13 visible channel images (above) displayed a beautiful example of ducted internal gravity wave clouds over parts of Iowa, Wisconsin, Illinois, and Michigan during the daylight hours on 27 January 2009. The main linear “wave train” feature became obscured by a veil of high cirrus clouds later in the day, but other smaller/shorter wave features were seen to the north (over far northeastern Iowa and southern/central Wisconsin).
Page 15 (Plus 1)
A MODIS visible image with an overlay of CIMSS Mesoscale Winds and pilot reports of turbulence (below) showed that the winds in the middle to upper troposphere were fairly strong from the southwest (several wind speeds of 160-200 knots were indicated between the pressure levels of 250 and 337 hPa), and there were a handful of pilot reports of light to moderate turbulence (with one report at an altitude of 37,000 feet over extreme northern Illinois, near the gravity wave feature).
Frame 2
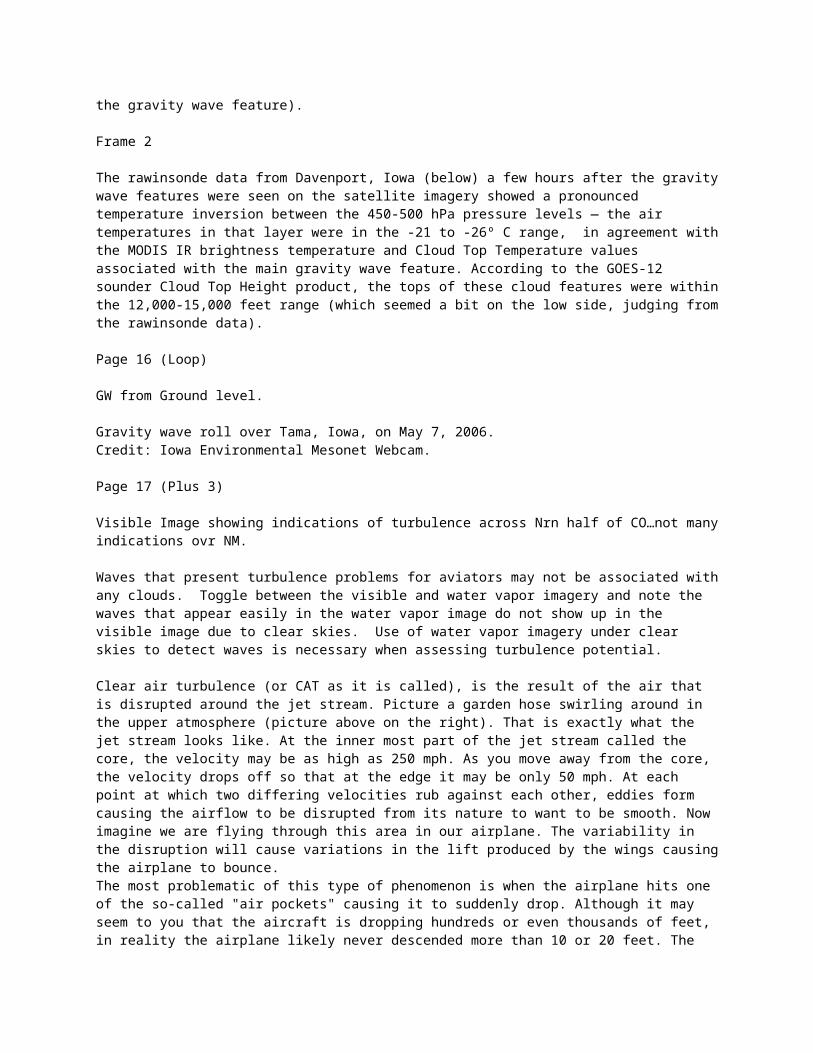
The rawinsonde data from Davenport, Iowa (below) a few hours after the gravity wave features were seen on the satellite imagery showed a pronounced temperature inversion between the 450-500 hPa pressure levels — the air temperatures in that layer were in the -21 to -26º C range, in agreement with the MODIS IR brightness temperature and Cloud Top Temperature values associated with the main gravity wave feature. According to the GOES-12 sounder Cloud Top Height product, the tops of these cloud features were within the 12,000-15,000 feet range (which seemed a bit on the low side, judging from the rawinsonde data).
Page 16 (Loop)
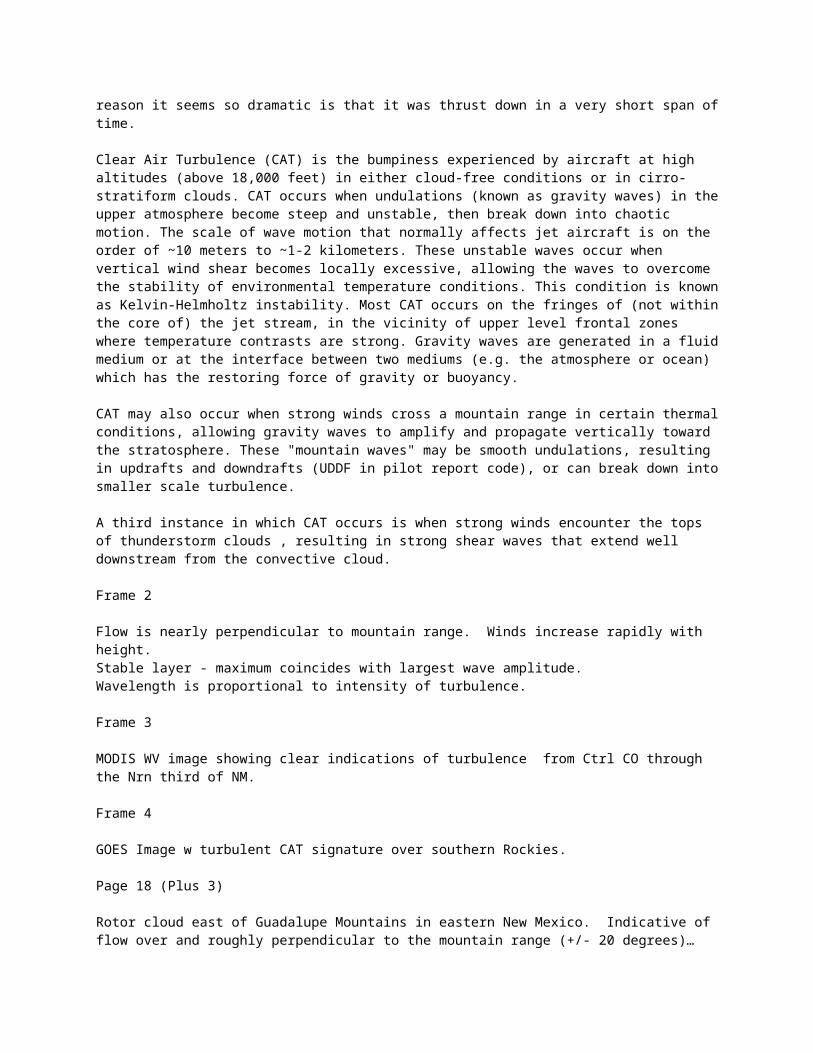
GW from Ground level.
Gravity wave roll over Tama, Iowa, on May 7, 2006. Credit: Iowa Environmental Mesonet Webcam.
Page 17 (Plus 3)
Visible Image showing indications of turbulence across Nrn half of CO…not many indications ovr NM.
Waves that present turbulence problems for aviators may not be associated with any clouds. Toggle between the visible and water vapor imagery and note the waves that appear easily in the water vapor image do not show up in the visible image due to clear skies. Use of water vapor imagery under clear skies to detect waves is necessary when assessing turbulence potential.
Clear air turbulence (or CAT as it is called), is the result of the air that is disrupted around the jet stream. Picture a garden hose swirling around in the upper atmosphere (picture above on the right). That is exactly what the jet stream looks like. At the inner most part of the jet stream called the core, the velocity may be as high as 250 mph. As you move away from the core, the velocity drops off so that at the edge it may be only 50 mph. At each point at which two differing velocities rub against each other, eddies form causing the airflow to be disrupted from its nature to want to be smooth. Now imagine we are flying through this area in our airplane. The variability in the disruption will cause variations in the lift produced by the wings causing the airplane to bounce.The most problematic of this type of phenomenon is when the airplane hits one of the so-called "air pockets" causing it to suddenly drop. Although it may seem to you that the aircraft is dropping hundreds or even thousands of feet, in reality the airplane likely never descended more than 10 or 20 feet. The reason it seems so dramatic is that it was thrust down in a very short span of time.
Clear Air Turbulence (CAT) is the bumpiness experienced by aircraft at high
altitudes (above 18,000 feet) in either cloud-free conditions or in cirro-stratiform clouds. CAT occurs when undulations (known as gravity waves) in the upper atmosphere become steep and unstable, then break down into chaotic motion. The scale of wave motion that normally affects jet aircraft is on the order of ~10 meters to ~1-2 kilometers. These unstable waves occur when vertical wind shear becomes locally excessive, allowing the waves to overcome the stability of environmental temperature conditions. This condition is known as Kelvin-Helmholtz instability. Most CAT occurs on the fringes of (not within the core of) the jet stream, in the vicinity of upper level frontal zones where temperature contrasts are strong. Gravity waves are generated in a fluid medium or at the interface between two mediums (e.g. the atmosphere or ocean) which has the restoring force of gravity or buoyancy.
CAT may also occur when strong winds cross a mountain range in certain thermal conditions, allowing gravity waves to amplify and propagate vertically toward the stratosphere. These "mountain waves" may be smooth undulations, resulting in updrafts and downdrafts (UDDF in pilot report code), or can break down into smaller scale turbulence.
A third instance in which CAT occurs is when strong winds encounter the tops of thunderstorm clouds , resulting in strong shear waves that extend well downstream from the convective cloud.
Frame 2
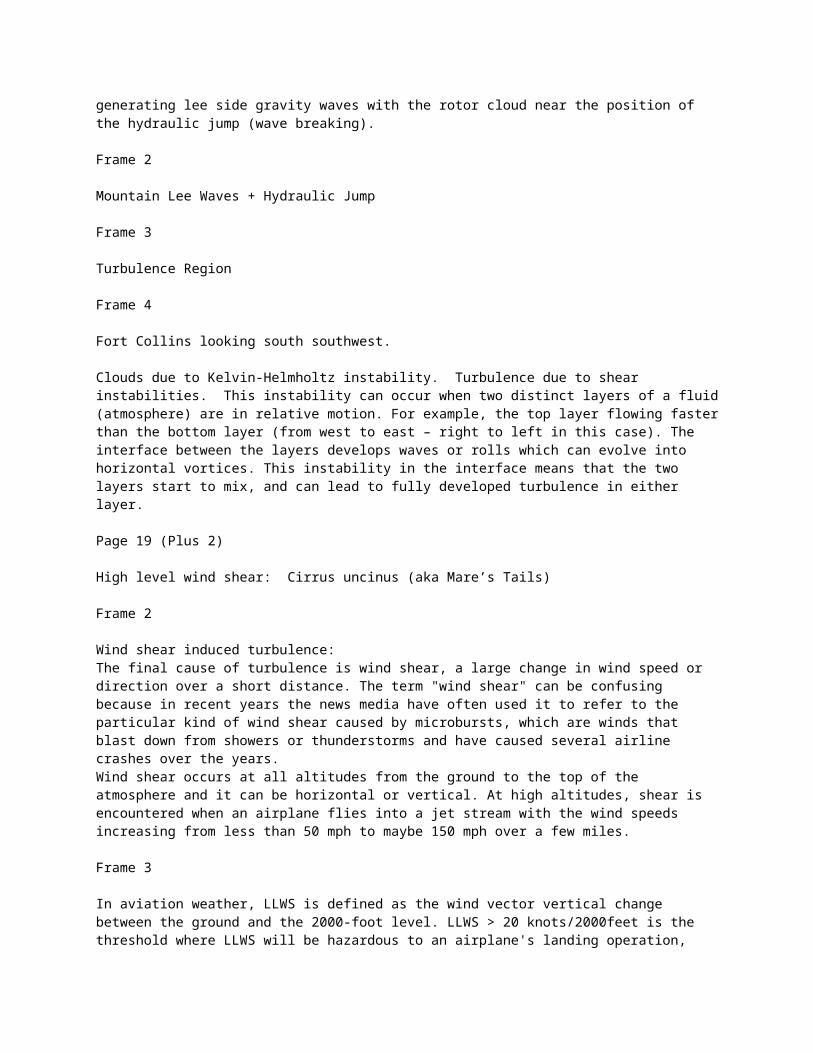
Flow is nearly perpendicular to mountain range. Winds increase rapidly with height.Stable layer - maximum coincides with largest wave amplitude.Wavelength is proportional to intensity of turbulence.
Frame 3
MODIS WV image showing clear indications of turbulence from Ctrl CO through the Nrn third of NM.
Frame 4
GOES Image w turbulent CAT signature over southern Rockies.
Page 18 (Plus 3)
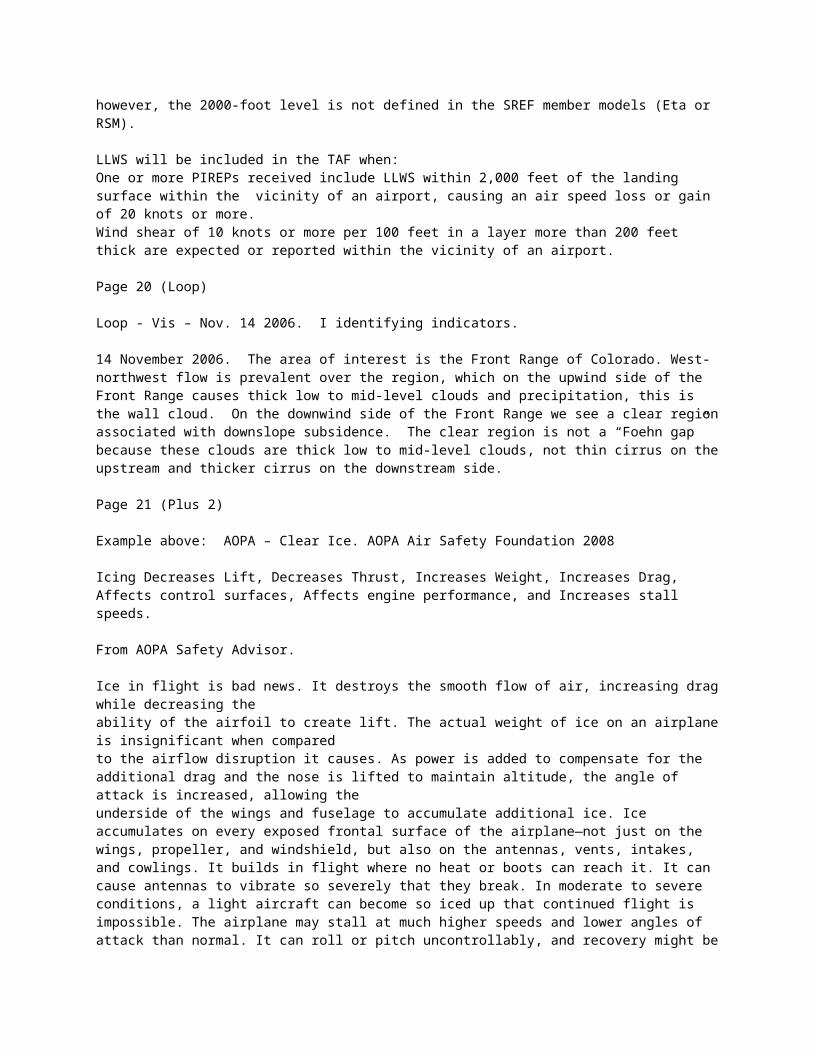
Rotor cloud east of Guadalupe Mountains in eastern New Mexico. Indicative of flow over and roughly perpendicular to the mountain range (+/- 20 degrees)…generating lee side gravity waves with the rotor cloud near the position of the hydraulic jump (wave breaking).
Frame 2
Mountain Lee Waves + Hydraulic Jump
Frame 3
Turbulence Region
Frame 4
Fort Collins looking south southwest.
Clouds due to Kelvin-Helmholtz instability. Turbulence due to shear instabilities. This instability can occur when two distinct layers of a fluid (atmosphere) are in relative motion. For example, the top layer flowing faster than the bottom layer (from west to east – right to left in this case). The interface between the layers develops waves or rolls which can evolve into horizontal vortices. This instability in the interface means that the two layers start to mix, and can lead to fully developed turbulence in either layer.
Page 19 (Plus 2)
High level wind shear: Cirrus uncinus (aka Mare’s Tails)
Frame 2
Wind shear induced turbulence:The final cause of turbulence is wind shear, a large change in wind speed or direction over a short distance. The term "wind shear" can be confusing because in recent years the news media have often used it to refer to the particular kind of wind shear caused by microbursts, which are winds that blast down from showers or thunderstorms and have caused several airline crashes over the years. Wind shear occurs at all altitudes from the ground to the top of the atmosphere and it can be horizontal or vertical. At high altitudes, shear is encountered when an airplane flies into a jet stream with the wind speeds increasing from less than 50 mph to maybe 150 mph over a few miles.
Frame 3
In aviation weather, LLWS is defined as the wind vector vertical change between the ground and the 2000-foot level. LLWS > 20 knots/2000feet is the threshold where LLWS will be hazardous to an airplane's landing operation, however, the 2000-foot level is not defined in the SREF member models (Eta or RSM).
LLWS will be included in the TAF when:One or more PIREPs received include LLWS within 2,000 feet of the landing surface within the vicinity of an airport, causing an air speed loss or gain of 20 knots or more.Wind shear of 10 knots or more per 100 feet in a layer more than 200 feet thick are expected or reported within the vicinity of an airport.
Page 20 (Loop)
Loop - Vis – Nov. 14 2006. I identifying indicators.
14 November 2006. The area of interest is the Front Range of Colorado. West-northwest flow is prevalent over the region, which on the upwind side of the Front Range causes thick low to mid-level clouds and precipitation, this is the wall cloud. On the downwind side of the Front Range we see a clear region associated with downslope subsidence. The clear region is not a “Foehn gap” because these clouds are thick low to mid-level clouds, not thin cirrus on the upstream and thicker cirrus on the downstream side.
Page 21 (Plus 2)
Example above: AOPA – Clear Ice. AOPA Air Safety Foundation 2008
Icing Decreases Lift, Decreases Thrust, Increases Weight, Increases Drag, Affects control surfaces, Affects engine performance, and Increases stall speeds.
From AOPA Safety Advisor.
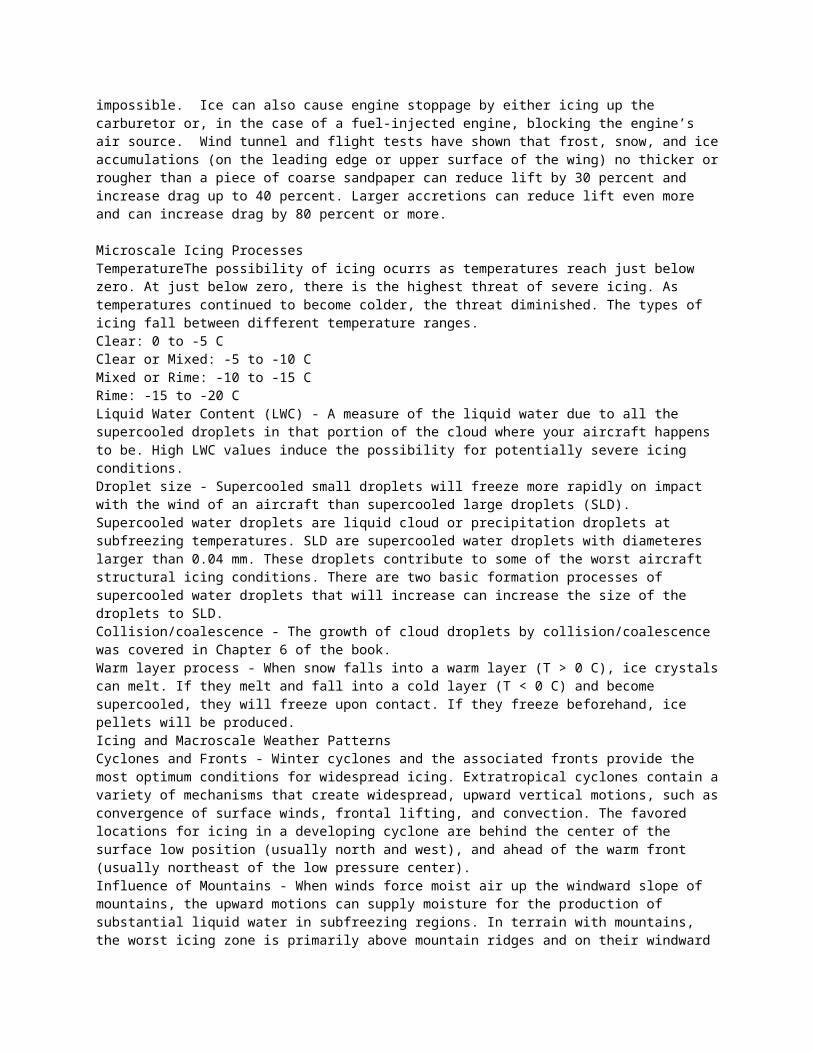
Ice in flight is bad news. It destroys the smooth flow of air, increasing drag while decreasing theability of the airfoil to create lift. The actual weight of ice on an airplane is insignificant when comparedto the airflow disruption it causes. As power is added to compensate for the additional drag and the nose is lifted to maintain altitude, the angle of attack is increased, allowing theunderside of the wings and fuselage to accumulate additional ice. Ice accumulates on every exposed frontal surface of the airplane—not just on the wings, propeller, and windshield, but also on the antennas, vents, intakes, and cowlings. It builds in flight where no heat or boots can reach it. It can cause antennas to vibrate so severely that they break. In moderate to severe conditions, a light aircraft can become so iced up that continued flight is impossible. The airplane may stall at much higher speeds and lower angles of attack than normal. It can roll or pitch uncontrollably, and recovery might be impossible. Ice can also cause engine stoppage by either icing up the carburetor or, in the case of a fuel-injected engine, blocking the engine’s air source. Wind tunnel and flight tests have shown that frost, snow, and ice accumulations (on the leading edge or upper surface of the wing) no thicker or rougher than a piece of coarse sandpaper can reduce lift by 30 percent and increase drag up to 40 percent. Larger accretions can reduce lift even more and can increase drag by 80 percent or more.
Microscale Icing ProcessesTemperatureThe possibility of icing ocurrs as temperatures reach just below zero. At just below zero, there is the highest threat of severe icing. As temperatures continued to become colder, the threat diminished. The types of icing fall between different temperature ranges. Clear: 0 to -5 C Clear or Mixed: -5 to -10 C Mixed or Rime: -10 to -15 C Rime: -15 to -20 C Liquid Water Content (LWC) - A measure of the liquid water due to all the supercooled droplets in that portion of the cloud where your aircraft happens to be. High LWC values induce the possibility for potentially severe icing conditions. Droplet size - Supercooled small droplets will freeze more rapidly on impact with the wind of an aircraft than supercooled large droplets (SLD). Supercooled water droplets are liquid cloud or precipitation droplets at subfreezing temperatures. SLD are supercooled water droplets with diameteres larger than 0.04 mm. These droplets contribute to some of the worst aircraft structural icing conditions. There are two basic formation processes of supercooled water droplets that will increase can increase the size of the droplets to SLD. Collision/coalescence - The growth of cloud droplets by collision/coalescence was covered in Chapter 6 of the book. Warm layer process - When snow falls into a warm layer (T > 0 C), ice crystals can melt. If they melt and fall into a cold layer (T < 0 C) and become supercooled, they will freeze upon contact. If they freeze beforehand, ice
pellets will be produced. Icing and Macroscale Weather PatternsCyclones and Fronts - Winter cyclones and the associated fronts provide the most optimum conditions for widespread icing. Extratropical cyclones contain a variety of mechanisms that create widespread, upward vertical motions, such as convergence of surface winds, frontal lifting, and convection. The favored locations for icing in a developing cyclone are behind the center of the surface low position (usually north and west), and ahead of the warm front (usually northeast of the low pressure center). Influence of Mountains - When winds force moist air up the windward slope of mountains, the upward motions can supply moisture for the production of substantial liquid water in subfreezing regions. In terrain with mountains, the worst icing zone is primarily above mountain ridges and on their windward side. Additionally, standing lenticular clouds downwind of ridges and peaks are also a suspect for icing when temperatures are in the critical subfreezing range.
Conditions Associated with Air Masses, Fronts and ThunderstormsAir Mass Icing – Stable air masses produce stratus clouds with rime icing conditions. Unstable air masses produce cumulus clouds with clear icing conditionsFrontal Icing – Cold Fronts and squall lines generally have a narrow weather and icing band with cumuliform clouds and clear icing conditions. The most critical area is where water is falling from warm air above to a freezing temperature below causing clear icing conditions. Occluded fronts are the most erratic, causing clear mixed and rime ice.
Frame 2
In flight Icing Related Information: http://aircrafticing.grc.nasa.gov/resources/related.html
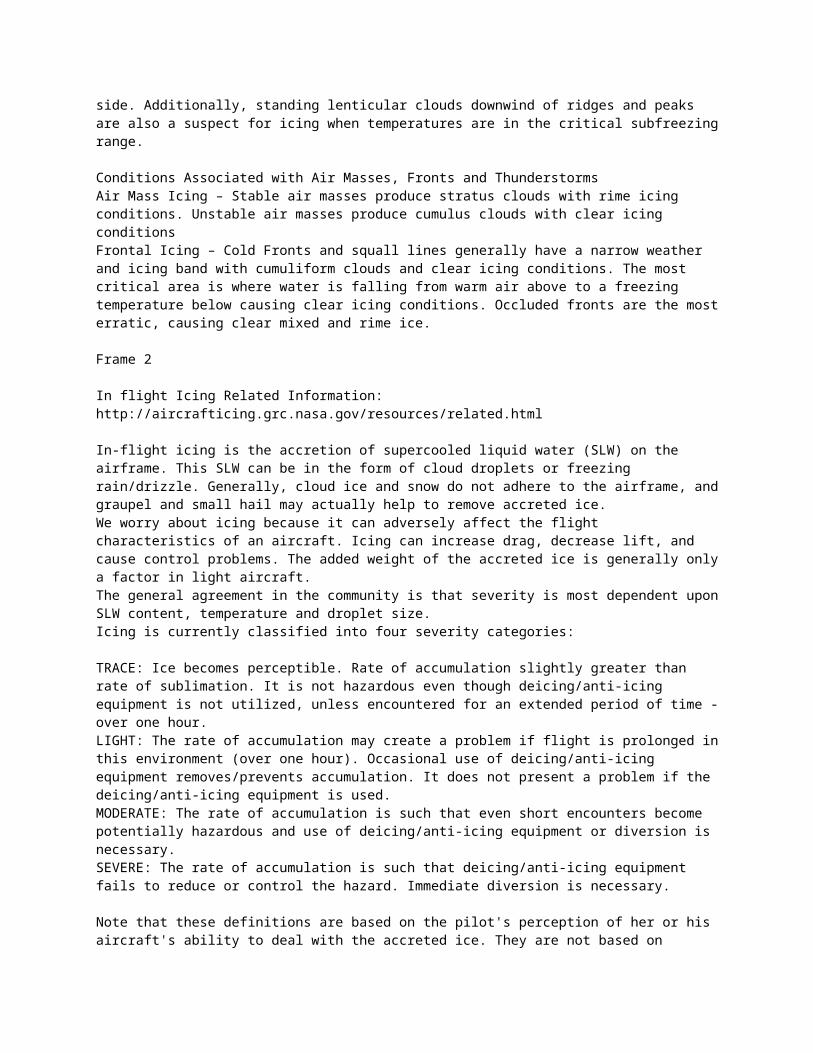
In-flight icing is the accretion of supercooled liquid water (SLW) on the airframe. This SLW can be in the form of cloud droplets or freezing rain/drizzle. Generally, cloud ice and snow do not adhere to the airframe, and graupel and small hail may actually help to remove accreted ice. We worry about icing because it can adversely affect the flight characteristics of an aircraft. Icing can increase drag, decrease lift, and cause control problems. The added weight of the accreted ice is generally only a factor in light aircraft. The general agreement in the community is that severity is most dependent upon SLW content, temperature and droplet size. Icing is currently classified into four severity categories:
TRACE: Ice becomes perceptible. Rate of accumulation slightly greater than rate of sublimation. It is not hazardous even though deicing/anti-icing equipment is not utilized, unless encountered for an extended period of time - over one hour. LIGHT: The rate of accumulation may create a problem if flight is prolonged in this environment (over one hour). Occasional use of deicing/anti-icing equipment removes/prevents accumulation. It does not present a problem if the deicing/anti-icing equipment is used. MODERATE: The rate of accumulation is such that even short encounters become potentially hazardous and use of deicing/anti-icing equipment or diversion is necessary. SEVERE: The rate of accumulation is such that deicing/anti-icing equipment fails to reduce or control the hazard. Immediate diversion is necessary.
Note that these definitions are based on the pilot's perception of her or his aircraft's ability to deal with the accreted ice. They are not based on meteorology.
Types of icing encountered are: RIME: Rough, milky, opaque ice formed by instantaneous freezing of small supercooled water droplets. CLEAR: A glossy, clear or translucent ice formed by the relatively slow freezing of large supercooled water droplets. MIXED: Mixture of rime and clear ice.
The presence of SLW represents a difference between production and depletion mechanisms.
Production: supercooled liquid is produced through condensation -- from cooling or moistening of the air. Look for atmospheric processes which contribute to these, i.e., lifting (fronts, low pressure centers, terrain), large bodies of water.
Depletion: In winter clouds, most of the depletion of SLW comes about through ice-phase processes - preferred depositional growth and riming. Coalescence will also remove cloud water (i.e. drizzle formation). Since the presence of ice tends to be strongly temperature dependent, look for deep clouds with cold tops - and/or locations with precipitation. These are locations where it is likely (but not always the case) that ice-phase processes are depleting liquid.
Frame 3
From Dept. of Interior and the Dept. of Agriculture: Interagency Aviation Safety Alert – October 20, 2008.
Page 22 (Plus 2)
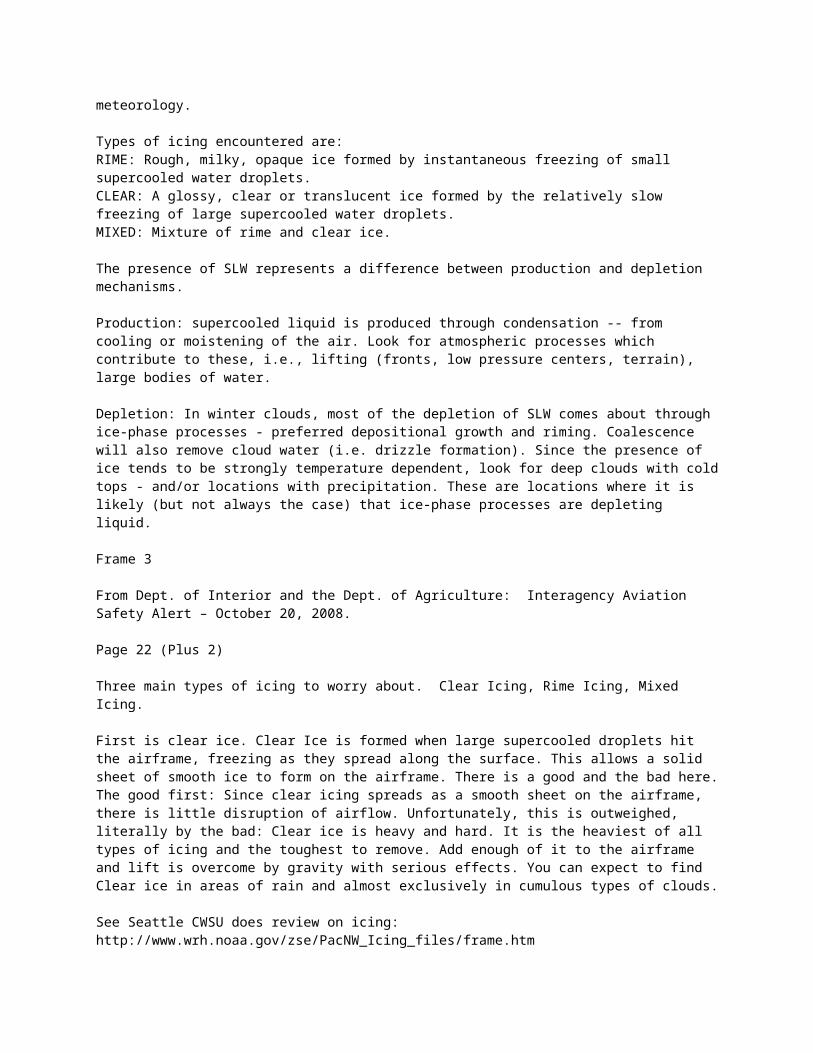
Three main types of icing to worry about. Clear Icing, Rime Icing, Mixed Icing.
First is clear ice. Clear Ice is formed when large supercooled droplets hit the airframe, freezing as they spread along the surface. This allows a solid sheet of smooth ice to form on the airframe. There is a good and the bad here. The good first: Since clear icing spreads as a smooth sheet on the airframe, there is little disruption of airflow. Unfortunately, this is outweighed, literally by the bad: Clear ice is heavy and hard. It is the heaviest of all types of icing and the toughest to remove. Add enough of it to the airframe and lift is overcome by gravity with serious effects. You can expect to find Clear ice in areas of rain and almost exclusively in cumulous types of clouds.
See Seattle CWSU does review on icing: http://www.wrh.noaa.gov/zse/PacNW_Icing_files/frame.htm
Frame 2
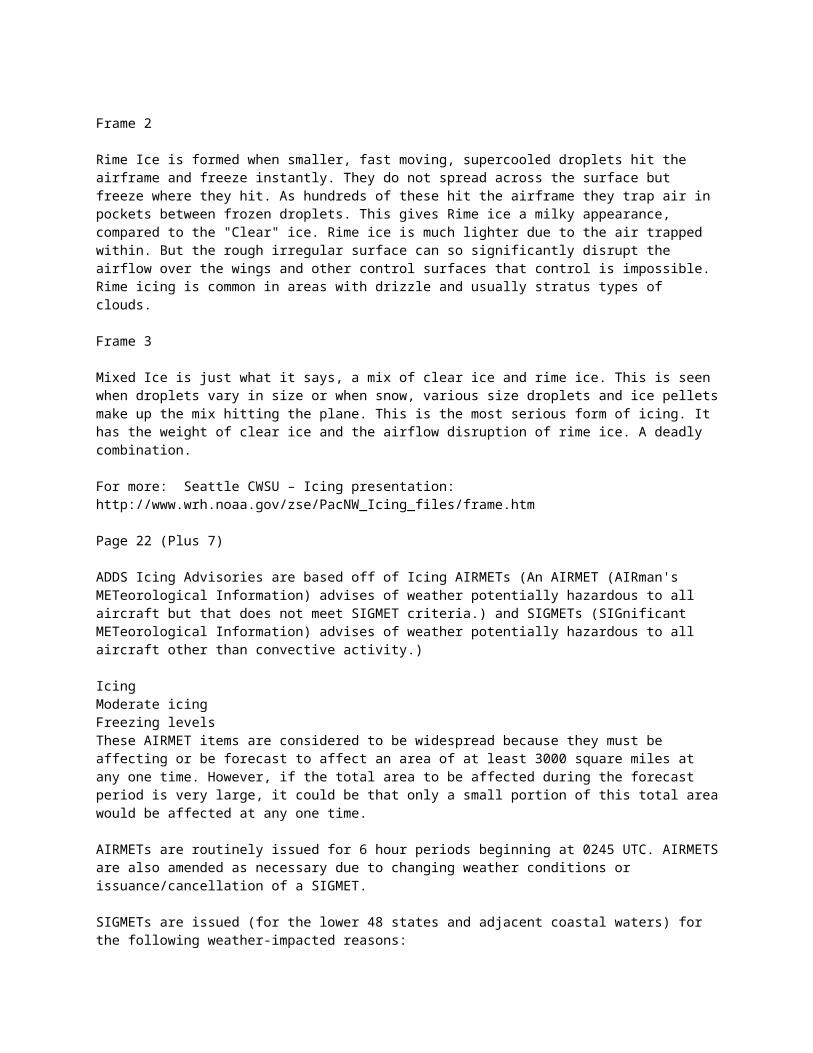
Rime Ice is formed when smaller, fast moving, supercooled droplets hit the airframe and freeze instantly. They do not spread across the surface but freeze where they hit. As hundreds of these hit the airframe they trap air in pockets between frozen droplets. This gives Rime ice a milky appearance,
compared to the "Clear" ice. Rime ice is much lighter due to the air trapped within. But the rough irregular surface can so significantly disrupt the airflow over the wings and other control surfaces that control is impossible. Rime icing is common in areas with drizzle and usually stratus types of clouds.
Frame 3
Mixed Ice is just what it says, a mix of clear ice and rime ice. This is seen when droplets vary in size or when snow, various size droplets and ice pellets make up the mix hitting the plane. This is the most serious form of icing. It has the weight of clear ice and the airflow disruption of rime ice. A deadly combination.
For more: Seattle CWSU – Icing presentation: http://www.wrh.noaa.gov/zse/PacNW_Icing_files/frame.htm
Page 22 (Plus 7)
ADDS Icing Advisories are based off of Icing AIRMETs (An AIRMET (AIRman's METeorological Information) advises of weather potentially hazardous to all aircraft but that does not meet SIGMET criteria.) and SIGMETs (SIGnificant METeorological Information) advises of weather potentially hazardous to all aircraft other than convective activity.)
Icing Moderate icing Freezing levels These AIRMET items are considered to be widespread because they must be affecting or be forecast to affect an area of at least 3000 square miles at any one time. However, if the total area to be affected during the forecast period is very large, it could be that only a small portion of this total area would be affected at any one time. AIRMETs are routinely issued for 6 hour periods beginning at 0245 UTC. AIRMETS are also amended as necessary due to changing weather conditions or issuance/cancellation of a SIGMET.
SIGMETs are issued (for the lower 48 states and adjacent coastal waters) for the following weather-impacted reasons: Severe Icing These SIGMET items are considered to be widespread because they must be affecting or be forecast to affect an area of at least 3000 square miles at any one time. However, if the total area to be affected during the forecast period is very large, it could be that only a small portion of this total area would be affected at any one time. SIGMETs are issued for 6 hour periods for conditions associated with hurricanes and 4 hours for all other events. If conditions persist beyond the forecast period, the SIGMET is updated and reissued. Convective SIGMETS are issued hourly for thunderstorm-related aviation hazards.
Frame 2
Current Icing Product
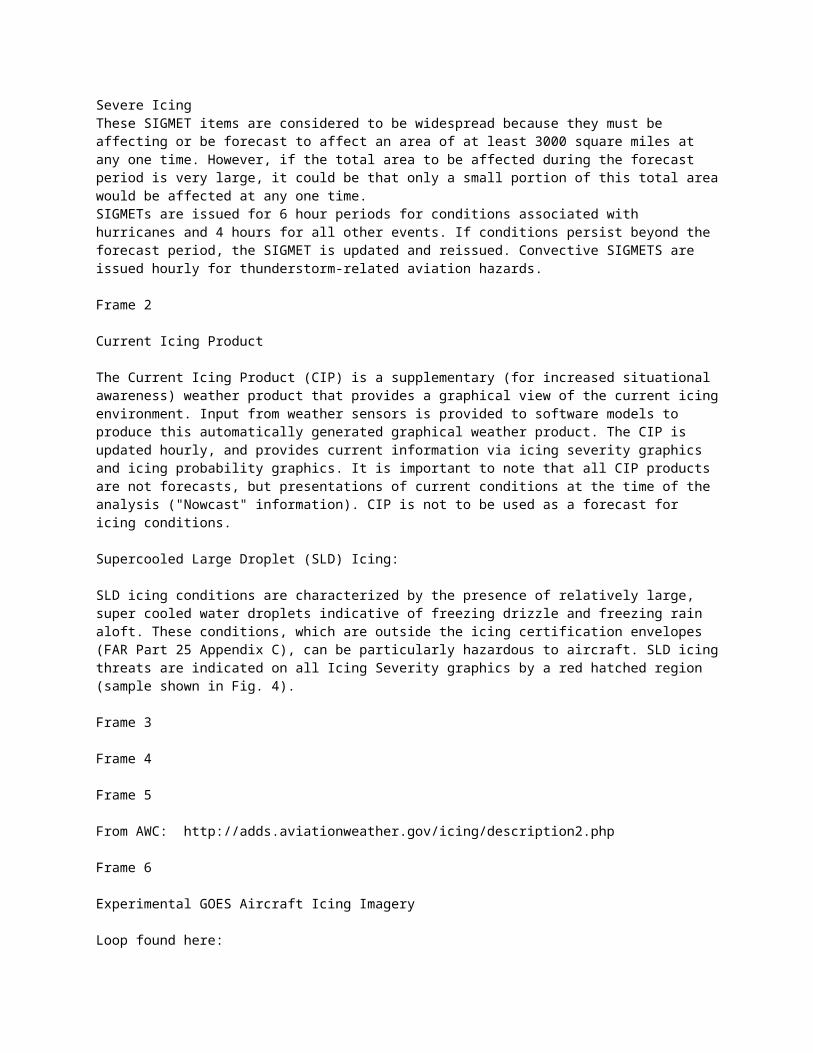
The Current Icing Product (CIP) is a supplementary (for increased situational awareness) weather product that provides a graphical view of the current icing
environment. Input from weather sensors is provided to software models to produce this automatically generated graphical weather product. The CIP is updated hourly, and provides current information via icing severity graphics and icing probability graphics. It is important to note that all CIP products are not forecasts, but presentations of current conditions at the time of the analysis ("Nowcast" information). CIP is not to be used as a forecast for icing conditions.
Supercooled Large Droplet (SLD) Icing:
SLD icing conditions are characterized by the presence of relatively large, super cooled water droplets indicative of freezing drizzle and freezing rain aloft. These conditions, which are outside the icing certification envelopes (FAR Part 25 Appendix C), can be particularly hazardous to aircraft. SLD icing threats are indicated on all Icing Severity graphics by a red hatched region (sample shown in Fig. 4).
Frame 3
Frame 4
Frame 5
From AWC: http://adds.aviationweather.gov/icing/description2.php
Frame 6
Experimental GOES Aircraft Icing Imagery
Loop found here: http://www.star.nesdis.noaa.gov/smcd/opdb/aviation/loops/icg/icgconus_loopw.html
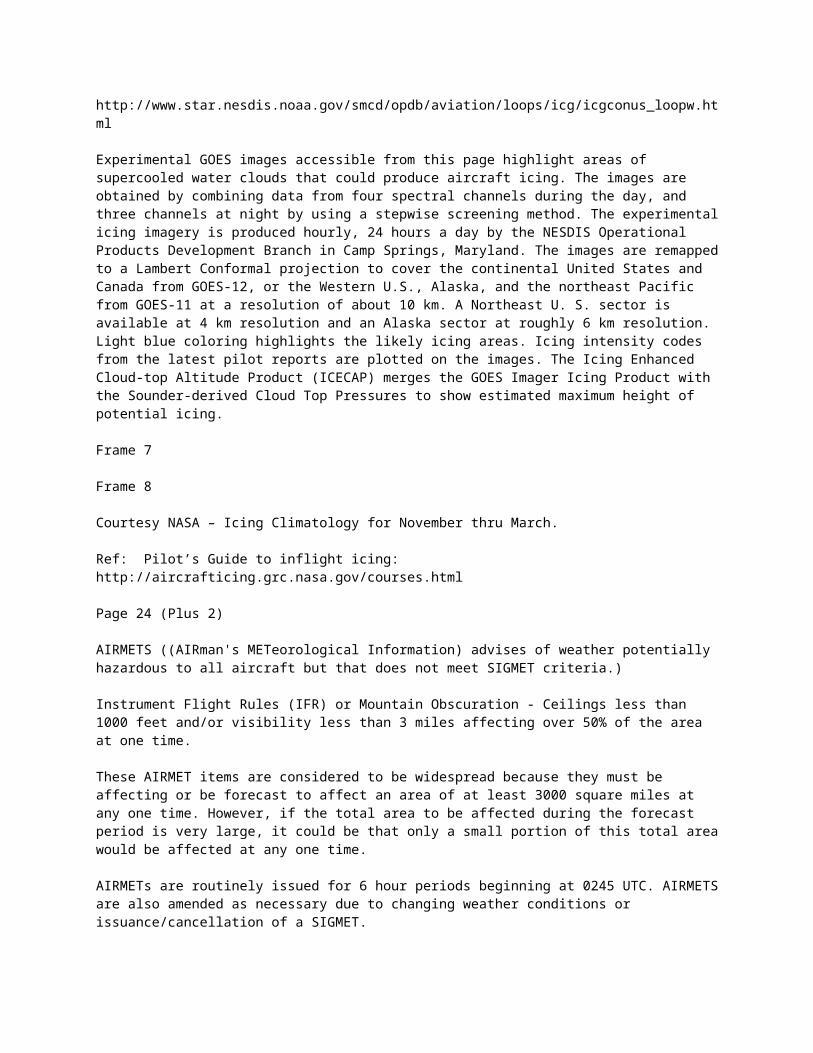
Experimental GOES images accessible from this page highlight areas of supercooled water clouds that could produce aircraft icing. The images are obtained by combining data from four spectral channels during the day, and three channels at night by using a stepwise screening method. The experimental icing imagery is produced hourly, 24 hours a day by the NESDIS Operational Products Development Branch in Camp Springs, Maryland. The images are remapped to a Lambert Conformal projection to cover the continental United States and Canada from GOES-12, or the Western U.S., Alaska, and the northeast Pacific from GOES-11 at a resolution of about 10 km. A Northeast U. S. sector is available at 4 km resolution and an Alaska sector at roughly 6 km resolution. Light blue coloring highlights the likely icing areas. Icing intensity codes from the latest pilot reports are plotted on the images. The Icing Enhanced Cloud-top Altitude Product (ICECAP) merges the GOES Imager Icing Product with the Sounder-derived Cloud Top Pressures to show estimated maximum height of potential icing.
Frame 7
Frame 8
Courtesy NASA – Icing Climatology for November thru March.
Ref: Pilot’s Guide to inflight icing: http://aircrafticing.grc.nasa.gov/courses.html
Page 24 (Plus 2)
AIRMETS ((AIRman's METeorological Information) advises of weather potentially hazardous to all aircraft but that does not meet SIGMET criteria.)
Instrument Flight Rules (IFR) or Mountain Obscuration - Ceilings less than 1000 feet and/or visibility less than 3 miles affecting over 50% of the area at one time.
These AIRMET items are considered to be widespread because they must be affecting or be forecast to affect an area of at least 3000 square miles at any one time. However, if the total area to be affected during the forecast period is very large, it could be that only a small portion of this total area would be affected at any one time. AIRMETs are routinely issued for 6 hour periods beginning at 0245 UTC. AIRMETS are also amended as necessary due to changing weather conditions or issuance/cancellation of a SIGMET.
Frame 2
Visual Flight Rules (VFR) - are ceilings greater than or equal to 3,000 feet AGL and visibilities greater than or equal to 5 statute miles.
Marginal Visual Flight Rules (MVFR) - are ceilings greater than or equal to 1,000 feet and less than or equal to 3,000 feet AGL and/or visibilities between 3 and statute 5 miles.
Instrument Flight Rules (IFR) - are ceilings greater than or equal to 500 feet and less than 1,000 feet AGL and/or visibilities greater than or equal to 1 statute mile to less than 3 statute miles.
Low Instrument Flight Rules (LIFR) - are ceilings below 500 feet AGL and/or visibility less than 1 statute mile.
Frame 3
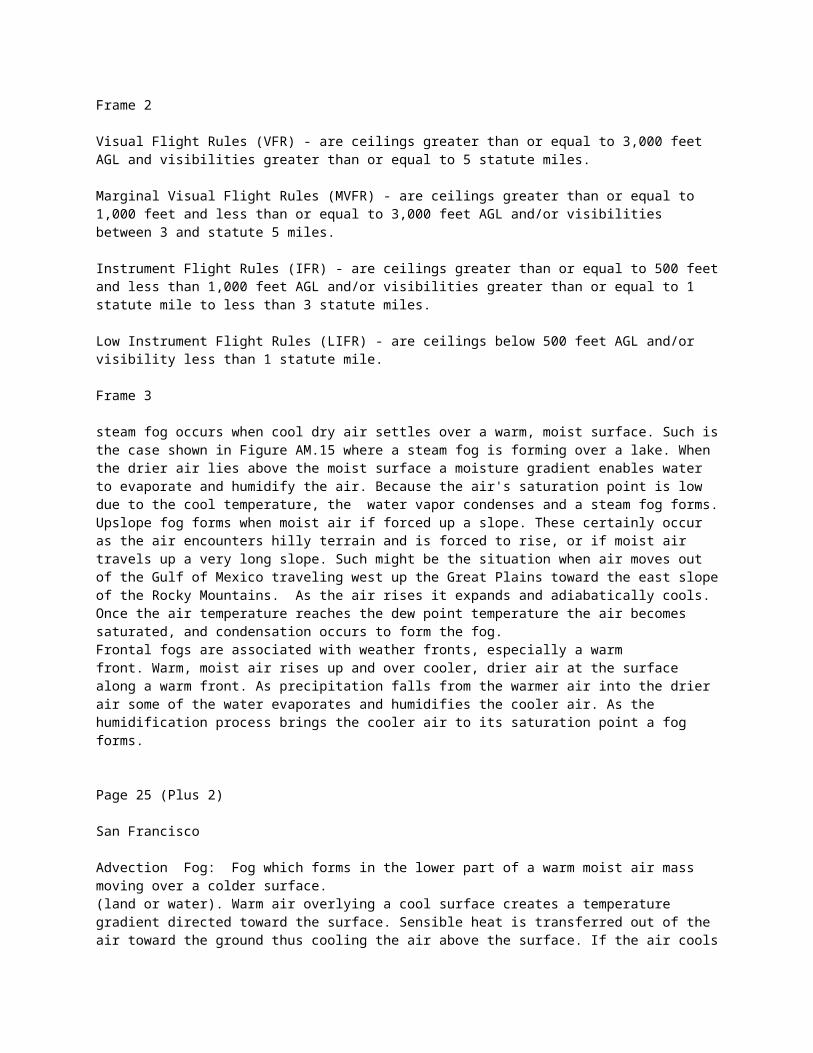
steam fog occurs when cool dry air settles over a warm, moist surface. Such is the case shown in Figure AM.15 where a steam fog is forming over a lake. When the drier air lies above the moist surface a moisture gradient enables water to evaporate and humidify the air. Because the air's saturation point is low due to the cool temperature, the water vapor condenses and a steam fog forms. Upslope fog forms when moist air if forced up a slope. These certainly occur as the air encounters hilly terrain and is forced to rise, or if moist air travels up a very long slope. Such might be the situation when air moves out of the Gulf of Mexico traveling west up the Great Plains toward the east slope of the Rocky Mountains. As the air rises it expands and adiabatically cools. Once the air temperature reaches the dew point temperature the air becomes saturated, and condensation occurs to form the fog.Frontal fogs are associated with weather fronts, especially a warm front. Warm, moist air rises up and over cooler, drier air at the surface along a warm front. As precipitation falls from the warmer air into the drier air some of the water evaporates and humidifies the cooler air. As the humidification process brings the cooler air to its saturation point a fog forms.
Page 25 (Plus 2)
San Francisco
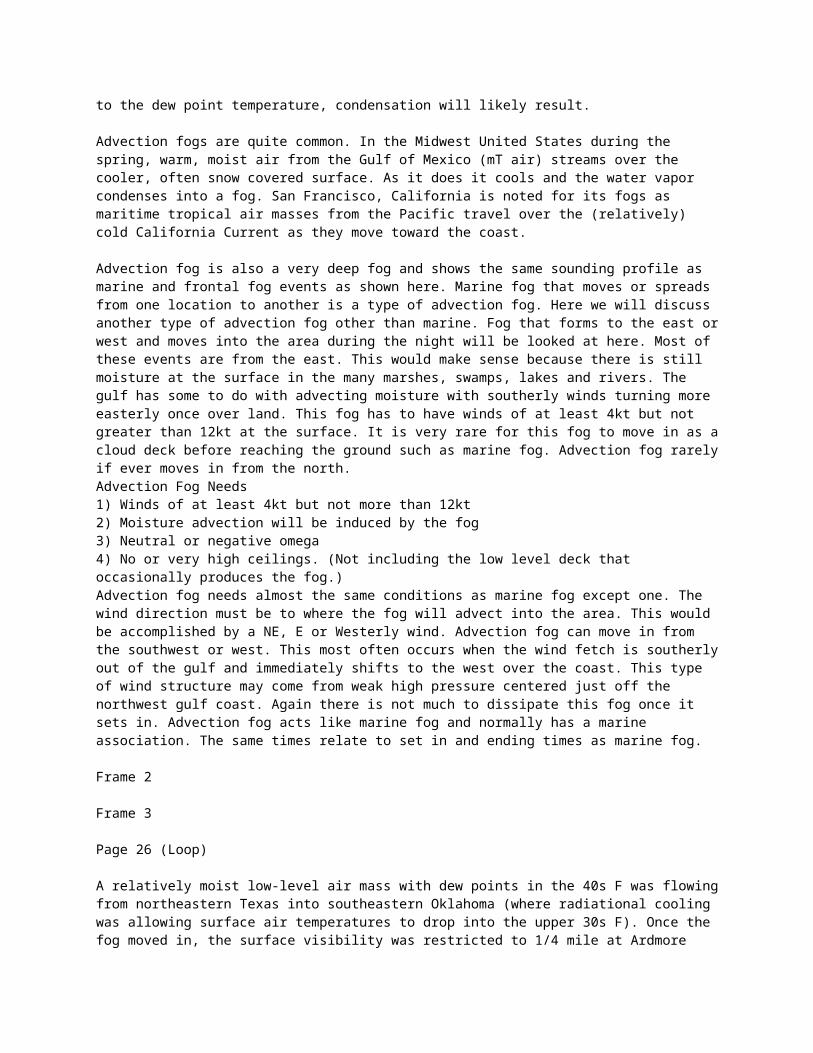
Advection Fog: Fog which forms in the lower part of a warm moist air mass moving over a colder surface.(land or water). Warm air overlying a cool surface creates a temperature gradient directed toward the surface. Sensible heat is transferred out of the air toward the ground thus cooling the air above the surface. If the air cools to the dew point temperature, condensation will likely result.
Advection fogs are quite common. In the Midwest United States during the spring, warm, moist air from the Gulf of Mexico (mT air) streams over the cooler, often snow covered surface. As it does it cools and the water vapor condenses into a fog. San Francisco, California is noted for its fogs as maritime tropical air masses from the Pacific travel over the (relatively) cold California Current as they move toward the coast.
Advection fog is also a very deep fog and shows the same sounding profile as marine and frontal fog events as shown here. Marine fog that moves or spreads from one location to another is a type of advection fog. Here we will discuss another type of advection fog other than marine. Fog that forms to the east or west and moves into the area during the night will be looked at here. Most of these events are from the east. This would make sense because there is still moisture at the surface in the many marshes, swamps, lakes and rivers. The gulf has some to do with advecting moisture with southerly winds turning more easterly once over land. This fog has to have winds of at least 4kt but not greater than 12kt at the surface. It is very rare for this fog to move in as a cloud deck before reaching the ground such as marine fog. Advection fog rarely if ever moves in from the north.Advection Fog Needs1) Winds of at least 4kt but not more than 12kt2) Moisture advection will be induced by the fog3) Neutral or negative omega4) No or very high ceilings. (Not including the low level deck that occasionally produces the fog.)Advection fog needs almost the same conditions as marine fog except one. The wind direction must be to where the fog will advect into the area. This would be accomplished by a NE, E or Westerly wind. Advection fog can move in from the southwest or west. This most often occurs when the wind fetch is southerly out of the gulf and immediately shifts to the west over the coast. This type of wind structure may come from weak high pressure centered just off the northwest gulf coast. Again there is not much to dissipate this fog once it sets in. Advection fog acts like marine fog and normally has a marine association. The same times relate to set in and ending times as marine fog.
Frame 2
Frame 3
Page 26 (Loop)
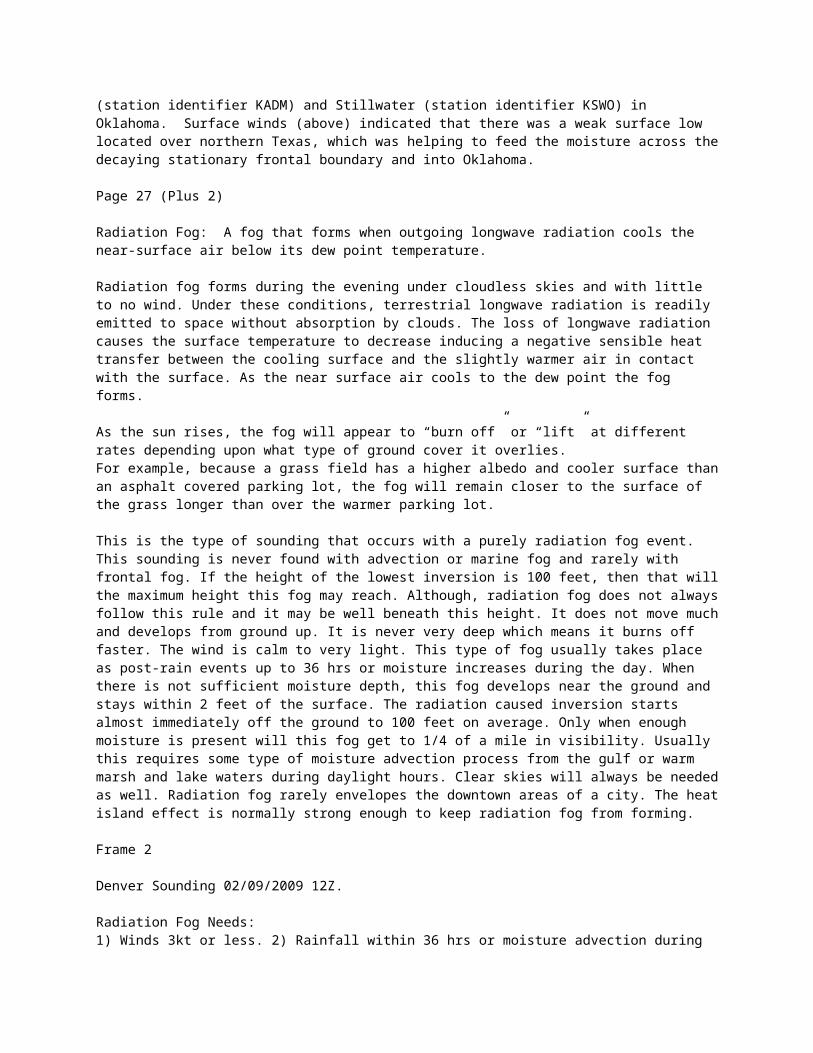
A relatively moist low-level air mass with dew points in the 40s F was flowing from northeastern Texas into southeastern Oklahoma (where radiational cooling was allowing surface air temperatures to drop into the upper 30s F). Once the fog moved in, the surface visibility was restricted to 1/4 mile at Ardmore
(station identifier KADM) and Stillwater (station identifier KSWO) in Oklahoma. Surface winds (above) indicated that there was a weak surface low located over northern Texas, which was helping to feed the moisture across the decaying stationary frontal boundary and into Oklahoma.
Page 27 (Plus 2)
Radiation Fog: A fog that forms when outgoing longwave radiation cools the near-surface air below its dew point temperature.
Radiation fog forms during the evening under cloudless skies and with little to no wind. Under these conditions, terrestrial longwave radiation is readily emitted to space without absorption by clouds. The loss of longwave radiation causes the surface temperature to decrease inducing a negative sensible heat transfer between the cooling surface and the slightly warmer air in contact with the surface. As the near surface air cools to the dew point the fog forms.
As the sun rises, the fog will appear to “burn off” or “lift” at different rates depending upon what type of ground cover it overlies. For example, because a grass field has a higher albedo and cooler surface than an asphalt covered parking lot, the fog will remain closer to the surface of the grass longer than over the warmer parking lot.
This is the type of sounding that occurs with a purely radiation fog event. This sounding is never found with advection or marine fog and rarely with frontal fog. If the height of the lowest inversion is 100 feet, then that will the maximum height this fog may reach. Although, radiation fog does not always follow this rule and it may be well beneath this height. It does not move much and develops from ground up. It is never very deep which means it burns off faster. The wind is calm to very light. This type of fog usually takes place as post-rain events up to 36 hrs or moisture increases during the day. When there is not sufficient moisture depth, this fog develops near the ground and stays within 2 feet of the surface. The radiation caused inversion starts almost immediately off the ground to 100 feet on average. Only when enough moisture is present will this fog get to 1/4 of a mile in visibility. Usually this requires some type of moisture advection process from the gulf or warm marsh and lake waters during daylight hours. Clear skies will always be needed as well. Radiation fog rarely envelopes the downtown areas of a city. The heat island effect is normally strong enough to keep radiation fog from forming.
Frame 2
Denver Sounding 02/09/2009 12Z.
Radiation Fog Needs:1) Winds 3kt or less. 2) Rainfall within 36 hrs or moisture advection during the day. 3) Neutral or negative omega (see below).4) Very Weak to no boundary layer positive vorticity. 5) Clear skies 6) Outside downtown areas (Outside of heat island effects). The inversion is shallow….usually less than 100m deep.
** When using AWIPS moisture fields for to aid in forecasting fog (all types) – the “30AGL”
Positive vorticity advection and no thermal advection results in a negative ?, that is, ascending motion. Similarly, warm advection also results in a
negative ? corresponding to ascending motion. Negative vorticity advection, however, results in a positive ? corresponding to descending motion.
Frame 3
Close-up.
Page 28
Photo: R. Hammitt – 2007
For Rain - Visibility is inversely proportional to:?The amount of water present in the lower atmosphere.?And, the number of drops
Therefore, the lowest visibilities occur in drizzle & heavy rain conditions.
Page 29
For Snow :Visibility falls off rapidly as intensity increases.High reflectivity of snow aids in increasing the effectiveness of the reduction to visibility.For moderate snow, visibility is greater than 500 meters (1640 feet) and less than 1500 meters (4921 feet). For heavy snow, visibility drops to below 500 meters (1640 feet).
Page 30 (Plus 1)
Obscuration: any phenomenon in the atmosphere, other than precipitation, that reduces horizontal visibility.
The Front, October 2008 - Smoke is defined as small particles produced by combustion suspended in the air. A transition to haze may occur when smoke particles have traveled great distances; for example, 25 to 100 miles or more, and when the larger particles have settled out and the remaining particles have become widely scattered through the atmosphere.
The main challenges with observing smoke are defining ceiling and visibility restrictions and determining where in the METAR such references belong.
METAR Example: KRNO 242355Z 27013G22KT 4SM FU OVC040 33/M03 A2997 RMK AO2 SLP093 FU OVC040MTN TOPS OBSCD SW-NW T03281033 10333 20244=
At Reno-Tahoe International Airport, on June 24, 2008, at 2355Z time (1655 PDT).Winds: from the west (270) at 13 knots with gusts to 22 knotsVisibility: 4 statute milesObscuration: Smoke (FU)Ceiling: Overcast 4,000 ft AGLTemperature: 33 degrees CelsiusDewpoint: Minus 3 degrees CelsiusAltimeter Setting: 29.97 inches of MercuryRMK: Beginning of Remarks SectionSea Level Pressure: 1009.3 mbRemarks: Smoke is the reason for the overcast 4,000 ft ceiling, mountain tops obscured to the southwest
to northwest.T Group: The temperature and dewpoint to the nearest tenth decimal place.1 Group: Maximum temperature in the last 6 hours.2 Group: Minimum temperature in the last 6 hours.
The main challenges in forecasting for smoke/haze obscuration involve keeping updated on current obs, assessing the overall stability of the atmosphere near and adjacent to the region of smoke production…and forecasting its change. How will the stability change vertically and horizontally with time. What are the Transport Winds and the Mixing height? What is the “ventilation factor?” Also, (obviously) how is the LL wind flow changing over time. Finally, is there a chance at precipitation over the area…this will often “clean” the air.
Frame 2
Area of Smoke/Haze caught on MODIS – AQUA Pass, Sept. 7, 2008 (18:25Z) over the Carolinas. Much of hazy look over the ocean is not atmospheric haze, but turbid regions that have been stirred up by Hurricane Hanna previously. The smoke/haze is from the burning of downed trees from said Hurricane Hanna and stretches from southeast of Wilmington, northeast through Jacksonville and on through New Bern, NC.
Page 31 (Plus 3)
Frame 2
MODIS Pass June 10, 2002
Frame 3
Photos from the Colorado Department of Health and Environment web cam in downtown Denver. Time series 7:06 am to 4:06 pm. The images show the arrival of the dense smoke plume in the Denver metro area at around 3:00 p.m. MDT (15:00 UTC). June 10, 2002
Frame 4
June 10, 2002 12Z DNR Sounding
Denver sounding from 00:00 UTC on 10 June 2002. Notice that the sounding remains nearly dry adiabatic from the surface to around 450mb. Winds just above the surface are south-southwest and strong.
Page 32 (Loop)
GOES-11 visible loop from 22:07 – 00:05 (10 June) UTC showing the large Hayman smoke plume, with large pyro-cumulus towers above it. Note the multiple point sources of smoke, each of which indicate separate burn areas. The plume at this time is covering the Denver metro area.
Page 33 (Loop)
KFDG, Denver, WSR-88D 0.5 degree base reflectivity with surfaces observations overlaid. Loop runs from 22:45 – 01:52 UTC and shows the Hayman fire smoke plume. Note that the echo intensity reaches 28 dBz at times which represents precipitation intensity reflectivity.
Page 34 (Plus 1)
(photochemical) Smog forms when sunlight hits various pollutants in the air - the chemical reaction of sunlight, nitrogen oxides (NOx) and volatile organic compounds (VOCs) in the atmosphere, which leaves airborne particles and ground-level ozone.
Frame 2
Satellite Example Here. MODIS – December 16, 2007 – California – San Joaquin Valley. Third day of trapped smog in the valley.
Page 35 (Plus 2)
The GOES Low Cloud Base Product - bi-spectral fog and low cloud images, based on the difference of two infrared channels centered at 3.9 and 10.7 lm during night time, have been improved to show likely areas of low ceilings significant for aviation operations. The improvement is based on a method that uses surface temperatures from METAR observing stations in combination with the satellite data. If differences between the surface temperatures and GOES 10.7 lm IR cloud top brightness temperatures are £3 K, cloud bases below 1000 ft AGL, a criterion for Instrument Flight Rules (IFR), are likely to exist.
The Low Cloud Base (LCB) products are generated from the GOES Imager and help to identify ceilings less than 1000 feet for aviation users. These products display possible Instrument Flight Rule (IFR) ceilings as red, and non-IFR ceilings as green. Some areas of IFR ceilings may not be detectable by the GOES product due to insufficient cloud depth, obscuration by cirrus, or insufficient temperature data. Conversely, some areas denoted as IFR by the GOES product may have higher cloud bases in areas of multiple inversions. Cloud heights (ft) observed at surface stations are overplotted in black.
Frame 2
The Fog Product shows the detection of fog and low clouds from the GOES Imager. This image product cannot distinguish fog from low clouds that do not reduce visibility at the ground. It is produced for the CONUS using GOES-East and for the Western U.S./Alaska using GOES-West. Frequent updates are essential for aviation interests.
Frame 3
The Fog Depth Estimate Product shows an estimate of the cloud layer thickness based on the IR brightness difference between GOES Imager channel 2 and 4. It is valid for single cloud layers only, preferably for radiation or advection fog.
Page 36 (Plus 1)
Cloud Climatologies:
The most common type of satellite climatology is a cloud composite, which is a measure of the frequency/persistence of clouds over a particular region based on seasonality and geographic features (image 1) or seasonality, geographic features, AND meteorology of the area…particularly (for operational purposes) the directional wind flow pattern (image 2) and/or temperature. Cloud composites can be derived from either geostationary or polar orbiting
satellites.
Image 1: Cloud cover climatology for eastern CONUS, for the months of June, July and August inclusive at the hour of 1245 UTC.
Image 2: (Visible) Cloud cover climatology for southeastern CONUS (Florida) for the months of June, July, and August inclusive, with low level southwest winds (1000-700 hPa Mean Layer Vector Winds), at the hour of 1815 UTC.
Other purposes include climate modeling.
Images from Colorado State University, Regional and Mesoscale Meteorology Branch (RAMMB)
http://rammb.cira.colostate.edu/research/satellite_climatologies/
Frame 2
Image 2
Page 37 (Plus 5)
December 15, 2003, NOAA 16 POES Satellite – AVHRR
Dust Storm Characteristics: Intense sand/dust/dirt storms reduce visibility to near zero in and near source regions with visibility improving away from the source. The average height of a dust storm is between 3,000 to 6,000 feet and is frequently determined by a capping inversion.
Sources of Dust: Appropriate source regions for dust storms have fine-grained soils, rich in clay and silt. Most of the dust comes from a number of discrete areas that can be regarded as point sources. Blowing dust usually does not occur for at least 24 hours after a rainfall.Potential source regions can frequently be identified with satellite imagery. (see above)
Atmospheric Conditions for Dust Storms: The lifting threshold for fine dust particles is 15 knots. Lofting of dust typically requires substantial turbulence in the boundary layer. Dust storms will be favored by an unstable boundary layer. Strong radiative cooling after sunset quickly cools the lowest atmosphere, forming an inversion and settling dust.
Dissipation and dispersion of dust: The dispersion of a dust plume as it moves downstream from its source region is primarily governed by turbulence, which mixes ambient air with the plume. Turbulence not only acts to disperse the plume, it also acts to keep the dust particle in suspension. Plumes disperse more in an unstable environment. Precipitation will very effectively remove dust from the troposphere. Dust tends to settle at a rate of 1,000 feet per hour once winds die down.
Many tools available for predicting dust storms. These include the satellite imagery, surface observations, NWP models, Radar and dust/aerosol models. Mesoscale NWP models can do a very good job of predicting winds and other atmospheric conditions, including friction velocity. Dust models combine atmospheric data with information on precipitation and dust source regions to produce dust forecasts out to several days.
Frame 2
Dust storm approaching Stratford, Texas. Dust bowl surveying in Texas
Image ID: theb1365, NOAA's National Weather Service (NWS) Collection Location: Stratford, TexasPhoto Date: April 18, 1935Credit: NOAA George E. Marsh Album
Part of the 650,000,000 tons of topsoil that blew away in the 30s.
Frame 3
Region of dust.
Visible images (upper left) over water, dust is easy to see. Over land, however, the dust plume and underlying surface look similar to each other, making dust hard to detect.
IR images (10.7um – upper right), dusty air appears relatively cool in contrast to the hot daytime land surface. At night, the thermal difference between the background and the dust lessens or can disappear altogether.
10.7um – 12.0um (Longwave) Difference Channel (lower left) – Yellow region showing negative temperature differences (Channel 4 minus Channel 5), where the difference is negative in the presence of dust. Works day or night and is a viable alternative to either visible or just IR alone.
Reflectance (Shortwave IR - 3.9um – lower right): Used to find dust and tell differences between water and ice clouds during the day.
Page: April 18, 2001 (19:30 UTC) – From Bernadette Connell, Cooperative Institute for Research in the Atmosphere, Colorado State University: “Volcanic ash and aerosol detection versus dust detection using GOES and MODIS imagery” Presented to 2nd International Conference on Volcanic Ash and Aviation Safety June 21-24, 2004 Alexandria, Virginia, USA.
Frame 4
December 15, 2003, NOAA 16 POES Satellite – AVHRR
Dust Storm Characteristics: Intense sand/dust/dirt storms reduce visibility to near zero in and near source regions with visibility improving away from the source. The average height of a dust storm is between 3,000 to 6,000 feet and is frequently determined by a capping inversion.
Sources of Dust: Appropriate source regions for dust storms have fine-grained soils, rich in clay and silt. Most of the dust comes from a number of discrete areas that can be regarded as point sources. Blowing dust usually does not occur for at least 24 hours after a rainfall.Potential source regions can frequently be identified with satellite imagery. (see above)
Atmospheric Conditions for Dust Storms: The lifting threshold for fine dust particles is 15 knots. Lofting of dust typically requires substantial turbulence in the boundary layer. Dust storms will be favored by an unstable
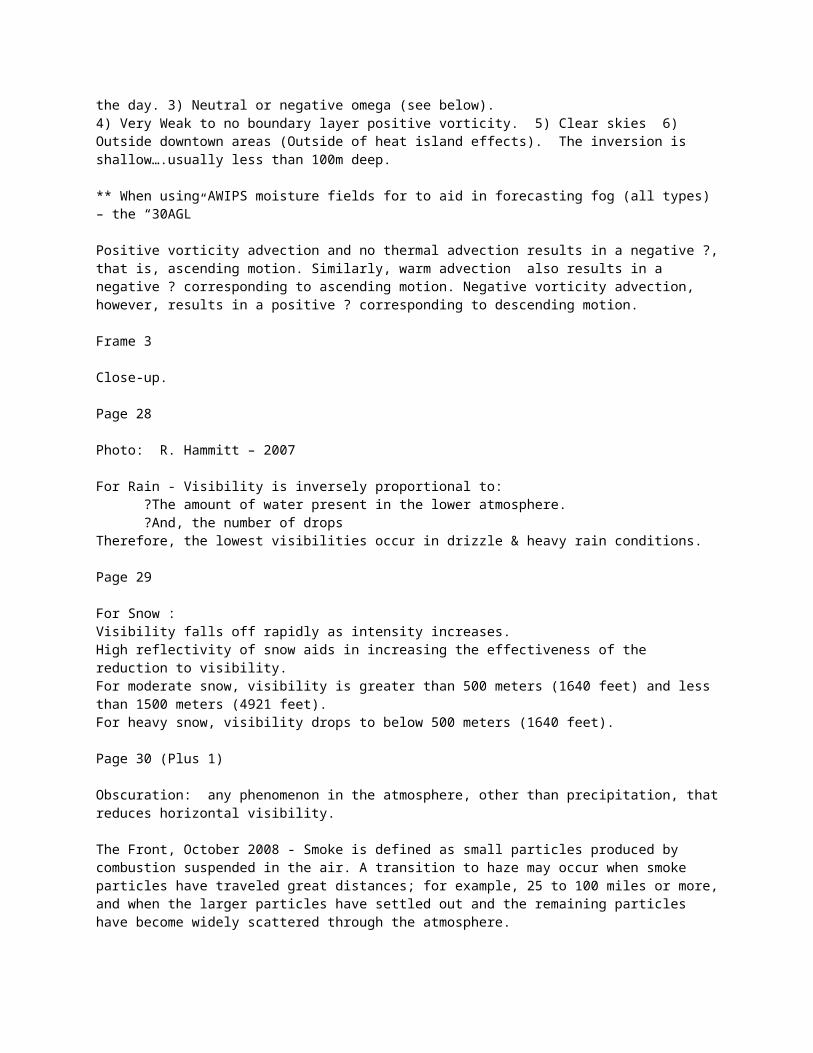
boundary layer. Strong radiative cooling after sunset quickly cools the lowest atmosphere, forming an inversion and settling dust.
Dissipation and dispersion of dust: The dispersion of a dust plume as it moves downstream from its source region is primarily governed by turbulence, which mixes ambient air with the plume. Turbulence not only acts to disperse the plume, it also acts to keep the dust particle in suspension. Plumes disperse more in an unstable environment. Precipitation will very effectively remove dust from the troposphere. Dust tends to settle at a rate of 1,000 feet per hour once winds die down.
Many tools available for predicting dust storms. These include the satellite imagery, surface observations, NWP models, Radar and dust/aerosol models. Mesoscale NWP models can do a very good job of predicting winds and other atmospheric conditions, including friction velocity. Dust models combine atmospheric data with information on precipitation and dust source regions to produce dust forecasts out to several days.
Frame 5
Channel 4 minus Channel five (11 – 12 um) imagery…same time and region as visible (next – previous).
Frame 6
Many tools available for predicting dust storms. These include the satellite imagery, surface observations, NWP models, Radar and dust/aerosol modelsMesoscale NWP models can do a very good job of predicting winds and other atmospheric conditions, including friction velocityDust models combine atmospheric data with information on precipitation and dust source regions to produce dust forecasts out to several days
Page 38
Wind/Downbursts/Microbursts/Windshear/Turbulence
LightningHailTornado/Water SpoutHeavy prcipitation/
Water Ingestion/Reduced Visibility
IcingAltimeter Interference
Page 39 (Plus 7)
Where to begin? Turbulence, one of the most significant hazards in a thunderstorm, is encountered as a result of the tremendous updraft and downdraft winds that are associated within the thunderstorm. Studies of the structure of thunderstorms indicate that the most severe turbulence that an aircraft may encounter in a thunderstorm will be at approximately 8,000 to 15,000 feet above the terrain.
Analysis of satellite imagery reveals that the following phenomena are often found in association with
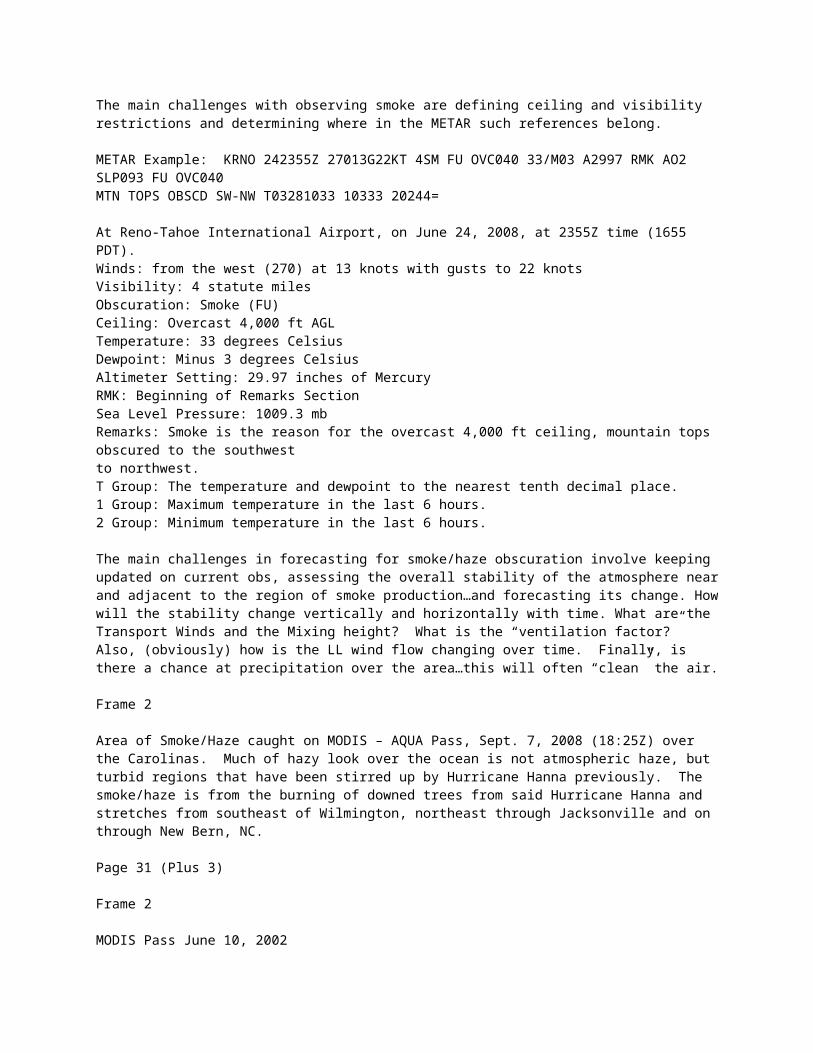
highly turbulent convective events:1) Rapidly vertical convective development2) Rapidly expanding anvil clouds indicative of strong outflow/divergence3) Banded cirrus outflow structures (i.e. transverse bands)4) Convective gravity waves
The strongest updraft winds are usually located at or above 10,000 feet, with updraft winds in excess of 65 feet per second producing extreme turbulence. Roller coaster intensity, but without the tracks! Downdraft winds can also produce turbulence, but they are generally less severe and occur in the lower altitudes below 10,000 feet. The hazard here is the downdraft can "push" a plane into the ground, and it doesn't care whether there's a runway nearby. The intensity of flight level turbulence seems to be directly related to the intensity of the precipitation in the thunderstorm, i.e., the heavier the precipitation, the more severe the turbulence.
Frame 2
Project Vortex - on the fringe of a downburst.
Image ID: nssl0164, NOAA's National Severe Storms Laboratory (NSSL) Collection Location: Near Wichita Falls, TexasPhoto Date: May 24, 1994Credit: NOAA Photo Library, NOAA Central Library; OAR/ERL/National Severe Storms Laboratory (NSSL)
Frame 3
Denver Sounding Sept. 12, 2005 – 12Z. Typical morning Sounding on the high plains for what could be a downburst day.
Frame 4
Denver Sounding Sept. 13, 2005 – 00Z. Typical afternoon sounding on the high plains for what could be a downburst day.
While CAPE values are modest, notice the values for DCAPE (Downburst CAPE) – 1141 J/KgDCAPE= negative buoyancy available to downdraft.
To estimate downdraft parcel path: Determine wet bulb temperature and follow moist adiabat to surface.
The DCAPE (Downdraft CAPE) can be used to estimate the potential strength of rain-cooled downdrafts within thunderstorm convection, and is similar to CAPE. Larger DCAPE values are associated with stronger downdrafts.
where LFS is the level of free sink (the downdraft equivalent of the LFC), and "sfc " is the surface, which presumably is where the potential damage from downdraft-induced winds is to occur. Since the buoyancy is negative, positive DCAPE is associated with descending parcels.
Gray area represents approx. 6KM DCAPE value.
Frame 5
Moist Downburst Sounding Lake Charles Louisianna – March 8 1999. Grey area
represent approximate 6km DCAPE area.
Mid-level dry air good moisture below (higher precipitable water in sounding). Dry air aloft will entrain into the downdraft and cause evaporative cooling. This increases the negative buoyancy and can result in microbursts and macrobursts If supercells develop they are most likely to be high precipitation supercells Most common severe weather: winds > 58mph, small hail near the 3/4" threshold, tornadoes possible (depends on low level shear and CAPE) Sounding most commonly found east of Rockies
Frame 6
Approaching thunderstorm with lead gust front. Rain-cooled air from the storm moves out ahead of the storm. It ploughs under the warm moist air forming a flat"shelf cloud."
Image ID: nssl0045, NOAA's National Severe Storms Laboratory (NSSL) Collection Location: Brookhaven, New MexicoPhoto Date: 1982Credit: NOAA Photo Library, NOAA Central Library; OAR/ERL/National Severe Storms Laboratory (NSSL)
Frame 7
From the NWS, Rapid City, SD. August 1, 2000 Downburst Damage to Airport.
Although this was a convective miso/meso-scale event, it clearly shows just what strong straight-line winds can do (this was not tornado damage).
Frame 8
Microburst - extremely dangerous for aircraft
Image ID: nssl0106, NOAA's National Severe Storms Laboratory (NSSL) Collection Credit: NOAA Photo Library, NOAA Central Library; OAR/ERL/National Severe Storms Laboratory (NSSL)
Microbursts are small-scale intense downdrafts that on reaching the surface spread outward in all directions from the downdraft center. However, the greatest threat from downdraft often occurs in front or leading edge of a thunderstorm. This causes the presence of both vertical and horizontal wind shears that can be extremely hazardous to all types and categories of aircraft, especially at low altitudes. Due to their small size (less than one mile to 2.5 miles), short life span (generally less than 15 minutes), and the fact that they can occur over areas without surface precipitation, microbursts are hard to detect using conventional weather radar or wind shear alert systems. The intensity of the downdraft can be as strong as 100 feet per second. Horizontal winds near the surface can be as strong as 45 knots resulting in a 90-knot shear (headwind to tailwind change for a traversing aircraft) across the microburst. The parent clouds producing microburst activity can be any of the low or even middle layer convective cloud types. It doesn't have to be a thunderstorm that produces them, but that is the most common. A major consideration for pilots is the fact that a microburst will intensify for about 5 minutes after it strikes the ground.
Page 40 (Loop)
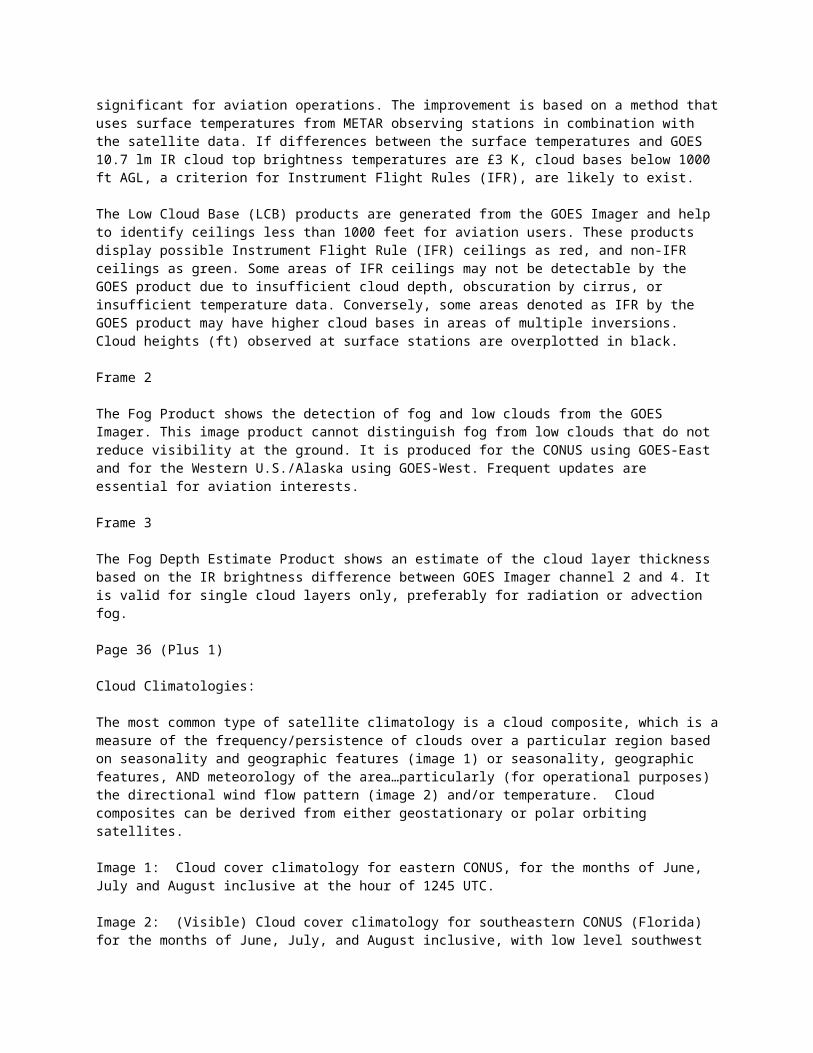
GOES visible imagery 1745 – 2125 UTC 11 June 2001. METARs may be toggled on/off with the “11June01” check box in the controls frame. A supercell develops in the vicinity of a low in southwest Minnesota. This storm exhibits inflow feeder clouds around 1955 UTC. Also note the outflow on the west side of the supercell around this time.
Page 41 (Loop)
3.9 mm shortwave IR loop - 20:45 - 0015 UTC. Near, and especially after, sunset we advise looking at the 3.9 mm imagery. 3.9 mm is better than 10.7 mm, because the information about cloud fields is enhanced by the fact that water clouds and ice clouds can be discriminated. Using this enhancement, the low level clouds show up as dull gray, the water/ice mix clouds as dark gray, and ice clouds as the darker colors or noisy-looking bright gray green. Note mesoscale deck of clouds that forms in southeastern AR and northwestern MS in association with the shortwave. This is a field of altocumulus castellanus (10.7 mm and 00Z JAN sounding). As the leading edge reaches central MS, a line of storms erupts and the accas dissipates. Why? Note organized bands of low-level cu developing in southwest MS. There are also many SW/NE oriented lines in AL and GA which may play a role later. NOTE: There will be slightly better resolution on Ch-2 at night, due to less diffraction.
Page 42
GOES-11, 1-min interval, visible loop 22:53 – 00:47 UTC. Early in the loop. we note that there are inflow feeder clouds, but no horizontal rolls west of the flanking line. Shortly thereafter we can see stratiform clouds pushing out ahead of the storm. Note that these clouds are casting a long shadow. The height of these clouds will be analyzed on the next Page, where they are found to be mid-level clouds. Notice the double pulse in the OST as it relates to the double pulse in the advancing stratiform clouds. Remember that this is not a classic supercell – little directional shear, no tornadoes reported. Note OST associated with northeastern storm appears at 00:22 UTC. On radar isolated we see the new echo at 00:18 UTC.23) Output from AWIPS Cloud Height Algorithm at 23:45 UTC 5 August, 2000 – The height of the clouds below the anvil level cirrus observed rushing southeastward from the storm are found to be around 580 mb. These are mid-level clouds, not low-level outflow. These are most likely caused by a gravity wave associated with the storms’ updraft.
Page 43 (Plus 1)
Lightning storm over Boston
Image ID: wea00606, NOAA's National Weather Service (NWS) Collection Photo Date: 1967Photographer: Boston globe
In the United States, the Federal Aviation Administration (FAA) has a system in place to track lightning strikes on commercial aircraft. The reported statistical results indicate that lightning strike frequency is such that every commercial aircraft gets one and a half strikes per year and commercial pilots experience this phenomenon once every 3,000 flight hours.
>50% of military aircraft weather-relatedin-flight mishaps are caused by lightning.-Major P.B. Corn, Air Force Flight Dynamics Lab.
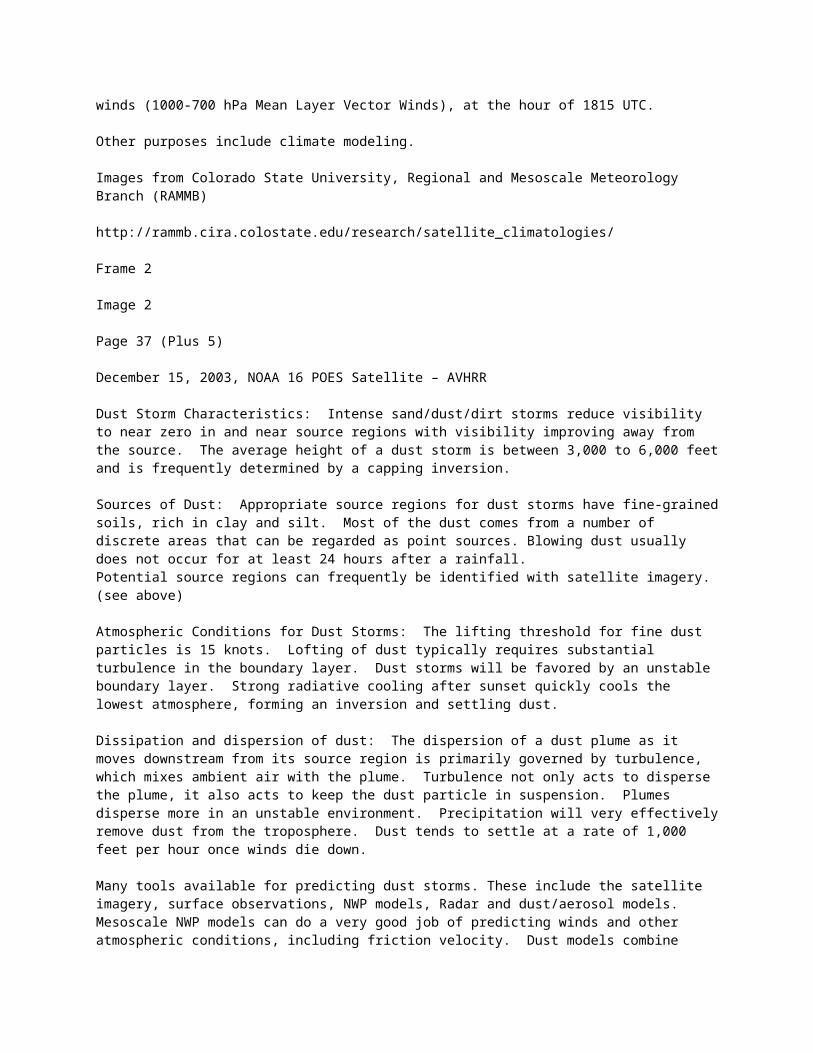
1988-1996: USAF had direct repair costs of$1,577,960 due to lightning damage to aircraft.– US Air Force Safety Center, Albuquerque NM. Lightning costs ~$2 billion annually in airlineoperating costs & passenger delays.-NOAA Report No. 18, MIT, 13 Feb. 1998.Lightning can have varying effects on an airplane, ranging from "no" effect, to severe damage, and even in extremely rare instances, explosion is fuel >tanks. Since the exterior or "skin" of most aircraft is metal, the electrical charge of the lightning bolt travels along the surface of the >aircraft and exits, causing only minor damage, such as pits or burns on the skin at the points of entry or exit. Occasionally the lightning can damage >other parts of an aircraft, such as the electrical or avionics systems. Aircraft are required to remain at least 20 miles from thunderstorms, mainly to protect them from hail and turbulence, but also from lightning. But those first two components of a thunderstorm cause much more damage to aircraft than lightning does.
Aircraft can trigger lightning. Communications may be interrupted due tolightning. When lightning strikes an airplane … Lightning attaches to an extremity(nose, tail or wingtip). Current travels through the conductive exterior skin &structures and exits off another extremity.
Frame 2
Photo: Courtesy NASA
Positive lightning makes up less than 5 percent of all strikes. However, despite a significantly lower rate of occurrence, positive lightning is particularly dangerous. Since it originates in the upper levels of a storm, the amount of air it must burn through to reach the ground is usually much greater. Therefore, its electric field typically is much stronger than a negative strike. Its flash duration is longer, and its peak charge and potential can be 10 times greater than a negative strike; as much as 300,000 amperes and 1 billion volts!Some positive strikes can occur within the parent thunderstorm and strike the ground beneath the cloud. However, many positive strikes occur near the edge of the cloud or strike more than 10 miles away, where you may not perceive any risk nor hear any thunder. Positive flashes are believed to be responsible for a large percentage of forest fires and power line damage. Thus, positive lightning is much more lethal and causes greater damage than negative lightning.There are two principal sources of static electrification on aircraft. The Autogenous Field is caused by frictional charges resulting from contact between the aircraft and various particles such as dust as it moves through the atmosphere. Exogenous Fields are caused by the presence of the aircraft in a thunderstorm which can cause both positive and negative streamers.
Page 44
Is hail dangerous to aircraft? Hail is regarded as one the worst hazards of thunderstorm flying, as if turbulence wasn't enough. Hail is generally found at about the 10,000 to 15,000 foot levels above the terrain, with the greatest
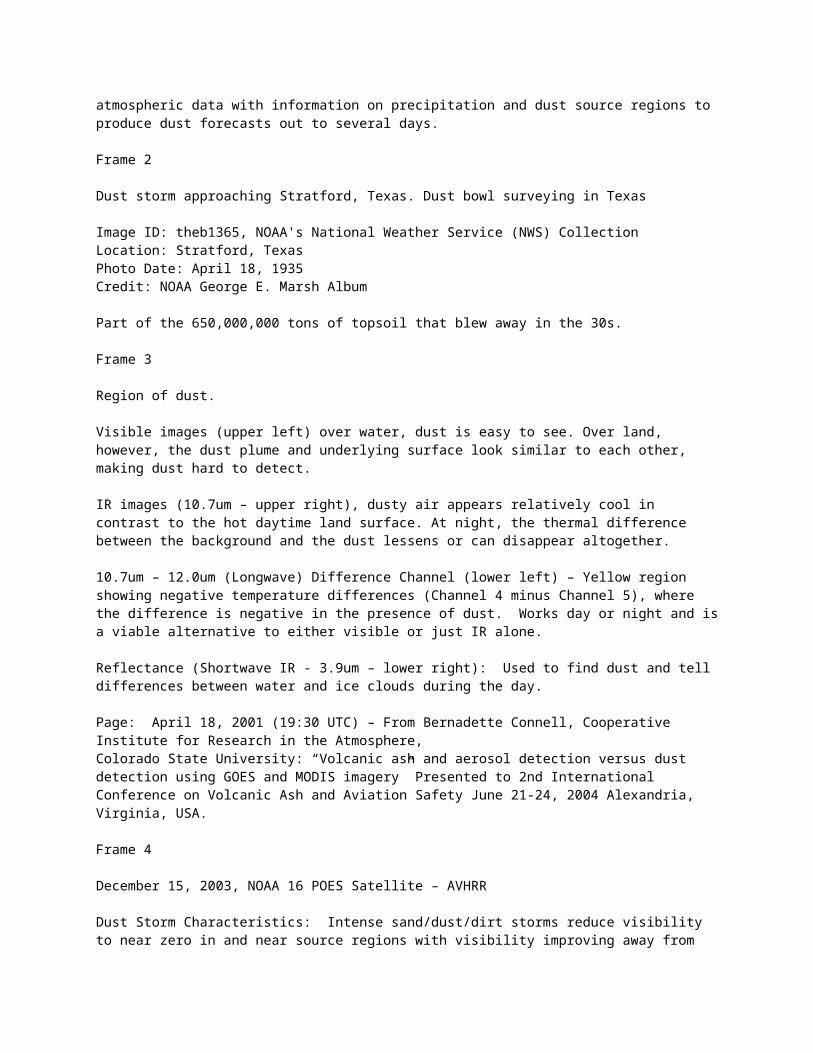
frequency of hail occurring at the mature stage of the thunderstorm. Hail can produce serious structural damage to an aircraft in a few seconds, especially if the hail is large. In severe thunderstorms (hail greater than 3/4in and/or wind gusts 50kts or greater), hail may be encountered in clear air as much as five miles in advance of a thunderstorm!Yes. On April 4, 1977, a Southern Airways DC-9 crashed in New Hope, GA. Both engines of the plane ingested hail and lost thrust. The plane crashed onto the road and burst into flames. Two of the four crew members and 60 of the 81 passengers were killed; eight others on the ground were also killed.
Also, the reason why we have ¾” as the demarcation for severe hail - it is based on a 1952 study of the "smallest size of hailstones that cause significant damage at airplane speeds between 200 and 300 mph." Though this was based on DC-3 type aircraft, hail remains a significant hazard to aviation.
Page 45
Remains of a large military aircraft after passage of tornado Tornado of March 25, 1948 at Tinker Air Force Base, Oklahoma The coming of this storm resulted in the first broadcast tornado warning
Image ID: wea00224, NOAA's National Weather Service (NWS) Collection Credit: Tinker Air Force Base History Office
Tornadoes and aircraft? The implications are too obvious. Look for mentions in the PIREPs, SIGMETs and MIS.
Page 46
St. Louis, 17 September 2006 – University of Washington.
Turbine engines have a limit on the amount of water they can ingest. Updrafts, as mentioned earlier, are present in thunderstorms, particularly those in the developing stages. If the updraft velocity in the thunderstorm approaches or exceeds the terminal velocity of the falling raindrops, very high concentrations of water may occur. In English, the upward vertical wind is able to suspend water droplets in a particular area of the cloud allowing for a buildup of water. It is possible that concentrations of water can be in excess of the quantity of water that turbine engines are designed or are able to ingest. Therefore, severe thunderstorms may contain areas of high water concentration, which could result in flameout and/or structural failure of one or more engines, probably not a good thing. There is also the possibility of severely reduced visibility, resulting in hitting the landing strip in the wrong area and then hydroplaning upon landing and not being able to stop in time.
Page 47
Icing is another significant hazard of flying through thunderstorms. Icing generally occurs in the mature and dissipating stages in the middle levels of the thunderstorms where the temperatures are between 0 to -15 degrees Celsius. Due to the extreme nature of icing, an aircraft can lose its lift rapidly. Supercooled (water that exists in below freezing temperatures - its a thermodynamic thing) water freezes on impact with an aircraft. Clear icing can occur at any altitude above the freezing level; but at high levels, icing from smaller droplets may be rime or mixed rime and clear. The abundance of large,
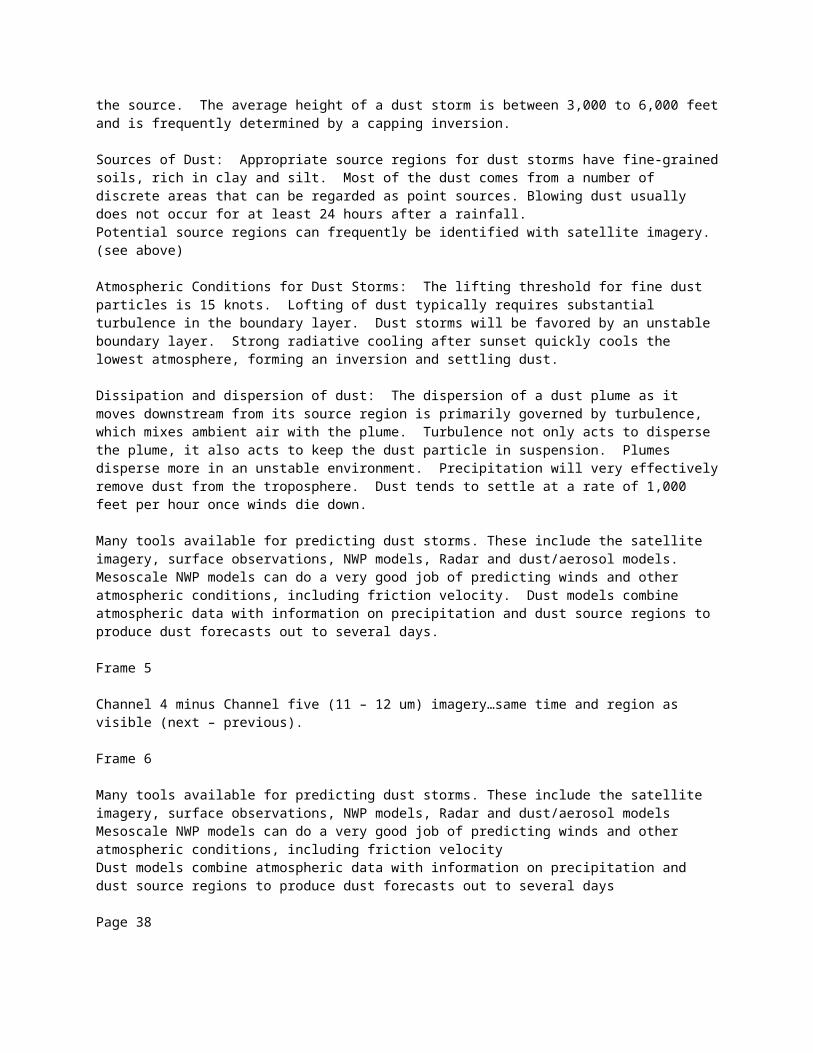
supercooled water droplets makes clear icing very rapid and encounters can be frequent in a cluster of convective cells. Clear icing can be extremely hazardous, extremely quickly.
Thunderstorm Icing – The worst icing conditions are encountered at and just above the freezing level (0degC to -15degC), but can be encountered throughout the cloud at different stages of the thunderstorm.
Page 48
Pressure usually falls rapidly with the approach of a thunderstorm, then rises sharply with the onset of the first gust and arrival of the cold downdraft and heavy rain showers, falling back to normal as the storm moves on. The pressure changes are the result of large temperature fluctuations. This cycle of pressure change may occur in 15 minutes. Altimeters may be more than 100 feet in error in a very short distance. Not a good thing in IMC during an IFR approach.
Page 49
The list: Gap winds, land and sea breezes, diurnal mountain and valley winds, terrain induced thunderstorms, katabatic winds, severe downslope winds, and mountain wave turbulence.
Page 50
Gap wind causes: Pressure gradients associated with synoptic or regional-scale features.Pressure gradients associated with rapid changes in the depth of cool air at low levels with colder air masses on the upstream side of the gap.
Gap winds develop when the pressure gradient lies across breaks in the terrain ranging from yards to miles wide. The terrain steers the wind flow to more or less follow the gap axis and thus increases its speed. Typically, the stronger the pressure gradient and narrower the gap, the stronger the resulting wind speed.
The terrain gap is not a fully enclosed tunnel but an open-topped channel. Thus, the fluid build-up at the terrain gap not only pushes the air through but also forces some to rise over it. As a result, the strongest winds generally do not blow at the narrowest width of the gap but near its downwind "re-opening."
Gap winds typically blow over shallow depths several hundred to a few thousand feet deep, and they can reach velocities of over 50 knots near the surface, particularly hazardous to aviators, boaters along the coastlines or among islands, and to motorists winding through rugged mountain terrain.
The strongest winds occur in the gap exit regions, as winds accelerate through the gap. In mountain pass areas, gap wind mechanisms can combine with downslope wind mechanisms to generate winds stronger than 100 kt.
Frontal passages can really wreak havoc in gap areas since the wind speed and direction can change very quickly…causing gap winds to generate in an areas one minute when there were none the minute before.
Page 51
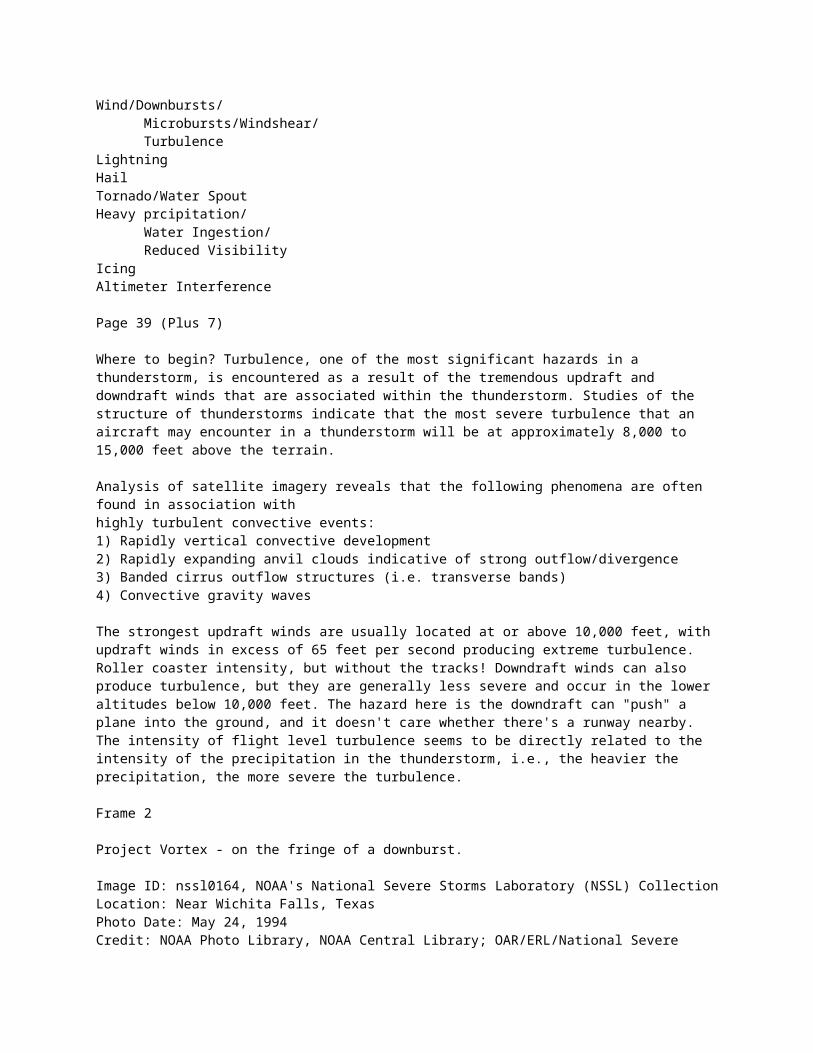
Orographic convective initiation mechanisms (from Banta 1990). When analyzing the effects of orography on convection over the mountains, keep in mind that the large scale dictates if thunderstorms will form or not, and the small scale dictates where and when convection will occur. Mountain flows play a role in convective initiation, but should be kept in mind together with other physical and dynamic processes. The important mountain flows that play a role in convective initiation are: Orographic lifting – forced ascent due to upslope flow. Air can be lifted to the LFC when the LFC is near or below ridgetop. Thermal forcing – elevated heating produces lower pressure over the mountain, leading to flow towards the mountain and thus convergence and updrafts near the peaks.Obstacle effects – convergence due to flow interacting with the terrain.The flow at ridge top level determines which mechanism plays a larger role Light flow at ridgetop level - Thermal forcing dominates. Thermal forcing is more (less) pronounced when the soil moisture is low (high) and there is less (more) vegetation cover. Solar angle is also key, meaning that convection begins on the east facing slopes, and later in the day develops on the west facing slopes. The level of predictability depends on ridetop winds, cloudiness, and soil moisture.
Strong flow at ridgetop level - As the ridge top flow gets stronger, the effects of solar angle become less important on cumulus initiation and cumulus clouds tend to form downwind of the peak unless the LCL is below mountain top (in which case clouds will tend to form upwind of the peak). Strong ridge top winds interfere with the thermally forced wind systems that lead to convective initiation. Thermally forced upslope flow becomes shorter and more disorganized. Thermal forcing effects are limited while obstacle and dynamically driven (i.e. gravity waves, convergent flow) effects tend to dominate.
Page 52 (Plus 5)
When strong flow encounters a topographic barrier, a vertically propagating gravity wave is generated. A key to mountain-wave formation is when the energy from the vertically propagating gravity wave can no longer go up, the energy may be redirected to the surface. This energy propagation is why it is possible to produce surface wind speeds at the base of the mountains far in excess of the wind speeds observed at any level in the free atmosphere. A critical level is the level in the atmosphere that prevents the gravity wave energy from continuing upward.
A critical level can be either a "mean-state" or "self-induced" type. A mean-state critical level means that it exists in the larger-scale observed or forecast data, while a self-induced critical level is generated by the mountain-wave itself, and probably cannot be observed except perhaps with a field program. A mean-state critical level is often defined as a level in the atmosphere where the cross-barrier flow goes to zero. This can be a place where the winds become very light, or where the winds become parallel to the barrier, or it can be the level where a wind direction reversal takes place (going from easterly to westerly flow). A mean-state critical level can also be a stable layer topped by an unstable layer. A fluid oscillation can take place in the stable layer, but not in the unstable layer, so the energy from the oscillation (a gravity wave) cannot propagate upward. A self-induced critical level can be visualized as the turbulence generated by a breaking wave. Consider a breaking ocean wave, where, as the wave builds and then
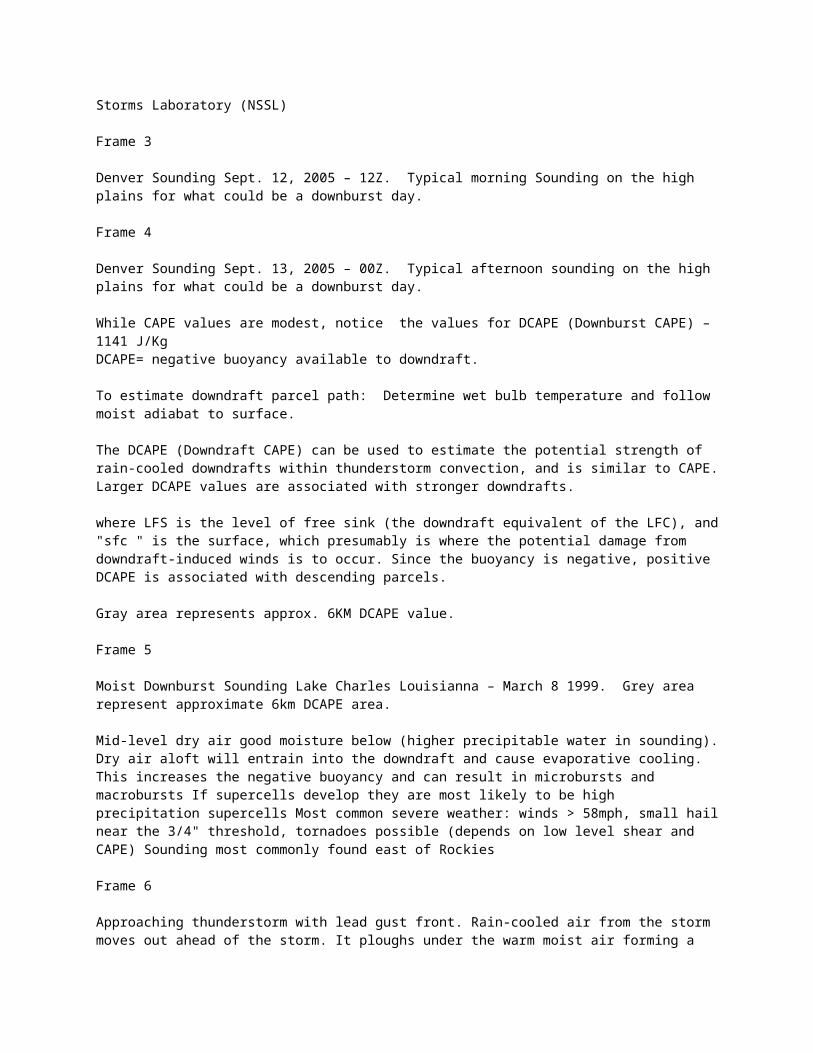
finally breaks, a region of turbulence is created where the flow may either reverse or go to zero. This region acts to prevent energy from propagating vertically through it. Wave breaking seems to be enhanced in the presence of "reverse shear". Reverse shear is cross-barrier flow that decreases with height. It is thought that even in the absence of a mean-state critical level, that reverse shear can lead to wave breaking, and thus, a self-induced critical level.
1. Strength of the cross-barrier flow2. Magnitude of the cross-barrier sea-level pressure gradient3. Presence of a critical level4. Near ridge-crest stability with lower stability aboveThe first two factors accounted for 82% of the variance in the strength of the observed winds, but the strongest events had all 4 factors present. The presence of a critical level was most important for events with stronger cross-barrier flow, which in turn produced wave-type events. However, it was noted that wave formation results in warming of the column and lowers the surface pressure in the lee of the mountains, which increases the cross-barrier pressure gradient. So, a wave-type event can result in stronger gap flow.
Talk about the schematics…flow, stability, hydraulic jump region, wave breaking…then talk about the “special case” for increased destructive/turbulent winds (five Pages).
Frame 2
Frame 3
Frame 4
Mountain waves and the Special case for Severe Downslope Winds.
Frame 5
Mountain waves and the Special case for Severe Downslope Winds.
Frame 6
Page 53 (Plus 1)
Extensive snow dunes wrinkle the surface of large parts of East and West Antarctica. The dunes are up to 100 kilometers long and separated by 2 to 4 kilometers, but only a few meters high. Comparison of modern satellite images with images acquired four decades earlier reveals that the dunes are nearly motionless. The dunes are unique in that they appear not to be formed by normal wind deposition, but rather by ablation due to wave patterns set up in katabatic winds. The linear pattern is due to backscatter variations associated with grain-size changes across dunes.
Katabatic - meaning "going downhill", is the technical name for a drainage wind (gravity wind), a wind that carries high density air from a higher elevation down a slope under the force of gravity. Winds such as the foehn or Chinook ARE NOT KATABATIC! Instead, rain shadow winds where air driven upslope on the windward side of a mountain range drops its moisture and descends leeward drier and warmer.
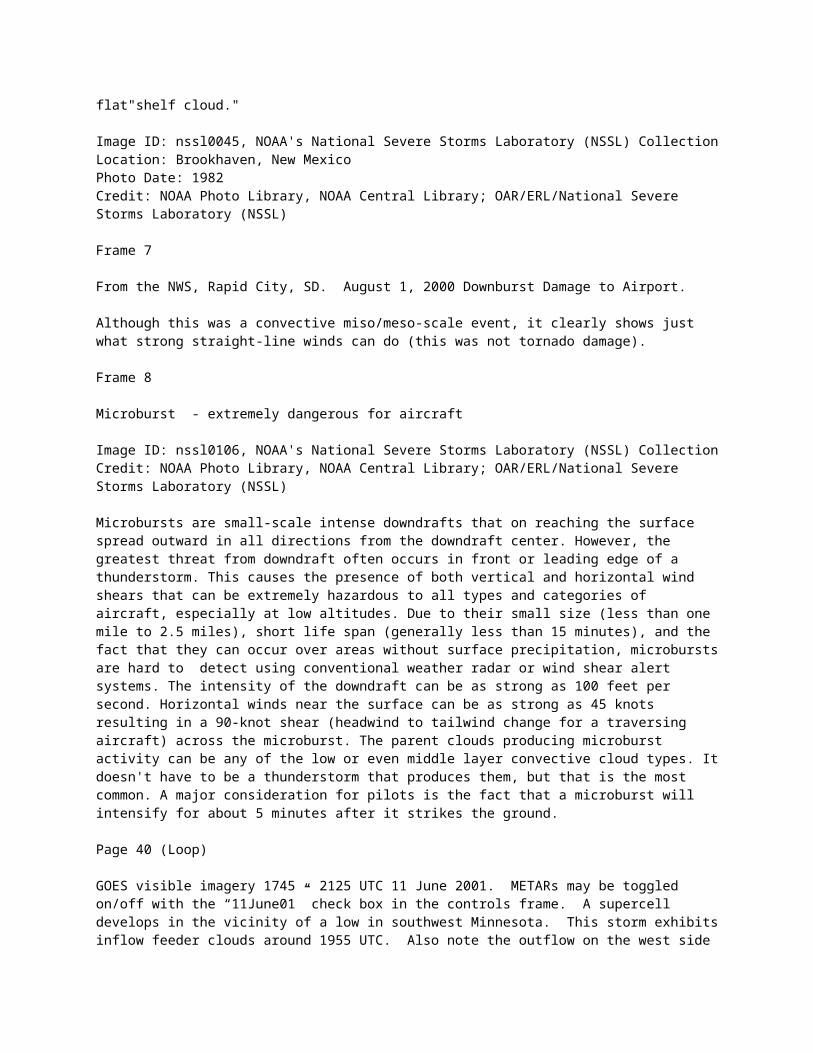
Katabatic winds can rush down elevated slopes at hurricane speeds, but most are not that intense and many are on the order of 10 knots or less. Examples of true katabatic winds include the Mistral in the Mediterranean, the Bora in the Adriatic, and the Santa Ana in southern California. A katabatic wind originates from the cooling by radiation of air atop a plateau, a mountain, glacier, or even a hill. Since the density of air increases with lower temperature, the air will flow downwards, warming adiabatically as it descends. The temperature of the wind depends on the temperature in the source region and the amount of descent. In the case of the Santa Ana, for example, the wind can (but does not always) become hot by the time it reaches sea level. In the case of Antarctica, by contrast, the wind is still intensely cold.
Frame 2
Page 54 (Plus 4)
Worldwide, nearly 500 airports lie within 100 km (62 miles) of active volcanoes. This is not an easy question to answer because the type of extensive research needed to answer these questions is destructive and expensive. The ash encounter listed here suggests that even what is considered a diffuse cloud caused major problems that prompted having all 4 engines replaces.The instruments detected SO2 and aerosol data. The aircraft was flying ~200mi north of the northernmost projected path of the plume and ~800 mi n of the volcano. The plume was ~35 hours old at this time.Ash plume penetration (into the aircraft) can be detected by an odor in the cabin air, by changes in engine readings, at night by the presence of St. Elmo’s fire, or by frosting of windows. The crew did not observe any of these features.
Potential hazards to aircraft are related to the intensity of the eruption and where the aircraft is in relation to what type of eruption and what stage of the eruption. The smaller eruptions become a hazard for ground operations and for aircraft taking off and landing. The larger eruptions become a hazard to long-distance flights.
The primary volcanic hazard to airports is ashfall, which causes not only loss of visibility and slippery runways, but structural damage and contamination to ground systems and stored aircraft along with slippery runways.
Ash in airspace around airports has damaged in-flight aircraft and caused airport closures that can involve loss of alternate landing sites.
Mt. Pinatubo, June 1991. Accumulation of even a few millimeters of ash has caused temporary airport closures. Heavy ash fall of up to 6 inches caused this World Airways CD-10 airplane at Cubi Point Naval Air Station to set on its tail. All told, 20 commercial jet aircraft were heavily damaged. The ash cloud caused eleven commercial aircraft in flight emergencies. On rare occasions, airports also have been damaged by pyroclastic flows (e.g., on the island of Montserrat, British West Indies, in 1997) and lava flows (notably, at Goma, Dem. Rep. of Congo, in 2002).
Frame 2
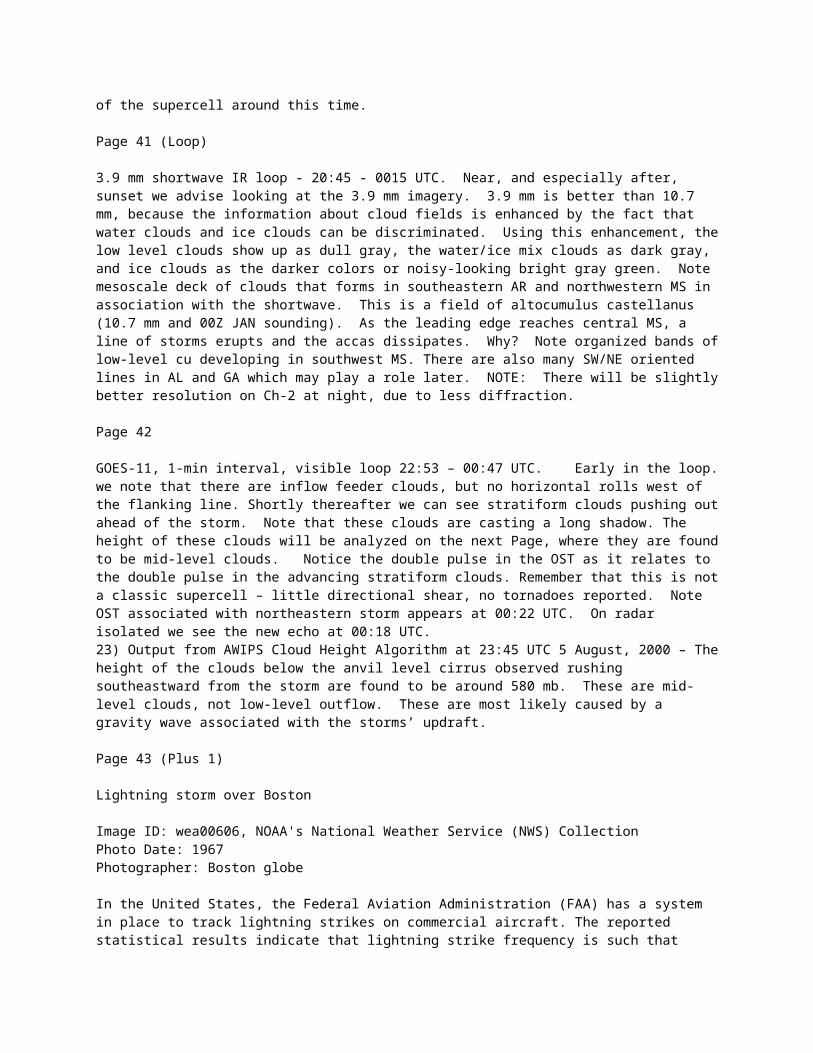
Reference New Session + Look at The Front December 2003
Frame 3
The ash particles also damage the external and aerodynamic surfaces of an aircraft…especially the windscreen (is a very common occurrence). Windscreens can become totally obscurred (etching) or even crack due to the ash’s hardness and the sppeds of the aircraft. As a matter of fact, documentation of the frequency and cost of damage to the windscreen helped to spark alert system development. Photo, NOAA-15 Satellite, July 10, 2008, Kilauea Volcano – ash and gas “cloud.”
Frame 4
Common flight routes near of over this highly active volcanic region. One can easily see the need for advanced observations and forecasting of volcanic plume movement.
Frame 5
Mt. Pinatubo, June 1991. Accumulation of even a few millimeters of ash has caused temporary airport closures. Heavy ash fall of up to 6 inches caused this World Airways CD-10 airplane at Cubi Point Naval Air Station to set on its tail. All told, 20 commercial jet aircraft were heavily damaged. The ash cloud caused eleven commercial aircraft in flight emergencies. On rare occasions, airports also have been damaged by pyroclastic flows (e.g., on the island of Montserrat, British West Indies, in 1997) and lava flows (notably, at Goma, Dem. Rep. of Congo, in 2002).
Page 55 (Plus 1)
Again, the implications of Tropical cyclones (much like that of severe thunderstorms and tornadoes) with regard to aviation is too obvious. Severe winds, torrential rains and the prospect of waterspouts and/or tornadoes is just too great. Today’s forecasting of intensity and movement of tropical cyclones has much improved over years (as has the technology to monitor these behemoths) and with the issuance aviation tropical storm advisories (Example: Tropical Cyclone International Civil Aviation Organization (ICAO) Advisory – National Hurricane Center) …gives both the pilot as well as airports affected plenty of heads-up to either avoid the phenomenon and re-direct the flight path or to batten down the hatches on the ground.
For more information on Tropical Cyclones, go to: the SHyMet Intern session on Tropical Cyclones at - http://rammb.cira.colostate.edu/training/shymet/intern_tropical.aspor,
Photo from Earth Science.org - http://earthsci.org/processes/weather/cyclone/cyclone.html
Frame 2
Example: Tropical Cyclone International Civil Aviation Organization (ICAO) Advisory – National Hurricane Center
Page 56 (Loop)
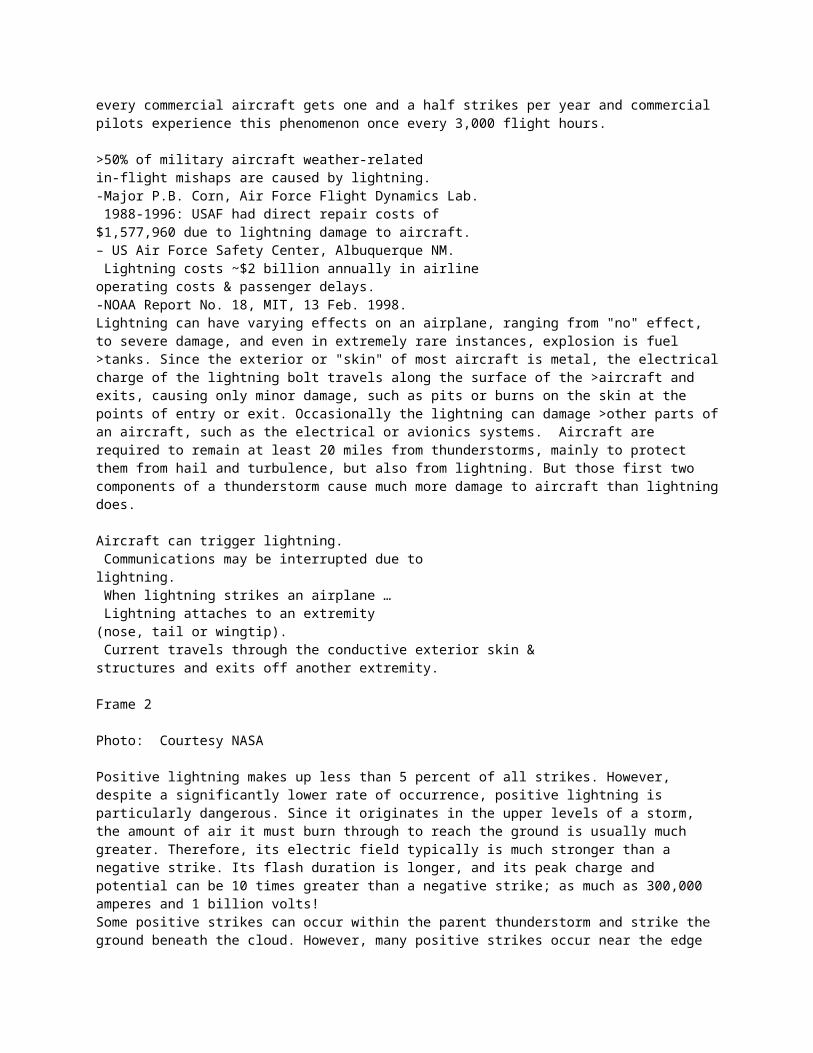
Loop Tropical Storm Hanna – transverse Waves (Turbulence)
GOES-13 IR images (above) displayed a period of transverse banding during the 01-05 UTC period — this transverse banding is a satellite signature of potential turbulence (although no aircraft reports of turbulence were received from that region, since pilots generally try to avoid flying over tropical storms). Very cold cloud top brightness temperatures were observed prior to the period of banding, with values in the -80º to -89º C range (light purple to dark purple colors).
Page 57 (Plus 2)
On January 15, 2009, at 3:27 in the afternoon, US Airways flight 1549, an Airbus A320-214, registered as N106US, experienced multiple birdstrikes following takeoff from New York's LaGuardia Airport. Birds were ingested by both engines and caused a significant loss of thrust. Due to the thrust loss, the airplane was unable to maintain level flight. The flight crew subsequently ditched the airplane in the Hudson River, adjacent to the Intrepid Sea, Air, and Space Museum, in New York City. The 150 passengers and 5 crewmembers evacuated the aircraft and were rescued by local ferry operators and boaters in the immediate area. One flight attendant and three passengers suffered serious injuries during the touchdown.
The flight data recorder, or FDR, revealed that the elapsed time from takeoff to the birdstrikes was a little over 1.5 minutes. The time from the birdstrikes to touchdown in the water was about 3.5 minutes. The birds struck the aircraft at an altitude of about 2,750 feet.
The birds: 5 to 11 pound Canadian Geese.
The effectiveness of bird mitigation efforts at or near airports. According to Embry-Riddle Aeronautical University statistics, birdstrikes cost the U.S. economy over $300 million per year (around a billion world wide), and have caused loss of life in the past. In 2007, a total of 7,439 birdstrikes were reported to the FAA. This number equates to 1.751 birdstrikes per 10,000 aircraft movements. Natural habitat surrounds many modern airports, and this habitat provides shelter, nesting areas, and feeding areas for wildlife that are not usually present in the surrounding metropolitan area. Further, because bird flight typically occurs at low altitude, a majority of wildlife strikes occur within the immediate airport environment. The Board is interested in exploring the new technologies that are being developed and fielded to detect large groups of birds in these environments.
U.S. Rep. John Mica, R-Fla., said he wants lawmakers to examine whether air traffic controllers in New York had technology sufficient to pinpoint the birds that reportedly collided with the jet – and whether the technology was “dumbed down” to eliminate clutter on radar screens. He says there's been little federal money for research into ways to prevent bird strikes.
About a year ago, concerns about waterfowl-jet collisions helped kill the Navy's plan to build a practice landing field near Pocosin Lakes National Wildlife Refuge in Eastern North Carolina. The refuge attracts some 100,000 large snow geese and tundra swans each year.At Charlotte/Douglas, airport officials use three main tactics to deal with birds: scaring them with noise or pyrotechnics, trapping them, or killing
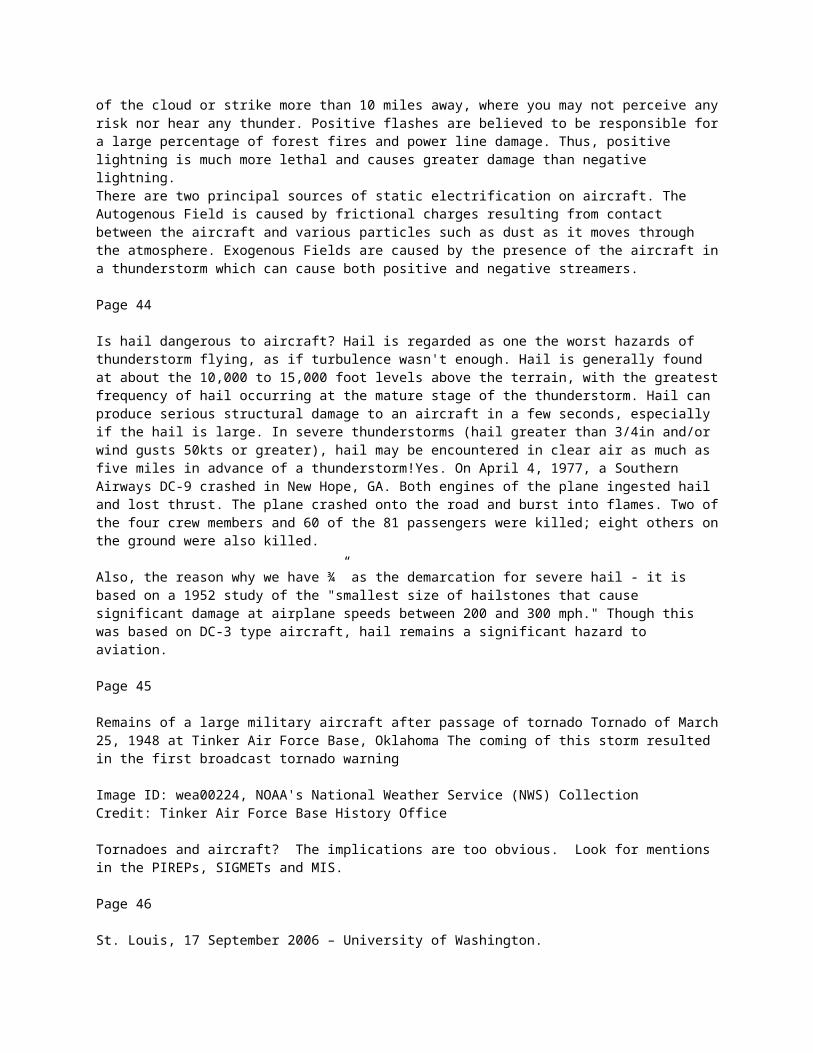
them.Experts hope new technology will help detect birds and keep them away from planes. They recommend more research into lighting on planes to scare away birds, vegetation that can make airports less attractive to wildlife, and radar that can be used to pinpoint the location of bird flocks from miles away.
Frame 2
March 2, 2003: These photographs show a Blackhawk helicopter that hit an migrating Crane at 800 feet AGL.
Frame 3
Since 1985 there have been over 38,000 bird-aircraft strikes recorded by the United States Air Force (USAF) that killed 33 aviators, destroyed 30 aircraft, and caused more than $500 million dollars worth of equipment damage.
AHAS is an online, near real-time, geographic information system (GIS) used for bird strike risk flight planning across the continental United States. Using NEXRAD (WSR-88D) weather radars and models developed to predict bird movement, AHAS monitors bird activity and forecasts bird strike risk as well.
The United States Air Force has developed a predictive Avian Hazard Advisory System (AHAS) using Geographic Information System (GIS) technology as a key tool for analysis and correlation of bird habitat, migration, and breeding characteristics, combined with key environmental, and man-made geospatial data.
Above is an example of the Bird Avoidance Model Run for the eastern region of the North Caroline/Virginia border area. The results are good for the two week period of February 26, 2009 to March 11, 2009 at dawn.
Page 58
Page 59 (Plus 2)
**Relatively NEW** - The FAA together with NOAA and NASA – have teamed up to provide a new set of forecast products that target remote oceanic regions of the Earth.
From: The Oceanic Weather Product Development handbook – Tenny Lindholm, FAA Oceanic weather product development team and Federal Aviation Administration (FAA) Aviation Weather Research Program.
Goals which affect oceanic decision makers, such as—pilots (all types), dispatchers,oceanic traffic managers and controllers: To improve shared situational awareness for pilots,controllers/traffic managers, and dispatchers through extensive user interaction and input.
FAA goals—enhance safety and efficiency
Better the diagnoses, nowcasts, forecasts of – Convection, Non-convective
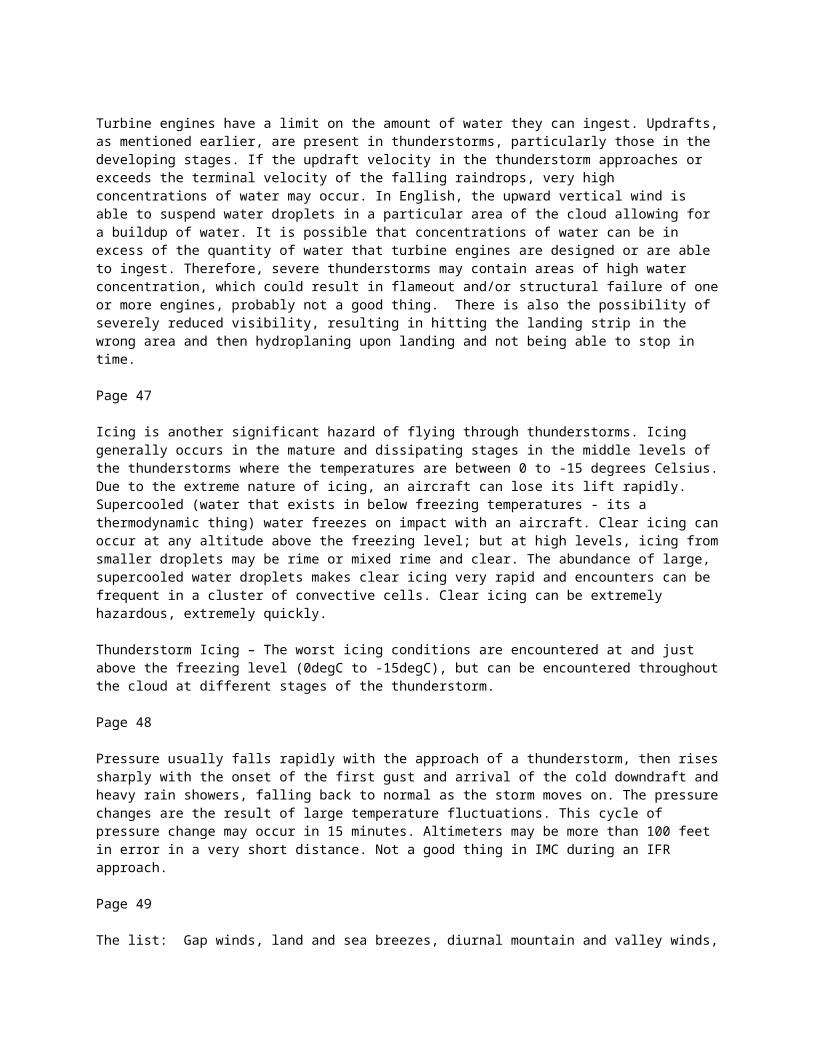
turbulence, In-flight icing, Volcanic ash cloud dispersion, Winds aloft, and Obstructions to visibility over the remote oceanic regions.
Objectives: Applied research and development toward informational weather products for (global) oceanic and remote regions concerning: Convection, Turbulence, Clear air (CAT), Convective induced turbulence (CIT), In-flight icing (ETOPS), Volcanic ash detection and dispersion, Improved flight level winds, Obstructions to visibility (off-shore operations). Then transfer to operational through Evaluation, Verification, and eventually Technology transfer to and in-place or emerging Infrastructure.
Development of “Intelligent weather systems” from the use of expert system framework to mimic what a“real” meteorologist does to generate a forecast. This will allow fast and precise assimilation of all data that canadd skill to generate informational products. The result: rapidly and frequently updated, high resolution, 4-dimensional graphic of the weather hazard that is easily transmitted to ground and airborne users.
Remote, oceanic regions have severely limited data availability and therefore, have few, if any, high resolution weather products that indicate current or future locations of convection. Convective hazards impact the safety, efficiency and economic viability of oceanic aircraft operations by producing turbulence, icing and lightning and by necessitating aircraft rerouting while in-flight, leading to higher fuel costs and delays. To improve convective products for the oceanic aviation community, the NASA-sponsored Oceanic Convection Diagnosis and Nowcasting project is focused on oceanic convective nowcasting over a 0-2 hour period. Polar-orbiting and geostationary satellite observations are utilized in addition to global model results. Resulting products focus on the needs of pilots, dispatchers, air traffic managers and forecasters within the oceanic aviation community.
Product Status and Schedule(Operational)• Cloud top height—2007– in use now.• Convective diagnosis (expert system)—2008– Prototype 2004• Improved 3-D wind field— in use now.• Convective nowcast (0-2 hours)—2009• Turbulence (convective induced, clear air)—2010– Prototype CAT expert system—2003• Volcanic ash dispersion—2010• Convective forecast (2-6 hours)—2012• In-flight icing—2012
A Lightning Detection Mapper (in cloud) will also be available for Oceanic forecasting when GOES R becomes operational towards the end of the next decade.
Frame 2
Frame 3
Convective Diagnosis: An oceanic convection diagnosis and nowcasting system is described whose domain of interest is the region between the southern continental United States and the northern extent of South America. In this
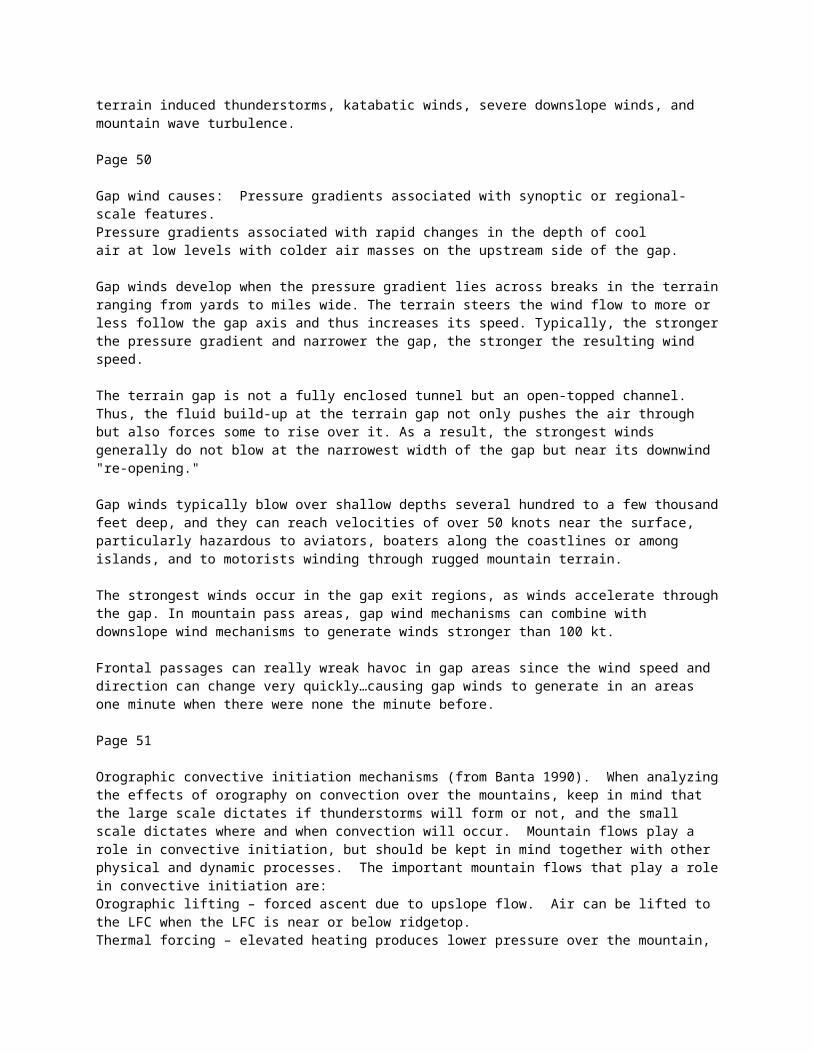
system, geostationary satellite imagery are used to define the locations of deep convective clouds through the weighted combination of three independent algorithms. The resultant output, called the Convective Diagnosis Oceanic (CDO) product, is independently validated against space-borne radar and lighting products from the Tropical Rainfall Measuring Mission (TRMM) satellite to ascertain the ability of the CDO to discriminate hazardous convection. The CDO performed well in this preliminary investigation with some limitations noted. Short-term, 1-hr and 2-hr nowcasts of convection location are performed within the Convective Nowcasting Oceanic (CNO) system using a storm tracker. The CNO was found to have good statistical performance at extrapolating existing storm positions. Current work includes the development and implementation of additional atmospheric features for nowcasting convection initiation and to improve nowcasting of mature convection evolution.
Page 60 (Plus 9)
ProjectThe Aviation Weather Testbed provides a means of testing new science and technology for the purpose of eventually producing better aviation weather products and services. The execution of the Testbed is accomplished via close collaboration between the AWC and its many partners.
PurposeProvide a path to operational use for experimental products and services. Invite the participation of third partiesProvide a test environment for the purpose of refining and optimizing experimental forecast toolsVerify the the scientific validity of experimental productsEducate forecasters about experimental tools and the latest research related to aviation weather forecasting.Educate researchers about operational forecast needs and constraints
http://aviationweather.noaa.gov/testbed/http://aviationweather.gov/testbed/
Frame 2
The Flight Path Tool (version 2) displays three-dimensional icing, turbulence, winds, temperature, and humidity in horizontal and vertical views. Newly available two-dimensional data include satellite, radar, cloud ceiling, surface visibility, and flight category. Typical forecast and observed textual data including surface weather reports (METARs), terminal forecasts (TAFs), voice and automated pilot reports (PIREPs), and en-route weather advisories (AIRMETs and SIGMETs) that are available to view graphically and/or in text form. Another new feature in this version is the Meteorogram tool that combines past observed weather data (METARs) combined with future prediction (TAFs) in tabular form.
http://weather.aero/jade/
Frame 3
Experimental: National Ceiling and Visibility Analysis (NCVA) Product.
There are 6 different versions of this product displaying flight categories,
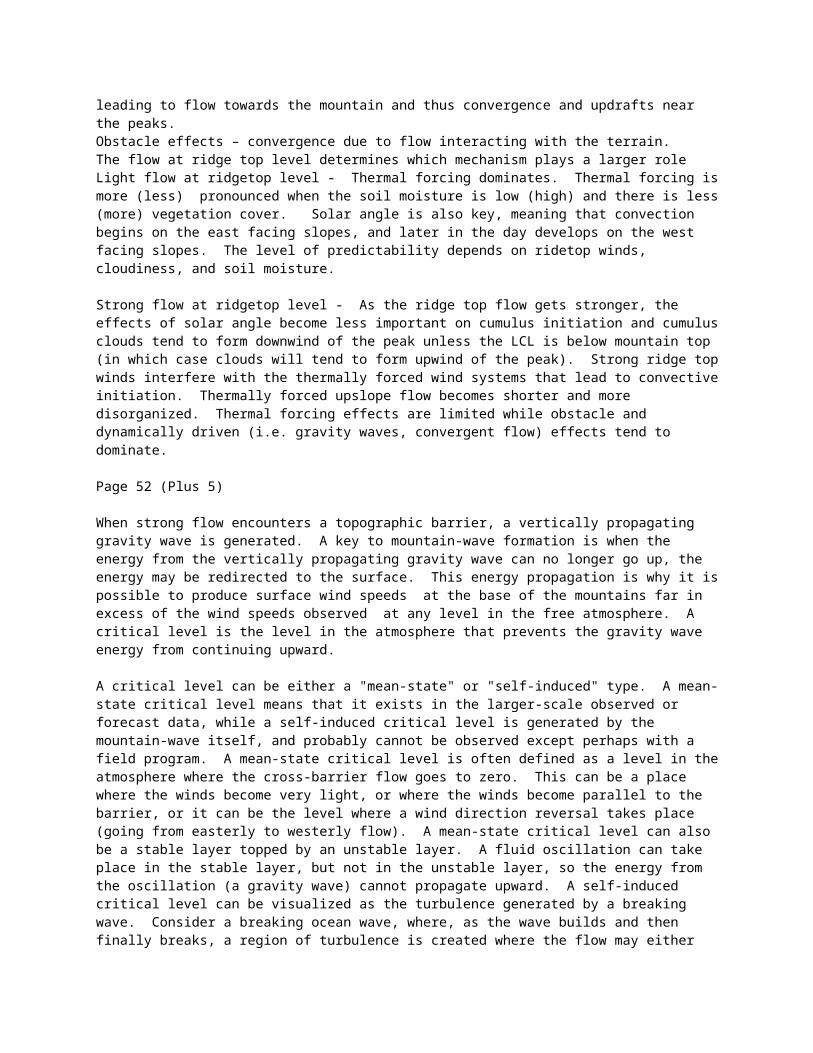
ceilings and visibilities (above).
http://weather.aero/metars/
Frame 4
The new Graphical-AIRMET product, known as the "G-AIRMET," is a decision-making tool based on weather "snapshots" displayed at short time intervals. The G-AIRMET identifies hazardous weather in space and time more precisely than text products, enabling pilots to maintain high safety margins while flying more efficient routes.
http://aviationweather.gov/products/gairmet/http://aviationweather.gov/products/gairmet/info.php
Following image graphic – Ceiling/visibility and Low Level turbulence.
Frame 5
Frame 6
(Experimental) NCEP SREF Aviation Products: http://wwwt.emc.ncep.noaa.gov/mmb/SREF_avia/FCST/AVN/web_site/visb/cnv_com_09z_prb1.htm
NCEP Short Range Ensemble Forecasting – for Aviation over the CONUS and Alaska, including: Flight Restriction Probability (above), Visibility, Ceiling and Cloud Top Amount, 10 meter wind, Low Level Wind Shear, Convection Cloud, Jet Stream probability, Icing probability, Turbulence probability, Tropopause, Freezing height, Precipitation type probability, and Fog probability.
This: 09Z Probability of LIFR on CONUS – Zero (analysis) hour.
Frame 7
New from the CWSUs:
Experimental - NWS “Mobile Aviation Product” – a quick and easy way to gather lots of data in short order (on the go):http://www.wrh.noaa.gov/zoa/MOBILE/ZOA2.htm
EXPERIMENTAL TERMINAL INFORMATION BOARD Product – A quick look at the status of any aiport/TAF.
Frame 8
Aviation Weather Community Forum 2009: http://aviationweather.noaa.gov/notice/forum/
NOAA's Aviation Weather Center is excited to announce the .Aviation Weather Community Forum., on April 14th through the 16th, 2009. This forum will be in the main auditorium of the NWS Training Center which is collocated with the Aviation Weather Center in Kansas City. The Aviation Weather Center desires to establish a forum that will continue on an annual basis, fostering ongoing and consistent weather collaboration between all aviation interests. The format of this forum will break from the traditional structure of industry
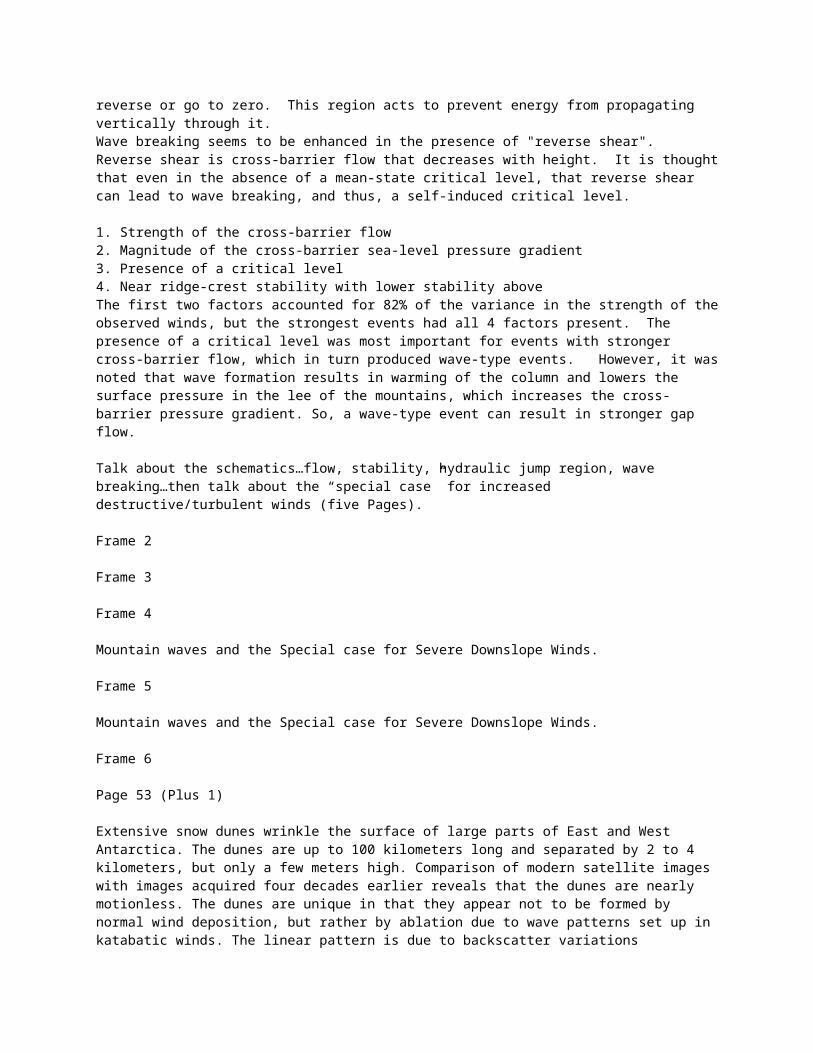
meetings and workshops. A limited number of speaker presentations and topics are planned, and they will be used to foster audience-determined breakout topics/sessions each afternoon. By diverging from passive audience listening to an array of speakers and topics, the forum aims to create a fully active dialog between all and generate tangible benefits for the Aviation Weather Community.
Frame 9
(Experimental) The AWC’s Product Overlay Display – Displaying AIRMETs turbulence and PIREPs turbulence for Feb. 11, 2009 at 19:45Z.
http://aviationweather.gov/exp/product_overlay/http://aviationweather.gov/exp/product_overlay/prod-olay-2img.html
Frame 10
(Experimental) The Elrod Index: Above – Flight Level 18000 to 24000.
The Ellrod Index results from an objective technique for forecasting clear-air-turbulence (CAT). The index is calculated based on the product of horizontal deformation and vertical wind shear derived from numerical model forecast of winds aloft. Indexes are derived from both the NAM/WRF and the RUC.
http://aviationweather.gov/exp/ellrod/nam/http://aviationweather.gov/exp/ellrod/info.php?mdl=NAMhttp://aviationweather.gov/exp/ellrod/ruc/
Page 61
Already high (super) resolution 8 bit data. Super Resolution (SR) base data are processedwith a range resolution of .25 km (.13 nm) and an azimuthal resolution of .5°. The display range for SR velocity and spectrum width products is extended from 230 km (124 nm) to 300 km (162 nm). The display range for SR reflectivity products is 460 km (248 nm).
Example: Dual Pol WSR-88D 1-hr rainfall estimate (left) vs. legacy WSR-88D estimate (right). The right-hand image was a significant overestimate due to hail contamination; the Dual Polar product provided a much better estimate.
Already super resolution vs legacy resolution:
Most weather radars, such as the National Weather Service NEXRAD radar, transmit radio wave pulses that have a horizontal orientation. Polarimetric radars (also referred to as dual-polarization radars), transmit radio wave pulses that have both horizontal and vertical orientations. The horizontal pulses essentially give a measure of the horizontal dimension of cloud (cloud water and cloud ice) and precipitation (snow, ice pellets, hail, and rain) particles while the vertical pulses essentially give a measure of the vertical dimension. Since the power returned to the radar is a complicated function of each particles size, shape, and ice density, this additional information results in improved estimates of rain and snow rates, better detection of large hail location in summer storms, and improved identification of rain/snow transition regions in winter storms.
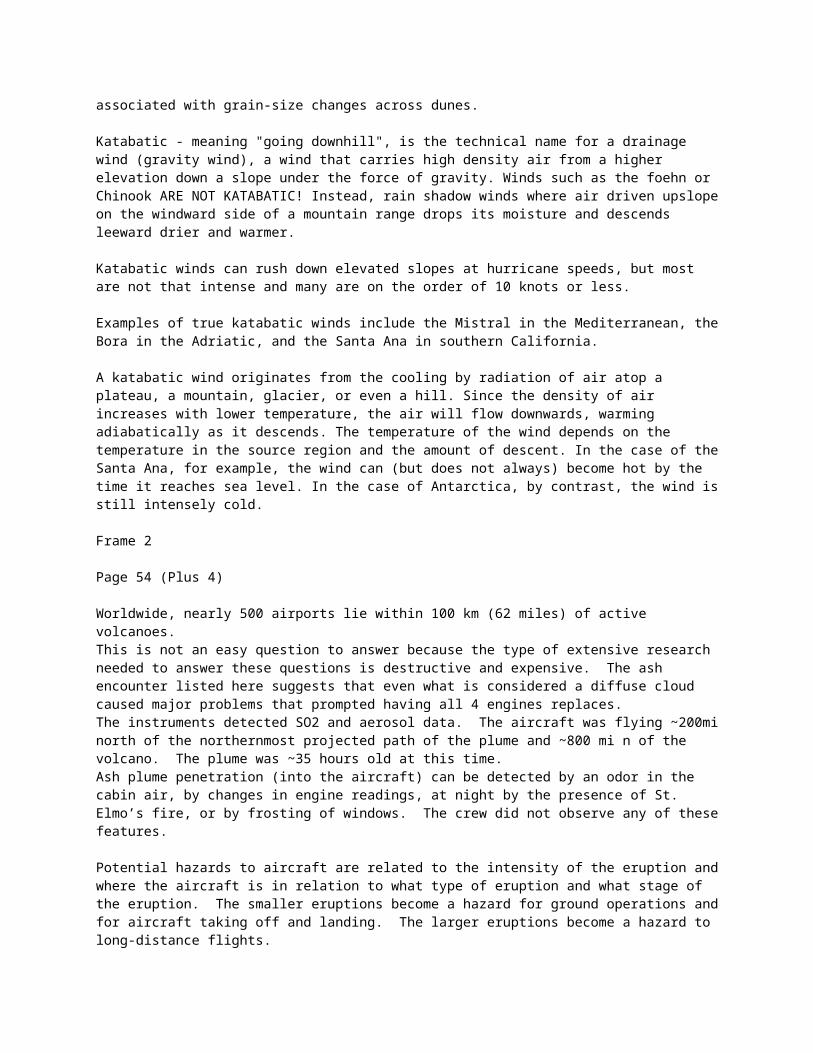
The electric and magnetic fields are oriented at 90 degree angles to each other. This concept is important for understanding what is meant by polarization. That is, the polarization of the radio wave is defined as the direction of orientation of the electric field wave crest. Polarimetric radars transmit and receive both horizontal and vertical polarization radio wave pulses. Therefore, they measure both the horizontal and vertical dimensions of cloud and precipitation particles. This additional information leads to improved radar estimation of precipitation type and rate.
The improvements associated with polarimetric radars comes from their ability to provide previously unavailable information on cloud and precipitation particle size, shape, and ice density. With this in mind, just a few of the potential applications of polarimetric radar data are listed below.
Benefits of Dual Polar Radar:
Meteorologists:Polarimetric radar can significantly improve the accuracy of the estimates of amounts of precipitation Polarimetric radar can tell the difference between very heavy rain and hail, which will improve flash flood watches and warnings Polarimetric radar can identify types of precipitation in winter weather forecasts, improving forecasts of liquid water equivalent or snow depth Polarimetric radar data is more accurate than conventional radar, saving the forecasters the step of having to verify radar data Increased confidence in polarimetric radar data can contribute to increased lead time in flash flood and winter weather hazard warnings.
Hydrologists: Polarimetric radar provides critical rainfall estimation information for stream flow forecasts and river flooding Polarimetric radar could be useful in water management
Aviation users:Polarimetric radar detects aviation hazards such as birds Polarimetric radar can detect aircraft icing conditions
Society:Polarimetric radar has the potential to save the public $690,000,000 annually by improving precipitation estimation Polarimetric radar can improve forecasts and warnings and reduce the impact of hazardous weather on our national transportation Polarimetric radar better equips forecasters to issue accurate warnings and in turn helps the public make wiser decisions about our safety
Improved estimation of rain and snow rates. Discrimination of hail from rain and possibly gauging hail size. Identification of precipitation type in winter storms. Identification of electrically active storms. Identification of aircraft icing conditions.
Page 62
New to RPG build 10 – NEXRAD Turbulence Detection Algorithm (NTDA). But, it’s essentially invisible to AWIPS users for now. There are also two products generated by theNEXRAD Turbulence Detection Algorithm (NTDA). This is an FAA sponsored
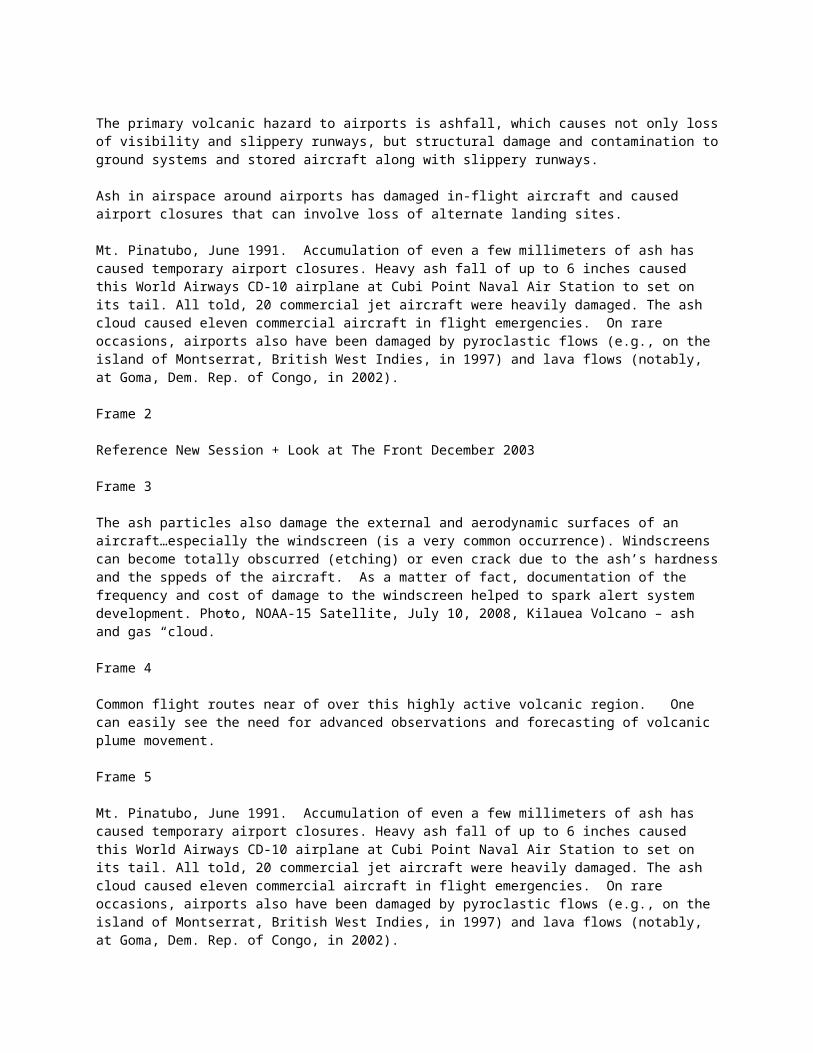
algorithm and AWIPS display of NTDA products is not currently scheduled for any upcoming build. The only indication of the NTDA products for NWS users would be their presence on the Product Generation List. Maybe in Next Gen AWIPS. However, the products are: 1. NTDA EDR Final Product (above): EDR, (EDR is Eddy Dispersion Rate) and 2. NTDA CONF Final Product: EDC, # 157 (EDC is Eddy Dispersion Confidence).
The NTDA does not measure clear-air turbulence, such as that caused by the jet stream or by wind flowing over mountainous terrain. But about two out of every three turbulence encounters are associated with clouds and storms, the focus of NTDA detection.Turbulence has major impacts on aviation. According to a review of National Traffic Safety Board data from 1992 to 2001 by the National Aviation Safety Data Analysis Center, turbulence was a factor in at least 509 accidents in the United States, including 251 deaths (mostly in the general aviation sector). Additionally, the FAA Joint Safety Analysis Team estimated that there are more than 1,000 minor turbulence-related injuries on commercial aircraft annually. Airlines lose millions of dollars every year due to turbulence because of injury claims, delays, extra fuel costs, and aircraft damage.
The NTDA captures turbulence in storms by peering into clouds to analyze the distribution of winds. It reprocesses radar data to remove factors that can contaminate measurements, such as sunlight, nearby storms, or even swarms of insects flying near the radar dish. It also averages a series of measurements to improve the reliability of its turbulence estimates.
A new Doppler radar turbulence detection algorithm, the NTDA, utilizes the radar reflectivity, radial velocity, and spectrum width data to perform quality control and produce eddy dissipation rate (EDR) estimates. It is anticipated that the NTDA will eventually be implemented on all NEXRAD radars so that the EDRs it produces will be readily available to all potential users for operational or scientific purposes.A web-based product is foreseen that will provide a nationwide, gridded turbulence diagnosis display for specified flight levels, thereby supplementing the upper-level turbulence forecasts currently supplied by the Graphical Turbulence Guidance product on the National Weather Service Aviation Weather Center’s Aviation Digital Data Service (ADDS). Eventually, the NTDA output will be combined with satellite, in situ, and numerical weather prediction model data to identify and forecast regions of hazardous turbulence.
From: Advanced Weather Radar Techniques - Lead: Kim Elmore – NSSL/CIMMS, Greg Meymaris – NCAR/RAL, David Smalley – MIT/LL, John K. Williams*, Larry Cornman, Danika Gilbert, Steven G. Carson, and Jaimi Yee National Center for Atmospheric Research, Boulder, Colorado.
Page 63
Space Weather and Aviation: Solar events can have a detrimental impact on airlines and ground equipment. Space weather storms can result in lost or degraded communications, unreliable navigational equipment, flight-critical electronic system problems, and radiation hazards to crew and passengers.
http://www.swpc.noaa.gov/index.htmlhttp://www.swpc.noaa.gov/aviation/aviation_user_guide.htmlhttp://www.swpc.noaa.gov/aviation/index.htmlhttp://www.swpc.noaa.gov/aviation/aviation_PDD.pdf
Page 64
The GOES-R series of satellites will be comprised of improved spacecraft and instrument technologies, which will result in more timely and accurate weather forecasts, and improve support for the detection and observations of meteorological phenomena that directly affect public safety, protection of property, and ultimately, economic health and development.
The aviation industry stands to benefit greatly from better weather information that would increaseaccuracy in forecasting. This study divides aviation benefits into four parts:1 Avoidable weather-related delays2 Passenger time value from avoidable weather-related delays3 Avoidable repair costs from not flying into volcanic ash plumes4 Avoided loss of life and aircraft from not flying into volcanic ash plumes
Page 65
Mammatus clouds result from the sinking of moist air into relatively dry air. June 2, 1973 – Tulsa. Associated most often with severe thunderstorms and can be a sign of severe to extreme turbulence.
Page 66
The End
Links from Aviation Hazards Session: NASA: http://oea.larc.nasa.gov/trailblazer/SP-4216/ - Taming the Microburst Windshear
Aviation Weather Center: http://aviationweather.noaa.gov/
Aviation Digital Data Service (ADDS): http://adds.aviationweather.gov/
Center Weather Service Unit (Products): http://aviationweather.gov/products/cwsu/
National Transportation Safety Board (NTSB)- Aviation: http://www.ntsb.gov/aviation/aviation.htm
National Weather Service Rapid City, SD: http://www.crh.noaa.gov/unr/
AWC ADDS Turbulence Products: http://adds.aviationweather.gov/turbulence/
Graphical Turbulence Guidance (GTG): http://adds.aviationweather.gov/turbulence/turb_nav.php
AIRMETs/SIGMETs: http://adds.aviationweather.gov/airmets/
PIREPs: http://adds.aviationweather.gov/pireps/ and http://adds.aviationweather.gov/pireps/java/
Turbulence Intensity: http://www.star.nesdis.noaa.gov/smcd/opdb/aviation/turb/tifcsts.html
Elrod Index: http://aviationweather.gov/exp/ellrod/ruc/
Aircraft Owners and Pilots Association (AOPA) – Air Safety Foundation: http://www.aopa.org/
AWC Inflight Icing Information: http://aircrafticing.grc.nasa.gov/resources/related.html
Seattle CWSU Icing Presentation: http://www.wrh.noaa.gov/zse/PacNW_Icing_files/frame.htm
AWC ADDS Icing Products: http://adds.aviationweather.gov/icing/
Experimental GOES Aircraft Icing Imagery: http://www.star.nesdis.noaa.gov/smcd/opdb/aviation/loops/icg/icgconus_loopw.html
GOES Low Cloud Base Product: http://www.star.nesdis.noaa.gov/smcd/opdb/aviation/CONUSlcb.html
GOES Fog Product: http://www.star.nesdis.noaa.gov/smcd/opdb/aviation/CONUSfog.html
GOES Fog Depth Estimate Product: http://www.star.nesdis.noaa.gov/smcd/opdb/aviation/fog/ltstfog/LTSTFGDPNW.GIF
Nighttime Fog and Low Cloud Images, from GOES and NOAA Polar Satellites: http://www.star.nesdis.noaa.gov/smcd/opdb/aviation/fog.html#current
Satellite Climatology Applications: http://rammb.cira.colostate.edu/research/satellite_climatologies/
Aviation Station Climatologies: http://www.srh.noaa.gov/abq/avclimate/
Alaskan Volcano Observatory: http://www.avo.alaska.edu/
Cascades Volcano Observatory: http://vulcan.wr.usgs.gov/home.html
Alaska Volcanic Ash Advisory Center: http://vaac.arh.noaa.gov/
United States Avian Hazard Advisory System: http://www.usahas.com/
The Aviation Test Bed: http://aviationweather.noaa.gov/testbed/ or http://aviationweather.gov/testbed/
Experimental Flight Path Tool: http://weather.aero/jade/
National Ceiling and Visibility Analysis (NCVA) product: http://weather.aero/metars/
Graphical-AIRMET Product: http://aviationweather.gov/products/gairmet/ or http://aviationweather.gov/products/gairmet/info.php
(Experimental) NCEP SREF Aviation Products: http://wwwt.emc.ncep.noaa.gov/mmb/SREF_avia/FCST/AVN/web_site/visb/cnv_com_09z_prb1.htm
(Experimental) – CWSU/NWS “Mobile Aviation Product”: http://www.wrh.noaa.gov/zoa/MOBILE/ZOA2.htm
(Experimental) The AWC’s Product Overlay Display: http://aviationweather.gov/exp/product_overlay/ or http://aviationweather.gov/exp/product_overlay/prod-olay-2img.html
(Experimental) Ellrod Index: http://aviationweather.gov/exp/ellrod/nam/ or http://aviationweather.gov/exp/ellrod/info.php?mdl=NAM or http://aviationweather.gov/exp/ellrod/ruc/
(Experimental) AWC/International Civil Aviation Organization (ICAO) Global Grids Display: http://aviationweather.gov/testbed/globalgrids/
Space Weather Links: http://www.swpc.noaa.gov/index.html or http://www.swpc.noaa.gov/aviation/aviation_user_guide.html or http://www.swpc.noaa.gov/aviation/index.html or http://www.swpc.noaa.gov/aviation/aviation_PDD.pdf
National Severe Storms Laboratory, Dual Polar Radar: http://www.cimms.ou.edu/~schuur/dualpol/
GOES R Cost Benefit Analysis: http://www.centrec.com/resources/reports/GOES%20Economic%20Value%20Report.pdf
Training Aid/Sites:Cooperative Institute for Research in the Atmosphere (CIRA): http://www.cira.colostate.edu/
Virtual Institute for Satellite Integrated Training (VISIT) Training Sessions: http://rammb.cira.colostate.edu/visit/ts.html
VISIT Contact: [email protected]
VISIT Blog: http://rammb.cira.colostate.edu/visit/blog/
Cooperative Institute for Meteorological Satellite Studies (CIMSS): http://cimss.ssec.wisc.edu/
CIMSS Blog: http://cimss.ssec.wisc.edu/goes/blog/
MetEd (COMET) – Aviation Including DLAC: http://www.meted.ucar.edu/topics_aviation.php
Pilot’s Guide to In-flight Icing: http://aircrafticing.grc.nasa.gov/courses.html
Microscale meteorology and atmospheric hazards: http://www.auf.asn.au/groundschool/umodule21.html
Satellite Based Nowcasting and Aviation Application Program: http://cimss.ssec.wisc.edu/snaap/
Aviation Simulation Weather Tutorial: http://www.avsim.com/avwx/avsim_wxus_icing.html
Aeronautical Meteorology Programme: http://www.wmo.ch/pages/prog/amp/aemp/index_en.html
NAV Canada (Check out the GREAT publications on forecasting!): http://www.navcanada.ca/NavCanada.asp?Language=en&Content=ContentDefinitionFiles\Publications\LAK\default.xml
Quantico METOC Division: https://www.metocwx.quantico.usmc.mil/weather_for_aviators/pilot_trng.htm
More E-Links to Great Aviation/Weather Sites: AWC – The Front:
Alaska Aviation Weather Unit Volcanic Ash Advisory Center:
To all VAACs:
International Civil Aviation Organization:
EAA - The Leader in Recreational Aviation - Oshkosh, Wisconsin
Colorado Aviation Historical Society
Welcome to Colorado Pilots Association CDOT - Aeronautics Division - Main Flightprep.com
NOAA Marine and Aviation Operations
ASAP - Advanced Satellite Aviation Weather Products
28 December 1997 -- Severe Turbulence Over the West Pacific
NCAR Teams with United Airlines to Pinpoint Turbulence in Clouds; Research Can Help Reduce Delays, Injuries, Costs - News Release
RAL Annual Report: 2007 NTDA
Atmospheric Turbulence detection
Lightning and aviation
What happens when lightning strikes an airplane?: Scientific American
CAeM Pilot Project on Aviation-weather Disaster Risk Reduction
FAA Advisory Circulars
February 1, 2008 Low Level Wind Shear Event
NOAA Magazine Online (Story 86)
Ceiling and Visibility Articles
NWS Dodge City, KS Dust Storm
Satellite Fog and Low Cloud Images (NOAA/NESDIS)
Cloud Products - Office of Satellite Data Processing and Distribution
International Satellite Cloud Climatology Project
AvnWx.com Aviation Weather -- About Forecast Winds and Temps Aloft
AVSIM Aviation Simulation Weather: Jet Stream
Lightning NASA: Concept to Reality
Thunderstorm Hazards
Volcanic Ash Hazards to Airliners
Safer air travel - Turbulence
Operational Forecasting of Gravity Waves
Accident statistics
AOPA Online: The weather accident picture
NASDAC Review of NTSB Weather-Related Accidents
NCAR RAL Aviation | Oceanic Convection Diagnosis and Nowcasting
AWC - Aviation Weather Community Forum
National Weather Service - Denver Center Weather Service Unit
Chicago Area Aviation Climatology
DOWNSLOPE WINDSTORM CASE STUDY - UTAH
11th Conference Aviation, Range and Aerospace
Operational Products Development Branch (NOAA/NESDIS)
U.S. Air Quality Aviation Issues
NTSB - Flight 1549 Remarks by Robert L. Sumwalt
Four Winds Saving the CWSU
National Weather Association – Aviation Weather Committee
Avionics Magazine – Avoiding Trouble Ahead (Use of the NTDA)
MODIS Rapid Response System


![[GPM 058] - UH-60 Blackhawk](https://img.pdfslide.us/doc/110x75/5472ddbfb4af9fab4c8b45a1/gpm-058-uh-60-blackhawk.jpg)