Embed Size (px)
Citation preview


RAMAN STUDIES ON MOLECULAR BEAMS
RELAXATION AND EXCITATION BY COj LASER

PROMOTOR PROF DR J REUSS
CO-REFERENT DR S STOLTE
RAMAN STUDIES ON MOLECULAR BEAMS RELAXATION AND EXCITATION BY C0 2 LASER
PROEFSCHRIFT
TER VERKRIJGING VAN DE GRAAD VAN DOCTOR IN DE WISKUNDE EN NATUURWETENSCHAPPEN
AAN DE KATHOLIEKE UNIVERSITEIT TE NIJMEGEN OP GEZAG VAN DE RECTOR MAGNIFICUS
PROF DR J H G I GIESBERS VOLGENS BESLUIT VAN HET COLLEGE VAN DEKANEN
IN HET OPENBAAR TE VERDEDIGEN OP VRIJDAG 7 OKTOBER 1983
DES NAMIDDAGS TE 2 UUR PRECIES
door
GERARDUS MARINUS JOSEPHUS FRANCISCUS LUIJKS
geboren te Steenbergen
И krips repro meppel
1 9 8 3

Op deze plaats wil ik al degenen bedanken die mij, op welke wijze dan ook,
ondersteund hebben bij mijn onderzoek en het tot stand komen van dit proef
schrift, met name
de leden en oud-leden van de afdeling Atoom- en Molecuulfysica voor de vrucht
bare discussies en ondervonden collegialiteit;
Cor Sikkens en John Holtkamp voor hun onontbeerlijke en zeer vakkundige
technische en electromsche assistentie, alsmede Eugène van Leeuwen en Frans
van Rijn voor hun hulpvaardigheid;
Jan Timmerman en Walter Knippers voor hun bijdragen aan het onderzoek tijdens
hun afstudeerperiode en ook Koo Rijpkema voor het voorbereidende werk;
de dienstverlenende afdelingen van de faculteit onder leiding van de heren
P. Walraven (Instrumentmakerij), H. Verschoor (Service Instrumentmaker!j),
J. Holten (Glasinstrumentmakerij), W. Verdijk (Illustratie) en H. Spruyt
(Fotografie) .
Albert van Etteger voor het verzorgen van de assemblage en het operationeel
maken van de CO2 laser;
Leo Hendriks voor het vervaardigen van een aantal van de figuren; de fraaie
afbeelding op de pagina hiernaast is getekend door de heer W. Verdijk.
Johanna van Well-Jacobs, die met uitzonderlijke toewijding het manuscript
heeft uitgetypt;
en uiteraard Ankie voor het onvermijdelijke correctiewerk.

aan mijn oadzu
Contents
CHAPTER 1 INTRODUCTION
1.1. Background and goal
1.2. Raman scattering and molecular beams
1.3. The present investigation
1
2
11
CHAPTER 2 : MOLECULAR BEAM DIAGNOSTICS BY RAMAN SCATTERING
published in Chem. Phys. 62(1981) 217 13
2.1. Introduction
2.2. Experimental set-up
2.3. The CO2 measurements
2.4. The N2 measurements
2.5. The СНц measurements
2.6. The SFg measurements
2.7. Discussion
13
14
16
18
21
24
25
CHAPTER 3 : MOLECULAR BEAMS OF СРзВг PROBED BY SPONTANEOUS RAMAN
EFFECT AND EXCITED WITH A CO2 LASER
published in Chem. Phys. Lett. 94(1983) 48 33
3.1.
3.2.
3.3.
3.4.
Introduction
State populations of СРэВг in a supersonic expansion
Vibrational excitation with a CO2 laser
Conclusions
33
35
33
41
CHAPTER 4 : RAMAN ANALYSIS OF SF6 MOLECULAR BEAMS EXCITED BY A
CW CO2 LASER
published m Chem. Phys. 77(1983) 169 43
4.1. Introduction
4.2. The intracavity experimental arrangement
4.3. , The SF¿ measurements
4.4. Results and discussion
4.4.1. Temperatures and densities m the SF̂ beams 4.4.2. The type I measurements
43
45
46
55
55 56
Contents
4.4.3. Ihe type II measurements 61
4.5. Summary 68
4.6. Concluding remarks 69
CHAPTER Ь : CONCLUSIONS 7J
5.1. Summary 73
5.2. Outlook 76
Samenvatting 78
Curriculum Vltae 80

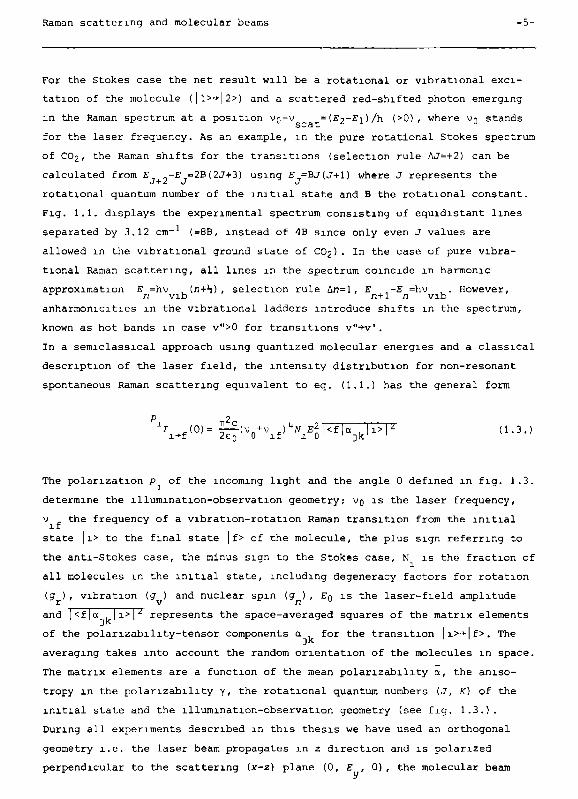
Background and goal -1-
CHAPTER 1 : INTRODUCTION
1.1. Background and goal
Supersonic molecular beams have developed into an experimental medium of great
interest. The special properties of a beam such as a sharply peaked velocity
distribution along the axis, low temperatures due to expansion cooling and
nearly collision-free conditions offer a large variety of applications, e.g.
crossed beam inelastic scattering experiments. These beam properties depend
strongly on the choice of source parameters like stagnation pressure (Pg) and
temperature (Tg) and seeding concentrations. Velocity selection, state selec
tion, orientation fields etc. supply additional means to obtain a well defined
molecular beam. However, for precise quantitative measurements in a beam the
knowledge of state populations before and after an interaction under investi
gation is often required. Therefore, the first part of this thesis describes
our effort to build a sensitive, universal apparatus for local state probing
in a beam (Δχ=50μπι, χ is the coordinate along the beam axis) . Spontaneous
Raman scattering has proved to meet our conditions, especially if an intraca-
vity focused Ar laser is used as a light source.
The dramatic evolution of laser technology in the past decades has largely
widened the scope of chemistry today, e.g. via laser-induced chemical
processes. As an illustration of this laser-triggering technique, we have
applied the IF radiation from a cw CO2 laser to excite СРзВг molecules via the
vj ladder (vi=1084.6 cm ) U ) . Due to energy-redistributing collisions the gas
is heated to a temperature, sufficient to initiate the process of pyrolysis of
СГэВг into CF3 and Br radicals. Recombination of Br atoms into Br2 molecules
in an electronically excited state results in a visible luminescence propor
tional to the reaction rate.
Alternatively, taking advantage of the monochromatic coherent radiation pro
duced by a laser, chemical reaction cross sections can be probed as a function
of excitation of particular states pumped by the laser. This offers opportuni
ties for the application of mode-selective chemistry which is very interesting,
not only from a purely scientific point of view but also with respect to huge
energy savings if applied at large scale. For example, if a chemical process
(1) G. Luijks, W. Knippers, G. Petrocelli, S. Stolte and J. Reuss, to be
published in Chem. Phys. Lett. (1983).
-2- Chapter 1
is triggered purely by the V3 vibrational mode of SFg, say at T=500 К, a
factor of ten in energy is calculated to be saved if a CO2 laser is used to
pump this V3 mode (948 cm" ) instead of applying the conventional method of
heating the molecules thermally in a bath. An additional advantage of laser
excitation is the possibility to modulate the internal energy of the molecules
at a fast rate by pulses or on-off modulation of the laser, whereas the ther
mal bath technique allows merely slow temperature variations.
Spectroscopic isotope separation is another promising application of selec
tive laser pumping of molecules, preferentially exciting one isotope species
into a state which leads to a chemical reaction acting as a scavenger for the
actual separation of the isotopes. On this subject, multiphoton dissociation
of molecules by intense IÄ-laser pulses has proven to be a useful isotopically-
-selective technique as first demonstrated by Letokhov(2) for the BCI3
molecule.
Generally speaking, for processes based upon selectivity of statet, collisions
are undesired as they deactivate and randomly redistribute the internal energy
of molecules and consequently obscure the state selectivity. In those cases
molecular beams may offer the suitable environment for the desired production
of single mode excited molecules since collisions are nearly absent. Our
sensitive state probing Raman apparatus enables us to follow excitation rates
of particular states in the beam after C02-laser irradiation. The second part
of this thesis describes how the terminal internal energy content of the beam
molecules can be controlled by a proper choice of conditions; single mode - as
well as multimode excited beams can be produced by the IR radiation from the
cw CO2 laser.
1.2. Raman scattering and molecular beams
Theoretically it may seem a hopeless task to 301η the low densities prevailing
in a molecular beam and the extremely low cross sections for Raman scattering
(10~12 Ä , typically) into a valid technique for probing state populations.
Nevertheless, the experimentalist is quickly tempted by the universal appli
cability of Raman scattering and the usually simple interpretation of the
spectra as demonstrated by fig. 1.1. , where each peak corresponds to one
(2) R.V. Ambartsumyan, V.S. Letokhov, E.A. Ryabov and N.V. Chekalin, JETP Lett. 20(1974) 273.
Raman scattering and molecular beams -3-
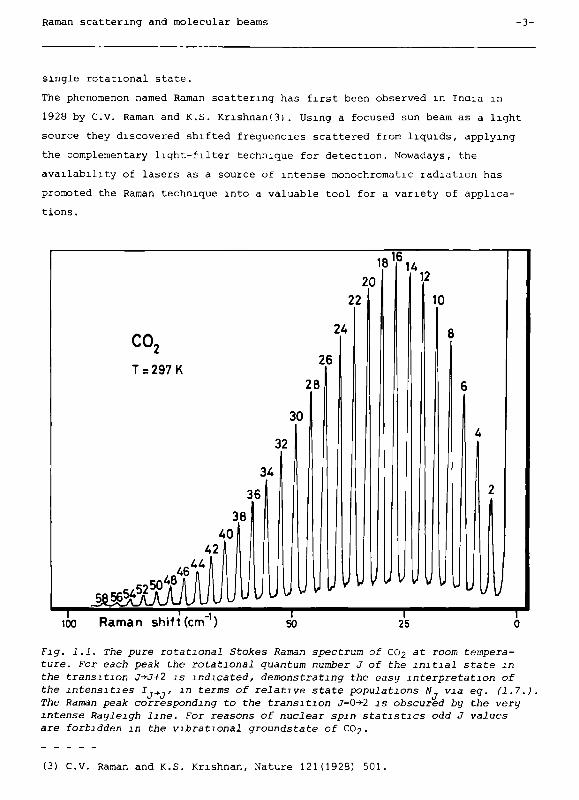
single rotational state.
The phenomenon named Raman scattering has first been observed in Inaia in
1928 by C.V. Raman and K.S. KnshnanO) . Using a focused sun beam as a light
source they discovered shifted frequencies scattered from liquids, applying
the complementary light-filter technique for detection. Nowadays, the
availability of lasers as a source of intense monochromatic radiation has
promoted the Raman technique into a valuable tool for a variety of applica
tions.
1
20
22
co2 26
Τ = 297 К 28
30
32
ЗА
v\ з
ΑΡΪ 42
.^^шШШШ^
9 Η 12
10
8
6
4
2 i
¿νν\juu ι I Y \J\J
I Г^ L -Mil ~\ ' ' Г
100 R a m a n shift (cm ) so 25 о
Fig. 1.1. The pure rotational Stokes Raman spectrum of CO2 at room temperature. For each peak the rotational quantum number J of the initial state m the transition J-h7+2 is indicated, demonstrating the easy interpretation of the intensities Ij+ji l n terms of relative state populations N via eg. (1.7.) . The Raman peak corresponding to the transition J=0->-2 is obscured by the very intense Rayleigh line. For reasons of nuclear spin statistics odd J values are forbidden m the vibrational groundstate of CO2.
(3) C.V. Raman and K.S. Krishnan, Nature 121(1928) 501.
-4- Chapter 1
The quantum-mechanical description of the Raman effect based on the polanza-
bility theory has been worked out in 1934 by Placzek and Teller(4,5). A
survey, containing both a classical and a quantum-mechanical treatment is
presented e.g. by Long(6).
In a classical picture the Raman scattering mechanism can be understood con
sidering the molecular polarizability α which has tensor properties. The
incident laser induces oscillating dipoles (P=aE) radiating power at the
frequency Vg of the laser field, known as elastic or Rayleigh scattering.
However, rotation (v ) and vibration (v , ) of the molecules can generate a rot vib
periodic change of polarizability and consequently give rise to frequency
mixing. As a result sidebands at v=vn±v and v=Vn±v , will occur, referred u rot
u vib
to as inelastic or Raman scattering. If the rotation of a molecule does not
affect its space-fixed polarizability, e.g. in the case of spherical top mole
cules, no rotational Raman effect is observed. Similarly, a specific vibration
is called Raman active if the vibrational displacements of the nuclei intro
duce a polarizability change (usually stretching vibrations) or Raman inactive
if they don't (mostly bending vibrations). The power radiated by an oscilla
ting dipole with strength Ρ is given by (see (6), p. 35)
2ε0
where 0 is the angle relative to the dipole orientation axis.
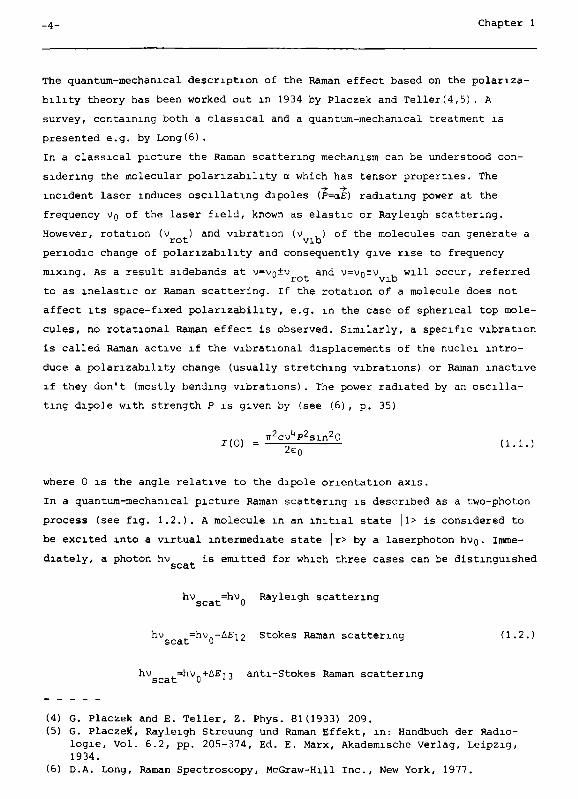
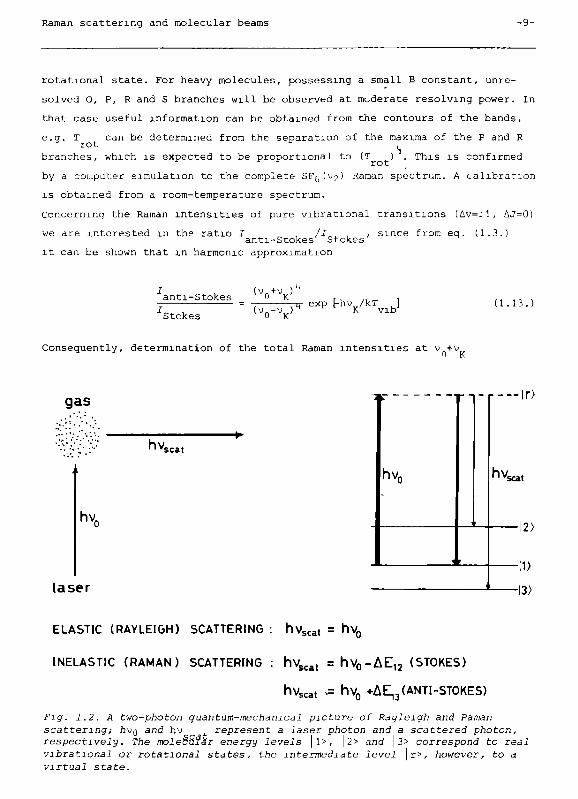
In a quantum-mechanical picture Raman scattering is described as a two-photon
process (see fig. 1.2.) . A molecule in an initial state | 1> is considered to
be excited into a virtual intermediate state |r> by a laserphoton hvg. imme
diately, a photon hv is emitted for which three cases can be distinguished
hv scat
=hv Rayleigh scattering
hv =Ην.-ΔΒΐ2 Stokes Raman scattering (1.2.)
scat 0 i/L *
hv =hv +ΔΕ13 anti-Stokes Raman scattering
(4) G. Placzek and E. Teller, Z. Phys. 81(1933) 209.
(5) G. Placzek, Rayleigh Streuung und Raman Effekt, in: Handbuch der Radio
logie, Vol. 6.2, pp. 205-374, Ed. E. Marx, Akademische Verlag, Leipzig,
1934. (6) D.A. Long, Raman Spectroscopy, McGraw-Hill Inc., New York, 1977.
Raman scattering and molecular beams -5-
For the Stokes case the net result will be a rotational or vibrational exci
tation of the molecule (|l>-*,|2>) and a scattered red-shifted photon emerging
in the Raman spectrum at a position VQ-V =(£2"^l)/h (>0), where vg stands
for the laser frequency. As an example, in the pure rotational Stokes spectrum
of CO2/ the Raman shifts for the transitions (selection rule ñJ=+2) can be
calculated from E -E =2B(2J+3) using E =BJ(J+1} where J represents the
rotational quantum number of the initial state and В the rotational constant.
Fig. 1.1. displays the experimental spectrum consisting of equidistant lines
separated by 3.12 cm (=86, instead of 4B since only even J values are
allowed in the vibrational ground state of CO2). In the case of pure vibra
tional Raman scattering, all lines in the spectrum coincide in harmonic
approximation E =hv , (л+Ь), selection rule Δη=1, E ,-E =hv , . However, η vib n+1 л vib
anharmomcities in the vibrational ladders introduce shifts in the spectrum,
known as hot bands in case v">0 for transitions v"->-v' .
In a semiclassical approach using quantized molecular energies and a classical
description of the laser field, the intensity distribution for non-resonant
spontaneous Raman scattering equivalent to eq. (1.1.) has the general form
\̂ f(0)= f^'V^V^lv11*1' ( 1 · 3 · '
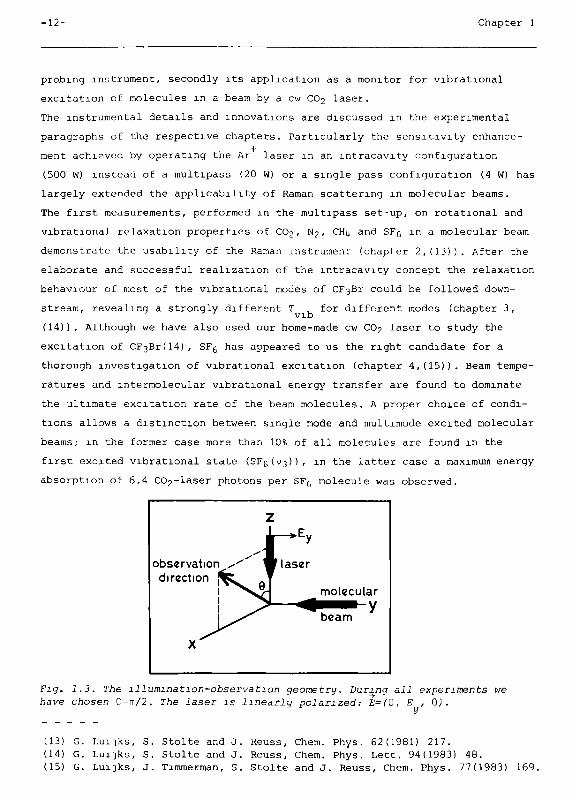
The polarization ρ of the incoming light and the angle 0 defined in fig. 1.3.
determine the illumination-observation geometry; Vg is the laser frequency,
ν the frequency of a vibration-rotation Raman transition from the initial
state Ii> to the final state |f> of the molecule, the plus sign referring to
the anti-Stokes case, the minus sign to the Stokes case, N is the fraction of
all molecules in the initial state, including degeneracy factors for rotation
(g ), vibration (g ) and nuclear spin (g ), EQ IS the laser-field amplitude
and ]<f|α Ii>|¿ represents the space-averaged squares of the matrix elements Jk
of the polarizability-tensor components α for the transition |i>->|f>. The
averaging takes into account the random orientation of the molecules in space.
The matrix elements are a function of the mean polanzability a, the aniso-
tropy in the polanzability γ, the rotational quantum numbers (J, if) of the
initial state and the illumination-observation geometry (see fig. 1.3.) .
During all experiments described in this thesis we have used an orthogonal
geometry i.e. the laser beam propagates in 2 direction and is polarized
perpendicular to the scattering (x-z) plane (0, Ε , 0), the molecular beam
-6- Chapter 1
expands in y direction and the spectrometer detects the light scattered in
χ direction (0=ττ/2) . The intensity symbol is then written as Ι (π/2). The
quantities α and γ can be defined in a body-fixed frame as
a = \(.a +a +a ) (1.4.)
3 xx yy zz
γ2 = 1[
( a _
a ) 2
+ ( a _
a )2
+ ( a _
a ¡2] (1.5.)
2 xx yy yy zz zz xx
These particular combinations of polarizability-tensor components appear to be
invariant under rotation of the coordinate system and therefore can be treated
as molecular constants. In order to describe the variation of the polanzabi-
lity as a consequence of molecular vibrations, the components ot of the
polarizability tensor can be expanded as
α , = (а ) +Σ ]к ]к 0 £
Эк _эо
г_
Q + (1.6. О i
where (а )0 represents the equilibrium polarizability and
За I -^І -(а ,')„ the
?QÍ Jo" Зк'Я so-called derived polarizability describing the dependence of α upon a
vibration ν via the derivative with respect to the normal coordinate Q in
the equilibrium position of the vibration as indicated by the subscript "Q"·
For both tensors [a , ) and (a ,') „ the invariants under rotation are ]k 0 ]k I
la) , (γ) ̂ and la')., ly')^., respectively. In the orthogonal geometry ι U U χ, Ц
( Ι (π/2)) general expressions for |<f|α |i>|¿ are given in table 1.1. (see
also ref. (7), central reference section, table L), illustrating which of the
isotropic [ (oOÍ:, (a')?! or anisotropic [ (γ) 2, (γ')?] tensor invariants contri
bute to Rayleigh scattering and which to pure rotational, pure vibrational and
vibration-rotation Raman scattering.
For the analysis of our data we are interested in some special cases. For pure
rotational Raman transitions in diatomic and linear molecules (N2, CO2) only
(γ)2 contributes (Δν=0, ДЯ^О in table 1.1.) .
From eq. (1.5.) we find (γ) = (α.,-α, ) by substituting а =а.. and α =α =aI ,
0 // I J xx // yy zz L
where a .. and a. is the component of a parallel and perpendicular to the
(7) D.A. Long, Raman Spectroscopy, McGraw-Hill Inc., New York, 1977.
Raman scattering and molecular beams -7-
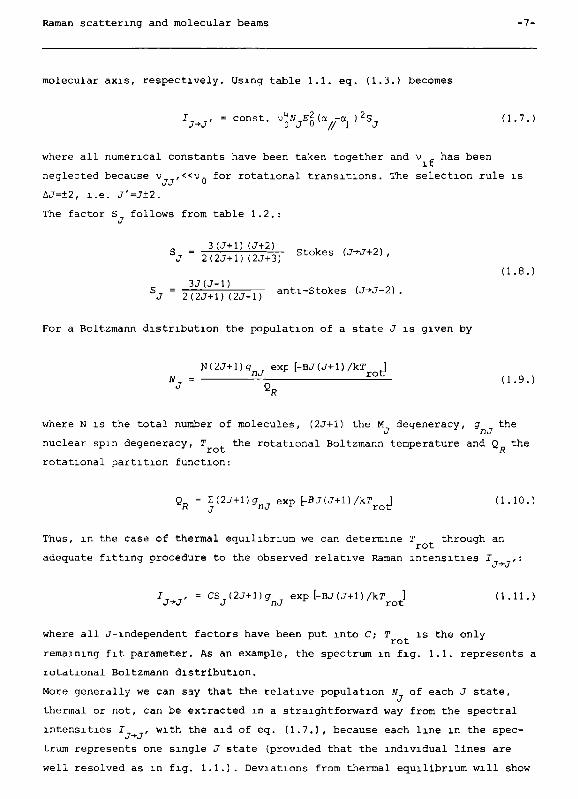
molecular axis, respectively. Using table 1.1. eq. (1.3.) becomes
IJ+J' = const. ̂ V ^ a ^ l ^ S j (1.7.)
where all numerical constants have been taken together and ν has been
neglected because ν ,<<vn for rotational transitions. The selection rule is
AJ=±2, i.e. J'=J±2.
The factor S follows from table 1.2.:
J
(1.8.
SJ • 2"j>I)"
l2J-l> « " W - S « * ™
U»
J-
2 1 ·
For a Boltzmann distribution the population of a state J is given by
N(2J+l)g exp [-BJ(J+l)/kT J
»j- V - — ( 1 · 9 · )
where N is the total number of molecules, (2J+1) the M degeneracy, g the
J nJ nuclear spin degeneracy, Τ the rotational Boltzmann temperature and Q the rotational partition function:
Q = E(2J+l)g exp [-BJ(J+1)/кГ J (1.10.) « j ^J ^ roc
Thus, in the case of thermal equilibrium we can determine Τ through an
rot
adequate fitting procedure to the observed relative Raman intensities J ,:
JT ,, = CS (2J+l)g exp [-BJ(J+l)/kT ] (1.11.)
J->-J J nJ rot
where all J-independent factors have been put into C-, Τ is the only
rot
remaining fit parameter. As an example, the spectrum m fig. 1.1. represents a
rotational Boltzmann distribution.
More generally we can say that the relative population w of each J state,
thermal or not, can be extracted in a straightforward way from the spectral
intensities I , with the aid of eq. (1.7.) , because each line in the spec
trum represents one single J state (provided that the individual lines are
well resolved as in fig. 1.1.) . Deviations from thermal equilibrium will show
-8- Chapter 1
up in an obvious way by comparing the measured intensity distribution to the
best fitting calculated Boltzmann distribution.
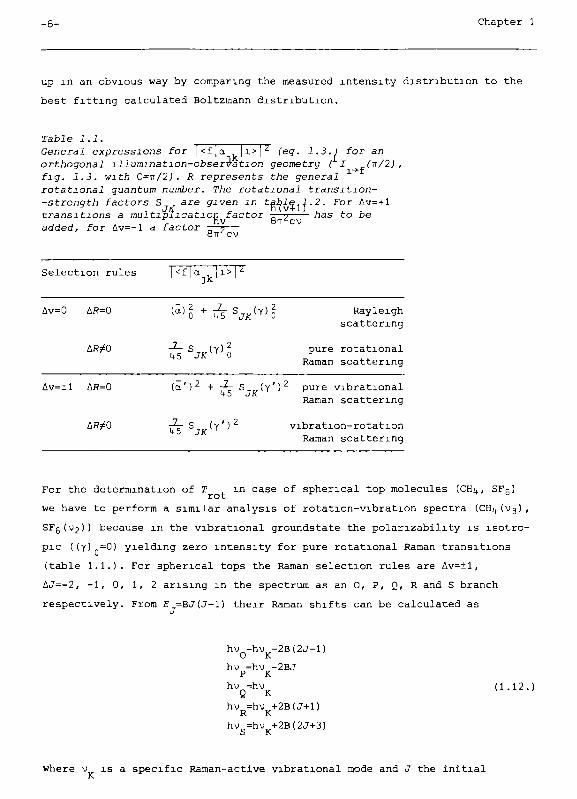
Table 1.1.
General expressions for |<f|a ]i>[ (eg. 1.3. i for an orthogonal illumination-observation geometry ( Ι (τι/2) , fig. 1.3. with 0=^/2). R represents the general rotational guantum number. The rotational transition--strength factors S are given m table.1.2. For Δν=+1 transitions a multiplication factor -τ—ρ has to be jj j * » ι * *. hv θπ^ον added, for Δν=-1 a factor -τ—η
Selection rules <f α , 1 jk
Δν=0 ДД=0 (α) 2 + jL- S (γ) g Rayleigh
scattering
ΔΑ^Ο -2- S (γ) J; pure rotational 4 5 JA О
Raman scattering
Δν=±1 Δίΐ=0 (α')2 + -^г S (γ')
2 pure vibrational
Raman scattering
ЛД^О ïï^"S7^'Y''2 vibration-rotation Raman scattering
For the determination of Τ ^ in case of spherical top molecules (CHj. , SFc!
rot D
we have to perform a similar analysis of rotation-vibration spectra (CH^iv^),
SFg(V2)) because in the vibrational groundstate the polarizability is isotro
pic ((γ)n=0) yielding zero intensity for pure rotational Raman transitions
(table 1.1.) . For spherical tops the Raman selection rules are Δν=±1,
AJ=-2, -1, 0, 1, 2 arising in the spectrum as an O, P, Q, R and S branch
respectively. From E =BJ(J+1) their Raman shifts can be calculated as
hv =hv -2B(2J-1)
hv =hv -2BJ Ρ К
hv =hv (1.12.) У К-
hv =hv +2B(J+1) R К
hv =hv +2B(2J+3)
where ν is a specific Raman-active vibrational mode and J the initial
Raman scattering and molecular beams -9-
rotational state. For heavy molecules, possessing a small В constant, unre
solved O, P, R and S branches will be observed at moderate resolving power. In
that case useful information can be obtained from the contours of the bands,
e.g. τ can be determined from the separation of the maxima of the Ρ and R y rot
r ,
branches, which is expected to be proportional to (T ) . This is confirmed
by a computer simulation to the complete SF&(V2) Raman spectrum. A calibration
is obtained from a room-temperature spectrum.
Concerning the Raman intensities of pure vibrational transitions (Δν=+1, AJ=0)
we are interested in the ratio I /I . , since from eq. (1.3.)
anti-Stokes Stokes
it can be shown that in harmonic approximation
anti-Stokes
Stokes
(W
-Ц- exp [-hv /кг J Ι υ0~
νκ v
(1.13.)
Consequently, determination of the total Raman intensities at ν +v 'J К
gas
hv s c a t
hv„
l a s e r
hv«
•ID
hv, scat
-12)
-ID
-13)
ELASTIC (RAYLEIGH) SCATTERING : hv s c at = hv,
INELASTIC (RAMAN) SCATTERING : hv s c a t = h v 0 - A E 1 2 (STOKES)
hvs c a t - hv0 •Д^з (ANTI-STOKES)
Fig. 1.2. A two-photon quantum-mechanical picture of Rayleigh and Paman scattering; hvp and hv represent a laser photon and a scattered photon, respectively. The mole§5îar energy levels |l>, |2> and |3> correspond to real vibrational or rotational states, the intermediate level \r>, however, to a virtual state.
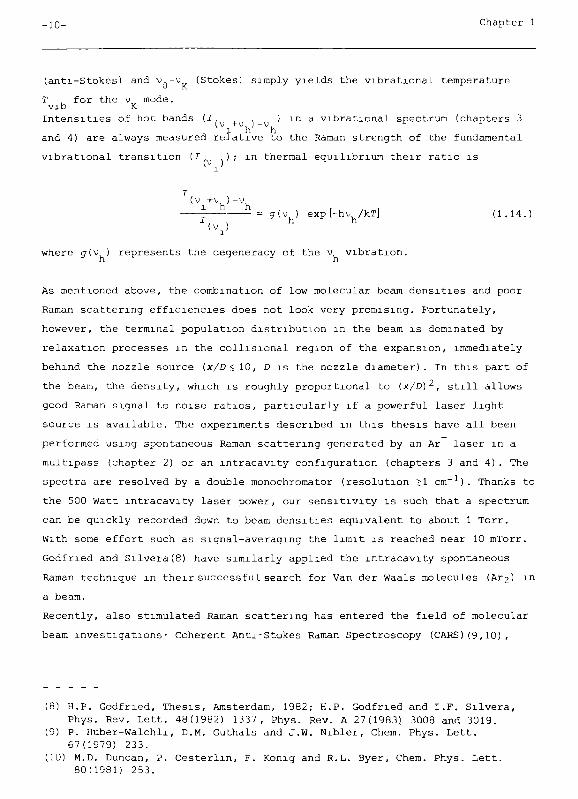
-10- Chapter 1
(anti-Stokes) and ν -v (Stokes) simply yields the vibrational temperature
Τ for the ν mode.
vib К
Intensities of hot bands (-Г/ , , ) in a vibrational spectrum (chapters 3 1 h h
and 4) are always measured relative to the Raman strength of the fundamental
vibrational transition (J. , ) ; in thermal equilibrium their ratio is
(v + v
h ) - v
h
; = g ( v j e x p [ - h v u / k T ] ( 1 . 1 4 . ) I h h
(
where g(v ) represents the degeneracy of the ν vibration.
As mentioned above, the combination of low molecular beam densities and poor
Raman scattering efficiencies does not look very promising. Fortunately,
however, the terminal population distribution in the beam is dominated by
relaxation processes in the collisional region of the expansion, immediately
behind the nozzle source (x/D< 10, D is the nozzle diameter). In this part of
the beam, the density, which is roughly proportional to (x/D)2, still allows
good Raman signal to noise ratios, particularly if a powerful laser light
source is available. The experiments described in this thesis have all been
performed using spontaneous Raman scattering generated by an Ar laser in a
multipass (chapter 2) or an intracavity configuration (chapters 3 and 4 ) . The
spectra are resolved by a double monochromator (resolution >1 cm ). Thanks to
the 500 Watt intracavity laser power, our sensitivity is such that a spectrum
can be quickly recorded down to beam densities equivalent to about 1 Torr.
With some effort such as signal-averaging the limit is reached near 10 mTorr.
Godfried and Silvera(8) have similarly applied the intracavity spontaneous
Raman technique in their successful search for Van der Waals molecules (АГ2) m
a beam.
Recently, also stimulated Raman scattering has entered the field of molecular
beam investigations· Coherent Anti-Stokes Raman Spectroscopy (CARS) (9,10) ,
(8) H.P. Godfried, Thesis, Amsterdam, 1982; H.P. Godfried and I.F. Silvera,
Phys. Rev. Lett. 48(1982) 1337, Phys. Rev. A 27(1983) 3008 and 3019.
(9) P. Huber-Walchli, D.M. Guthals and J.W. Nibler, Chem. Phys. Lett.
67(1979) 233.
(10) M.D. Duncan, P. Oesterlin, F. König and R.L. Byer, Chem. Phys. Lett. 80(1981) 253.
The present investigation -11-
Inverse Raman Spectroscopy (1RS)(11) and Stimulated Raman Gain Spectroscopy
(SRGS)(12). The sensitivity of these methods appears to be roughly the same as
in our intracavity set-up whereas the spectral resolution is orders of
magnitude better, essentially limited by the linewidth of the lasers
(0.002 c m- 1) . As far as the spectral scanning range is concerned, it is
advantageous to employ spontaneous Raman scattering since the monochromator
covers the complete visible spectrum over thousands of wavenumbers whereas
stimulated Raman techniques are limited by the tuning range of the lasers,
typically in the order of a few wavenumbers for a continuous scan. Moreover,
the operation of one fixed-frequency laser in a spontaneous Raman set-up is
relatively simple compared to stimulated Raman experiments, where the simul
taneous use of two lasers (at least one tunable) requires special alignment
and stability conditions.
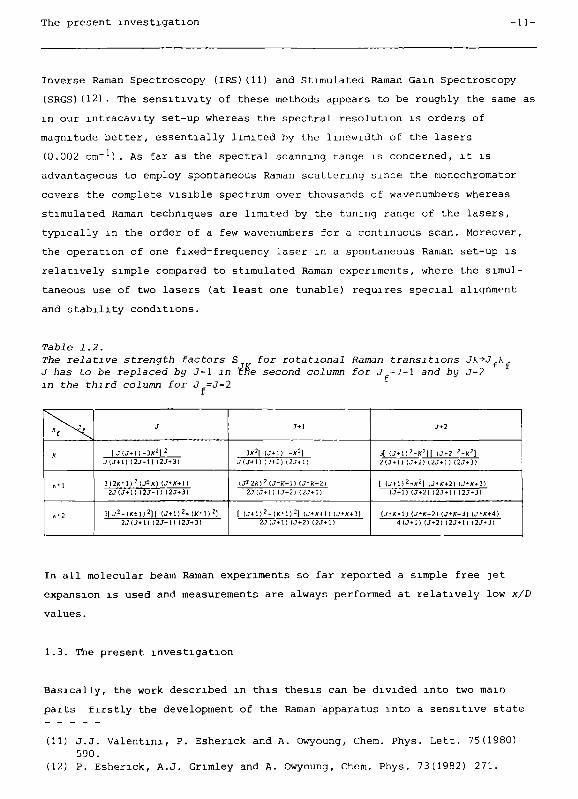
ГаЫе 1.2. The relative strength factors S for rotational Raman transitions Jk'+J к J has to be replaced by J-l m Ene second column for J =7-1 and by J-? m the third column for J =J-2
" f ^
К
»«1
* * 2
J
1 J1J-H)-3JÍ2] 2
J ( J t l ) ( 2 J - 1 ) l 2 J + 3 )
3 ( 2 K 4 ) 2 ( J T J C ) ( J - K + l ) 2 J ( J + 1 ) ( 2 J - 1 ) ( 2 J * 3 )
3[ J2-{K±\)2)i ( J + 1 ) 2 - ( J C 4 ) 2 ] 2 J ( J * 1 I ( 2 J - I ) ( 2 J + 3 )
J + l
3fr2| ( J + l l -K 2 ] J I J + l ) 17+2) (2J -H)
( J T 2 A ) 2 ( J + í f + l ) (J+K+2) 2 J ( J + 1 ) ( J + 2 ) ( 2 J + 1 )
[ [ J + l ) 2 - ( f r M ) 2] (J*K+1) (J*X+3) 2 J ( J + 1 ) ( J + 2 ) ( 2 J + 1 )
J+2
31 ( J + I ) 2 - K 2 1 [ ( J+2 2 - K 2 ] 2 ( J + I ) ( J + 2 ) ( 2 J + 1 ) ( 2 J + 3 )
I ( J + l ) 2 - * 2 ] lJ«>r + 2) (J»K+3) ( J + l ) ( J + 2 ) ( 2 J + 1 ) ( 2 J + 3 )
( J>*+1) (J*í í+2) (J>) t+J) lJ>)(+4) - l l J + l ) ( J+2) (2 J + 1) ( 2 J * 3 )
In all molecular beam Raman experiments so far reported a simple free ]et
expansion is used and measurements are always performed at relatively low x/D
values.
1.3. The present investigation
Basically, the work described in this thesis can be divided into two main
parts firstly the development of the Raman apparatus into a sensitive state
(11) J.J. Valentin!, P. Eshenck and A. Owyoung, Chem. Phys. Lett. 75(1980) 590.
(12) P. Eshenck, A.J. Gnmley and A. Owyoung, Chem. Phys. 73(1982) 271.
-12- Chapter 1
probing instrument, secondly its application as a monitor for vibrational
excitation of molecules in a beam by a cw CO2 laser.
The instrumental details and innovations are discussed in the experimental
paragraphs of the respective chapters. Particularly the sensitivity enhance
ment achieved by operating the Ar laser in an intracavity configuration
(500 W) instead of a multipass (20 W) or a single pass configuration (4 W) has
largely extended the applicability of Raman scattering in molecular beams.
The first measurements, performed in the multipass set-up, on rotational and
vibrational relaxation properties of CO2, N7, СНц and SF5 in a molecular beam
demonstrate the usability of the Raman instrument (chapter 2,(13)). After the
elaborate and successful realization of the intracavity concept the relaxation
behaviour of most of the vibrational modes of СГзВг could be followed down
stream, revealing a strongly different Г for different modes (chapter 3,
(14)). Although we have also used our home-made cw CO2 laser to study the
excitation of СГзВг(14), SF^ has appeared to us the right candidate for a
thorough investigation of vibrational excitation (chapter 4,(15)). Beam tempe
ratures and mtermolecular vibrational energy transfer are found to dominate
the ultimate excitation rate of the beam molecules. A proper choice of condi
tions allows a distinction between single mode and multimode excited molecular
beams; in the former case more than 10% of all molecules are found in the
first excited vibrational state (SF^iv^)), in the latter case a maximum energy
absorption of 6.4 С0?-1азег photons per SF
6 molecule was observed.
Fig. 1.3. The illumination-observation geometry. During all experiments we have chosen 0=π/2. The laser is linearly polarized: E= (0, Ε , 0).
(13) G. Luijks, S. Stolte and J. Reuss, Chem. Phys. 62(1981) 217.
(14) G. Luijks, S. Stolte and J. Reuss, Chem. Phys. Lett. 94(1983) 48.
(15) G. Lui]ks, J. Timmerman, Ξ. Stolte and J. Reuss, Chem. Phys. 77(1983) 169.
Introduction -13-
CHAPTER 2 : MOLECULAR BEAM DIAGNOSTICS BY RAMAN SCATTERING
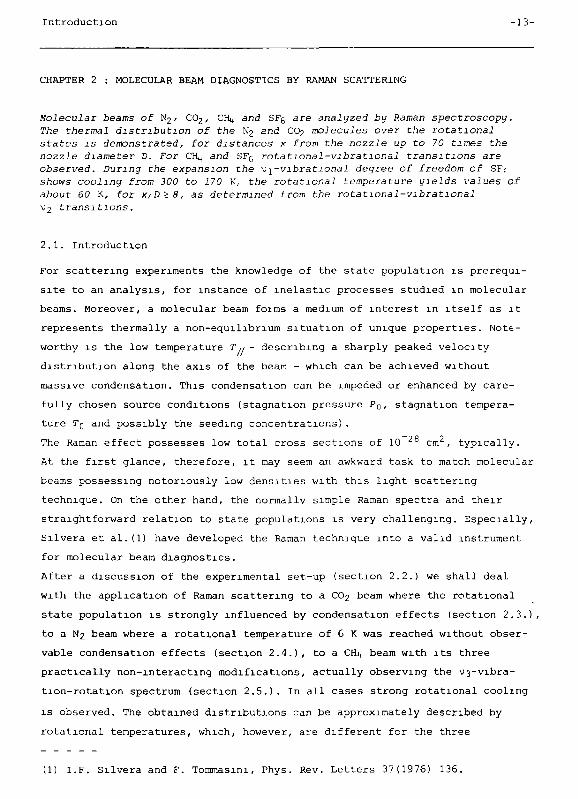
Molecular beams of ^/ CO2, Cfl·, and SFg are analyzed by Raman spectroscopy. The thermal distribution of the N2 and CO2 molecules over the rotational states is demonstrated, for distances χ from the nozzle up to 70 times the nozzle diameter D. For СНц and SFç rotational-vibrational transitions are observed. During the expansion the vi-vibrational degree of freedom of SFc shows cooling from 300 to 170 K/ the rotational temperature yields values of about 60 K, for X/D > 8, as determined from the rotational-vibrational V2 transitions.
2.1. Introduction
For scattering experiments the knowledge of the state population is prerequi
site to an analysis, for instance of inelastic processes studied in molecular
beams. Moreover, a molecular beam foims a medium of interest in itself as it
represents thermally a non-equilibrium situation of unique properties. Note
worthy is the low temperature Τ,, - describing a sharply peaked velocity
distribution along the axis of the bean - which can be achieved without
massive condensation. This condensation can be impeded or enhanced by care
fully chosen source conditions (stagnation pressure Pg, stagnation tempera
ture Tg and possibly the seeding concentrations) .
The Raman effect possesses low total cross sections of 10 cm , typically.
At the first glance, therefore, it may seem an awkward task to match molecular
beams possessing notoriously low densities with this light scattering
technique. On the other hand, the normally simple Raman spectra and their
straightforward relation to state populations is very challenging. Especially,
Silvera et al.(l) have developed the Raman technique into a valid instrument
for molecular beam diagnostics.
After a discussion of the experimental set-up (section 2.2.) we shall deal
with the application of Raman scattering to a CO2 beam where the rotational
state population is strongly influenced by condensation effects (section 2.3.) ,
to a N2 beam where a rotational temperature of 6 К was reached without obser
vable condensation effects (section 2.4.), to a CH^ beam with its three
practically non-interacting modifications, actually observing the з-vibra-
tion-rotation spectrum (section 2.5.). In all cases strong rotational cooling
is observed. The obtained distributions can be approximately described by
rotational tenperatures, which, however, are different for the three
(1) I.F. Silvera and F. Tommasini, Phys. Rev. Letters 37(1976) 136.
-14- Chapter 2
modifications of СНі̂ and are of limited applicability, anyhow, for this mole
cule. In section 2.6. we shall describe the possibility to observe also
vibrational cooling as exemplified by the observation of the Stokes- and
anti-Stokes intensities of the v^ vibration of SFg. This technique may be of
importance for the analysis, too, of UFg uolecular beams in multiphoton
experiments.
The special feature of the Raman technique consists of its small sampling
volume which allows to follow the beam cooling as function of the distance χ
from the nozzle (nozzle diameter D) right through the Mach disc where in a
freely expanding molecular beam the populations are thermalized by the inter
action with the background gas. Moreover, all measurements can be done without
perturbing the molecular beam.
For CO2 and N2, the rotational state population N can be extracted from the
Raman intensities J ,, using J>J ^
τ - ru 3(J+1) (J+2)
V j + 2 - CNJ 2(2J
+l)(2
J+3)
( S t 0 k e S )
V / - 2 = CNJ Z ^ - i n L + l ) (anti-Stokes)
(2.1.)
С contains all factors which are constant for the respective rotational
transitions. The more complicated analysis of the СНц intensities is dealt
with in section 2.5.
In table 2.1., the relative intensities of the observed Raman lines are
given, as a practical guide for the experimentalist who meditates the use of
rotational and vibrational Raman effect in conjunction with a molecular beam
scattering target.
2.2. Experimental set-up
In principle, the apparatus is quite simple (fig. 2.1.) , the skimmerless
molecular beam is formed by expansion through a drilled hole with length
L, 3L < D=250\im. The single chamber beam apparatus is pumped by a roots pump
(500 m3/h) backed by a 25 m /h motor pump (Leybold Heraeus). The maximum
background pressure was 0.7 Torr, for СНц with Po=7 atm, To=297 K. The
nozzle is mounted on an optical sliding table and can be translated in y-z
directions; moreover, the distance χ from the laser beam crossing can be
varied easily.
Experimertal se t-up •15-
averager counter pm double monochromator
L
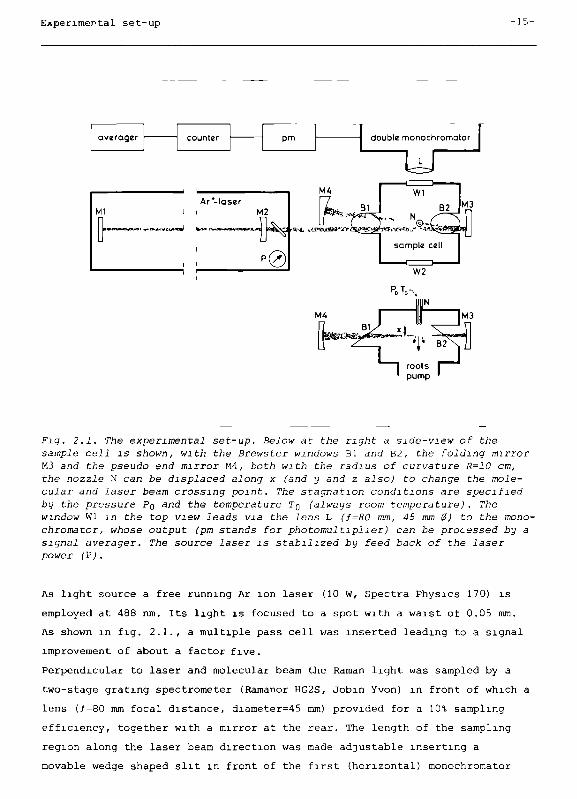
Fig. 2.1. The experimental set-up. Below at the right a side-view of the sample cell is shown, with the Brewster windows Bl dnd B2, the folding mirror M3 and the pseudo end mirror M4, both with the radius of curvature R=10 cm, the nozzle N can be displaced along χ (and y and ζ also) to change the molecular and laser beam crossing point. The stagnation conditions are specified by the pressure Pg and the temperature TQ (always room temperature). The window Wl in the top view leads via the lens L (f=80 mm, 45 mm 0) to the monochromator, whose output (pm stands for photomultiplier) can be processed by a signal averager. The source laser is stabilized by feed back of the laser power (P).
As light source a free running Ar ion laser (10 W, Spectra Physics 170) is
employed at 488 nm. Its light is focused to a spot with a waist of 0.05 mm.
As shown in fig. 2.1. , a multiple pass cell was inserted leading to a signal
improvement of about a factor five.
Perpendicular to laser and molecular beam the Raman light was sampled by a
two-stage grating spectrometer (Ramanor HG2S, Jobin Yvon) in front of which a
lens (/=80 mm focal distance, diameter=45 mm) provided for a 10% sampling
efficiency, together with a mirror at the rear. The length of the sampling
region along the laser beam direction was made adjustable inserting a
movable wedge shaped slit in front of the first (horizontal) monochromator
-16- Chapter 2
slit; adjustment can be obtained between 0.5 and 5 mm. The spectrometer was
equipped with a photomultiplier (EMI 9658B) ,· cooling of the window allowed to
work with a dark current of 5 cts/s, typically.
For signal averaging the multiplier output (preamplified) could be fed into an
averager (Nicolet 1070, 2048 channels) so that measuring times up to 20 h
became possible.
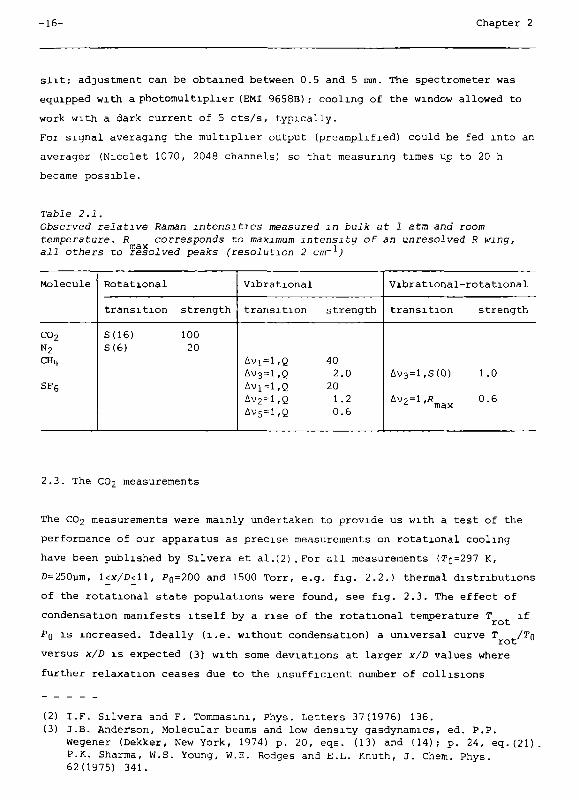
ГаЫе 2.1. Observed relative Raman intensities measured m bulk at 1 atm and room temperature. R corresponds to maximum intensity of an unresolved R wing, all others to resolved peaks (resolution 2 cm-1
;
Molecule
CO2 N
2
CHi,
SF6
Rotational
transition
S(16)
S (6)
strength
100
20
Vibrational
transition
Av1=l,Q
Д з=1,<2 Δ ν1=1-Q
AV2=1,Q
AV5=1,Q
strength
40
2.0
20
1.2
0.6
Vibrational-
transition
Д э=1,3(0)
Δ\)? = 1 ,R z max
-rotational
strength
1.0
0.6
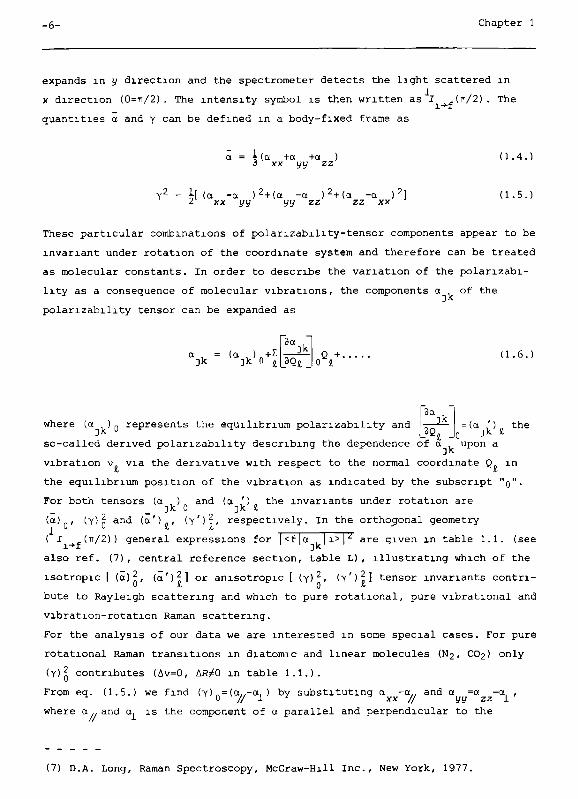
2.3. The CO2 measurements
The CO2 measurements were mainly undertaken to provide us with a test of the
performance of our apparatus as precise measurements on rotational cooling
have been published by Silvera et al.(2). For all measurements (To=297 K,
ß=250pm, l<x/D<ll/ P0=200 and 1500 Torr, e.g. fig. 2.2.) thermal distributions
of the rotational state populations were found, see fig. 2.3. The effect of
condensation manifests itself by a rise of the rotational temperature Γ if
Pg l s
increased. Ideally (i.e. without condensation) a universal curve Τ 4-/r0
versus χ/Ό is expected (3) with some deviations at larger χ/Ό values where
further relaxation ceases due to the insufficient number of collisions
(2) I.F. Silvera and F. Tommasim, Phys. Letters 37(1976) 136.
(3) J.B. Anderson, Molecular beams and low density gasdynamics, ed. P.P.
Wegener (Dekker, New York, 1974) p. 20, eqs. (13) and (14); p. 24, eq.(21).
P.K. Sharma, W.S. Young, W.E. Rodges and E.L. Knuth, J. Chem. Phys.
62(1975) 341.
The CO2 measurements -17-
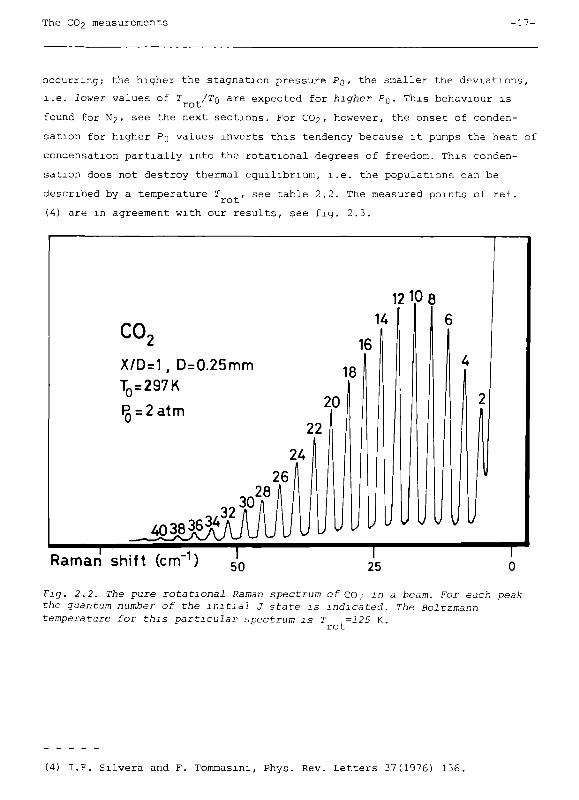
occurring; the higher the stagnation pressure Pg, the smaller the deviations,
i.e. lower values of Τ t/To a r e expected for higher PQ. This behaviour is
found for N2/ see the next sections. For CO2, however, the onset of conden
sation for higher Pg values inverts this tendency because it pumps the heat of
condensation partially into the rotational degrees of freedom. This conden
sation does not destroy thermal equilibrium, i.e. the populations can be
described by a temperature Τ , see table 2.2. The measured points of ref. rot
(4) are in agreement with our results, see fig. 2.3.
CO
X/D=1, D=0.25mm T0 = 297K
fg = 2atm
Raman shift (cm 1) 50 25
Fig. 2.2. The pure rotational Raman spectrum of CO; m a beam. For each peak the quantum number of the initial J state is indicated. The Boltzmann temperature for this particular spectrum is Τ =125 К
rot
(4) I.F. Silvera and F. Tommasini, Phys. Rev. Letters 37(1976) 136.
-18- Chapter 2
Trot To
π 1 г τ 1 1 1 1—
c o 2
To = 297K, 0 = 0 25 mm
• Po = 1500 Torr
л Po= 200 Torr
} Silvera
This work
Trot (K)
256
12B
61.
32
16
10 12 U X/0
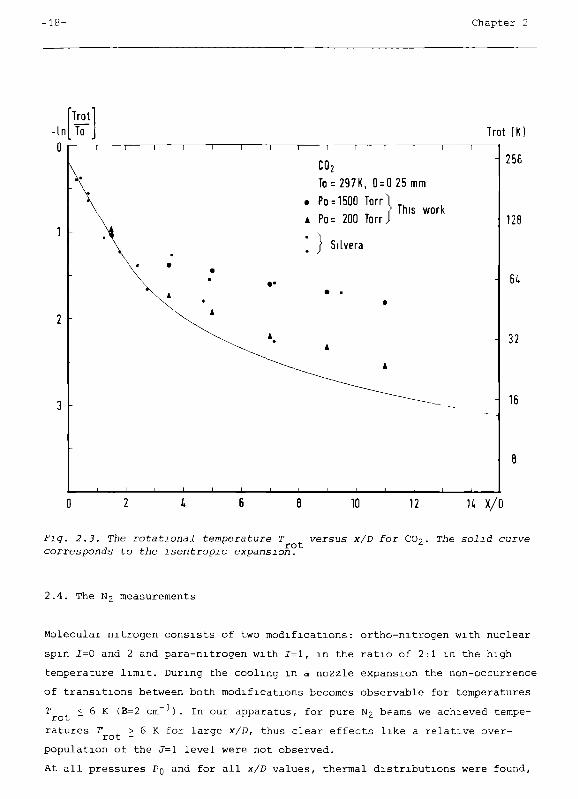
Fig. 2.3. The rotational temperature Τ versus x/D for CO2. The solid curve corresponds to the isentropic expansion.
2.4. The N2 measurements
Molecular nitrogen consists of two modifications: ortho-nitrogen with nuclear
spin 2=0 and 2 and para-nitrogen with 1=1, in the ratio of 2:1 in the high
temperature limit. During the cooling in a nozzle expansion the non-occurrence
of transitions between both modifications becomes observable for temperatures
Τ < б К (B=2 cm- 1) . In our apparatus, for pure N2 beams we achieved tempe
ratures Τ > 6 К for large x/D, thus clear effects like a relative over-rot -
population of the J=l level were not observed.
At all pressures Pg and for all x/D values, thermal distributions were found,
The N2 measurements -19-
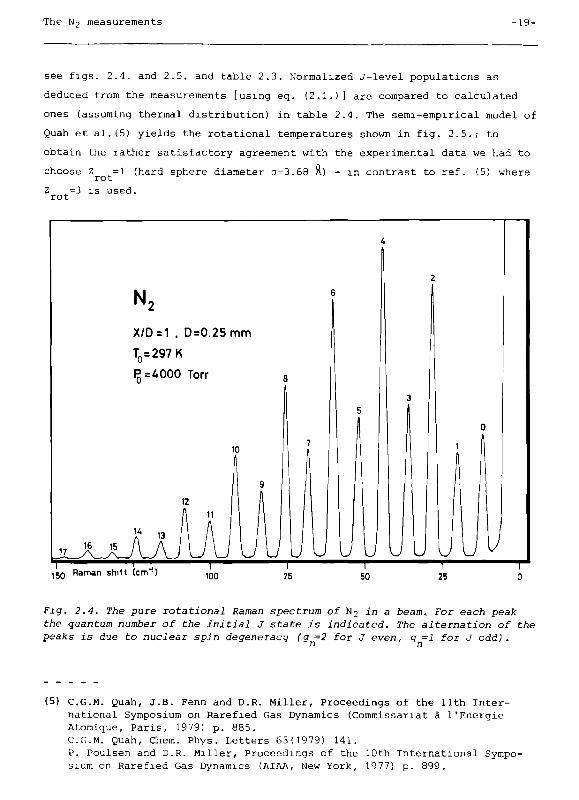
see figs. 2.4. and 2.5. and table 2.3. Normalized J-level populations as
deduced from the measurements [using eq. (2.1.)] are compared to calculated
ones (assuming thermal distribution) in table 2.4. The semi-empirical model of
Quah et al.(5) yields the rotational temperatures shown in fig. 2.5.; to
obtain the rather satisfactory agreement with the experimental data we had to
choose Ζ =1 (hard sphere diameter σ=3.6θ Я) - m contrast to réf. (5) where
Ζ =3 is used. rot
N-
X/D=1 . D=0.25mm
^ = 297 К
l==4000 Torr
15Q Raman shiH (cm"')
Fig. 2.4. The pure rotational Raman spectrum of N2 іл a beam. For each peak the quantum number of the initial J state is indicated. The alternation of the peaks is due to nuclear spin degeneracy (g =2 for J even, g =1 for J odd).
η η
(5) C.G.M. Quah, J.B. Fenn and D.R. Miller, Proceedings of the 11th Inter
national Symposium on Rarefied Gas Dynamics (Commissariat à l'Energie Atomique, Paris, 1979) p. 885. C.G.M. Quah, Chem. Phys. Letters 63(1979) 141. P. Poulsen and D.R. Miller, Proceedings of the 10th International Symposium on Rarefied Gas Dynamics (AIAA, New York, 1977) p. 899.
-20- Chapter 2
Inconveniently, there is no proper terminal value defined in ref. (5); we
obtained a lower limit by subtracting the corresponding translational tempe
rature at a fixed value of x/D from Γ . Because this translational tempe-
rot
rature diminishes rapidly with increasing x/D (proportional to (x/D)2~
2Y) a
satisfactory convergence is
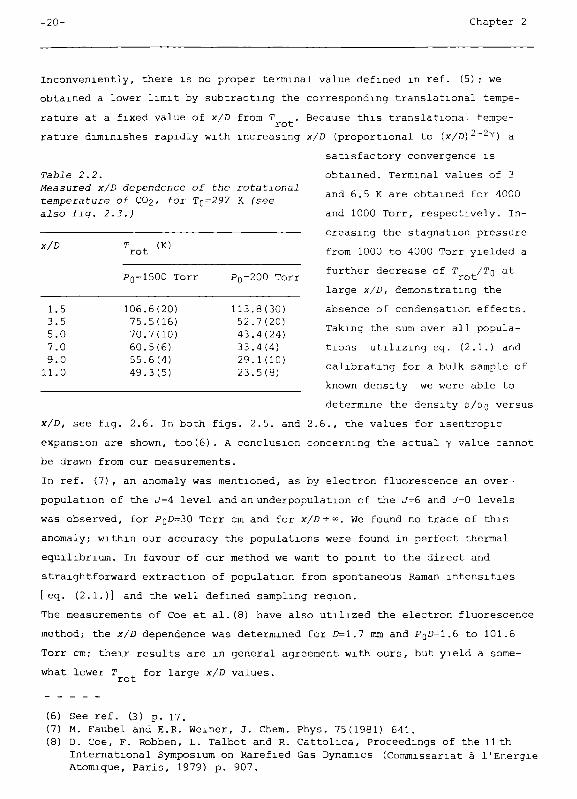
Table 2.2. obtained. Terminal values of 3
Measured x/D dependence of the rotational temperature of CO2, for T0^297 К (see also fig. 2.3.) and 1000 Torr, respectively. In-
and 6.5 К are obtained for 4000
x/D
1.5
3.5
5.0
7.0
9.0
11.0
rrot
( K )
P0=1500 Torr
106.6(20)
75.5(16)
70.7(10)
60.5(6)
55.6(4)
49.3(5)
P0=200 Torr
113.8(30)
52.7(20)
43.4(24)
33.4(4)
29.1 (10)
23.5(8)
creasing the stagnation pressure
from 1000 to 4000 Torr yielded a
further decrease of Τ , / Τ η at rot
υ
large x/D, demonstrating the
absence of condensation effects.
Taking the sum over all popula
tions utilizing eq. (2.1.) and
calibrating for a bulk sample of
known density we were able to
determine the density p/pg versus
x/D, see fig. 2.6. In both figs. 2.5. and 2.6., the values for isentropic
expansion are shown, too(6). A conclusion concerning the actual γ value cannot
be drawn from our measurements.
In ref. (7), an anomaly was mentioned, as by electron fluorescence an over
population of the J=4 level and an underpopulation of the J=6 and J-0 levels
was observed, for PoD=30 Torr cm and for x/D -»-<». We found no trace of this
anomaly; within our accuracy the populations were found in perfect thermal
equilibrium. In favour of our method we want to point to the direct and
straightforward extraction of population from spontaneous Raman intensities
[ eq. (2.1.)] and the well defined sampling region.
The measurements of Сое et al. (8) have also utilized the electron fluorescence
method; the x/D dependence was determined for 0=1.7 mm and РдГ»=1.6 to 101.6
Torr cm; their results are in general agreement with ours, but yield a some
what lower Г ^ for large x/D values.
rot
(6) See ref. (3) p. 17.
(7) M. Faubel and E.R. Werner, J. Chem. Phys. 75(1981) 641.
(8) D. Сое, F. Robben, L. Talbot and R. Cattolica, Proceedings of the 11th
International Symposium on Rarefied Gas Dynamics (Coinmissariat à l'Energie Atomique, Paris, 1979) p. 907.
The CHi, m e a s u r e m e n t s - 2 1 -
Trot' To
N 2
To = 2 9 7 K , 0 = 0 2 5 m m Po = i.000 Torr Po = 1000 Torr
•Zrotrl
isentropic
Trot (K)
256
12B
Ы,
32
16
- i.
5 10 15 20 25 30 35 U) LS 50 55 60 65 70 X/D
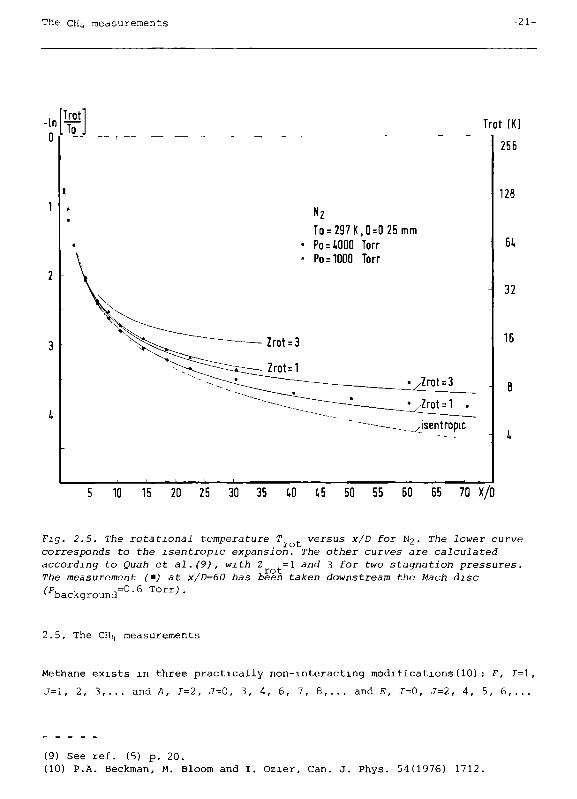
Fig. 2.5. The rotational temperature Τ versus x/D for N2- The lower curve corresponds to the isentropic expansion. The other curves are calculated
according to Quah et al.(9), with 2 =1 and 3 for two stagnation pressures. The measurement (ш) at x/D=60 has been taken downstream the Mach disc (p. , =0.6 Torr) . 1 background '
2.5. The CHi, measurements
Methane exists in three practically non-interacting modifications(10): F, 1=1,
J=l, 2, 3,... and A, 1=2, J=Q, 3, 4, 6, 7, 8,... and E, 1=0, J=2, 4, 5, 6,...
(9) See ref. (5) p. 20.
(10) P.A. Beekman, M. Bloom and I. Ozier, Can. J. Phys. 54(1976) 1712.
-22- Chapter 2
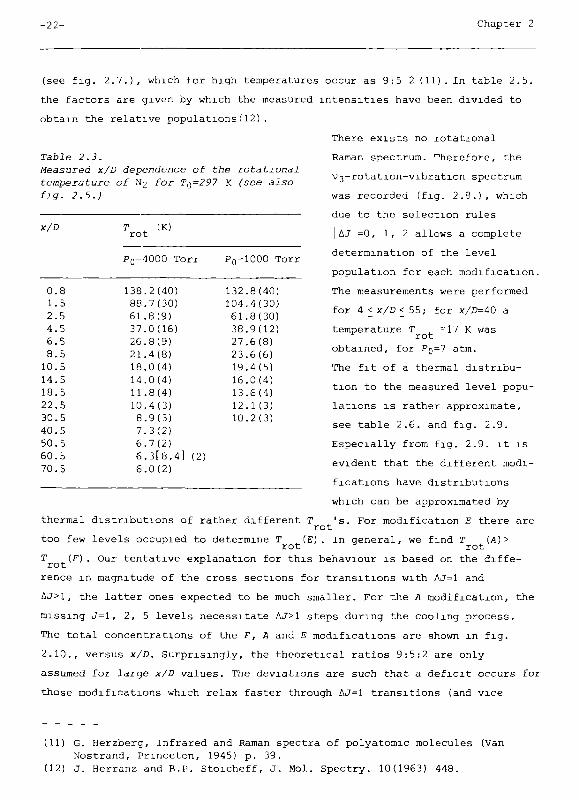
(see fig. 2.7.), which for high temperatures occur as 9:5 2 (11). In table 2.5.
the factors are given by which the measured intensities have been divided to
obtain the relative populations(12).
Table 2.3. Measured x/D dependence of the rotational temperature of N2 for TQ=297 К (see also fig. 2.5.)
x/D
0.8
1.5
2.5
4.5
6.5
8.5
10.5
14.5
18.5
22.5
30.5
40.5
50.5
60.5
70.5
Τ ^ (K) rot
P0=4000 Torr
138.2(40)
88.7(30)
61.8(9)
37.0(16)
26.8(9)
21.4(8)
18.0(4)
14.0(4)
11.8(4)
10.4(3)
8.9(3)
7.3(2)
6.7(2)
6.3[8.4] (2)
6.0(2)
P0-1000 Torr
132.8(40)
104.4(30)
61.8(30)
38.9(12)
27.6(8)
23.6(6)
19.4(5)
16.0(4)
13.6(4)
12.1(3)
10.2(3)
thermal distributions of rather different Τ
There exists no rotational
Raman spectrum. Therefore, the
з-rotation-vibration spectrum
was recorded (fig. 2.8.), which
due to the selection rules
|Δι7|=0, 1, 2 allows a complete
determination of the level
population for each modification.
The measurements were performed
for 4 < χ/Ό < 55,- for x/D=40 a
temperature Τ ^ -17 К was rot
obtained, for Po=7 atm.
The fit of a thermal distribu
tion to the measured level popu
lations is rather approximate,
see table 2.6. and fig. 2.9.
Especially from fig. 2.9. it is
evident that the different modi
fications have distributions
which can be approximated by
For modification E there are rot too few levels occupied to determine Г (E). In general, we find Τ (Л)>
rot rot Τ (F). Our tentative explanation for this behaviour is based on the diffe-rot
r
rence in magnitude of the cross sections for transitions with AJ=1 and
AJ>1, the latter ones expected to be much smaller. For the Л modification, the
missing J=l, 2, 5 levels necessitate AJ>1 steps during the cooling process.
The total concentrations of the F, A and E modifications are shown in fig.
2.10., versus x/D. Surprisingly, the theoretical ratios 9:5:2 are only
assumed for large x/D values. The deviations are such that a deficit occurs for
those modifications which relax faster through AJ=1 transitions (and vice
(11) G. Herzberg, Infrared and Raman spectra of polyatomic molecules (Van
Nostrand, Princeton, 1945) p. 39.
(12) J. Herranz and B.P. Stoicheff, J. Mol. Spectry. 10(1963) 448.
The СНі̂ measurements -23-
versa), as if their rotational energy transmitted into translation by
inelastic collisions would be partially used to knock these molecules out of
the central portion of the beam.
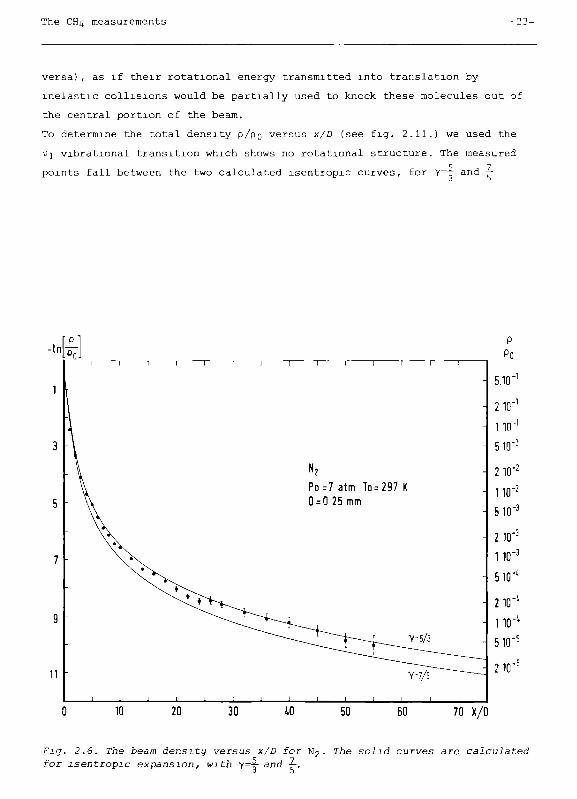
To determine the total density P/PQ versus x/D (see fig. 2.11.) we used the
Vj vibrational transition which shows no rotational structure. The measured
points fall between the two calculated isentropic curves, for Y=-T and —
-<1 1
3
5
7
9
11
' ' '
_ \
- \
\\
\ ·\ \ ^x
\^ e 4 ^
\
-
-
1 1 1
^ i 4 ^ - ^ ^^-C^
1 1 [ _ _
1 1 1 1 1 1 1 1
_
Po =7 atm To=297 К 0 = 0 25 mm
-
-
^ ^ ^ ^ I
^ ^ ^ З ^ ь ^ л ^ -γ-уГ "—:
_ | 1 ' I ' ' ' '
_P_
Po
-1 5.10
2 10
110
5 ΙΟ
Σ 10
П О " 2
5 IO"3
•з
,-2
Η 2 10
110 -з
5 1 0 "
2 10"
- 110"
- 5 1 0 "
- 2 1 0 "
20 30 ¿.О 50 60 70 Χ/0
Fig. 2.6. The beam density versus x/D for N^· The solid curves are calculated for isentropic expansion, with γ=-|- and -ξ-.
- 2 4 - Chapter 2
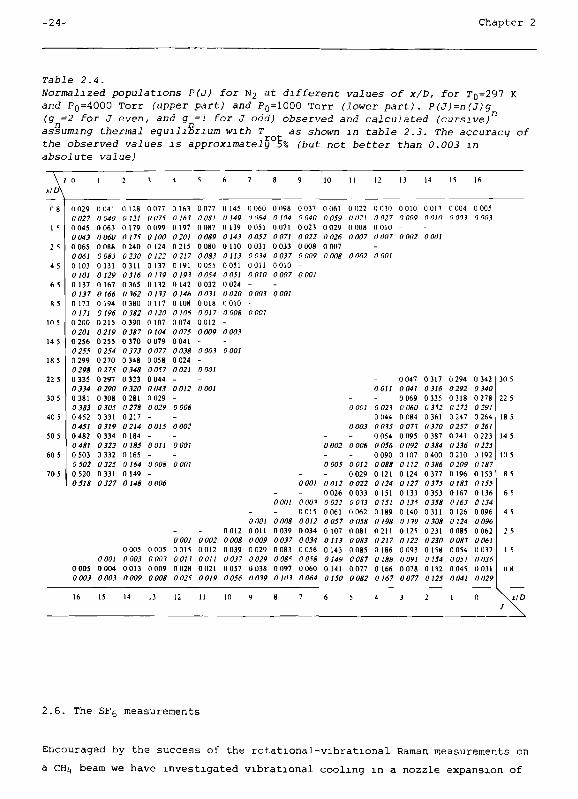
Table 2.4. Normalized populations P(J) for N2 at d i f f e r e n t values of χ/Ό, for TQ=297 К ала P0=4OOO Torr Cupper p a r t ; and P0=1000 Torr (lower part). P(J)=n(J)g (g =2 for J even, and g =1 for J odd) observed and calculated (cursive) assuming thermal equilibrium with Τ as shown m table 2.3. The accuracy of
r o t the observed vaiues i s approximateiy 5% (but not better than 0.003 in absolute value)
(18
1 s
2 s
4 5
6 S
5 5
10 5
14 5
18 5
22 5
30 5
40 5
50 5
60 5
70 5
0 029
0 027
0 045
0 043
0 065
0 061
0 103
ΟΙΟΙ
0 137
0 137
0 173
от 0 200
0 201
0 256
0 25S
0 299
0 29S
0 335
0 334
0 381
0 383
0 452
0 4S¡ 0 482
0 481
0 503
0 502
0 520
0S18
Q 041
0 040
0 063
0 060
0 088
0 083
0 131
0 129
а 167
0 166
0 194
0 196
0215 0 219
0 255
0 254
0 270
0 275
0 297
0 290
0 308
0 305
0 331
0 319
0 334
0 323
0 332
0 325
0 331
0 327
а 128
» /г;
0 179
0 175
0 240
0 230
0311 OJ;Í
0 365
0 762
0 380
0 382
0 390
0J*7
0 370
0 373
0 348
0.MS
0 323
О.Ш 0 281
0 278
0 217
0 Л 4 0 184
0 185
а 165
0ÍÍ4
0 149
0/4«
0 077
0 07І
0 099
0/00
0 124
0 122
0 137
0 П9 0 112
ОПЗ 0 117
0 120
0 107
0 104
0 079
0 077
0 058
0 057
0 044
0 0« 0 029
0 029
-0 0J5
-0071
-0 00«
-0 006
0 163
0 161
0 197
ого;
0215
02/7
0 191
0/91
0 142
0М6 0 108
0 106
0 074
0 075
0 041
0 0.М
0 024
002;
-0 012
-0 006
-0 002
-ООО;
-0 00)
0 077
0OÄ/
0 0Я7
оода
0 080
0 0SJ
0 055
0 054
0 032
0 0JÍ
0018
00/7
0012
0 009
-0 00J
-0 001
-0O0J
0 145
0 /49
0 139
0 143 0 ПО 0 из 0051
0 05/
0 024
0 020
0 010
0 00«
-0 003
-0 001
а обо
(1 064
0 051
0 052
0 031
0 034
ООП 0 010
-0 00J
-ооо;
0 098
0 Í04
0 071
0 07;
0 033
0 0J7
0010
0 007
-ооо;
0 037
0 040
0 023
0 022
0 008
0 009
-ооо;
-ооо;
0 061 0 022 0 010 0 010 О ОП 0 004 0 005 0 059 0 02; 0 027 0 009 0 01(1 0 001 0 003 0 029 0 008 0 010 -0 026 0 007 0 007 0 002 0 00/ 0 007 ооо« 0 002 ооо;
0 005 0 005 ооо; 0 00.3 0 00?
0 005 0 004 0 013 0 009
о оо; о 007 0015
ооо; ооо« оо;2 0 012 О О П 0 039 0 034
O00I 0 002 0 008 0 009 0 037 0 034
0015 0012 0039 0029 0083 0 056 о о м о о; ; ooJ7 0029 OOSÎ о OÍ« 0 028 0 021 0 057 0 038 0 097 0 060
0 003 0 003 0 009 0 008 0 025 0 019 0 056 0 019 ΟΙΟΙ 0 064
-0 002
-0 005
-оо;2
0 026
0 022
0 061
0 057
0 107
0 113 0 143
0J49
0 141
о;5о
-ооо;
0 003
-0 006
-оо;2
0 029
0 022
0 033
ООМ 0 062
0 05«
0 081
0 0« 0 085
0 0S7
0 077
0 0«2
-оо;;
_ 0 021
0 044
0 075
0 054
0 056
0 090
0 0««
0 121
о;24
0 151
о;5;
0 189
0/9«
0211 0 217
0 186
о;««
0 166
0/67
0 047
0 04;
0 069
0 060
0 084
0 077
0 095
0 092
0 107
о;;2
0 124
0/27
0 133
0 135
0 140
0 119
0 125
о;22
0 093
0 09;
0 078
0 077
0317
ОЛб 0 3Э5
0JÍ2
0 361
0J70
0 387
0J«4
0 400
0 386
0 377 0375 0 353 0J5« 0311 0 308
0 231
0 2J0
0 158
С Ш 0 112
0125
0 294
0292
0318
0 272
0 247
0 257
0 241
0 2J6
0 210
0 209
0 196
О Ш 0 167
o;6j
0 126
0 124
0 085
0 0«7
0 054
0 05;
0 045
0 04;
0 342
0J4O
0 278
0 29;
0 264
0 26;
0 223
0 225
0 192
о;»7
0 153
0/55
0 136
0 134
0 096
0 096
0 062
0 061
0 017
0 0J6
11031
0 029
2.6. The SFc measurements
Encouraged by the success of the rotational-vibrational Raman measurements on
а сНц beam we have investigated vibrational cooling in a nozzle expansion of
The SF6 measurements -25-
SFg. Here, the all-symmetric Raman-active v^ mode(13) provides the adequate
means to determine the total population of the first excited vibrational state
and the ground state - summed over all rotational states - by comparing the
strength of the Stokes and anti-Stokes intensity (see table 2.7.). The ratio
of scattered intensities obeys
1 ,- c. i, /
Іс^ ι, = [(vo+^l)/(vo-Vi) ]Ц
expt-hvj/kr ), (2.2.) anti-Stokes Stokes
L u 1 u 1 i vib
where vg stands for the incoming laser frequency.
Concerning the rotational temperature of SF6, the unresolved rotational
branches (P & 0 and R & S) of the V2 mode (see fig. 4.5.) yield at least an
approximate means to estimate the x/D dependence(14)
The value of Γ is obtained from the spacing of the maxima of the two rot ,
observed rotational wings Δν , assumed to be proportional to Τ . In general,
Τ <T , is found, with 1-Γ /Tn*2(l-r ,/T
n) for Pn=6 atm (table 2.7 and
rot vib rot u
vib u u
fig. 2. 12. ). Furthermore, Τ /Το=Ό.56 for large x/D, this in contrast to
ref. (15), where vibrational cooling is assumed to be absent.
2.7. Discussion
In the foregoing we have presented results which demonstrate the potential:-
ties of conventional Raman spectroscopy in analyzing the state distribution of
a molecular beam. With high accuracy, these state distributions were obtained
as function of x/D, together with the absolute number density. Rather novel is
the application of Raman scattering to quantitatively determine the vibra
tional cooling during expansion which up to now was often assumed to be absent
altogether.
For N2 and CO2 thermal equilibrium within the rotational degree of freedom was
demonstrated. For different degrees of freedom (e.g. rotation and Vj vibration
of SFg) strongly different temperature parameters were obtained describing the
pertaining state distributions.
In comparison to other techniques the advantage of Raman diagnostics lies in
its possibility to investigate the beam properties as function of x/D, in a
(13) A. Aboumajd, H. Berger and R. Saint-Loup, J. Mol. Spectry. 78(1979) 486.
(14) F.N. Masn and W.H. Fletchner, J. Chem. Phys. 52(1970) 5759.
(15) P.A. Schulz, A.S. Sudbjí, E.R. Grant, Y.R. Shen and Y.T. Lee, J. Chem. Phys. 72(1980) 4985.
-26- Chapter 2
non-destructive way. This property is shared with the much more sensitive
laser-induced-fluorescence technique ( 16) With the latter, the state distri
bution can be significantly altered by optical pumping. The nearly universally
applicable spontaneous Raman effect (only atoms elude its grasp) avoids the
necessity of resonance tuning.
The spontaneous Raman scattering as diagnostic tool found its competitors in
CARS(17) and the inverse Raman scattering ( 18) . Concerning CARS the quadratic
dependence on the difference in number densities for molecules in the initial
and final state causes firstly a [x/D) proportionality of the scattered light
signal, for large x/D values, secondly, a rather high minimum temperature is
the consequence at which e.g. populations of higher rotational states cease to
be detectable. For instance, at 35 К all rotational structure had disappeared
in the Q branch of N2(17) whereas in our measurements still at 6 К this struc
ture remains clearly observable. Sensitivity and resolution obtained with CARS
seem comparable to what we have presented in the foregoing (17) .
The inverse Raman effect has permitted molecular beam diagnostics with much
higher resolution (0.002 cm" ,(18) ), the obtained sensitivity is comparable to
that achieved by us.
However, employing pulsed molecular beams the sensitivity probably can be im
proved considerably.
The conventional Raman scattering described in this paper can be amended in
our opinion ro increase the now observed signal-to-noise ratio by about an
order of magnitude, work in this direction is under way.
Acknowledgement
The skillful and permanent assistance of Cor Sikkens and John Holtkamp, the
preparatory work of Koo Rijpkema and helpful discussions especially on CHÌJ
with H. Kuypers, U Buck and M. Faubel are gratefully acknowledged. We have
profited much by the technical know how of the group of I. Silvera readily
communicated to us particularly by H. Godfried.
(16) D.H Levy, Ann. Rev. Phys. Chem. 31(1980) 197. (17) P. Huber-Walchli, D.M. Guthals and J.W. Nibler, Chem. Phys. Letters
67(1979) 233. (18) J.J. Valentin!, Chem. Phys. Letters 75(1980) 590.
Discussion - 2 7 -
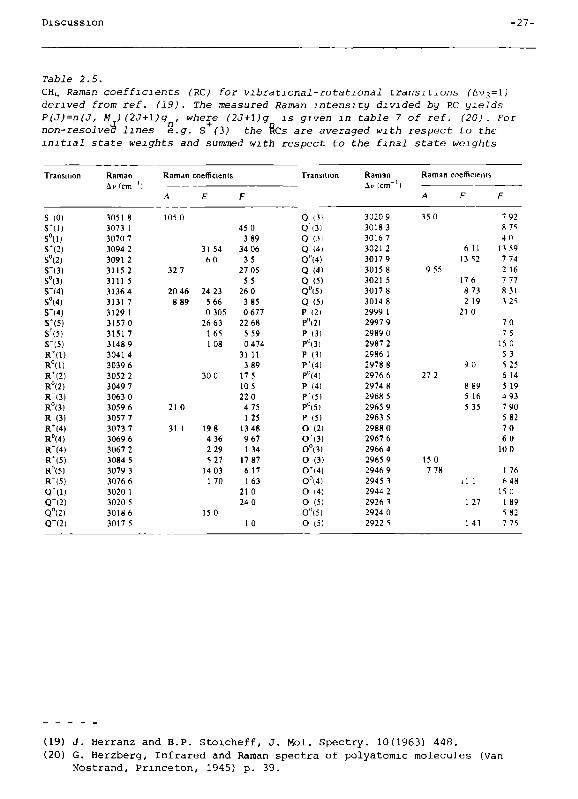
Table 2.5. СНц Raman coefficients CRC) for vibrational-rotational transitions СД з=і; derived from ref. (19). The measured Raman intensity divided by RC yields P(J)=n(J, M ) (2J+l)g , where (2J+l)g is given m table 7 of ref. (20). For non-resolved lines e.g. s (3) the RCs are averaged with respect to the initial state weights and summed with respect to the final state weights
Transilion Raman Raman coefficients Transition Raman Raman coefficients
Δι, (cm ') AiMcm"1) A E F Ä F F
S (0)
S*(l)
S°(l) S*(2)
S0(2)
S*(3)
S0(3)
S'(4)
S0(4)
SI«)
S*(5)
Sn(5)
S"(5)
R U ) R0(l)
R*(2)
R0(2)
R"(3)
R0(3)
R"(3)
R*(4)
R0(4)
R"(4)
R*(5)
R"(5)
R"(5)
0*(1) Q*12)
Q0(2)
Q"(2)
1051 8
3073 1
3070 7
3094 2
30912
31152
3111 5 31364
3131 7
3129 1
31570
31517
3148 9
30414
3039 6
3052 2
3049 7
3063 0
3059 6
3057 7
3073 7
3069 6
3067 2
3084 5
3079 3
3076 6
3020 1
3020 5
3018 6
3017 5
105 0
32 7
20 46
8 89
21 0
31 1
31 54
60
24 23
5 66
0 305
26 63 16S 1 08
30 0
198 4 36
2 29
5 27
14 03
170
150
45 0
3 89
34 06
35 27 05
55 26 0
3 85
0 677
22 68
5 59
0 474
31 11
3 89
17 5
10 5
22 0
4 75
1 25
13 48
9 67
1 34
17 87
617 163
21 0
24 0
10
Q (3)
Q'l3)
Q (3)
Q (4)
Qu(4)
Q (4)
Q (5)
QÜ(5I
Q (5)
Ρ (21
P"(2)
Ρ (3)
Ρϋ(3)
ρ (3)
P*(4)
Ρϋ(4)
Ρ (4)
Ρ*(5)
Ρ'\5) Ρ (5)
Ο (2)
0*(3)
Ο'Ό) Ο (3)
0·(4)
θ"(4)
Ο [4)
Ο (5)
0"(5)
Ο (5)
3020 9
3018 3
3016 7
30212
3017 9
3015 8
3021 5
3017 8
3014 8
2999 1
2997 9
2989 0
2987 2
2986 1
2978 Β
2976 6
2974 8
2968 5
2965 9
2963 5
2988 0
2967 6
2966 4
2965 9
2946 9
2945 3
2944 2
2926 3
2924 0
2922 5
35 0
9 55
27 2
150
7 78
6 11
13 52
176
8 73
2 19
21 0
90
8 89
5 16
5 35
• 1 1
1 27
1 43
7 92
Я 74
4П 13 59
7 74
2 16
7 77
831 3 25
70
75 150 53 5 25
6 14
5 19
4 93
7 90
5 82
70 60 10 0
1 76
6 48
15 0
1 89
5 82
7 75
(19) J. Herranz and В.P. Stoicheff, J. Mol. Spectry. 10(1963) 448.
(20) G. Herzberg, Infrared and Raman spectra of polyatomic molecuJes (Van Nostrand, Princeton, 1945) p. 39.
-28- Chapter 2
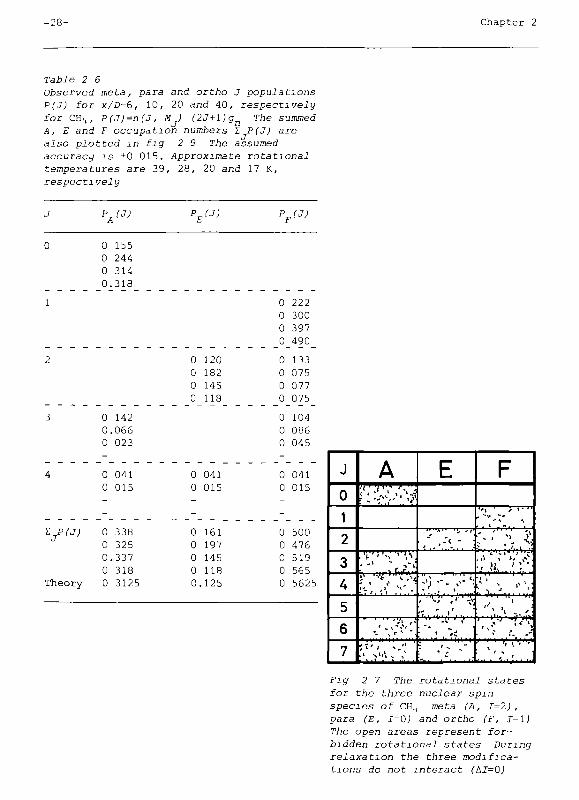
Table 2 6 Observed meta, para and Ortho J populations Ρ(J) for x/D=6, 10, 20 and 40, respectively for СНц, P(J)=n(J, M ) (2J+\)gn The summed A, E and F occupation numbers Σ Ρ(J) are also plotted m fig 2 9 The assumed accuracy is +0 015. Approximate rotational temperatures are 39, 28, 20 and 17 K,
respectively
J
0
1
2
3
4
ïjPfJ)
Theory
PA(J)
0 155 0 244 0 314 0.318
0 142 0.066 0 023
0 041 0 015
0 338 0 325 0.337 0 318 0 3125
PE(J)
0 0 0 0
0 0
0 0 0 0 0
120 182 145 118
041 015
161 197 145 118 125
vj;
0 0 0 0
0 0 0 0
0 0 0
0 0
0 0 0 0 0
222 300 397 490
133 075 077 075
104 086 045
041 015
500 476 519 565 5625
',ν mìt\*l'+
. *.
г i'· Vi •'' ' Щ ' | ,•• 'f' >'
»•»'¿•ν ;/*;ІіЛ
JL·
••Uli,· ι ¡Г·Щі
'ι T í " '
Fi g 2 7 The rotational states for the three nuclear spin species of CH^ meta (A, 1=2), para (E, I-Q) and ortho (F, I-\) The open areas represent forbidden rotational states During relaxation the three modifications do not interact CAJ=0J
Discussion - 2 9 -
rel. intensity
1.0 -
0.Θ
5(0)^(2)
Q(v3)
0.6
0Á
0.2
CHA X/D=6,0 = 0.25 mm P0 = 7atm. T0=297K
2v2,R(3) Sd^RW)
3020 зодо 3060 3080 3100 . Raman
Δν (cm-1)
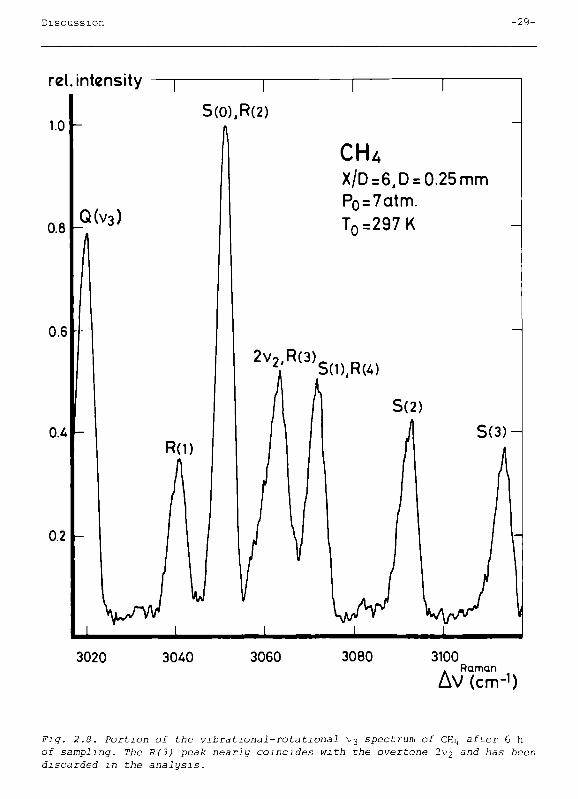
Fig. 2.8. Portion of the vibrational-rotational V3 spectrum of СНц after 6 h of sampling. The R(3) peak nearly coincides with the overtone 2v2 and bas been discarded m the analysis.
-30- Chapter 2
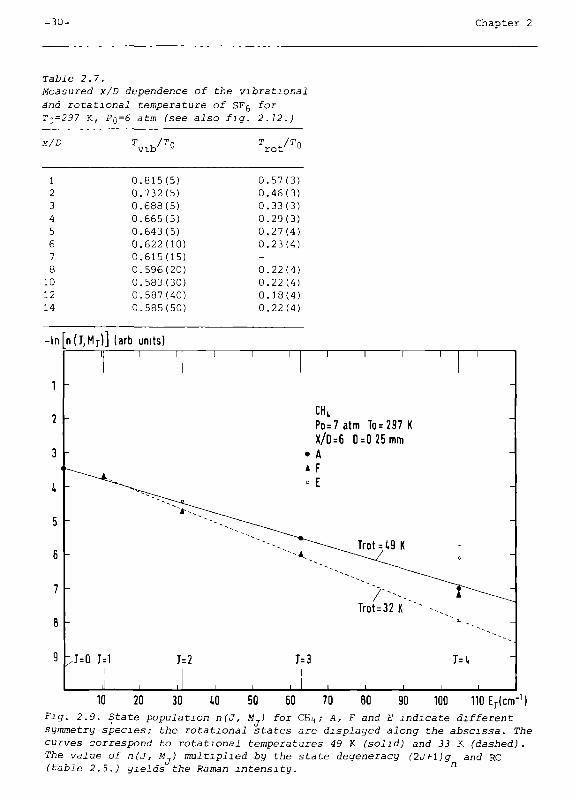
Table 2.7. Measured x/D dependence of the vibrational and rotational temperature of SFg for Γ3=297 K, P
0=6 atm (see also fig. 2.12.)
x/D vib
u Τ ./Τΰ rot u
1
2
3
4
5
6
7
8
10
12
14
0.815(5)
0.732(5)
0.688(5)
0.665(5)
0.643(5)
0.622(10)
0.615(15)
0.596(20)
0.583(30)
0.587(40)
0.585(50)
0.57(3)
0.46(3)
0.33(3)
0.29(3)
0.27(4)
0.23(4)
0.22(4)
0.22(4)
0.18(4)
0.22(4)
-In
1
2
3
/,
5
6
7
В
9
n d . M j ) ] (arb units) 1 1 1 1
-
_ ^ ^ ^ - ^ ^
> ^ - ~ ^ _ ^ ^
-
-
>Ь0 1=1 1=2
1 1 1 1
1 1 1 1 1
CHi Po=7atm To=297 К X/D=6 0=0 25 mm
• Д
* F = E
^^-ГГ*~^~---ТгоІ = і.Э К
Trot=32 К -
1=3
! I
-
"
Τ
г ^ ^ •±
1=1. 1
1 1 1
10 20 30 10 50 60 70 ВО 90 100 110Er(cm-
1)
Fig. 2.9. State population n(J, Mi for CHi4 ; A, F and E indicate different
symmetry species; the rotational states are displayed along the abscissa. The curves correspond to rotational temperatures 49 К (solid) and 33 К (dashed). The value of η (J, M ) multiplied by the state degeneracy (2Л-\)д and RC (table 2.5.) yields the Raman intensity. n
Discussion - 3 1 -
population
tu
09
ne
07
06
05
01
03
02
01
I
.
•
,
•
•
-
1- I 1
^
• t *
.
1
• F.ortho I I - 1 ] • Д mela I I - 2 I
• E para I I - O )
.
*. г
-
-
-
-
-
-
0 5625
0 3125
55 J/O
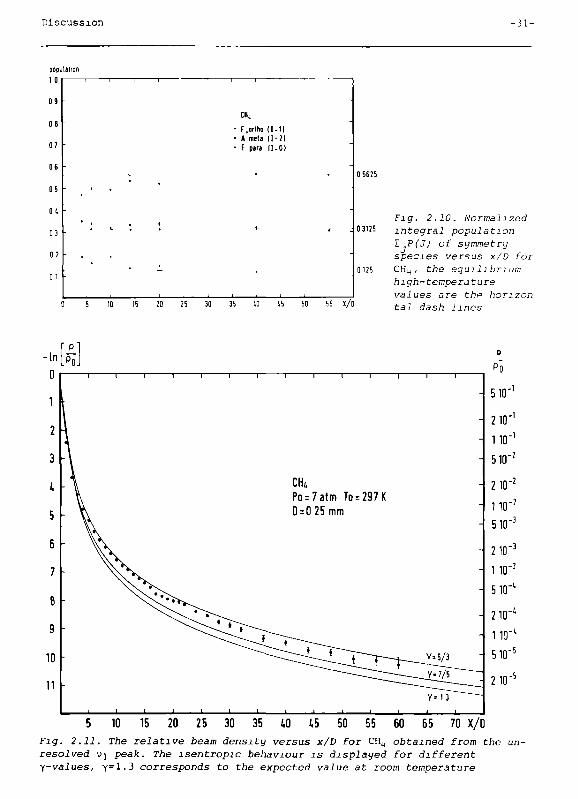
Fig. 2.10. Normalized integral population Σ Ρ (J) of symmetry species versus x/D for CH^, the equilibrium high-tempe га tu re values are the horizontal dash lines
' l n l p o J ρ
Po
510'
210'
110'
510"
210'
110'
510'
210'
110'
510'
2 ΙΟ
Ι 10'
510'
210'
5 10 15 20 25 30 35 ί,Ο ί,δ 50 55 60 65 70 Χ/θ
Fig. 2.11. The relative beam density versus x/D for СНц obtained from the unresolved vj peak. The isentropic behaviour is displayed for different y-values, γ=·1.3 corresponds to the expected value at room temperature
и
1
2
3
5
6
7
6
9
10
11
I
-\
- Λ
V -
-
-
1 1 1
^ $ 5 ^
1 1 1 1 1 1 1 1
Po = 7 a t m To = 297K 0 = 0 2 5 mm
• ~~\̂^
_ | 1 1 1 1 1 1 1
1 1
;
-
-
-
-
. Y"5/3
Υ θ " Ρ
- 3 2 - Chapter 2
Τ/Το
ι и
υ β
06
(Η
02
1- I
' I
t
•
•
Tvib
-' i
Trot
• • •
SF6
P o = 6 a t m To=293 К D = 0 25 mm
1 ¡ !
" • · ·
•
2
T(K)
300
210
180
120
11 X/D
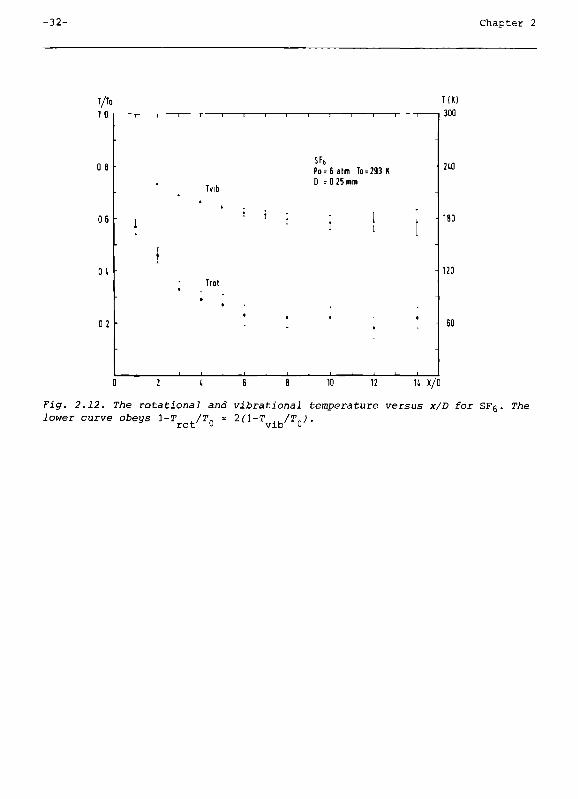
Fig. 2.12. The rotational and vibrational temperature versus x/D for SFg. The lower curve obeys 1-T /Tn = 2(\-T .,/T,).
rot u vib и
Introduction -33-
CHAPTER 3 - MOLECULAR BEAMS OF СГзВг PROBED BY SPONTANEOUS RAMAN EFFECT AND
EXCITED WITH A CO2 LASER
The state population of СГзВг is found to be entirely non-thermal under certain molecular-beam conditions ; the various vibrational modes show distributions which can be described using mode temperatures differing by as much as a factor of 1.7. Considerable vibrational excitation Cvj, р+̂ з̂ was produced with a focused cw CO2 laser. A structured excitation spectrum was observed.
3.1. Introduction
Molecules like SF6 and СРзВг possess many internal degrees of freedom. For a
supersonic expansion it is well known that a state distribution may occur
which can be described by different temperatures Г ^ and Τ . concerning the
rot vib
rotational and vibrational degrees of freedom (see e.g. ref. (1)). In this
letter we demonstrate that also for different modes, ν , one may have to in
troduce temperatures Τ which differ greatly. These temperatures Τ refer to a
two-level idealization, i.e. the populations of states higher than the ground
and first excited level for each vibrational mode were not considered in this
paper. For the special case of Tg, see below. We are aware that distributions
may occur which cannot be described by vibrational temperatures if more than
two levels are taken into account; for diatoms one obtains Treanor distribu
tions (see e.g. ref. (2)).
From a theoretical point of view the occurrence of different two-level tempe
ratures Τ is not too surprising because the rate constants k(v -»-v ) and
1 ^ 1 ]
k(v -»T) are known to differ vastly. From a practical point of view, however,
the resulting distributions are often unknown in a supersonic expansion, and
are of great importance e.g. for gas-dynamic laser operation (which depends on
population inversion by supersonic expansion(3)) or multi-photon-dissociation
(MPD) processes. The MPD steps leading to the quasi continuum, and their iso
topie specificity, depend sensitively on the state distribution.
The molecule СРзВг has been chosen for demonstration of multiple vibrational
temperatures, because the absence of an inversion centre renders all modes
Raman active (see relative Raman intensities and IR absorption strengths in
(1) G. Lui]ks, Ξ. Stolte and J. Reuss, Chem. Phys. 62(1981) 217, chapter 2 of
this thesis.
(2) C E . Treanor and J.W. Rich, J. Chem. Phys. 48(1968) 1798.
(3) E.T. Gerry, IEEE-Spectrum, November 1970, p. 51.
-34- Chapter 3
in table 3.1.) , and because MPD and multi-photon absorption (MPA) have been
studied yielding an interesting structured spectrum (4-7) .
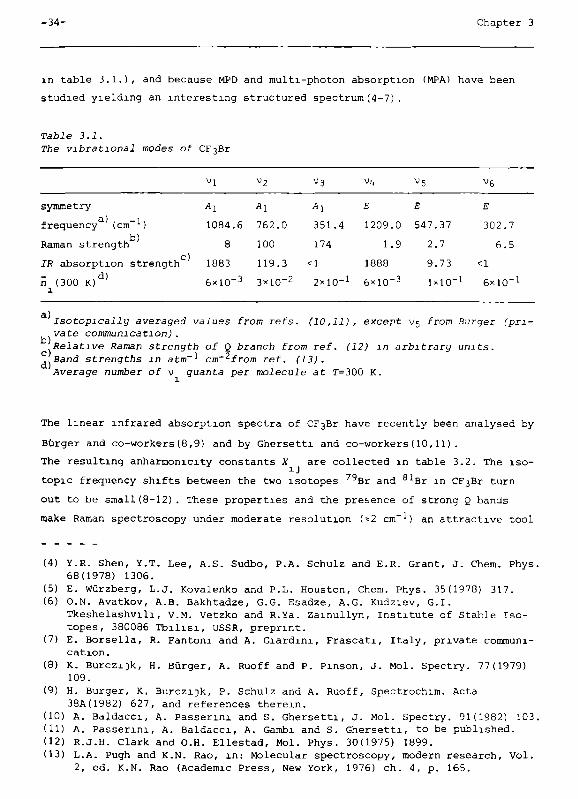
Table 3.1.
The vibrational modes of СГзВг
υ1 Vj V3
v6
symmetry
a) / -1 \ frequency (cm )
vb) Raman strength
IR absorption strength
π (300 K )d )
ι
О
*1
1084.6
8
1883
Al
762.0
100
119.3
¿1
351.4
174
<1
E
1209.0
1.9
1888
E
547.37
2.7
9.73
E
302.7
6.5
<1
6xl0" 3 3x10" 2x10" бхІО- 3 IxlO
- 1 6x10 -1
a)
b)
Isotopically averaged values from refs. (10,11), except V5 from Burger (pri
vate communication,) .
Relative Яаліал strength of Q branch from ref. (12) m arbitrary units. ..Band strengths m atm
-' cm
_2from ref. (13).
QJ
Average number of ν guanta per molecule at T=300 K.
The linear infrared absorption spectra of СГзВг have recently been analysed by
Burger and co-workers (8,9) and by Ghersetti and co-workers(10,11).
The resulting anharmomcity constants X are collected in table 3.2. The iso
topie frequency shifts between the two isotopes 7 9
B r and 8 i
B r in СГзВг turn
out to be small(8-12). These properties and the presence of strong Q bands
make Raman spectroscopy under moderate resolution (=2 c m-M an attractive tool
Lee, A.S. Sudbo, P.A. Schulz and E.R. Grant, (4) Y.R. Shen, Y.T
68(1978) 1306.
(5) E. Würzberg, L.J. Kovalenko and P.L. Houston, Chem. Phys. 35
(6) O.N. Avatkov, A.B. Bakhtadze, G.G. Esadze, A.G. Kudziev, G.I
Tkeshelashvili, v.M. Vetzko and R.Ya. Zainullyn, Institute о
topes, 380086 Tbilisi, USSR, preprint.
(7) E. Borsella, R. Fantom and A. Giardini, Frascati, Italy, pr
cation.
(8) K. Burczi]k, H. Burger, A. Ruoff and P. Pinson, J. Mol. Spec
109.
(9) H. Burger, K. Burczijk, P. Schulz and A. Ruoff, Spectrochim.
38A(1982) 627, and references therein.
(10) A. Baldacci, A. Passerini and Ξ. Ghersetti, J. Mol. Spectry
(11) A. Passerini, A. Baldacci, A. Gambi and S. Ghersetti, to be
(12) R.J.H. Clark and O.H. Ellestad, Mol. Phys. 30(1975) 1899.
(13) L.A. Pugh and K.N. Rao, in: Molecular spectroscopy, modern
2, ed. K.N. Rao (Academic Press, New York, 1976) ch. 4, p.
J. Chem. Phys.
(1978) 317.
f Stable Iso-
ivate communi-
try. 77(1979)
Acta
. 91(1982) 103.
published.
research. Vol.
165.
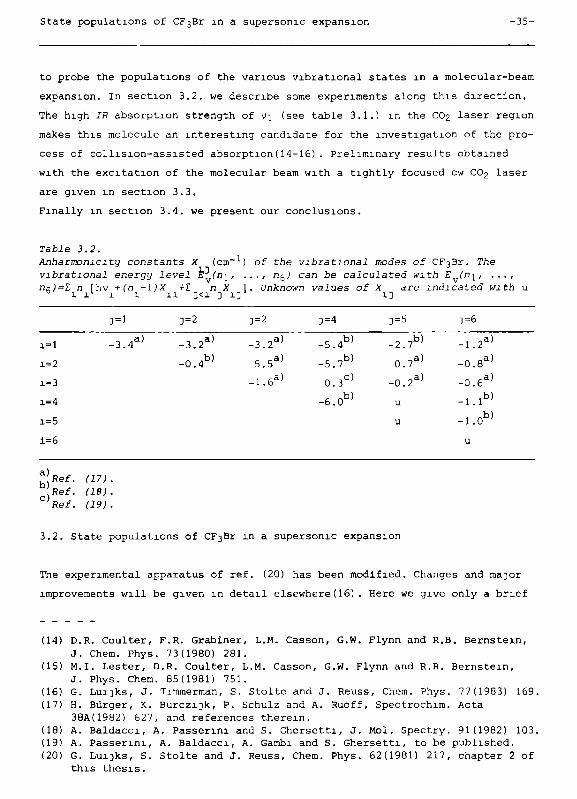
State populations of СГзВг in a supersonic expansion -35-
to probe the populations of the various vibrational states in a molecular-beam
expansion. In section 3.2. we describe some experiments along this direction.
The high ІЯ absorption strength of vj (see table 3.1.) in the CO2 laser region
makes this molecule an interesting candidate for the investigation of the pro
cess of collision-assisted absorption(14-16). Preliminary results obtained
with the excitation of the molecular beam with a tightly focused cw CO2 laser
are given in section 3.3.
Finally in section 3.4. we present our conclusions.
Table 3.2. Anharmomcity constants X (cm
-1) of the vibrational modes of СГзВг. The
vibrational energy level Erfni, ..., n^) can be calculated with E Cnj, ..., nfJ=E η íhv +(n -1)X +Σ η X 1. Unknown values of X are indicated with u
D 1 1
1 1 1 11 3<i ] ij' i]
1=1
1=2
1=3
1 = 4
1 = 5
1=6
keff-^ J t e f .
3 = 1
- 3 . 4 a )
(17). (18). (19).
1 = 2
- 3 . 2 a »
- 0 . 4 b )
1=2
- 3 . 2 a )
5 . 5 a )
- 1 . 6 a )
D=4
- 5 . 4 b )
- 5 . 7 b )
о . з с )
- 6 . 0 b )
3=5
- 2 . 7 b )
0 . 7 a )
- 0 . 2 a )
u
u
1=6
- 1 . 2 a )
- 0 . 8 a )
-o.ea)
- l . l b )
- i . o b )
u
3.2. State populations of СГзВг in a supersonic expansion
The experimental apparatus of ref. (20) has been modified. Changes and ma^or
improvements will be given in detail elsewhere(16). Here we give only a brief
(14) D.R. Coulter, F.R. Grabiner, L.M. Casson, G.W. Flynn and R.B. Bernstein,
J. Chem. Phys. 73(1980) 281.
(15) M.I. Lester, D.R. Coulter, L.M. Casson, G.W. Flynn and R.B. Bernstein,
J. Phys. Chem. 85(1981) 751.
(16) G. Lui]ks, J. Timmerman, S. Stolte and J. Reuss, Chem. Phys. 77(1983) 169.
(17) H. Burger, K. Burczijk, P. Schulz and A. Ruoff, Spectrochim. Acta
38A(1982) 627, and references therein.
(18) A. Baldacci, A. Passerini and S. Ghersetti, J. Mol. Spectry. 91(1982) 103.
(19) A. Passerini, A. Baldacci, A. Gambi and S. Ghersetti, to be published.
(20) G. Luijks, S. Stolte and J. Reuss, Chem. Phys. 62(1981) 217, chapter 2 of
this thesis.
-36- Chapter 3
outline. A beam of СРзВг molecules is expanding from a nozzle (with diameter
D=0.25 mm and at room temperature) into a roots pump (500 m /h) and is ana
lysed by spontaneous Raman scattering. This probing occurs at variable χ/Ό,
where χ represents the distance between the nozzle and the intersection of the
molecular beam with the focused Ar-ion laser beam (λ=488 ran, 1/e2 waist = 50
ym, and 500 W intracavity power).
The vibrational temperatures Γ are obtained from a comparison between the
anti-Stokes intensity, I , and the Stokes intensity I . The different modes
aS - ' S
are considered to behave like independent two-level systems:
кГ
In I „ (v-v )
r
aS 0 ι
S O l hv
1 (3.1.)
Here, Vp stands for the laser frequency, ν for the excitation frequency of the
mode ι (see table 3.1.). (We have tested the applicability of eq. (3.1.) by
bulk measurements at room temperature). High mode frequencies with a weak
Raman strength (e.g. vj and v^) render this approach impractical due to the
expected low signals of J (see table 3.1.). Eq. (3.1.) can be used (a) if
aS
the vibrational ladder ι is such that at the observed temperature Γ the popu
lation of levels higher than the first excited one can be neglected (only for
vg this simplification is not admissible because e.g. ; 20% of the ground-
-state population is found in the second excited state, at Tg=250 Κ), and (b)
if as an additional assumption a Boltzmann distribution is taken to be present
e.g. for this Vg mode.
A rotational Boltzmann distribution was supposed to be present; its tempera
ture, Τ , has been determined from the unresolved rotational Raman spectrum
of СРзВг, where the spacing of the maxima of the OP and RS wings was taken to
be proportional to Γ ; the proportionality factor was obtained from a bulk
measurement at room temperature.
These measurements have been carried out for two stagnation pressures Pg = 1.2
and 6 atm. The resulting values of Γ and Τ ^ are displayed in fig. 3.1. as a ι rot
function of χ/Ό. For reasons of clarity the values of Γ5 have been omitted
from fig. 3.1. For P0 = 1.2 atm Γ5 was measured slightly below Γ
6(0<Г
6-Т
5<20 К)
and for Pg = 6 atm slightly above Г6(0<Т5-Г
6<20 К). As expected the vibratio
nal temperatures drop less than the rotational temperatures and reach their
terminal values at rather small χ/Ό. The temperature of the vibrational mode
V5 with the lowest vibrational spacing, Tg, drops slowly, whereas Γ3 of the
vibrational frequency ]ust lying above vg(V5-V3»50 cm ) decreases most. For
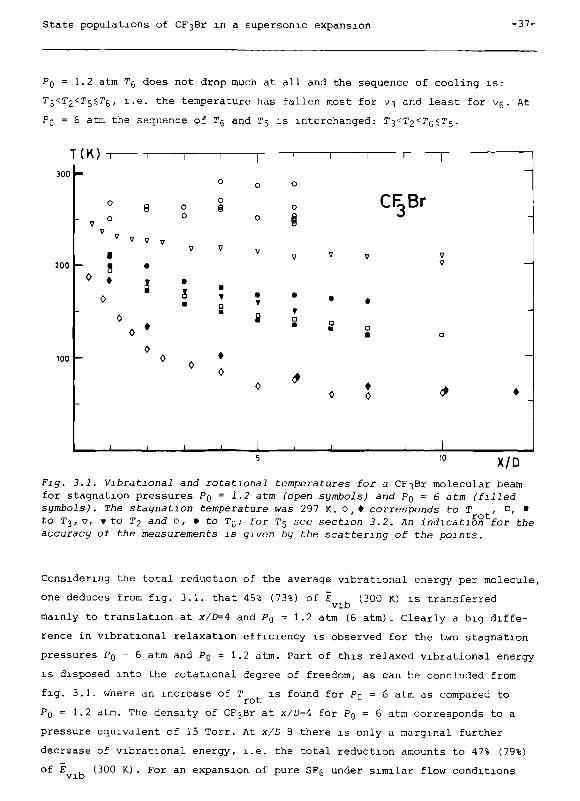
State populations of СГзВг in a supersonic expansion -37-
PQ = 1.2 atm Tg does not drop much at all and the sequence of cooling is:
Гз<Г2<Т'5<Т'6, i.e. the temperature has fallen most for V3 and least for Vg. At
PQ = 6 atm the sequence of T6 and Г5 is interchanged: Гз<Г2<Т5<Т5.
К Ю - г -3 0 0
2 0 0
100
О
- 7 0
У ν
• 8
0 i 0
0
ι
—
у
0
ι
θ
7
• ä
0
ν
0
— Ι
Ο
о
7
• S •
0
ι
о
0 §
7
• ? D •
0
I
о
о
у
• τ
s
0
I
ι
0
0
§
V
• f α •
ι
7
•
О •
0
— Г
7
•
О
•
• 0
1
CFjBr
1
I
7 7
α
I
-
—
•
5 ,0 X/D
Fig. 3.1. Vibrational and rotational temperatures for а СГзВг molecular beam for stagnation pressures Pg = 1.2 atm (open symbols) and PQ = 6 atm (filled symbols) . The stagnation temperature was 297 K. 0,* corresponds to Τ , π, • to Тз/ , • to T2 and o, · to T
G; for T5 see section 3.2. An indication for the
accuracy of the measurements is given by the scattering of the points.
Considering the total reduction of the average vibrational energy per molecule,
one deduces from fig. 3.1. that 45% (73%) of В , (300 К) is transferred vib
mainly to translation at x/D=4 and Pg = 1.2 atm (6 atm). Clearly a big diffe
rence in vibrational relaxation efficiency is observed for the two stagnation
pressures P0 = 6 atm and PQ = 1.2 atm. Part of this relaxed vibrational energy
is disposed into the rotational degree of freedom, as can be concluded from
fig. 3.1. where an increase of Τ is found for Pg = б atm as compared to
Pg = 1.2 atm. The density of СРзВг at x/D=4 for Pg = 6 atm corresponds to a
pressure equivalent of 15 Torr. At x/D=8 there is only a marginal further
decrease of vibrational energy, i.e. the total reduction amounts to 47% (79%)
of £ (300 K). For an expansion of pure SFg under similar flow conditions
-38- Chapter 3
(Pn = 6 atm) one calculates from fig. 2.12. a reduction of 71% (T =200 K) at u vib
x/I>=4 and 79% (Γ =180 K) at x/D=8. From these values one concludes that the vib
vibrational cooling goes somewhat easier for SFg than for СГзВг, because
E (SFf:)=596 cm- 1 and В ,_ (CF,Br) =370 cm
- 1, at 300 К.
vib vib J
3.3. Vibrational excitation with a CO2 laser
A line tunable cw CC^-laser beam is crossed with the molecular beam. A well-
-defmed point of intersection has been established by focusing sharply (1/e
waist;0.4 mm). Both the CC^-and the Ar -laser beam are directed perpendicu
larly to the molecular beam axis, whereas the two laser beams propagate under
an angle of =48 , with respect to each other.
The effect of the C02-laser excitation upon the Raman spectrum at x/D=4 around
V2 is shown in fig. 3.2. The spreading out of the spectral structures is in
duced by the process of collision-assisted absorption and up-pumpmg, which
has been observed earlier for SFg (21-23). The application of the Raman
technique offers the possibility of observing the redistribution of the
absorbed energy in a mode-selective way.
To interpret the Raman spectra, let us first consider the results obtained
with the CO2 laser turned off. Besides a strong Q branch at - г^О, only a
weak Q branch originating from molecules with Лз=1 appears in fig. 3.1. The
other hot bands cannot be resolved from the strong Q branch (vj, ̂ 5, Vg) due
to the small anharmonicity shift with respect to V2 (see table 3.2., experi
mental resolution -2 cm fwhm), or have too low an intensity (Vj, ц) due to
low occupation. The very weak signals in the broad background (Ім-^І^З cm )
originate from the OP and RS branches of the small depolarized Raman component
of \)2 (24). For the conditions Pg = 2 atm and x/D=4, we have calculated the
spectrum by interpolating the vibrational temperatures of fig. З.1.;
Γ (Ρ = 2 atm) = [ 5Γ (Ρ = 1.2 atm) + Τ (Pg = 6 atm)]/6.
(21) D.R. Coulter, F.R. Grabiner, L.M. Casson, G.W. Flynn and R.B. Bernstein,
J. Chem. Phys. 73(1980) 281.
(22) M.I. Lester, D.R. Coulter, L.M. Casson, G.W. Flynn and R.B. Bernstein, J.
Phys. Chem. 85(1981) 751.
(23) G. Luijks, J. Timmerman, Ξ. Stolte and J. Reuss, Chem. Phys. 77(1983) 169,
chapter 4 of this thesis.
(24) R.J.H. Clark andO.H. Ellestad, Mol. Phys. 30(1975) 1899.
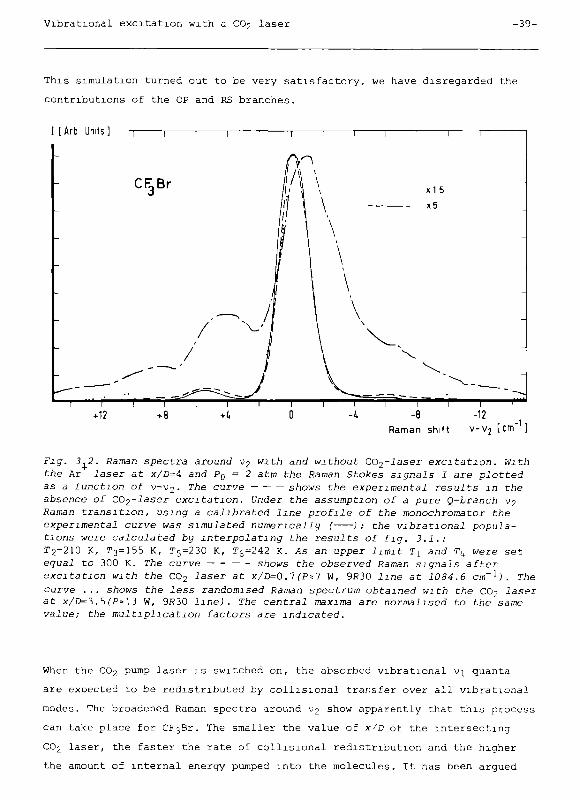
Vibrational excitation with a CO2 laser -39-
This simulation turned out to be very satisfactory, we have disregarded the
contributions of the OP and RS branches.
I [Arb Units] Τ Γ
СРзВг xi 5
χ5
ι 1 Γ
-12 Raman shift V-V2 [cm" ]
Fig. 3,2. Raman spectra around V2 with and without C02-laser excitation. With the Ar iaser at x/D=4 and P
0 = 2 atm the Raman Stokes signals I are plotted
as a function of V-V2. The curve shows the experimental results m the absence of C02-laser excitation. Under the assumption of a pure (¿-branch V2 Raman transition, using a calibrated line profile of the monochromator the experimental curve was simulated numerically ( ) ; the vibrational populations were calculated by interpolating the results of fig. 3.1.: Г2-210 К, Гз=155 К, Г
5=230 К, Г
6=242 К. As an upper limit Τχ and Tk were set
equal to 300 K. The curve shows the observed Raman signals after excitation with the CO2 laser at x/D=0.7(ΡχΊ W, 9R30 line at 1084.6 cm'1). The Curve ... shows the less randomised Raman spectrum obtained with the CO? laser at x/£>=3.5 (РИЗ W, 9Д30 line). The central maxima are normalised to the same value; the multiplication factors are indicated.
When the CO2 pump laser is switched on, the absorbed vibrational Vj quanta
are expected to be redistributed by collisional transfer over all vibrational
modes. The broadened Raman spectra around V2 show apparently that this process
can take place for СРзВг. The smaller the value of x/D of the intersecting
CO2 laser, the faster the rate of collisional redistribution and the higher
the amount of internal energy pumped into the molecules. It has been argued
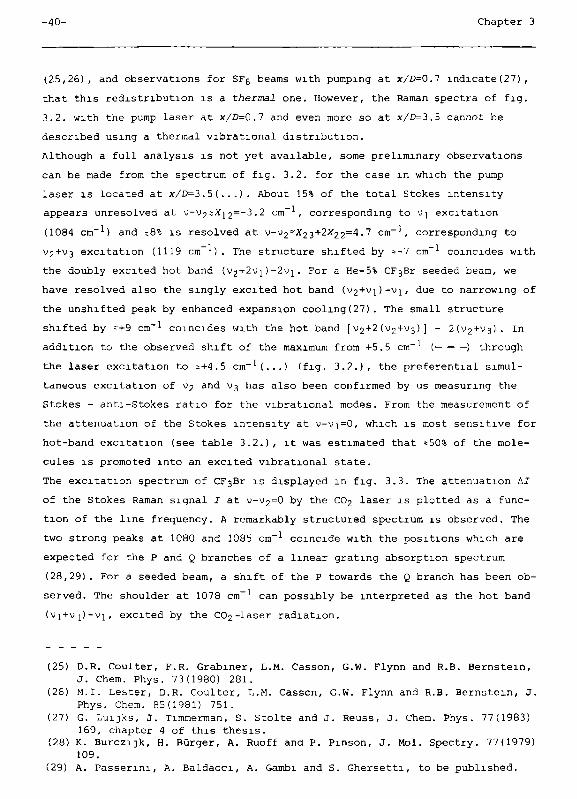
-40- Chapter 3
(25,26), and observations for SFg beams with pumping at x/D=0.1 indicate(27),
that this redistribution is a thermal one. However, the Raman spectra of fig.
3.2. with the pump laser at x/D=0.7 and even more so at x/D=3.S cannot be
described using a thermal vibrational distribution.
Although a full analysis is not yet available, some preliminary observations
can be made from the spectrum of fig. 3.2. for the case in which the pump
laser is located at x/D=3.5 (...) . About 15% of the total Stokes intensity
appears unresolved at v-\)2zX\ 2=~^ · 2 cm- , corresponding to Vj excitation
(1084 cm ) and ;8% is resolved at v-V2~^23+2-
x22
=^ · ' cm > corresponding to
2+ э excitation (1119 cm ). The structure shifted by ~-l cm-1 coincides with
the doubly excited hot band (V2+2vi )-2vj . For a He-5% СГзВг seeded beam, we
have resolved also the singly excited hot band (V2+Vi)-vi, due to narrowing of
the unshifted peak by enhanced expansion cooling(27). The small structure
shifted by -+9 cm~^ coincides with the hot band [V2+2(V2+V3)] - 2( 2+ з). In
addition to the observed shift of the maximum from +5.5 cm ( ) through
the laser excitation to =+4.5 cm (...) (fig. 3.2.), the preferential simul
taneous excitation of V2 and V3 has also been confirmed by us measuring the
Stokes - anti-Stokes ratio for the vibrational modes. From the measurement of
the attenuation of the Stokes intensity at v-vi=0, which is most sensitive for
hot-band excitation (see table 3.2.), it was estimated that =50% of the mole
cules is promoted into an excited vibrational state.
The excitation spectrum of CFjBr is displayed in fig. 3.3. The attenuation ΔΙ
of the Stokes Raman signal I at \>-V2=0 by the CO2 laser is plotted as a func
tion of the line frequency. A remarkably structured spectrum is observed. The
two strong peaks at 1080 and 1085 cm- 1 coincide with the positions which are
expected for the Ρ and Q branches of a linear grating absorption spectrum
(28,29). For a seeded beam, a shift of the Ρ towards the Q branch has been ob
served. The shoulder at 1078 cm- 1 can possibly be interpreted as the hot band
(vi+v^-vj, excited by the C02-laser radiation.
(25) D.R. Coulter, F.R. Grabiner, L.M. Casson, G.W. Flynn and R.B. Bernstein,
J. Chem. Phys. 73(1980) 281.
(26) M.I. Lester, D.R. Coulter, L.M. Casson, G.W. Flynn and R.B. Bernstein, J.
Phys. Chem. 85(1981) 751.
(27) G. Luijks, J. Timmerman, Ξ. Stolte and J. Reuss, J. Chem. Phys. 77(1983)
169, chapter 4 of this thesis.
(28) K. Burczi]k, H. Burger, A. Ruoff and P. Pinson, J. Mol. Spectry. 77(1979)
109.
(29) A. Passerini, A. Baldacci, A. Gambi and S. Ghersetti, to be published.
Conclusions - 4 1 -
Re ΔΙ/Ι(β/.) -1
1070 1080 1090
V(cm-0
Fig. 3.3. Excitation spectrum of СГзВг. A CO2 laser crosses the molecular beam at x/D=3.5. Its power (-\3 W} was kept constant for all laser lines. The excitation was measured as the resulting attenuation ΔΓ of the Raman Stokes signal I, collected from molecules at x/D=4 at \j-\>2=0.
3.4. Conclusions
From fig. 3.1. it is evident that molecular-beam expansion conditions may lead
to vastly non-thermal state populations. This situation can be described by
different vibrational temperatures and rotational temperatures which e.g.
assume the values of about 255 K(T6), 240 K(T
5), 220 K(T2), 150 К(Гз), and 85
K(T 1, at x/D=4 and Pn = 1.2 atm. The high value of Tc can be understood as rot
u 0
being caused by the rate-determining step by which energy flows from the
energetically lowest vibrational mode to the translational degrees of freedom.
However, the high value of T5 proves that vibrational relaxation encounters
different bottlenecks before the energy is taken up by the translational
degrees of freedom. At higher stagnation pressures (e.g. PQ = 6 atm, fig.
3.1.) , this barrier may be partially overcome. Simultaneously, Τ increases
-42- Chapter 3
due to the more complete relaxation of the vibrational degrees of freedom.
Hereby, energy is apparently deposited into the rotational degrees of freedom.
It seems that the mismatch between internal energy to be converted («300 cm
in the case of Vj,) and thermal energy is of predominant influence [ the value
of the Tí? absorption strength being of minor importance for the effectiveness
of collisions (see table 3.1.)] .
With a tightly focused cw CO2 laser at x/D<4 an appreciable fraction of the
СРзВг molecules can be excited vibrationally. For instance when this laser is
pointed at x/D=3.S, the absorbed energy (non-thermally stored in the mole
cules) is used to excite -15% to the νχ level and =8% to the \J2+^3 level. The
total of 23% is seen as attenuation of the x^ Raman signal at v-V2=0, for an
Д30 excitation (fig. 3.3.) . The other 27% being excited, as demonstrated by
hot-band shifts with respect to the Vj Raman line (see above), experience
smaller shifts with respect to the V2 Raman line due to smaller X values. As
a consequence they do not yield an observable ΔΙ/Γ signal since the resolving
power of our monochromator is limited to 2 cm" fwhm.
Acknowledgement
The permanent and decisive technical assistance of Jan Timmerman, Cor Sikkens
and John Holtkamp is gratefully acknowledged. The work has drawn large profit
from the collaboration with the Frascati group, notably through Elisabetta
Borsella. Dr. Steve Simpson (Oxford) read the manuscript and gave valuable
criticism.

Introduction -43-
CHAPTER 4 : RAMAN ANALYSIS OF SF6 MOLECULAR BEAMS EXCITED BY A CW CO2 LASER
In a molecular beam the effects of vibrational pumping of SFg ( ^=94в слГ ) are studied, using a line-tunable cw CO2 laser. Intracavity spontaneous Raman scattering is used for analysis. For excitation m the collision regime (X /D<\), a thermal redistribution of the V3 excitation over all vibrational modes is found, together with an average absorption up to six photons per molecule. The infrared absorption profile shows a red-shift of 6 cm" . For excitation 2η the relatively rare collision regime (X /D>4), a structured non--thermal Vj Даяіап spectrum 2s observed, especially m the case of seeded molecular beams (10% m He,) . The observed hot-band peaks can be explained m terms of single-photon absorptions and collision-induced near-resonant V-V energy transfer, leading to single, double and triple excitations of the V3 mode. The value of Τ m the beam is found to influence sensitively the non-resonant
energy-transfer rate (e.g. h\>-¡(948 cm~ )+àE ^hCv^ + Vg.) (962 cm-1 ) relative to the near-resonant transfer rate (hv^+iìvj^iwj^is. 5 cm"',).
4.1. Introduction
In an earlier paper(1) we have demonstrated the applicability of spontaneous
Raman scattering to determine directly the rotational and vibrational tempe
rature of molecules like SFg in a supersonic expansion. For СГзВг we have ob
served different vibrational temperatures for different modes(2).
In the present study we investigate excitation of an SFg beam in the collisio-
nal regime with a focused cw CO2 laser at variable distances χ downstream of a
nozzle orifice (diameter D=0.25 m m ) . Detailed information about the state
distribution of the SFg molecules is obtained in a direct way by spontaneous
Raman scattering inside the folded cavity of a sharply focused Ar laser. The
locations of intersection with the molecular beam, which can be selected
independently for the two laser beams, are defined as x /D for the exciting
E
CO2 laser (waist diameter=2wo=0.4 mm) and x/D for the Raman-probing Ar laser
(2woS50pm). If the CO2 laser intersects the molecular beam as near to the
nozzle as possible (x/DzO.1) , the Raman analysis at * /D>2 shows that all the
photon energy absorbed by the V3 vibrational mode is thermally redistributed
among all modes, due to collisions. A maximum storage of six photons as
average vibrational energy per molecule has been observed. A moderate increase in rotational energy has been found [ ΔΓ (x /D=2)=200 к ] .
rot R
(1) G. Luijks, Ξ. Stolte and J. Reuss, Chem. Phys. 62(1981) 217, chapter 2 of
this thesis.
(2) G. Luijks, S. Stolte and J. Reuss, Chem. Phys. Letters 94(1983) 48,
chapter 3 of this thesis.
-44- Chapter 4
Pumping with the CO2 laser at larger * /D leads to preferential з-mode
excitation. In the case of seeded beams (10% SF6 in He) a structured Raman
spectrum was observed (x /D=x /D=4) , indicating a nearly pure V3 excitation.
E R
Recently, similar studies were performed by other groups. Eshenck and co-
-workers(3,4) have empToyed stimulated Raman scattering to resolve individual
rotational' states and to analyse their populations with and without a pulsed
C02-laser beam intersecting a molecular beam.
After a C02-laser pulse non-equilibrium vibrational distributions in low-
-pressure bulk SF6 have been observed in real time by monitoring the absor-
bance of a tunable probe laser (see ref. (5) and references therein).
A more direct probing of this process has been carried out by Bagratashvili et
al.(6) employing pulsed spontaneous Raman scattering and by Smirnov(7) employ
ing coherent anti-Stokes Raman scattering (CARS).
The studies mentioned above and earlier work (e.g. refs. (8-10)) led to the
following model for relaxation of SFg at room temperature. The pump laser
couples certain ground-state molecules to specific rotational levels of the
з=1 state. The very high R-R relaxation rate of SF5 molecules (larger than
gas-kinetic rates (5)) yields a rapid fill up of the rotational states de
pleted by the pump laser and consequently permits additional excitation. The
slower but still high rate of V-V energy transfer rapidly redistributes the
pumped molecules over all the excited vibrational states of SFg. Finally, the
excited vibrational manifolds relax via a V-T energy-transfer process, limited
by the rate-determining deactivation of the lowest vibrational level (V5=347
c m "1) .
(3) P. Eshenck, A.J. G n m l e y and A. Owyoung, Chem. Phys. 73(1982) 271.
(4) P. Eshenck and A. Owyoung, J. Mol. Spectry. 92(1982) 162.
(5) J.L. Lyman, L.J. Radziemski and A.C. Nilsson, IEEE J. Quantum Electron.
QE-16(1980) 1174.
(6) V.N. Bagratashvili, Yu G. Vainer, V.S. Dol]ikov, V.S. Letokhov, A.A.
Makarov, L.P. Molyavkin, E.A. Ryabov and E.G. Silkis, Opt. Letters 6(1981)
148.
(7) S.S. Alimpiev, S.I. Valyanskn, S.M. Nikiforov, V.V. Smirnov, B.G. Sartakov,
V.l. Fabelinskn and A.L. Shtarkov, JETP Letters 35(1982) 361.
(8) J.I. Steinfeld and P.L. Houston, in: Laser and coherence spectroscopy, ed.
J.I. Steinfeld (Plenum Press, New York, 1978) ch. 1, p. 1.
(9) J.I. Steinfeld, I. Burak, D.G. Sutton and A.V. Nowak, J. Chem. Phys.
52(1970) 5421.
(10) R.D. Bates, J.T. Knudtson, G.W. Flynn and A.M. Ronn, J. Chem. Phys.
57(1972) 4174.
The m t r a c a v i t y experimental arrangement -45-
Using a bolometer as detector Bernstein and co-workers(11,12) investigated the
excitation of an expanding supersonic SF6 beam with a cw CO2 laser. Apprecia
ble excitation could be observed only if the CO2 laser irradiated the SF6
molecules in the high-pressure regime upstream the nozzle opening. At maximum
about four laser photons per molecule could be deposited as internal energy.
Employing the electron-diffraction method and a focused cw CO2 laser Bartell
et al.(13) investigated the excitation of an expanding SFg jet emerging from a
long thin capillary. Their data suggest a thermal distribution among all
vibrational modes and a maximum absorbance of about two laser photons per SFg
molecule.
By bolometnc techniques Bassi et al. (14) measured the total excitation of a
supersonic SF^ beam with a high-energy pulsed laser (fluence 1 J/cm ) in the
collisionless regime. The decrease of the average number of photons absorbed
per molecule for increasing stagnation pressure (a maximum of eight has been
achieved) was attributed to the cooling of the internal, in particular rota
tional state distribution of SFg, diminishing the probability of multiphoton
absorption.
The outline of this paper is the following: in section 4.2. we describe our
improved apparatus, in section 4.3. we report about the experiments of which
the results are discussed in section 4.4. and summarized in section 4.5.
Section 4.6. contains some concluding remarks.
4.2. The mtracavity experimental arrangement
The Raman scattering apparatus is basically the same as the one described
previously(15). However, great improvement in sensitivity has been achieved by
exchanging the multipass laser arrangement for a folded mtracavity configu
ration as shown in fig. 4.1. The original output mirror of the Ar laser
(11) D.R. Coulter, F.R. Grabiner, L.M. Casson, G.W. Flynn and R.B. Bernstein, J. Chem. Phys. 73(1980) 281.
(12) M.I. Lester, D.R. Coulter, L.M. Casson, G.W. Flynn and R.B. Bernstein, J. Phys. Chem. 85(1981) 751.
(13) L.S. Bartell, S.R. Goates and M.A. Kacner, Chem. Phys. Letters 76(1980) 245.
(14) D. Bassi, A. Boschetti, M. Scotoni and M. Zen, Appi. Phys. B26(1981) 99. D. Bassi, A. Boschetti, G. Scoles, M. Scotoni and M. Zen, Chem. Phys. 71(1982) 239.
(15) G. Lui]ks, S. Stolte and J. Reuss, Chem. Phys. 62(1981) 217, chapter 2 of this thesis.
-46- Chapter 4
(Spectra Physics 170) has been removed and replaced by two curved high-quality
reflectors (Мэ, Кз=10 cm and M4, Ді+=5 cm), mounted inside the sample cell and
furnished with a sensitive translation and tilting system. Intracavity laser
powers up to 500 W can easily be reached, yielding a signal gain of a factor
25 with respect to the old multipass situation. The laser power is monitored
by a photomultiplier collecting photons inside the sample cell through a
glass-fiber optics probe. This provides us with the possibility to stabilize
the laser power or to compensate for power fluctuations as schematically shown
in fig. 4.2.
At the location of the beam waist (2wQ<50\im) the Ar laser crosses a molecular
beam expanding freely from a nozzle with diameter D=0.25 mm which can be
translated in the χ direction to adjust the nozzle-laser beam separation, i.e.
the value of *„/£>. The scattered Raman light is collected by a lens (Lj , f=8
cm) and a reflector (M5, i?5=2.5 cm) and analyzed by a double monochromator
(Ramanor HG2S, Jobin Yvon), followed by a cooled photomultiplier (EMI
9862B/350). The instrumental resolution is 2 спГ^, typically.
The size of the sampling area is fully determined by the dimensions of the
first slit of the monochromator, where the interaction region is imaged by the
lens (Lj), with a magnification factor 4. In our case the sensitive area has a
minimum length of 500ym and a width of 50um, permitting good spatial resolu
tion, especially in the χ direction.
A home-made line-tunable 50 W cw CO2 laser also crosses the sample cell
through two ZnSe windows (W2 and W3) and is focused at the molecular-beam axis
by a lens system (L2, Í2 = ̂ cm). The position χ /D of the focus (2WQ=0.40 mm)
can be set very accurately by a three-axis micrometer adjustment option of the
lens. The CO2 laser is modulated by a mechanical chopper.
A microprocessor (Rockwell AIM65, 32k) is employed to control the monochroma
tor scans as well as to process the data collected from the phase-sensitive
photon-counting system (Brookdeal 5C1). The spectra become available on a
screen, an x-y plotter or numerically on a printer, all controlled by the
microprocessor (fig. 4.2.).
4.3. The SF5 measurements
The SFg molecole possesses six normal vibrational modes (fig. 4.3.); three of
them are Raman active, vj (774 cm 1), \>2 (643 cm - 1
) and V5(523 c m- 1) ; two are
IR active, V3(948 cm- 1) and ν4(615 c m
- 1) . The Vg mode (347 cm
- 1) is not active
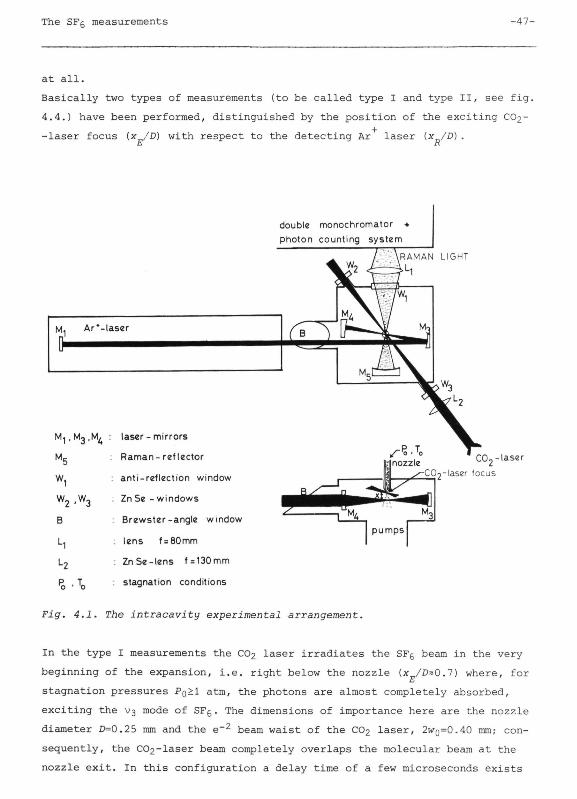
The SF6 measurements -47-
at all.
Basically two types of measurements (to be called type I and type II, see fig.
4.4.) have been performed, distinguished by the position of the exciting CO2-
-laser focus (x^D) with respect to the detecting Ar laser (x /D) . E R
M. Ar'-laser
M, ,Мз,Мд
w,
w2.W3
e .т„
laser-mirrors
Raman- reflector
ant i-ref lect ion window
Zn Se - windows
Brewster-angle window
lens f = 80mm
ZnSe-lens f = 130mm
stagnation conditions
double monochromator + photon counting system
CO,-laser
CO^-laser focus
Fig. 4.1. The intracavity experimental arrangement.
In the type I measurements the CO2 laser irradiates the SF6 beam in the very
beginning of the expansion, i.e. right below the nozzle {x /D»0.7) where, for
stagnation pressures Po>l atm, the photons are almost completely absorbed,
exciting the V3 mode of SFg. The dimensions of importance here are the nozzle
diameter D=Q.25 mm and the e - 2 beam waist of the CO2 laser, 2wo=0.40 mm; con
sequently, the C02-laser beam completely overlaps the molecular beam at the
nozzle exit. In this configuration a delay time of a few microseconds exists
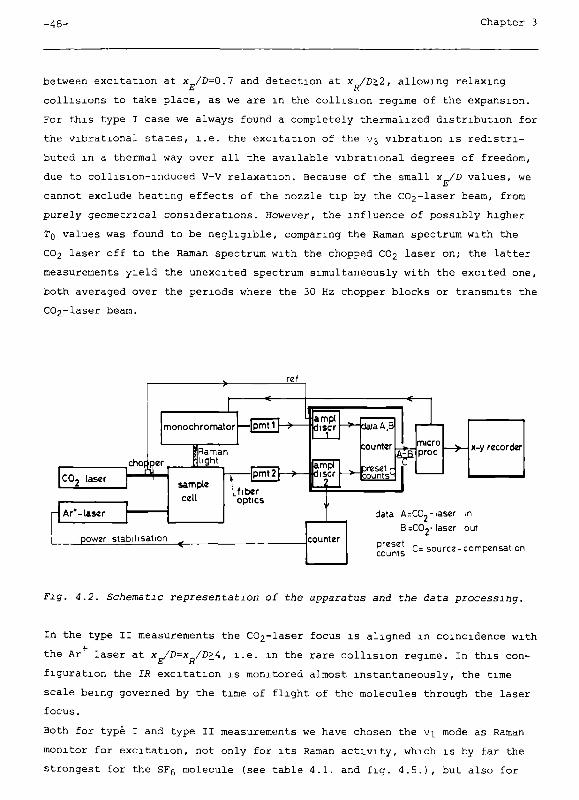
-48- Chapter 3
between excitation at χ /D-0.1 and detection at χ /D>2, allowing relaxing
collisions to take place, as we are in the collision regime of the expansion.
For this type I case we always found a completely thermalized distribution for
the vibrational states, i.e. the excitation of the V3 vibration is redistri
buted in a thermal way over all the available vibrational degrees of freedom,
due to collision-induced V-V relaxation. Because of the small x_/D values, we
E
cannot exclude heating effects of the nozzle tip by the CC^-laser beam, from
purely geometrical considerations. However, the influence of possibly higher
Tg values was found to be negligible, comparing the Raman spectrum with the
CO2 laser off to the Raman spectrum with the chopped CO2 laser on; the latter
measurements yield the unexcited spectrum simultaneously with the excited one,
both averaged over the periods where the 30 Hz chopper blocks or transmits the
C02-laser beam.
COj laser
Ar*-laser
re f
chopper
monochromator —Ipmt 11—»
χ ¡Raman light
sample cell
|pmt2
Ltiber optics
power stabilisation
ampi discr
ampi 1 ser _2_
counter
> - data A,В
counter
•eset r counts4
¥* micro proc —>- x-y recorder
data AITCCL- laser in BiCOj-laser out
counís C= source-compensation
Fig. 4.2. Schematic representation of the apparatus and the data processing.
In the type II measurements the CC^-laser focus is aligned in coincidence with
the Ar laser at χ ./D=x /D>4, i.e. in the rare collision regime. In this con
figuration the IR excitation is monitored almost instantaneously, the time
scale being governed by the time of flight of the molecules through the laser
focus.
Both for typé I and type II measurements we have chosen the Vj mode as Raman
monitor for excitation, not only for its Raman activity, which is by far the
strongest for the SF6 molecule (see table 4.1. and fig. 4.5.), but also for
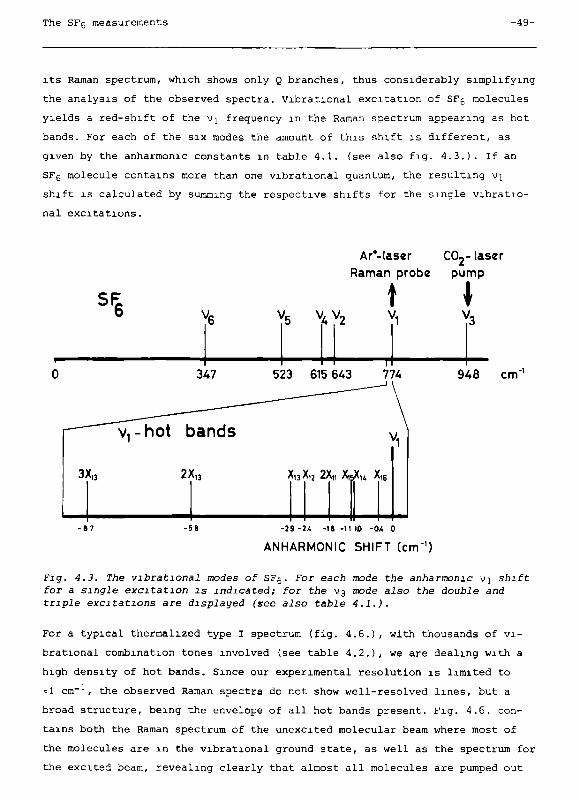
The SFg measurements -49-
its Raman spectrum, which shows only Q branches, thus considerably simplifying
the analysis of the observed spectra. Vibrational excitation of SFg molecules
yields a red-shift of the vj frequency in the Raman spectrum appearing as hot
bands. For each of the six modes the amount of this shift is different, as
given by the anharmonic constants in table 4.1. (see also fig. 4.3.) . If an
SFg molecule contains more than one vibrational quantum, the resulting Vj
shift is calculated by summing the respective shifts for the single vibratio
nal excitations.
COj-laser
S F 6
Ar*-laser
Raman probe pump
v A v 2
347 523 615 6A3 774 948 cm"
3X,, 2Х,э Λ13Λ12 2Xll X I S X R Л ^
- 6 7 -5 β -29 -2A -1β -11 10 -OA 0
ANHARMONIC SHIFT (crTT')
Fig. 4.3. The vibrational modes of SFg. For each mode the anharmonic vj shift
for a smgie excitation is indicated; for the V3 mode also the doiibie and
triple excitations are displayed (see also table 4.1.).
For a typical thermalized type I spectrum (fig. 4.6.), with thousands of vi
brational combination tones involved (see table 4.2.), we are dealing with a
high density of hot bands. Since our experimental resolution is limited to
=1 cm , the observed Raman spectra do not show well-resolved lines, but a
broad structure, being the envelope of all hot bands present. Fig. 4.6. con
tains both the Raman spectrum of the unexcited molecular beam where most of
the molecules are in the vibrational ground state, as well as the spectrum for
the excited beam, revealing clearly that almost all molecules are pumped out
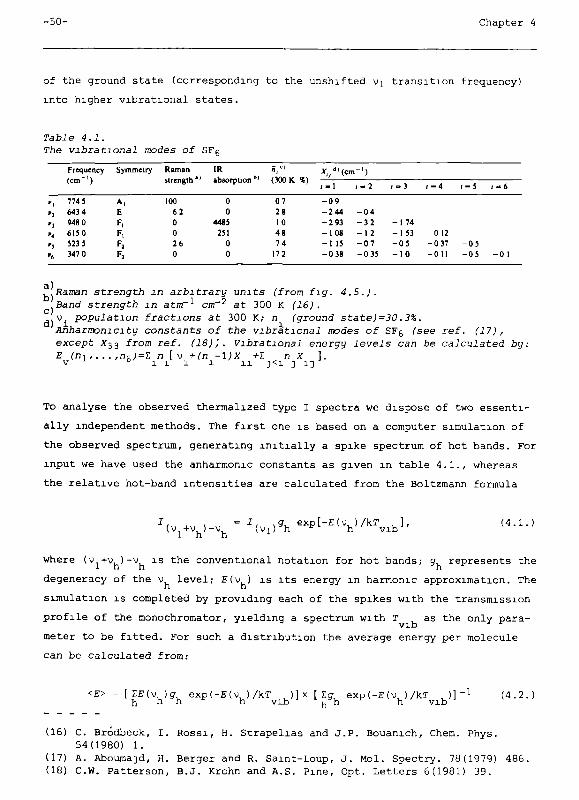
-50- Chapter 4
of the ground state (corresponding to the unshifted Vj transition frequency)
into higher vibrational states.
Table 4.1. The vibrational modes of SFg
" l
»?
» 1
»4
Ί
'»
Frequency (cm- 1 )
774 5 643 4
948 0
6150
523 5
347 0
Symmetry
A, E
F,
F. F! F,
Raman
slrenglh"
100
6 2
0
0
26
0
IR
absorption b )
0
0
4485
251
0
0
я , "
(300 К %)
0 7
2 8 10 4 8 7 4
17 2
• V (cm
i - l
- 0 9 - 2 4 4
- 2 9 3 - 1 0 8 - 1 15 - 0 38
1 - 2
- 0 4
- 3 2 - 1 2 - 0 7
- 0 35
1 - 3
- 1 7 4
- 1 5 3 - 0 5 - 1 0
1 - 4
0 12 - 0 3 7
- 0 1 1
1 - 5
- 0 5 - 0 5
1 - 6
- 0 1
Raman strength m arbitrary units (from fig. 4.5.). Band strength m atm
-1 cm
- 2 at 300 К (16) .
ν popuJation fractions at 300 Κ/ η (ground state)=30.3%. Anharmonicity constants of the vibrational modes of SFg (see ref. (17) , except X33 from ref. (18)). Vibrational energy levels can be calculated by: Ε (η,,. . . ,η
κ;=Σ η [ν +(η -1)Χ +ΐ η Χ ].
ν D
ι ι ι ι 11 ]<ι ] ΐ]
To analyse the observed thermalized type I spectra we dispose of two essenti
ally independent methods. The first one is based on a computer simulation of
the observed spectrum, generating initially a spike spectrum of hot bands. For
input we have used the anharmonic constants as given in table 4.1., whereas
the relative hot-band intensities are calculated from the Boltzmann formula
I , . *. = I , s9^ exp[-E(v,_)/kT 1, (v +v, )-v, (Vi) h * h vib 1 h h
(4.1.)
where (ν +v, )-v, is the conventional notation for hot bands; g, represents the 1 h h h
degeneracy of the ν level; E(v ) is its energy in hamonic approximation. The
simulation is completed by providing each of the spikes with the transmission
profile of the monochromator, yielding a spectrum with Γ as the only para
meter to be fitted. For such a distribution the average energy per molecule
can be calculated from:
<£> = [ГЕ( )g expt-EtvJ/kT J ] χ [ Σσ_ exp (-E(\J ) /kT J h h h h vib u h h vib
-1 (4.2.)
(16) C. Bródbeck, I. Rossi, H. Strapelias and J.P. Bouanich, Chem. Phys. 54(1980) 1.
(17) A. Aboumajd, H. Berger and R. Saint-Loup, J. Mol. Spectry. 78(1979) 486. (18) C.W. Patterson, B.J. Krohn and A.S. Pine, Opt. Letters 6(1981) 39.
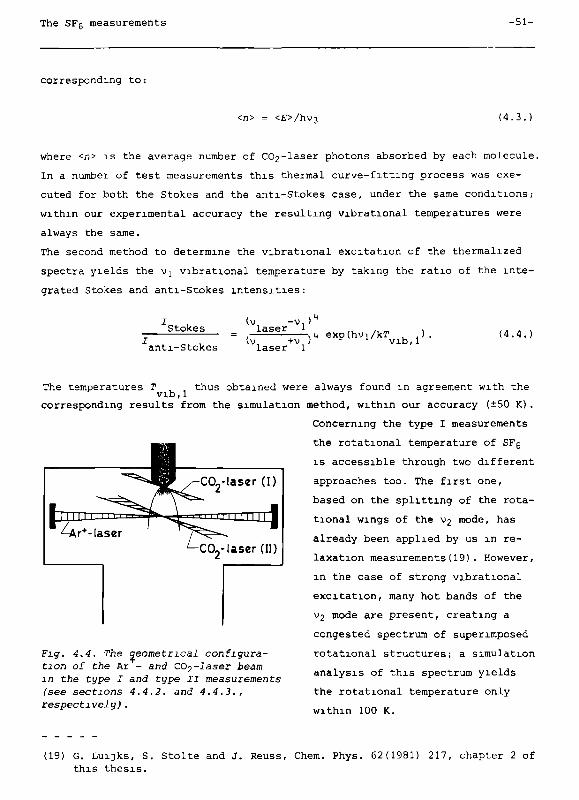
The SFg measurements -51-
corresponding to:
<n> = <£>/Ь з (4.3.)
where <n> is the average number of C02-laser photons absorbed by each molecule.
In a number of test measurements this thermal curve-fitting process was exe
cuted for both the Stokes and the anti-Stokes case, under the same conditions,-
within our experimental accuracy the resulting vibrational temperatures were
always the same.
The second method to determine the vibrational excitation of the thermalized
spectra yields the Vj vibrational temperature by taking the ratio of the inte
grated Stokes and anti-Stokes intensities:
Stokes (v v,)'
anti-Stokes
laser 1
(v. +v ) laser 1
u e x p t h V i / k T ^ y (4.4.)
The temperatures Τ thus obtained were always found in agreement with the vib, 1
corresponding results from the simulation method, within our accuracy (±50 K).
Concerning the type I measurements
the rotational temperature of SFg
is accessible through two different
approaches too. The first one,
based on the splitting of the rota
tional wings of the V2 mode, has
already been applied by us in re
laxation measurements(19). However,
in the case of strong vibrational
excitation, many hot bands of the
\>2 mode are present, creating a
congested spectrum of superimposed
rotational structures; a simulation
analysis of this spectrum yields
the rotational temperature only
within 100 K.
Fig. 4.4. The geometrical configuration of the Ar - and CC^-Jaser ¿>eam іл the type I and type II measurements (see sections 4.4.2. and 4.4.3. , respectively) .
(19) G. Luijks, Ξ. Stolte and J. Reuss, Chem. Phys. 62(1981) 217, chapter 2 of
this thesis.
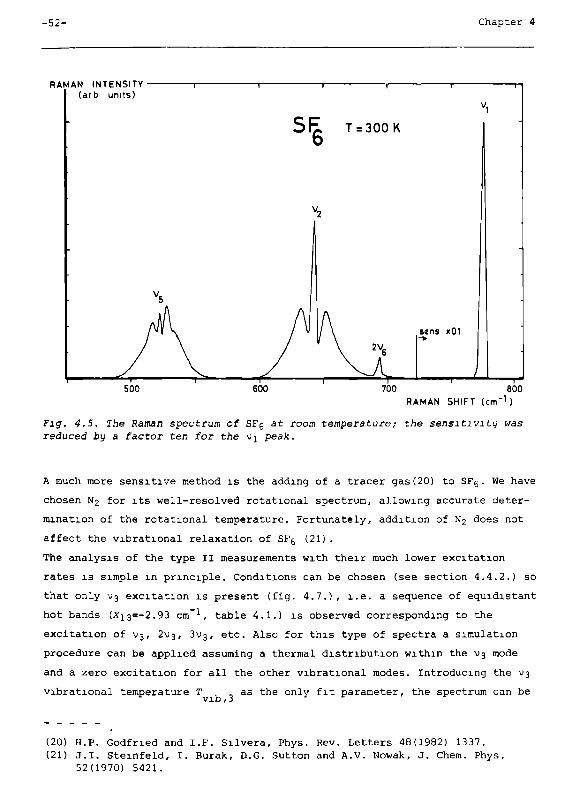
-52- Chapter 4
RAMAN INTENSITY (arb units)
Г 700 800
RAMAN SHIFT (cm"1 )
Fig. 4.5. The Raman spectrum of SFg at room temperature; the sensitivity was reduced by a factor ten for the vj peak.
A much more sensitive method is the adding of a tracer gas(20) to SF6. We have
chosen N2 for its well-resolved rotational spectrum, allowing accurate deter
mination of the rotational temperature. Fortunately, addition of N2 does not
affect the vibrational relaxation of SF6 (21).
The analysis of the type II measurements with their much lower excitation
rates is simple in principle. Conditions can be chosen (see section 4.4.2.) so
that only V3 excitation is present (fig. 4.7.), i.e. a sequence of equidistant
hot bands (Ліз=-2.93 cm *, table 4.1.) is observed corresponding to the
excitation of V3, 2 з, З 3, etc. Also for this type of spectra a simulation
procedure can be applied assuming a thermal distribution within the V3 mode
and a zero excitation for all the other vibrational modes. Introducing the V3
vibrational temperature Τ as the only fit parameter, the spectrum can be
(20) H.P. Godfried and I.F. Silvera, Phys. Rev. Letters 48(1982) 1337.
(21) J.I. Steinfeld, I. Burak, D.G. Sutton and A.V. Nowak, J. Chem. Phys.
52(1970) 5421.
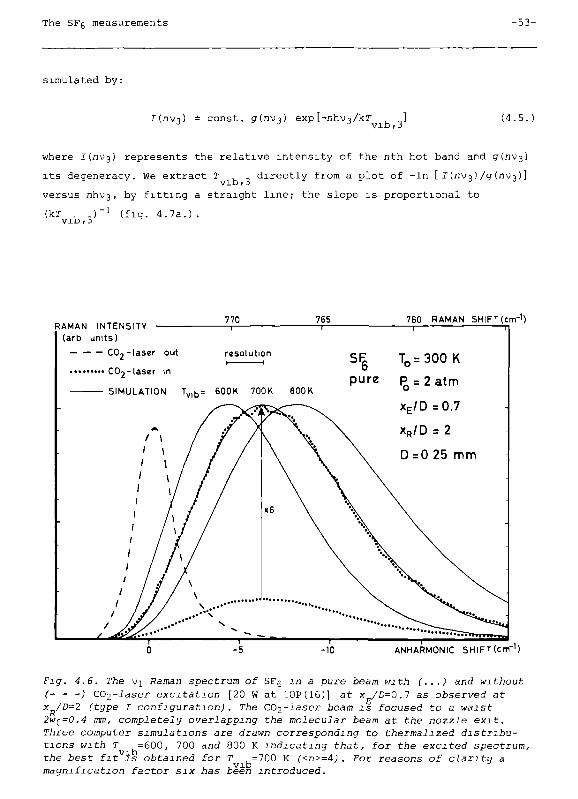
The SFg measurements - 5 3 -
simulated by:
Цп 3) const , ginxij) expl-nhv-j/kr vib ,3
(4.5.)
where І(л з) represents the relative intensity of the nth hot band and д(л з)
its degeneracy. We extract Τ , ., directly from a plot of -In [ Ι (ηυο) /g{n\)r>)] vib,3 J O
versus nhV3, by fitting a straight line; the slope is proportional to
(кГ vib,3 (fig. 4.7a.)
RAMAN INTENSITY (arb units)
CO,-laser out
770 765 760 RAMAN SHIFT (cm"1)
resolution
COj-laser in
SIMULATION T v l b = 600K 700K BOOK
Sl^ T o =300K
pure (3 = 2atm
xE/D =0.7
xR/D = 2
D=0 25 mm
ANHARMONIC SHIFTÍcnT1)
Fig. 4.6. The Vj Raman spectrum of SFg m a pure beam with (...) and without (- - -) C02-laser excitation [20 W at 10P(16)] at χ /0=0.7 as observed at χ /D=2 (type I configuration). The CC^-laser beam is focused to a waist 2WQ=0.4 mm, completely overlapping the molecular beam at the nozzle exit. Three computer simulations are drawn corresponding to thermalized distributions with Τ =600, 700 and 800 К indicating that, for the excited spectrum, the best fit is obtained for Τ ,=700 К (<n>=4) . For reasons of clarity a magnification factor six has been introduced.
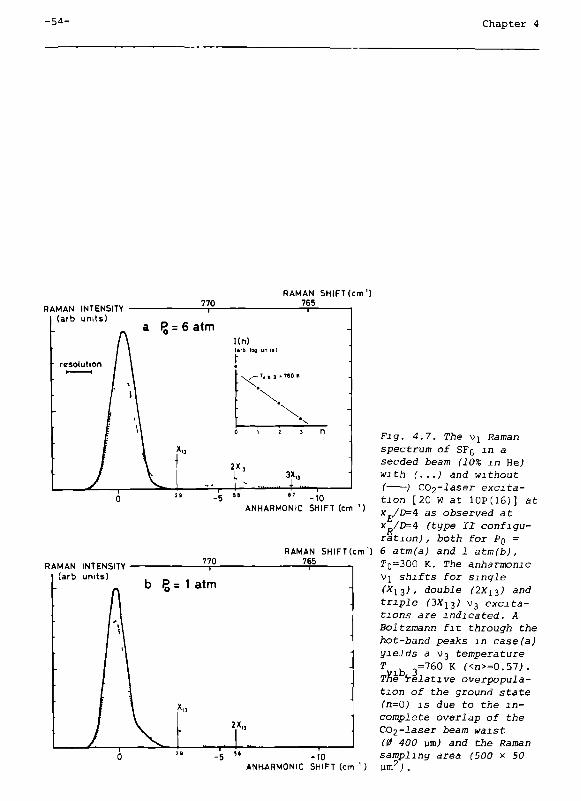
- 5 4 - Chapter 4
RAMAN INTENSITY (arb units)
RAMAN S H I F T ( c m ' ) 765
s ' " -10 ANHARMONIC SHIFT (cm
RAMAN INTENSITY (arb units)
Fig. 4.7. The Vj Raman spectrum of SFg in a seeded beam (10% m Be) with (...) and without ( ) CO2-laser excitation [20 W at 10P(16)] a t x^,D=4 as observed at χ /D=4 (type II configuration) , both for PQ =
RAMAN SHIFT(cm') 6 atm(a) and 1 atm(b) , T o = 3 0 0 κ · The anharmonic Vj shifts for single (X13) , double (2Хіз) and triple (ЗХц) з excitations are indicated. A Boltzmann fit through the hot-band peaks m case(a) yields a V3 temperature Τ 3=760 Κ (<:η>=0.5Ί) . The ^relative overpopulation of the ground state (n=0) is due to the incomplete overlap of the C02-laser beam waist (0 400 um) and the Raman sampling area (500 χ 50
ANHARMONIC SHIFT (cm ' ) u m 2 ; .
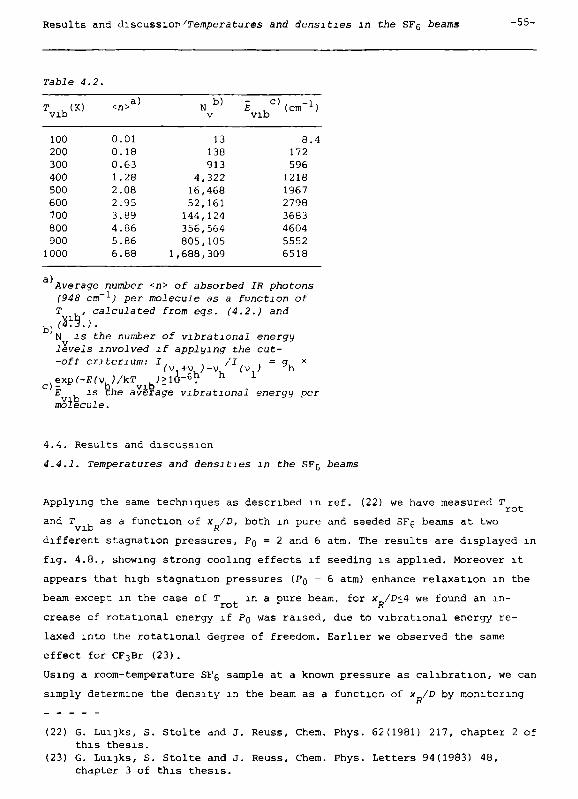
Results and discussier'Températures and densities in the SFg ¿earns -55-
Table 4.2.
Τ . (К) vib
100
200
300
400
500
600
700
800
900
1000
<n>a)
0.01
0.18
0.63
1.28
2.08
2.95
3.89
4.86
5.86
6.88
Nb )
V
13
138
913
4,322
16,468
52,161
144,124
356,564
805,105
1,688,309
ε ^'(сш-1)
vib
8.4
172
596
1218
1967
2798
3683
4604
5552
6518
Average number <n> of absorbed IR photons (948 cm
- 1; per moJecuie as a function of
Τ , , calcuJated from egs. (4.2.) and
N is the number of vibrational energy
levels involved if applying the cut--oft criterium: I, , /I , = g χ
.expf-BfvJ/kr WJ>1Ó-6. n
£ is еле average vibrational energy per vib ,
molecule.
4.4. Results and discussion
4.4.1. Temperatures and densities m the SFg beams
Applying the same techniques as described in ref. (22) we have measured Τ rot
and Τ , as a function of χ /Ό, both in pure and seeded SFc beams at two vib R c
different stagnation pressures, Pp = 2 and 6 atm. The results are displayed in
fig. 4.8., showing strong cooling effects if seeding is applied. Moreover it
appears that high stagnation pressures (Pg = 6 atm) enhance relaxation in the
beam except in the case of Τ m a pure beam, for χ /D<4 we found an m -
rot R
crease of rotational energy if Pg was raised, due to vibrational energy re
laxed into the rotational degree of freedom. Earlier we observed the same
effect for СГзВг (23).
Using a room-temperature SFg sample at a known pressure as calibration, we can
simply determine the density in the beam as a function of x_/-D by monitoring
(22) G. Lui]ks, Ξ. Stolte and J. Reuss, Chem. Phys. 62(1981) 217, chapter 2 of
this thesis.
(23) G. Lui]ks, S. Stolte and J. Reuss, Chem. Phys. Letters 94(1983) 48,
chapter 3 of this thesis.
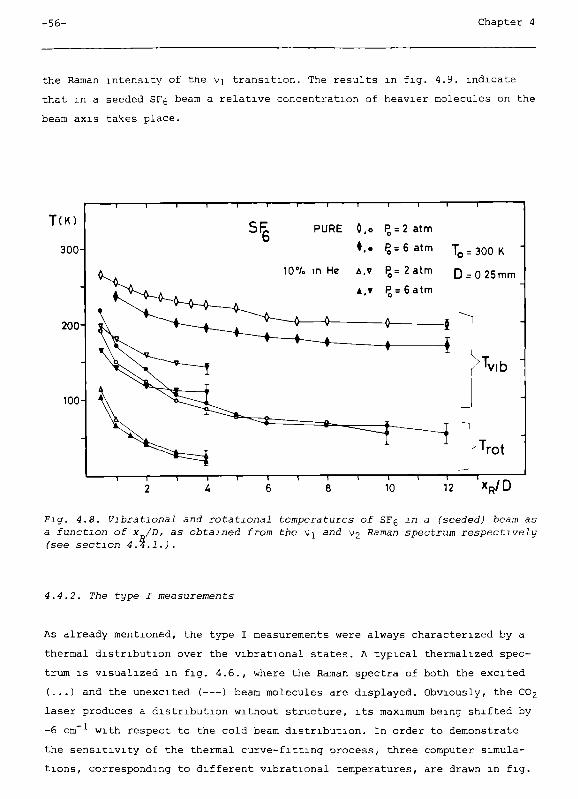
-56- Chapter 4
the Raman intensity of the Vj transition. The results in fig. 4.9. indicate
that in a seeded SFg beam a relative concentration of heavier molecules on the
beam axis takes place.
T(K)
300-
200·
100-
SF6 PURE Ο,ο P0 = 2 atm
• , . Ç = 6 a t m To = 300K
10'/. in He Δ.ν Ç = 2 a t m 0 = 0 25mm
Α , τ Ç = 6 atm
'vib
—ι— 10
' T r o t
12 X R / D
Fig-. 4.8. Vibrational and rotational temperatures of SFg in a (seeded) beam as a function of x„/D, as obtained from the Vj ала V2 Raman spectrum respectively (see section 4.4.1.) .
4.4.2. The type I measurements
As already mentioned, the type I measurements were always characterized by a
thermal distribution over the vibrational states. A typical thermalized spec
trum is visualized in fig. 4.6., where the Raman spectra of both the excited
(...) and the unexcited ( ) beam molecules are displayed. Obviously, the CO2
laser produces a distribution without structure, its maximum being shifted by
-6 cm with respect to the cold beam distribution. In order to demonstrate
the sensitivity of the thermal curve-fitting process, three computer simula
tions, corresponding to different vibrational temperatures, are drawn in fig.
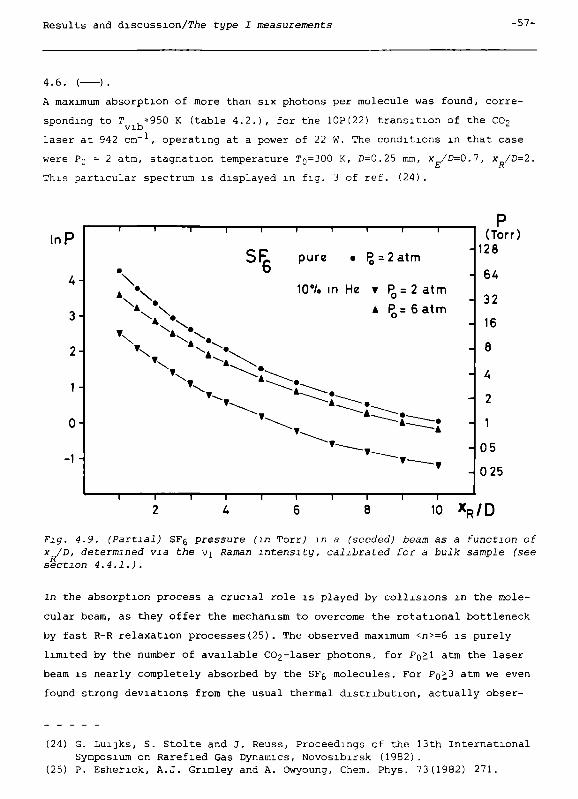
Results and discussion/The type J measurements -57-
4.6. ( ).
A maximum absorption of more than six photons per molecule was found, corre
sponding to Τ ,=950 К (table 4.2.), for the 10P(22) transition of the CO2
laser at 942 cm , operating at a power of 22 W. The conditions in that case
were PQ = 2 atm, stagnation temperature To=300 K, D=0.25 mm, χ /0=0.7, χ /D=2
This particular spectrum is displayed in fig. 3 of ref. (24).
τ 1 1 1 1 1 1 1 г 2 A 6 θ 10 x R / D
Fig. 4.9. (Partial) SFg pressure Сіл Torr; in a (seeded) beam as a function of χ /D, determined via the \>i Raman intensity, calibrated for a bulk sample (see section 4.4.1. ) .
In the absorption process a crucial role is played by collisions in the mole
cular beam, as they offer the mechanism to overcome the rotational bottleneck
by fast R-R relaxation processes(25). The observed maximum <n>=6 is purely
limited by the number of available CO2-laser photons, for Po>l atm the laser
beam is nearly completely absorbed by the SFg molecules. For P Q Ì ^ a t m w e e v e n
found strong deviations from the usual thermal distribution, actually obser-
(24) G. Lui]ks, S. Stolte and J. Reuss, Proceedings of the 13th International Symposium on Rarefied Gas Dynamics, Novosibirsk (19Θ2) .
(25) P. Eshenck, A.J. Gnmley and A. Owyoung, Chem. Phys. 73(1982) 271.
-58- Chapter 4
ving a hot and a cold fraction in the vj spectrum, caused probably by the
limited penetration depth of the CC^-laser beam. This feature suggests a.
streamline behaviour in the molecular beam since the excitation rate was
probed relatively far downstream [x /D=4).
The efficiency of collision-assisted absorption is clearly demonstrated by
moving the C02-laser focus downstream, towards the edge of the collision
regime. Between 0.7<x /D<4 one finds a steep decrease of excitation as moni-
tored by decreasing attenuation at the vj frequency.
The evolution of the Raman spectrum as a function of χ /D can be followed from
figs. 4.10a.-4.lOd., where distributions are shown for constant χ /D=4, but
different x^D, i.e. χ /D=l , 2, 3, 4. In addition it appears from figs. 4.10.
that the collision-induced thermalization process remains already uncompleted
for χ /D>1, e.g. at χ„/0=4 a hot fraction is observed (mainly a hot band cor-E E
responding to V3 excitation) but no vibrational temperature can be defined
(see fig. 4.10d.).
The IR excitation spectrum at 15 W CC^-laser power is shown in fig. 4.11. All
type I measurements lead to thermalized distributions, allowing the determi
nation of <n>. As function of the COj-laser frequency, the value of <n> (and
Τ , ) is plotted as obtained from the simulation procedure. As most remarkable vib
feature the broad profile (fwhm=10 cm- 1) without structure shows a considerable
red-shift (;6 cm ) with respect to the linear absorption spectrum of SF9,
centered at 948 cm , the V3 resonance. A possible explanation in terms of
collisionless multiphoton resonances, where red-shifts are expected due to an-
harmonicities in the V3 vibrational ladder, is not supported by our type II
measurements (see section 4.4.3.).
Power broadening and collision broadening can be excluded because their
effects are expected to be smaller than 0.1 cm and do not lead to shifts.
However, the observed red-shifts can be understood if one considers hot Q
bands half way of the total excitation of fig. 4.11., i.e. for ΞΓς molecules
having absorbed already two photons of the final four, the third photon is ab
sorbed at a frequency which is shifted between 1 and 12 cm-' to the red, as
can be seen from the X values in table 4.1. Thus a broad absorption maximum
ID is expected around 942 cm
- 1.
In order to explain the absorption of the first photon one has to keep in mind
that at 100 Torr each SFß molecule experiences IQ-̂ -lO1* rotationally inelastic
collisions during its passage through the full waist (0.4 mm) of the CO2-laser
beam. Thus, collisional hole filling supplies the answer why practically all
Results and discussion/The type I measurements -59-
molecules are able to absorb the first photon, even if its frequency is shif
ted by =10 cm to the red(26). However, the rotational temperature in the
beam at χ /D must be such that sufficient population is maintained in the ro
tational states, which are pumped by the CO2 laser. For example, at a position
shifted 10 cm- 1 with respect to the Q branch, corresponding to J=55 in the
Ρ branch, we calculate a population ratio:
P(J) (T =200 K)/P(J)(r =50 K) = 53 rot rot
if one assumes Boltzmann distributions. For this reason we observe a less-
-effective pumping in the case of seeded beams (10% SFg in He), since at
χ /D=0.7, Τ is much lower than in a pure SFg beam (see fig. 4.8.) .
At a fixed C02-laser frequency we have investigated the relaxation behaviour
of the vibrationally excited molecules by measuring Τ , as a function of in-
vib
creasing * /£> at PQ = 2 atm. Within our accuracy we found neither deviations
from thermal distributions, nor a decrease of Τ , for χ /D>2, i.e. a frozen
vib R Τ is observed further downstream. vib
Therefore we conclude that a technique has been developed to produce and moni
tor a molecular beam of persisting high internal energies, which can be modu
lated at a fast rate, offering new possibilities for practical applications.
As a consequence of the CC^-laser excitation, the vibrational temperature is
increased much stronger than the rotational temperature as determined both by
the N2 tracer method and a simulation program to the V2 Raman spectrum. For
instance at χ /D=2, for a 5% N2 in SFg beam at Pg = 2 atm and 20 W of CO2-
-laser power at the P(16) transition, we found Τ , =700125 К and Τ =300±20
vib rot
K, the latter from the N2 rotational spectrum. Using these temperatures a
simulation of the V2 spectrum reproduced the experimental spectrum very satis
factory. The big mismatch existing between the vibrational quanta (94Θ cm" )
and the rotational energies (B=0.1 cm ) is held responsible for the observed
temperature discrepancy, as it inhibits energy input from V-R transfer. In
addition, continuing efficient rotational cooling during the molecular beam
expansion for x/D>x /D provides an outlet and prevents the rotational degrees
of freedom from accumulating much energy from the laser excitation (see ref.
(26) C.C. Jensen, T.G. Anderson, C. Reiser and J.I. Steinfeld, J. Chem. Phys.
71(1979) 3648.
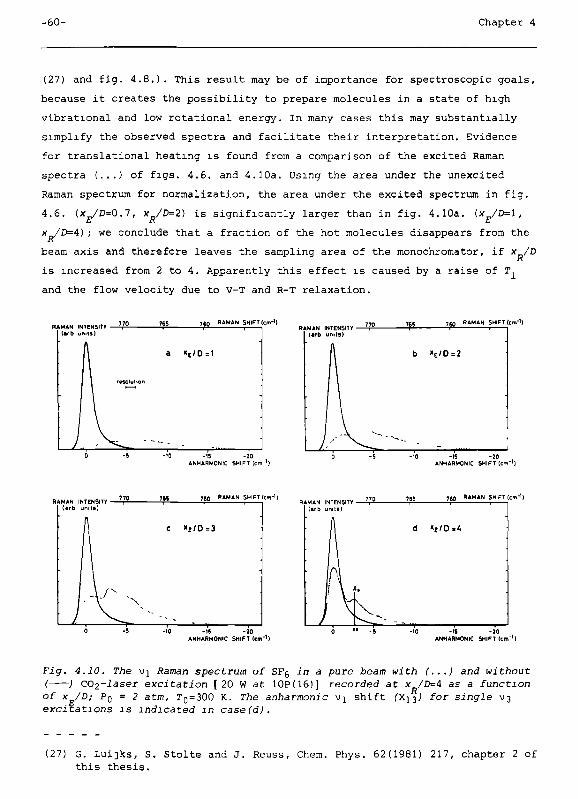
-60- Chapter 4
(27) and fig. 4.8.). This result may be of importance for spectroscopic goals,
because it creates the possibility to prepare molecules in a state of high
vibrational and low rotational energy. In many cases this may substantially
simplify the observed spectra and facilitate their interpretation. Evidence
for translational heating is found from a comparison of the excited Raman
spectra (...) of figs. 4.6. and 4.10a. Using the area under the unexcited
Raman spectrum for normalization, the area under the excited spectrum in fig.
4.6. (хУП=0.7, χ /0=2) is significantly larger than in fig. 4.10a. (x /D=l,
x /0=4); we conclude that a fraction of the hot molecules disappears from the R
beam axis and therefore leaves the sampling area of the monochromator, if xB/D
is increased from 2 to 4. Apparently this effect is caused by a raise of Г,
and the flow velocity due to V-T and R-T relaxation.
RAMAN INTENSITY -( a r b units)
7 6 0 RAMAN SHIFT (cm-1)
a « E / D = 1
-15 - 2 0 ANHARM0NIC SHIFT (cm b
RAMAN INTENSITY -« r b u n i t s )
76S ? 6 0 RAMAN SHIFT (cm'))
Ь « E /0 = 2
-10 -IS - 2 0 ANHARMONIC SHIFT (cm-1)
RAMAN INTENSITY ( t r b units)
760 RAMAN SHIFT (cm"1 )
- IS - 2 0 ANHARMONIC SHIFT ( c m - 1 )
RAMAN INTENSITY -( t r b u m l l )
760 RAMAN SHIFT (cm'1)
d « E / D = 4
-10 -IS - 2 0 ANHARMONIC SHIFT (cm"1)
Fig. 4.10. The Vj Raman spectrum of SFg in a pure beam with (...) and without ( ; C02-laser excitation [ 20 W at 10P(16)] recorded at χ /D=4 as a function of x /D; PQ = 2 atm, r
0 = 300 K. The anharmonic \>i shift СХіз^ for single V3
excitations is indicated m case(d).
(27) G. Lui]ks, Ξ. Stolte and J. Reuss, Chem. Phys. 62(1981) 217, chapter 2 of
this thesis.
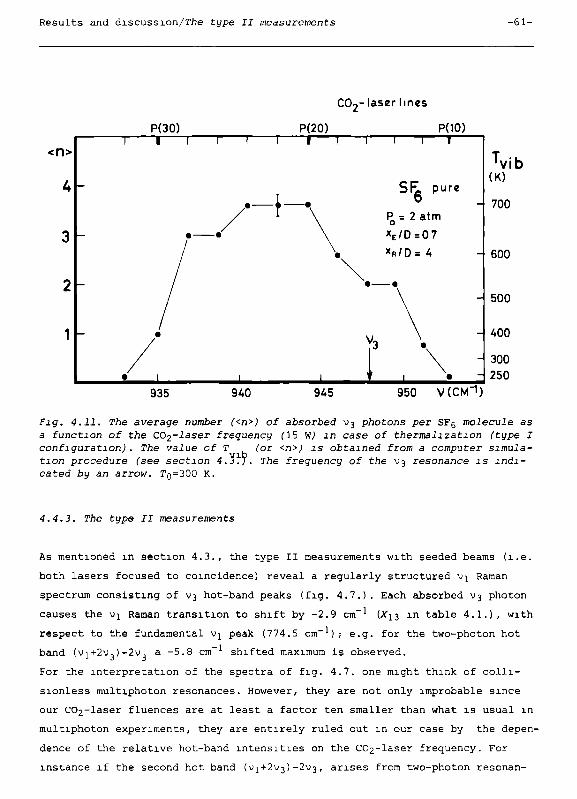
Results and discussion/The type II measurements - 6 1 -
<n>
4
3
2
1 -
CO2- laser lines
P(30) ~ I —
P(20) POO)
- ι —
- t - P = 2atm О
x E /D=07
T vib
(K)
700
- 600
500
-I 400
300 Η 250
935 940 945 950 V(CM"1)
Fig. 4.11. The average number (<n>) of absorbed \>-¡ photons per SF^ moiecuJe as a function of the CC^-iaser frequency (IS Yl) m case of thermalization (type I configuration). The value of Τ (or <n>) is obtained from a computer simula
tion procedure Csee section 4.3.7. The frequency of the V3 resonance is indi
cated by an arrow. Гд=300 К.
4.4.3. The type II measurements
As mentioned in section 4.3., the type II measurements with seeded beams (i.e.
both lasers focused to coincidence) reveal a regularly structured Vj Raman
spectrum consisting of V3 hot-band peaks (fig. 4.7.) . Each absorbed vj photon
causes the vj Raman transition to shift by -2.9 cm- 1 (ΛΊ3 in table 4.1.) , with
respect to the fundamental Vj peak (774.5 c m- 1) ; e.g. for the two-photon hot
band (vi+2v,)-2v a -5.8 cm shifted maximum is observed.
For the interpretation of the spectra of fig. 4.7. one might think of colli-
sionless multiphoton resonances. However, they are not only improbable since
our C02-laser fluences are at least a factor ten smaller than what is usual in
multiphoton experiments, they are entirely ruled out in our case by the depen
dence of the relative hot-band intensities on the C02-laser frequency. For
instance if the second hot band (V1+2V3)-2 з, arises from two-photon resonan-
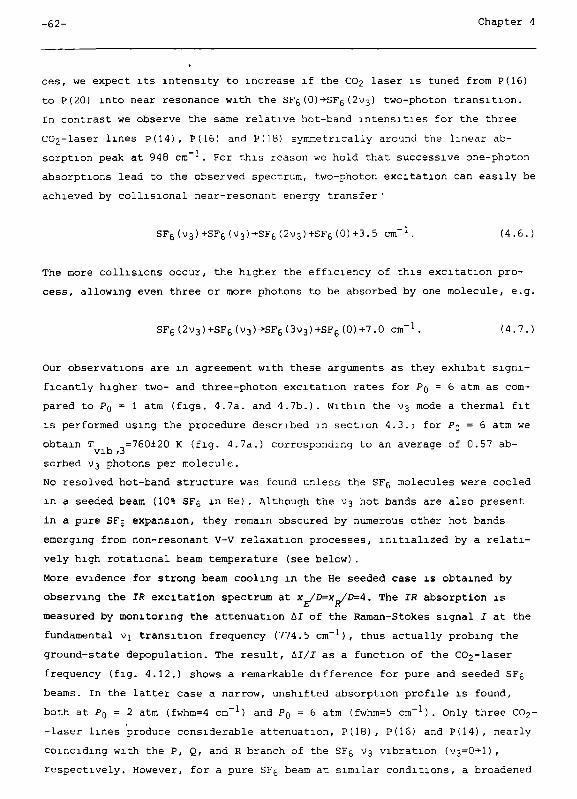
-62- Chapter 4
ces, we expect its intensity to increase if the CO2 laser is tuned from Ρ(16)
to P(20) into near resonance with the SFg (OJ-̂ SFg (2V3) two-photon transition.
In contrast we observe the same relative hot-band intensities for the three
C02-laser lines P(14), P(16) and P(18) symmetrically around the linear ab
sorption peak at 948 cm . For this reason we hold that successive one-photon
absorptions lead to the observed spectrum, two-photon excitation can easily be
achieved by collisional near-resonant energy transfer •
SF6(V3)+SF
6(V3)->SF
6(2v3)+SF
6(0)+3.5 cm
- 1. (4.6.)
The more collisions occur, the higher the efficiency of this excitation pro
cess, allowing even three or more photons to be absorbed by one molecule, e.g.
SF 6(2V3)+SF 6(V 3)-Î-SF 6(3V3)+SF 6(0)+7.0 cm-1. (4.7.)
Our observations are in agreement with these arguments as they exhibit signi
ficantly higher two- and three-photon excitation rates for PQ = 6 atm as com
pared to PQ = 1 atm (figs. 4.7a. and 4.7b.). Within the V3 mode a thermal fit
is performed using the procedure described in section 4.3. ; for Pg = 6 atm we
obtain Τ , =760+20 К (fig. 4.7a.) corresponding to an average of 0.57 ab-vib ,3
sorbed V3 photons per molecule.
No resolved hot-band structure was found unless the SFg molecules were cooled
in a seeded beam (10% SFg in He) . Although the v-¡ hot bands are also present
in a pure SFg expansion, they remain obscured by numerous other hot bands
emerging from non-resonant V-V relaxation processes, initialized by a relati
vely high rotational beam temperature (see below).
More evidence for strong beam cooling in the He seeded case is obtained by
observing the IR excitation spectrum at x/D=x/D=4. The IP absorption is
measured by monitoring the attenuation ΔΙ of the Raman-Stokes signal I at the
fundamental \>i transition frequency (774.5 c m - 1) , thus actually probing the
ground-state depopulation. The result, ΔΙ/Ι as a function of the CC^-laser
frequency (fig. 4.12.) shows a remarkable difference for pure and seeded SFg
beams. In the latter case a narrow, unshifted absorption profile is found,
both at PQ = 2 atm (fwhm=4 cm- 1) and P
0 = 6 atm (fwhm=5 c m
- 1) . Only three CO2-
-laser lines produce considerable attenuation, P(1B), P(16) and P(14), nearly
coinciding with the P, Q, and R branch of the SFg V3 vibration ( з=0->-1) ,
respectively. However, for a pure SFg beam at similar conditions, a broadened
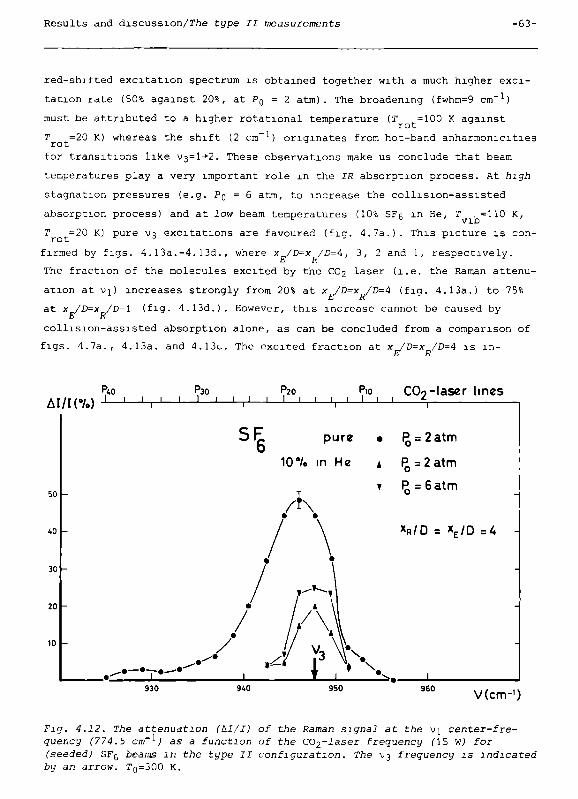
Results and discussion/The type II measurements -63-
red-shifted excitation spectrum is obtained together with a much higher exci
tation rate (50% against 20%, at Pg = 2 atm). The broadening (fwhm=9 cm- 1)
must be attributed to a higher rotational temperature (T =100 К against
rot Τ =20 К) whereas the shift (2 cm
- 1) originates from hot-band anharmomcities
rot
for transitions like з = 1->-2. These observations make us conclude that beam
temperatures play a very important role in the IR absorption process. At high
stagnation pressures (e.g. Pg = б atm, to increase the collision-assisted
absorption process) and at low beam temperatures (10% SFg in He, Τ ,=110 К,
Τ =20 К) pure з excitations are favoured (fig. 4.7a.). This picture is con-rot 1 - 3 -3 i-
firmed by figs. 4.13a.-4.13d., where χ /D=x /D=4, 3, 2 and 1, respectively.
The fraction of the molecules excited by the CO2 laser (i.e. the Raman attenu
ation at vj) increases strongly from 20% at χ /D-x /D=4 (fig. 4.13a.) to 75%
at χ /D=x /D=l (fig. 4.13d.). However, this increase cannot be caused by
collision-assisted absorption alone, as can be concluded from a comparison of
figs. 4.7a., 4.13a. and 4.13c. The excited fraction at χ /D=x /D=4 is in-E R
ΔΙ/Ι(7.) PAO РЭО P20 Pio COo-laser l ines I 1 1 1 l I 1 L-J 1 I 1 1 L _ I I 1 1 £,
40
20 -
S E pure · (¿ = 2atm
10"/. m He
XR/D = V D =4 -
930 940 950 960 . . . . .
V(cm-,)
Fig. 4.12. The attenuation (àl/I) of the Raman signal at the vj c e n t e r - f r e -quency (774.5 cm'1) as a function of the CC^-laser frequency (\S W) for (seeded) SF5 beams m the type II configuration. The V3 frequency is indicated by an arrow. Tg=300 K.
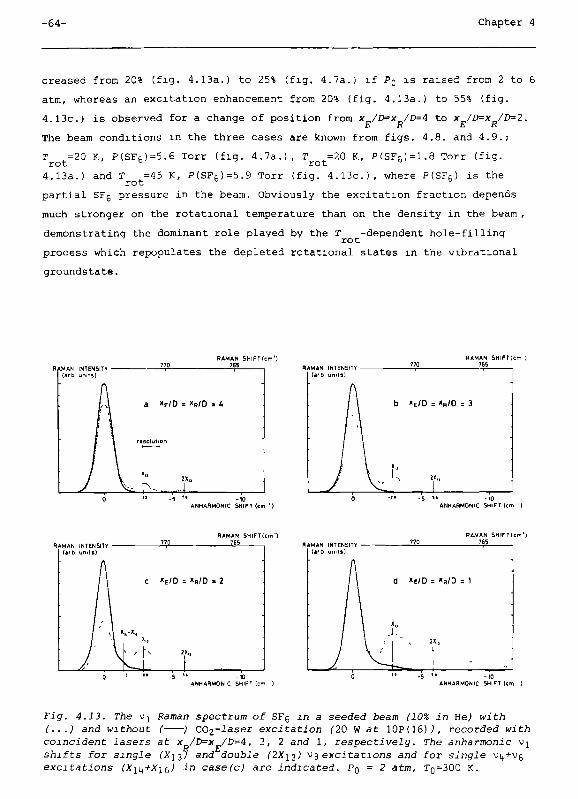
-64- Chapter 4
creased from 20% (fig. 4.13a.) to 25% (fig. 4.7a.) if P0 is raised from 2 to 6
atm, whereas an excitation enhancement from 20% (fig. 4.13a.) to 55% (fig.
4.13c.) is observed for a change of position from χ /D=x /D=4 to χ /D=x /D=2.
E R E R The beam conditions in the three cases are known from figs. 4.8. and 4.9.;
Τ =20 К, P(SFf,)=5.6 Torr (fig. 4.7a.), Τ =20 К, P(SFc)=1.8 Torr (fig. rot rot
4.13a.) and Τ =45 К, P(SF6)=5.9 Torr (fig. 4.13c.), where P(SF
6) is the
partial SFg pressure in the beam. Obviously the excitation fraction depends
much stronger on the rotational temperature than on the density in the beam ,
demonstrating the dominant role played by the Τ -dependent hole-fillinq
rot
process which repopulates the depleted rotational states in the vibrational
groundstate.
RAMAN INTENSITY ( a r b u n i t s )
RAMAN S H I F T ( c m ' ) 765
RAMAN S H I F T i c m )
RAMAN INTENSITY Urb u n i t s )
ANHARMONIC SHIFT (cm ' ) ANHARMONIC SHIFT ( c m ' )
RAMAN INTENSITY • ( a r b u n i t « )
RAMAN S H I F T ( c m ' ) 765
С « E ' D = » R / D = 2
RAMAN INTENSITY -( « r b u n i t s )
RAMAN S H I F T ( c m ' ) 765
d *E/D = «R/D = 1
ANHARMONIC SHIFT (cm ) ANHARMONIC SHIFT (cm )
Fig. 4.13. The Vj Raman spectrum of SFg in a seeded beam (10% in Ее) with (...) and without ( ; C02--2aser e x c i t a t i o n C20 W a t 10P(16).), recorded with coincident lasers at χ /D=x /D=4, 3, 2 and 1, respectively. The anharmonic Vj shifts for single (X13) and double (2Xi-¡) м^ excitations and for single νίψ+υς e x c i t a t i o n s (Хщ+Хк,) in case (с) are indicated. PQ = 2 atm, Гр=300 К.
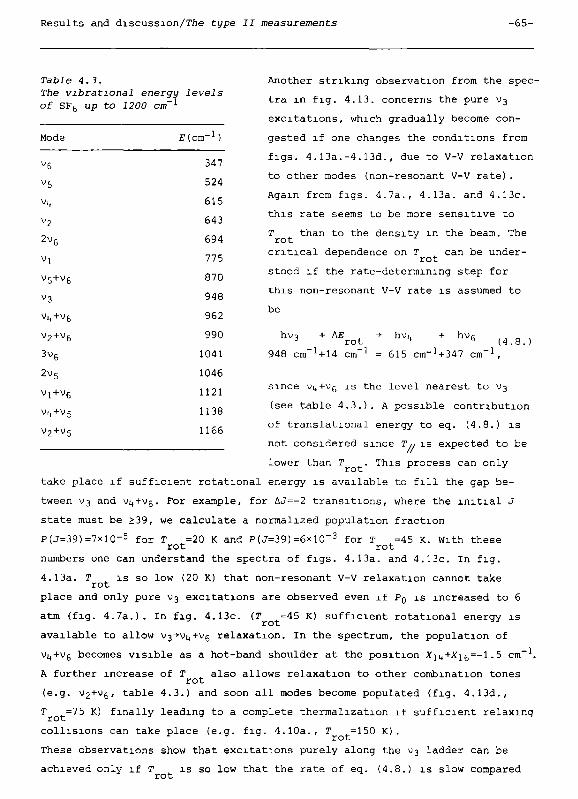
Results and discussion/IVíe type II measurements -65-
Table 4.3. The vibrational energy levels of SF 6 up to 1200 cm - 1
Mode E (cm' • b
v6
v 2
v 5+v 6
з
ц+ б
v2+v
6
^6 3Vc
2v5
νίψ+νς
V2+V 5
347
524
615
643
694
775
870
948
962
990
1041
1046
1121
1138
1166
Another striking observation from the spec
tra in fig. 4.13. concerns the pure V3
excitations, which gradually become con
gested if one changes the conditions from
figs. 4.13a.-4.13d., due to V-V relaxation
to other modes (non-resonant V-V rate).
Again from figs. 4.7a., 4.13a. and 4.13c.
this rate seems to be more sensitive to
Τ than to the density in the beam. The rot
critical dependence on Γ can be under-
rot
stood if the rate-determining step for
this non-resonant V-V rate is assumed to
be
hv + ΔΕ rot
hVü hVfi
615 cm~1+347 cm - 1, (4.8.)
since \>ι,+υ6 is the level nearest to V3
(see table 4.3.). A possible contribution
of translational energy to eq. (4.8.) is
not considered since Τ,, is expected to be
lower than Τ . This process can only rot
r *
take place if sufficient rotational energy is available to fill the gap be
tween V3 and V4+V5. For example, for AJ=-2 transitions, where the initial J
state must be >39, we calculate a normalized population fraction P(J=39)=7xl0-
5 for Τ =20 К and P(J=39)=6xl0"
3 for Τ =45 К. With these
rot rot numbers one can understand the spectra of figs. 4.13a. and 4.13c. In fig.
4.13a. Г is so low (20 K) that non-resonant V-V relaxation cannot take rot
place and only pure V3 excitations are observed even if PQ IS increased to 6
atm (fig. 4.7a.). In fig. 4.13c. (Г =45 K) sufficient rotational energy is
rot **
available to allow з+ ^+ с relaxation. In the spectrum, the population of
v^+Vg becomes visible as a hot-band shoulder at the position Χ^+Χ\^=-\ . 5 cm-1.
A further increase of Τ also allows relaxation to other combination tones
rot
(e.g. V2+Vg, table 4.3.) and soon all modes become populated (fig. 4.13d.,
Τ .̂=75 К) finally leading to a complete thermalization if sufficient relaxing Τ =150 К) rot
collisions can take place (e.g. fig. 4.10a.,
These observations show that excitations purely along the V3 ladder can be
achieved only if Τ is so low that the rate of eq. (4.8.) is slow compared
rot
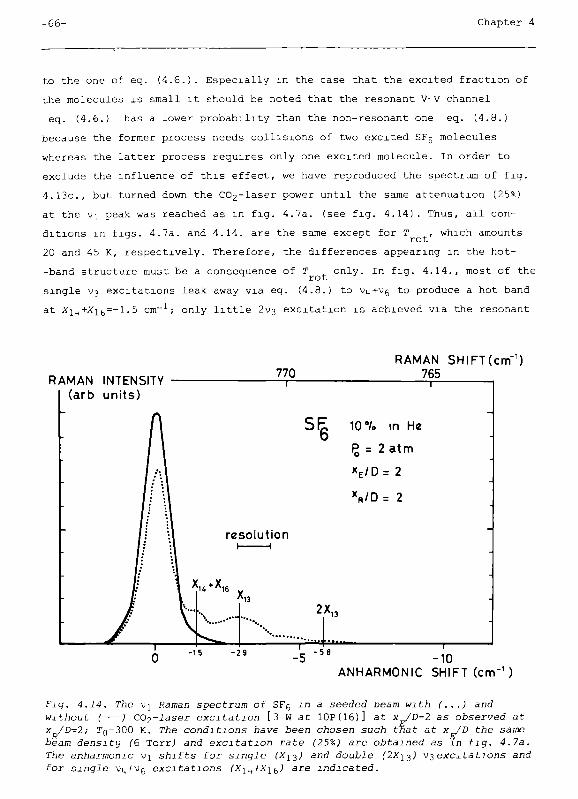
- 6 6 - Chapter 4
to the one of eq. (4.6.). Especially in the case that the excited fraction of
the molecules is small it should be noted that the resonant V-V channel
eq. (4.6.) has a lower probability than the non-resonant one eq. (4.8.)
because the former process needs collisions of two excited SFg molecules
whereas the latter process requires only one excited molecule. In order to
exclude the influence of this effect, we have reproduced the spectrum of fig.
4.13c., but turned down the CC^-laser power until the same attenuation (25%)
at the vi peak was reached as in fig. 4.7a. (see fig. 4.14) . Thus, all con
ditions m figs. 4.7a. and 4.14. are the same except for Τ , which amounts
rot
20 and 45 K, respectively. Therefore, the differences appearing in the hot-
-band structure must be a consequence of Τ only. In fig. 4.14., most of the
rot
single ^3 excitations leak away via eq. (4.8.) to v^+Vg to produce a hot band
at Χι^+Χι6=-l.5 cm- 1; only little 2V3 excitation is achieved via the resonant
RAMAN INTENSITY (arb units)
770 — 1 —
RAMAN SHIFTCcm"1) 765
resolution 1 1
^ H * ^ 1 6
S E 10e/. m He
ζ = 2 atm
xE/D= 2
2X,
X R / D = 2
-5Θ -10
ANHARMONIC SHIFT (cm-')
Fig. 4.14. The Vj Raman spectrum of SFg in a seeded beam with (...) and without ( ; C02-Jaser excitation [3 W at 10P(16)] at χ^Ώ=2 as observed at χ /D=2; TQ=300 K. The conditions have been chosen such that at x/D the same beam density (6 Torr) and excitation rate (25%) are obtained as m fig. 4.7a. The anharmonic vj shifts for single (Хц) and double (2Хіз) \>з excitations and for single ц+Vg excitations (Χι^+Χΐζ,) are indicated.
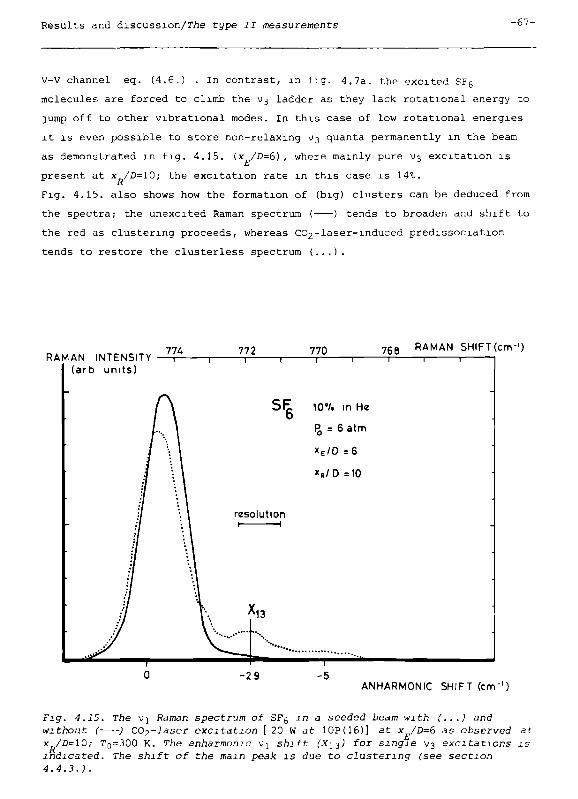
Results and discussion/The type II measurements -67-
V-V channel eq. (4.6.) . In contrast, in fig. 4.7a. the excited SF6
molecules are forced to climb the V3 ladder as they lack rotational energy to
]ump off to other vibrational modes. In this case of low rotational energies
it is even possible to store non-relaxing V3 quanta permanently m the beam
as demonstrated in fig. 4.15. (x /D=6), where mainly pure V3 excitation is
E present at χ /0=10; the excitation rate in this case is 14».
R
Fig. 4.15. also shows how the formation of (big) clusters can be deduced from
the spectra; the unexcited Raman spectrum ( ) tends to broaden and shift to
the red as clustering proceeds, whereas CC^-laser-induced predissociation
tends to restore the clusterless spectrum (...).
774 RAMAN INTENSITY , r
(arb units)
772 7 7 0 7 6 e RAMAN SHIFT (cm-') τ 1 1 1 1 1
S E 10e/. in He
P0 = 6 atm
X E / D = 6
X R / D =10
ANHARMONIC SHIFT ( с т " ' )
Fig. 4.15. The Vj Raman spectrum of SFg m a seeded beam with (...) and without ( ) C02--Zaser excitation [ 20 W at 10P(16)] a t χ /D=d as observed at χ /D=10; I'Q=300 K. The anharmonic чц shift (X13) for single V3 e x c i t a t i o n s i s i n d i c a t e d . The shift of the mam peak is due to clustering (see section 4.4.3.).
-68- Chapter 4
4.5. Summary
The results of CC^-laser excitation of ЗГ6( з) in a molecular beam allow a
distinction between three situations, based upon the local rotational tempera
ture (T ) and the number of collisions at χ /D.
rot E
Ά. Pure V3 excitations [10% SF6 in He, χ /D>4 (fig. 4.7.)]
Due to seeding Γ is low, especially at some distance from the nozzle
{x /D>4, Τ <20 K). Therefore, independently of the number of collisions, the E rot
excitation of the V3 mode cannot relax to other modes because insufficient ro
tational energy is available to overcome the gap to the nearest vibrational
level ц+Vg [see eq. (4.8.)]. Only higher excitations of the V3 mode can occur
via collisions of two excited SFg molecules [see eqs. (4.6.) and (4.7.)] yiel
ding spectra like fig. 4.7. With our cw laser power [ <20 W at 10P(16)] we
found as maximum excitation Τ , .=160 К, corresponding to <n>=0.57 photons in
vib,3
the V3 mode (fig. 4.16.).
fl. Thermalization [100% SF6, Χ^0<1 (fig. 4.6.)]
In a pure SF6 beam, close to the nozzle (x /D<1), Τ is so high (>150 K)
that all vibrational levels are easily accessible via non-resonant V3 relax
ation [e.g. eq. (4.8.)]. Moreover, the collisions in the region χ /D<1 are so
numerous that the V3 vibrational energy gets redistributed to an equilibrium
in which all vibrational levels are thermally populated (fig. 4.6.). At most
we found Τ ,=950 К, equivalent to <n>=6.4 (fig. 4.16.), applying 22 W of CO2-
-laser power at 10P(22), i.e. 6 cm red shifted with respect to the V3
resonance.
С Intermediate case [100% SF6, χ /D>\ (fig. 4.10.), and 10% SF
6 in He
K x /D<4 (fig. 4.13.)]
In this intermediate case the conditions are such that Τ is not so low that
rot
non-resonant V3 relaxation via eq. (4.8.) is completely absent, but its effi
ciency and/or the number of collisions at x„/D is so low that thermalization E
cannot take place. A non-thermal distribution as in figs. 4.10. and 4.13. is
then observed.
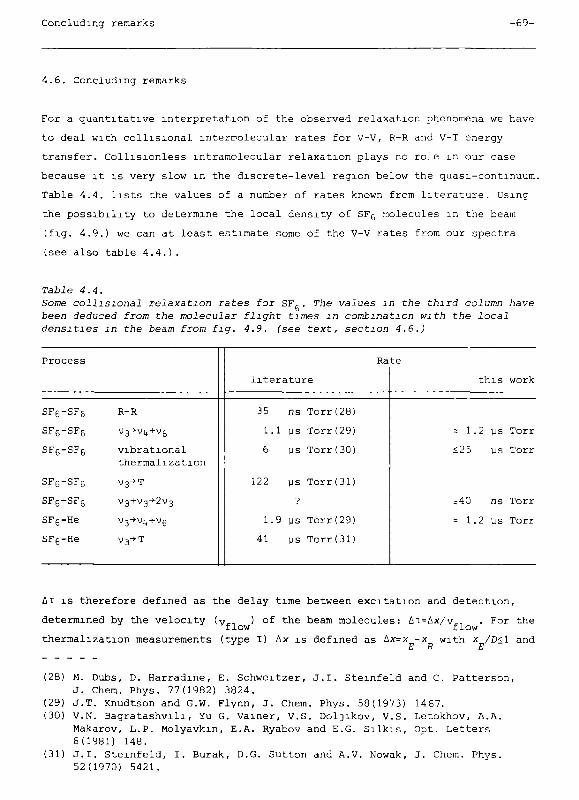
Concluding remarks -69-
4.6. Concluding remarks
For a quantitative interpretation of the observed relaxation phenomena we have
to deal with collisional intermolecular rates for V-V, R-R and V-T energy
transfer. Collisionless intramolecular relaxation plays no role in our case
because it is very slow in the discrete-level region below the quasi-continuum.
Table 4.4. lists the values of a number of rates known from literature. Using
the possibility to determine the local density of SFg molecules in the beam
(fig. 4.9.) we can at least estimate some of the V-V rates from our spectra
(see also table 4.4.).
Table 4.4. Some collisional relaxation rates for SF,. The values m the third column have
b
been deduced from the molecular flight times m combination with the local densities m the beam from fig. 4.9. (see text, section 4.6.)
Process
SF6-SF
6 R-R
SF6-SF
6 Vj-^+Vg
SF6-SF
6 vibrational
thermalization
SF6-SF
6 з+Т
SFg-SFg э + э->-2 з
SFg-He з-»- 1++
6
SF6-He з->Т
Ra
literature
35 ns Torr(28)
1.1 ys Torr(29)
6 ys Torr(30)
122 ys Torr(31)
1.9 ys Torr(29)
41 ys Torr(31)
te
this work
= 1 .2 ys Torr
<25 ys Torr
=40 ns Torr
= 1 . 2 ys Torr
Δτ is therefore defined as the delay time between excitation and detection,
determined by the velocity (v̂, ) of the beam molecules: Δτ=Δχ/ν , . For the
'flow flow
thermalization measurements (type Ι) Δχ is defined as Δχ-χ -χ with χ /D<1 and
ER E
(28) M. Dubs, D. Harradine, E. Schweitzer, J.I. Steinfeld and C. Patterson,
J. Chem. Phys. 77(1982) 3824.
(29) J.T. Knudtson and G.W. Flynn, J. Chem. Phys. 58(1973) 1467.
(30) V.N. Bagratashvili, Yu G. Vainer, V.S. Ооіціко , V.S. Letokhov, A.A.
Makarov, L.P. Molyavkin, E.A. Ryabov and E.G. Silkis, Opt. Letters
6(1981) 148.
(31) J.I. Steinfeld, I. Burak, D.G. Sutton and A.V. Nowak, J. Chem. Phys.
52(1970) 5421.
-70- Chapter 4
x /D>2 (D=0.25 mm) . Assuming ν ^500 m/s in a pure beam we find Δτ>0.5 ys. R " flow
The average density in the region l<x /D<2 is equivalent to =50 Torr (fig.
4.9.). As a result an upper limit for the thermalization rate is found
τ P<25 us Torr. Bagratashvili(32) observed т , P=6 us Torr in a room therm therm
temperature sample applying multiphoton instead of single-photon excitation.
In the pure υ-i-excitation measurements (type II, 10% SFr in He, ν -1000 m/s, J 0 flow
x /D<x /D=4) Δλ stands for the average distance travelled by the molecules E R
between excitation and detection when the Ar -laser focus (0 50 yra) is aligned
on the edge of the CC^-laser focus (0 400 ym) at the downstream end. This
gives Δχ=200 ym and Δτ=Δχ/ν^, =0.2 ys. The rate for non-resonant V-V transfer
flow
( з-̂ ̂ + ^, eq. (4.8.)) can be estimated from the conditions in fig. 4.14.
where the v^+Vg hot band emerges in the spectrum (local density ~6 Torr). The
result τ P=1.2 ys Torr is comparable with values measured by Flynn(33)
(table 4.4.). No rate constant is known for the resonant V-V transfer process
described in eq. (4.6.), but we can obtain a fairly good value considering the
conditions in fig. 4.7b. where the 2 з hot band comes up for Pg = 1 atm (local
density -1 Torr). For this process ( з+ з-^ з) the rate is determined by the
density of singly excited SFg molecules. Since only 20% of the molecules can
be excited (as can be deduced from the unshifted Vj peak in fig. 4.7b.) this
density is equivalent to :0.2 Torr, yielding a rate τ P=40 ns Torr.
V3-V3
By the choice of source- and excitation conditions (seeded beam, χ /D>4) it is E ~
shown (section 4.4.3.) that "thermal barriers" can be introduced in the
relaxation scheme, i.e. at low translational and rotational temperatures the
collisional energies will be so low that population-transfer processes to the
nearest vibrational levels ( з-̂ ц+Vg, ΔΕ=-14 cm- 1 or νз^ 5+v5, ΔΕ=+7Θ cm
- 1,
see also table 4.3.) cannot occur. Only population redistribution within the
V3 ladder ( з+ з->-2 з, ΔΕ=-3.5 cm"1) will continue to be a fast relaxation
channel.
(32) V.N. Bagratashvili, Yu G. Vainer, V.S. Doljikov, V.S. Letokhov, A.A.
Makarov, L.P. Molyavkin, E.A. Ryabov and E.G. Silkis, Opt. Letters
6(1981) 148.
(33) J.T. Knudtson and G.W. Flynn, J. Chem. Phys. 58(1973) 1467.
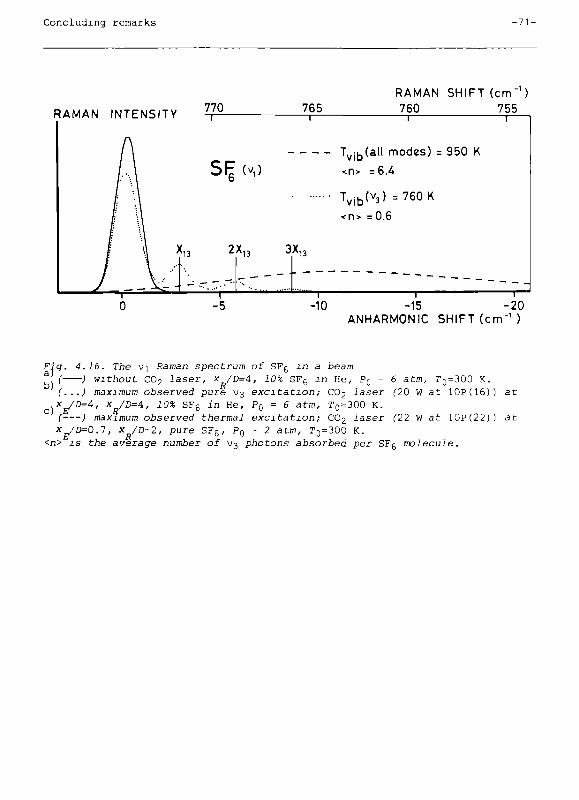
Conc lud ing remarks - 7 1 -
RAMAN INTENSITY 770 ~ i —
Sf^ (v,)
765
RAMAN SHIFT (cm - 1)
760 755
Tv¡b(all modes) = 950 К
<n> =6.A
Т і ь ( з) =760 К
<n> =0.6
2Х,з ЭХ
- ι 1 ΓΙ Ο -15 -20
ANHARMONIC SHIFT (cm" 1 )
if* b)
4.16. The Vj Raman spectrum of SF6 m a beam
6 atm, Γ0=3ΟΟ K.
(20 W at 10P(16)) at
( Ì without CO2 laser, x /D=4, 10% SF6 in He, PQ = (...) maximum observed pure V3 excitation; CO2 laser
,хУО=4, x /D=4, 10% SF6 in He, Pg = 6 atm, T
0 = 300 K.
С ; maximum observed thermal excitation; CO2 laser (22 w at 10P(22)) at x/D=0.T, x /D=2, pure SF
6, P
0 = 2 atm, T
0=3OO K.
<n> is the average number of V3 photons absorbed per SF6 molecule.

Summary/The Raman instrument - 7 3 -
CHAPTER 5 . CONCLUSIONS
5 . 1 . Summary
A. The Raman instrument
It has been the purpose of this study to develop a universal instrument for
probing state populations in a molecular beam in order to act as a monitor for
relaxation and excitation processes. Raman scattering has been proven to be
very useful in this respect although it is not a very sensitive technique,
especially in molecular beams with their low densities. However, an increase
in sensitivity has been achieved by tightly focusing the Ar -laser beam to a
high power beam waist (0 <50 um) permitting high spatial resolution in the
beam (àx/D-O.l at D=0.25 nun). We gained an extra factor five by inserting a
curved-mirror multipass arrangement (fig. 2.1.) . An instrumental novelty was
our construction of the vacuum system inside the cavity of the Ar laser (fig.
4.1.) . This cavity was formed by three mirrors (reflectivity >99%) in a folded
configuration in order to obtain a sharp intracavity focus. For this design
severe stability and mechanical adjustment requirements had to be met. As a
result of the low losses m the cavity huge laser powers (typically 500 W)
could be reached, yielding a gam in signal by a factor of 125 compared to the
single pass configuration.
The data-acquisition process has been fully automized by the use of a micro
computer (fig. 4.2.).
B. The relaxation measurements
ς) C02 (section 2.3.)
The rotational spectrum of CO2 always revealed a Boltzmann distribution for
the populations of the rotational states (fig. 2.2.). The temperature Τ in
the beam was found to increase strongly with increasing stagnation pressure PQ,
due to the formation of clusters in the expansion (fig. 2.3.).
11) N2 (section 2.4.)
Also for N2 a rotational Boltzmann distribution was observed at all x/D-
-values up to x/D=70, where as a minimum temperature Τ = 6K was measured.
rot
Collisional deactivation of N2 rotations appeared to be very effective
<Z =1, fig. 2.5.).
-74- Chapter 5
in) СНц (section 2.5.)
Via the vibrational-rotational V3 spectrum a different relaxation behaviour
was observed for ortho-, meta- and рага-СНь, i.e. a different Τ for each of r ч
rot
the nuclear spin species was found (fig. 2.9.).
iv) SFg (sections 2.6. and 4.4.1.)
Vibrational cooling (T ) in an expansion of SFg could be followed by moni
toring the Stokes/anti-Stokes vj-intensity ratio as a function of x/D, yiel
ding Τ > 170 К in a pure beam and Γ , >100 К in a seeded beam (10% SFc in He)
vib vib
(fiq. 4.8.). Τ could be determined from the contours of the unresolved
rot
rotational wings in the V2 spectrum. In a pure beam Τ >60 К was observed, in
a seeded beam Τ >20 К (fig. 4.Θ.).
rot
v) СГзВг (section 3.2.)
For four different modes of СГзВг (V2=762 cm- 1, v
5=547 cm" , з=351 cm
- 1 and
Vf:=303 cm- 1) Τ has been measured (fig. 3.1.) revealing the existence of
vib
bottlenecks in the vibrational relaxation process. For example, at x/D=6 and
Pn = 1.2 atm we found Г ,( ч)=140±10 К and Τ . (\>
fi) =250±20K
/ indicating that u
vib э
vib 0
V-T relaxation from the lowest vibrational mode (ν6) is the rate-determining
process for vibrational deactivation.
Although the pure rotational spectrum of СГзВг could not be resolved, its
contours allowed a fair determination of Τ ^ ; we found Τ ^ϊ.60 К in a pure rot rot
beam (fig. 3.1.).
vi) Both for СГзВг and SF6 Г_ was always found much lower than Τ (figs.
2.12., 3.1. and 4.Θ.). More generally, the results of all our measurements
obey the principle that collisional relaxation is efficient as long as the
collisional energies in the beam (described by TV,) are large compared to the
energy gaps that have to be overcome during relaxation.
v u ) Seeding the molecular beams (10% in Ar or He) was always found to en
hance the V-T and R-T relaxation rates, resulting in lower Τ , and Τ
vib rot
values than in pure beams (fig. 4.8. and fig. 2 of ref. (1)).
vin) The dependence of Τ and Τ upon the stagnation pressure Pn showed
vib rot υ
varying behaviours. For Γ ^(N?) (fig. 2.5.), Τ ,_(SF6) (fig. 4.8.) and
rot ' vib °
Г (СГзВг) (fig. 3.1.) lower values were measured if Pg was increased, which
is to be expected from the simple argument that more relaxing collisions occur
at higher Pg values. (1) G. Luijks, S. Stolte and J. Reuss, Proceedings of the 13th International
Symposium on Rarefied Gas Dynamics, Novosibirsk (1982).
Зиішпагу/ГЛе CC^-Jaser excitation measurements -75-
In contrast, Γ (CO·,) (fig. 2.3.) , Τ (SFfi) (fig. 4.8.) and Γ (CF,Br) (fig.
rot ¿ rot 0 rot л
3.1.) were found to increase if Pg was raised in a pure expansion.
For CO2 this has been ascribed to cluster formation due to expansion cooling,
whereas SFg and СГзВг, which do not condensate in pure beams, gain rotational
energy as a result of enhanced V-R relaxation, i.e. at high Pp more vibratio
nal energy will relax into the rotational degree of freedom than at low Pg,
resulting in a higher Τ . Of course, this effect can only occur if suffi
cient vibrational energy is present in the molecule at the stagnation tempe
rature (Tn=300 K) E
1_(SF
fi)=600 cm
- 1, Ё ,(CF
3Br)=370 cm"
1. Therefore we did
u vib ° vib
J
not observe this effect for N? (fig. 2.5.) because Ё , (N,)=0.03 cm at
' vib
Γ=300 K. No Γ increase was observed raising Pg in a seeded SFg beam (fig.
4.8.), because most of the vibrational energy will relax into translation in
stead of rotation, due to the enhanced V-T rate as a result of seeding (table
4.4.).
ix) For N2, СНц and SFg we have measured the absolute molecular density in the
beam versus x/D by monitoring the integrated rotational intensity (N2) or the
Ml Q-branch intensity (СНц and SFg). An easy calibration was obtained from a
room-temperature sample at a known pressure.
For N2 (fig. 2.6.) and CHi, (fig. 2.11.) deviations from calculated isentropic
curves were observed in such a direction that freezing of internal degrees of
freedom (as a consequence of expansion cooling) can account for them.
The results for SFg (fig. 4.9.) reveal a strong concentration of the heavy SFg
molecules on the beam axis if seeding is applied. The densities from fig. 4.9.
have been used directly for the determination of the rates in section 4.6.
C. The C02-laser excitation measurements
1) СГзВг (section 3.3.)
The IR-excitation spectrum of СРзВг (vi=1084.6 cm- 1) was measured by monito
ring the ground state depopulation via the attenuation of the V2 maximum
(762 cm ) in the Raman spectrum (fig. 3.3.) . The observed structures were
identified as a Ρ and a Q branch belonging to the Vj transition.
In contrast to the results for SFg, a complete collisional thermalization of
the Vj excitation was never observed, even if the CO2 laser crossed the mole
cular beam very close to the nozzle, where numerous randomizing collisions
take place. From the hot-band structures a preferred excitation of \>i (1085
cm ) and V2+V3 (1119 cm , Fermi resonance) could be deduced (fig. 3.2.) .
-76- Chapter 5
il) SF6 (sections 4.4.1. and 4.4.2.)
A detailed investigation of cw C02-laser excitation of SFg( з=94 cm"1) in a
(seeded) beam has been performed. It was demonstrated that collisions and in
particular the local rotational temperature in the beam determine the total
excitation rate of the beam molecules as well as the channels of relaxation of
the absorbed V3 energy. At low Τ values, R-R collisional energy transfer
ceases to efficiently refill those rotational states in the vibrational ground
state that are pumped by the CO2 laser, thus leading to a reduction of the
total excitation rate at a given CC^-laser power. Concerning the channels of
relaxation, if Τ becomes comparable to the thermal energy gap between V3
and the nearest vibrational level (νι,+νς, Δ£=14 cm ) , a thermal barrier for
V-V relaxation ( з-̂- ц+ ^ ) is formed and the absorbed C02-laser energy will
remain within the э mode. Consequently, the terminal energy content of the
SF6 molecules is ruled by the position of CC^-laser irradiation (χ/D) and by
the seeding concentrations because they determine the local rotational tempe
rature. If x„/D>4 in a seeded SFc, beam (Γ <20 K) a pure v^-excited beam
E ° rot 3
could be produced, also containing doubly and triply з-excited SFg molecules
(fig. 4.7.). The rate of redistribution of energy within the V3 ladder (e.g.
V3+V3-+2V3) has been found to be fast: τ P=40 ns Torr. Complete collisional
thermalization of the V3 excitations was achieved in a pure beam if χ /D<1, a
maximum absorption of 6.4 C02-laser photons per SFg molecule (Γ (all modes)
=950 K) was observed (fig. 4.16.).
It has been shown that all з-relaxation processes proceed on a microsecond
time scale or faster (table 4.4.). Therefore we may conclude that molecular
beams can be produced with high internal energies which can be modulated at
frequencies up to =100 kHz. By a proper selection of conditions, this internal
energy can be chosen to be thermally distributed among all modes (all mole
cules excited, e.g. fig. 4.6.) or to be stored in one single mode (still more
than 10% of all SF6 molecules excited in the V3 mode, fig. 4.15.).
5.2. Outlook
As a result of the work described in this thesis we have now at our disposal
a sensitive Raman instrument as a monitor for relaxation and excitation pro
cesses. It hag been shown that the spectra contain information not only about
the degree of excitation that can be produced, but also about the question
which states share the absorbed energy. This is interesting for the study of
Outlook -77-
of all kinds of population-transfer processes, for instance multiphoton
excitations.
The application of time resolution in the experiment, e.g. for the determina
tion of rate constants, has been limited so far to cw-laser measurements in a
molecular beam, where the flow velocity of the molecules is utilized to intro
duce a delaytime Δτ between excitation and detection.
However, for a proper quantitative investigation of relevant rates in exci
tation processes, in a cell as well as in a beam, it is desirable to dispose
of other and possibly better ways to obtain the required resolution in time.
One possibility is chopping the exciting cw laser at a fast rate (ω<10 rad/s).
Information is then obtained by setting time windows for photon counting or by
reading the phase shift ΔΦ=ωΔτ, if Δτ is the characteristic time for a rate
under investigation. If a higher power level for excitation is required, the
exciting laser can be pulsed (pulse duration <100 ns) and the time evolution
of an excitation feature in the spectrum can be followed by reading out the
photodetector at a variable delaytime after the pulse.
Both for chopped and pulsed excitation the Raman-probing cw Ar laser can be
maintained in its high-power intracavity set-up. In addition, however, very
much measuring time can be saved and thereby possible drift effects can be
suppressed if multichannel detection is introduced. In a multichannel Raman
spectrometer an array of 1024 diodes is arranged in the focal plane of a
grating. Consequently a complete Raman spectrum can be recorded at one time by
simultaneously reading the diodes. As a result the sampling efficiency is
drastically increased compared to a single-channel monochromator where the
spectrum has to be scanned.
If a pulsed laser is used for Raman detection as well, time resolution is
determined by the delaytime between the two laser pulses (Δτ<50 ns is
possible). An excimer laser seems suitable in this respect as it produces
short powerful pulses in the UV, where Raman scattering is relatively effi
cient (̂ v1*) . One should take care, however, that no dissociation or ionization
of the molecules is induced as a result of these strong UV pulses.
The spectral resolution that can be achieved with a monochromator or a multi
channel detection system is always moderate (>1 cm fwhm). High-resolution
spectra can only be obtained via stimulated Raman techniques where the
necessity of a dispersive element is avoided by the use of two lasers. The
spectral resolution is then fully determined by the linewidths of the probe
lasers (>0.001 cm"1).
-78- Samenvatting
Samenvatting
Moleculaire bundels hebben zich ontwikkeld tot een belangrijk medium voor
natuurkundig en chemisch onderzoek dankzij hun bijzondere eigenschappen zoals
vrijwel botsingsvrije omstandigheden, lage temperaturen als gevolg van
expansiekoeling en de mogelijkheid tot het selecteren van specifieke molecuul
toestanden.
Het onderzoek beschreven in dit proefschrift had tot doel, gebruik makend van
Raman verstrooiing, een universeel instrument te ontwerpen geschikt voor het
locaal aftasten van toestandbezettingen in een molecuulbundel, omdat die vaak
een onbekende parameter vormen. Het is daardoor mogelijk populatieverschui-
vingen te volgen niet alleen ten gevolge van de snelle afkoeling in de expan
sie (relaxatie) maar bijvoorbeeld ook ten gevolge van interactie met laser
straling (excitatie).
Ondanks de geringe efficiëntie van het Raman effect, zeker in combinatie met
de lage dichtheden in een molecuulbundel, zijn we erin geslaagd een goede ge
voeligheid te bereiken door het vacuümsysteem in te bouwen in de daartoe ge
vouwen cavity van de Ar laser. Door de lage intracavity verliesfactoren van
deze mechanisch kritische constructie kunnen laservermogens tot 500 W gemakke
lijk verwezenlijkt worden. Dit betekent een factor 125 winst in signaal ten
opzichte van een extra-cavity meetopstelling.
Het eerste gedeelte van het proefschrift bewijst de bruikbaarheid van de
Raman-techniek via relaxatiemetingen aan molecuulbundels van CO2, N2, CH^, SFg
en СГзВг. De rotationele vrijheidsgraad gaf voor CO2 en N2 steeds een
Boltzmann verdeling te zien, CH^ daarentegen vertoonde in dat opzicht een
athermisch gedrag. Voor SF6 kon via de Vj mode tevens de vibratiekoeling ge
volgd worden welke erg inefficient bleek te zijn. СГзВг liet voor vier ver
schillende modes de vibratietemperatuur bepalen, waarbij locaal grote verschil
len werden gemeten, bijvoorbeeld voor de op één na laagste mode ( з=351 c m )
en de laagste mode (vK=303 c m
- 1) : Τ (
ч)=140 К en Τ ívfi)=250 К. ° vib
3 vib
0
De locale absolute bundeldichtheid voor N2, СН^ en SF5 kon eenvoudig bepaald
worden door een geïntegreerde Raman-intensiteit te ijken aan de intensiteit
bij een bekende druk. Voor SF5 konden daardoor een aantal relaxatie-tijdcon
stanten kwantitatief bepaald worden.
Het tweede gedeelte van het proefschrift beschrijft hoe populatieverschui-
vingen ten gevolge van JÍ? excitatie (met CO2 laser) zichtbaar gemaakt en ge
volgd konden worden. Het excitatie spectrum voor de V2 mode van СГзВг en de з
Samenvatting -79-
mode van SF, was meetbaar als de verzwakking van het V2- respectievelijk Vj-
-Raman maximum als functie van de CC^-laser frequentie. Voor СГзВг leverde
dit een Ρ en een Q branch op, voor SF6 was het spectrum steeds structuurloos.
Vibrationele excitatie en daarop volgende relaxatie zijn gedetailleerd onder
zocht in SFg bundels. Niet alleen het aantal intermoleculaire botsingen maar
ook de locale rotationele temperatuur bleek een bepalende factor te zi]n zowel
voor het percentage van de moleculen dat geexciteerd kon worden, als voor de
relaxatiekanalen waarlangs de Vq excitaties herverdeeld werden. Een lage Τ 0 rot
introduceerde namelijk thermische barrières, enerzijds voor R-R relaxatie in
de vibrationele grondtoestand waardoor het weer opvullen van door de CO2 laser
leeggepompte rotatie-niveaus vertraagd werd (resulterend in een lagere totale
excitatie), anderzijds voor niet-rescnante V-V relaxatie vanuit de V3 mode
( з-щ^+ с) waarvoor een thermische energie-afstand van 20 К overbrugd moest
worden door rotatie-energie. Afhankelijk van de plaats van C02-laser instra
ling en van de draaggas-(He)-concentratie konden daardoor twee typen geexci-
teerde SFg bundels geproduceerd worden:
aj een volledig gethermaliseerde bundel waarin de V3 excitaties zijn herver
deeld over alle vibratiemodes van SFc; maximaal kon Τ ,=950 К worden gerea-0 vib
liseerd corresponderend met een gemiddelde absorptie van 6.4 C02-laser fotonen
per molecuul.
b) een zuiver \J3-geexciteerde bundel waarin ten gevolge van de thermische
barrières alleen maar bijna-resonante V-V relaxatie binnen de V3 ladder optrad
(bijvoorbeeld з+ з->-2 з) ; de efficiëntie van dit proces kon worden afgeschat op τ P=40 ns Torr.
V3-V3
-80- Curriculum Vitae
Curriculum Vitae
Op 1 augustus 1955 ben ik geboren te Steenbergen (N. Br.).
De middelbare schoolopleiding volgde ik aan het Moller-
lyceum te Bergen op Zoom waar ik in 1973 het diploma
gymnasium β behaalde. Aansluitend volgde de studie wis- en
natuurkunde aan de Katholieke Universiteit Nijmegen waar
ik in april 1977 het kandidaatsexamen aflegde en in
december 1979 het doctoraalexamen experimentele natuur
kunde .
Tijdens mijn afstudeerperiode was ik werkzaam op de afdeling Experimentele
Atoom- en Molecuulfysica onder leiding van Prof. Dr. A. Dyraanus. Na het docto
raalexamen heb ik op dezelfde afdeling, onder leiding van Prof. Dr. J. Reuss
het promotie-onderzoek verricht waarvan de resultaten in dit proefschrift zijn
neergelegd.
Vanaf 1 november 1983 zal ik werkzaam zijn op het centraal laboratorium van
Philips' Hoofdindustriegroep Licht te Eindhoven.
STELLINGEN
1. De gevoeligheid van de door Owyoung en medewerkers bedreven gestimuleerde Raman technieken in moleculaire bundels kan ordes van grootte opgevoerd worden door toepassing van selectieve multifoton ionisatie vanuit de grondtoestand waardoor de hoge spectrale resolutie van gestimuleerde Raman verstrooiing gearmd gaat met de hoge gevoeligheid van ionendetectie ("ion-dip spectroscopy").
P. Esherick, A.J. Grimley and A. Ouyoung, Chem. Phys. 73(1982) 271
2. In hun metingen aan spontane IR fluorescentie in een vrije expansie van CO2 houden Fenn en medewerkers ten onrechte geen rekening met emissie en zelfabsorptie processen in het meegemeten omringende achtergrondgas ter verklaring van de gevonden rotationele niet-Boltzmann verdeling.
S.P. Venkateshan, S.B. Ryali and J.B. Fenn, J. Chem. Phys. 77(1982) 2599
3. Voor de frequentie van de Vg mode van СгНц in de gasfase worden reeds gedurende meer dan twee decennia onderling tegenstrijdige foutieve waarden aangehaald.
M. Casassa, D. Bomse and K. Janda, J. Chem. Phys. 74(1981) 5044 T. Fukumi, Opt. Corm. 30(1979) 351
4. Bij de MPD metingen aan СГзВг (Borsella et al.) is ten onrechte geen rekening gehouden met eventueel sterke verschillen in ionisatie kanalen voor al dan niet vibrationeel hoog aangeslagen moleculen.
E. Borsella, R. Pantani, A. Giardini-Guidoni, D. Masai, Λ. Palucoi and J. Reuss, Chem. Phys. Lett. 93(1982) 523
5. Bij de bepaling van bundel-rotatietemperaturen via toestandbezettingen
in EBR en MBR experimenten kunnen moeilijkheden ten gevolge van ongelijke machinefactoren voor bij de bepaling betrokken rotatieniveaus omzeild worden wanneer de stagnatie-druk afhankelijkheid van de genormeerde bezetting van een enkel rotatieniveau een maximum vertoont.
A. Amirav, U. Even, J. Jortner and L. Kleinman, J. Chem. Phys. 73(1980) 4217
6. Het verdient aanbeveling om via welbekende technieken extreem gekoelde
СгНі, complexen te produceren in een poging spectrale structuren op te lossen die tot nu toe aan predissociatie metingen zijn ontsnapt.
J. Geraedts, proefschrift 1983, Nijmegen
7. Gezien de aangetoonde mutagene en kankerverwekkende eigenschappen van verschillende chemische stoffen en het feit dat langdurige expositie tot detecteerbare chromosoomafwijkingen in witte bloedcellen leidt (1,2), verdient het aanbeveling spoedig over te gaan tot een regelmatige screening van alle werknemers in die bedrijven waar deze stoffen worden geproduceerd of verwerkt.
1. H.J. Evans and D.C. Lloyd (eds.) (1978) Mutagen-induoed chromosome damages in man. University Press, Edinburgh.
2. H.J. Evans, Sister chromatid exchanges and disease states in man. In: S. Wolff (ed. )( 1982) Sister chromatid exchange, J. Wiley & Sons, N.Y.
8. Fabrikanten van laserbuizen dreigen zich uit de markt te prijzen.
9. Bij de keuze voor zwart-wit dan wel kleuren fotografie dient men zich te bedenken dat kleuren de inhoud van een foto kunnen verdoezelen.
10. Het aantal van 620 kinderartsen op 13.02Z Nederlanders jonger dan 10 jaar tegen 2 geriaters op 16.05% Nederlanders ouder dan 60 jaar nodigt uit tot omscholing (situatie op 1 januari 1982).
11. De reclameboodschap "U drinkt uw koffie toch niet om de Coffeine" gaat geheel voorbij aan de algemeen aanvaarde sociaal-integrerende functie van de volle gerijpte koffieboon, bij uitstek in de ochtenduren.
12. In het kader van de nieuwe rampenwetgeving verdient overspanning van ons land met een nationaal trampolinen-netwerk de voorkeur boven verdergaande bouw van atoomschuilkelders.
Gerard Luijks
7 oktober 1983