Embed Size (px)
Citation preview
1
RAMAN SPECTROSCOPY FOR THE IN-LINE POLYMER-DRUG QUANTIFICATION AND SOLID STATE CHARACTERIZATION DURING A PHARMACEUTICAL HOT-MELT EXTRUSION PROCESS L. Saerensa, L. Dierickxb, B. Lenainc, C. Vervaetb, J.P. Remonb, T. De Beera aLaboratory of Pharmaceutical Process Analytical Technology, Ghent University bLaboratory of Pharmaceutical Technology, Ghent University cKaiser Optical Systems Europe, France Corresponding Author: Lien Saerens, Ghent University Laboratory of Pharmaceutical Process Analytical Technology Harelbekestraat 72 9000 Ghent Belgium Tel: +32 9 264 80 94 Fax: +32-9-264.81.96 E-mail: [email protected] Abstract The aim of this study was to evaluate the suitability of Raman spectroscopy as a Process Analytical Technology (PAT) tool for the in-line determination of the active pharmaceutical ingredient (API) concentration and the polymer-drug solid state during a pharmaceutical hot-melt extrusion process. For in-line API quantification, different metoprolol tartrate (MPT) - Eudragit® RL PO mixtures, containing 10, 20, 30, and 40% MPT respectively, were extruded and monitored in-line in the die using Raman spectroscopy. A PLS model, regressing the MPT concentrations versus the in-line collected Raman spectra, was developed and validated, allowing real-time API concentration determination. The correlation between the predicted and real MPT concentrations of the validation samples is acceptable (R²=0.997) The predictive performance of the calibration model is rated by the root mean square error of prediction (RMSEP), which is 0.59%. Two different polymer-drug mixtures were prepared to evaluate the suitability of Raman spectroscopy for in-line polymer-drug solid state characterization. Mixture 1 contained 90% Eudragit® RS PO and 10% MPT, and was extruded at 140°C, hence producing a solid solution. Mixture 2 contained 60% Eudragit® RS PO and 40% MPT, and was extruded at 105°C, prod ucing a solid dispersion. The Raman spectra collected during these extrusion processes provided two main observations. First, the MPT Raman peaks in the solid solution broadened compared to the corresponding solid dispersion peaks, indicating the presence of amorphous MPT. Secondly, peak shifts appeared in the spectra of the solid dispersion and solid solution compared to the physical mixtures, suggesting interactions between Eudragit® RS PO and MPT, most likely hydrogen bonds. These shifts were larger in the spectra of the solid solution. DSC analysis confirmed these Raman solid state observations and the interactions seen in the spectra. Raman spectroscopy is a potential PAT-tool for in-line determination of the API-concentration and the polymer-drug solid state during pharmaceutical hot-melt extrusion. KEY WORDS: Raman spectroscopy, Hot-Melt Extrusion (HME), Process Analytical Technology (PAT), In-line measurements, solid dispersions, solid solutions
2
Introduction
Hot-melt extrusion (HME) is one of the most widely used processing technologies in the plastic, food and rubber industry[1]. Recently, it also found its application in pharmaceutical manufacturing operations. Pharmaceutical hot-melt extrusion processes are currently applied for the manufacture of a variety of dosage forms and formulations such as granules, pellets, tablets, suppositories, implants, stents, transdermal systems and ophthalmic inserts[1]. HME offers several advantages over traditional pharmaceutical processing techniques[1-5]: the process is anhydrous; poorly compactable materials can be incorporated into tablets; HME has a short residence time; it enables superior mixing (both distributive and dispersive); it improves the dissolution rate and the bioavailability of poorly water soluble drugs by the formation of solid solutions or solid dispersions; it allows the production of formulations with controlled, modified, sustained and targeted release; and it also allows masking of the bitter taste of several API’s[1]. Drawbacks of the technology are related to a high energy input coming from the applied shear forces and high temperature, which could lead to either drug or polymer degradation, thus having a significant impact on product quality. Also, thermal stability of the individual compounds is a requirement for the process, although not all thermolabile compounds are excluded because of the short processing times.
Today, extruders allow in-line monitoring and control of the process parameters barrel and die
temperature, melt pressure in the extruder and die, feed rate, screw speed and motor load. The motor load and melt pressure depend on the temperature, feed rate and screw speed, and on the molecular weight of polymer and drug and on polymer miscibility in binary mixtures when the feed rate and screw speed are kept constant[2]. However, these parameters are all inherent to the hot-melt extrusion equipment. In-line monitoring and control of quality parameters corresponding to the extruded product itself, such as drug load and solid state, have not been performed yet to our best knowledge. Besides real-time product quality evaluation, this might increase the understanding of the product behaviour during extrusion.
The FDA has introduced the concept of PAT in 2004[6]. Pharmaceutical products must meet
very strict specifications. Conventional pharmaceutical manufacturing is generally accomplished using batch processing followed by time-consuming, expensive and less efficient off-line laboratory testing on randomly collected samples to evaluate the end product quality. The processes themselves are not fully understood and are often inefficient black-boxes. The general principle of PAT is to build quality into products rather than testing it into products. PAT-tools such as Raman spectroscopy provide in-line and real-time process information concerning critical formulation parameters, which allows the steering of processes towards their desired state through adaptations of process settings. Consequently, final product quality is ensured and end product characteristics can be predicted, hence avoiding batch losses.
Raman spectroscopy enables rapid, non-destructive and in-line measurements, and has
previously been used during hot-melt extrusion (single screw extrusion) to monitor EVA copolymer melt composition[7,8], to analyze film formulations[9], and to monitor the composition of a series of high-density polyethylene (HDPE)/polypropylene (PP) blends[10,11]. It has also been implemented in a twin screw extrusion process to determine the concentration of Irganox additive in polypropylene[12]. Raman spectroscopy has also been applied for off-line confirmation of drug dispersion within PEO and interaction with PEO in extrudates[13], for characterization of the hydrogen bonding nature in α and amorphous indomethacin[14], and for comparison of the solid state properties of solid dispersions prepared by HME and solvent co-precipitation processes[15].
The formation of solid dispersions and solid solutions is one of the most promising strategies
to improve the oral bioavailability of poorly water soluble drugs[16]. In a solid solution, the drug is dissolved at the molecular level, while in a solid dispersion the drug is in a two phase system with the polymer. In this study, both solid solutions and solid dispersions were prepared using twin screw hot-melt extrusion.
3
Materials and Methods 1. Materials and Hot-Melt Extrusion
Hot-melt extrusion was performed using a Prism Eurolab 16 co-rotating, fully intermeshing twin screw extruder (ThermoFisher Scientific, Germany). The standard screw configuration was used. The extruder exists of different segments, and the temperature of each segment and the die can be controlled separately. The hot-melt extruder was equipped with a DD Flexwall® 18 gravimetric feeder (Brabender Technologie, Germany), which was set in its gravimetric feeding mode.
For the development of a calibration model allowing in-line API quantification, 4 different polymer-drug mixtures, containing 10, 20, 30 and 40% (w/w) API respectively, were extruded. Eudragit® RL PO (Evonik Röhm, Germany) was used as polymer and metoprolol tartrate (MPT) was used (Esteve Quimica, Spain) as API. Eudragit® RL PO is an amorphous copolymer of acrylic and methacrylic acid esters with a low content of quaternary ammonium groups, which are present as salts. MPT is a crystalline API. The Hansen solubility parameters of all polymers and MPT were calculated using SPWin version 2.1 (J. Breitkreutz, 1998)[17]. Before extrusion, the polymer and drug were mixed in a mortar. Each mixture was hot-melt extruded with a feeder speed of 0.3 kg/h and a screw speed of 50 rpm. The barrel temperature profile was set at 90-140-140-140-140-140°C (from hopper to die). The torque dropped from 70% motor capacity for the 10% MPT mixture, over 35% for the 20% MPT mixture and 20% for the 30% MPT mixture to 15% for the mixture containing 40% MPT. The die pressure, measured with a pressure probe, decreased with increasing MPT content, from 2 bar in the 10% MPT mixture to 0 bar in the 40% mixture.
Two different polymer-drug mixtures were prepared to evaluate the suitability of Raman
spectroscopy for in-line polymer-drug solid-state characterization. Mixture A contained 10% MPT and 90% Eudragit® RS PO (Evonik Röhm, Germany), which has an identical molecular structure as the RL PO form, but contains fewer ammonium groups. It was extruded with a barrel temperature profile of 90-140-140-140-140-140°C, which is above the meltin g temperature of pure MPT, 120°C, to produce a solid solution. This resulted in a torque of 50% of the motor capacity and a die pressure of 1 bar. Mixture B consisted of 60% Eudragit® RS PO and 40% MPT, and was extruded with a barrel temperature profile of 90-105-105-105-105-105°C, re sulting in a solid dispersion. The torque was 65% and the die pressure 0 bar. For both mixtures, the feeder speed rate was set at 0.4 kg/h and the screw speed at 80 rpm. The minimum batch size used was 700g of mixture.
2. Raman spectroscopy
Raman spectra were collected with a Raman Rxn1 spectrometer (Kaiser Optical Systems, Ann Arbor, MI, USA), equipped with an air-cooled CCD detector. A fibre-optic Raman Dynisco probe was used to monitor the extrusion process in-line. The Raman Dynisco probe was built into the extrusion die, behind the pressure probe, to monitor the process stream before the melt is forced through the die. The laser wavelength was the 785 nm line from a 785 nm Invictus NIR diode laser. All spectra were recorded with a resolution of 4 cm-1 and an exposure time of 1 second, using a laser power of 400 mW. Spectra were collected every 5 seconds. Data collection and data transfer were automated using the HoloGRAMSTM data collection software, the HoloREACTTM reaction analysis and profiling software and the Matlab software (version 7.1, The MathWorks Inc., Natick, MA). The analyzed spectral region was 50 – 1800 cm-1, since this region contained all useful drug and polymer information.
Data analysis was performed using SIMCA P+ (Version 12.0.1.0, Umetrics, Umeå, Sweden).
Mean centering, Savitzky-Golay and SNV pre-processing were applied on the in-line collected spectra before principal components analysis (PCA) and partial least squares analysis (PLS), to exclude inter-batch variation and variation caused by baseline-shifts, respectively. For PCA and PLS, 20 spectra of each polymer-drug mixture were used to develop the models. A PLS model was developed, regressing the MPT-concentrations (Y) versus the corresponding in-line collected Raman spectra (X). This model was validated with 20 other spectra from each polymer-drug mixture, which were not used to develop the PLS model.
4
3. DSC analysis Differential scanning calorimetry with a DSC Q 2000 (TA Instruments, Belgium) was used to confirm the Raman findings. Thermograms were produced with the Thermal Advantage Release 5.1.2 software and analysed with TA Instruments Universal Analysis 2000 4.7A (TA Instruments, Belgium). Aluminium hermetic pans (TA Instruments, Belgium) were used to contain the samples. Measurements were carried out in a nitrogen atmosphere, with a heating/cooling rate of 10°C/min. Differential Scanning calorimetry can differentiate between solid solutions (molecularly dispersed drug), solid dispersions in which drug is only partly molecularly dispersed and physical mixtures of drug and carrier. The lack of an endothermic melting transition in the DSC scan of the hot-melt extrudate indicates that the drug is present in its amorphous form[3]. Results and discussion 1. In-line API concentration monitoring
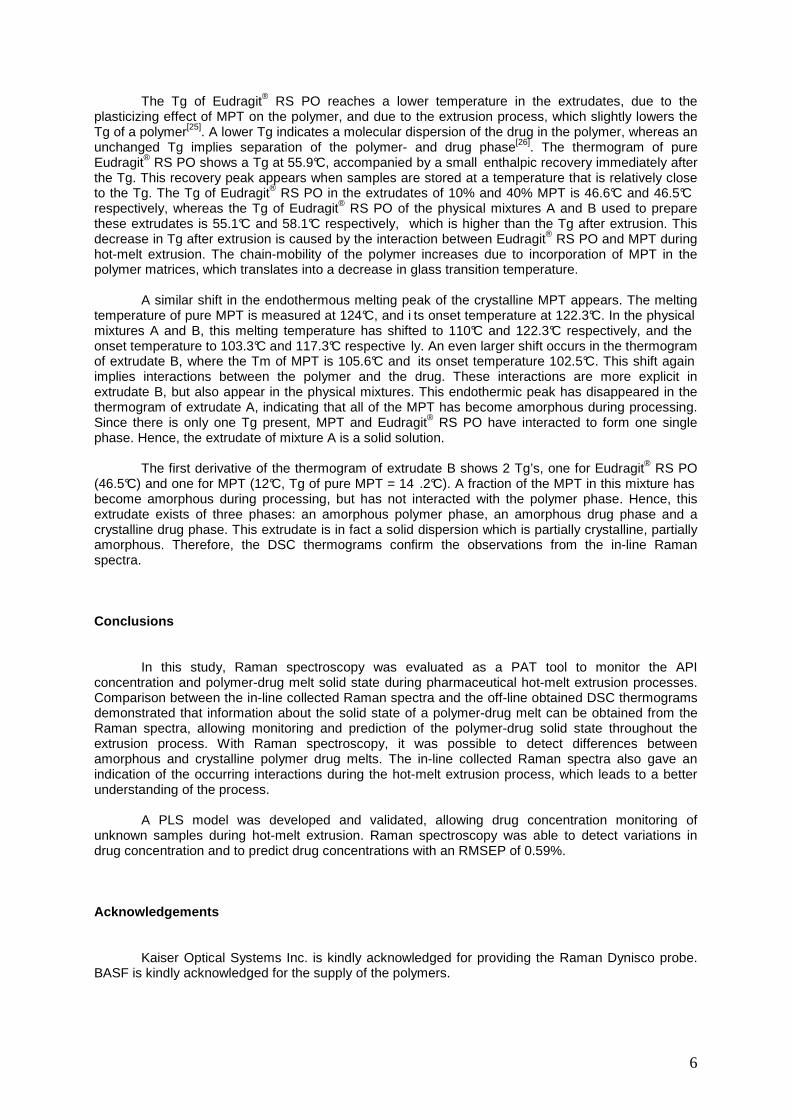
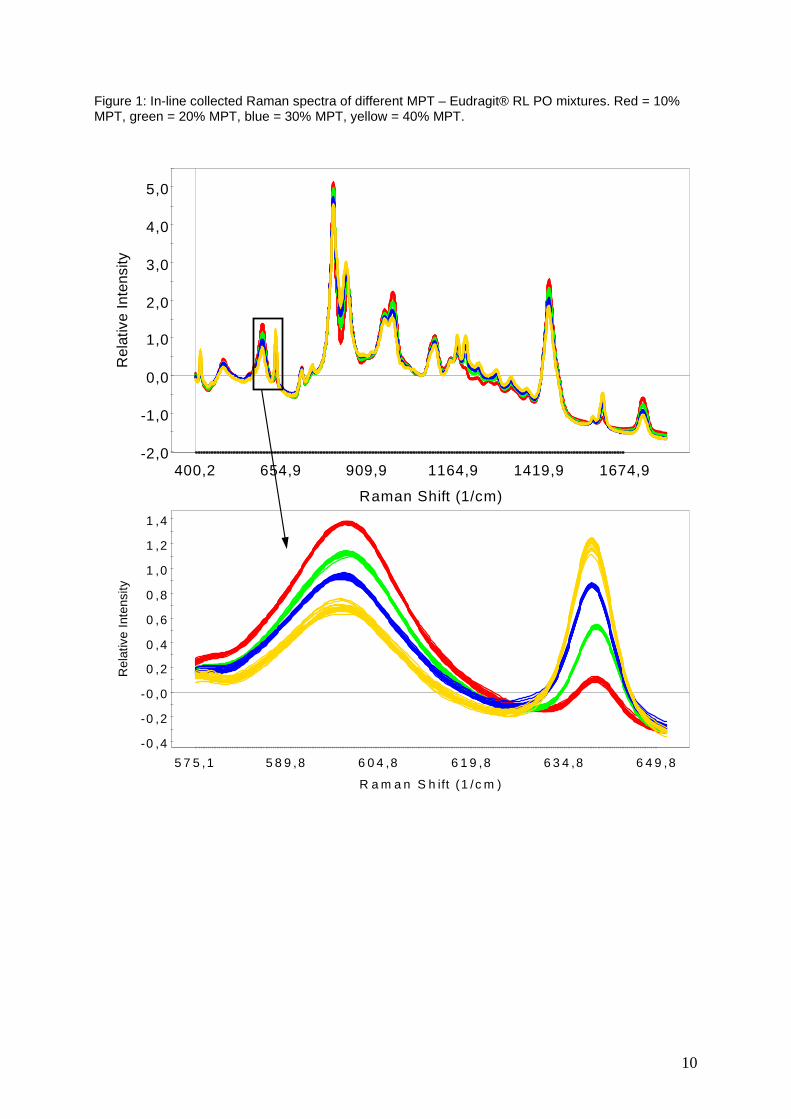
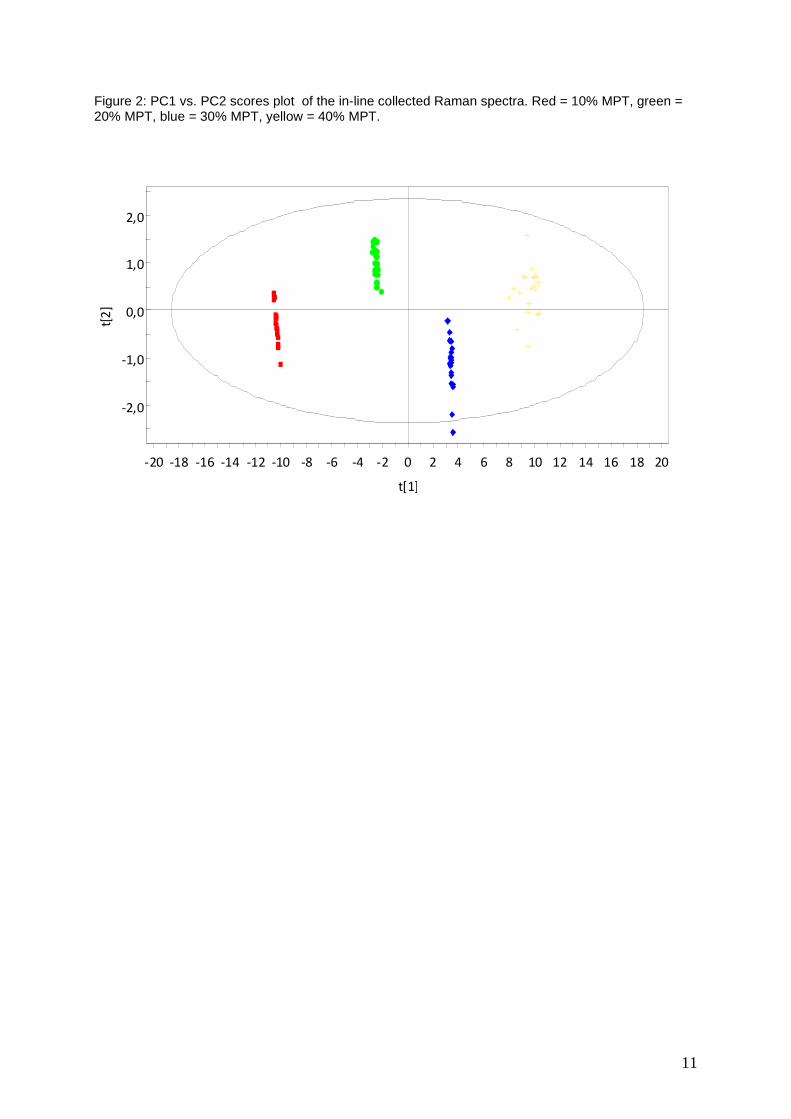
10, 20, 30 and 40% MPT (API) - Eudragit® RL PO (polymer) mixtures were extruded. The concentration variations are visible in the collected Raman spectra (Fig. 1). PCA on all in-line collected spectra showed that two principle components covered nearly all spectral variation. The first principal component captures 97% of the variation, i.e. the variation caused by concentration differences. The second principal component represents only 1% of extra variation. This variation is most likely not related to the differences in API concentration. The PC1 versus PC2 scores plot (Fig. 2) shows a clear distinction between the spectra of the different mixtures and confirms that PC1 captures the variation caused by differences in API-polymer concentration.
For the development of the PLS model, allowing prediction of the MPT concentration in
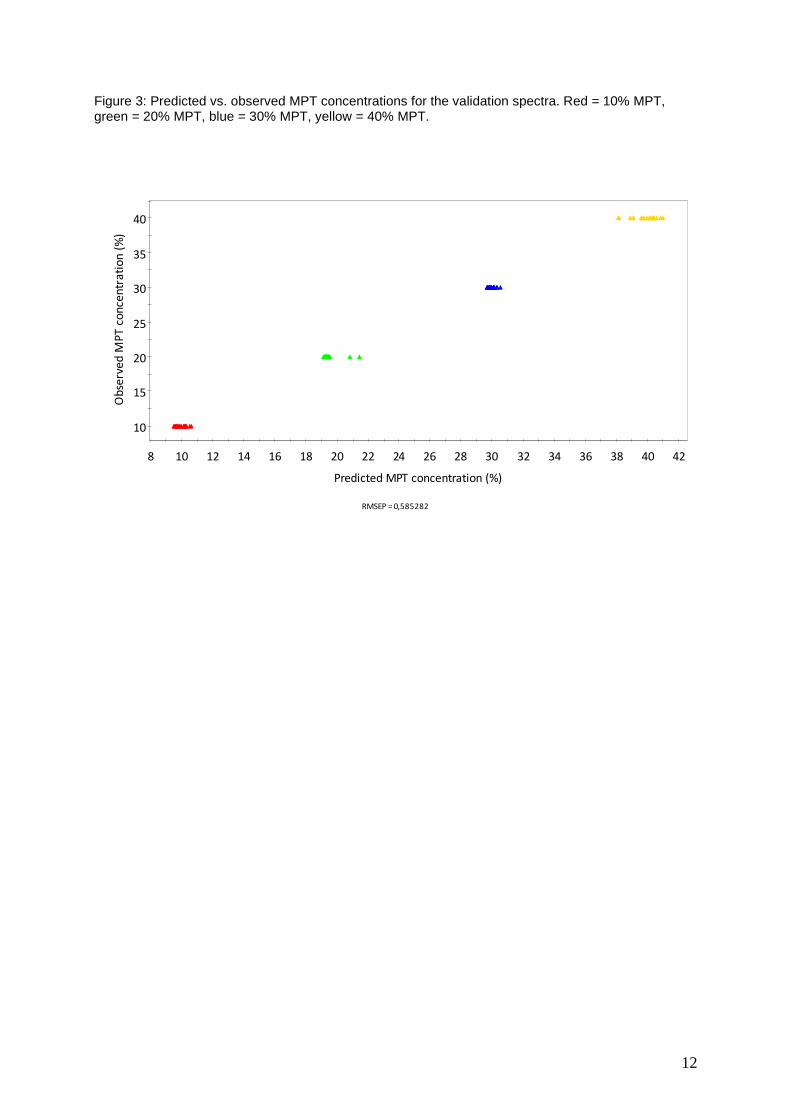
unknown samples during hot-melt extrusion processes, the in-line Raman collected spectra (X) were regressed versus the known MPT concentrations (Y). Two PLS components were chosen, since the goodness of prediction of the model (Q² =0.997) did not increase significantly after adding extra components[18]. To evaluate the predictive performance of this model, 20 test spectra of each mixture were used (i.e., other spectra than used for composing the PLS model) and were projected onto the model to predict the corresponding MPT concentrations. Fig. 3 shows the predicted versus the observed MPT concentration values for these validation spectra (R² = 0.997). The resulting root mean square error of prediction (RMSEP) is 0.59%. 2. In-line solid state monitoring Two component extrudates can exist in several solid states[19]. In solid solutions, both the polymer and the drug are amorphous, and have interacted with each other to form one molecular phase. Solid dispersions can exist as two types: a solid crystalline or a solid amorphous dispersion. Both extrudates contain two phases. In the crystalline dispersion, the drug is still in its crystalline form, whereas in the amorphous dispersion both the drug and the polymer are amorphous, but have not interacted at a molecular level. Each of these solid states has its own physical properties like storage stability, dissolution rate etc. The state of the drug in the dosage form may have profound impact on the processibility and stability of the product. Polymers can improve the physical stability of drugs in solid dispersions, due to either an increase of the glass transition temperature (Tg) in the miscible mixture which reduces the molecular mobility at storage temperatures, or due to specific interactions such as ion-dipole interactions and intermolecular hydrogen bonding with functional groups of the drug. For complete miscibility, these interactions between polymer and drug are required[16]. To obtain a good compatibility between polymer and drug, the difference between solubility parameters (δ) of polymer and drug should not be much more than 2.0 (MPa)1/2 [21]. When this is

5
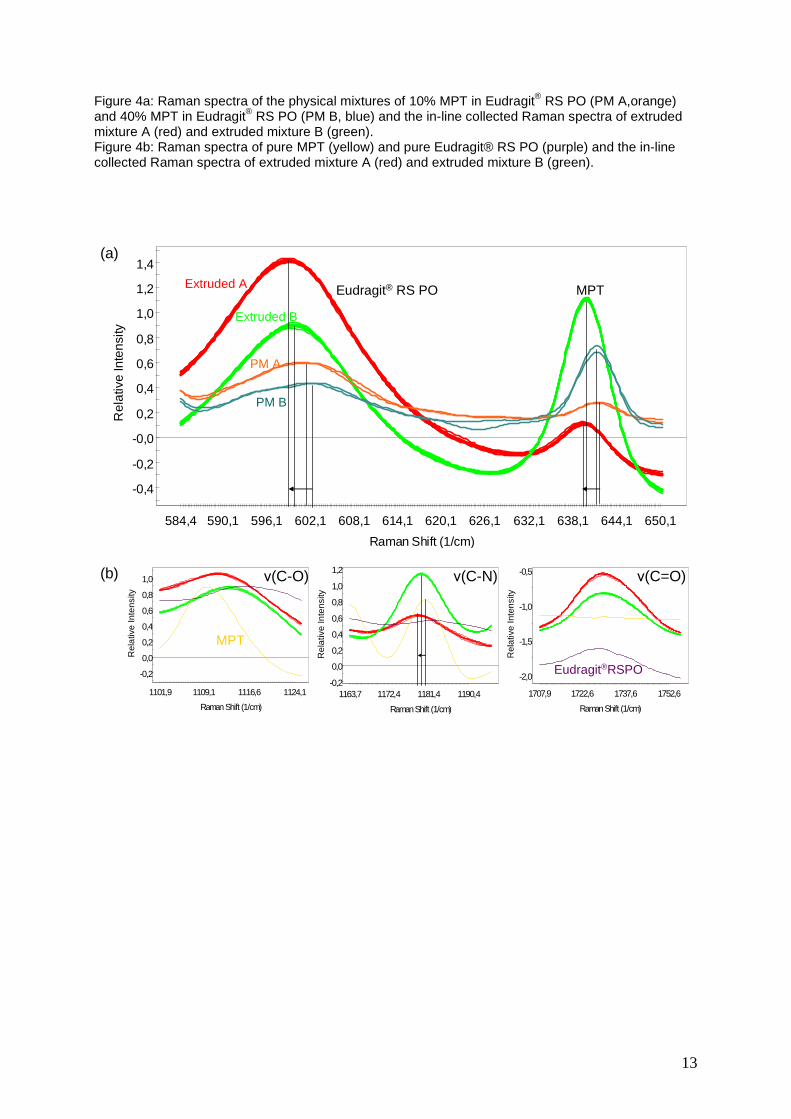
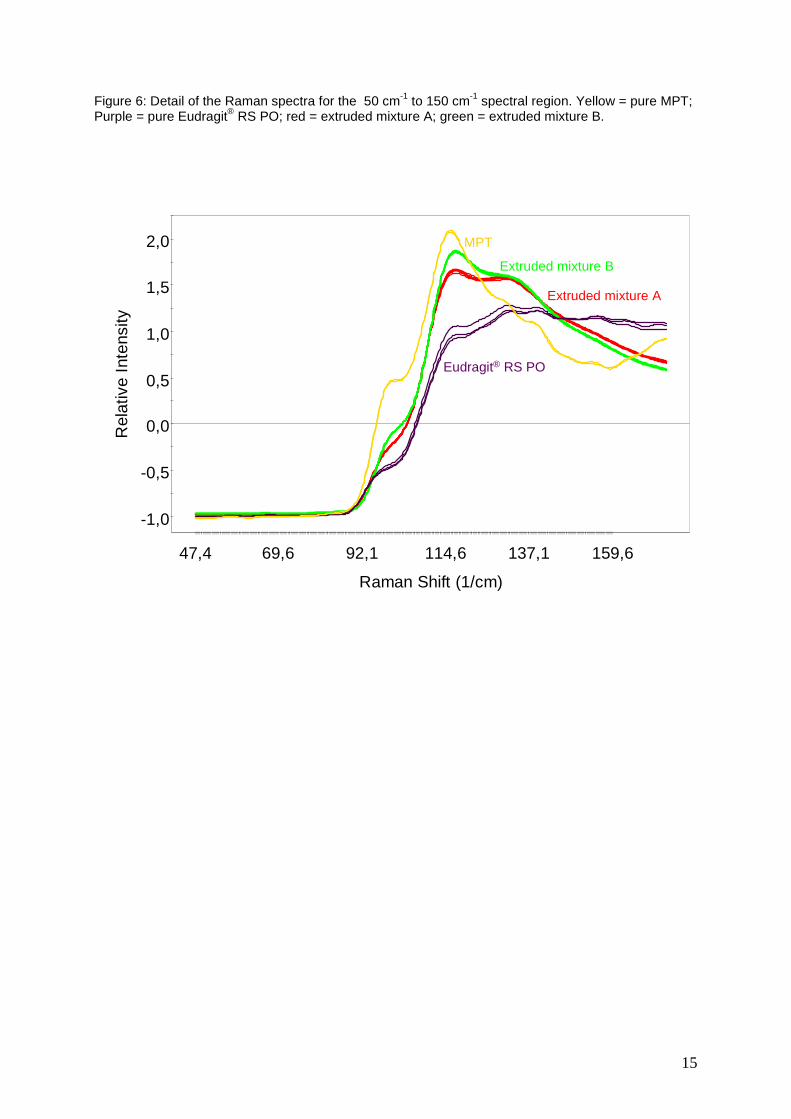
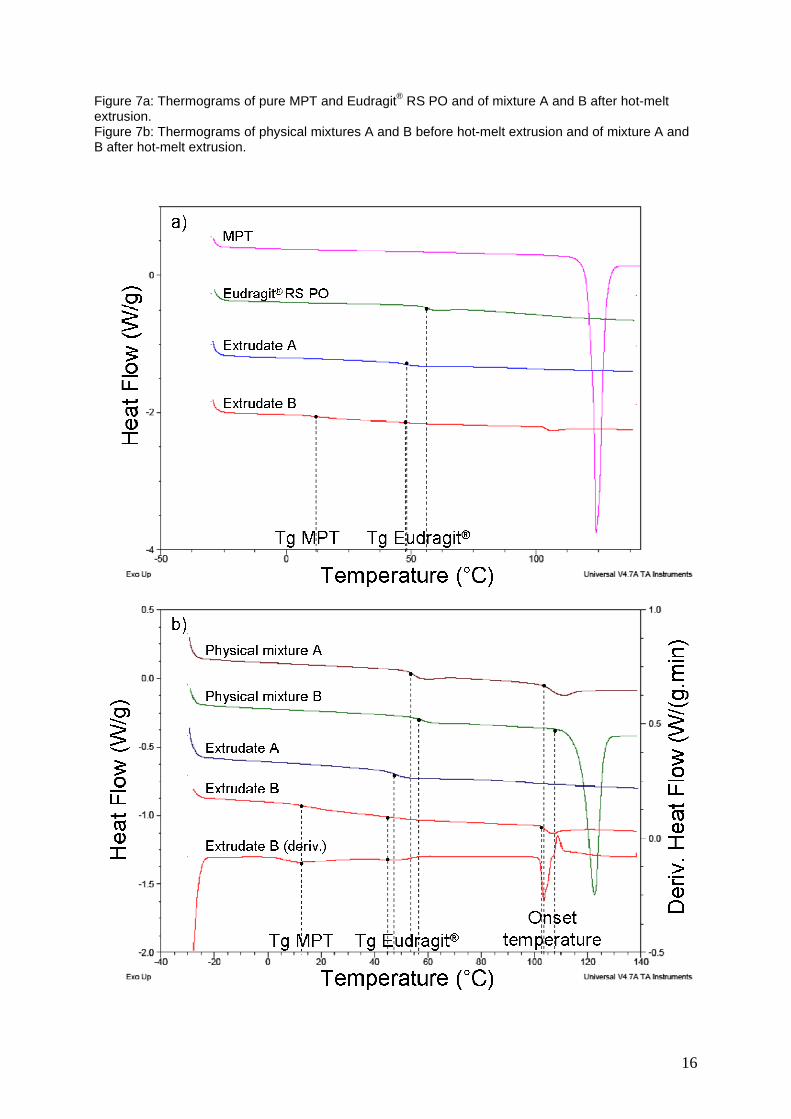
achieved, miscibility is significant and, therefore, glass solution formation during melt extrusion can be obtained. The Hansen solubility parameter for MPT is 23.59 (MPa)1/2, 19.64 (MPa)1/2 for Eudragit® RS PO and 19.58 (MPa)1/2 for Eudragit® RL PO. The smaller the difference in solubility parameters, the greater the miscibility between two compounds. Hence, a good miscibility and possible formation of a solid solution between Eudragit® RS PO and MPT is expected. Two mixtures (mixture A and B, containing 10% and 40% MPT in Eudragit® RS PO respectively) were extruded at two different extrusion temperatures (140°C and 105°C respectively). Mixture A was expected to result in a solid solution where the MPT has transferred from the crystalline to the amorphous state. This would result from a high processing temperature (above the melting temperature of pure MPT) and a good miscibility between both components. Mixture B was expected to result in a solid dispersion, since the extrusion temperature is below the melting temperature of MPT, which will prevent the transfer of all MPT in the melt into the amorphous state. Hence, a fraction of the MPT will remain crystalline and the extrudate of mixture B will exist of at least 2 phases. Fig. 4a shows a detail of the in-line collected Raman spectra for the extruded mixtures A and B and the Raman spectra of the physical mixtures before extrusion. Comparison of these spectra resulted into two major observations. First, throughout the entire Raman spectrum, the extrudates show peak shifts compared to the spectra of the pure components and the spectra of the physical mixtures. These peak shifts in the spectra of the extrudates indicate interactions between MPT and Eudragit® RS PO. These interactions are stronger for extruded mixture A, as the shifts are larger. All MPT in extruded mixture A is amorphous, which enhances interaction with the polymer. In extruded mixture B, some MPT is amorphous, but the largest fraction remains crystalline, explaining the smaller peak shifts for this mixture. The occurring interactions are most likely hydrogen bonds between MPT and Eudragit® RS PO, which can take place between the hydroxyl functions or amino functions from MPT and the carbonyl groups from the polymer (Fig. 5). Shifts of the corresponding Raman peaks from these groups are indeed visible (Fig. 4b). Hydrogen bonding in Raman and IR spectra can be mainly observed as a broadening of the spectral bands and a shift of these bands to lower frequencies[21]. The peak of ν(C=O) stretch vibration[22] of Eudragit® RS PO has shifted from 1729.5 cm-1 in pure Eudragit to 1729.2 cm-1 in extruded mixture B and 1729.2 cm-1 in extruded mixture A. The shift of the vibration of this bond is much smaller than that of the O-H or N-H stretch[21]. The peak of ν(C-N) in pure MPT can be found at 1181 cm-1[23], and shifts over 1179.6 cm-1 in extruded mixture B to 1178.7 cm-1 in extruded mixture A. The ν(C-O) peak of pure MPT[23] is located at 1109.7 cm-1, but shifts can not be seen in the in-line collected spectra, since Eudragit® RS PO also has a ν(C-O) peak, appearing at 1116.3 cm-1. These peaks overlap in the spectra of the extruded mixtures, causing difficulties to see the peak shifts. The decrease in vibration frequency of ν(C-N) adjacent to the hydrogen bond is due to weakening of these bonds, caused by the hydrogen bond formation. A second observation of interest lies in the peaks of MPT. Since pure MPT is crystalline, its Raman spectrum contains narrow, well defined peaks. Extruded mixture B still contains a fraction of MPT in the crystalline state. The peaks of MPT have slightly broadened, but are still well defined. In extruded mixture A, the MPT peaks have broadened or even disappeared, indicating amorphous MPT. Since Eudragit® RS PO is an amorphous polymer, due to the absence of complete stereoregularity and the presence of bulky side groups[24], this broadening can not occur in polymer peaks. Peaks of Eudragit® RS PO maintain their form. In the physical mixtures, the peaks of MPT remain as sharp as the original peaks. Interactions or transitions have not taken place in these physical mixtures. The spectra in the 150 – 50 cm-1 region of the Raman spectrum contain information about lattice vibrations corresponding to vibrations and translations of the entire molecule in the lattice[14]. These vibrations are characteristic for the crystal structure and sensitive to local order or disorder. For the spectrum of pure MPT, this region has sharp, well defined peaks, which are still present in the spectra of extruded mixture B, but which are nearly disappeared in the spectra of extruded mixture A. In extruded mixture A, broad bands are visible, indicating a more disordered structure (Fig. 6) . DSC analysis was performed to confirm these interpretations drawn from the Raman spectra. For the samples containing Eudragit® RS PO, the maximum heating temperature was restricted to 140°C, to avoid degradation of the polymer, which c an occur above 150°C. Fig. 7a depicts the thermograms of pure MPT and Eudragit® RS PO, together with the thermograms of the extrudates. Fig. 7b presents the thermograms of the physical mixtures prior to extrusion, the thermograms of the extrudates and the second derivative of the extrudate of mixture B.
6
The Tg of Eudragit® RS PO reaches a lower temperature in the extrudates, due to the plasticizing effect of MPT on the polymer, and due to the extrusion process, which slightly lowers the Tg of a polymer[25]. A lower Tg indicates a molecular dispersion of the drug in the polymer, whereas an unchanged Tg implies separation of the polymer- and drug phase[26]. The thermogram of pure Eudragit® RS PO shows a Tg at 55.9°C, accompanied by a small enthalpic recovery immediately after the Tg. This recovery peak appears when samples are stored at a temperature that is relatively close to the Tg. The Tg of Eudragit® RS PO in the extrudates of 10% and 40% MPT is 46.6°C and 46.5°C respectively, whereas the Tg of Eudragit® RS PO of the physical mixtures A and B used to prepare these extrudates is 55.1°C and 58.1°C respectively, which is higher than the Tg after extrusion. This decrease in Tg after extrusion is caused by the interaction between Eudragit® RS PO and MPT during hot-melt extrusion. The chain-mobility of the polymer increases due to incorporation of MPT in the polymer matrices, which translates into a decrease in glass transition temperature.
A similar shift in the endothermous melting peak of the crystalline MPT appears. The melting
temperature of pure MPT is measured at 124°C, and i ts onset temperature at 122.3°C. In the physical mixtures A and B, this melting temperature has shifted to 110°C and 122.3°C respectively, and the onset temperature to 103.3°C and 117.3°C respective ly. An even larger shift occurs in the thermogram of extrudate B, where the Tm of MPT is 105.6°C and its onset temperature 102.5°C. This shift again implies interactions between the polymer and the drug. These interactions are more explicit in extrudate B, but also appear in the physical mixtures. This endothermic peak has disappeared in the thermogram of extrudate A, indicating that all of the MPT has become amorphous during processing. Since there is only one Tg present, MPT and Eudragit® RS PO have interacted to form one single phase. Hence, the extrudate of mixture A is a solid solution.
The first derivative of the thermogram of extrudate B shows 2 Tg’s, one for Eudragit® RS PO
(46.5°C) and one for MPT (12°C, Tg of pure MPT = 14 .2°C). A fraction of the MPT in this mixture has become amorphous during processing, but has not interacted with the polymer phase. Hence, this extrudate exists of three phases: an amorphous polymer phase, an amorphous drug phase and a crystalline drug phase. This extrudate is in fact a solid dispersion which is partially crystalline, partially amorphous. Therefore, the DSC thermograms confirm the observations from the in-line Raman spectra. Conclusions In this study, Raman spectroscopy was evaluated as a PAT tool to monitor the API concentration and polymer-drug melt solid state during pharmaceutical hot-melt extrusion processes. Comparison between the in-line collected Raman spectra and the off-line obtained DSC thermograms demonstrated that information about the solid state of a polymer-drug melt can be obtained from the Raman spectra, allowing monitoring and prediction of the polymer-drug solid state throughout the extrusion process. With Raman spectroscopy, it was possible to detect differences between amorphous and crystalline polymer drug melts. The in-line collected Raman spectra also gave an indication of the occurring interactions during the hot-melt extrusion process, which leads to a better understanding of the process. A PLS model was developed and validated, allowing drug concentration monitoring of unknown samples during hot-melt extrusion. Raman spectroscopy was able to detect variations in drug concentration and to predict drug concentrations with an RMSEP of 0.59%. Acknowledgements Kaiser Optical Systems Inc. is kindly acknowledged for providing the Raman Dynisco probe. BASF is kindly acknowledged for the supply of the polymers.
7
References [1] R. Chokshi and H. Zia, Hot-melt extrusion technique: A review, Iranian J. Pharm. Res. 3 (2004) 3-16. [2] J. Breitenbach, Melt extrusion: From process to drug delivery technology, Eur. J. Pharm. Biopharm. 54 (2002) 107-117. [3] M.M. Crowley, F. Zhang, M.A. Repka, S. Thumma, S.B. Upadhye, S. Battu, J.W. McGinity and C. Martin, Review article: Pharmaceutical Applications of Hot-Melt Extrusion: Part I, Drug Dev. Ind. Pharm. 33 (2007) 909-926. [4] M.A. Repka, S. Battu, S.B.Upadhye, S. Thumma, M.M. Crowley, F. Zhang, C. Martin and J.W. McGinity, Review article: Pharmaceutical Applications of Hot-Melt Extrusion: Part II, Drug Dev. Ind. Pharm 33 (2007) 1043-1057. [5] M.A. Repka, S. Majumdar, S. Battu, R. Srirangam and S.B. Upadhye, Applications of hot-melt extrusion for drug delivery, Expert. Opin. Drug Deliv. 5 (2008) 1357-1376. [6] Food and Drug Administration, Process Analytical Technology Initiative, Guidance for Industry PAT - A Framework for Innovative Pharmaceutical development, Manufacturing and Quality Assurance (2004). [7] S.E. Barnes, M.G. Sibley, H.G.M. Edwards and P.D. Coates, Process monitoring of polymer melts using in-line spectroscopy, Trans. Inst. Meas. Control, 29 (2007) 453-465. [8] S.E. Barnes, E.C. Brown, M.G. Sibley, H.G.M. Edwards and P.D. Coates, Vibrational spectroscopic and ultrasound analysis for the in-process monitoring of poly(ethylene vinyl acetate) copolymer composition during melt extrusion, Analyst 130 (2005) 286-292. [9] V.S. Tumuluri, M.S. Kemper, I.R. Lewis, S. Prodduturi, S. Majumdar, B.A. Avery and M.A. Repka, Off-line and on-line measurements of drug loaded hot-melt extruded films using Raman spectroscopy, Int. J. Pharm. 357 (2008) 77-84. [10] S.E. Barnes, E.C. Brown, M.G. Sibley, H.G.M. Edwards, I.J. Scowen and P.D. Coates, Vibrational spectroscopic and ultrasound measurements for in-process characterisation of high density polyethylene/polypropylene mechanical blends during melt extrusion, Appl. Spectrosc. 59 (2005) 611-619. [11] P.D. Coates, S.E. Barnes, M.G. Sibley, E.C. Brown, H.G.M. Edwards and I.J. Scowen, In-process vibrational spectroscopy and ultrasound measurements in polymer melt extrusion, Polymer 44 (2003) 5937-5949. [12] I. Alig, D. Fischer, D. Lellinger and B. Steinhoff, Combination of NIR, Raman, Ultrasonic and Dielectric Spectroscopy for In-line Monitoring of the Extrusion Process, Macromol. Symp. 230 (2005) 51-58. [13] L. Li, O. AbuBaker and Z.J. Shao, Characterization of Poly(Ethylene Oxide) as a drug Carrier in Hot-Melt Extrusion, Drug Dev. Ind. Pharm. 32 (2006) 991-1002. [14] L.S. Taylor and G. Zografi, Spectroscopic Characterization of Interactions Between PVP and Indomethacin in Amorphous Molecular Dispersions, Pharm. Res. 14 (1997) 1691-1698. [15] Z. Dong, A. Chatterji, H. Sandhu, D.S. Choi, H. Chokshi and N. Shah, Evaluation of solid state properties of solid dispersions prepared by hot-melt extrusion and solvent co-precipitation, Int. J. Pharm. 355 (2007) 141-149. [16] T. Vasconcelos, B. Sarmento and P. Costa, Solid dispersions as strategy to improve oral bioavailability of poor water soluble drugs, Drug Discov. Today 12 (2007) 1068-1075.
8
[17] J. Breitkreutz, Prediction of Intestinal Drug Absorption Properties by Three-Dimensional Solubility Parameters, Pharm. Res. 15 (1998) 1370-1375. [18] L. Eriksson, E. Johansson, N. Kettaneh-Wold, J. Trygg, C. Wikström and S. Wold, Multi- and Megavariate Data Analysis Part I: Basic Principles and Applications, Umetrics Academy, Sweden (2006) pp. 63-101.
[19] A. Gryczke, Physical-chemical characterisation of polymers and actives to model and understand the changes the chances of successful extrusion. In: 2009 AAPS Annual Meeting, Los Angeles, California, 2009 [20] A. Forster, J. Hempenstall, I. Tucker and T. Rades, Selection of excipients for melt extrusion with two poorly water-soluble drugs by solubility parameter calculation and thermal analysis, Int. J. Pharm. 226 (2001) 147-161. [21] Y. He, B. Zhu and Y. Inoue, Hydrogen bonds in polymer blends, Prog. Polym. Sci. 29 (2004) 1021-1051. [22] M. De Veij, P. Vandenabeele, T. De Beer, J.-P. Remon and L. Moens, Reference Database of Pharmaceutical Excipients, J. Raman spectrosc. 40 (2008) 297-30. [23] G. Socrates, Infrared and Raman Characteristic Group Frequencies: Tables and Charts, John Wiley & Sons Ltd. , England, 2004. [24] C. Wu and J.W. McGinity, Influence of methylparaben as a solid state plasticizer on the physicochemical properties of Eudragit® RS PO hot-melt extrudates, Eur. J. Pharm. Biopharm. 56 (2003) 95-100. [25] V.B. Mathot, Calorimetry and Thermal Analysis of Polymers, Hanser Publishers, New York, NY (1994). [26] S. Qi, A. Gryczke, P. Belton and D.Q.M. Craig, Characterisation of solid dispersions of paracetamol and EUDRAGIT® E prepared by hot-melt extrusion using thermal, microthermal and spectroscopic analysis, Int. J. Pharm. 354 (2008) 158-167.

9
Figures
Figure 1: In-line collected Raman spectra of different MPT – Eudragit® RL PO mixtures. Red =
10% MPT, green = 20% MPT, blue = 30% MPT, yellow = 40% MPT. Figure 2: PC1 vs. PC2 scores plot of the in-line collected Raman spectra. Red = 10% MPT,
green = 20% MPT, blue = 30% MPT, yellow = 40% MPT. Figure 3: Predicted vs. Observed MPT concentrations for validation spectra. Red = 10% MPT,
green = 20% MPT, blue = 30% MPT, yellow = 40% MPT. Figure 4: Raman spectra of physical mixtures of 10% MPT in Eudragit® RS PO (orange) and
40% MPT in Eudragit® RS PO (blue) and in-line collected Raman spectra of mixture A (red) and mixture B (green).
Figure 5: Molecular structures of Eudragit® RL/RS PO and Metoprolol tartrate. Figure 6: Detail of Raman spectra from 50 cm-1 to 150 cm-1. Yellow = pure MPT; Purple = pure
Eudragit® RS PO; red = extruded mixture A; green = extruded mixture B. Figure 7a: Thermograms of pure MPT and Eudragit® RS PO and of mixture A and B after hot-
melt extrusion. Figure 7b: Thermograms of physical mixtures A and B before hot-melt extrusion and of mixture A
and B after hot-melt extrusion.
10
Figure 1: In-line collected Raman spectra of different MPT – Eudragit® RL PO mixtures. Red = 10% MPT, green = 20% MPT, blue = 30% MPT, yellow = 40% MPT.
-0 ,4
-0 ,2
-0 ,0
0 ,2
0 ,4
0 ,6
0 ,8
1 ,0
1 ,2
1 ,4
5 7 5 ,1 5 8 9 ,8 6 0 4 ,8 6 1 9 ,8 6 3 4 ,8 6 4 9 ,8
Rel
ativ
e In
tens
ity
R a m a n S h ift (1 /c m )
-2,0
-1,0
0,0
1,0
2,0
3,0
4,0
5,0
400,2 654,9 909,9 1164,9 1419,9 1674,9
Rel
ativ
e In
tens
ity
Raman Shift (1/cm)
11
Figure 2: PC1 vs. PC2 scores plot of the in-line collected Raman spectra. Red = 10% MPT, green = 20% MPT, blue = 30% MPT, yellow = 40% MPT.
-2,0
-1,0
0,0
1,0
2,0
-20 -18 -16 -14 -12 -10 -8 -6 -4 -2 0 2 4 6 8 10 12 14 16 18 20
t[2
]
t[1]
12
Figure 3: Predicted vs. observed MPT concentrations for the validation spectra. Red = 10% MPT, green = 20% MPT, blue = 30% MPT, yellow = 40% MPT.
10
15
20
25
30
35
40
8 10 12 14 16 18 20 22 24 26 28 30 32 34 36 38 40 42
Ob
serv
ed
MP
T c
on
ce
ntr
ati
on
(%
)
Predicted MPT concentration (%)
RMSEP = 0,585282 SIMCA-P+ 12.0.1 - 2010-07-07 16:29:56 (UTC+1)
13
Figure 4a: Raman spectra of the physical mixtures of 10% MPT in Eudragit® RS PO (PM A,orange) and 40% MPT in Eudragit® RS PO (PM B, blue) and the in-line collected Raman spectra of extruded mixture A (red) and extruded mixture B (green). Figure 4b: Raman spectra of pure MPT (yellow) and pure Eudragit® RS PO (purple) and the in-line collected Raman spectra of extruded mixture A (red) and extruded mixture B (green).
-0,4
-0,2
-0,0
0,2
0,4
0,6
0,8
1,0
1,2
1,4
584,4 590,1 596,1 602,1 608,1 614,1 620,1 626,1 632,1 638,1 644,1 650,1
Rel
ativ
e In
tens
ity
Raman Shift (1/cm)
Eudragit® RS PO MPTExtruded A
Extruded B
PM A
PM B
-0,2
0,0
0,2
0,4
0,6
0,8
1,0
1101,9 1109,1 1116,6 1124,1
Rel
ativ
e In
tens
ity
Raman Shift (1/cm)
ν(C-O)
MPT
-0,2
0,0
0,2
0,4
0,6
0,8
1,0
1,2
1163,7 1172,4 1181,4 1190,4
Rel
ativ
e In
tens
ity
Raman Shift (1/cm)
ν(C-N)
-2,0
-1,5
-1,0
-0,5
1707,9 1722,6 1737,6 1752,6
Rel
ativ
e In
tens
ity
Raman Shift (1/cm)
ν(C=O)
Eudragit®RSPO
(a)
(b)

14
Figure 5: Molecular structures of Eudragit® RL/RS PO and Metoprolol tartrate.
Eudragit® RL/RS PO Metoprolol tartrate
15
Figure 6: Detail of the Raman spectra for the 50 cm-1 to 150 cm-1 spectral region. Yellow = pure MPT; Purple = pure Eudragit® RS PO; red = extruded mixture A; green = extruded mixture B.
-1,0
-0,5
0,0
0,5
1,0
1,5
2,0
47,4 69,6 92,1 114,6 137,1 159,6
Rel
ativ
e In
tens
ity
Raman Shift (1/cm)
MPT
Extruded mixture A
Extruded mixture B
Eudragit® RS PO
16
Figure 7a: Thermograms of pure MPT and Eudragit® RS PO and of mixture A and B after hot-melt extrusion. Figure 7b: Thermograms of physical mixtures A and B before hot-melt extrusion and of mixture A and B after hot-melt extrusion.