Embed Size (px)
Citation preview
Raman imaging at biological interfaces:applications in breast cancer diagnosisSurmacki et al.
Surmacki et al. Molecular Cancer 2013, 12:48http://www.molecular-cancer.com/content/12/1/48
Surmacki et al. Molecular Cancer 2013, 12:48http://www.molecular-cancer.com/content/12/1/48
RESEARCH Open Access
Raman imaging at biological interfaces:applications in breast cancer diagnosisJakub Surmacki1, Jacek Musial2, Radzislaw Kordek2 and Halina Abramczyk1*
Abstract
Background: One of the most important areas of Raman medical diagnostics is identification and characterizationof cancerous and noncancerous tissues. The methods based on Raman scattering has shown significant potentialfor probing human breast tissue to provide valuable information for early diagnosis of breast cancer. A vibrationalfingerprint from the biological tissue provides information which can be used to identify, characterize anddiscriminate structures in breast tissue, both in the normal and cancerous environment.
Results: The paper reviews recent progress in understanding structure and interactions at biological interfaces ofthe human tissue by using confocal Raman imaging and IR spectroscopy. The important differences between thenoncancerous and cancerous human breast tissues were found in regions characteristic for vibrations ofcarotenoids, fatty acids, proteins, and interfacial water. Particular attention was paid to the role played byunsaturated fatty acids and their derivatives as well as carotenoids and interfacial water.
Conclusions: We demonstrate that Raman imaging has reached a clinically relevant level in regard to breast cancerdiagnosis applications. The results presented in the paper may have serious implications on understandingmechanisms of interactions in living cells under realistically crowded conditions of biological tissue.
Keywords: Breast cancer biochemical imaging, Interfacial water, Raman imaging, IR spectroscopy
BackgroundThe most important factors in improving the survival ratefor cancer patients are: reliable diagnosis for early detec-tion, early treatment, and treatment response monitoringproviding with unequivocal data. There is a profound clin-ical need for diagnostic tools to achieve these goals.The current diagnosis or prevention methods are based
on X-Ray mammography, magnetic resonance imaging(MRI), positron emission tomography (PET) and ultrason-ography. X-Ray mammography is the golden standard ofimaging examination used for breast cancer diagnosis.However, there are well-known limitations in terms of sen-sitivity and specificity, especially when scanning patientswith high breast density, common in younger women. Thisleads to relatively unsatisfying levels of false positive andfalse negative results, as high as 75% and 34%, respectively[1-3]. Moreover, mammography is not a specific screeningmethod, as it does not allow to differentiate between
* Correspondence: [email protected] of Laser Molecular Spectroscopy, Institute of Applied RadiationChemistry, Lodz University of Technology, Wroblewskiego 15, Lodz 93-590,PolandFull list of author information is available at the end of the article
© 2013 Surmacki et al.; licensee BioMed CentrCommons Attribution License (http://creativecreproduction in any medium, provided the or
benign and malignant tumors. The second standardmethod – ultrasonography is a fast and low-cost technique,but has a low spatial resolution [4]. The MRI technique of-fers a good contrast between different soft tissues of thebody, but has many drawbacks, like the long duration ofthe examination and the cost of the instrument. It alsocauses side effects in the patients like hyperthermia or anegative impact on the patient’s kidneys, related to the useof gadolinium contrast agent [5]. Positron Emission Tom-ography (PET) is an appealing complementary techniquefor breast imaging, but the image resolution of PET is lowand typically ranges between 4 and 7 mm. To improveresolution and contrast between normal and cancerousbreast tissue a dedicated breast PET – Positron EmissionMammography (PEM) has been developed [6-8].To overcome major drawbacks of the standard tech-
niques, the optical methods such as diffuse optical tomog-raphy–fluorescence mediated tomography [9,10], photo-acoustic imaging [11], acousto-optical imaging [12] havebeen developed to obtain a more accurate, rapid, inexpen-sive, and non-destructive method of imaging. The opticalimaging systems are ideally suited for early detection ofintraepithelial diseases, including most cancers, and allow
al Ltd. This is an Open Access article distributed under the terms of the Creativeommons.org/licenses/by/2.0), which permits unrestricted use, distribution, andiginal work is properly cited.
Surmacki et al. Molecular Cancer 2013, 12:48 Page 3 of 12http://www.molecular-cancer.com/content/12/1/48
assessing tumor margins and response to therapy. Opticalmethods offer several significant advantages over theroutine clinical imaging methods, including: a) non-invasiveness through the use of safe, non-ionizing radiation,b) display of contrast between soft tissues based on opticalproperties of the tissue, c) facility for continuous bedsidemonitoring, d) high spatial resolution (less than 1 micronlateral resolution in visible range). Almost all of the widelyused methods of molecular diagnostics centered on proteinseparation, amplification, and gene expression in target pro-teins and nucleic acids involve fluorescence spectroscopy.The confocal, laser-based fluorescence microscopy becamea golden standard for optical imaging and molecular diag-nostics [13]. The disadvantage of fluorescence is that themultiplexing capability of this technique is limited due tothe broad emission profile of fluorophores. This results indifficulty in deconvoluting mixtures of signals.Raman spectroscopy has many advantages over fluores-
cence [14]. First, Raman spectroscopy needs no external la-beling as the contrast is based on endogeneous opticalproperties of the biological tissue. The contrast is generatedin the cross section for Raman scattering due to inducedpolarizability generated in the tissue upon irradiation. Ra-man scattering is inelastic scattering, and measuring thedifference between the energy of the incident photons andscattered photons one can obtain the information about vi-brations. Therefore, biochemical signatures of the mole-cules obtained from the Raman spectroscopy are richerthan those from the fluorescence spectroscopy. For ex-ample–nucleic acids, lipids, biological chromophores andproteins are characterized by narrow vibrational peaks indifferent spectral regions, in contrast to broad, largely un-specific emission profiles obtained in the fluorescencemethod. Second, Raman imaging (RI) has now reached alevel of sophistication that makes it competitive with moreconventional methods of confocal fluorescence microscopyin terms of sensitivity, specificity, and spatial resolution.Optical Raman imaging has emerged as a new modality
which enables real time, non-invasive, high resolution im-aging of epithelial tissue, with a particular focus in this paperon breast cancer diagnosis [15-34]. The method has a poten-tial to replace the conventional biopsy and histopathologicalanalysis by an optical Raman biopsy [35-39]. Due to confocalmicroendoscopy advancements, optically fiber coupled spec-trometers and semiconductor technology it becomes pos-sible to perform the in vivo mode of operation in real time.Raman scattering efficiency can be enhanced by fac-
tors >108 when a substance is adsorbed on or near roughmetal surfaces. The Raman scattering amplification associ-ated with this phenomenon is known as surface-enhancedRaman scattering (SERS) spectroscopy [40]. These hugeincreases in Raman scattering are primarily caused by theincreased intensity of the electromagnetic fields present atthe surface of these metals. SERS preserves the essential
features of Raman scattering, yet the surface enhancementprovided by the metal nanoparticle allows unique spectrato be acquired from a variety of adsorbed species.The enhancement can further increase even up to 11 or-
ders and reach a limit of detection of 10-16 M in surface-enhanced resonance Raman spectroscopy (SERRS) [41,42],13 orders in surface-enhanced Raman scattering–scanningnear-field optical microscopy (SERS–SNOM) [31] or even14–15 orders of magnitude and detection down to10-10–10-14 M in non-linear optical microscopy (e.g. coher-ent anti-Stokes Raman scattering (CARS)) [43-46].Therefore, with further advancements of SERS com-
bined with highly sensitive SERS active probes, Ramantechniques may open up a new direction in nanomedicine,and bioimaging for high-sensitive high-throughput signaldetection, even down to the single-molecule level [44-46].There is increasing evidence that Raman imaging can be
utilized to understand molecular mechanisms of breastcancer [21,47,48]. It also has potential to be employed inclinical applications for early diagnosis, recurrence predic-tion and response to treatment measurement. Properlychosen optically active contrast agents and targeted bio-markers that monitor functional features of cancer cangreatly contribute to the development of nucleic acid andprotein-based diagnostic tests by Raman methods. The de-sign of proper SERS–based biotags requires a complexinterplay of biological interactions for increasing the num-ber of fluorescent proteins or nanoparticles, which is cur-rently at early stages of research and development [48,49].This paper will focus on new developments in breast
cancer biochemical imaging, as well as exploring the po-tential of clinical applications. The aim of the presentstudy is to demonstrate that the label-free Raman imaginghas the ability to accurately characterize breast cancer tis-sue and distinguish between noncancerous and canceroustypes. We will demonstrate how this knowledge contrib-utes to new branches of diagnostic developments forbreast cancer diseases. The results presented in this paperdemonstrate that Raman imaging has significant potentialfor probing human breast tissue to provide complemen-tary data in the early diagnosis of breast cancer.
ResultsIn this section we present the results of the Raman and IRstudies on the noncancerous and cancerous human breasttissues. Having reached this point when we have establishedthe proper protocol of tissue preparation to obtain reliableresults from IR and Raman measurements, we will explorevibrational spectroscopy and imaging for a variety of bio-medical applications, particularly molecular diagnosticsof breast cancer. Details of the protocol are provided inAdditional file 1, available at [URL].Figure 1(A,B,C) shows the microscope image, a typical
Raman image, and Raman spectra of the noncancerous
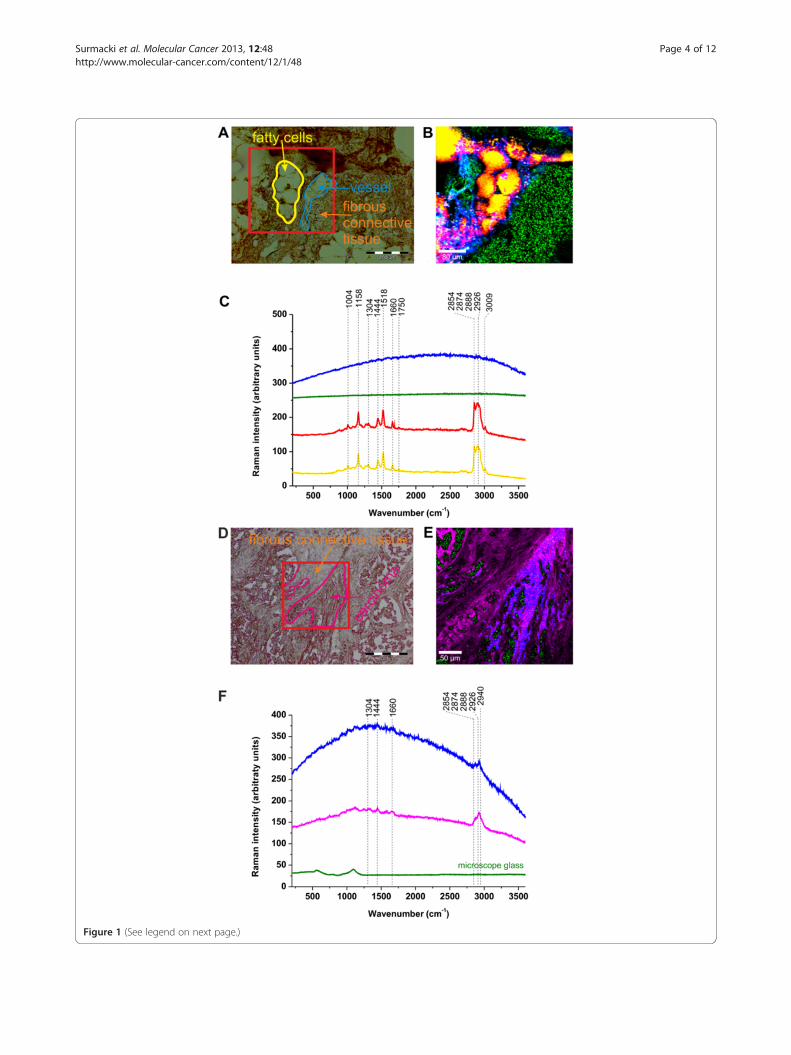
Figure 1 (See legend on next page.)
Surmacki et al. Molecular Cancer 2013, 12:48 Page 4 of 12http://www.molecular-cancer.com/content/12/1/48
(See figure on previous page.)Figure 1 Raman image and spectra of the noncancerous and cancerous breast tissue of the patient P81. Noncancerous breast tissue: (A)Microscope image, (B) Raman image (400x400 μm) from the region marked in (A), (C) Raman spectra (integration time: 0.05 s). Cancerous breasttissue: (D) Microscope image, (E) Raman image (300x300 μm) from the region marked in (D), (F) Raman spectra (integration time: 0.036 s). Thecolors of the spectra correspond to the colors in the image. Mixed areas are displayed as mixed colors.
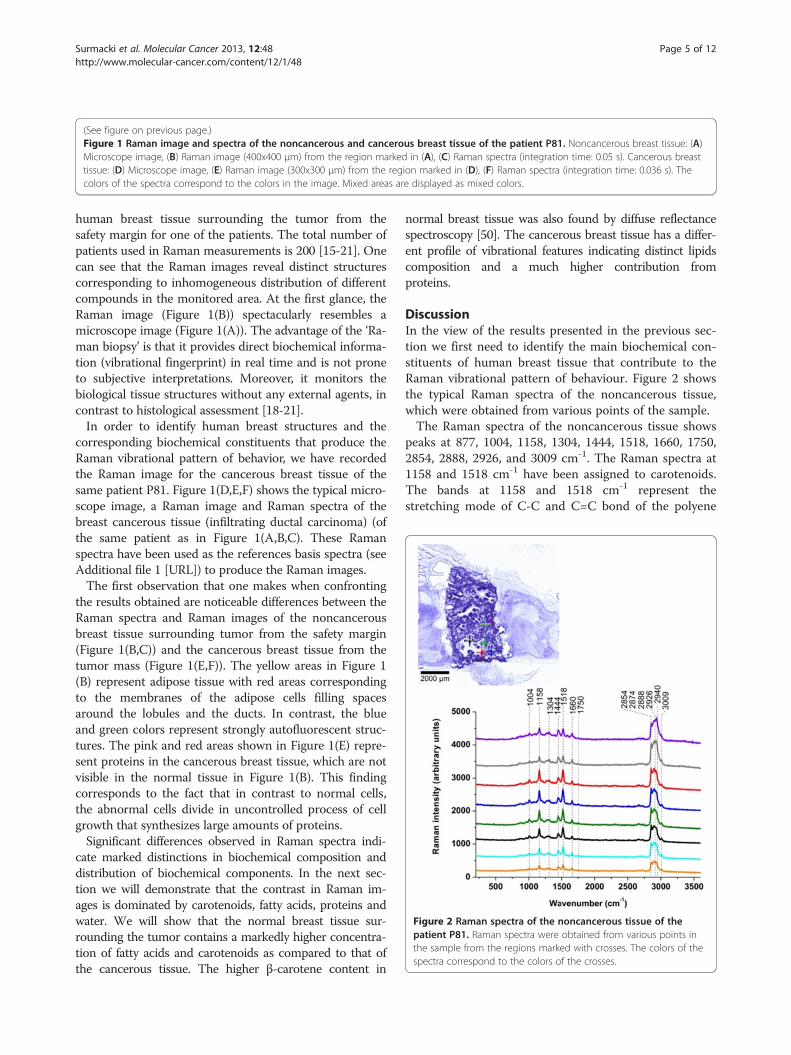
Figure 2 Raman spectra of the noncancerous tissue of thepatient P81. Raman spectra were obtained from various points inthe sample from the regions marked with crosses. The colors of thespectra correspond to the colors of the crosses.
Surmacki et al. Molecular Cancer 2013, 12:48 Page 5 of 12http://www.molecular-cancer.com/content/12/1/48
human breast tissue surrounding the tumor from thesafety margin for one of the patients. The total number ofpatients used in Raman measurements is 200 [15-21]. Onecan see that the Raman images reveal distinct structurescorresponding to inhomogeneous distribution of differentcompounds in the monitored area. At the first glance, theRaman image (Figure 1(B)) spectacularly resembles amicroscope image (Figure 1(A)). The advantage of the ‘Ra-man biopsy’ is that it provides direct biochemical informa-tion (vibrational fingerprint) in real time and is not proneto subjective interpretations. Moreover, it monitors thebiological tissue structures without any external agents, incontrast to histological assessment [18-21].In order to identify human breast structures and the
corresponding biochemical constituents that produce theRaman vibrational pattern of behavior, we have recordedthe Raman image for the cancerous breast tissue of thesame patient P81. Figure 1(D,E,F) shows the typical micro-scope image, a Raman image and Raman spectra of thebreast cancerous tissue (infiltrating ductal carcinoma) (ofthe same patient as in Figure 1(A,B,C). These Ramanspectra have been used as the references basis spectra (seeAdditional file 1 [URL]) to produce the Raman images.The first observation that one makes when confronting
the results obtained are noticeable differences between theRaman spectra and Raman images of the noncancerousbreast tissue surrounding tumor from the safety margin(Figure 1(B,C)) and the cancerous breast tissue from thetumor mass (Figure 1(E,F)). The yellow areas in Figure 1(B) represent adipose tissue with red areas correspondingto the membranes of the adipose cells filling spacesaround the lobules and the ducts. In contrast, the blueand green colors represent strongly autofluorescent struc-tures. The pink and red areas shown in Figure 1(E) repre-sent proteins in the cancerous breast tissue, which are notvisible in the normal tissue in Figure 1(B). This findingcorresponds to the fact that in contrast to normal cells,the abnormal cells divide in uncontrolled process of cellgrowth that synthesizes large amounts of proteins.Significant differences observed in Raman spectra indi-
cate marked distinctions in biochemical composition anddistribution of biochemical components. In the next sec-tion we will demonstrate that the contrast in Raman im-ages is dominated by carotenoids, fatty acids, proteins andwater. We will show that the normal breast tissue sur-rounding the tumor contains a markedly higher concentra-tion of fatty acids and carotenoids as compared to that ofthe cancerous tissue. The higher β-carotene content in
normal breast tissue was also found by diffuse reflectancespectroscopy [50]. The cancerous breast tissue has a differ-ent profile of vibrational features indicating distinct lipidscomposition and a much higher contribution fromproteins.
DiscussionIn the view of the results presented in the previous sec-tion we first need to identify the main biochemical con-stituents of human breast tissue that contribute to theRaman vibrational pattern of behaviour. Figure 2 showsthe typical Raman spectra of the noncancerous tissue,which were obtained from various points of the sample.The Raman spectra of the noncancerous tissue shows
peaks at 877, 1004, 1158, 1304, 1444, 1518, 1660, 1750,2854, 2888, 2926, and 3009 cm-1. The Raman spectra at1158 and 1518 cm-1 have been assigned to carotenoids.The bands at 1158 and 1518 cm-1 represent thestretching mode of C-C and C=C bond of the polyene
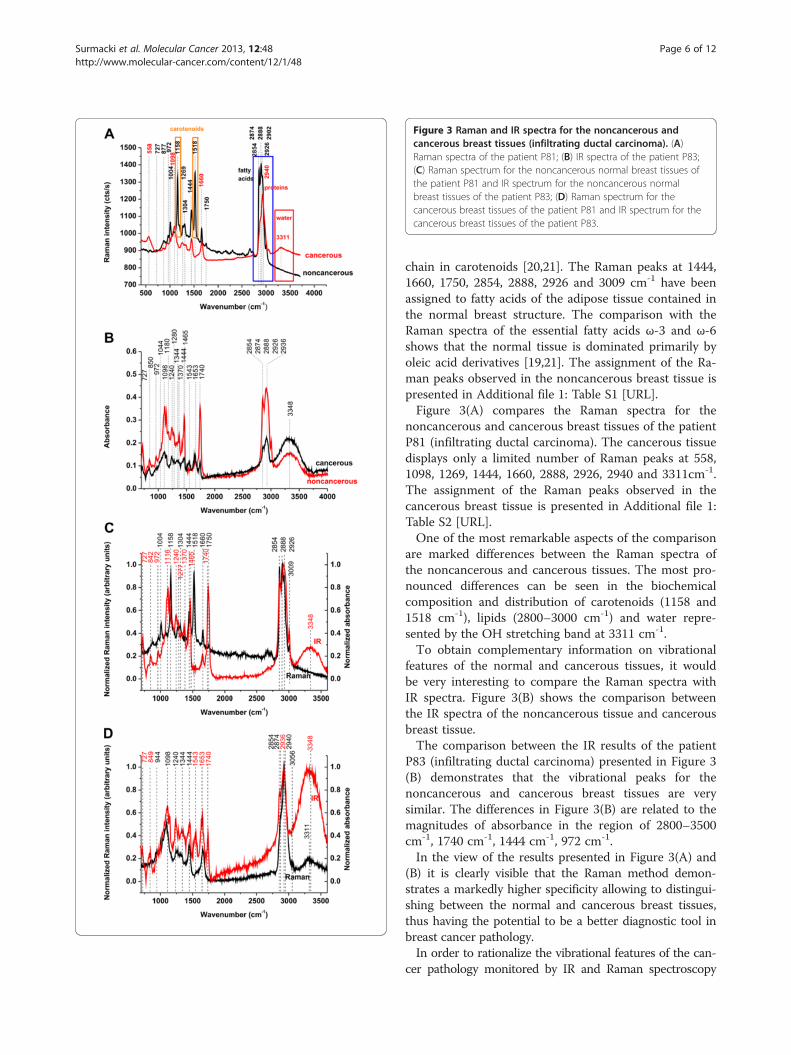
Figure 3 Raman and IR spectra for the noncancerous andcancerous breast tissues (infiltrating ductal carcinoma). (A)Raman spectra of the patient P81; (B) IR spectra of the patient P83;(C) Raman spectrum for the noncancerous normal breast tissues ofthe patient P81 and IR spectrum for the noncancerous normalbreast tissues of the patient P83; (D) Raman spectrum for thecancerous breast tissues of the patient P81 and IR spectrum for thecancerous breast tissues of the patient P83.
Surmacki et al. Molecular Cancer 2013, 12:48 Page 6 of 12http://www.molecular-cancer.com/content/12/1/48
chain in carotenoids [20,21]. The Raman peaks at 1444,1660, 1750, 2854, 2888, 2926 and 3009 cm-1 have beenassigned to fatty acids of the adipose tissue contained inthe normal breast structure. The comparison with theRaman spectra of the essential fatty acids ω-3 and ω-6shows that the normal tissue is dominated primarily byoleic acid derivatives [19,21]. The assignment of the Ra-man peaks observed in the noncancerous breast tissue ispresented in Additional file 1: Table S1 [URL].Figure 3(A) compares the Raman spectra for the
noncancerous and cancerous breast tissues of the patientP81 (infiltrating ductal carcinoma). The cancerous tissuedisplays only a limited number of Raman peaks at 558,1098, 1269, 1444, 1660, 2888, 2926, 2940 and 3311cm-1.The assignment of the Raman peaks observed in thecancerous breast tissue is presented in Additional file 1:Table S2 [URL].One of the most remarkable aspects of the comparison
are marked differences between the Raman spectra ofthe noncancerous and cancerous tissues. The most pro-nounced differences can be seen in the biochemicalcomposition and distribution of carotenoids (1158 and1518 cm-1), lipids (2800–3000 cm-1) and water repre-sented by the OH stretching band at 3311 cm-1.To obtain complementary information on vibrational
features of the normal and cancerous tissues, it wouldbe very interesting to compare the Raman spectra withIR spectra. Figure 3(B) shows the comparison betweenthe IR spectra of the noncancerous tissue and cancerousbreast tissue.The comparison between the IR results of the patient
P83 (infiltrating ductal carcinoma) presented in Figure 3(B) demonstrates that the vibrational peaks for thenoncancerous and cancerous breast tissues are verysimilar. The differences in Figure 3(B) are related to themagnitudes of absorbance in the region of 2800–3500cm-1, 1740 cm-1, 1444 cm-1, 972 cm-1.In the view of the results presented in Figure 3(A) and
(B) it is clearly visible that the Raman method demon-strates a markedly higher specificity allowing to distingui-shing between the normal and cancerous breast tissues,thus having the potential to be a better diagnostic tool inbreast cancer pathology.In order to rationalize the vibrational features of the can-
cer pathology monitored by IR and Raman spectroscopy
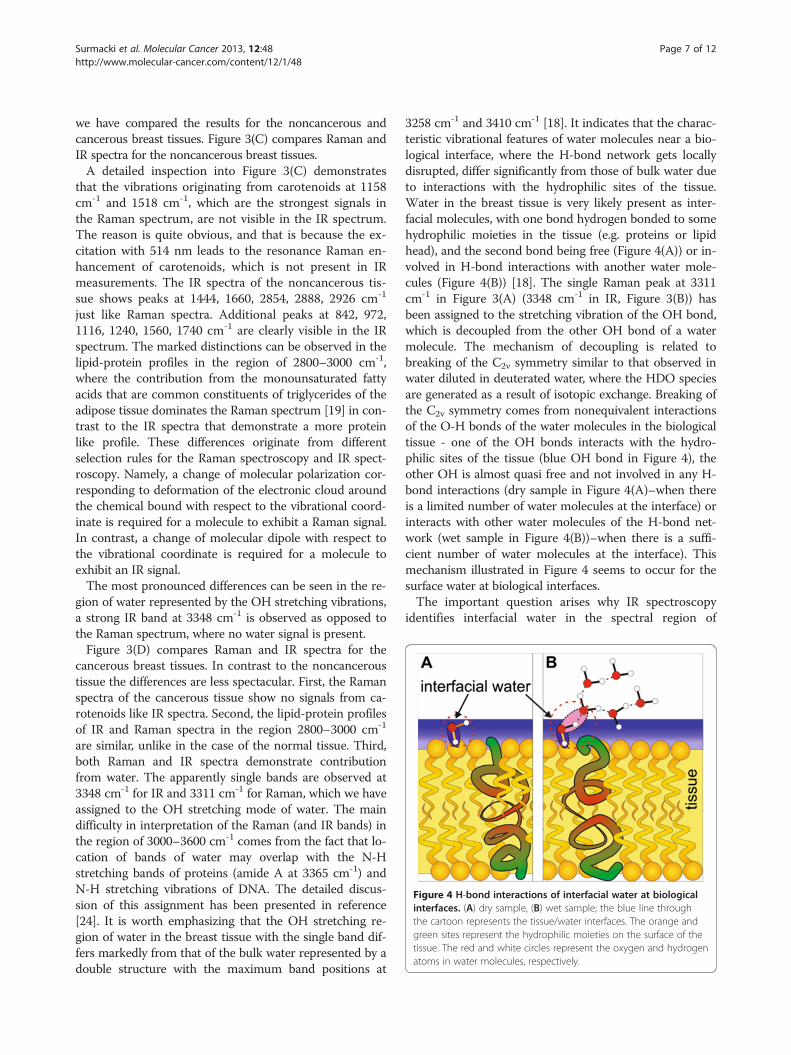
Figure 4 H-bond interactions of interfacial water at biologicalinterfaces. (A) dry sample, (B) wet sample; the blue line throughthe cartoon represents the tissue/water interfaces. The orange andgreen sites represent the hydrophilic moieties on the surface of thetissue. The red and white circles represent the oxygen and hydrogenatoms in water molecules, respectively.
Surmacki et al. Molecular Cancer 2013, 12:48 Page 7 of 12http://www.molecular-cancer.com/content/12/1/48
we have compared the results for the noncancerous andcancerous breast tissues. Figure 3(C) compares Raman andIR spectra for the noncancerous breast tissues.A detailed inspection into Figure 3(C) demonstrates
that the vibrations originating from carotenoids at 1158cm-1 and 1518 cm-1, which are the strongest signals inthe Raman spectrum, are not visible in the IR spectrum.The reason is quite obvious, and that is because the ex-citation with 514 nm leads to the resonance Raman en-hancement of carotenoids, which is not present in IRmeasurements. The IR spectra of the noncancerous tis-sue shows peaks at 1444, 1660, 2854, 2888, 2926 cm-1
just like Raman spectra. Additional peaks at 842, 972,1116, 1240, 1560, 1740 cm-1 are clearly visible in the IRspectrum. The marked distinctions can be observed in thelipid-protein profiles in the region of 2800–3000 cm-1,where the contribution from the monounsaturated fattyacids that are common constituents of triglycerides of theadipose tissue dominates the Raman spectrum [19] in con-trast to the IR spectra that demonstrate a more proteinlike profile. These differences originate from differentselection rules for the Raman spectroscopy and IR spect-roscopy. Namely, a change of molecular polarization cor-responding to deformation of the electronic cloud aroundthe chemical bound with respect to the vibrational coord-inate is required for a molecule to exhibit a Raman signal.In contrast, a change of molecular dipole with respect tothe vibrational coordinate is required for a molecule toexhibit an IR signal.The most pronounced differences can be seen in the re-
gion of water represented by the OH stretching vibrations,a strong IR band at 3348 cm-1 is observed as opposed tothe Raman spectrum, where no water signal is present.Figure 3(D) compares Raman and IR spectra for the
cancerous breast tissues. In contrast to the noncanceroustissue the differences are less spectacular. First, the Ramanspectra of the cancerous tissue show no signals from ca-rotenoids like IR spectra. Second, the lipid-protein profilesof IR and Raman spectra in the region 2800–3000 cm-1
are similar, unlike in the case of the normal tissue. Third,both Raman and IR spectra demonstrate contributionfrom water. The apparently single bands are observed at3348 cm-1 for IR and 3311 cm-1 for Raman, which we haveassigned to the OH stretching mode of water. The maindifficulty in interpretation of the Raman (and IR bands) inthe region of 3000–3600 cm-1 comes from the fact that lo-cation of bands of water may overlap with the N-Hstretching bands of proteins (amide A at 3365 cm-1) andN-H stretching vibrations of DNA. The detailed discus-sion of this assignment has been presented in reference[24]. It is worth emphasizing that the OH stretching re-gion of water in the breast tissue with the single band dif-fers markedly from that of the bulk water represented by adouble structure with the maximum band positions at
3258 cm-1 and 3410 cm-1 [18]. It indicates that the charac-teristic vibrational features of water molecules near a bio-logical interface, where the H-bond network gets locallydisrupted, differ significantly from those of bulk water dueto interactions with the hydrophilic sites of the tissue.Water in the breast tissue is very likely present as inter-facial molecules, with one bond hydrogen bonded to somehydrophilic moieties in the tissue (e.g. proteins or lipidhead), and the second bond being free (Figure 4(A)) or in-volved in H-bond interactions with another water mole-cules (Figure 4(B)) [18]. The single Raman peak at 3311cm-1 in Figure 3(A) (3348 cm-1 in IR, Figure 3(B)) hasbeen assigned to the stretching vibration of the OH bond,which is decoupled from the other OH bond of a watermolecule. The mechanism of decoupling is related tobreaking of the C2ν symmetry similar to that observed inwater diluted in deuterated water, where the HDO speciesare generated as a result of isotopic exchange. Breaking ofthe C2v symmetry comes from nonequivalent interactionsof the O-H bonds of the water molecules in the biologicaltissue - one of the OH bonds interacts with the hydro-philic sites of the tissue (blue OH bond in Figure 4), theother OH is almost quasi free and not involved in any H-bond interactions (dry sample in Figure 4(A)–when thereis a limited number of water molecules at the interface) orinteracts with other water molecules of the H-bond net-work (wet sample in Figure 4(B))–when there is a suffi-cient number of water molecules at the interface). Thismechanism illustrated in Figure 4 seems to occur for thesurface water at biological interfaces.The important question arises why IR spectroscopy
identifies interfacial water in the spectral region of
Surmacki et al. Molecular Cancer 2013, 12:48 Page 8 of 12http://www.molecular-cancer.com/content/12/1/48
3000–3700 cm-1 both in the noncancerous and in thecancerous tissues (see Figure 3(B) and Additional file 1:Figure S3, [URL]) in contrast to Raman spectroscopy, whereonly cancerous tissue exhibits vibrational features of water(see Figure 3(A)). It can be explained by the different config-urations of the optical paths in Raman and IR techniques(Additional file 1: Figure S1, [URL]). The Raman spectros-copy measures the Raman signal scattered back from the tis-sue. The IR methods measures the signal transmittedthrough the tissue thin section attached to the window(BaF2). Therefore, the layer of external, ambient water isconfined between the tissue section and the surface of thewindow, giving the contribution to the IR spectrum both inthe noncancerous and the cancerous tissues. The ambientwater cannot be removed by the reference beam, becausethe amount of water attached to the empty window differsfrom that confined under the tissue slice. In the Ramanmeasurements the laser penetration depth is around 30 μmat 514 nm and allows to reaching the layer of water betweenthe microscope glass and the tissue slice of 2 μm. However,in the confocal Raman microscopy the laser beam is focusedexactly on the tissue and the back scattered Raman signaloriginates only from the tissue. As a result, the Raman signalis dominated by the water molecules confined within the tis-sue in contrast to the IR signal originating largely from theabsorption of water from the space between the tissue andthe window (Additional file 1: Figure S1, [URL]).The detailed inspection into Figure 3(A) shows the
spectacular differences in the Raman spectra of the OHband of water in the noncancerous and cancerous breasttissues. The noncancerous tissue shows a negligible sig-nal of water when compared to the cancerous tissuewhere the signal peak at 3311 cm-1 is observed. The lackof water is likely due to higher content of hydrophobic
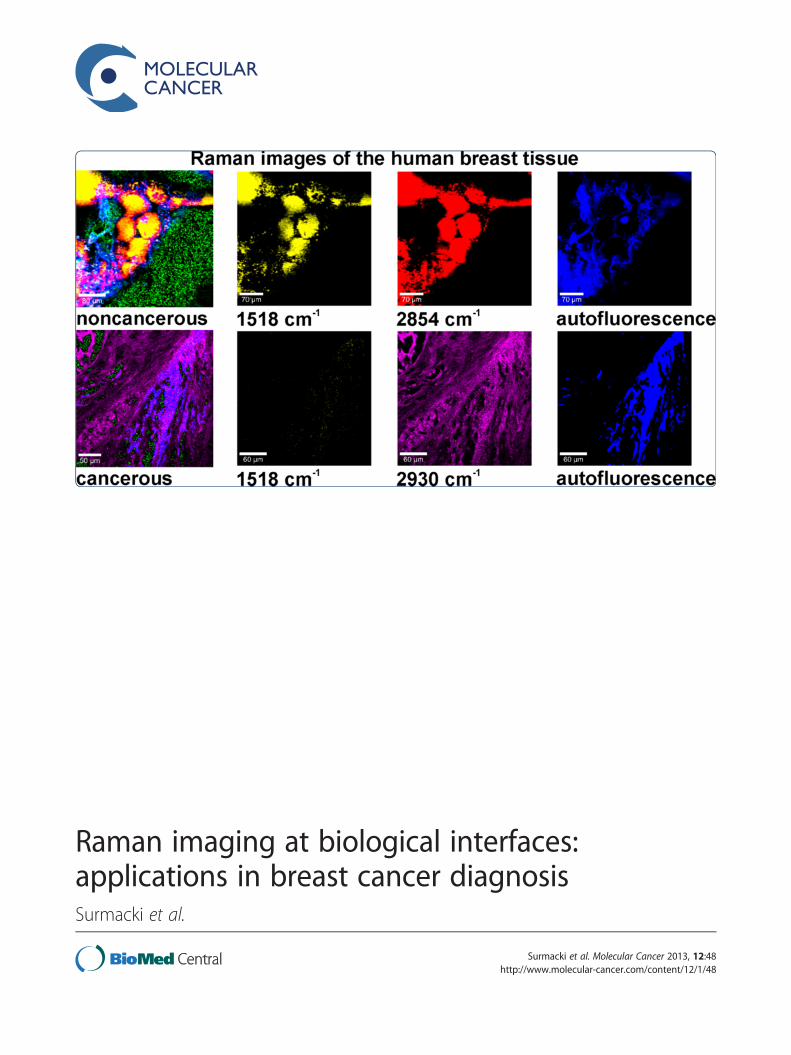
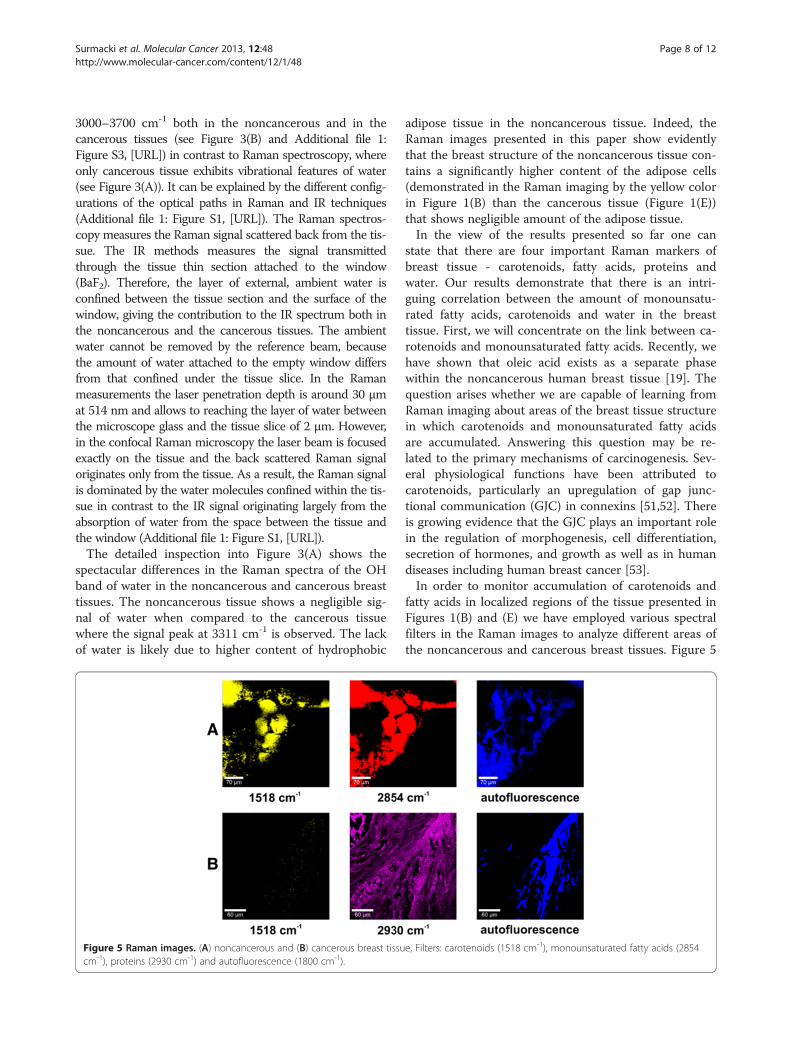
Figure 5 Raman images. (A) noncancerous and (B) cancerous breast tissucm-1), proteins (2930 cm-1) and autofluorescence (1800 cm-1).
adipose tissue in the noncancerous tissue. Indeed, theRaman images presented in this paper show evidentlythat the breast structure of the noncancerous tissue con-tains a significantly higher content of the adipose cells(demonstrated in the Raman imaging by the yellow colorin Figure 1(B) than the cancerous tissue (Figure 1(E))that shows negligible amount of the adipose tissue.In the view of the results presented so far one can
state that there are four important Raman markers ofbreast tissue - carotenoids, fatty acids, proteins andwater. Our results demonstrate that there is an intri-guing correlation between the amount of monounsatu-rated fatty acids, carotenoids and water in the breasttissue. First, we will concentrate on the link between ca-rotenoids and monounsaturated fatty acids. Recently, wehave shown that oleic acid exists as a separate phasewithin the noncancerous human breast tissue [19]. Thequestion arises whether we are capable of learning fromRaman imaging about areas of the breast tissue structurein which carotenoids and monounsaturated fatty acidsare accumulated. Answering this question may be re-lated to the primary mechanisms of carcinogenesis. Sev-eral physiological functions have been attributed tocarotenoids, particularly an upregulation of gap junc-tional communication (GJC) in connexins [51,52]. Thereis growing evidence that the GJC plays an important rolein the regulation of morphogenesis, cell differentiation,secretion of hormones, and growth as well as in humandiseases including human breast cancer [53].In order to monitor accumulation of carotenoids and
fatty acids in localized regions of the tissue presented inFigures 1(B) and (E) we have employed various spectralfilters in the Raman images to analyze different areas ofthe noncancerous and cancerous breast tissues. Figure 5
e, Filters: carotenoids (1518 cm-1), monounsaturated fatty acids (2854
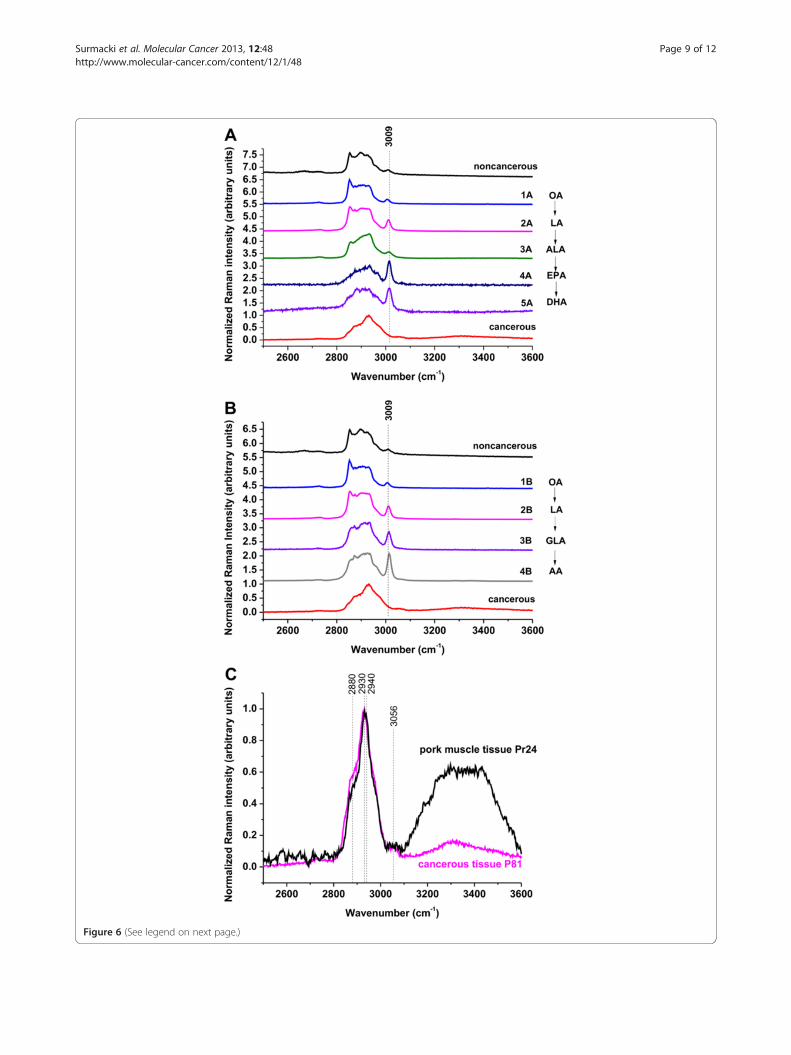
Figure 6 (See legend on next page.)
Surmacki et al. Molecular Cancer 2013, 12:48 Page 9 of 12http://www.molecular-cancer.com/content/12/1/48
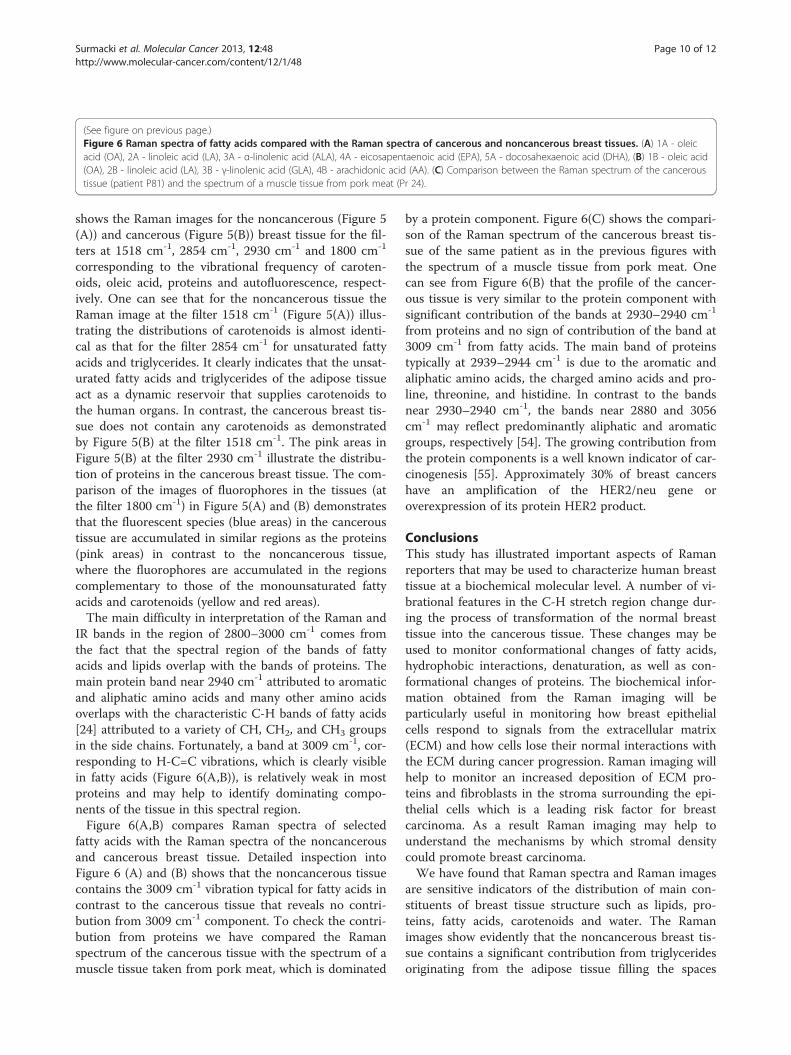
(See figure on previous page.)Figure 6 Raman spectra of fatty acids compared with the Raman spectra of cancerous and noncancerous breast tissues. (A) 1A - oleicacid (OA), 2A - linoleic acid (LA), 3A - α-linolenic acid (ALA), 4A - eicosapentaenoic acid (EPA), 5A - docosahexaenoic acid (DHA), (B) 1B - oleic acid(OA), 2B - linoleic acid (LA), 3B - γ-linolenic acid (GLA), 4B - arachidonic acid (AA). (C) Comparison between the Raman spectrum of the canceroustissue (patient P81) and the spectrum of a muscle tissue from pork meat (Pr 24).
Surmacki et al. Molecular Cancer 2013, 12:48 Page 10 of 12http://www.molecular-cancer.com/content/12/1/48
shows the Raman images for the noncancerous (Figure 5(A)) and cancerous (Figure 5(B)) breast tissue for the fil-ters at 1518 cm-1, 2854 cm-1, 2930 cm-1 and 1800 cm-1
corresponding to the vibrational frequency of caroten-oids, oleic acid, proteins and autofluorescence, respect-ively. One can see that for the noncancerous tissue theRaman image at the filter 1518 cm-1 (Figure 5(A)) illus-trating the distributions of carotenoids is almost identi-cal as that for the filter 2854 cm-1 for unsaturated fattyacids and triglycerides. It clearly indicates that the unsat-urated fatty acids and triglycerides of the adipose tissueact as a dynamic reservoir that supplies carotenoids tothe human organs. In contrast, the cancerous breast tis-sue does not contain any carotenoids as demonstratedby Figure 5(B) at the filter 1518 cm-1. The pink areas inFigure 5(B) at the filter 2930 cm-1 illustrate the distribu-tion of proteins in the cancerous breast tissue. The com-parison of the images of fluorophores in the tissues (atthe filter 1800 cm-1) in Figure 5(A) and (B) demonstratesthat the fluorescent species (blue areas) in the canceroustissue are accumulated in similar regions as the proteins(pink areas) in contrast to the noncancerous tissue,where the fluorophores are accumulated in the regionscomplementary to those of the monounsaturated fattyacids and carotenoids (yellow and red areas).The main difficulty in interpretation of the Raman and
IR bands in the region of 2800–3000 cm-1 comes fromthe fact that the spectral region of the bands of fattyacids and lipids overlap with the bands of proteins. Themain protein band near 2940 cm-1 attributed to aromaticand aliphatic amino acids and many other amino acidsoverlaps with the characteristic C-H bands of fatty acids[24] attributed to a variety of CH, CH2, and CH3 groupsin the side chains. Fortunately, a band at 3009 cm-1, cor-responding to H-C=C vibrations, which is clearly visiblein fatty acids (Figure 6(A,B)), is relatively weak in mostproteins and may help to identify dominating compo-nents of the tissue in this spectral region.Figure 6(A,B) compares Raman spectra of selected
fatty acids with the Raman spectra of the noncancerousand cancerous breast tissue. Detailed inspection intoFigure 6 (A) and (B) shows that the noncancerous tissuecontains the 3009 cm-1 vibration typical for fatty acids incontrast to the cancerous tissue that reveals no contri-bution from 3009 cm-1 component. To check the contri-bution from proteins we have compared the Ramanspectrum of the cancerous tissue with the spectrum of amuscle tissue taken from pork meat, which is dominated
by a protein component. Figure 6(C) shows the compari-son of the Raman spectrum of the cancerous breast tis-sue of the same patient as in the previous figures withthe spectrum of a muscle tissue from pork meat. Onecan see from Figure 6(B) that the profile of the cancer-ous tissue is very similar to the protein component withsignificant contribution of the bands at 2930–2940 cm-1
from proteins and no sign of contribution of the band at3009 cm-1 from fatty acids. The main band of proteinstypically at 2939–2944 cm-1 is due to the aromatic andaliphatic amino acids, the charged amino acids and pro-line, threonine, and histidine. In contrast to the bandsnear 2930–2940 cm-1, the bands near 2880 and 3056cm-1 may reflect predominantly aliphatic and aromaticgroups, respectively [54]. The growing contribution fromthe protein components is a well known indicator of car-cinogenesis [55]. Approximately 30% of breast cancershave an amplification of the HER2/neu gene oroverexpression of its protein HER2 product.
ConclusionsThis study has illustrated important aspects of Ramanreporters that may be used to characterize human breasttissue at a biochemical molecular level. A number of vi-brational features in the C-H stretch region change dur-ing the process of transformation of the normal breasttissue into the cancerous tissue. These changes may beused to monitor conformational changes of fatty acids,hydrophobic interactions, denaturation, as well as con-formational changes of proteins. The biochemical infor-mation obtained from the Raman imaging will beparticularly useful in monitoring how breast epithelialcells respond to signals from the extracellular matrix(ECM) and how cells lose their normal interactions withthe ECM during cancer progression. Raman imaging willhelp to monitor an increased deposition of ECM pro-teins and fibroblasts in the stroma surrounding the epi-thelial cells which is a leading risk factor for breastcarcinoma. As a result Raman imaging may help tounderstand the mechanisms by which stromal densitycould promote breast carcinoma.We have found that Raman spectra and Raman images
are sensitive indicators of the distribution of main con-stituents of breast tissue structure such as lipids, pro-teins, fatty acids, carotenoids and water. The Ramanimages show evidently that the noncancerous breast tis-sue contains a significant contribution from triglyceridesoriginating from the adipose tissue filling the spaces
Surmacki et al. Molecular Cancer 2013, 12:48 Page 11 of 12http://www.molecular-cancer.com/content/12/1/48
around the lobules and ducts, and fatty acids that makeup the cell membrane and nuclear membrane. The can-cerous tissue is dominated by the protein component.We have found that the water amount confined in thecancerous tissue is markedly higher than in thenoncancerous tissue. The OH stretching vibrations ofwater, C-C,C=C stretching vibrations of carotenoids,2930–2940 cm-1 vibrations of proteins, and 2800–3009cm-1 vibrations of fatty acids can be useful as potentialRaman biomarkers to distinguish between the cancerousand the noncancerous human breast tissues. Our resultsprovide experimental evidence for the role played by thelipid-protein-carotenoid profile and cell hydration as fac-tors of particular significance in differentiation of thenon-cancerous and cancerous breast tissues.Our further studies will concentrate on a detailed un-
derstanding of interfacial water at the biological surfacesof the cancerous human tissue, where the crowded en-vironment of many biomolecules introduces its own “hy-dration fingerprint”. It is one of the most importanttopics in molecular biology because it will not only im-prove our current knowledge about water itself but alsolead to significant advances in our understanding of thestructure and process with which confined water is asso-ciated (protein folding, hydrophobic assemblies, bio-logical membranes).
MethodsAll procedures were conducted under a protocol ap-proved by the institutional Bioethical Committee at theMedical University of Lodz, Poland (RNN/29/11/KE,RNN/30/11/KE, RNN/31/11/KE).Detailed methodology is available in Additional file 1,
available at [URL].
Additional file
Additional file 1: Figure S1. Illustration of measurement techniques:transmission IR spectroscopy and confocal Raman scattering microscopy.Figure S2. IR spectra of the noncancerous and cancerous (infiltrating ductalcarcinoma) human breast tissue slices (patient P81) (a) on the microscopeglass of paraffin-embeddeded, nonstained tissue ; (b) the histological samplesafter deparaffinization, staining and coating with a standard adhesive(Histokitt, Glaswarenfabrik Karl Hecht GmbH & Co KG); (c) IR spectrum of theadhesive (Histokitt) and paraffin. Figure S3. IR spectra of the noncancerousand cancerous (infiltrating ductal carcinoma) human breast tissue. Slicesobtained from cryosectioning on the glass window, patient P81. Table S1.Assignments of the major bands for Raman and IR spectra of thenoncancerous human breast tissue. Table S2. Assignments of the majorbands for Raman and IR spectra of the cancerous human breast tissue.
AbbreviationsIR: infrared; MRI: magnetic resonance imaging; PET: positron emissiontomography; PEM: positron emission mammography; RI: Raman imaging;SERS: surface-enhanced Raman scattering; Microscopy (SERS–SNOM): surface-enhanced Raman scattering–scanning near-field optical; CARS: coherent anti-Stokes Raman scattering; DNA: deoxyribonucleic acid; GJC: gap junctionalcommunication; HER2/neu: human epidermal growth factor receptor 2;
OA: Oleic acid; LA: Linoleic acid; ALA: α-linolenic acid; EPA: Eicosapentaenoicacid; DHA: Docosahexaenoic acid; OA: Oleic acid; LA: Linoleic acid; GLA: γ-linolenic acid; AA: Arachidonic acid.
Competing interestsAll authors declare that they do not have any competing interests.
Authors’ contributionsJS performed most of the experiments, analyzed the data, preparing thefigures and tables, JM prepared histological samples, examined histologicalspecimens, RK participated in designed carcinogenesis study, HA participatedin designed carcinogenesis study, analyzed the data and interpretation ofthe results. All authors read and approved the final manuscript.
AcknowledgementThe research work has been financed through the Dz. St. 2013.The authors thank the entire surgical and pathology staff at the MedicalUniversity of Lodz and Synevo for their assistance in the research. Theauthors acknowledge also Dr. Elena Bailo and Dr. Thomas Dieing from WITec(Ulm, Germany) for their technical support and for valuable insights.
Author details1Laboratory of Laser Molecular Spectroscopy, Institute of Applied RadiationChemistry, Lodz University of Technology, Wroblewskiego 15, Lodz 93-590,Poland. 2Department of Pathology, Chair of Oncology, Medical University ofLodz, Paderewskiego 4, Lodz 93-509, Poland.
Received: 19 December 2012 Accepted: 22 May 2013Published: 24 May 2013
References1. Obi N, Waldmann A, Schäfer F, Schreer I, Katalinic A: Impact of the quality
assured mammadiagnostic (QuaMaDi) programme on survival of breastcancer patients. Cancer Epidemiol 2011, 35:286–292.
2. Bird RE, Wallace TW, Yankaskas BC: Analysis of Cancers Missed atScreening Mammography. Radiology 1992, 184:613–617.
3. Elmore JG, Barton MB, Moceri VM, Polk S, Arena PJ, Fletcher SW: Ten-YearRisk of False Positive Screening Mammograms and Clinical BreastExaminations. N Engl J Med 1998, 338:1089–1096.
4. Takei J, Tsunoda-Shimizu H, Kikuchi M, Kawasaki T, Yagata H, Tsugawa K,Suzuki K, Nakamura S, Saida Y: Clinical implications of architecturaldistortion visualized by breast ultrasonography. Breast Cancer 2009,16:132–135.
5. Le-Petross HT, Shetty MK: Magnetic resonance imaging and breastultrasonography as an adjunct to mammographic screening in high-riskpatients. Semin Ultrasound CT MR 2011, 32:266–272.
6. Avril N, Adler LP: F-18 fluorodeoxyglucose-positron emission tomographyimaging for primary breast cancer and loco-regional staging. Radiol ClinNorth Am 2007, 45:645–657.
7. Nass SJ, Henderson IC, Lashof JC: Mammography and Beyond: DevelopingTechnologies for the Early Detection of Breast Cancer. Washington, DC:National Academy Press; 2001.
8. Abreu MC, Almeida P, Balau F, Ferreira NC, Fetal S, Fraga F, Martins M,Matela N, Moura R, Ortgao C, Peralta L, Rato P, Ribeiro R, Rodriques P,Santos AI, Trindade A, Varela J: Clear-PEM: A dedicated PET camera forimproved breast cancer detection. Radiat Prot Dosim 2005, 116:208–210.
9. Tromberg BJ, Pogue BW, Paulsen KD, Yodh AG, Boas DA, Cerussi AE:Assessing the future of diffuse optical imaging technologies for breastcancer management. Med Phys 2008, 35:2443–2451.
10. Schulz RB, Peter J, Semmler W, D’Andrea C, Valentini G, Cubeddu R:Comparison of noncontact and fiber-based fluorescence-mediatedtomography. Opt Lett 2006, 31:769–771.
11. Mienkina MP, Friedrich CS, Gerhardt NC, Beckmann MF, Schiffner MF, HofmannMR, Schmitz G: Multispectral photo-acoustic coded excitation imaging usingunipolar orthogonal Golay codes. Opt Ex. 2010, 18:9076–9087.
12. Ramaz F, Forget BC, Atlan M, Boccara AC, Gross M, Delaye P, Roosen G:Photorefractive detection of tagged photons in ultrasound modulatedoptical tomography of thick biological tissues. Opt Exp 2004, 12:5469–5474.
13. Denk W, Strickler JH, Webb WW: Two-photon laser scanning fluorescencemicroscopy. Science 1990, 248:73–76.
Surmacki et al. Molecular Cancer 2013, 12:48 Page 12 of 12http://www.molecular-cancer.com/content/12/1/48
14. Dieing T, Hollricher O, Toporski J: Confocal Raman Microscopy. DordrechtLondon New York: Springer Heidelberg; 2011. ISBN ISBN: 978-3-642-12521-8.
15. Abramczyk H, Surmacki J, Brożek–Płuska B, Morawiec Z, Tazbir M: The hallmarksof breast cancer by Raman spectroscopy. J Mol Struc 2009, 924–926:175–182.
16. Brożek–Płuska B, Placek I, Kurczewski K, Morawiec Z, Tazbir M, Abramczyk H: Breastcancer diagnostics by Raman spectroscopy. J Mol Liquid 2008, 141:145–148.
17. Abramczyk H, Placek I, Brożek-Płuska B, Kurczewski K, Morawiec Z, Tazbir M:Human breast tissue cancer diagnosis by Raman spectroscopy.Spectroscopy 2008, 22:113–121.
18. Abramczyk H, Brozek-Pluska B, Surmacki J, Jablonska-Gajewicz J, Kordek R:Hydrogen bonds of interfacial water in human breast cancer tissuecompared to lipid and DNA interfaces. JBPC 2011, 2:158–169.
19. Brozek-Pluska B, Jablonska-Gajewicz J, Kordek R, Abramczyk H: Phasetransitions in oleic acid and in human breast tissue as studied by Ramanspectroscopy and Raman imaging. J Med Chem 2011, 54:3386–3392.
20. Abramczyk H, Brozek-Pluska B, Surmacki J, Jablonska J, Kordek R: The label-freeRaman imaging of human breast cancer. J Mol Liq 2011, 164:123–131.
21. Abramczyk H, Brozek-Pluska B, Surmacki J, Jablonska-Gajewicz J, Kordek R: Raman‘optical biopsy’ of human breast cancer. Prog Biophys Mol Biol 2012, 108:74–81.
22. Santos L, Wolthuis R, Koljenovic S, Almeida RM, Puppels GJ: Fiber-opticsprobes for in-vivo Raman spectroscopy in the high wavenumber region.Anal Chem 2005, 77:6747–6752.
23. Alfano RR, Liu CH, Sha WL, Zhu HR, Akins DL, Cleary J, Prudente R, CellmerE: Human breast tissues studied by IR Fourier transform Ramanspectroscopy. Lasers Life Sci 1991, 4:23–28.
24. Frank CJ, Redd DCB, Gansler TS, McCreery RL: Characterization of humanbreast biopsy specimens with near-IR Raman spectroscopy. Anal Chem1994, 66:319–326.
25. Manoharan R, Shafer K, Perelman RT, Wu J, Chen K, Deinum G, FitzmauriceM, Myles J, Crowe J, Dasari RR, Feld MS: Raman spectroscopy andfluorescence photon migration for breast cancer diagnosis and imaging.Photochem Photobiol 1998, 67:15–22.
26. Motz JT, Gandhi SJ, Scepanovic OR, Haka AS, Kramer JR: Real-time Ramansystem for in vivo disease diagnosis. J Biomed Opt 2005, 10:031113–031117.
27. Choo-Smith LP, Edwards HGM, Enditz HP, Kros JM, Heule F, Barr H, Robinson JS,Bruining HA, Puppels GJ: Medical applications of Raman spectroscopy: Fromproof of principle to clinical implementation. Biopolymers 2002, 67:1–9.
28. Shafer-Peltier KE, Haka AS, Fitzmaurice M, Crowe J, Myles J, Dasari RR, FeldMS: Raman microspectroscopic model of human breast tissue:implications for breast cancer diagnosis in vivo. J Raman Spectroscopy2002, 33:552–563.
29. Baker R, Matousek P, Ronayne KL, Parker AW, Rogers K, Stone N: Depthprofiling of calcifications in breast tissue using picosecond Kerr gatedRaman spectroscopy. Analyst 2007, 132:48–53.
30. Owen C, Notingher I, Hill R, Stevens M, Hench L: Progress in Ramanspectroscopy in the fields of tissue engineering, diagnostics andtoxicological testing. Mater Med 2006, 17:1019–1023.
31. Short KW, Carpenter S, Freyer JP, Mourant JR: Raman spectroscopy detectsbiochemical changes due to proliferation in mammalian cell cultures.Biophys J 2005, 88:4274–4288.
32. Kneipp J, Tom BS, Kliffen M, Marian MP, Puppels G: Characterization of breastduct epithelia: a Raman spectroscopic study. Vib Spectrosc 2003, 32:67–74.
33. Chowdary MVP, Kumar KK, Kurien J, Mathew S, Krishna CM: Discriminationof normal, benign, and malignant breast tissues by Raman spectroscopy.Biopolymers 2006, 83:556–569.
34. Chowdary PD, Jiang Z, Chaney EJ, Benalcazar WA, Marks DL, Gruebele M,Boppart SA: Molecular histopathology by spectrally reconstructed nonlinearinterferometric vibrational imaging. Cancer Res 2010, 70:9562–9569.
35. Saha A, Barman I, Dingari NC, McGee S, Volynskaya Z, Galindo LH, Liu W,Plecha D, Klein N, Dasari RR, Fitzmaurice M: Raman spectroscopy: a real-time tool for identifying microcalcifications during stereotactic breastcore needle biopsies. Biomed Opt Exp 2011, 2:2792–2803.
36. Dingari NC, Barman I, Saha A, McGee S, Galindo LH, Liu W, Plecha D, Klein N,Dasari RR, Fitzmaurice M: Development and comparative assessment of Ramanspectroscopic classification algorithms for lesion discrimination in stereotacticbreast biopsies with microcalcifications. J Biophotonics 2012, 6:371–381.
37. Stone N, Baker R, Rogers K, Parker AW, Matousek P: Subsurface probing ofcalcifications with spatially offset Raman spectroscopy (SORS): futurepossibilities for the diagnosis of breast cancer. Analyst 2007, 132:899–905.
38. Stone N, Matousek P: Advanced transmission Raman spectroscopy: apromising tool for breast disease diagnosis. Cancer Res 2008, 68:4424–4430.
39. Saha A, Barman I, Dingari NC, Galindo LH, Sattar A, Liu W, Plecha D, Klein N,Dasari RR, Fitzmaurice M: Precision of Raman spectroscopy measurementsin detection of microcalcifications in breast needle biopsies. Anal Chem2012, 84:6715–6722.
40. Graham D, Faulds K: Quantitative SERRS for DNA sequence analysis. ChemSoc Rev 2008, 37:1042–1051.
41. Zeisel D, Deckert V, Zenobi R, Vo-Dinh T: Near-field surface-enhancedRaman spectroscopy of dye molecules adsorbed on silver island films.Chem Phys Lett 1998, 283:381–385.
42. Chowdary J, Sarkar J, Tanaka T, Talapatra GB: Concentration dependentorientational changes of 2-amino-2-thiazoline molecule adsorbed onsilver nanocolloidal surface investigated by SERS and DFT. J Phys Chem2008, 112:227–239.
43. Jarvis RM, Goodacre R: Characterization and identification of bacteriausing SERS. Chem Soc Rev 2008, 37:931–936.
44. Isola NR, Stokes DL, Vo-Dinh T: Surface enhanced Raman gene probe forHIV detection. Anal Chem 1998, 70:1352–1356.
45. Haynes CL, Van Duyne RP: Plasmon-sampled surface-enhanced Ramanexcitation spectroscopy. J Phys Chem B 2003, 107:7426–7433.
46. Kneipp K, Wang Y, Kneipp H, Perelman LT, Itzkan I, Dasari R, Feld MS: Singlemolecule detection using surface-enhanced Raman scattering (SERS).Phys Rev Lett 1997, 78:1667–1670.
47. Bailo E, Deckert V: Tip-enhanced Raman spectroscopy of single RNAstrands: Towards a novel direct-sequencing method. Angew Chem Int Ed2008, 47:1658–1661.
48. Wang H, Vo-Dinh T: Multiplex detection of breast cancer biomarkersusing plasmonic molecular sentinel nanoprobes. Nanotechnology 2009,20:065101-1–065101-6.
49. Cao YC, Jin R, Mirkin CA: Nanoparticles with Raman spectroscopicfingerprints for DNA and RNA detection. Science 2002, 297:1536–1540.
50. Soares JS, Barman I, Dingari NC, Volynskaya Z, Liu W, Klein N, Plecha D,Dasari RR: Diagnostic power of diffuse reflectance spectroscopy fortargeted detection of breast lesions with microcalcifications. Proc NatlAcad Sci USA 2013, 110:471–476.
51. Lee SW, Tomasetto C, Paul D, Keyomarsi K, Sager RJ: Transcriptionaldownregulation of gap-junction proteins blocks junctionalcommunication in human mammary tumor cell lines. Cell Biol 1992,188:1213–1221.
52. Bertram JS: Induction of connexin 43 by carotenoids: functionalconsequences. Arch Biochem Biophys 2004, 430:120–126.
53. Kumar NM, Gilula NB: The gap junction communication channel. Cell 1996,84:381–388.
54. El-Bahy GMS: FTIR and Raman spectroscopy study of fenugreek(Trigonella foenum graecum L.) seeds. J Appl Spectrosc 2005, 72:111–116.
55. Olayioye MA: Update on HER-2 as a target for cancer therapy:Intracellular signaling pathways of ErbB2/HER-2 and family members.Breast Cancer Res 2001, 3:385–389.
doi:10.1186/1476-4598-12-48Cite this article as: Surmacki et al.: Raman imaging at biological interfaces:applications in breast cancer diagnosis. Molecular Cancer 2013 12:48.
Submit your next manuscript to BioMed Centraland take full advantage of:
• Convenient online submission
• Thorough peer review
• No space constraints or color figure charges
• Immediate publication on acceptance
• Inclusion in PubMed, CAS, Scopus and Google Scholar
• Research which is freely available for redistribution
Submit your manuscript at www.biomedcentral.com/submit