Embed Size (px)
Citation preview
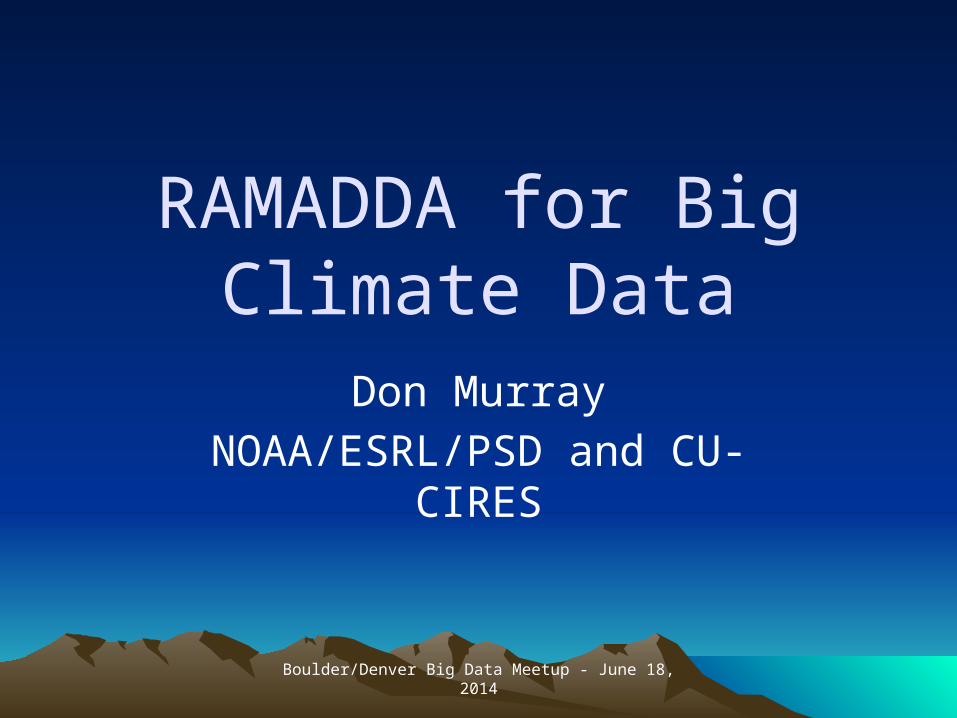
Boulder/Denver Big Data Meetup - June 18, 2014
RAMADDA for Big Climate Data
Don Murray
NOAA/ESRL/PSD and CU-CIRES
Boulder/Denver Big Data Meetup - June 18, 2014
Outline
• The Problem Space• The Data Space• The RAMADDA Solution• How should we deal with complex
calculations?
Boulder/Denver Big Data Meetup - June 18, 2014
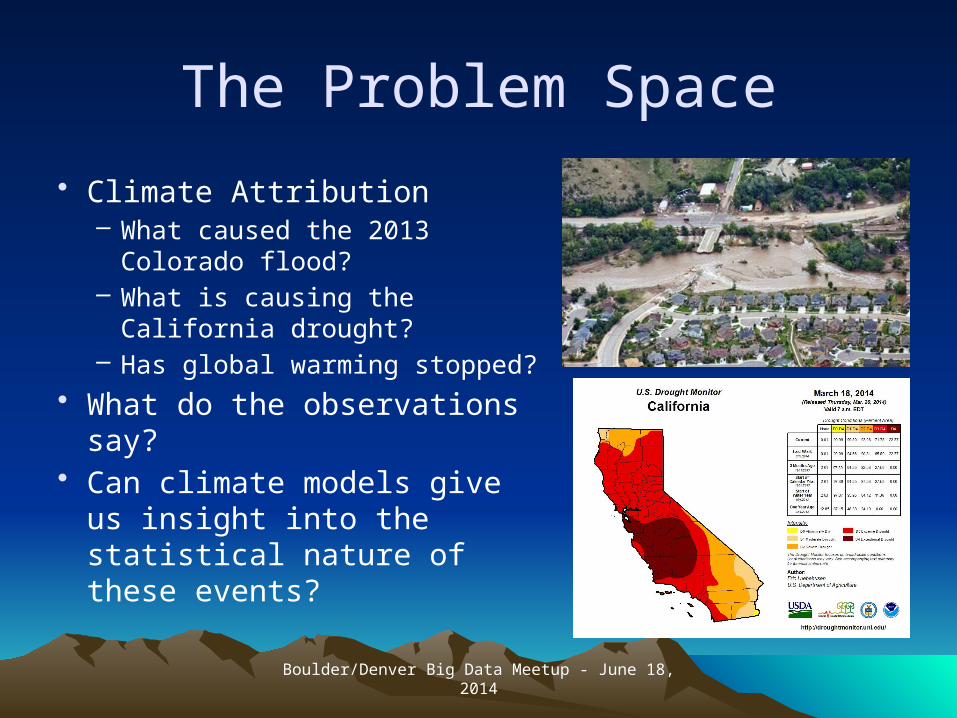
The Problem Space
• Climate Attribution– What caused the 2013
Colorado flood?– What is causing the California
drought?– Has global warming stopped?
• What do the observations say?
• Can climate models give us insight into the statistical nature of these events?
Boulder/Denver Big Data Meetup - June 18, 2014
The Data Space
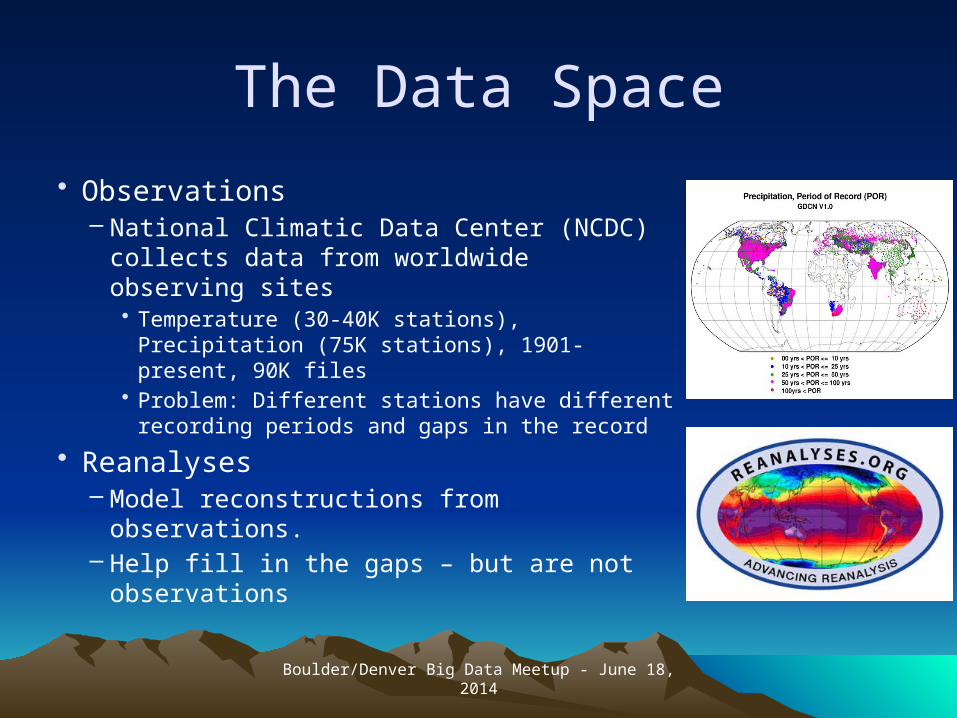
• Observations– National Climatic Data Center (NCDC)
collects data from worldwide observing sites• Temperature (30-40K stations), Precipitation
(75K stations), 1901-present, 90K files• Problem: Different stations have different
recording periods and gaps in the record
• Reanalyses– Model reconstructions from observations.– Help fill in the gaps – but are not
observations
Boulder/Denver Big Data Meetup - June 18, 2014
The Data Space
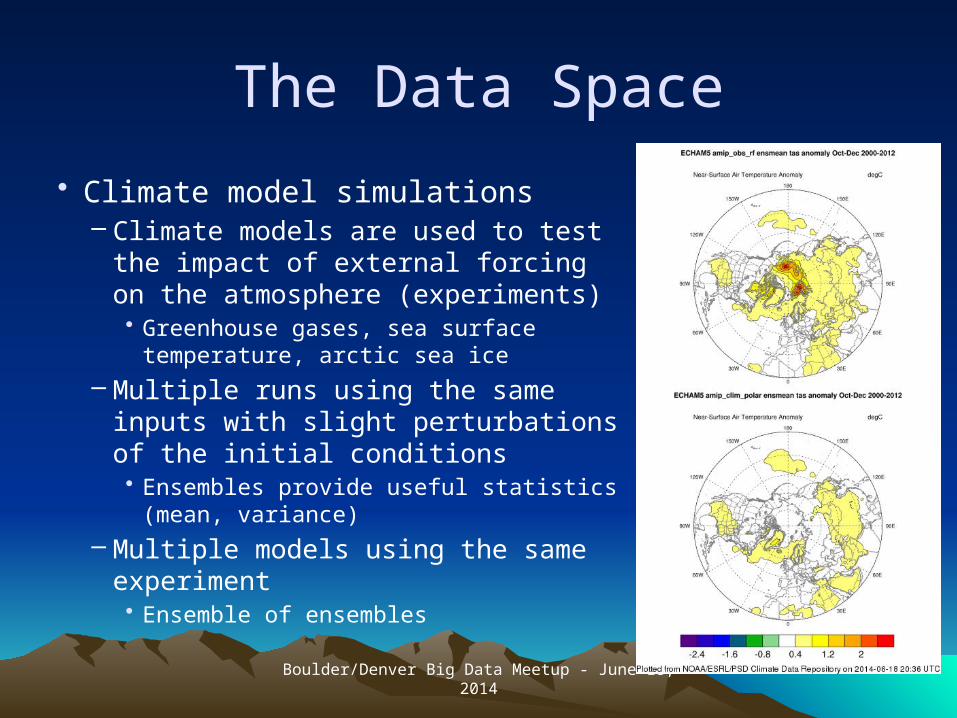
• Climate model simulations– Climate models are used to test the
impact of external forcing on the atmosphere (experiments)• Greenhouse gases, sea surface
temperature, arctic sea ice
– Multiple runs using the same inputs with slight perturbations of the initial conditions• Ensembles provide useful statistics (mean,
variance)
– Multiple models using the same experiment• Ensemble of ensembles
Boulder/Denver Big Data Meetup - June 18, 2014
The Data Space
• PSD Climate Model Output– Experiments are run over a period of time (e.g. 1979-
present, 1880-present)– Global models at .75 to 1.25 degree resolution
• 27 levels• 55-115K points/parameter/level/time step/ensemble• Problem: Different domains (-180 to 180, 0 to 360)
– Model’s internal calculations vary (5 mins to hours)• Output data for each 6 hour time step (0, 06, 12, 18)• Post processing produces daily and monthly averages
– Output format is netCDF (in an ideal world)
Boulder/Denver Big Data Meetup - June 18, 2014
The Data Space
• Ensemble size from 10 to 50 members– Even larger in other cases
• Multiple parameters calculated– Temperature, precipitation, wind, humidity,
etc.– Problem: Each model has different variable
names and units• Each experiment can take weeks to
months to complete on a supercomputer.
Boulder/Denver Big Data Meetup - June 18, 2014
The Data Space
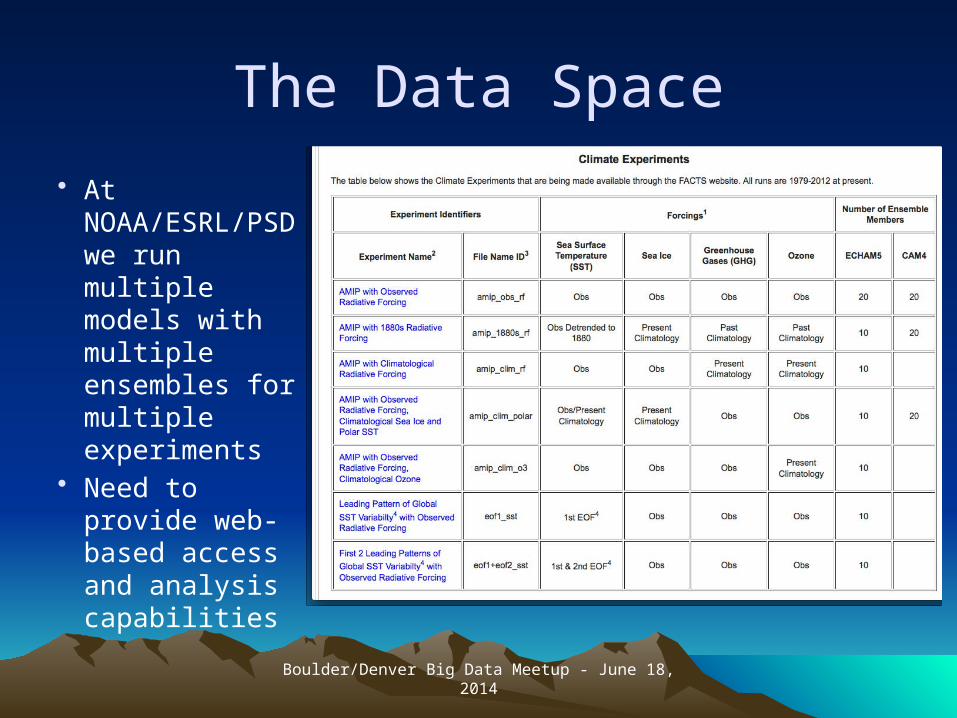
• At NOAA/ESRL/PSD we run multiple models with multiple ensembles for multiple experiments
• Need to provide web-based access and analysis capabilities
Boulder/Denver Big Data Meetup - June 18, 2014
The Data Problem
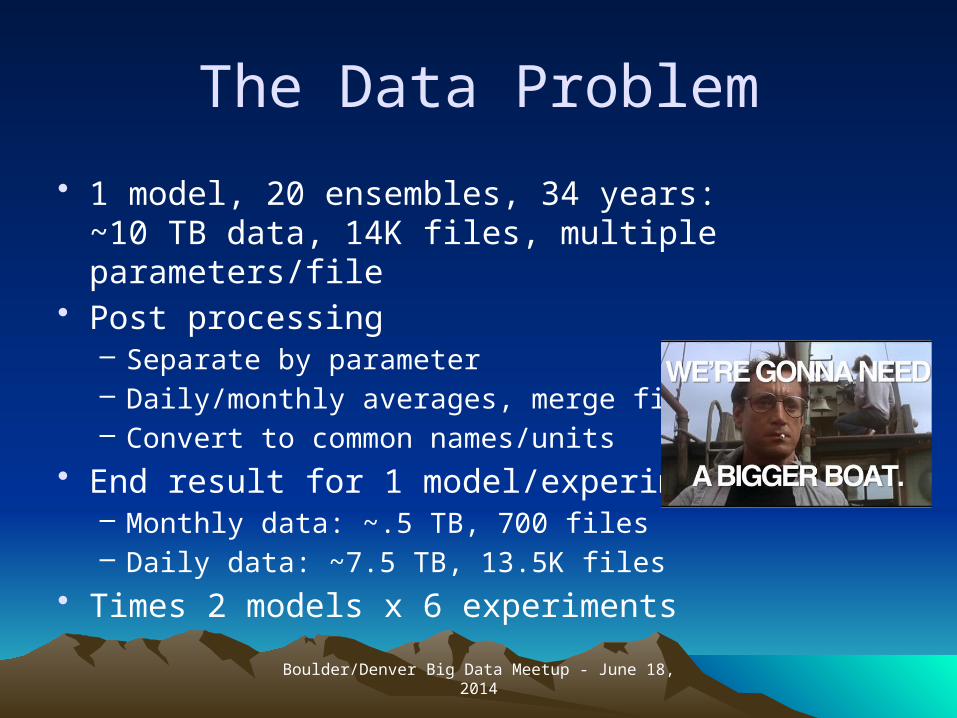
• 1 model, 20 ensembles, 34 years: ~10 TB data, 14K files, multiple parameters/file
• Post processing– Separate by parameter– Daily/monthly averages, merge files– Convert to common names/units
• End result for 1 model/experiment– Monthly data: ~.5 TB, 700 files– Daily data: ~7.5 TB, 13.5K files
• Times 2 models x 6 experiments
Boulder/Denver Big Data Meetup - June 18, 2014
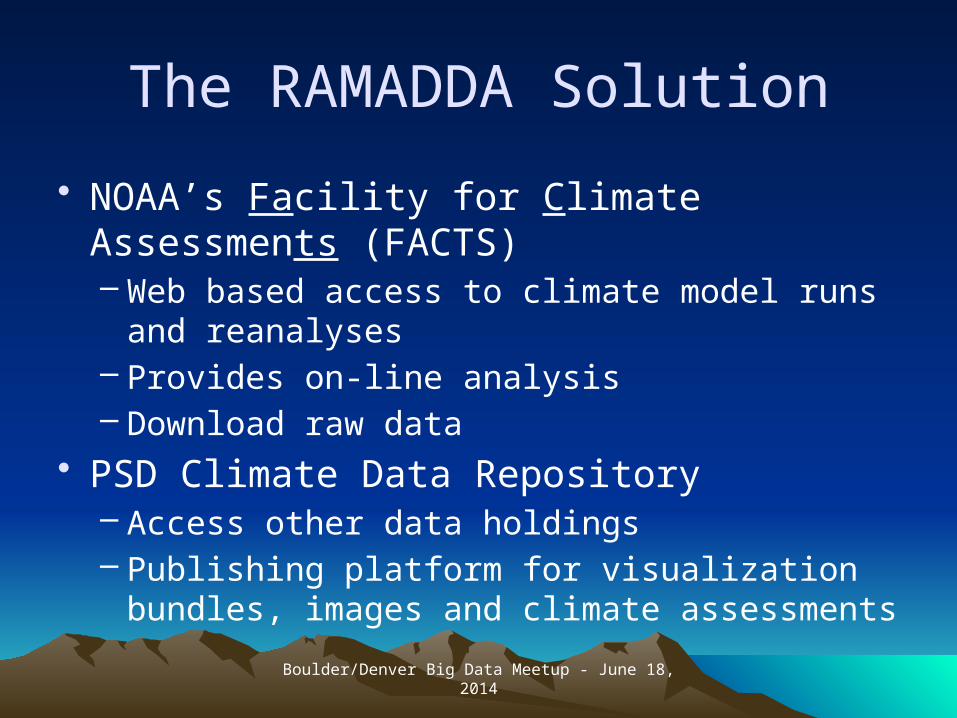
The RAMADDA Solution
• NOAA’s Facility for Climate Assessments (FACTS)– Web based access to climate model runs and
reanalyses– Provides on-line analysis– Download raw data
• PSD Climate Data Repository– Access other data holdings– Publishing platform for visualization bundles,
images and climate assessments
Boulder/Denver Big Data Meetup - June 18, 2014
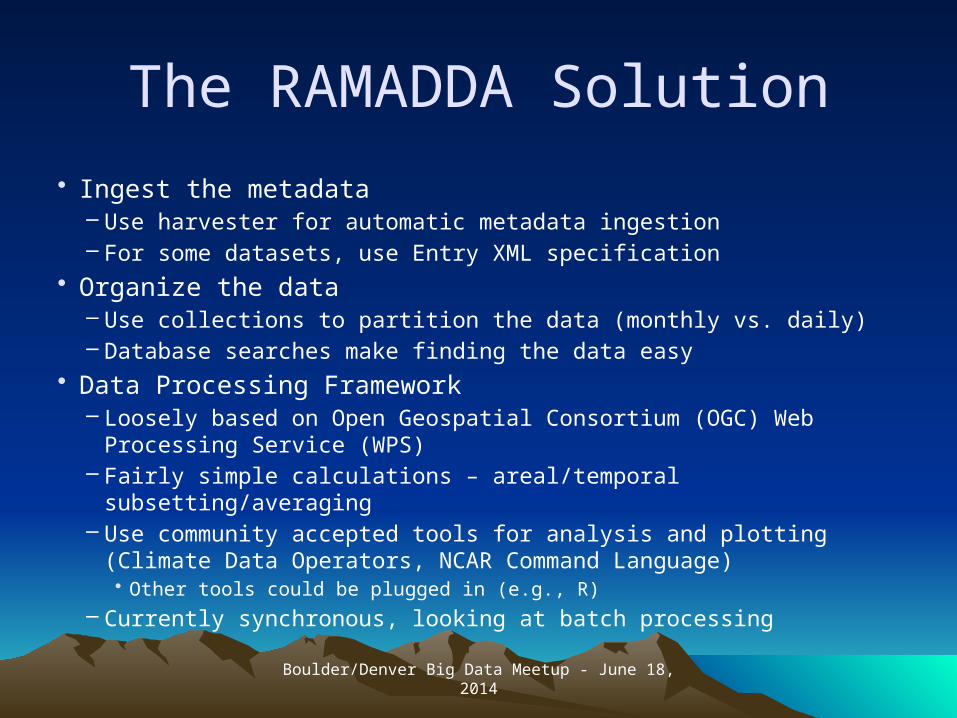
The RAMADDA Solution
• Ingest the metadata– Use harvester for automatic metadata ingestion– For some datasets, use Entry XML specification
• Organize the data– Use collections to partition the data (monthly vs. daily)– Database searches make finding the data easy
• Data Processing Framework– Loosely based on Open Geospatial Consortium (OGC) Web
Processing Service (WPS)– Fairly simple calculations – areal/temporal subsetting/averaging– Use community accepted tools for analysis and plotting (Climate Data
Operators, NCAR Command Language)• Other tools could be plugged in (e.g., R)
– Currently synchronous, looking at batch processing
Boulder/Denver Big Data Meetup - June 18, 2014
The RAMADDA Solution
• Demo/Examples
Boulder/Denver Big Data Meetup - June 18, 2014
Complex calculations
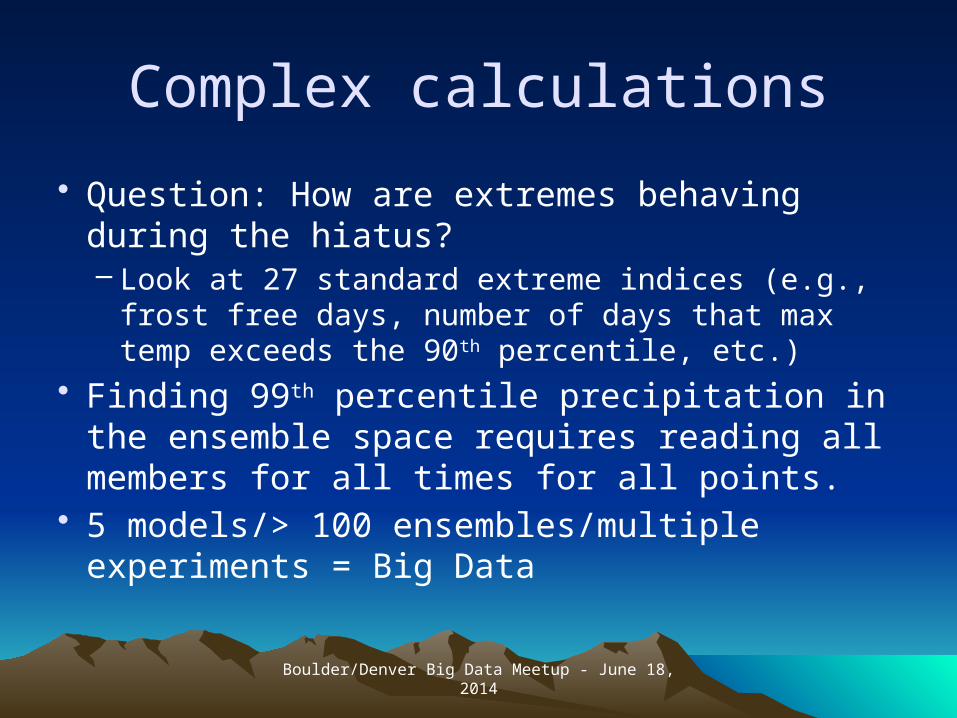
• Question: How are extremes behaving during the hiatus?– Look at 27 standard extreme indices (e.g., frost
free days, number of days that max temp exceeds the 90th percentile, etc.)
• Finding 99th percentile precipitation in the ensemble space requires reading all members for all times for all points.
• 5 models/> 100 ensembles/multiple experiments = Big Data
Boulder/Denver Big Data Meetup - June 18, 2014
Complex calculations
• Tools used now– FORTRAN, R, Python
• Data has to be looked at as a cohesive unit for statistical calculations, but may be in many files.
• Problems – getting all the data into memory – System reliability
• Could standard Big Data processes be applied?
Boulder/Denver Big Data Meetup - June 18, 2014
Links
• NOAA/ESRL/PSD Climate Data Repository– http://www.esrl.noaa.gov/psd/repository
• Facility for Climate Assessments (FACTS)– http://www.esrl.noaa.gov/psd/repository/alias/f
acts• RAMADDA
– http://ramadda.org