Embed Size (px)
Citation preview
Please cite this paper as:
OECD (2013), “Raising the Returns to
Innovation: Structural Policies for a
Knowledge-based Economy”, OECD
Economics Department Policy Notes, No. 17
May 2013.
Economics Department
ECONOMICS DEPARTMENT POLICY NOTE No. 17
RAISING THE RETURNS TO INNOVATION: STRUCTURAL POLICIES FOR A KNOWLEDGE-BASED ECONOMY

1
RAISING THE RETURNS TO INNOVATION: STRUCTURAL POLICIES FOR A
KNOWLEDGE-BASED ECONOMY
Main findings
Investment in knowledge-based capital (KBC) – assets that have no physical embodiment, such as computerised information, innovative property and economic competencies – has been rising significantly.
This has implications for innovation and productivity growth and requires new thinking on policy.
Investment in KBC differs greatly across countries. While the available data suggests that English-
speaking countries – particularly the United States – Japan and Sweden invest in the vicinity of 10% of GDP in KBC, investment in KBC in Italy, Portugal and Spain typically amounts to less than 5% of GDP.
Some countries are more successful than others at channeling tangible resources to firms that invest in KBC. For example, the ease with which investment flows to firms that patent ideas in the United
States and Sweden is over four times higher than for similar firms in Italy and Spain.
Policies that make it easier to reallocate scarce resources to firms that invest in KBC will bolster the returns to investing in KBC.
Such policies include those that enhance the functioning of product, labour and risk capital markets and bankruptcy laws that do not overly penalise failure.
Well-defined intellectual property rights (IPR) provide firms with the incentive to innovate, especially in the chemicals and pharmaceutical sectors. However, such IPR regimes need to be coupled with pro-competition policies to ensure maximum effect while rising litigation costs are undermining the effectiveness of the patent system in promoting innovation in the software sector.
R&D tax incentives and, as a finding that contrasts with previous research, direct support measures are found to boost investment in KBC. However, design features are crucial in order to minimise the fiscal cost and unintended consequences of these policies.
The emerging knowledge-based economy as a source of economic growth
1. Innovation-based growth, underpinned by investments in a broad range of knowledge-based
capital (KBC), is central to raising long-term living standards. While investment in innovation has
traditionally been proxied by spending on R&D, innovation-based growth relies on a much broader range
of assets, such as employee skills, organisational know-how, databases, design, brands and various forms
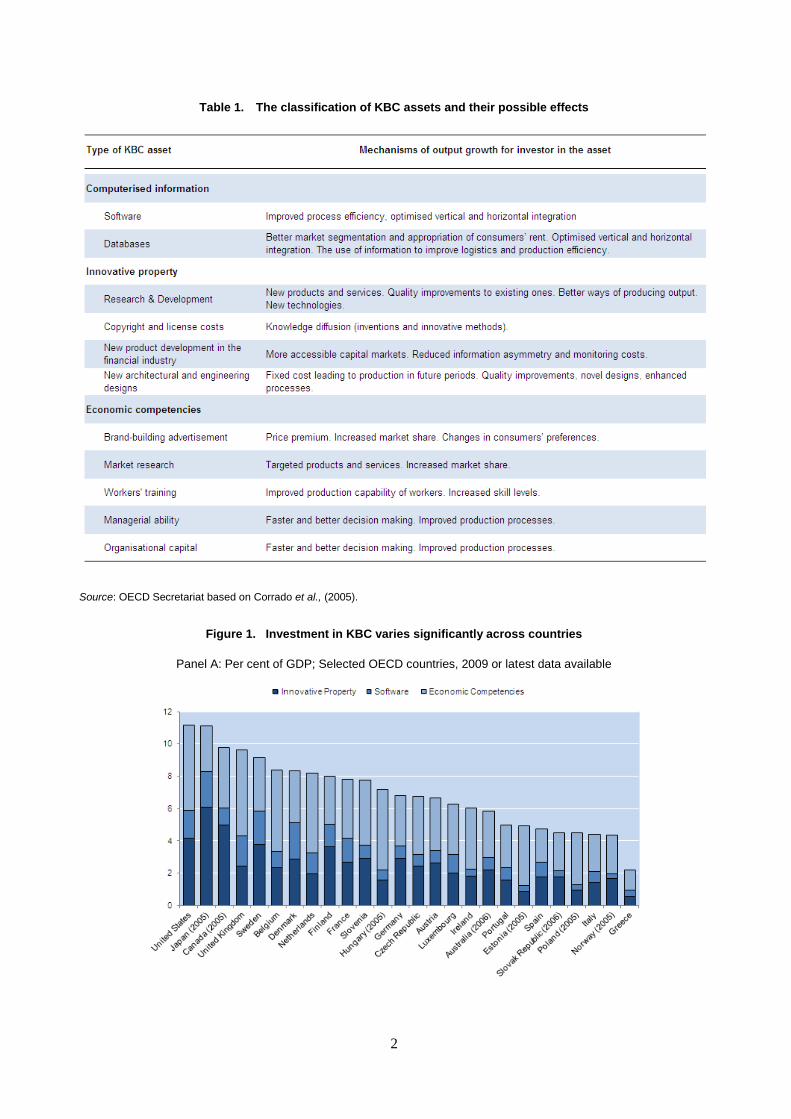
of intellectual property (Table 1). Indeed, investment in KBC has been increasing, and in some countries is
larger as a share of GDP than investment in physical capital (Figure 1). This has implications for
innovation and productivity growth and places heightened importance on a policy environment that
promotes smooth adjustments of labour and capital inputs and entrepreneurial risk-taking.
2. Unlike investment in tangible assets such as machinery and equipment, many knowledge-based
assets (e.g. software) are non-rival to the extent that they can be simultaneously employed by multiple
users without diminishing their basic usefulness. Thus, the initial cost incurred in developing new ideas –
typically through R&D – does not get re-incurred as the latter are combined with other inputs in the
production process. Hence, in economies where KBC is important, growth is less likely to be constrained
by scarcity than in an economy dominated by tangible capital. Furthermore, privately created knowledge
often diffuses beyond its place of creation, thus providing wider social benefits.
2
Table 1. The classification of KBC assets and their possible effects
Source: OECD Secretariat based on Corrado et al., (2005).
Figure 1. Investment in KBC varies significantly across countries
Panel A: Per cent of GDP; Selected OECD countries, 2009 or latest data available
3
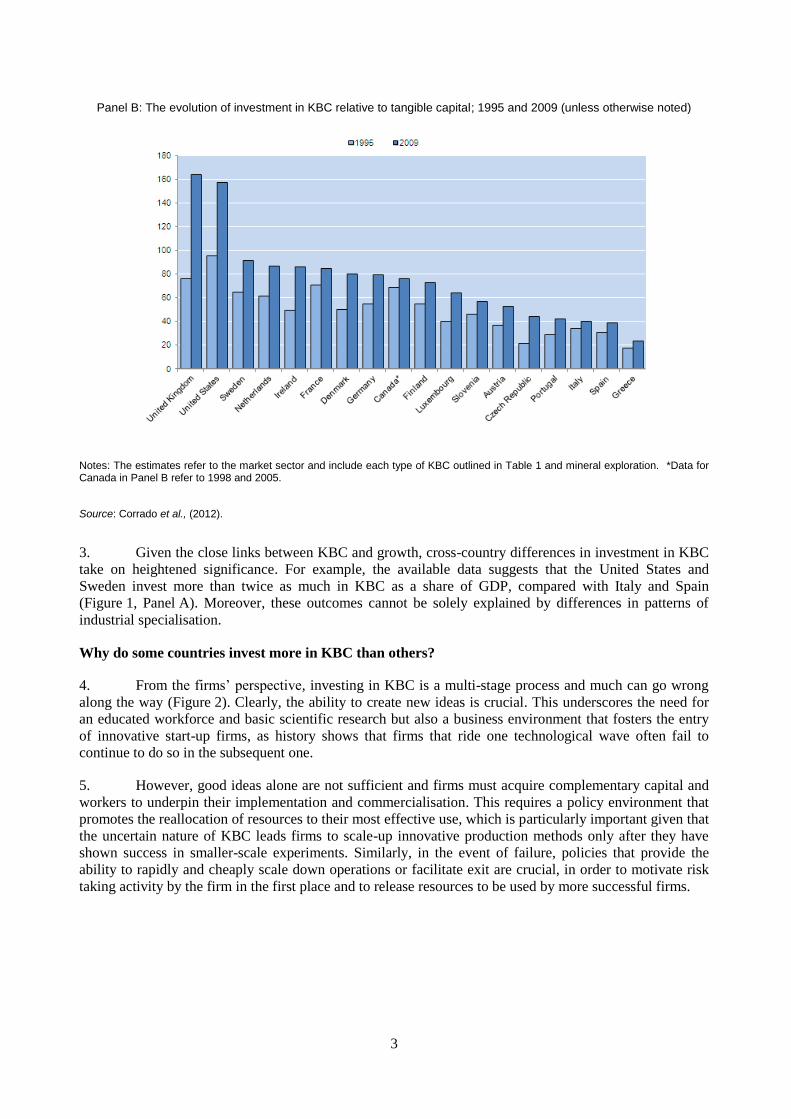
Panel B: The evolution of investment in KBC relative to tangible capital; 1995 and 2009 (unless otherwise noted)
Notes: The estimates refer to the market sector and include each type of KBC outlined in Table 1 and mineral exploration. *Data for Canada in Panel B refer to 1998 and 2005.
Source: Corrado et al., (2012).
3. Given the close links between KBC and growth, cross-country differences in investment in KBC
take on heightened significance. For example, the available data suggests that the United States and
Sweden invest more than twice as much in KBC as a share of GDP, compared with Italy and Spain
(Figure 1, Panel A). Moreover, these outcomes cannot be solely explained by differences in patterns of
industrial specialisation.
Why do some countries invest more in KBC than others?
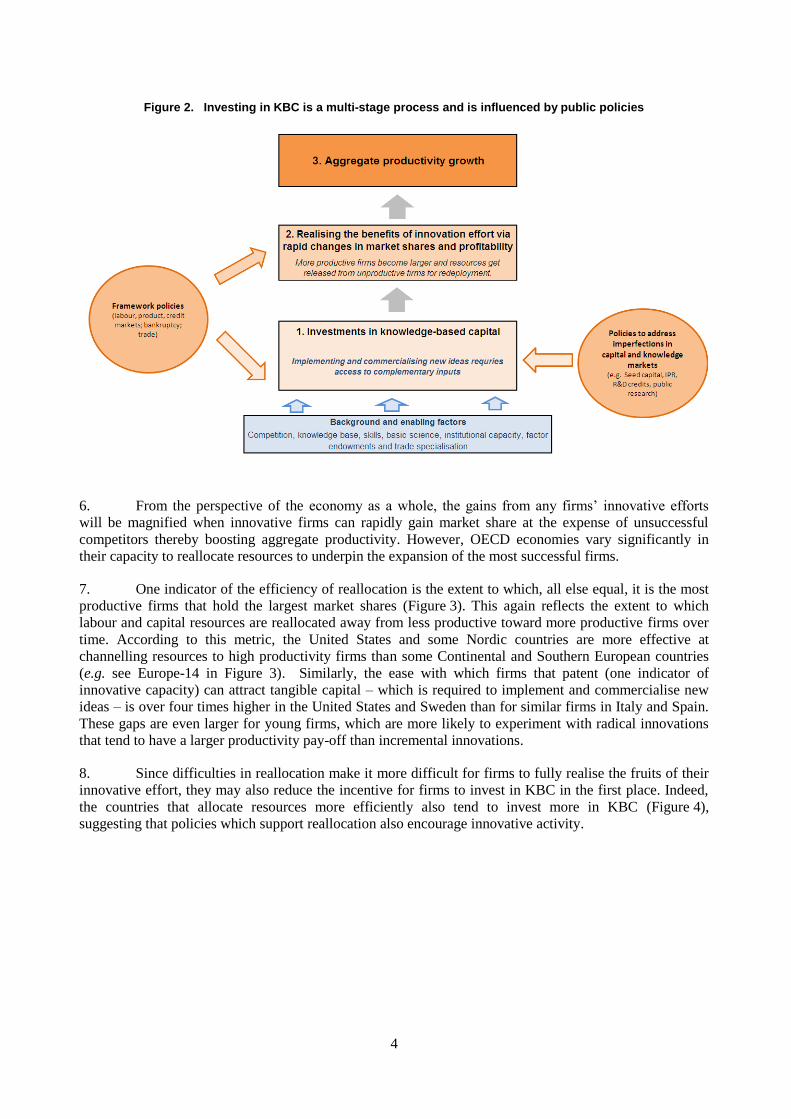
4. From the firms’ perspective, investing in KBC is a multi-stage process and much can go wrong
along the way (Figure 2). Clearly, the ability to create new ideas is crucial. This underscores the need for
an educated workforce and basic scientific research but also a business environment that fosters the entry
of innovative start-up firms, as history shows that firms that ride one technological wave often fail to
continue to do so in the subsequent one.
5. However, good ideas alone are not sufficient and firms must acquire complementary capital and
workers to underpin their implementation and commercialisation. This requires a policy environment that
promotes the reallocation of resources to their most effective use, which is particularly important given that
the uncertain nature of KBC leads firms to scale-up innovative production methods only after they have
shown success in smaller-scale experiments. Similarly, in the event of failure, policies that provide the
ability to rapidly and cheaply scale down operations or facilitate exit are crucial, in order to motivate risk
taking activity by the firm in the first place and to release resources to be used by more successful firms.
4
Figure 2. Investing in KBC is a multi-stage process and is influenced by public policies
6. From the perspective of the economy as a whole, the gains from any firms’ innovative efforts
will be magnified when innovative firms can rapidly gain market share at the expense of unsuccessful
competitors thereby boosting aggregate productivity. However, OECD economies vary significantly in
their capacity to reallocate resources to underpin the expansion of the most successful firms.
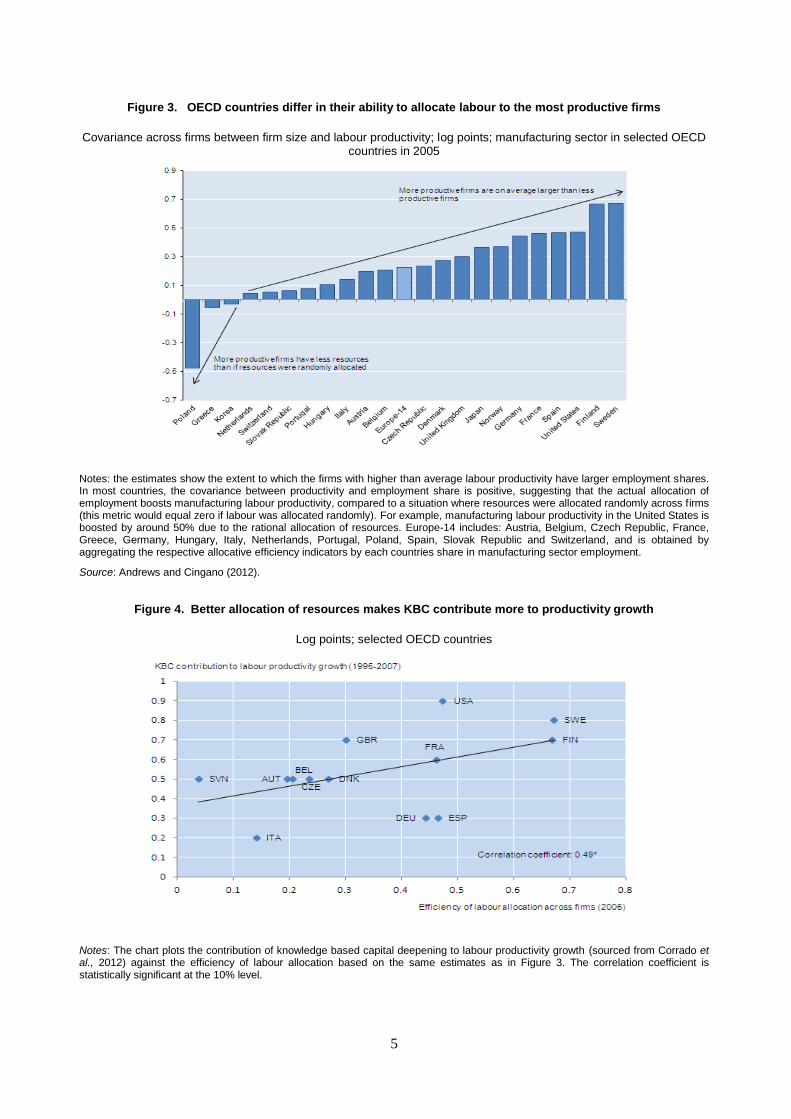
7. One indicator of the efficiency of reallocation is the extent to which, all else equal, it is the most
productive firms that hold the largest market shares (Figure 3). This again reflects the extent to which
labour and capital resources are reallocated away from less productive toward more productive firms over
time. According to this metric, the United States and some Nordic countries are more effective at
channelling resources to high productivity firms than some Continental and Southern European countries
(e.g. see Europe-14 in Figure 3). Similarly, the ease with which firms that patent (one indicator of
innovative capacity) can attract tangible capital – which is required to implement and commercialise new
ideas – is over four times higher in the United States and Sweden than for similar firms in Italy and Spain.
These gaps are even larger for young firms, which are more likely to experiment with radical innovations
that tend to have a larger productivity pay-off than incremental innovations.
8. Since difficulties in reallocation make it more difficult for firms to fully realise the fruits of their
innovative effort, they may also reduce the incentive for firms to invest in KBC in the first place. Indeed,
the countries that allocate resources more efficiently also tend to invest more in KBC (Figure 4),
suggesting that policies which support reallocation also encourage innovative activity.
5
Figure 3. OECD countries differ in their ability to allocate labour to the most productive firms
Covariance across firms between firm size and labour productivity; log points; manufacturing sector in selected OECD countries in 2005
Notes: the estimates show the extent to which the firms with higher than average labour productivity have larger employment shares. In most countries, the covariance between productivity and employment share is positive, suggesting that the actual allocation of employment boosts manufacturing labour productivity, compared to a situation where resources were allocated randomly across firms (this metric would equal zero if labour was allocated randomly). For example, manufacturing labour productivity in the United States is boosted by around 50% due to the rational allocation of resources. Europe-14 includes: Austria, Belgium, Czech Republic, France, Greece, Germany, Hungary, Italy, Netherlands, Portugal, Poland, Spain, Slovak Republic and Switzerland, and is obtained by aggregating the respective allocative efficiency indicators by each countries share in manufacturing sector employment.
Source: Andrews and Cingano (2012).
Figure 4. Better allocation of resources makes KBC contribute more to productivity growth
Log points; selected OECD countries
Notes: The chart plots the contribution of knowledge based capital deepening to labour productivity growth (sourced from Corrado et al., 2012) against the efficiency of labour allocation based on the same estimates as in Figure 3. The correlation coefficient is statistically significant at the 10% level.
6
Well-designed framework policies can raise incentives to invest in KBC
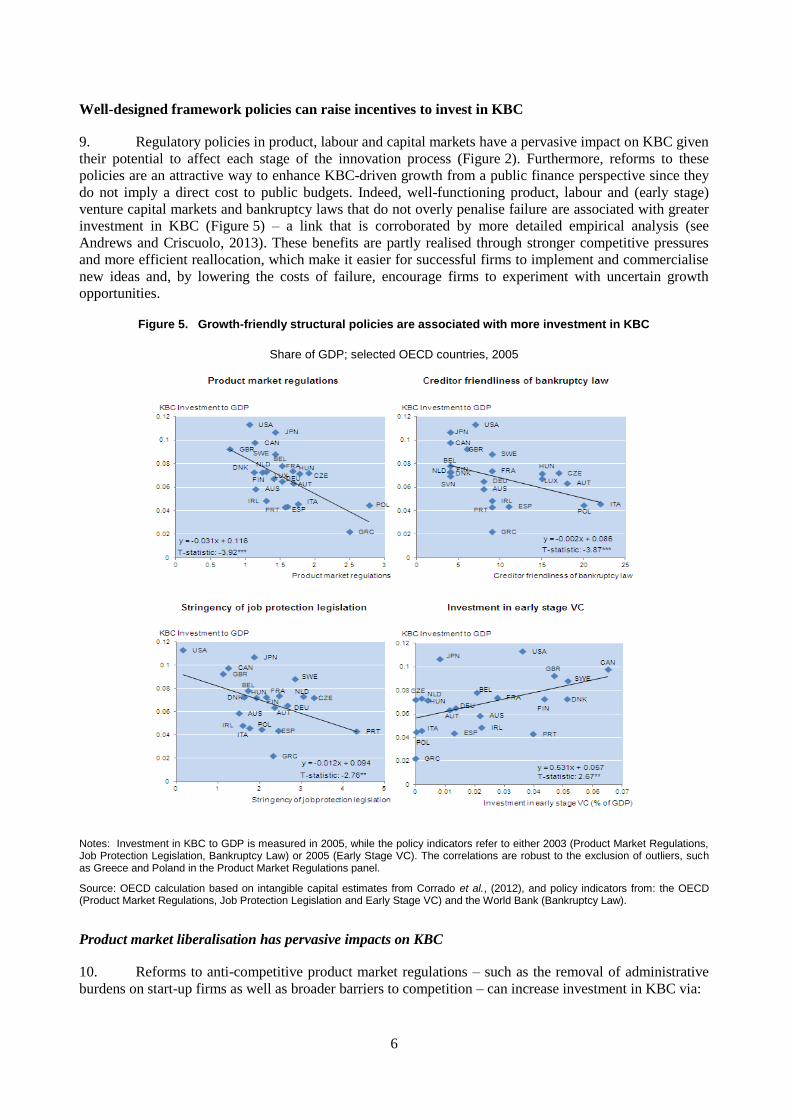
9. Regulatory policies in product, labour and capital markets have a pervasive impact on KBC given
their potential to affect each stage of the innovation process (Figure 2). Furthermore, reforms to these
policies are an attractive way to enhance KBC-driven growth from a public finance perspective since they
do not imply a direct cost to public budgets. Indeed, well-functioning product, labour and (early stage)
venture capital markets and bankruptcy laws that do not overly penalise failure are associated with greater
investment in KBC (Figure 5) – a link that is corroborated by more detailed empirical analysis (see
Andrews and Criscuolo, 2013). These benefits are partly realised through stronger competitive pressures
and more efficient reallocation, which make it easier for successful firms to implement and commercialise
new ideas and, by lowering the costs of failure, encourage firms to experiment with uncertain growth
opportunities.
Figure 5. Growth-friendly structural policies are associated with more investment in KBC
Share of GDP; selected OECD countries, 2005
Notes: Investment in KBC to GDP is measured in 2005, while the policy indicators refer to either 2003 (Product Market Regulations, Job Protection Legislation, Bankruptcy Law) or 2005 (Early Stage VC). The correlations are robust to the exclusion of outliers, such as Greece and Poland in the Product Market Regulations panel.
Source: OECD calculation based on intangible capital estimates from Corrado et al., (2012), and policy indicators from: the OECD (Product Market Regulations, Job Protection Legislation and Early Stage VC) and the World Bank (Bankruptcy Law).
Product market liberalisation has pervasive impacts on KBC
10. Reforms to anti-competitive product market regulations – such as the removal of administrative
burdens on start-up firms as well as broader barriers to competition – can increase investment in KBC via:
7
More entry of entrepreneurial start-ups, which in turn increases pressure on incumbent firms to
invest in R&D and incorporate foreign technologies.
Improved management performance as a result of greater market discipline, which enhances the
ability of firms to implement new technologies and sustain the innovation process. See Bloom
and Van Reenen (2010) for a discussion.
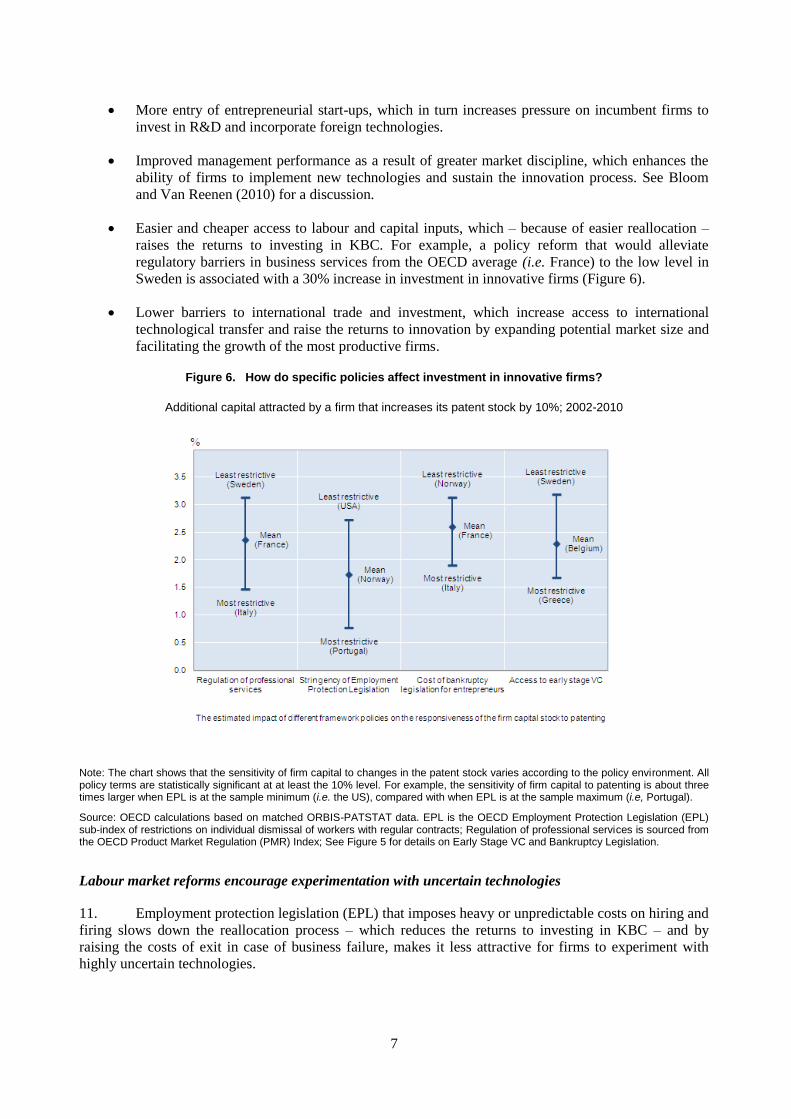
Easier and cheaper access to labour and capital inputs, which – because of easier reallocation –
raises the returns to investing in KBC. For example, a policy reform that would alleviate
regulatory barriers in business services from the OECD average (i.e. France) to the low level in
Sweden is associated with a 30% increase in investment in innovative firms (Figure 6).
Lower barriers to international trade and investment, which increase access to international
technological transfer and raise the returns to innovation by expanding potential market size and
facilitating the growth of the most productive firms.
Figure 6. How do specific policies affect investment in innovative firms?
Additional capital attracted by a firm that increases its patent stock by 10%; 2002-2010
Note: The chart shows that the sensitivity of firm capital to changes in the patent stock varies according to the policy environment. All policy terms are statistically significant at at least the 10% level. For example, the sensitivity of firm capital to patenting is about three times larger when EPL is at the sample minimum (i.e. the US), compared with when EPL is at the sample maximum (i.e, Portugal).
Source: OECD calculations based on matched ORBIS-PATSTAT data. EPL is the OECD Employment Protection Legislation (EPL) sub-index of restrictions on individual dismissal of workers with regular contracts; Regulation of professional services is sourced from the OECD Product Market Regulation (PMR) Index; See Figure 5 for details on Early Stage VC and Bankruptcy Legislation.
Labour market reforms encourage experimentation with uncertain technologies
11. Employment protection legislation (EPL) that imposes heavy or unpredictable costs on hiring and
firing slows down the reallocation process – which reduces the returns to investing in KBC – and by
raising the costs of exit in case of business failure, makes it less attractive for firms to experiment with
highly uncertain technologies.
8
Reforming EPL significantly increases the ability of innovative firms to attract resources that are
required to implement and commercialise new ideas (Figure 6). For example, for firms in the
United States where EPL is relatively lax, a 10% in the firm patent stock is associated with a
2.7% increase in investment, but this effect is round three times smaller for firms in Portugal
where EPL is very rigid.
High and unpredictable job protection costs particularly handicap dynamic firms that operate in
an environment subject to greater technological change and that place therefore a high option
value on flexibility, given their tendency to experiment with uncertain technologies.
12. While labour market reforms are desirable in order to boost KBC, the recent experience of some
European countries highlights that such reforms should be designed and implemented in a broad-based
fashion. For instance, the asymmetric liberalisation of employment protection for temporary contracts,
while leaving in place stringent regulations on permanent contracts may have adverse effects on the
accumulation of firm-specific human capital (one form of KBC), to the extent that firms replace permanent
workers with temporary workers, who are less likely to participate in job-related training.
Debtor-friendly bankruptcy laws can promote risk-taking but trade-offs emerge
13. Bankruptcy regimes can foster experimentation with risky technologies if they do not sanction
business failure too severely. If the cost of winding-down a business is particularly high, risky
entrepreneurial ventures might not be brought to the market to avoid incurring high exit costs in case of
failure. Reforms to bankruptcy legislation that lower the cost to close a business can promote investment in
more innovative business ventures (Figure 6), by reducing the expectation of entrepreneurs that they will
be heavily penalised in case of failure. Such arrangements could, however, also discourage investment in
KBC if credit supply is tightened as a result of reduced loss recovery in case of bankruptcy. Striking the
right balance between these two forces makes the design of bankruptcy provisions complicated.
14. The swift reallocation of resources from failed ventures to other more effective uses will also be
affected by the time required for the full completion of all legal procedures to wind up a business and the
incentives to the use of out-of-court arrangements. In extreme cases, these legal procedures might take
years to complete, thus undermining reallocation and the accumulation of entrepreneurial capital. Thus, by
easing reallocation constraints, measures aimed at streamlining and quickening bankruptcy procedures can
create conditions for increased investment in KBC. For more details on impact of legal systems on
economic performance, see Palumbo et al., (2013).
Financing KBC by nurturing the market for risk capital
15. Countries with more developed seed and early stage venture capital markets are more effective at
channelling investment to young, innovative firms (Figure 6). The importance of risk capital markets stems
from the fact that knowledge-based assets are difficult to collateralise – partly because they are less easy to
define and transfer than tangible assets – which makes them less conducive to traditional debt and equity
financing. Cross-country differences in the size of risk capital markets are significant (Figure 5), and
reflect a number of policy-related factors:
Appropriate labour market regulations and bankruptcy legislation (see above) and lower rates of
taxation on corporate incomes and capital gains can foster risk capital markets.
The existence of exit possibilities for risk capital investments (e.g. secondary stock markets such
as the NASDAQ) increases the expected return to investors and entrepreneurs. Rules affecting
initial public offerings and portfolio restrictions that bar, or limit institutional investors (e.g.
pension funds) from investing in risk capital also loom large.

9
16. While government risk capital funds and favourable tax treatment of risk capital investments and
returns are becoming increasingly common in OECD countries, evidence on their effectiveness is scarce.
Innovation policies
17. There is also scope for policies that raise private incentives to invest in KBC towards more
socially desirable levels since knowledge spillovers across firms prevent firms from fully appropriating the
returns from their innovative investments in absence of policy intervention.
18. Intellectual property rights (IPR) provide firms with the incentive to innovate, but maximum
effects are obtained when they are coupled with pro-competition policies. However, in some emerging
KBC sectors where the innovation process is typically fragmented (e.g. software), the patent system may
unduly favour incumbents at the expense of young firms, thus undermining incentives to invest in KBC.
Empirical evidence from the United States suggests that the cost of litigation exceeded the profit from
patents in the late 1990s in industries outside pharmaceuticals and chemicals. Indeed, the increasing
emergence of “patent aggregators” that accumulate software patents with the sole objective of extracting
rents from innovators may challenge innovation activities. While the patent system remains effective at
promoting innovation in sectors such as pharmaceuticals and chemicals, the rising importance of the digital
economy raises an important policy dilemma for governments, which is yet to be resolved in academic and
policy circles.
19. Aside from setting appropriate intellectual property rights, there is scope for public finance
policies that subsidise innovation-related KBC. The most frequent policies are tax incentives and direct
support (i.e. loans, grants) for R&D (Figure 7), with reliance on the former increasing dramatically over
recent decades in many economies. While both policies can be effective, their design features are crucial in
order to minimise the cost to the tax payer and unintended consequences:
It is important that R&D tax incentives are refundable or contain carry-over provisions so as to
avoid overly favouring less dynamic incumbents at the expense of dynamic young firms. Many
young innovative firms are typically in a loss position in the early years of an R&D project and
thus will not benefit from the program unless it contains provisions for immediate cash refunds
for R&D expenditure or allows such firms to carry associated losses forward to deduct against
future tax burdens (see Table A1 for how the design of R&D tax incentive schemes varies across
countries).
Recent improvements in the design of schemes that provide direct government support to R&D
may explain why, in contrast with earlier empirical research, there is now clearer evidence of a
positive impact on innovation (Westmore, 2013). For example, the structure of public support has
become more focused on subsidies for commercial R&D activities and with matching grants (for
private sector investments) being a more common feature of government funding programmes.
10
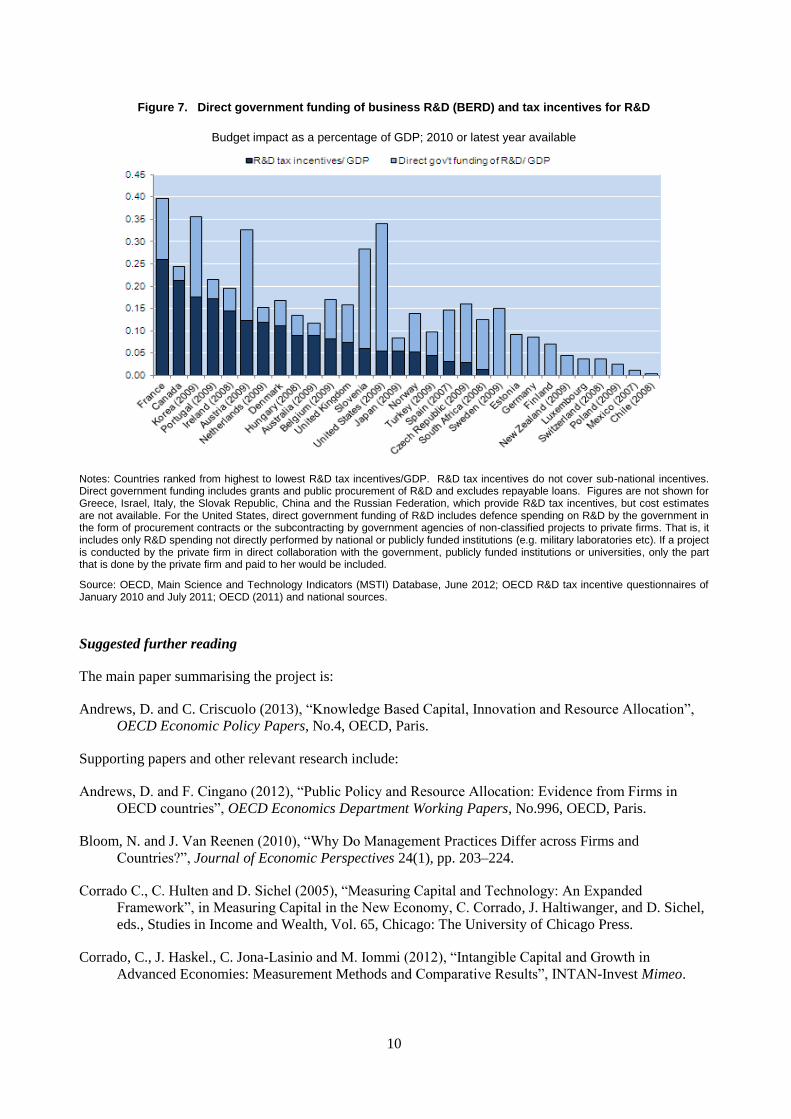
Figure 7. Direct government funding of business R&D (BERD) and tax incentives for R&D
Budget impact as a percentage of GDP; 2010 or latest year available
Notes: Countries ranked from highest to lowest R&D tax incentives/GDP. R&D tax incentives do not cover sub-national incentives. Direct government funding includes grants and public procurement of R&D and excludes repayable loans. Figures are not shown for Greece, Israel, Italy, the Slovak Republic, China and the Russian Federation, which provide R&D tax incentives, but cost estimates are not available. For the United States, direct government funding of R&D includes defence spending on R&D by the government in the form of procurement contracts or the subcontracting by government agencies of non-classified projects to private firms. That is, it includes only R&D spending not directly performed by national or publicly funded institutions (e.g. military laboratories etc). If a project is conducted by the private firm in direct collaboration with the government, publicly funded institutions or universities, only the part that is done by the private firm and paid to her would be included.
Source: OECD, Main Science and Technology Indicators (MSTI) Database, June 2012; OECD R&D tax incentive questionnaires of January 2010 and July 2011; OECD (2011) and national sources.
Suggested further reading
The main paper summarising the project is:
Andrews, D. and C. Criscuolo (2013), “Knowledge Based Capital, Innovation and Resource Allocation”,
OECD Economic Policy Papers, No.4, OECD, Paris.
Supporting papers and other relevant research include:
Andrews, D. and F. Cingano (2012), “Public Policy and Resource Allocation: Evidence from Firms in
OECD countries”, OECD Economics Department Working Papers, No.996, OECD, Paris.
Bloom, N. and J. Van Reenen (2010), “Why Do Management Practices Differ across Firms and
Countries?”, Journal of Economic Perspectives 24(1), pp. 203–224.
Corrado C., C. Hulten and D. Sichel (2005), “Measuring Capital and Technology: An Expanded
Framework”, in Measuring Capital in the New Economy, C. Corrado, J. Haltiwanger, and D. Sichel,
eds., Studies in Income and Wealth, Vol. 65, Chicago: The University of Chicago Press.
Corrado, C., J. Haskel., C. Jona-Lasinio and M. Iommi (2012), “Intangible Capital and Growth in
Advanced Economies: Measurement Methods and Comparative Results”, INTAN-Invest Mimeo.

11
OECD (2010), Innovation Strategy, OECD, Paris.
OECD (2011), OECD Science, Technology and Industry Scoreboard 2011, OECD, Paris.
Palumbo G., G. Giupponi, G., L. Nunziata, and J. Mora-Sanguinetti (2013), “The Effectiveness of Civil
Justice: A Cross-country Economic Analysis”, OECD Economic Policy Papers, No. 5, OECD, Paris.
Westmore, B. (2013), “R&D, Patenting and Productivity: The Role of Public Policy”, OECD Economics
Department Working Papers, No. 1047, OECD, Paris.
12
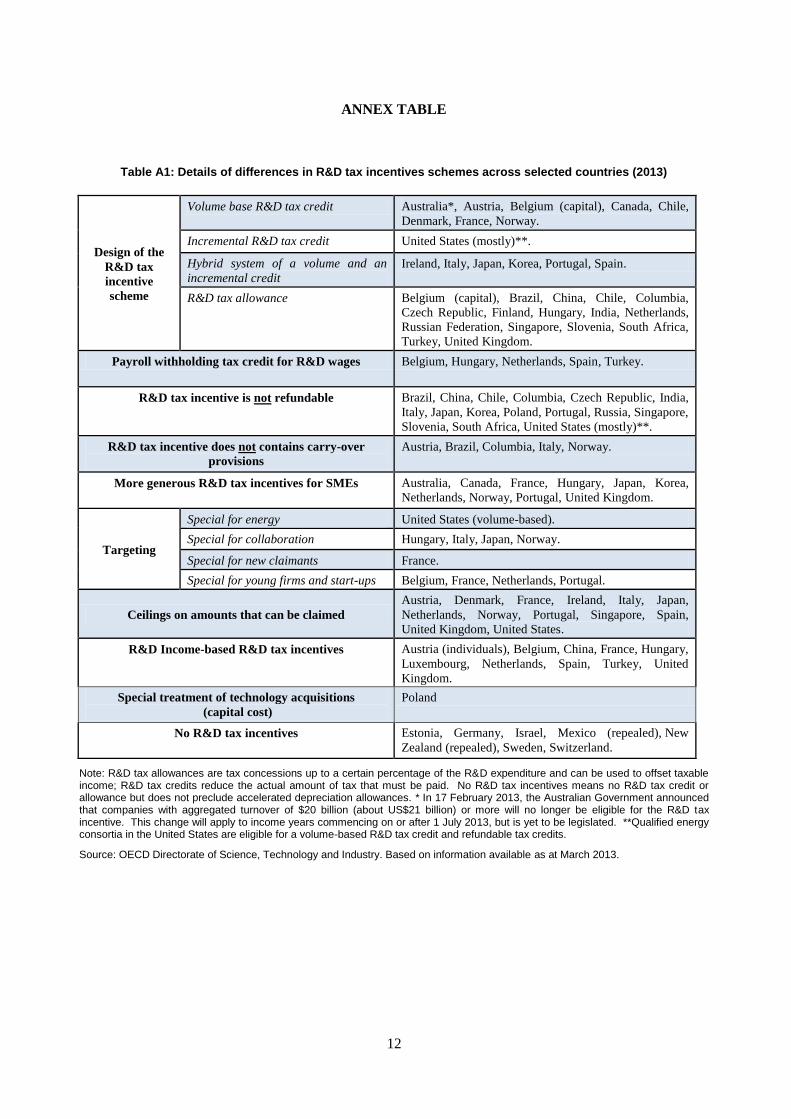
ANNEX TABLE
Table A1: Details of differences in R&D tax incentives schemes across selected countries (2013)
Design of the
R&D tax
incentive
scheme
Volume base R&D tax credit Australia*, Austria, Belgium (capital), Canada, Chile,
Denmark, France, Norway.
Incremental R&D tax credit United States (mostly)**.
Hybrid system of a volume and an
incremental credit
Ireland, Italy, Japan, Korea, Portugal, Spain.
R&D tax allowance Belgium (capital), Brazil, China, Chile, Columbia,
Czech Republic, Finland, Hungary, India, Netherlands,
Russian Federation, Singapore, Slovenia, South Africa,
Turkey, United Kingdom.
Payroll withholding tax credit for R&D wages Belgium, Hungary, Netherlands, Spain, Turkey.
R&D tax incentive is not refundable Brazil, China, Chile, Columbia, Czech Republic, India,
Italy, Japan, Korea, Poland, Portugal, Russia, Singapore,
Slovenia, South Africa, United States (mostly)**.
R&D tax incentive does not contains carry-over
provisions
Austria, Brazil, Columbia, Italy, Norway.
More generous R&D tax incentives for SMEs Australia, Canada, France, Hungary, Japan, Korea,
Netherlands, Norway, Portugal, United Kingdom.
Targeting
Special for energy United States (volume-based).
Special for collaboration Hungary, Italy, Japan, Norway.
Special for new claimants France.
Special for young firms and start-ups Belgium, France, Netherlands, Portugal.
Ceilings on amounts that can be claimed
Austria, Denmark, France, Ireland, Italy, Japan,
Netherlands, Norway, Portugal, Singapore, Spain,
United Kingdom, United States.
R&D Income-based R&D tax incentives Austria (individuals), Belgium, China, France, Hungary,
Luxembourg, Netherlands, Spain, Turkey, United
Kingdom.
Special treatment of technology acquisitions
(capital cost)
Poland
No R&D tax incentives Estonia, Germany, Israel, Mexico (repealed), New
Zealand (repealed), Sweden, Switzerland.
Note: R&D tax allowances are tax concessions up to a certain percentage of the R&D expenditure and can be used to offset taxable income; R&D tax credits reduce the actual amount of tax that must be paid. No R&D tax incentives means no R&D tax credit or allowance but does not preclude accelerated depreciation allowances. * In 17 February 2013, the Australian Government announced that companies with aggregated turnover of $20 billion (about US$21 billion) or more will no longer be eligible for the R&D tax incentive. This change will apply to income years commencing on or after 1 July 2013, but is yet to be legislated. **Qualified energy consortia in the United States are eligible for a volume-based R&D tax credit and refundable tax credits.
Source: OECD Directorate of Science, Technology and Industry. Based on information available as at March 2013.

13
POLICY NOTE SERIES
The full Economics Department Policy Notes series can be consulted at: www.oecd.org/economy/policynotes
Debt and Macroeconomic stability: The perils of high debt and how to avoid them Policy Note No. 16, January 2013
Looking to 2060: A Global Vision of Long-Term Growth Policy Note, No. 15, November 2012
Financial Contagion in the Era of Globalised Banking Policy Note, No. 14, June 2012
International capital mobility: structural policies to reduce financial fragility Policy Note, No. 13, June 2012
What are the best policy instruments for fiscal consolidation? Policy Note, No. 12, April 2012
Fiscal consolidation: How much is needed to reduce debt to a prudent level? Policy Note, No. 11, April 2012
Managing government debt and assets after the crisis Policy Note, No. 10, February 2012
Income inequality and growth - The role of taxes and transfers Policy Note, No. 9, January 2012
Inequality in labour income - What are its drivers and how can it be reduced? Policy Note, No. 8, January 2012
Recent Developments in the Automobile Industry Policy Note, No. 7, July 2011
Getting the most out of International Capital Flows Policy Note, No. 6, May 2011
The persistence of high unemployment: what risks? what policies? Policy Note, No. 5, April 2011
The Effects of Oil Price Hikes on Economic Activity and Inflation Policy Note, No. 4, March 2011
The Impact of Structural Reforms on Current Account Imbalances Policy Note, No. 3, March 2011
Health care systems: Getting more value for money Policy Note, No. 2, June 2010
Counter Cyclical Economic Policy Policy Note, No. 1, May 2010
ECONOMICS DEPARTMENT POLICY NOTES
This series of Policy Notes is designed to make available,
to a wider readership, selected studies which the
Department has prepared for use within OECD.
Comment on this Policy Note is invited, and may be sent
to OECD Economics Department, 2 rue André Pascal,
75775 Paris Cedex 16, France, or by e-mail to