Embed Size (px)
Citation preview
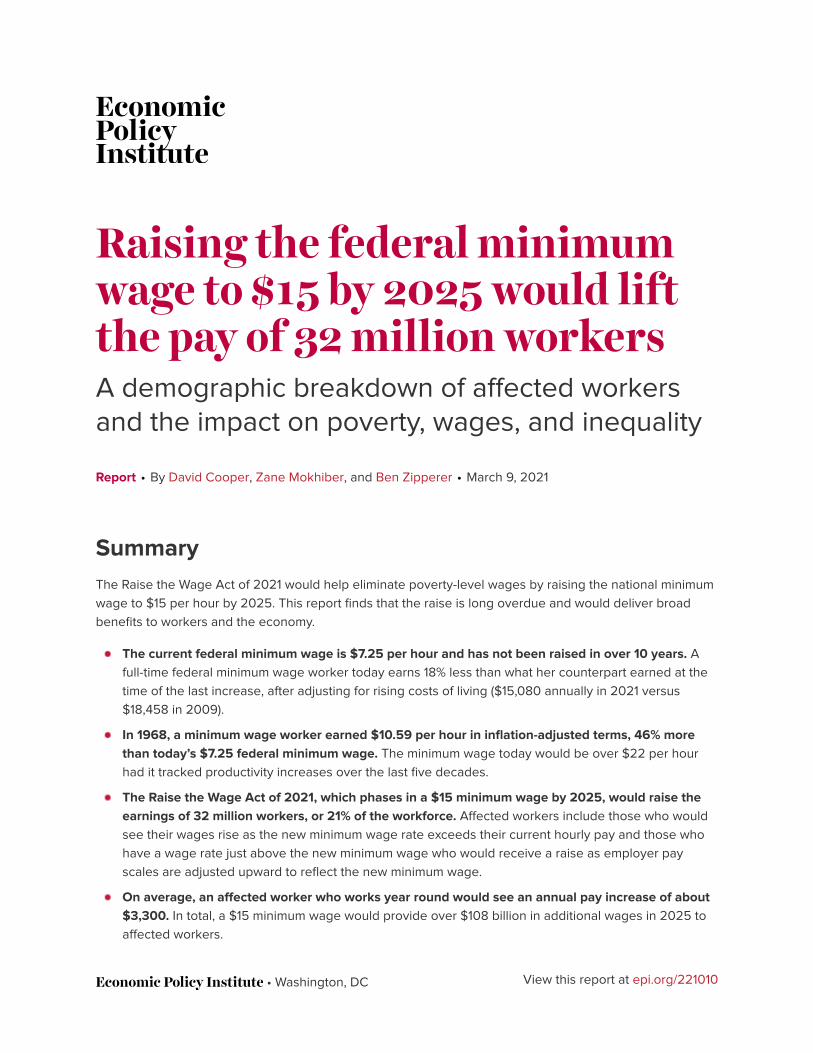
Raising the federal minimumwage to $15 by 2025 would liftthe pay of 32 million workersA demographic breakdown of affected workersand the impact on poverty, wages, and inequality
Report • By David Cooper, Zane Mokhiber, and Ben Zipperer • March 9, 2021
SummaryThe Raise the Wage Act of 2021 would help eliminate poverty-level wages by raising the national minimumwage to $15 per hour by 2025. This report finds that the raise is long overdue and would deliver broadbenefits to workers and the economy.
The current federal minimum wage is $7.25 per hour and has not been raised in over 10 years. Afull-time federal minimum wage worker today earns 18% less than what her counterpart earned at thetime of the last increase, after adjusting for rising costs of living ($15,080 annually in 2021 versus$18,458 in 2009).
In 1968, a minimum wage worker earned $10.59 per hour in inflation-adjusted terms, 46% morethan today’s $7.25 federal minimum wage. The minimum wage today would be over $22 per hourhad it tracked productivity increases over the last five decades.
The Raise the Wage Act of 2021, which phases in a $15 minimum wage by 2025, would raise theearnings of 32 million workers, or 21% of the workforce. Affected workers include those who wouldsee their wages rise as the new minimum wage rate exceeds their current hourly pay and those whohave a wage rate just above the new minimum wage who would receive a raise as employer payscales are adjusted upward to reflect the new minimum wage.
On average, an affected worker who works year round would see an annual pay increase of about$3,300. In total, a $15 minimum wage would provide over $108 billion in additional wages in 2025 toaffected workers.
• Washington, DC View this report at epi.org/221010
A national minimum wage of $15 delivers on a core demand of the Civil Rightsmovement. The March on Washington in 1963 (the March on Washington for Jobs andFreedom) demanded a $2.00 national minimum wage that would be equivalent to$15.00 today, after adjusting for inflation.
Earnings would rise for nearly one in three Black workers (31%) and for one in fourHispanic workers (26%), compared with about one in five white workers. For Blackand Hispanic workers who work year round, annual pay would increase by at least$3,500.
$15 minimum wage by 2025 would raise the wages of at least 19 million essentialand front-line workers. Essential and front-line workers constitute more than 60% ofall workers who would see a pay increase.
Workers who cannot work from home—who are more likely to be Black, Latinx, andNative American—are the overwhelming majority of workers (almost nine out ofevery 10) who would receive pay raises under the Raise the Wage Act of 2021.
The Raise the Wage Act would help eliminate poverty wages. Raising the minimumwage to $15 in 2025 would lift up to 3.7 million—including an estimated 1.3 millionchildren—out of poverty.
Raising the minimum wage to $15 would help ensure that more low-wage workersare paid enough to cover basic living expenses, i.e., a wage providing a modest yetadequate standard of living. As of 2021, in virtually all urban and rural areas of thecountry, a single adult without children working full time must earn more than $15 perhour to have enough to pay for housing and other basic living expenses. Forindividuals with children, year-round work at a $15 wage in 2025 will still beinadequate to achieve basic economic security.
Minimum wage increases have not led to significant job losses. Despite claims thatraising the minimum wage would reduce job opportunities for vulnerable groups ofworkers, the best evidence shows little to no job losses in the wake of minimum wageincreases and a net wage gain even if job losses have occurred. These benefitsexplain why surveys show that the people most likely to support a minimum wageincrease are unemployed people, people of color, and women.
Minimum wage increases affect adults in their career-building years who arehelping to support their families—with woman disproportionately benefiting from apay boost. The average age of workers who would see a pay increase under theRaise the Wage Act is 35 years old. About 90% of those with increased wages wouldbe adults age 20 or older. Most of the workers who would benefit are women (59%)even though men are a majority of the workforce. More than half of those who wouldhave higher pay work full time (59%). Past research shows that these workers areoften the primary earners for their families, producing the majority of their family’stotal income.
Data by state and congressional district
2
Supplemental tables showing characteristics of workers who would be affectedby increasing the federal minimum wage to $15 by 2025 in each state and in theDistrict of Columbia are available here.
Data by congressional district are viewable in an interactive map (EPI 2021b).
An increase in the national minimum wage iswell overdueThe federal minimum wage has not been raised in over a decade; it has remained stuck at$7.25 per hour since 2009. Figure A compares the trajectory of the minimum wage at facevalue (known in economics as the nominal minimum wage) with the inflation-adjusted or“real” value of the minimum wage (representing its purchasing power) and with the realvalue of the minimum wage had it risen with productivity after 1948. As the figure shows,rising costs of living since the last increase in the nominal minimum wage in 2009 havediminished the purchasing power of the federal minimum wage (the middle line for most ofthe graph), which had declined by 17% as of 2020 and 18% as of 2021 (not shown), adevastating fall in the earnings of the lowest-wage workers.
The figure also shows that, with the exception of some important increases, the inflation-adjusted value of the minimum wage has mostly stagnated or declined since the 1970s.But that was not always the case: In the 1950s and 1960s, Congress raised the minimumwage more frequently such that it rose roughly in line with the pace of economywideproductivity. At the peak purchasing power of the minimum wage in 1968, a minimumwage worker earned $10.59 per hour (in 2021 dollars), 46% more than a worker at the$7.25 federal minimum wage today. Had Congress continued to increase the minimumwage in line with productivity growth, the minimum wage today would be over $22 perhour. Despite the doubling of labor productivity, minimum wage workers today are paidsubstantially less in real terms than their counterparts earned five decades ago.
Raising the minimum wage to $15 by 2025, as called for in the Raise the Wage Act of 2021,is an important step toward reversing the erosion of the minimum wage’s buying powerand—as detailed later in this report—achieving greater racial and gender pay equity, aswell as fairer wages for those workers most affected by the COVID-19 pandemic. The acthas three key components:
1. The national minimum wage increases in five steps over five years, beginning with anincrease to $9.50 this year and ending with a $15 minimum wage in 2025.
2. Each year after 2025, the minimum wage would automatically increase in line withchanges in the median hourly wage in the economy.
3. The subminimum wages employers are currently allowed to pay tipped workers,workers with disabilities, and workers under the age of 20 are gradually phased out,raising minimum wages for these workers to the same level as other workers.
3
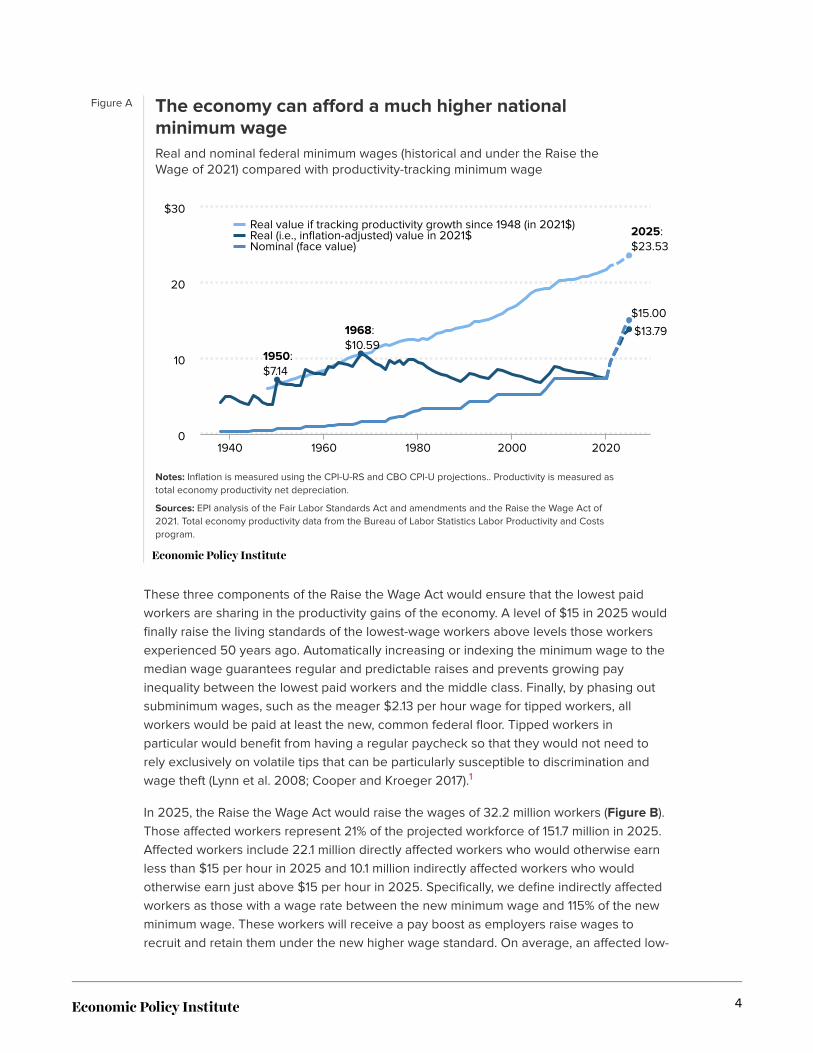
Figure A The economy can afford a much higher nationalminimum wageReal and nominal federal minimum wages (historical and under the Raise theWage of 2021) compared with productivity-tracking minimum wage
Notes: Inflation is measured using the CPI-U-RS and CBO CPI-U projections.. Productivity is measured astotal economy productivity net depreciation.
Sources: EPI analysis of the Fair Labor Standards Act and amendments and the Raise the Wage Act of2021. Total economy productivity data from the Bureau of Labor Statistics Labor Productivity and Costsprogram.
2025:$23.53
$13.79
1950:$7.14
1968:$10.59
$15.00
Real value if tracking productivity growth since 1948 (in 2021$)Real (i.e., inflation-adjusted) value in 2021$Nominal (face value)
1940 1960 1980 2000 20200
10
20
$30
These three components of the Raise the Wage Act would ensure that the lowest paidworkers are sharing in the productivity gains of the economy. A level of $15 in 2025 wouldfinally raise the living standards of the lowest-wage workers above levels those workersexperienced 50 years ago. Automatically increasing or indexing the minimum wage to themedian wage guarantees regular and predictable raises and prevents growing payinequality between the lowest paid workers and the middle class. Finally, by phasing outsubminimum wages, such as the meager $2.13 per hour wage for tipped workers, allworkers would be paid at least the new, common federal floor. Tipped workers inparticular would benefit from having a regular paycheck so that they would not need torely exclusively on volatile tips that can be particularly susceptible to discrimination andwage theft (Lynn et al. 2008; Cooper and Kroeger 2017).1
In 2025, the Raise the Wage Act would raise the wages of 32.2 million workers (Figure B).Those affected workers represent 21% of the projected workforce of 151.7 million in 2025.Affected workers include 22.1 million directly affected workers who would otherwise earnless than $15 per hour in 2025 and 10.1 million indirectly affected workers who wouldotherwise earn just above $15 per hour in 2025. Specifically, we define indirectly affectedworkers as those with a wage rate between the new minimum wage and 115% of the newminimum wage. These workers will receive a pay boost as employers raise wages torecruit and retain them under the new higher wage standard. On average, an affected low-
4
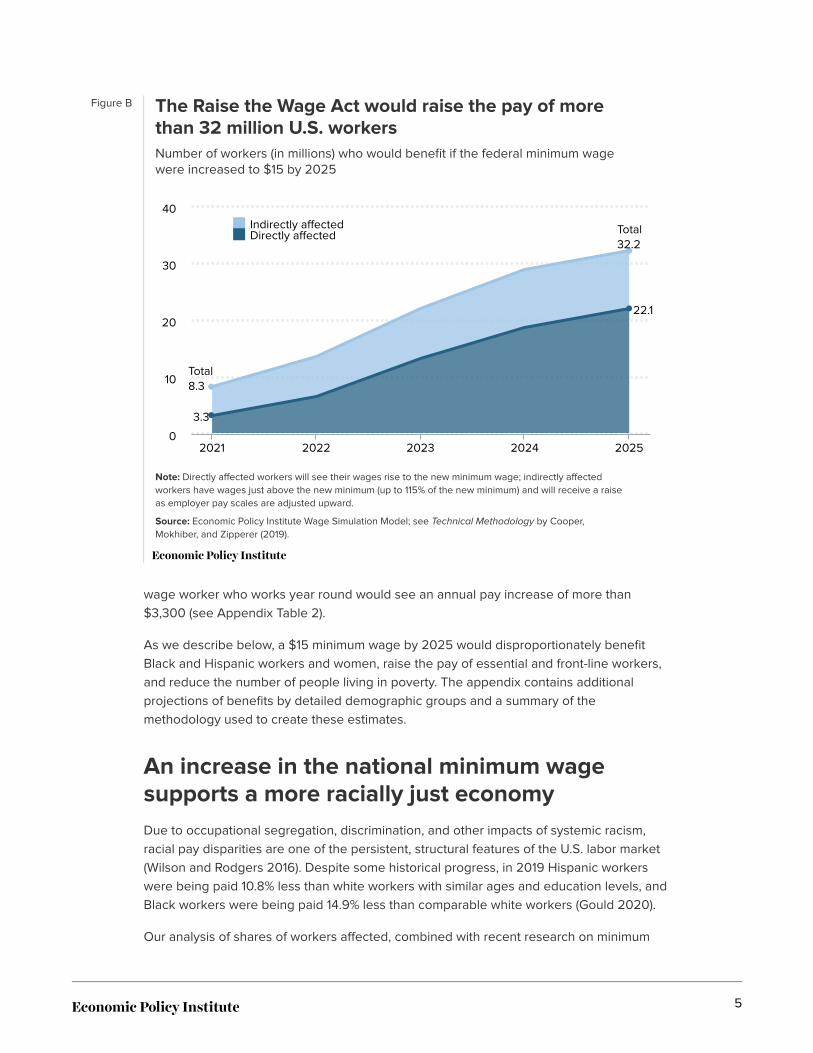
Figure B The Raise the Wage Act would raise the pay of morethan 32 million U.S. workersNumber of workers (in millions) who would benefit if the federal minimum wagewere increased to $15 by 2025
Note: Directly affected workers will see their wages rise to the new minimum wage; indirectly affectedworkers have wages just above the new minimum (up to 115% of the new minimum) and will receive a raiseas employer pay scales are adjusted upward.
Source: Economic Policy Institute Wage Simulation Model; see Technical Methodology by Cooper,Mokhiber, and Zipperer (2019).
Total8.3
Total32.2
3.3
22.1
Indirectly affectedDirectly affected
2021 2022 2023 2024 20250
10
20
30
40
wage worker who works year round would see an annual pay increase of more than$3,300 (see Appendix Table 2).
As we describe below, a $15 minimum wage by 2025 would disproportionately benefitBlack and Hispanic workers and women, raise the pay of essential and front-line workers,and reduce the number of people living in poverty. The appendix contains additionalprojections of benefits by detailed demographic groups and a summary of themethodology used to create these estimates.
An increase in the national minimum wagesupports a more racially just economyDue to occupational segregation, discrimination, and other impacts of systemic racism,racial pay disparities are one of the persistent, structural features of the U.S. labor market(Wilson and Rodgers 2016). Despite some historical progress, in 2019 Hispanic workerswere being paid 10.8% less than white workers with similar ages and education levels, andBlack workers were being paid 14.9% less than comparable white workers (Gould 2020).
Our analysis of shares of workers affected, combined with recent research on minimum
5
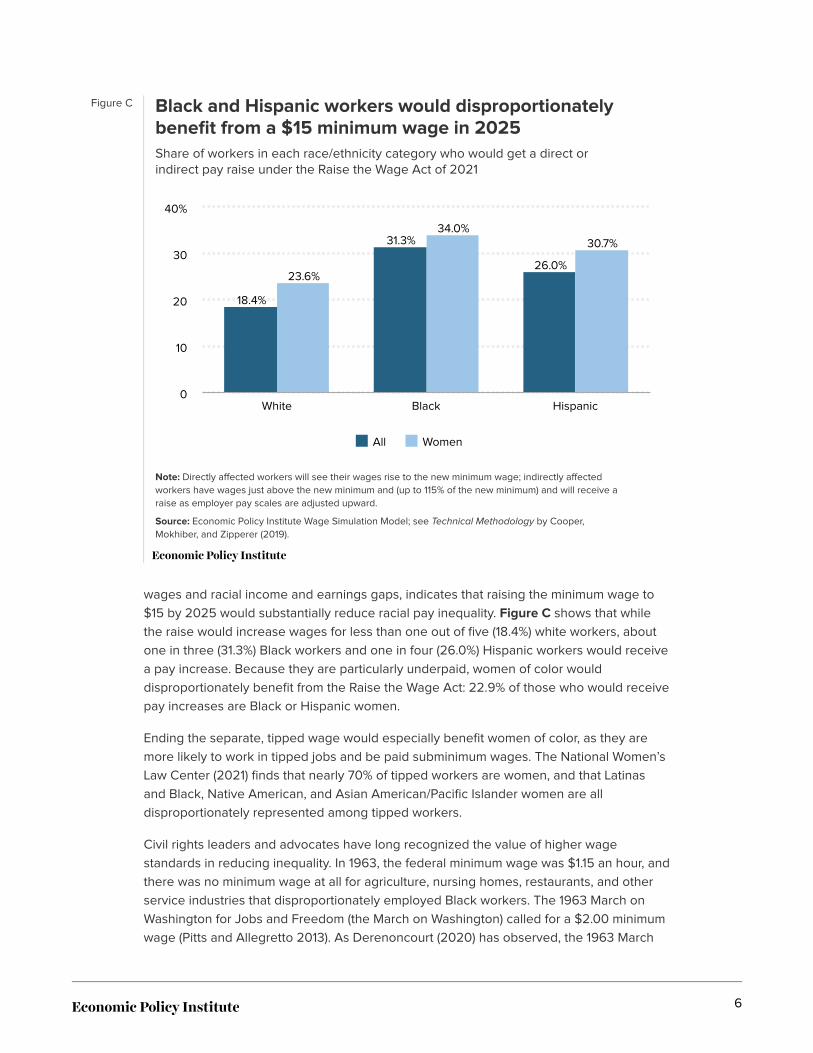
Figure C Black and Hispanic workers would disproportionatelybenefit from a $15 minimum wage in 2025Share of workers in each race/ethnicity category who would get a direct orindirect pay raise under the Raise the Wage Act of 2021
Note: Directly affected workers will see their wages rise to the new minimum wage; indirectly affectedworkers have wages just above the new minimum and (up to 115% of the new minimum) and will receive araise as employer pay scales are adjusted upward.
Source: Economic Policy Institute Wage Simulation Model; see Technical Methodology by Cooper,Mokhiber, and Zipperer (2019).
18.4%
31.3%
26.0%23.6%
34.0%30.7%
All Women
White Black Hispanic0
10
20
30
40%
wages and racial income and earnings gaps, indicates that raising the minimum wage to$15 by 2025 would substantially reduce racial pay inequality. Figure C shows that whilethe raise would increase wages for less than one out of five (18.4%) white workers, aboutone in three (31.3%) Black workers and one in four (26.0%) Hispanic workers would receivea pay increase. Because they are particularly underpaid, women of color woulddisproportionately benefit from the Raise the Wage Act: 22.9% of those who would receivepay increases are Black or Hispanic women.
Ending the separate, tipped wage would especially benefit women of color, as they aremore likely to work in tipped jobs and be paid subminimum wages. The National Women’sLaw Center (2021) finds that nearly 70% of tipped workers are women, and that Latinasand Black, Native American, and Asian American/Pacific Islander women are alldisproportionately represented among tipped workers.
Civil rights leaders and advocates have long recognized the value of higher wagestandards in reducing inequality. In 1963, the federal minimum wage was $1.15 an hour, andthere was no minimum wage at all for agriculture, nursing homes, restaurants, and otherservice industries that disproportionately employed Black workers. The 1963 March onWashington for Jobs and Freedom (the March on Washington) called for a $2.00 minimumwage (Pitts and Allegretto 2013). As Derenoncourt (2020) has observed, the 1963 March
6
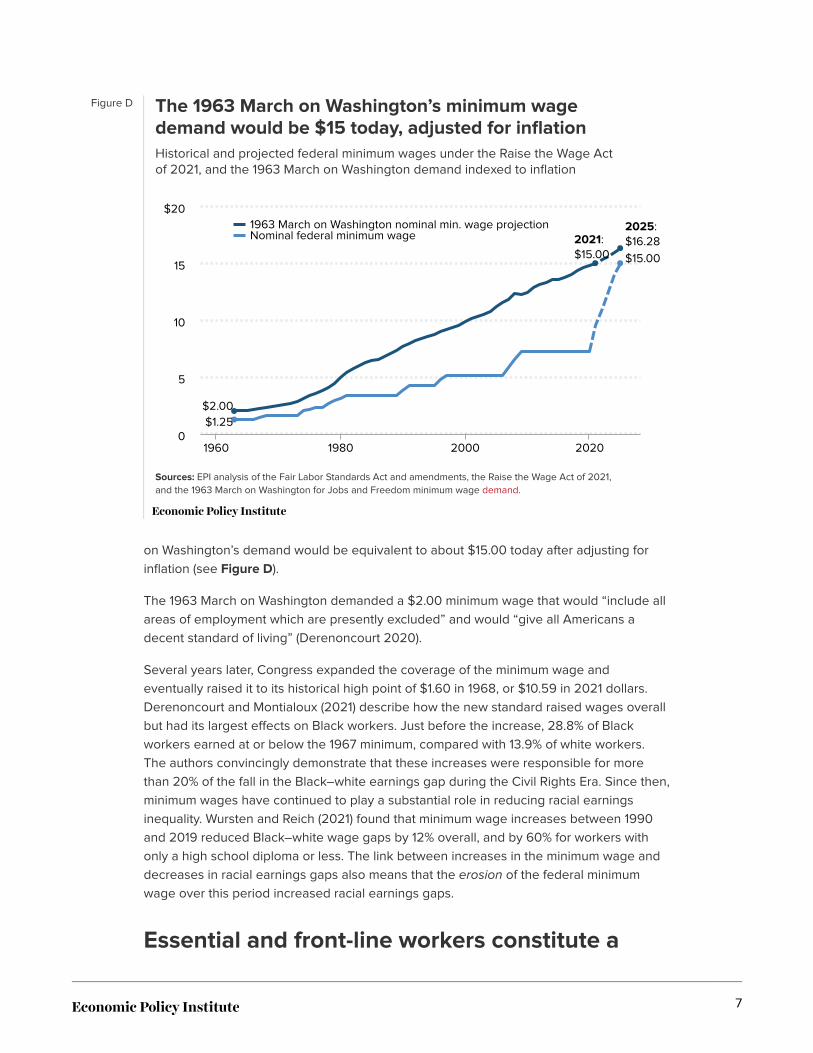
Figure D The 1963 March on Washington’s minimum wagedemand would be $15 today, adjusted for inflationHistorical and projected federal minimum wages under the Raise the Wage Actof 2021, and the 1963 March on Washington demand indexed to inflation
Sources: EPI analysis of the Fair Labor Standards Act and amendments, the Raise the Wage Act of 2021,and the 1963 March on Washington for Jobs and Freedom minimum wage demand.
2021:$15.00
2025:$16.28
$2.00
$15.00
$1.25
1963 March on Washington nominal min. wage projectionNominal federal minimum wage
1960 1980 2000 20200
5
10
15
$20
on Washington’s demand would be equivalent to about $15.00 today after adjusting forinflation (see Figure D).
The 1963 March on Washington demanded a $2.00 minimum wage that would “include allareas of employment which are presently excluded” and would “give all Americans adecent standard of living” (Derenoncourt 2020).
Several years later, Congress expanded the coverage of the minimum wage andeventually raised it to its historical high point of $1.60 in 1968, or $10.59 in 2021 dollars.Derenoncourt and Montialoux (2021) describe how the new standard raised wages overallbut had its largest effects on Black workers. Just before the increase, 28.8% of Blackworkers earned at or below the 1967 minimum, compared with 13.9% of white workers.The authors convincingly demonstrate that these increases were responsible for morethan 20% of the fall in the Black–white earnings gap during the Civil Rights Era. Since then,minimum wages have continued to play a substantial role in reducing racial earningsinequality. Wursten and Reich (2021) found that minimum wage increases between 1990and 2019 reduced Black–white wage gaps by 12% overall, and by 60% for workers withonly a high school diploma or less. The link between increases in the minimum wage anddecreases in racial earnings gaps also means that the erosion of the federal minimumwage over this period increased racial earnings gaps.
Essential and front-line workers constitute a
7
majority of those who would see pay raises byraising the minimum wage to $15During the COVID-19 pandemic, essential and front-line workers have kept the economyrunning at great risk to their health and their families. The U.S. labor market, however, hasnot fairly rewarded that vital work. Very few essential workers receive hazard pay tocompensate for their now-more dangerous work, and low pay among essential and front-line workers continues to be pervasive (Dorman and Mishel 2020; McNicholas andPoydock 2020, Table 3). Kinder and Stateler (2021) found that in 2018, essential workersmade up nearly half (22.3 million) of the 47.7 million U.S. workers in occupations in whichthe median wage was less than $15 per hour. In our analysis, we find that a majority ofworkers who would benefit from the Raise the Wage Act are essential or front-lineworkers.
Definitions of essential workers vary because the U.S. has no single uniform guidance andbecause it is difficult to map a given set of job characteristics to coarse data onoccupations. Nevertheless, using a variety of different occupation-based definitions weconsistently find that most of the workers who would see a pay increase due to the Raisethe Wage Act are essential or front-line workers.
Table 1 shows the projected total workforce in 2025 and affected workers under the Raisethe Wage Act. The first row summarizes findings already discussed in this report: 32.2million of 151.7 million workers would receive a direct or indirect pay increase in 2025 if theminimum wage were raised to $15 per hour. In the second row, we consider “criticalinfrastructure” occupations defined by the Labor Market Information Institute (LMI Institute2020), where “infrastructure” includes a broad set of workers covering a majority of theworkforce, including those in energy, health care, law enforcement, telecommunications,and other occupations. The institute’s count of essential workers includes StandardOccupation Classification (SOC) codes established by federal statistical agencies for theindustries and job descriptions that the Department of Homeland Security Cybersecurityand Infrastructure Agency considers “essential critical infrastructure workers.”
About 22.0 million critical infrastructure workers would receive pay increases due to theRaise the Wage Act, and they constitute about 68.3% of the total number of all affectedworkers. In other words, more than two-thirds of those who would benefit from a $15minimum wage in 2025 are critical infrastructure workers.
We also look at essential and front-line work from another angle, considering occupationsin which workers cannot do their jobs remotely by working from home. In the third andfourth rows of Table 1 we analyze workers who can’t telework using two differentdefinitions. The first definition comes from a classification by Dingel and Neiman (2020)based on pre-pandemic survey information. The second definition comes from ourclassification based on Current Population Survey data collected during the pandemic,specifically the employment share of occupations that were not teleworking during themonths of May through December 2021.
Under these definitions of essential and front-line work, the number of workers affected by
8
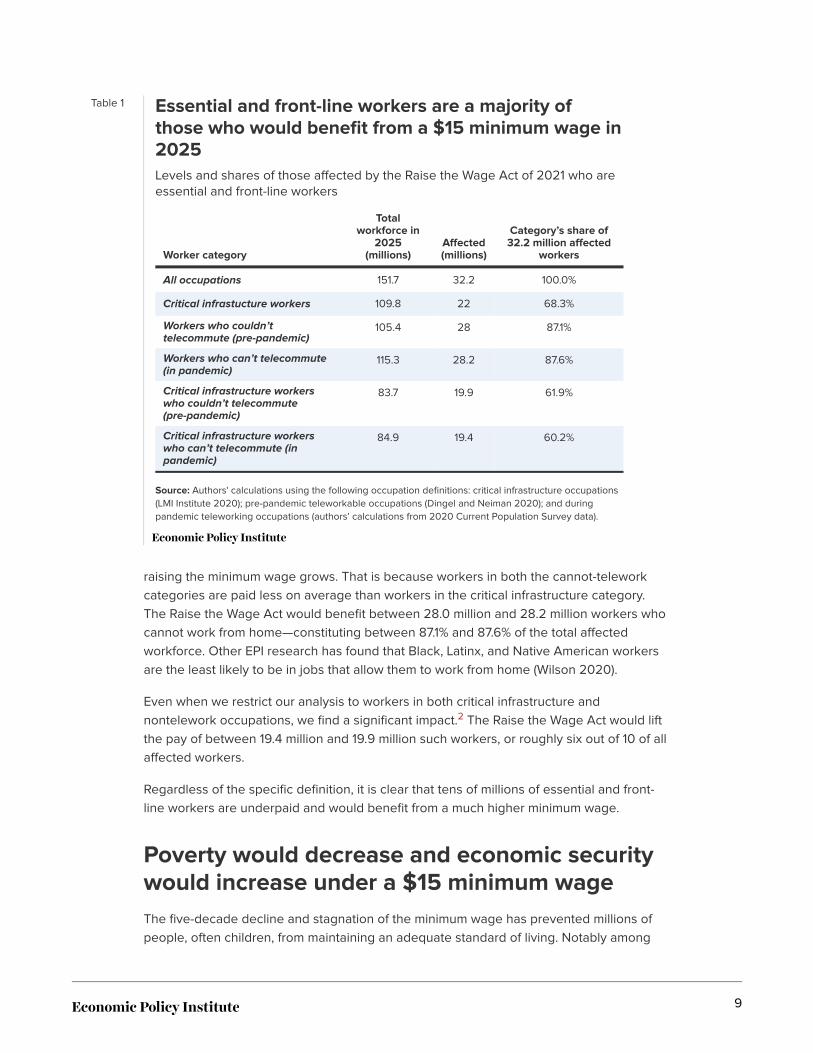
Table 1 Essential and front-line workers are a majority ofthose who would benefit from a $15 minimum wage in2025Levels and shares of those affected by the Raise the Wage Act of 2021 who areessential and front-line workers
Worker category
Totalworkforce in
2025(millions)
Affected(millions)
Category’s share of32.2 million affected
workers
All occupations 151.7 32.2 100.0%
Critical infrastucture workers 109.8 22 68.3%
Workers who couldn’ttelecommute (pre-pandemic)
105.4 28 87.1%
Workers who can’t telecommute(in pandemic)
115.3 28.2 87.6%
Critical infrastructure workerswho couldn’t telecommute(pre-pandemic)
83.7 19.9 61.9%
Critical infrastructure workerswho can’t telecommute (inpandemic)
84.9 19.4 60.2%
Source: Authors' calculations using the following occupation definitions: critical infrastructure occupations(LMI Institute 2020); pre-pandemic teleworkable occupations (Dingel and Neiman 2020); and duringpandemic teleworking occupations (authors’ calculations from 2020 Current Population Survey data).
raising the minimum wage grows. That is because workers in both the cannot-teleworkcategories are paid less on average than workers in the critical infrastructure category.The Raise the Wage Act would benefit between 28.0 million and 28.2 million workers whocannot work from home—constituting between 87.1% and 87.6% of the total affectedworkforce. Other EPI research has found that Black, Latinx, and Native American workersare the least likely to be in jobs that allow them to work from home (Wilson 2020).
Even when we restrict our analysis to workers in both critical infrastructure andnontelework occupations, we find a significant impact.2 The Raise the Wage Act would liftthe pay of between 19.4 million and 19.9 million such workers, or roughly six out of 10 of allaffected workers.
Regardless of the specific definition, it is clear that tens of millions of essential and front-line workers are underpaid and would benefit from a much higher minimum wage.
Poverty would decrease and economic securitywould increase under a $15 minimum wageThe five-decade decline and stagnation of the minimum wage has prevented millions ofpeople, often children, from maintaining an adequate standard of living. Notably among
9
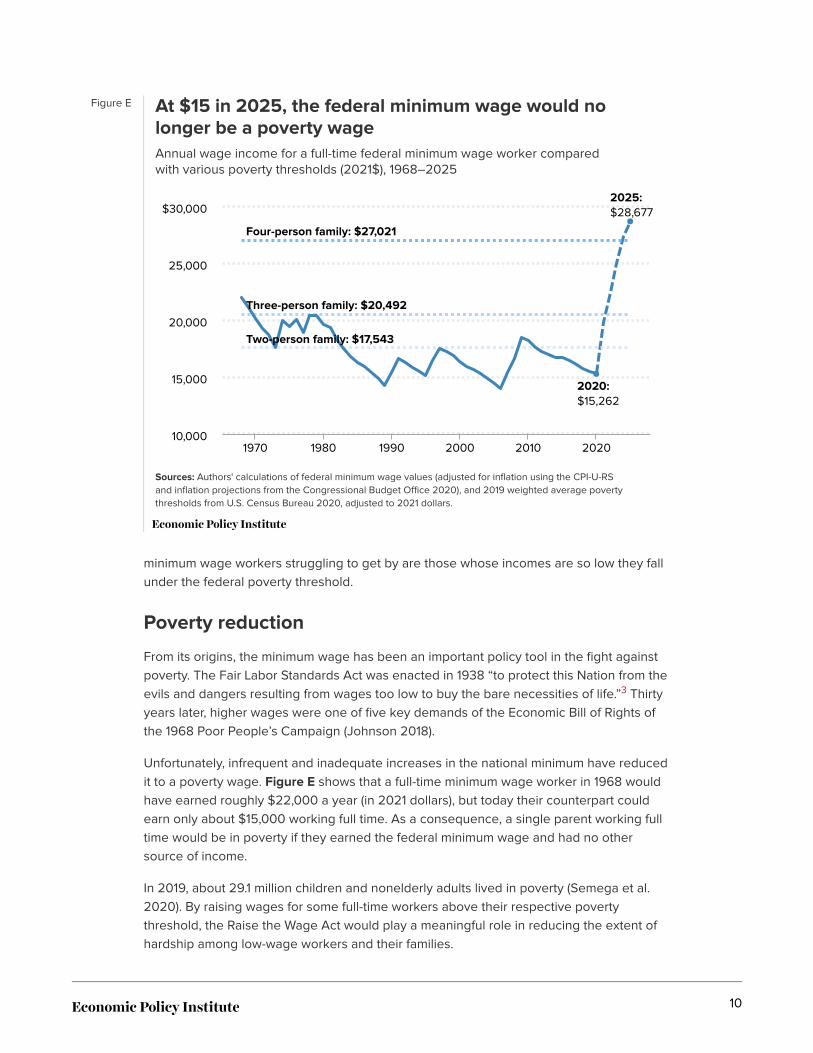
Figure E At $15 in 2025, the federal minimum wage would nolonger be a poverty wageAnnual wage income for a full-time federal minimum wage worker comparedwith various poverty thresholds (2021$), 1968–2025
Sources: Authors' calculations of federal minimum wage values (adjusted for inflation using the CPI-U-RSand inflation projections from the Congressional Budget Office 2020), and 2019 weighted average povertythresholds from U.S. Census Bureau 2020, adjusted to 2021 dollars.
2020:$15,262
2025:$28,677
Four-person family: $27,021
Three-person family: $20,492
Two-person family: $17,543
1970 1980 1990 2000 2010 202010,000
15,000
20,000
25,000
$30,000
minimum wage workers struggling to get by are those whose incomes are so low they fallunder the federal poverty threshold.
Poverty reduction
From its origins, the minimum wage has been an important policy tool in the fight againstpoverty. The Fair Labor Standards Act was enacted in 1938 “to protect this Nation from theevils and dangers resulting from wages too low to buy the bare necessities of life.”3 Thirtyyears later, higher wages were one of five key demands of the Economic Bill of Rights ofthe 1968 Poor People’s Campaign (Johnson 2018).
Unfortunately, infrequent and inadequate increases in the national minimum have reducedit to a poverty wage. Figure E shows that a full-time minimum wage worker in 1968 wouldhave earned roughly $22,000 a year (in 2021 dollars), but today their counterpart couldearn only about $15,000 working full time. As a consequence, a single parent working fulltime would be in poverty if they earned the federal minimum wage and had no othersource of income.
In 2019, about 29.1 million children and nonelderly adults lived in poverty (Semega et al.2020). By raising wages for some full-time workers above their respective povertythreshold, the Raise the Wage Act would play a meaningful role in reducing the extent ofhardship among low-wage workers and their families.
10
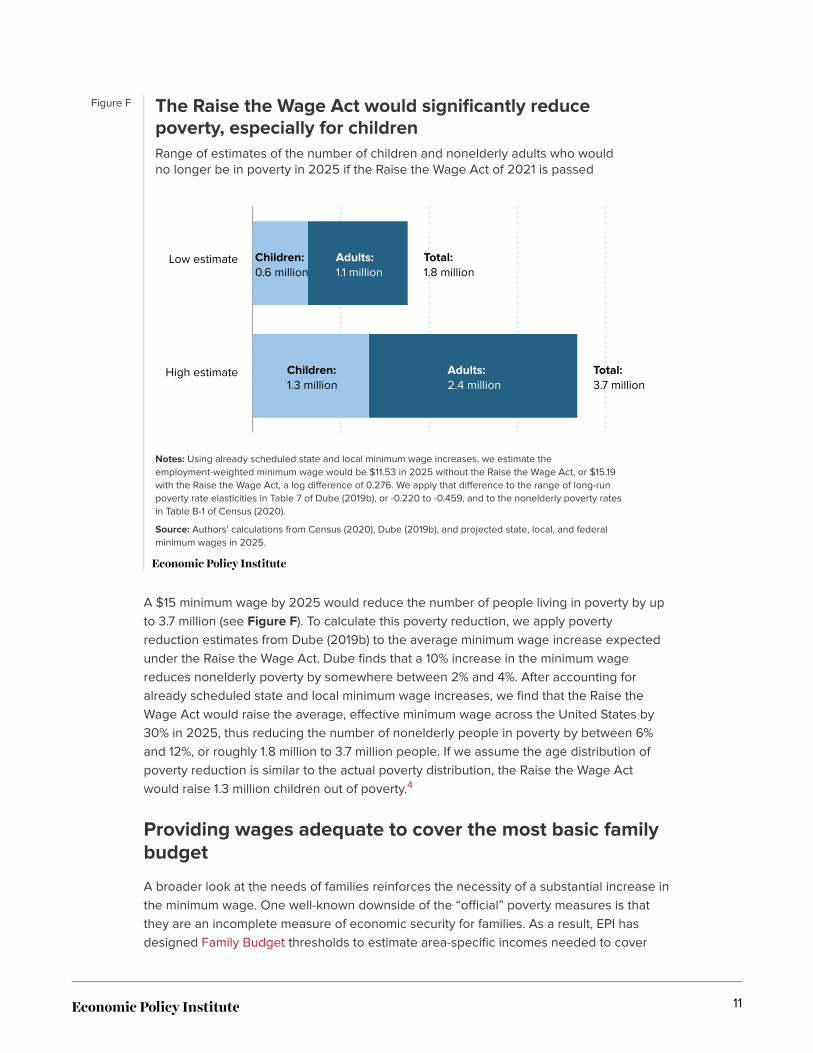
Figure F The Raise the Wage Act would significantly reducepoverty, especially for childrenRange of estimates of the number of children and nonelderly adults who wouldno longer be in poverty in 2025 if the Raise the Wage Act of 2021 is passed
Notes: Using already scheduled state and local minimum wage increases, we estimate theemployment-weighted minimum wage would be $11.53 in 2025 without the Raise the Wage Act, or $15.19with the Raise the Wage Act, a log difference of 0.276. We apply that difference to the range of long-runpoverty rate elasticities in Table 7 of Dube (2019b), or -0.220 to -0.459, and to the nonelderly poverty ratesin Table B-1 of Census (2020).
Source: Authors’ calculations from Census (2020), Dube (2019b), and projected state, local, and federalminimum wages in 2025.
Total:1.8 million
Total:3.7 million
Adults:1.1 million
Adults:2.4 million
Children:0.6 million
Children:1.3 million
Low estimate
High estimate
A $15 minimum wage by 2025 would reduce the number of people living in poverty by upto 3.7 million (see Figure F). To calculate this poverty reduction, we apply povertyreduction estimates from Dube (2019b) to the average minimum wage increase expectedunder the Raise the Wage Act. Dube finds that a 10% increase in the minimum wagereduces nonelderly poverty by somewhere between 2% and 4%. After accounting foralready scheduled state and local minimum wage increases, we find that the Raise theWage Act would raise the average, effective minimum wage across the United States by30% in 2025, thus reducing the number of nonelderly people in poverty by between 6%and 12%, or roughly 1.8 million to 3.7 million people. If we assume the age distribution ofpoverty reduction is similar to the actual poverty distribution, the Raise the Wage Actwould raise 1.3 million children out of poverty.4
Providing wages adequate to cover the most basic familybudget
A broader look at the needs of families reinforces the necessity of a substantial increase inthe minimum wage. One well-known downside of the “official” poverty measures is thatthey are an incomplete measure of economic security for families. As a result, EPI hasdesigned Family Budget thresholds to estimate area-specific incomes needed to cover
11
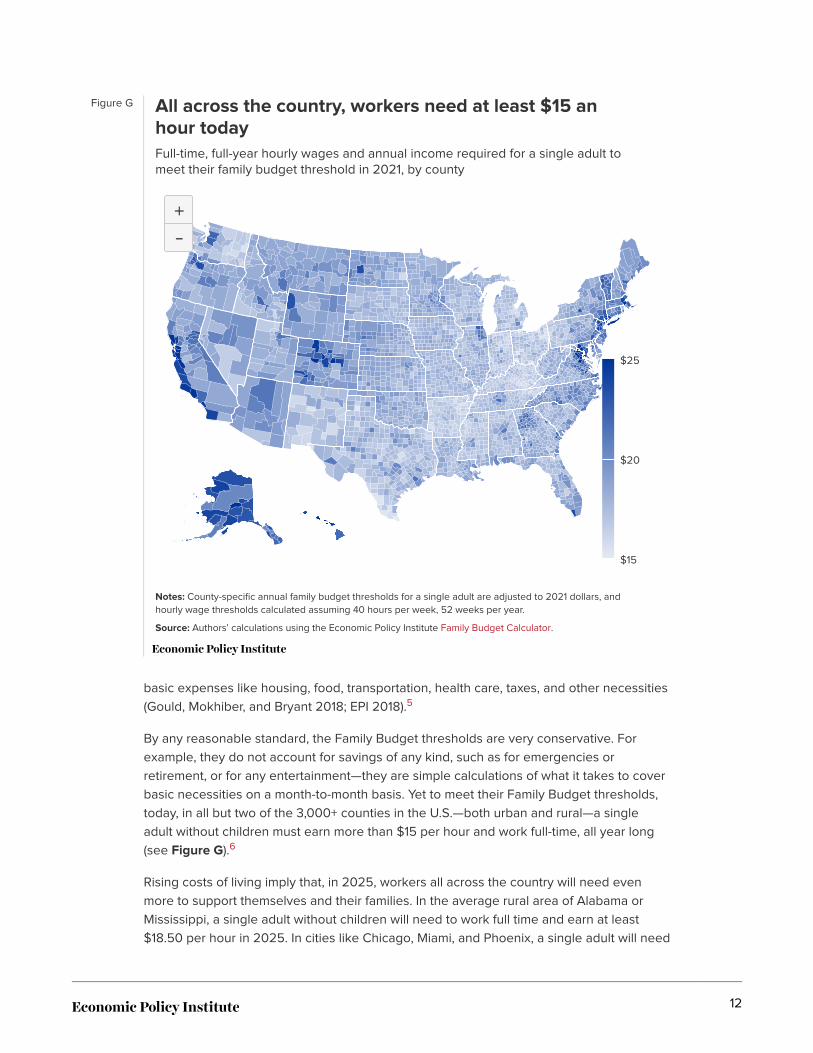
Figure G All across the country, workers need at least $15 anhour todayFull-time, full-year hourly wages and annual income required for a single adult tomeet their family budget threshold in 2021, by county
Notes: County-specific annual family budget thresholds for a single adult are adjusted to 2021 dollars, andhourly wage thresholds calculated assuming 40 hours per week, 52 weeks per year.
Source: Authors’ calculations using the Economic Policy Institute Family Budget Calculator.
++--
$15
$20
$25
basic expenses like housing, food, transportation, health care, taxes, and other necessities(Gould, Mokhiber, and Bryant 2018; EPI 2018).5
By any reasonable standard, the Family Budget thresholds are very conservative. Forexample, they do not account for savings of any kind, such as for emergencies orretirement, or for any entertainment—they are simple calculations of what it takes to coverbasic necessities on a month-to-month basis. Yet to meet their Family Budget thresholds,today, in all but two of the 3,000+ counties in the U.S.—both urban and rural—a singleadult without children must earn more than $15 per hour and work full-time, all year long(see Figure G).6
Rising costs of living imply that, in 2025, workers all across the country will need evenmore to support themselves and their families. In the average rural area of Alabama orMississippi, a single adult without children will need to work full time and earn at least$18.50 per hour in 2025. In cities like Chicago, Miami, and Phoenix, a single adult will need
12
even more—at least $20 per hour in 2025.7 In some cities, like New York and SanFrancisco, that number will approach—or exceed—$30 per hour. And of course when afamily includes children, the wage needed to just afford the basics increases dramatically.
A $15 minimum wage would advance genderjusticeIn addition to the disproportionate impact that it would have for workers of color and thosein essential and front-line jobs, raising the federal minimum wage would broadly benefitwomen workers. As shown in Table 2, a $15 minimum wage in 2025 would provide a payraise to nearly 19 million women—roughly one in four women workers in the United States.Women make up nearly 60% of all those who would benefit from the policy.
A $15 minimum wage would benefit adults intheir career-building years who help supporttheir familiesThere is sometimes a perception that the workers who would benefit from a higherminimum wage are mostly teenagers in their first jobs. In fact, the data show that most ofthe workers who would benefit from a federal increase to $15 are older and full-timeworkers. Past research shows that many of these workers are likely supporting families(Cooper 2019). Table 2 shows that only 10% of affected workers are teenagers while 65.8%are 25 years old or older. The average age of affected workers is 35 years old. Fifty-ninepercent of affected workers work 35 hours per week or more, and more than a quarterhave children. In fact, raising the federal minimum wage to $15 would provide a raise tonearly one in three working single parents.
Table 2 also shows that the majority of workers who would receive a raise come fromfamilies with limited means. Nearly 57% of affected workers are in families with totalannual incomes less than $50,000. For these families, every additional dollar they receivehas a meaningful impact on their ability to make ends meet. (More detailed demographicstatistics are available in Appendix Table 3.)
A $15 minimum wage in 2025 would benefit theeconomyThe immediate benefits of a minimum wage increase are in the earnings boost for thelowest-paid workers, but increasing the minimum wage to $9.50 this year and theincreases thereafter would deliver broader benefits to the economy, particularly now. Theeconomy is still reeling from the stunning collapse of economic activity during theCOVID-19 pandemic. Extra dollars in the pockets of millions of working families would helpby boosting aggregate demand. Economists generally recognize that low-wage workersare more likely than any other income group to spend any extra earnings immediately on
13
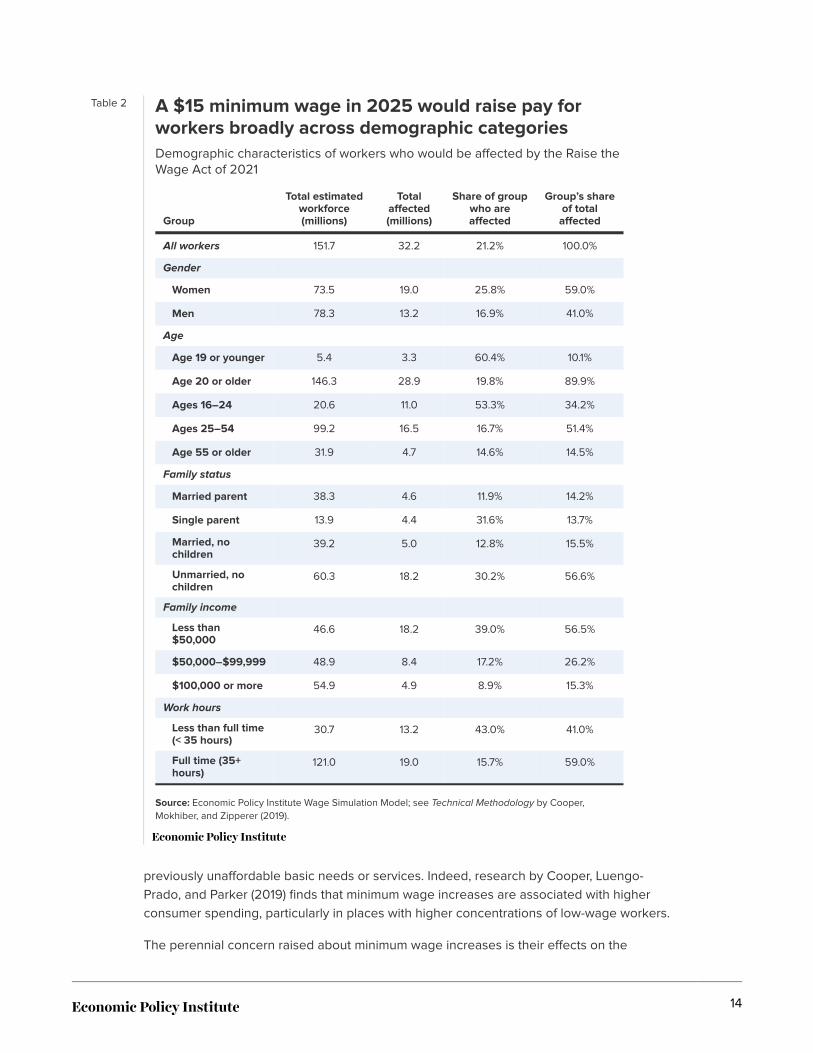
Table 2 A $15 minimum wage in 2025 would raise pay forworkers broadly across demographic categoriesDemographic characteristics of workers who would be affected by the Raise theWage Act of 2021
Group
Total estimatedworkforce(millions)
Totalaffected(millions)
Share of groupwho areaffected
Group’s shareof total
affected
All workers 151.7 32.2 21.2% 100.0%
Gender
Women 73.5 19.0 25.8% 59.0%
Men 78.3 13.2 16.9% 41.0%
Age
Age 19 or younger 5.4 3.3 60.4% 10.1%
Age 20 or older 146.3 28.9 19.8% 89.9%
Ages 16–24 20.6 11.0 53.3% 34.2%
Ages 25–54 99.2 16.5 16.7% 51.4%
Age 55 or older 31.9 4.7 14.6% 14.5%
Family status
Married parent 38.3 4.6 11.9% 14.2%
Single parent 13.9 4.4 31.6% 13.7%
Married, nochildren
39.2 5.0 12.8% 15.5%
Unmarried, nochildren
60.3 18.2 30.2% 56.6%
Family income
Less than$50,000
46.6 18.2 39.0% 56.5%
$50,000–$99,999 48.9 8.4 17.2% 26.2%
$100,000 or more 54.9 4.9 8.9% 15.3%
Work hours
Less than full time(< 35 hours)
30.7 13.2 43.0% 41.0%
Full time (35+hours)
121.0 19.0 15.7% 59.0%
Source: Economic Policy Institute Wage Simulation Model; see Technical Methodology by Cooper,Mokhiber, and Zipperer (2019).
previously unaffordable basic needs or services. Indeed, research by Cooper, Luengo-Prado, and Parker (2019) finds that minimum wage increases are associated with higherconsumer spending, particularly in places with higher concentrations of low-wage workers.
The perennial concern raised about minimum wage increases is their effects on the
14
employment of low-wage workers. By raising the cost of labor, do minimum wageincreases cause businesses to employ significantly fewer workers, threatening theincomes of the low-wage workforce overall? The answer from empirical research onprevious minimum wage increases is a clear “no.” In his comprehensive review ofminimum wage research, Dube (2019a) concludes that “the overall body of evidencesuggests a rather muted effect of minimum wages to date on employment” and “theweight of the evidence suggests any job losses are quite small.” For every 10% change inthe average wage of low-wage workers, the median employment effect across studieswas essentially zero.
Some of these studies and more recent research show that there have been little to noemployment losses for even the highest minimum wages enacted at state or local levels.Cengiz et al. (2019) found that both the typical minimum wage increases and also thehighest state-level minimum wage increase significantly raised wages without reducingthe employment of low-wage workers. Derenoncourt and Montialoux (2021) demonstratedthat highest national minimum wage we’ve had—in 1968, the equivalent of $10.59 per hourin 2021 dollars—also raised wages and significantly reduced Black–white earningsinequality without employment losses. Using data from low-wage counties, whereminimum wage increases have raised labor costs much more than in high-wage labormarkets, Godoey and Reich (2021) found that the policies significantly reduced povertyand had essentially no employment impact. Dube and Lindner (2021) found that 21 city-level minimum wage increases raised wages in those cities with little effect on the numberof low-wage jobs.
Economists typically measure how “high” a new minimum wage is by where it would cutinto the existing wage distribution. One such measure is the ratio of the minimum-to-median wage, with the median of course representing the worker at the very middle of thewage distribution. The $15 minimum wage in 2025 under the Raise the Wage Act wouldbe 66.8%, or approximately two-thirds, of the projected national median wage.8 Dube andLindner (2021) and Godoey and Reich (2021) found little employment impacts fromminimum wage increases, even though the counties and cities they studied had minimum-to-median wage ratios of up to roughly 80%.
Another measure of the “bite” of the minimum wage is the share of the workforce affectedby the policy. According to this statistic, the highwater 1968 national minimum wage isremarkably similar to the Raise the Wage Act. Estimates from Derenoncourt andMontialoux (2021) suggest that the 1968 policy directly affected an estimated 16.1% of theoverall workforce and 28.8% of Black workers.9 Above we estimate similar shares for a $15minimum wage in 2025: 14.5% of all workers and 23.2% of Black workers would be directlyaffected. Given that the 1968 policy raised the incomes of the low-wage workforce withoutsubstantial job loss, we should feel confident that a phased-in $15 minimum wage in 2025would do the same.
Despite such evidence, some still may maintain that concerns about job losses arewarranted. To put these concerns in perspective, consider the predictions of CBO (2021),which estimated that a $15 minimum wage by 2025 would reduce low-wage employmentby about 1.4 million. There are three reasons why this estimate is overstated. First, that
15
particular employment reduction estimate is not well supported by the best research oreven the typical minimum wage study; in Dube (2019a), the median estimate of the own-wage elasticity was –0.04, less than one-tenth the size of the employment response.Second, because CBO (2021) also estimated that a $15 minimum wage in 2025 wouldraise the earnings of 27 million workers, even accepting at face value the job loss estimateimplies that about 95% of the low-wage workforce would benefit from the policy. Third, thefocus on job loss gives the misleading impression that the policy would cause manyworkers to have no income over the course of a year; but because of the high degree ofchurn in the low-wage labor market, what is measured as job losses will actually be low-wage workers spending more time in between jobs, but earning more when they do work(Cooper, Mishel, and Zipperer 2018).
Minimum wage increases are extremely popular. Moreover, the highest approval ofminimum wage increases comes from those groups who critics say are most likely tosuffer job losses. An analysis of the 2016 American National Election Survey by AaronSojourner estimates that more than seven in 10 unemployed workers approved of raisingthe minimum wage (Sojourner 2021). Figure H also shows that the unemployed favorraising the minimum wage by an 11 percentage-point margin over those already employed.A stronger preference for minimum wage increases holds for other demographic groupswho face greater obstacles in the labor market. Black and Hispanic adults are significantlymore likely to approve of minimum wage increases than white adults. Women approve ofminimum wage increases significantly more than men, with similar approval marginsbetween those without and with a college degree.
Even with these margins, most demographic groups overwhelmingly approve of minimumwage increases. In fact, voters have approved every one of 22 state-level minimum wageincreases on the ballot over the last two decades.10
ConclusionCurrently, about four in 10 workers in the United States live in a state where minimumwages are eventually scheduled to rise to $15 per hour.11 Yet without a stronger federalstandard, most low-wage workers in this country will continue to experience the hardshipsand indignity of low pay.
The Raise the Wage Act charts the path forward to where we, as a society, should target aminimum wage in 2025. Raising the federal minimum wage to $15 by 2025 would securea long-overdue improvement in living standards for the lowest-wage workers and willfinally help ensure that full-time work is a means to escape poverty. The policy wouldsignificantly reduce long-standing race- and gender-based pay inequities and theinequities between how tipped and nontipped workers are treated. Finally, byautomatically linking future increases to median wage growth, it will prevent those with thelowest pay from slipping behind.
16
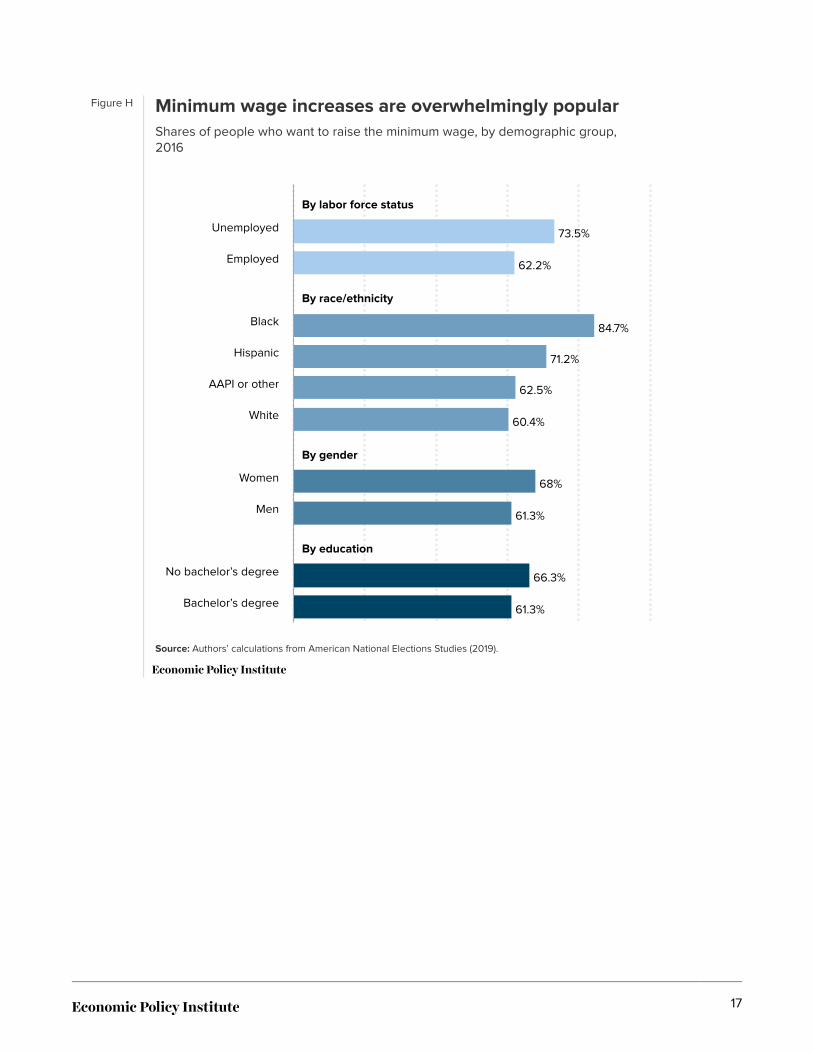
Figure H Minimum wage increases are overwhelmingly popularShares of people who want to raise the minimum wage, by demographic group,2016
Source: Authors’ calculations from American National Elections Studies (2019).
73.5%
62.2%
84.7%
71.2%
62.5%
60.4%
68%
61.3%
66.3%
61.3%
Unemployed
Employed
Black
Hispanic
AAPI or other
White
Women
Men
No bachelor’s degree
Bachelor’s degree
By labor force status
By race/ethnicity
By gender
By education
17
Endnotes1. Cooper and Kroeger (2017) explain how the tipped minimum wage is supposed to work and the
problems with it: “In most states and under federal law, employers of workers who customarilyreceive tips—such as restaurant servers and nail salon attendants—may credit workers’ tipsagainst their required minimum wage. For example, federal law allows employers to pay tippedworkers as little as $2.13 per hour, provided that the employees’ tips over the course of a weekraise their effective hourly pay to at least the minimum wage. If the tips are inadequate, employersare required to make up the difference. Unfortunately, policing this requirement is largely left tothe tipped workers themselves, who would need to carefully track their weekly hours and tips toknow if employers were paying an adequate base wage. Moreover, the FLSA and most statetipped wage laws do not specify the period over which weekly tips are supposed to be calculated,nor do they specify how employers are to treat secondary tipping—when tipped workers share aportion of their tips with support staff….The opaqueness of tipped wage laws leaves most tippedworkers with little knowledge of their rights and particularly open to abuse.”
2. The combination of critical infrastructure jobs and nontelework jobs is similar to approaches usedby Blau, Koebe, and Meyerhofer (2020) and Goodnough and Hoffman (2020).
3. S. Rep. No. 75-884, at 4 (1937).
4. Using already scheduled state and local minimum wage increases, we estimate the employment-weighted minimum wage (with no change in the federal minimum) will be $11.53 in 2025. We applythe 0.263 log point increase to $15 to the range of long-run poverty rate elasticities in Table 7 ofDube (2019b), or -0.220 to -0.459, and to the nonelderly poverty rates in Table B-1 of U.S. CensusBureau 2020, which estimated that of 270.1 million children and nonelderly adults, 29.1 millionlived in poverty, of which 35.9% were under the age of 18.
5. Gould, Cooke, and Kimball (2015) observe that “official” poverty rate methodology was designedin 1963 and has only been adjusted to account for overall inflation, and they contrast povertythresholds and Family Budget thresholds.
6. After adjusting the 2017$ values in the Family Budget Calculator to 2021$, only Lucas County,Ohio ($14.80), .and Cameron County, Texas ($14.96), have family budget thresholds below $15 anhour for a single adult without children. We can expect that the Family Budget thresholds for bothcounties will exceed a $15 hourly equivalent by 2022.
7. Chicago (Cook County, $20.42), Miami (Miami-Dade County, $20.63), Phoenix (Maricopa County,$20.80).
8. The median hourly wage in 2019 was $19.33, and it would be $22.46 in 2025 assuming 0.5% realwage growth on top of CBO’s (2021) CPI-U inflation projections.
9. Specifically, Derenoncourt and Montialoux (2021) estimated that, in the year prior to the 1968increase, 16.1% of the overall workforce and 28.8% of Black workers would be directly affected bythe new policy.
10. There have been 27 state-level ballot initiatives since 1996, and only two failed in that year. SeeBallotpedia (2021).
11. Economic Policy Institute calculation using Current Employment Statistics data from the Bureau ofLabor statistics. Values calculated using the listed states’ share of total U.S. nonfarm employment
18
in calendar year 2019 (prior to the COVID-19 pandemic). For recent minimum wage changes, seethe Economic Policy Institute Minimum Wage Tracker, https://www.epi.org/minimum-wage-tracker/.
ReferencesAmerican National Elections Studies. 2019. “2016 Times Series Study.” September 4, 2019 version.Accessed at https://electionstudies.org/data-center/2016-time-series-study/.
Ballotpedia. 2021. “Minimum Wage on the Ballot” (web page). Accessed February 15, 2021.
Blau, Francine D., Josefine Koebe, and Pamela A. Meyerhofer. 2020. “Who are the Essential andFrontline Workers?” NBER Working Paper 27791, September 2020.
Cengiz, Doruk, Arindrajit Dube, Attila Lindner, and Ben Zipperer. 2019. “The Effect of MinimumWages on Low-Wage Jobs.” The Quarterly Journal of Economics 134, no. 3, August 2019.
Congressional Budget Office (CBO). 2020. Budget and Economic Data: 10-Year EconomicProjections. July 2020.
Congressional Budget Office (CBO). 2021. The Budgetary Effects of the Raise the Wage Act of 2021.February 2021.
Cooper, Daniel, María José Luengo-Prado, and Jonathan A. Parker. 2019. “The Local AggregateEffects of Minimum Wage Increases.” Journal of Money, Credit, and Banking 52 (December 2019),5-35.
Cooper, David. 2019. Raising the Federal Minimum Wage to $15 by 2024 Would Lift Pay for Nearly40 Million Workers. Economic Policy Institute, February 2019.
Cooper, David, and Teresa Kroeger. 2017. Employers Steal Billions from Workers’ Paychecks EachYear. Economic Policy Institute, May 2017.
Cooper, David, Lawrence Mishel, and Ben Zipperer. 2018. Bold Increases in the Minimum WageShould be Evaluated for the Benefits of Raising Low-Wage Workers’ Total Earnings. Economic PolicyInstitute, April 2018.
Cooper, David, Zane Mokhiber, and Ben Zipperer. 2019. Minimum Wage Simulation Model TechnicalMethodology. Economic Policy Institute, February 2019.
Derenoncourt, Ellora. 2020. “Just calculated the inflation-adjusted nat’l MW demanded by the Marchon Washington in August 1963 ($2/hr).” Twitter, @EDerenoncourt, July 23, 2020, 3:42 p.m.
Derenoncourt, Ellora, and Claire Montialoux. 2021. “Minimum Wages and Racial Inequality.” QuarterlyJournal of Economics 136, no. 1, February.
Dingel, Jonathan I., and Brent Neiman. 2020. “How Many Jobs Can Be Done at Home?” Journal ofPublic Economics 189, September 2020.
Dorman, Peter, and Lawrence Mishel. 2020. A Majority of Workers are Fearful of CoronavirusInfections at Work, Especially Black, Hispanic, and Low- and Middle-Income Workers. EconomicPolicy Institute, June 16, 2020.
Dube, Arindrajit. 2019a. Impacts of Minimum Wages: Review of the International Evidence. Reportprepared for Her Majesty’s Treasury (UK). November 2019.
19
Dube, Arindrajit. 2019b. “Minimum Wages and the Distribution of Family Incomes.” AmericanEconomic Journal: Applied Economics 11, no. 4: 268–304.
Dube, Arindrajit, and Attila Lindner. 2021. “City Limits: What Do Local-Area Minimum Wages Do?”Journal of Economic Perspectives 35, no. 1, Winter 2021.
Economic Policy Institute (EPI). 2018. Family Budget Calculator (interactive tool). Last updated March2018.
Economic Policy Institute (EPI). 2021a. Current Population Survey Extracts, Version 1.0.13,https://microdata.epi.org.
Economic Policy Institute (EPI). 2021b. “The Impact of Raising the Minimum Wage to $15 by 2025, byCongressional District: Mapping the Impact of the Raise the Wage Act of 2021 on Workers”(interactive map). Accessed January 28, 2021.
Godoey, Anna, and Michael Reich. 2021. “Are Minimum Wage Effects Greater in Low-Wage Areas?”Industrial Relations, January 2021.
Goodnough, Abby, and Jan Hoffman. 2020. “The Elderly vs. Essential Workers: Who Should Get theCoronavirus Vaccine First?” New York Times, December 5, 2020.
Gould, Elise. 2020. State of Working America Wages 2019: A Story of Slow, Uneven, and UnequalWage Growth over the Last 40 Years, Economic Policy Institute, February 2020.
Gould, Elise, Tanyell Cooke, and Will Kimball. 2015. What Families Need to Get By: EPI’s 2015 FamilyBudget Calculator. Economic Policy Institute, August 2015.
Gould, Elise, Zane Mokhiber, and Kathleen Bryant. 2018. The Economic Policy Institute’s FamilyBudget Calculator: Technical Documentation. Economic Policy Institute, March 2018.
Johnson, Charles. 2018. “A Reflection: The Poor People’s Campaign and Dr. King’s Economic Vision.”Georgia Budget and Policy Institute, April 27, 2018.
Kinder, Molly, and Laura Stateler. 2021. “Essential Workers Comprise About Half of All Workers inLow-Paid Occupations. They Deserve a $15 Minimum Wage.” The Avenue, The Brookings Institution,February 5, 2021.
Labor Market Information Institute (LMI Institute). 2020. “Many U.S. Workers in Critical Occupations inthe Fight Against COVID-19.” Database, Version April 3, 2020. Accessed February 2021.
Lynn, M., M. Sturman, C. Ganley, E. Adams, M. Douglas, and J. McNeil. 2008. “Consumer RacialDiscrimination in Tipping: A Replication and Extension.” Journal of Applied Social Psychology 38,1045–1060. https://doi.org/10.1111/j.1559-1816.2008.00338.x.
McNicholas, Celine, and Margaret Poydock. 2020. “Who Are Essential Workers? A ComprehensiveLook at Their Wages, Demographics, and Unionization Rates.” Working Economics Blog (EconomicPolicy Institute), May 19, 2020.
National Women’s Law Center. 2021. One Fair Wage: Women Fare Better in States with EqualTreatment for Tipped Workers. National Women’s Law Center, February 2021.
Pitts, Steven C., and Sylvia Allegretto. 2013. To Work with Dignity: The Unfinished March Toward aDecent Minimum Wage. Economic Policy Institute, August 2013.
Raise the Wage Act of 2021, S. 53, 117th Cong. (2021).
20
Semega, Jessica, Melissa Kollar, Emily A. Shrider, and John F. Creamer. 2020. Income and Poverty inthe United States: 2019. U.S. Census Bureau, September.
Sojourner, Aaron. 2021. “Most-recent data I found is ANES after 2016 election. 78% of unemployedjobseekers in the U.S. favored raising the minimum wage.” Twitter, @aaronsojourner, February 6,2021, 12:08 p.m.
Wilson, Valerie. 2020. “Inequities Exposed: How COVID-19 Widened Racial Inequities in Education,Health, and the Workforce.” Testimony before the U.S. House of Representatives Committee onEducation and Labor, June 22, 2020.
Wilson, Valerie, and William M. Rodgers III. 2016. Black-White Wage Gaps Expand with Rising WageInequality. Economic Policy Institute, September 2016.
Wursten, Jesse, and Michael Reich. 2021. “Racial Inequality and Minimum Wages in Frictional LaborMarkets.” IRLE Working Paper 101-21, February.
21
AppendixFigure A
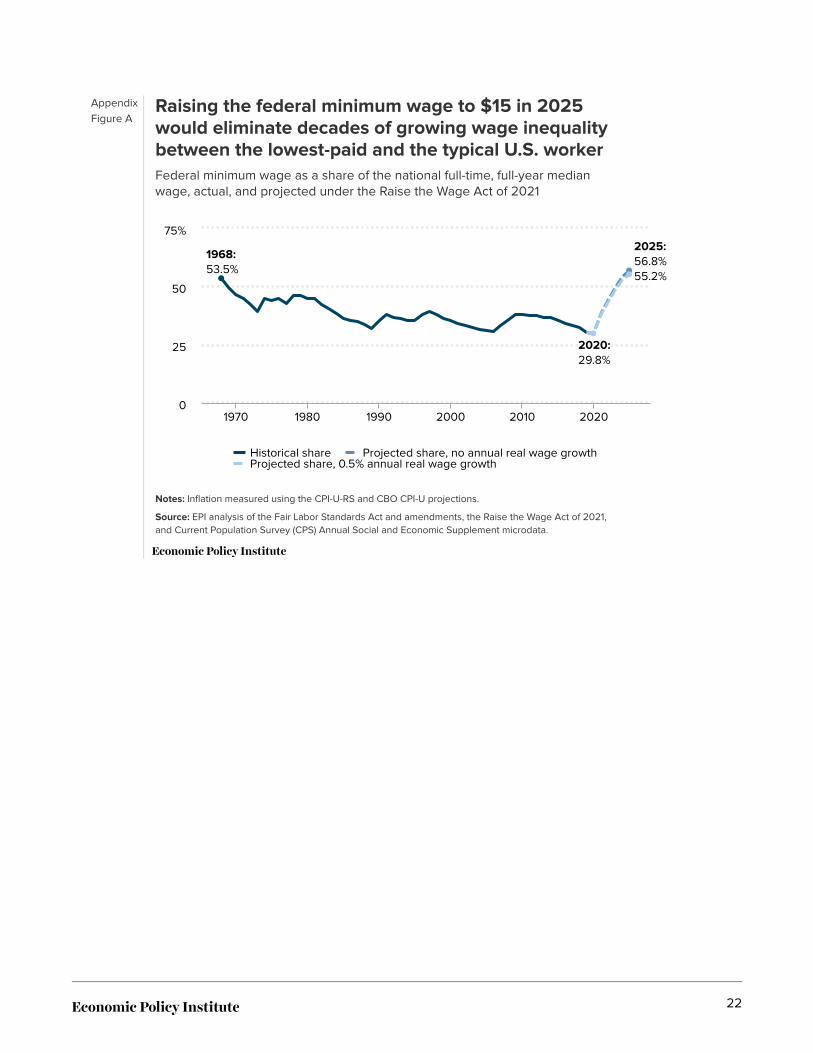
Raising the federal minimum wage to $15 in 2025would eliminate decades of growing wage inequalitybetween the lowest-paid and the typical U.S. workerFederal minimum wage as a share of the national full-time, full-year medianwage, actual, and projected under the Raise the Wage Act of 2021
Notes: Inflation measured using the CPI-U-RS and CBO CPI-U projections.
Source: EPI analysis of the Fair Labor Standards Act and amendments, the Raise the Wage Act of 2021,and Current Population Survey (CPS) Annual Social and Economic Supplement microdata.
1968:53.5%
2025:56.8%
2020:29.8%
55.2%
Historical share Projected share, no annual real wage growthProjected share, 0.5% annual real wage growth
1970 1980 1990 2000 2010 20200
25
50
75%
22
AppendixTable 1
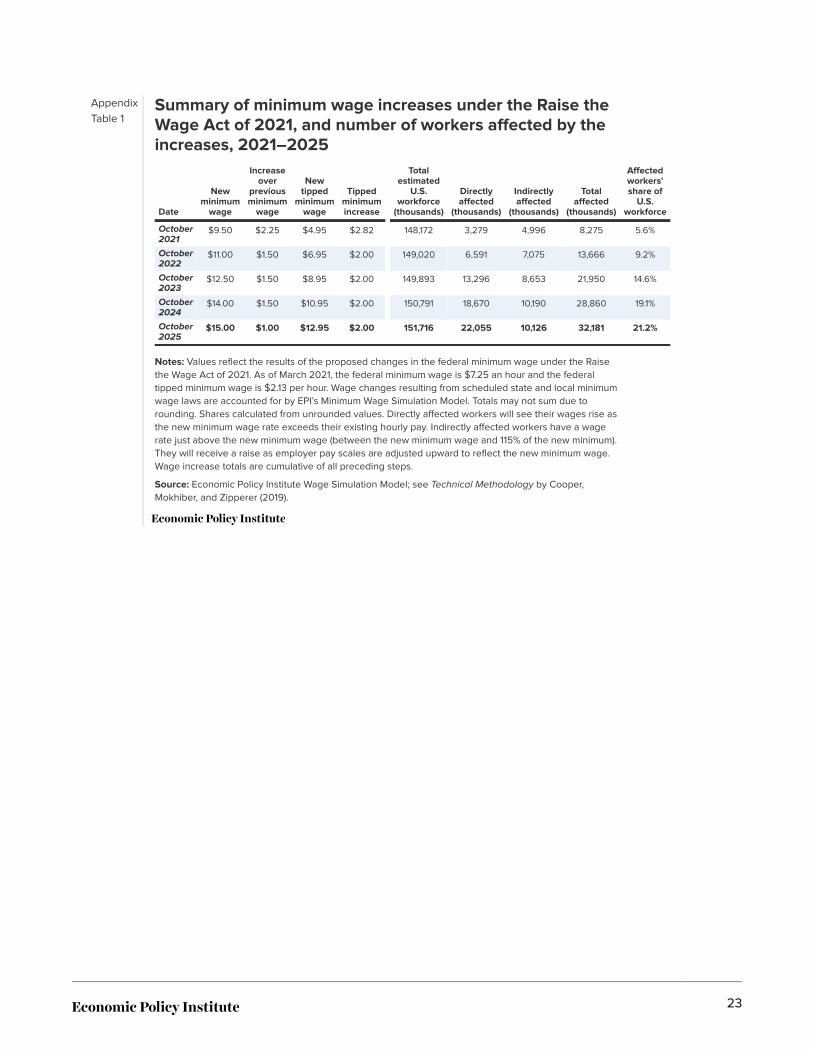
Summary of minimum wage increases under the Raise theWage Act of 2021, and number of workers affected by theincreases, 2021–2025
Date
Newminimum
wage
Increaseover
previousminimum
wage
Newtipped
minimumwage
Tippedminimumincrease
Totalestimated
U.S.workforce
(thousands)
Directlyaffected
(thousands)
Indirectlyaffected
(thousands)
Totalaffected
(thousands)
Affectedworkers’share of
U.S.workforce
October2021
$9.50 $2.25 $4.95 $2.82 148,172 3,279 4,996 8,275 5.6%
October2022
$11.00 $1.50 $6.95 $2.00 149,020 6,591 7,075 13,666 9.2%
October2023
$12.50 $1.50 $8.95 $2.00 149,893 13,296 8,653 21,950 14.6%
October2024
$14.00 $1.50 $10.95 $2.00 150,791 18,670 10,190 28,860 19.1%
October2025
$15.00 $1.00 $12.95 $2.00 151,716 22,055 10,126 32,181 21.2%
Notes: Values reflect the results of the proposed changes in the federal minimum wage under the Raisethe Wage Act of 2021. As of March 2021, the federal minimum wage is $7.25 an hour and the federaltipped minimum wage is $2.13 per hour. Wage changes resulting from scheduled state and local minimumwage laws are accounted for by EPI’s Minimum Wage Simulation Model. Totals may not sum due torounding. Shares calculated from unrounded values. Directly affected workers will see their wages rise asthe new minimum wage rate exceeds their existing hourly pay. Indirectly affected workers have a wagerate just above the new minimum wage (between the new minimum wage and 115% of the new minimum).They will receive a raise as employer pay scales are adjusted upward to reflect the new minimum wage.Wage increase totals are cumulative of all preceding steps.
Source: Economic Policy Institute Wage Simulation Model; see Technical Methodology by Cooper,Mokhiber, and Zipperer (2019).
23
AppendixTable 2
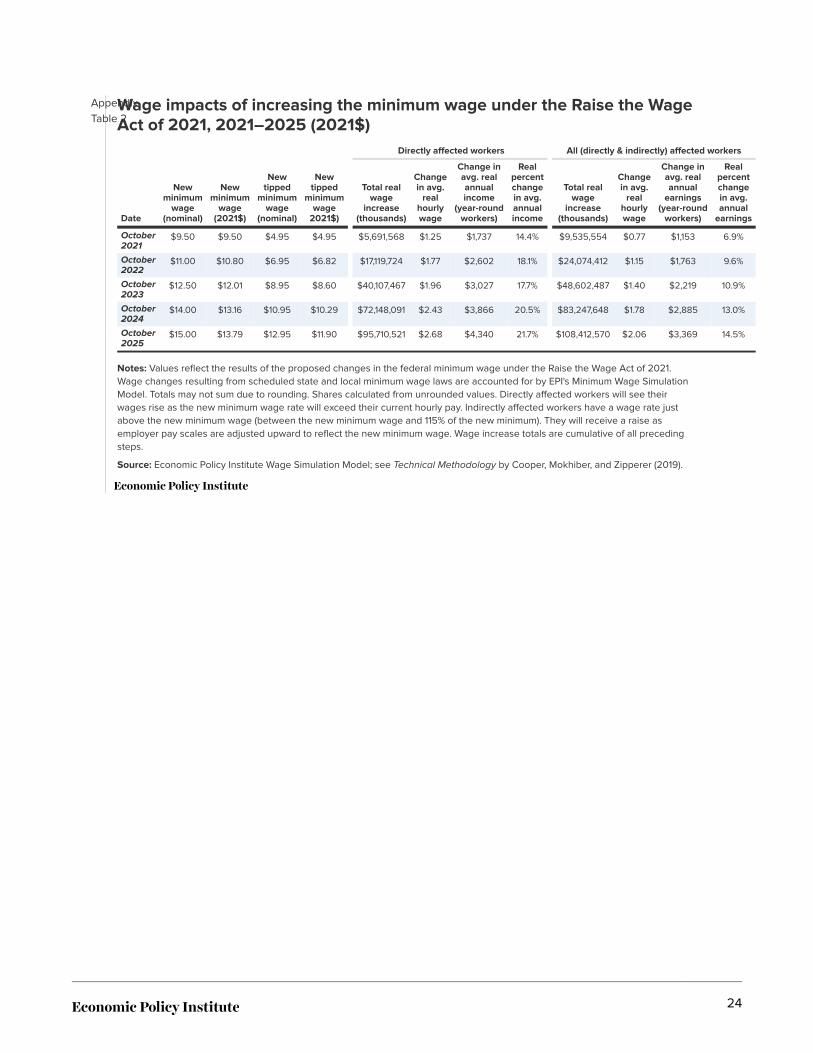
Wage impacts of increasing the minimum wage under the Raise the WageAct of 2021, 2021–2025 (2021$)
Directly affected workers All (directly & indirectly) affected workers
Date
Newminimum
wage(nominal)
Newminimum
wage(2021$)
Newtipped
minimumwage
(nominal)
Newtipped
minimumwage
2021$)
Total realwage
increase(thousands)
Changein avg.
realhourlywage
Change inavg. realannualincome
(year-roundworkers)
Realpercentchangein avg.annualincome
Total realwage
increase(thousands)
Changein avg.
realhourlywage
Change inavg. realannual
earnings(year-round
workers)
Realpercentchangein avg.annual
earnings
October2021
$9.50 $9.50 $4.95 $4.95 $5,691,568 $1.25 $1,737 14.4% $9,535,554 $0.77 $1,153 6.9%
October2022
$11.00 $10.80 $6.95 $6.82 $17,119,724 $1.77 $2,602 18.1% $24,074,412 $1.15 $1,763 9.6%
October2023
$12.50 $12.01 $8.95 $8.60 $40,107,467 $1.96 $3,027 17.7% $48,602,487 $1.40 $2,219 10.9%
October2024
$14.00 $13.16 $10.95 $10.29 $72,148,091 $2.43 $3,866 20.5% $83,247,648 $1.78 $2,885 13.0%
October2025
$15.00 $13.79 $12.95 $11.90 $95,710,521 $2.68 $4,340 21.7% $108,412,570 $2.06 $3,369 14.5%
Notes: Values reflect the results of the proposed changes in the federal minimum wage under the Raise the Wage Act of 2021.Wage changes resulting from scheduled state and local minimum wage laws are accounted for by EPI's Minimum Wage SimulationModel. Totals may not sum due to rounding. Shares calculated from unrounded values. Directly affected workers will see theirwages rise as the new minimum wage rate will exceed their current hourly pay. Indirectly affected workers have a wage rate justabove the new minimum wage (between the new minimum wage and 115% of the new minimum). They will receive a raise asemployer pay scales are adjusted upward to reflect the new minimum wage. Wage increase totals are cumulative of all precedingsteps.
Source: Economic Policy Institute Wage Simulation Model; see Technical Methodology by Cooper, Mokhiber, and Zipperer (2019).
24
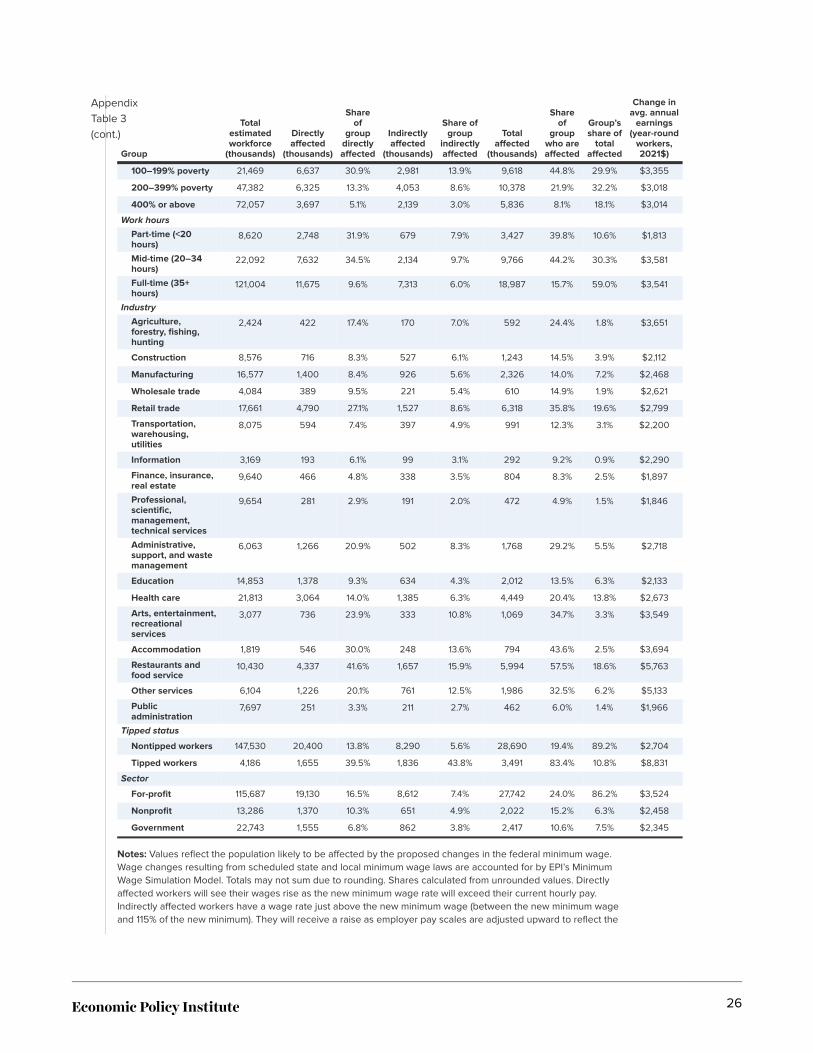
AppendixTable 3
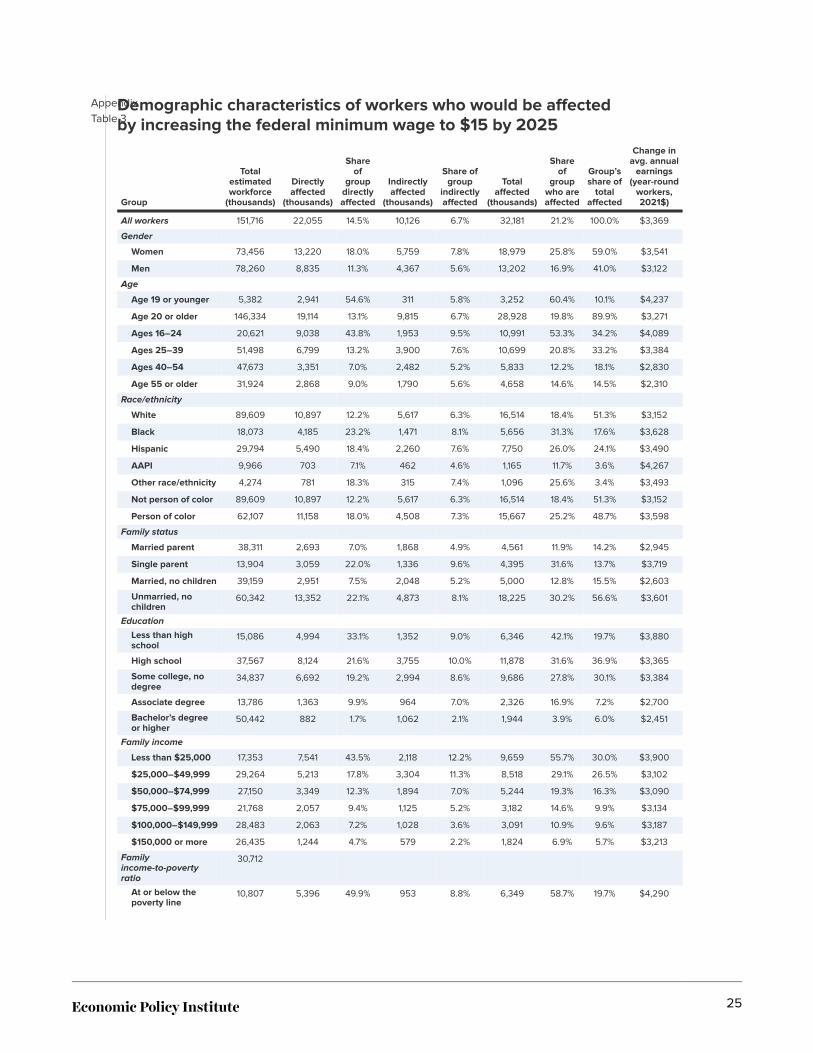
Demographic characteristics of workers who would be affectedby increasing the federal minimum wage to $15 by 2025
Group
Totalestimatedworkforce
(thousands)
Directlyaffected
(thousands)
Shareof
groupdirectlyaffected
Indirectlyaffected
(thousands)
Share ofgroup
indirectlyaffected
Totalaffected
(thousands)
Shareof
groupwho areaffected
Group’sshare of
totalaffected
Change inavg. annual
earnings(year-round
workers,2021$)
All workers 151,716 22,055 14.5% 10,126 6.7% 32,181 21.2% 100.0% $3,369
Gender
Women 73,456 13,220 18.0% 5,759 7.8% 18,979 25.8% 59.0% $3,541
Men 78,260 8,835 11.3% 4,367 5.6% 13,202 16.9% 41.0% $3,122
Age
Age 19 or younger 5,382 2,941 54.6% 311 5.8% 3,252 60.4% 10.1% $4,237
Age 20 or older 146,334 19,114 13.1% 9,815 6.7% 28,928 19.8% 89.9% $3,271
Ages 16–24 20,621 9,038 43.8% 1,953 9.5% 10,991 53.3% 34.2% $4,089
Ages 25–39 51,498 6,799 13.2% 3,900 7.6% 10,699 20.8% 33.2% $3,384
Ages 40–54 47,673 3,351 7.0% 2,482 5.2% 5,833 12.2% 18.1% $2,830
Age 55 or older 31,924 2,868 9.0% 1,790 5.6% 4,658 14.6% 14.5% $2,310
Race/ethnicity
White 89,609 10,897 12.2% 5,617 6.3% 16,514 18.4% 51.3% $3,152
Black 18,073 4,185 23.2% 1,471 8.1% 5,656 31.3% 17.6% $3,628
Hispanic 29,794 5,490 18.4% 2,260 7.6% 7,750 26.0% 24.1% $3,490
AAPI 9,966 703 7.1% 462 4.6% 1,165 11.7% 3.6% $4,267
Other race/ethnicity 4,274 781 18.3% 315 7.4% 1,096 25.6% 3.4% $3,493
Not person of color 89,609 10,897 12.2% 5,617 6.3% 16,514 18.4% 51.3% $3,152
Person of color 62,107 11,158 18.0% 4,508 7.3% 15,667 25.2% 48.7% $3,598
Family status
Married parent 38,311 2,693 7.0% 1,868 4.9% 4,561 11.9% 14.2% $2,945
Single parent 13,904 3,059 22.0% 1,336 9.6% 4,395 31.6% 13.7% $3,719
Married, no children 39,159 2,951 7.5% 2,048 5.2% 5,000 12.8% 15.5% $2,603
Unmarried, nochildren
60,342 13,352 22.1% 4,873 8.1% 18,225 30.2% 56.6% $3,601
Education
Less than highschool
15,086 4,994 33.1% 1,352 9.0% 6,346 42.1% 19.7% $3,880
High school 37,567 8,124 21.6% 3,755 10.0% 11,878 31.6% 36.9% $3,365
Some college, nodegree
34,837 6,692 19.2% 2,994 8.6% 9,686 27.8% 30.1% $3,384
Associate degree 13,786 1,363 9.9% 964 7.0% 2,326 16.9% 7.2% $2,700
Bachelor’s degreeor higher
50,442 882 1.7% 1,062 2.1% 1,944 3.9% 6.0% $2,451
Family income
Less than $25,000 17,353 7,541 43.5% 2,118 12.2% 9,659 55.7% 30.0% $3,900
$25,000–$49,999 29,264 5,213 17.8% 3,304 11.3% 8,518 29.1% 26.5% $3,102
$50,000–$74,999 27,150 3,349 12.3% 1,894 7.0% 5,244 19.3% 16.3% $3,090
$75,000–$99,999 21,768 2,057 9.4% 1,125 5.2% 3,182 14.6% 9.9% $3,134
$100,000–$149,999 28,483 2,063 7.2% 1,028 3.6% 3,091 10.9% 9.6% $3,187
$150,000 or more 26,435 1,244 4.7% 579 2.2% 1,824 6.9% 5.7% $3,213
Familyincome-to-povertyratio
30,712
At or below thepoverty line
10,807 5,396 49.9% 953 8.8% 6,349 58.7% 19.7% $4,290
25
AppendixTable 3(cont.)
Group
Totalestimatedworkforce
(thousands)
Directlyaffected
(thousands)
Shareof
groupdirectlyaffected
Indirectlyaffected
(thousands)
Share ofgroup
indirectlyaffected
Totalaffected
(thousands)
Shareof
groupwho areaffected
Group’sshare of
totalaffected
Change inavg. annual
earnings(year-round
workers,2021$)
100–199% poverty 21,469 6,637 30.9% 2,981 13.9% 9,618 44.8% 29.9% $3,355
200–399% poverty 47,382 6,325 13.3% 4,053 8.6% 10,378 21.9% 32.2% $3,018
400% or above 72,057 3,697 5.1% 2,139 3.0% 5,836 8.1% 18.1% $3,014
Work hours
Part-time (<20hours)
8,620 2,748 31.9% 679 7.9% 3,427 39.8% 10.6% $1,813
Mid-time (20–34hours)
22,092 7,632 34.5% 2,134 9.7% 9,766 44.2% 30.3% $3,581
Full-time (35+hours)
121,004 11,675 9.6% 7,313 6.0% 18,987 15.7% 59.0% $3,541
Industry
Agriculture,forestry, fishing,hunting
2,424 422 17.4% 170 7.0% 592 24.4% 1.8% $3,651
Construction 8,576 716 8.3% 527 6.1% 1,243 14.5% 3.9% $2,112
Manufacturing 16,577 1,400 8.4% 926 5.6% 2,326 14.0% 7.2% $2,468
Wholesale trade 4,084 389 9.5% 221 5.4% 610 14.9% 1.9% $2,621
Retail trade 17,661 4,790 27.1% 1,527 8.6% 6,318 35.8% 19.6% $2,799
Transportation,warehousing,utilities
8,075 594 7.4% 397 4.9% 991 12.3% 3.1% $2,200
Information 3,169 193 6.1% 99 3.1% 292 9.2% 0.9% $2,290
Finance, insurance,real estate
9,640 466 4.8% 338 3.5% 804 8.3% 2.5% $1,897
Professional,scientific,management,technical services
9,654 281 2.9% 191 2.0% 472 4.9% 1.5% $1,846
Administrative,support, and wastemanagement
6,063 1,266 20.9% 502 8.3% 1,768 29.2% 5.5% $2,718
Education 14,853 1,378 9.3% 634 4.3% 2,012 13.5% 6.3% $2,133
Health care 21,813 3,064 14.0% 1,385 6.3% 4,449 20.4% 13.8% $2,673
Arts, entertainment,recreationalservices
3,077 736 23.9% 333 10.8% 1,069 34.7% 3.3% $3,549
Accommodation 1,819 546 30.0% 248 13.6% 794 43.6% 2.5% $3,694
Restaurants andfood service
10,430 4,337 41.6% 1,657 15.9% 5,994 57.5% 18.6% $5,763
Other services 6,104 1,226 20.1% 761 12.5% 1,986 32.5% 6.2% $5,133
Publicadministration
7,697 251 3.3% 211 2.7% 462 6.0% 1.4% $1,966
Tipped status
Nontipped workers 147,530 20,400 13.8% 8,290 5.6% 28,690 19.4% 89.2% $2,704
Tipped workers 4,186 1,655 39.5% 1,836 43.8% 3,491 83.4% 10.8% $8,831
Sector
For-profit 115,687 19,130 16.5% 8,612 7.4% 27,742 24.0% 86.2% $3,524
Nonprofit 13,286 1,370 10.3% 651 4.9% 2,022 15.2% 6.3% $2,458
Government 22,743 1,555 6.8% 862 3.8% 2,417 10.6% 7.5% $2,345
Notes: Values reflect the population likely to be affected by the proposed changes in the federal minimum wage.Wage changes resulting from scheduled state and local minimum wage laws are accounted for by EPI’s MinimumWage Simulation Model. Totals may not sum due to rounding. Shares calculated from unrounded values. Directlyaffected workers will see their wages rise as the new minimum wage rate will exceed their current hourly pay.Indirectly affected workers have a wage rate just above the new minimum wage (between the new minimum wageand 115% of the new minimum). They will receive a raise as employer pay scales are adjusted upward to reflect the
26
AppendixTable 3(cont.)
new minimum wage. AAPI refers to Asian American/Pacific Islander.
Source: Economic Policy Institute Wage Simulation Model; see Technical Methodology by Cooper, Mokhiber, andZipperer (2019).
27
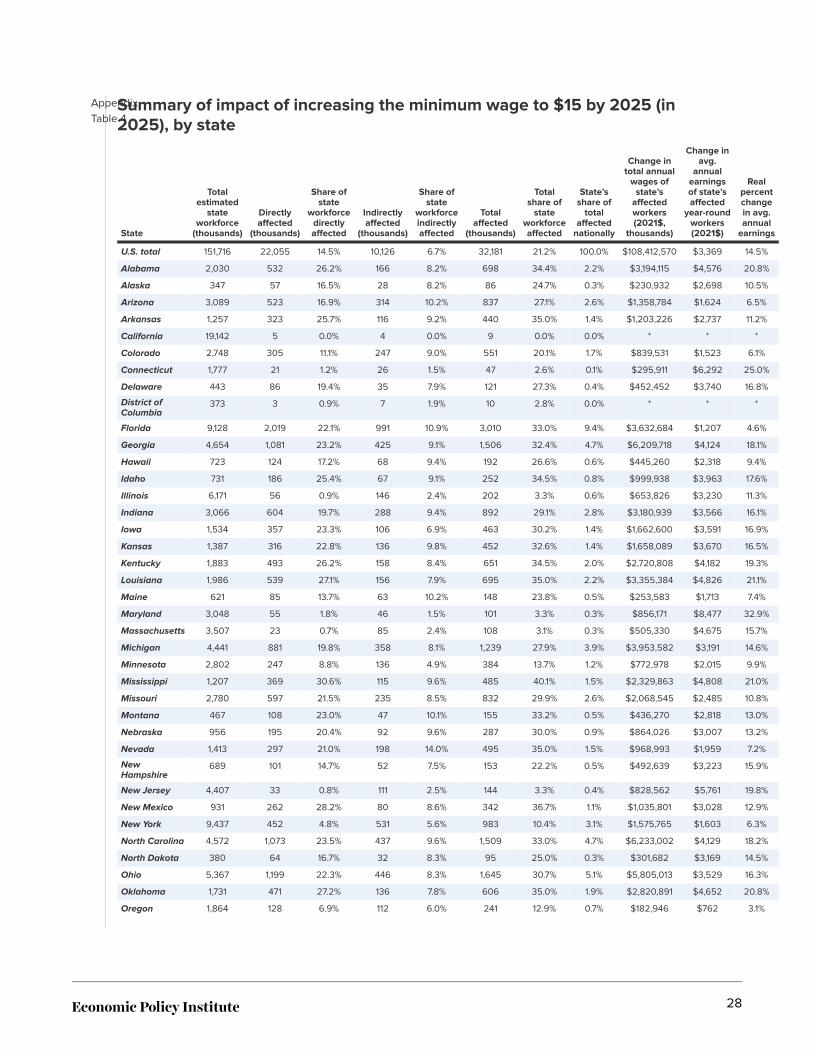
AppendixTable 4
Summary of impact of increasing the minimum wage to $15 by 2025 (in2025), by state
State
Totalestimated
stateworkforce
(thousands)
Directlyaffected
(thousands)
Share ofstate
workforcedirectlyaffected
Indirectlyaffected
(thousands)
Share ofstate
workforceindirectlyaffected
Totalaffected
(thousands)
Totalshare of
stateworkforceaffected
State’sshare of
totalaffected
nationally
Change intotal annual
wages ofstate’s
affectedworkers(2021$,
thousands)
Change inavg.
annualearningsof state’saffected
year-roundworkers(2021$)
Realpercentchangein avg.annual
earnings
U.S. total 151,716 22,055 14.5% 10,126 6.7% 32,181 21.2% 100.0% $108,412,570 $3,369 14.5%
Alabama 2,030 532 26.2% 166 8.2% 698 34.4% 2.2% $3,194,115 $4,576 20.8%
Alaska 347 57 16.5% 28 8.2% 86 24.7% 0.3% $230,932 $2,698 10.5%
Arizona 3,089 523 16.9% 314 10.2% 837 27.1% 2.6% $1,358,784 $1,624 6.5%
Arkansas 1,257 323 25.7% 116 9.2% 440 35.0% 1.4% $1,203,226 $2,737 11.2%
California 19,142 5 0.0% 4 0.0% 9 0.0% 0.0% * * *
Colorado 2,748 305 11.1% 247 9.0% 551 20.1% 1.7% $839,531 $1,523 6.1%
Connecticut 1,777 21 1.2% 26 1.5% 47 2.6% 0.1% $295,911 $6,292 25.0%
Delaware 443 86 19.4% 35 7.9% 121 27.3% 0.4% $452,452 $3,740 16.8%
District ofColumbia
373 3 0.9% 7 1.9% 10 2.8% 0.0% * * *
Florida 9,128 2,019 22.1% 991 10.9% 3,010 33.0% 9.4% $3,632,684 $1,207 4.6%
Georgia 4,654 1,081 23.2% 425 9.1% 1,506 32.4% 4.7% $6,209,718 $4,124 18.1%
Hawaii 723 124 17.2% 68 9.4% 192 26.6% 0.6% $445,260 $2,318 9.4%
Idaho 731 186 25.4% 67 9.1% 252 34.5% 0.8% $999,938 $3,963 17.6%
Illinois 6,171 56 0.9% 146 2.4% 202 3.3% 0.6% $653,826 $3,230 11.3%
Indiana 3,066 604 19.7% 288 9.4% 892 29.1% 2.8% $3,180,939 $3,566 16.1%
Iowa 1,534 357 23.3% 106 6.9% 463 30.2% 1.4% $1,662,600 $3,591 16.9%
Kansas 1,387 316 22.8% 136 9.8% 452 32.6% 1.4% $1,658,089 $3,670 16.5%
Kentucky 1,883 493 26.2% 158 8.4% 651 34.5% 2.0% $2,720,808 $4,182 19.3%
Louisiana 1,986 539 27.1% 156 7.9% 695 35.0% 2.2% $3,355,384 $4,826 21.1%
Maine 621 85 13.7% 63 10.2% 148 23.8% 0.5% $253,583 $1,713 7.4%
Maryland 3,048 55 1.8% 46 1.5% 101 3.3% 0.3% $856,171 $8,477 32.9%
Massachusetts 3,507 23 0.7% 85 2.4% 108 3.1% 0.3% $505,330 $4,675 15.7%
Michigan 4,441 881 19.8% 358 8.1% 1,239 27.9% 3.9% $3,953,582 $3,191 14.6%
Minnesota 2,802 247 8.8% 136 4.9% 384 13.7% 1.2% $772,978 $2,015 9.9%
Mississippi 1,207 369 30.6% 115 9.6% 485 40.1% 1.5% $2,329,863 $4,808 21.0%
Missouri 2,780 597 21.5% 235 8.5% 832 29.9% 2.6% $2,068,545 $2,485 10.8%
Montana 467 108 23.0% 47 10.1% 155 33.2% 0.5% $436,270 $2,818 13.0%
Nebraska 956 195 20.4% 92 9.6% 287 30.0% 0.9% $864,026 $3,007 13.2%
Nevada 1,413 297 21.0% 198 14.0% 495 35.0% 1.5% $968,993 $1,959 7.2%
NewHampshire
689 101 14.7% 52 7.5% 153 22.2% 0.5% $492,639 $3,223 15.9%
New Jersey 4,407 33 0.8% 111 2.5% 144 3.3% 0.4% $828,562 $5,761 19.8%
New Mexico 931 262 28.2% 80 8.6% 342 36.7% 1.1% $1,035,801 $3,028 12.9%
New York 9,437 452 4.8% 531 5.6% 983 10.4% 3.1% $1,575,765 $1,603 6.3%
North Carolina 4,572 1,073 23.5% 437 9.6% 1,509 33.0% 4.7% $6,233,002 $4,129 18.2%
North Dakota 380 64 16.7% 32 8.3% 95 25.0% 0.3% $301,682 $3,169 14.5%
Ohio 5,367 1,199 22.3% 446 8.3% 1,645 30.7% 5.1% $5,805,013 $3,529 16.3%
Oklahoma 1,731 471 27.2% 136 7.8% 606 35.0% 1.9% $2,820,891 $4,652 20.8%
Oregon 1,864 128 6.9% 112 6.0% 241 12.9% 0.7% $182,946 $762 3.1%
28
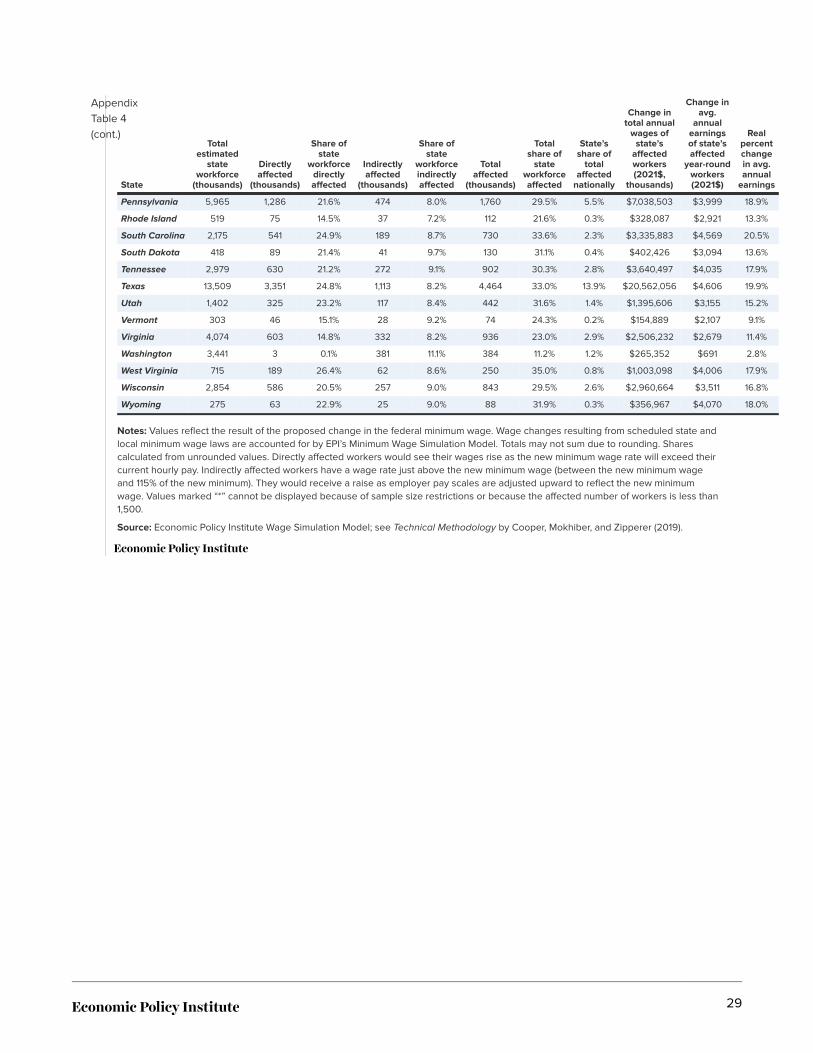
AppendixTable 4(cont.)
State
Totalestimated
stateworkforce
(thousands)
Directlyaffected
(thousands)
Share ofstate
workforcedirectlyaffected
Indirectlyaffected
(thousands)
Share ofstate
workforceindirectlyaffected
Totalaffected
(thousands)
Totalshare of
stateworkforceaffected
State’sshare of
totalaffected
nationally
Change intotal annual
wages ofstate’s
affectedworkers(2021$,
thousands)
Change inavg.
annualearningsof state’saffected
year-roundworkers(2021$)
Realpercentchangein avg.annual
earnings
Pennsylvania 5,965 1,286 21.6% 474 8.0% 1,760 29.5% 5.5% $7,038,503 $3,999 18.9%
Rhode Island 519 75 14.5% 37 7.2% 112 21.6% 0.3% $328,087 $2,921 13.3%
South Carolina 2,175 541 24.9% 189 8.7% 730 33.6% 2.3% $3,335,883 $4,569 20.5%
South Dakota 418 89 21.4% 41 9.7% 130 31.1% 0.4% $402,426 $3,094 13.6%
Tennessee 2,979 630 21.2% 272 9.1% 902 30.3% 2.8% $3,640,497 $4,035 17.9%
Texas 13,509 3,351 24.8% 1,113 8.2% 4,464 33.0% 13.9% $20,562,056 $4,606 19.9%
Utah 1,402 325 23.2% 117 8.4% 442 31.6% 1.4% $1,395,606 $3,155 15.2%
Vermont 303 46 15.1% 28 9.2% 74 24.3% 0.2% $154,889 $2,107 9.1%
Virginia 4,074 603 14.8% 332 8.2% 936 23.0% 2.9% $2,506,232 $2,679 11.4%
Washington 3,441 3 0.1% 381 11.1% 384 11.2% 1.2% $265,352 $691 2.8%
West Virginia 715 189 26.4% 62 8.6% 250 35.0% 0.8% $1,003,098 $4,006 17.9%
Wisconsin 2,854 586 20.5% 257 9.0% 843 29.5% 2.6% $2,960,664 $3,511 16.8%
Wyoming 275 63 22.9% 25 9.0% 88 31.9% 0.3% $356,967 $4,070 18.0%
Notes: Values reflect the result of the proposed change in the federal minimum wage. Wage changes resulting from scheduled state andlocal minimum wage laws are accounted for by EPI’s Minimum Wage Simulation Model. Totals may not sum due to rounding. Sharescalculated from unrounded values. Directly affected workers would see their wages rise as the new minimum wage rate will exceed theircurrent hourly pay. Indirectly affected workers have a wage rate just above the new minimum wage (between the new minimum wageand 115% of the new minimum). They would receive a raise as employer pay scales are adjusted upward to reflect the new minimumwage. Values marked “*” cannot be displayed because of sample size restrictions or because the affected number of workers is less than1,500.
Source: Economic Policy Institute Wage Simulation Model; see Technical Methodology by Cooper, Mokhiber, and Zipperer (2019).
29
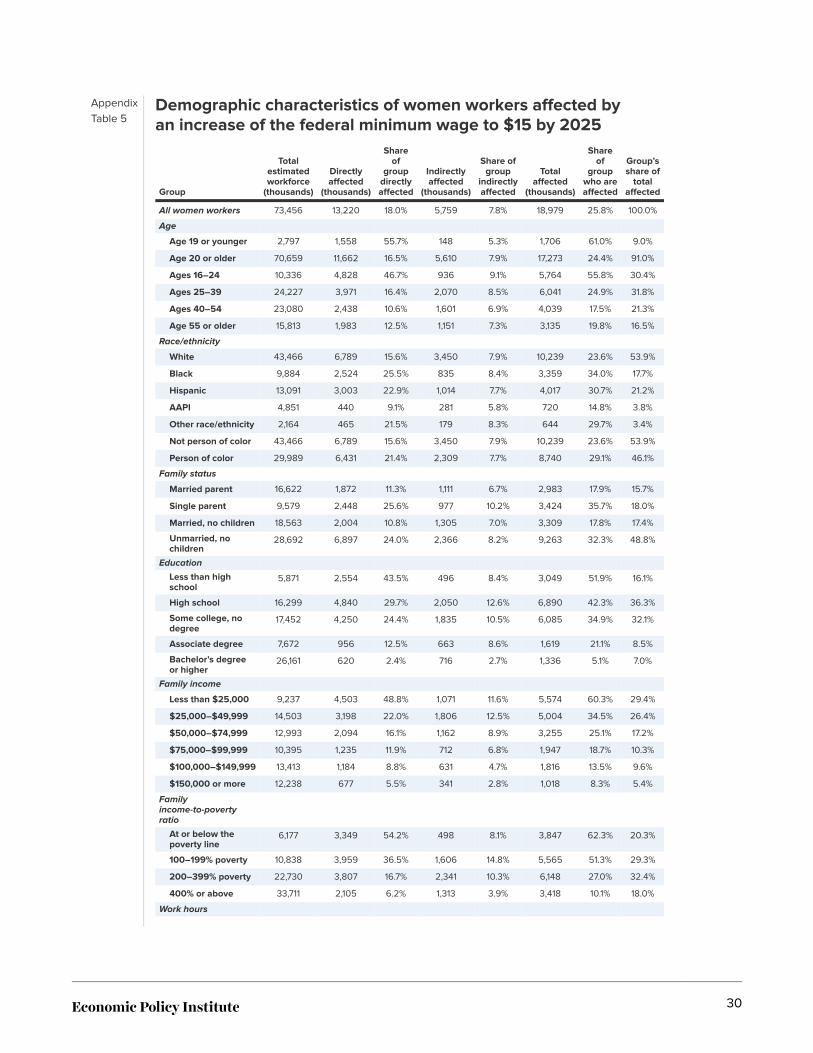
AppendixTable 5
Demographic characteristics of women workers affected byan increase of the federal minimum wage to $15 by 2025
Group
Totalestimatedworkforce
(thousands)
Directlyaffected
(thousands)
Shareof
groupdirectlyaffected
Indirectlyaffected
(thousands)
Share ofgroup
indirectlyaffected
Totalaffected
(thousands)
Shareof
groupwho areaffected
Group’sshare of
totalaffected
All women workers 73,456 13,220 18.0% 5,759 7.8% 18,979 25.8% 100.0%
Age
Age 19 or younger 2,797 1,558 55.7% 148 5.3% 1,706 61.0% 9.0%
Age 20 or older 70,659 11,662 16.5% 5,610 7.9% 17,273 24.4% 91.0%
Ages 16–24 10,336 4,828 46.7% 936 9.1% 5,764 55.8% 30.4%
Ages 25–39 24,227 3,971 16.4% 2,070 8.5% 6,041 24.9% 31.8%
Ages 40–54 23,080 2,438 10.6% 1,601 6.9% 4,039 17.5% 21.3%
Age 55 or older 15,813 1,983 12.5% 1,151 7.3% 3,135 19.8% 16.5%
Race/ethnicity
White 43,466 6,789 15.6% 3,450 7.9% 10,239 23.6% 53.9%
Black 9,884 2,524 25.5% 835 8.4% 3,359 34.0% 17.7%
Hispanic 13,091 3,003 22.9% 1,014 7.7% 4,017 30.7% 21.2%
AAPI 4,851 440 9.1% 281 5.8% 720 14.8% 3.8%
Other race/ethnicity 2,164 465 21.5% 179 8.3% 644 29.7% 3.4%
Not person of color 43,466 6,789 15.6% 3,450 7.9% 10,239 23.6% 53.9%
Person of color 29,989 6,431 21.4% 2,309 7.7% 8,740 29.1% 46.1%
Family status
Married parent 16,622 1,872 11.3% 1,111 6.7% 2,983 17.9% 15.7%
Single parent 9,579 2,448 25.6% 977 10.2% 3,424 35.7% 18.0%
Married, no children 18,563 2,004 10.8% 1,305 7.0% 3,309 17.8% 17.4%
Unmarried, nochildren
28,692 6,897 24.0% 2,366 8.2% 9,263 32.3% 48.8%
Education
Less than highschool
5,871 2,554 43.5% 496 8.4% 3,049 51.9% 16.1%
High school 16,299 4,840 29.7% 2,050 12.6% 6,890 42.3% 36.3%
Some college, nodegree
17,452 4,250 24.4% 1,835 10.5% 6,085 34.9% 32.1%
Associate degree 7,672 956 12.5% 663 8.6% 1,619 21.1% 8.5%
Bachelor’s degreeor higher
26,161 620 2.4% 716 2.7% 1,336 5.1% 7.0%
Family income
Less than $25,000 9,237 4,503 48.8% 1,071 11.6% 5,574 60.3% 29.4%
$25,000–$49,999 14,503 3,198 22.0% 1,806 12.5% 5,004 34.5% 26.4%
$50,000–$74,999 12,993 2,094 16.1% 1,162 8.9% 3,255 25.1% 17.2%
$75,000–$99,999 10,395 1,235 11.9% 712 6.8% 1,947 18.7% 10.3%
$100,000–$149,999 13,413 1,184 8.8% 631 4.7% 1,816 13.5% 9.6%
$150,000 or more 12,238 677 5.5% 341 2.8% 1,018 8.3% 5.4%
Familyincome-to-povertyratio
At or below thepoverty line
6,177 3,349 54.2% 498 8.1% 3,847 62.3% 20.3%
100–199% poverty 10,838 3,959 36.5% 1,606 14.8% 5,565 51.3% 29.3%
200–399% poverty 22,730 3,807 16.7% 2,341 10.3% 6,148 27.0% 32.4%
400% or above 33,711 2,105 6.2% 1,313 3.9% 3,418 10.1% 18.0%
Work hours
30
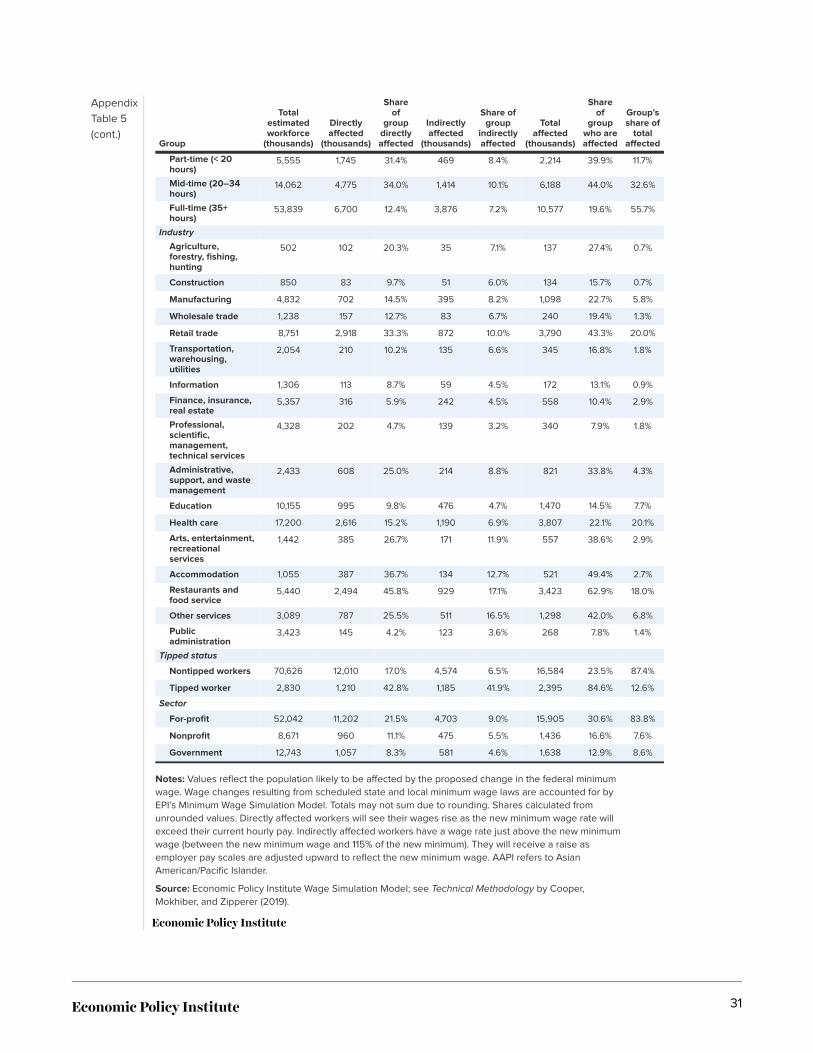
AppendixTable 5(cont.)
Group
Totalestimatedworkforce
(thousands)
Directlyaffected
(thousands)
Shareof
groupdirectlyaffected
Indirectlyaffected
(thousands)
Share ofgroup
indirectlyaffected
Totalaffected
(thousands)
Shareof
groupwho areaffected
Group’sshare of
totalaffected
Part-time (< 20hours)
5,555 1,745 31.4% 469 8.4% 2,214 39.9% 11.7%
Mid-time (20–34hours)
14,062 4,775 34.0% 1,414 10.1% 6,188 44.0% 32.6%
Full-time (35+hours)
53,839 6,700 12.4% 3,876 7.2% 10,577 19.6% 55.7%
Industry
Agriculture,forestry, fishing,hunting
502 102 20.3% 35 7.1% 137 27.4% 0.7%
Construction 850 83 9.7% 51 6.0% 134 15.7% 0.7%
Manufacturing 4,832 702 14.5% 395 8.2% 1,098 22.7% 5.8%
Wholesale trade 1,238 157 12.7% 83 6.7% 240 19.4% 1.3%
Retail trade 8,751 2,918 33.3% 872 10.0% 3,790 43.3% 20.0%
Transportation,warehousing,utilities
2,054 210 10.2% 135 6.6% 345 16.8% 1.8%
Information 1,306 113 8.7% 59 4.5% 172 13.1% 0.9%
Finance, insurance,real estate
5,357 316 5.9% 242 4.5% 558 10.4% 2.9%
Professional,scientific,management,technical services
4,328 202 4.7% 139 3.2% 340 7.9% 1.8%
Administrative,support, and wastemanagement
2,433 608 25.0% 214 8.8% 821 33.8% 4.3%
Education 10,155 995 9.8% 476 4.7% 1,470 14.5% 7.7%
Health care 17,200 2,616 15.2% 1,190 6.9% 3,807 22.1% 20.1%
Arts, entertainment,recreationalservices
1,442 385 26.7% 171 11.9% 557 38.6% 2.9%
Accommodation 1,055 387 36.7% 134 12.7% 521 49.4% 2.7%
Restaurants andfood service
5,440 2,494 45.8% 929 17.1% 3,423 62.9% 18.0%
Other services 3,089 787 25.5% 511 16.5% 1,298 42.0% 6.8%
Publicadministration
3,423 145 4.2% 123 3.6% 268 7.8% 1.4%
Tipped status
Nontipped workers 70,626 12,010 17.0% 4,574 6.5% 16,584 23.5% 87.4%
Tipped worker 2,830 1,210 42.8% 1,185 41.9% 2,395 84.6% 12.6%
Sector
For-profit 52,042 11,202 21.5% 4,703 9.0% 15,905 30.6% 83.8%
Nonprofit 8,671 960 11.1% 475 5.5% 1,436 16.6% 7.6%
Government 12,743 1,057 8.3% 581 4.6% 1,638 12.9% 8.6%
Notes: Values reflect the population likely to be affected by the proposed change in the federal minimumwage. Wage changes resulting from scheduled state and local minimum wage laws are accounted for byEPI’s Minimum Wage Simulation Model. Totals may not sum due to rounding. Shares calculated fromunrounded values. Directly affected workers will see their wages rise as the new minimum wage rate willexceed their current hourly pay. Indirectly affected workers have a wage rate just above the new minimumwage (between the new minimum wage and 115% of the new minimum). They will receive a raise asemployer pay scales are adjusted upward to reflect the new minimum wage. AAPI refers to AsianAmerican/Pacific Islander.
Source: Economic Policy Institute Wage Simulation Model; see Technical Methodology by Cooper,Mokhiber, and Zipperer (2019).
31
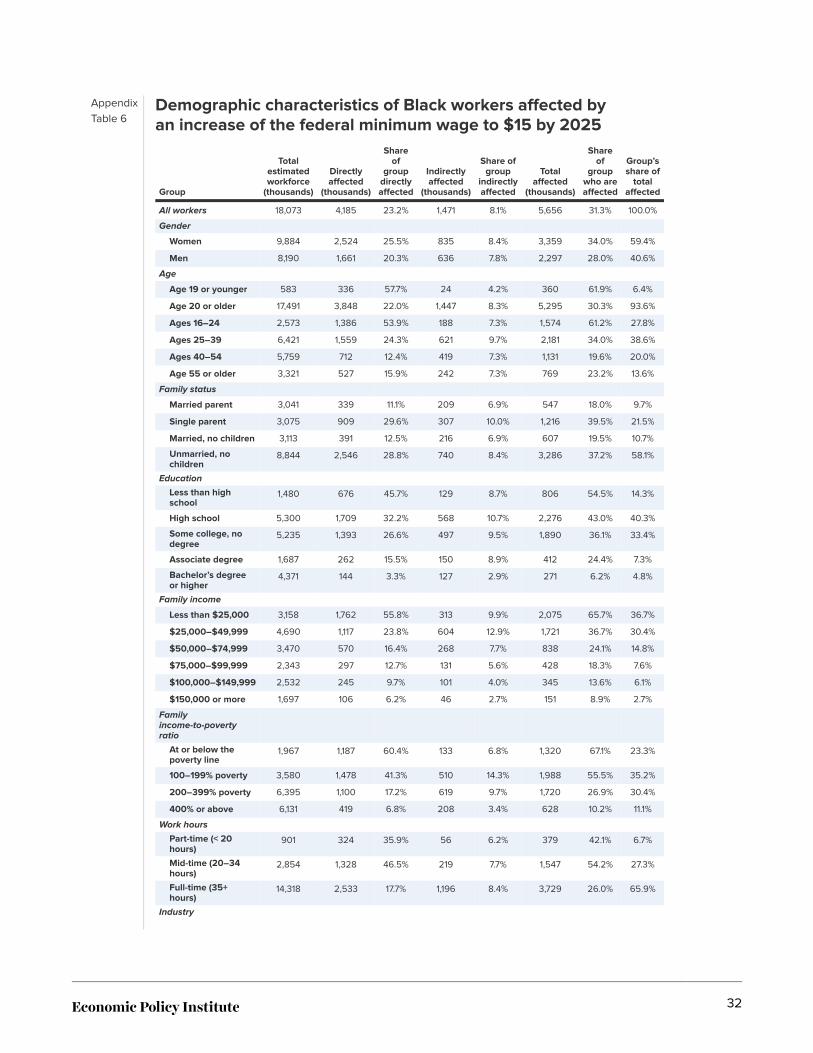
AppendixTable 6
Demographic characteristics of Black workers affected byan increase of the federal minimum wage to $15 by 2025
Group
Totalestimatedworkforce
(thousands)
Directlyaffected
(thousands)
Shareof
groupdirectlyaffected
Indirectlyaffected
(thousands)
Share ofgroup
indirectlyaffected
Totalaffected
(thousands)
Shareof
groupwho areaffected
Group’sshare of
totalaffected
All workers 18,073 4,185 23.2% 1,471 8.1% 5,656 31.3% 100.0%
Gender
Women 9,884 2,524 25.5% 835 8.4% 3,359 34.0% 59.4%
Men 8,190 1,661 20.3% 636 7.8% 2,297 28.0% 40.6%
Age
Age 19 or younger 583 336 57.7% 24 4.2% 360 61.9% 6.4%
Age 20 or older 17,491 3,848 22.0% 1,447 8.3% 5,295 30.3% 93.6%
Ages 16–24 2,573 1,386 53.9% 188 7.3% 1,574 61.2% 27.8%
Ages 25–39 6,421 1,559 24.3% 621 9.7% 2,181 34.0% 38.6%
Ages 40–54 5,759 712 12.4% 419 7.3% 1,131 19.6% 20.0%
Age 55 or older 3,321 527 15.9% 242 7.3% 769 23.2% 13.6%
Family status
Married parent 3,041 339 11.1% 209 6.9% 547 18.0% 9.7%
Single parent 3,075 909 29.6% 307 10.0% 1,216 39.5% 21.5%
Married, no children 3,113 391 12.5% 216 6.9% 607 19.5% 10.7%
Unmarried, nochildren
8,844 2,546 28.8% 740 8.4% 3,286 37.2% 58.1%
Education
Less than highschool
1,480 676 45.7% 129 8.7% 806 54.5% 14.3%
High school 5,300 1,709 32.2% 568 10.7% 2,276 43.0% 40.3%
Some college, nodegree
5,235 1,393 26.6% 497 9.5% 1,890 36.1% 33.4%
Associate degree 1,687 262 15.5% 150 8.9% 412 24.4% 7.3%
Bachelor’s degreeor higher
4,371 144 3.3% 127 2.9% 271 6.2% 4.8%
Family income
Less than $25,000 3,158 1,762 55.8% 313 9.9% 2,075 65.7% 36.7%
$25,000–$49,999 4,690 1,117 23.8% 604 12.9% 1,721 36.7% 30.4%
$50,000–$74,999 3,470 570 16.4% 268 7.7% 838 24.1% 14.8%
$75,000–$99,999 2,343 297 12.7% 131 5.6% 428 18.3% 7.6%
$100,000–$149,999 2,532 245 9.7% 101 4.0% 345 13.6% 6.1%
$150,000 or more 1,697 106 6.2% 46 2.7% 151 8.9% 2.7%
Familyincome-to-povertyratio
At or below thepoverty line
1,967 1,187 60.4% 133 6.8% 1,320 67.1% 23.3%
100–199% poverty 3,580 1,478 41.3% 510 14.3% 1,988 55.5% 35.2%
200–399% poverty 6,395 1,100 17.2% 619 9.7% 1,720 26.9% 30.4%
400% or above 6,131 419 6.8% 208 3.4% 628 10.2% 11.1%
Work hours
Part-time (< 20hours)
901 324 35.9% 56 6.2% 379 42.1% 6.7%
Mid-time (20–34hours)
2,854 1,328 46.5% 219 7.7% 1,547 54.2% 27.3%
Full-time (35+hours)
14,318 2,533 17.7% 1,196 8.4% 3,729 26.0% 65.9%
Industry
32
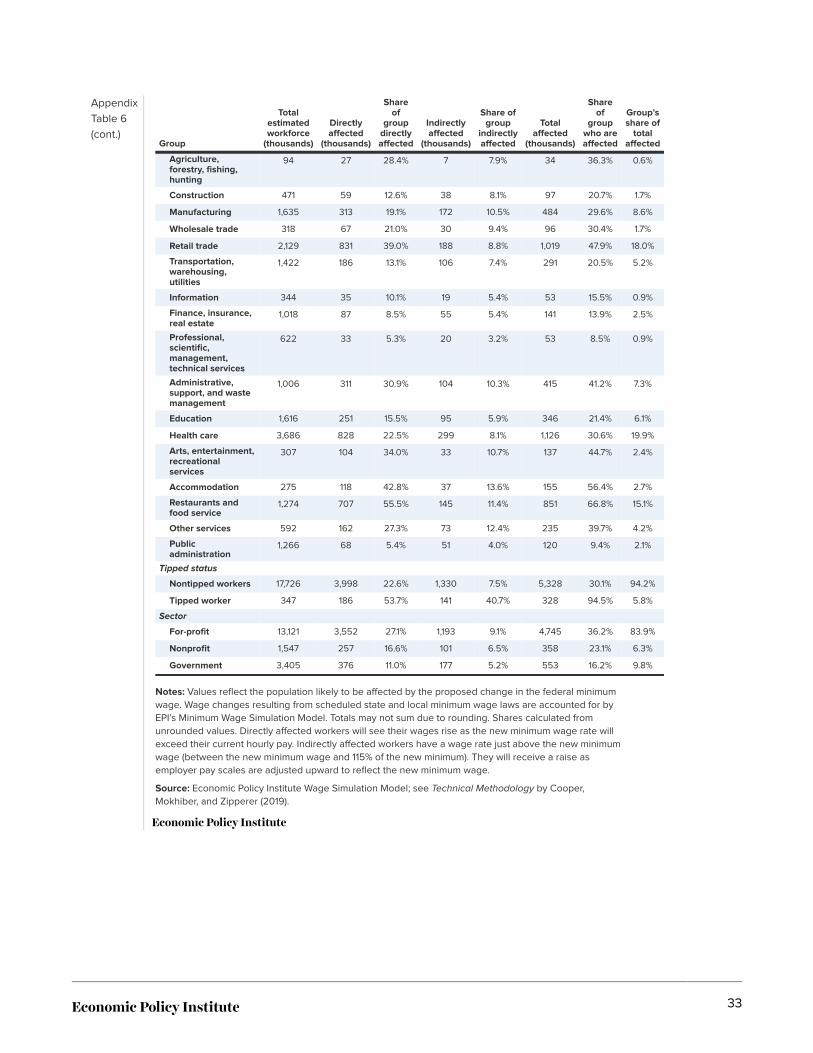
AppendixTable 6(cont.)
Group
Totalestimatedworkforce
(thousands)
Directlyaffected
(thousands)
Shareof
groupdirectlyaffected
Indirectlyaffected
(thousands)
Share ofgroup
indirectlyaffected
Totalaffected
(thousands)
Shareof
groupwho areaffected
Group’sshare of
totalaffected
Agriculture,forestry, fishing,hunting
94 27 28.4% 7 7.9% 34 36.3% 0.6%
Construction 471 59 12.6% 38 8.1% 97 20.7% 1.7%
Manufacturing 1,635 313 19.1% 172 10.5% 484 29.6% 8.6%
Wholesale trade 318 67 21.0% 30 9.4% 96 30.4% 1.7%
Retail trade 2,129 831 39.0% 188 8.8% 1,019 47.9% 18.0%
Transportation,warehousing,utilities
1,422 186 13.1% 106 7.4% 291 20.5% 5.2%
Information 344 35 10.1% 19 5.4% 53 15.5% 0.9%
Finance, insurance,real estate
1,018 87 8.5% 55 5.4% 141 13.9% 2.5%
Professional,scientific,management,technical services
622 33 5.3% 20 3.2% 53 8.5% 0.9%
Administrative,support, and wastemanagement
1,006 311 30.9% 104 10.3% 415 41.2% 7.3%
Education 1,616 251 15.5% 95 5.9% 346 21.4% 6.1%
Health care 3,686 828 22.5% 299 8.1% 1,126 30.6% 19.9%
Arts, entertainment,recreationalservices
307 104 34.0% 33 10.7% 137 44.7% 2.4%
Accommodation 275 118 42.8% 37 13.6% 155 56.4% 2.7%
Restaurants andfood service
1,274 707 55.5% 145 11.4% 851 66.8% 15.1%
Other services 592 162 27.3% 73 12.4% 235 39.7% 4.2%
Publicadministration
1,266 68 5.4% 51 4.0% 120 9.4% 2.1%
Tipped status
Nontipped workers 17,726 3,998 22.6% 1,330 7.5% 5,328 30.1% 94.2%
Tipped worker 347 186 53.7% 141 40.7% 328 94.5% 5.8%
Sector
For-profit 13,121 3,552 27.1% 1,193 9.1% 4,745 36.2% 83.9%
Nonprofit 1,547 257 16.6% 101 6.5% 358 23.1% 6.3%
Government 3,405 376 11.0% 177 5.2% 553 16.2% 9.8%
Notes: Values reflect the population likely to be affected by the proposed change in the federal minimumwage. Wage changes resulting from scheduled state and local minimum wage laws are accounted for byEPI’s Minimum Wage Simulation Model. Totals may not sum due to rounding. Shares calculated fromunrounded values. Directly affected workers will see their wages rise as the new minimum wage rate willexceed their current hourly pay. Indirectly affected workers have a wage rate just above the new minimumwage (between the new minimum wage and 115% of the new minimum). They will receive a raise asemployer pay scales are adjusted upward to reflect the new minimum wage.
Source: Economic Policy Institute Wage Simulation Model; see Technical Methodology by Cooper,Mokhiber, and Zipperer (2019).
33
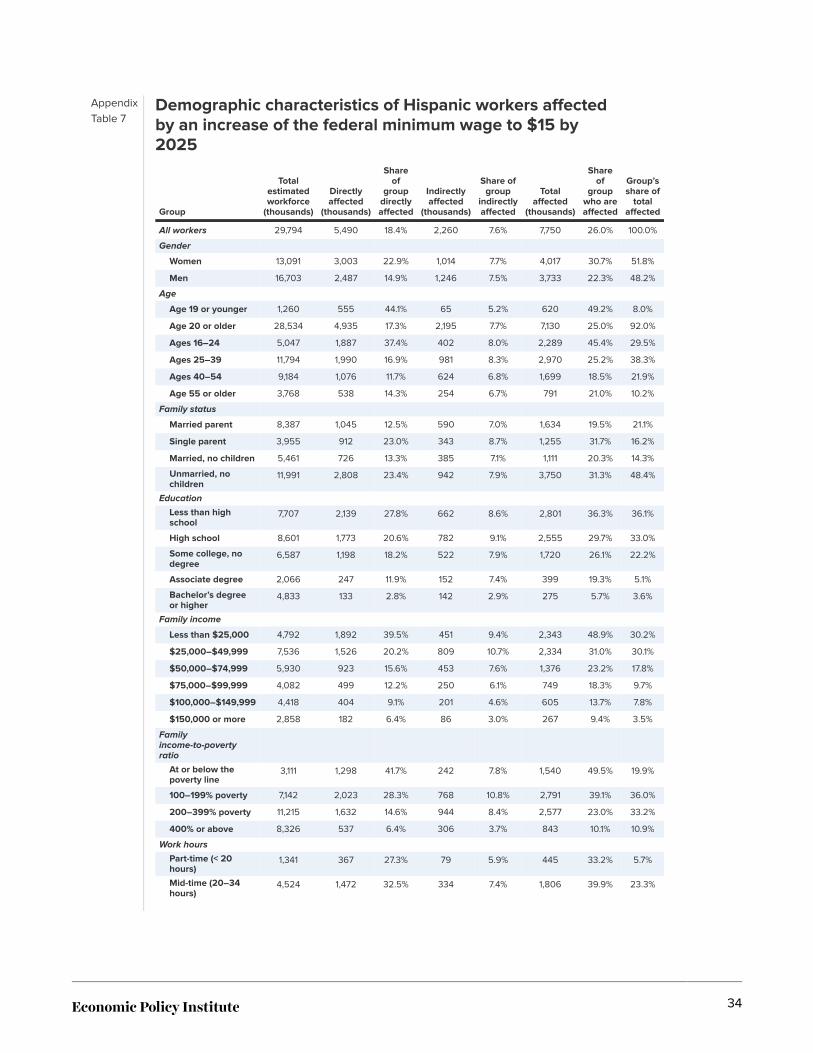
AppendixTable 7
Demographic characteristics of Hispanic workers affectedby an increase of the federal minimum wage to $15 by2025
Group
Totalestimatedworkforce
(thousands)
Directlyaffected
(thousands)
Shareof
groupdirectlyaffected
Indirectlyaffected
(thousands)
Share ofgroup
indirectlyaffected
Totalaffected
(thousands)
Shareof
groupwho areaffected
Group’sshare of
totalaffected
All workers 29,794 5,490 18.4% 2,260 7.6% 7,750 26.0% 100.0%
Gender
Women 13,091 3,003 22.9% 1,014 7.7% 4,017 30.7% 51.8%
Men 16,703 2,487 14.9% 1,246 7.5% 3,733 22.3% 48.2%
Age
Age 19 or younger 1,260 555 44.1% 65 5.2% 620 49.2% 8.0%
Age 20 or older 28,534 4,935 17.3% 2,195 7.7% 7,130 25.0% 92.0%
Ages 16–24 5,047 1,887 37.4% 402 8.0% 2,289 45.4% 29.5%
Ages 25–39 11,794 1,990 16.9% 981 8.3% 2,970 25.2% 38.3%
Ages 40–54 9,184 1,076 11.7% 624 6.8% 1,699 18.5% 21.9%
Age 55 or older 3,768 538 14.3% 254 6.7% 791 21.0% 10.2%
Family status
Married parent 8,387 1,045 12.5% 590 7.0% 1,634 19.5% 21.1%
Single parent 3,955 912 23.0% 343 8.7% 1,255 31.7% 16.2%
Married, no children 5,461 726 13.3% 385 7.1% 1,111 20.3% 14.3%
Unmarried, nochildren
11,991 2,808 23.4% 942 7.9% 3,750 31.3% 48.4%
Education
Less than highschool
7,707 2,139 27.8% 662 8.6% 2,801 36.3% 36.1%
High school 8,601 1,773 20.6% 782 9.1% 2,555 29.7% 33.0%
Some college, nodegree
6,587 1,198 18.2% 522 7.9% 1,720 26.1% 22.2%
Associate degree 2,066 247 11.9% 152 7.4% 399 19.3% 5.1%
Bachelor’s degreeor higher
4,833 133 2.8% 142 2.9% 275 5.7% 3.6%
Family income
Less than $25,000 4,792 1,892 39.5% 451 9.4% 2,343 48.9% 30.2%
$25,000–$49,999 7,536 1,526 20.2% 809 10.7% 2,334 31.0% 30.1%
$50,000–$74,999 5,930 923 15.6% 453 7.6% 1,376 23.2% 17.8%
$75,000–$99,999 4,082 499 12.2% 250 6.1% 749 18.3% 9.7%
$100,000–$149,999 4,418 404 9.1% 201 4.6% 605 13.7% 7.8%
$150,000 or more 2,858 182 6.4% 86 3.0% 267 9.4% 3.5%
Familyincome-to-povertyratio
At or below thepoverty line
3,111 1,298 41.7% 242 7.8% 1,540 49.5% 19.9%
100–199% poverty 7,142 2,023 28.3% 768 10.8% 2,791 39.1% 36.0%
200–399% poverty 11,215 1,632 14.6% 944 8.4% 2,577 23.0% 33.2%
400% or above 8,326 537 6.4% 306 3.7% 843 10.1% 10.9%
Work hours
Part-time (< 20hours)
1,341 367 27.3% 79 5.9% 445 33.2% 5.7%
Mid-time (20–34hours)
4,524 1,472 32.5% 334 7.4% 1,806 39.9% 23.3%
34

AppendixTable 7(cont.)
Group
Totalestimatedworkforce
(thousands)
Directlyaffected
(thousands)
Shareof
groupdirectlyaffected
Indirectlyaffected
(thousands)
Share ofgroup
indirectlyaffected
Totalaffected
(thousands)
Shareof
groupwho areaffected
Group’sshare of
totalaffected
Full-time (35+hours)
23,928 3,651 15.3% 1,847 7.7% 5,499 23.0% 71.0%
Industry
Agriculture,forestry, fishing,hunting
996 216 21.6% 84 8.4% 299 30.1% 3.9%
Construction 2,990 392 13.1% 270 9.0% 662 22.1% 8.5%
Manufacturing 3,175 427 13.4% 231 7.3% 658 20.7% 8.5%
Wholesale trade 872 125 14.3% 59 6.7% 184 21.1% 2.4%
Retail trade 3,497 926 26.5% 244 7.0% 1,169 33.4% 15.1%
Transportation,warehousing,utilities
1,596 147 9.2% 89 5.6% 236 14.8% 3.0%
Information 433 42 9.7% 18 4.2% 60 13.9% 0.8%
Finance, insurance,real estate
1,443 131 9.0% 75 5.2% 206 14.3% 2.7%
Professional,scientific,management,technical services
1,054 63 5.9% 36 3.5% 99 9.4% 1.3%
Administrative,support, and wastemanagement
1,922 477 24.8% 152 7.9% 629 32.7% 8.1%
Education 2,018 272 13.5% 102 5.1% 374 18.5% 4.8%
Health care 3,330 580 17.4% 207 6.2% 787 23.6% 10.2%
Arts, entertainment,recreationalservices
530 125 23.5% 54 10.2% 179 33.7% 2.3%
Accommodation 570 176 30.9% 73 12.8% 249 43.7% 3.2%
Restaurants andfood service
3,012 1,052 34.9% 385 12.8% 1,438 47.7% 18.6%
Other services 1,286 294 22.9% 145 11.3% 439 34.1% 5.7%
Publicadministration
1,070 46 4.3% 35 3.3% 81 7.6% 1.0%
Tipped status
Nontipped workers 28,815 5,157 17.9% 1,857 6.4% 7,014 24.3% 90.5%
Tipped worker 979 333 34.0% 403 41.2% 736 75.2% 9.5%
Sector
For-profit 24,937 4,971 19.9% 2,032 8.2% 7,003 28.1% 90.4%
Nonprofit 1,633 217 13.3% 89 5.4% 306 18.7% 4.0%
Government 3,224 302 9.4% 139 4.3% 441 13.7% 5.7%
Notes: Values reflect the population likely to be affected by the proposed change in the federal minimumwage. Wage changes resulting from scheduled state and local minimum wage laws are accounted for byEPI’s Minimum Wage Simulation Model. Totals may not sum due to rounding. Shares calculated fromunrounded values. Directly affected workers will see their wages rise as the new minimum wage rate willexceed their current hourly pay. Indirectly affected workers have a wage rate just above the new minimumwage (between the new minimum wage and 115% of the new minimum). They will receive a raise asemployer pay scales are adjusted upward to reflect the new minimum wage.
Source: Economic Policy Institute Wage Simulation Model; see Technical Methodology by Cooper,Mokhiber, and Zipperer (2019).
35
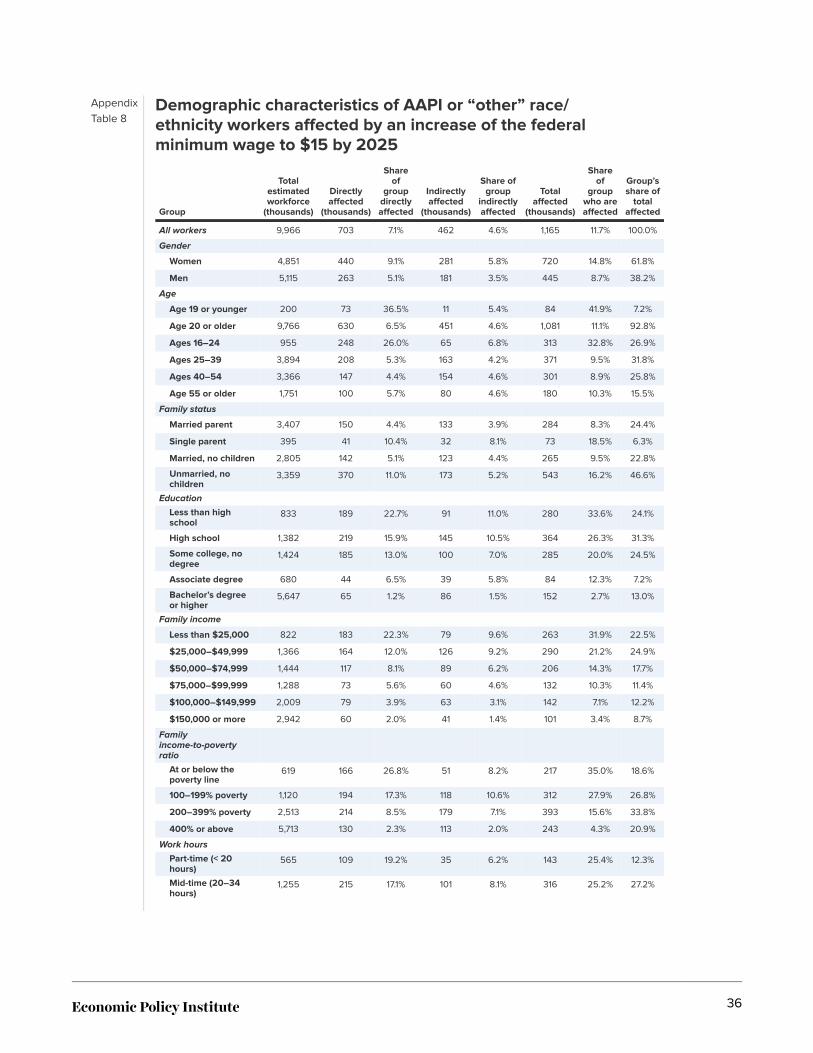
AppendixTable 8
Demographic characteristics of AAPI or “other” race/ethnicity workers affected by an increase of the federalminimum wage to $15 by 2025
Group
Totalestimatedworkforce
(thousands)
Directlyaffected
(thousands)
Shareof
groupdirectlyaffected
Indirectlyaffected
(thousands)
Share ofgroup
indirectlyaffected
Totalaffected
(thousands)
Shareof
groupwho areaffected
Group’sshare of
totalaffected
All workers 9,966 703 7.1% 462 4.6% 1,165 11.7% 100.0%
Gender
Women 4,851 440 9.1% 281 5.8% 720 14.8% 61.8%
Men 5,115 263 5.1% 181 3.5% 445 8.7% 38.2%
Age
Age 19 or younger 200 73 36.5% 11 5.4% 84 41.9% 7.2%
Age 20 or older 9,766 630 6.5% 451 4.6% 1,081 11.1% 92.8%
Ages 16–24 955 248 26.0% 65 6.8% 313 32.8% 26.9%
Ages 25–39 3,894 208 5.3% 163 4.2% 371 9.5% 31.8%
Ages 40–54 3,366 147 4.4% 154 4.6% 301 8.9% 25.8%
Age 55 or older 1,751 100 5.7% 80 4.6% 180 10.3% 15.5%
Family status
Married parent 3,407 150 4.4% 133 3.9% 284 8.3% 24.4%
Single parent 395 41 10.4% 32 8.1% 73 18.5% 6.3%
Married, no children 2,805 142 5.1% 123 4.4% 265 9.5% 22.8%
Unmarried, nochildren
3,359 370 11.0% 173 5.2% 543 16.2% 46.6%
Education
Less than highschool
833 189 22.7% 91 11.0% 280 33.6% 24.1%
High school 1,382 219 15.9% 145 10.5% 364 26.3% 31.3%
Some college, nodegree
1,424 185 13.0% 100 7.0% 285 20.0% 24.5%
Associate degree 680 44 6.5% 39 5.8% 84 12.3% 7.2%
Bachelor’s degreeor higher
5,647 65 1.2% 86 1.5% 152 2.7% 13.0%
Family income
Less than $25,000 822 183 22.3% 79 9.6% 263 31.9% 22.5%
$25,000–$49,999 1,366 164 12.0% 126 9.2% 290 21.2% 24.9%
$50,000–$74,999 1,444 117 8.1% 89 6.2% 206 14.3% 17.7%
$75,000–$99,999 1,288 73 5.6% 60 4.6% 132 10.3% 11.4%
$100,000–$149,999 2,009 79 3.9% 63 3.1% 142 7.1% 12.2%
$150,000 or more 2,942 60 2.0% 41 1.4% 101 3.4% 8.7%
Familyincome-to-povertyratio
At or below thepoverty line
619 166 26.8% 51 8.2% 217 35.0% 18.6%
100–199% poverty 1,120 194 17.3% 118 10.6% 312 27.9% 26.8%
200–399% poverty 2,513 214 8.5% 179 7.1% 393 15.6% 33.8%
400% or above 5,713 130 2.3% 113 2.0% 243 4.3% 20.9%
Work hours
Part-time (< 20hours)
565 109 19.2% 35 6.2% 143 25.4% 12.3%
Mid-time (20–34hours)
1,255 215 17.1% 101 8.1% 316 25.2% 27.2%
36
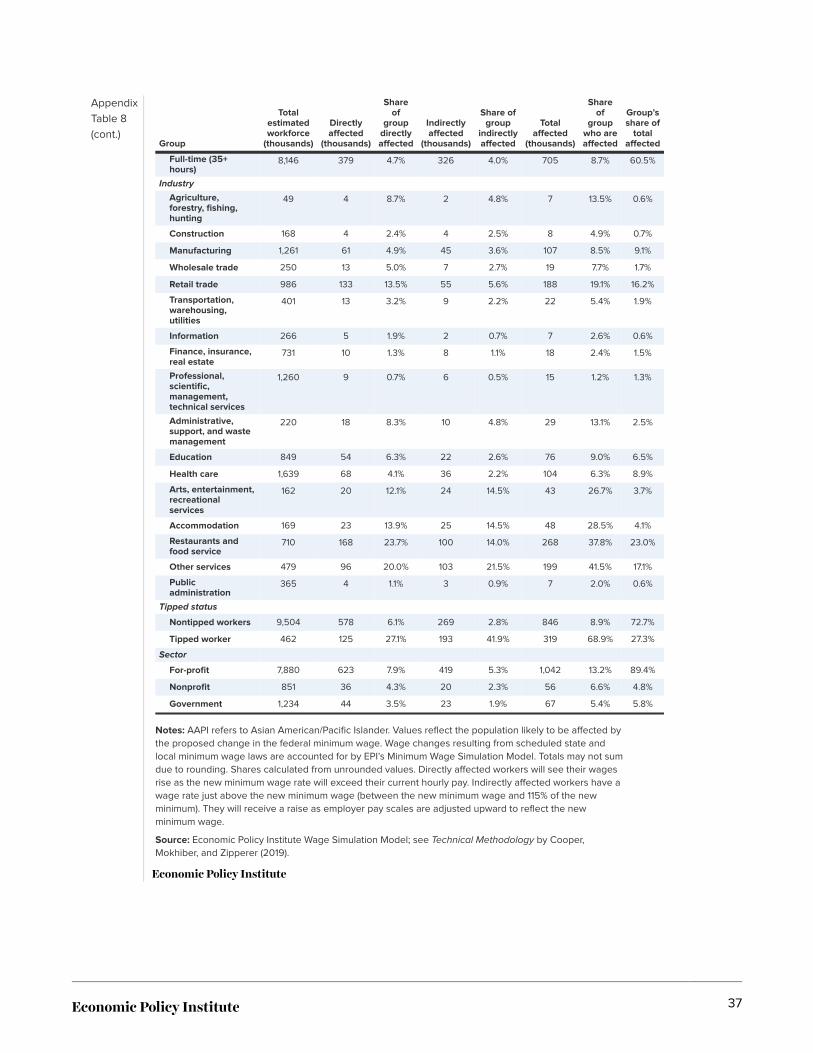
AppendixTable 8(cont.)
Group
Totalestimatedworkforce
(thousands)
Directlyaffected
(thousands)
Shareof
groupdirectlyaffected
Indirectlyaffected
(thousands)
Share ofgroup
indirectlyaffected
Totalaffected
(thousands)
Shareof
groupwho areaffected
Group’sshare of
totalaffected
Full-time (35+hours)
8,146 379 4.7% 326 4.0% 705 8.7% 60.5%
Industry
Agriculture,forestry, fishing,hunting
49 4 8.7% 2 4.8% 7 13.5% 0.6%
Construction 168 4 2.4% 4 2.5% 8 4.9% 0.7%
Manufacturing 1,261 61 4.9% 45 3.6% 107 8.5% 9.1%
Wholesale trade 250 13 5.0% 7 2.7% 19 7.7% 1.7%
Retail trade 986 133 13.5% 55 5.6% 188 19.1% 16.2%
Transportation,warehousing,utilities
401 13 3.2% 9 2.2% 22 5.4% 1.9%
Information 266 5 1.9% 2 0.7% 7 2.6% 0.6%
Finance, insurance,real estate
731 10 1.3% 8 1.1% 18 2.4% 1.5%
Professional,scientific,management,technical services
1,260 9 0.7% 6 0.5% 15 1.2% 1.3%
Administrative,support, and wastemanagement
220 18 8.3% 10 4.8% 29 13.1% 2.5%
Education 849 54 6.3% 22 2.6% 76 9.0% 6.5%
Health care 1,639 68 4.1% 36 2.2% 104 6.3% 8.9%
Arts, entertainment,recreationalservices
162 20 12.1% 24 14.5% 43 26.7% 3.7%
Accommodation 169 23 13.9% 25 14.5% 48 28.5% 4.1%
Restaurants andfood service
710 168 23.7% 100 14.0% 268 37.8% 23.0%
Other services 479 96 20.0% 103 21.5% 199 41.5% 17.1%
Publicadministration
365 4 1.1% 3 0.9% 7 2.0% 0.6%
Tipped status
Nontipped workers 9,504 578 6.1% 269 2.8% 846 8.9% 72.7%
Tipped worker 462 125 27.1% 193 41.9% 319 68.9% 27.3%
Sector
For-profit 7,880 623 7.9% 419 5.3% 1,042 13.2% 89.4%
Nonprofit 851 36 4.3% 20 2.3% 56 6.6% 4.8%
Government 1,234 44 3.5% 23 1.9% 67 5.4% 5.8%
Notes: AAPI refers to Asian American/Pacific Islander. Values reflect the population likely to be affected bythe proposed change in the federal minimum wage. Wage changes resulting from scheduled state andlocal minimum wage laws are accounted for by EPI’s Minimum Wage Simulation Model. Totals may not sumdue to rounding. Shares calculated from unrounded values. Directly affected workers will see their wagesrise as the new minimum wage rate will exceed their current hourly pay. Indirectly affected workers have awage rate just above the new minimum wage (between the new minimum wage and 115% of the newminimum). They will receive a raise as employer pay scales are adjusted upward to reflect the newminimum wage.
Source: Economic Policy Institute Wage Simulation Model; see Technical Methodology by Cooper,Mokhiber, and Zipperer (2019).
37
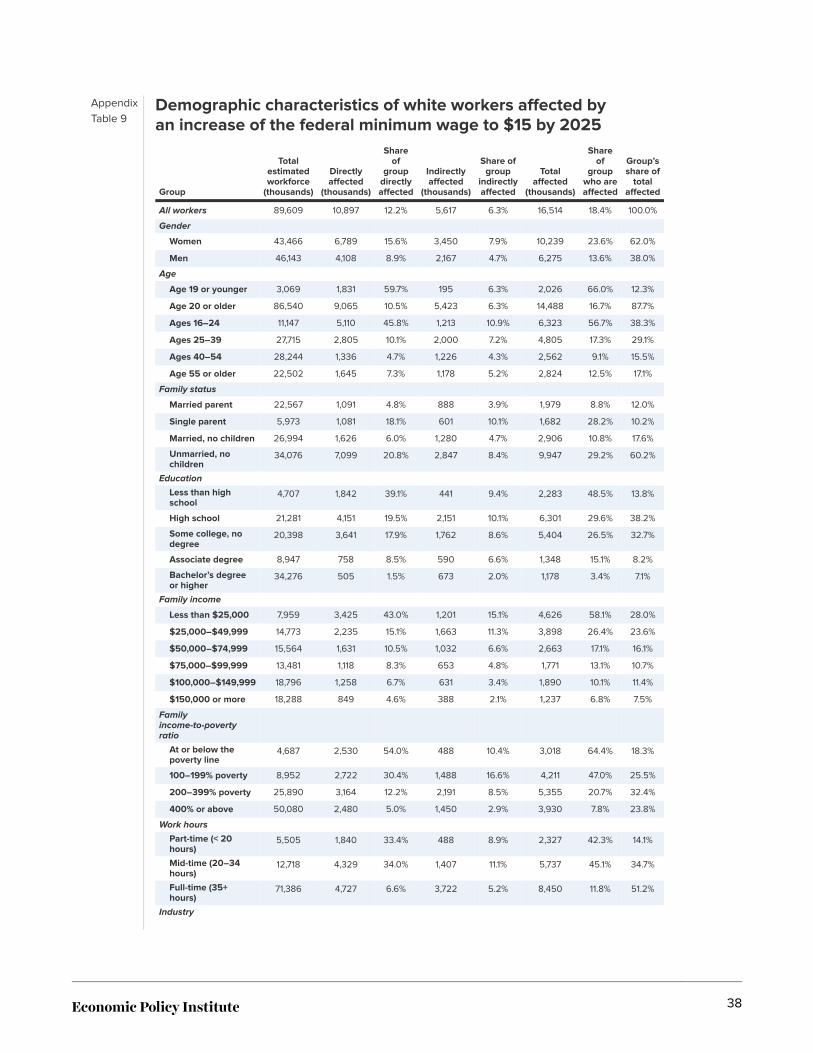
AppendixTable 9
Demographic characteristics of white workers affected byan increase of the federal minimum wage to $15 by 2025
Group
Totalestimatedworkforce
(thousands)
Directlyaffected
(thousands)
Shareof
groupdirectlyaffected
Indirectlyaffected
(thousands)
Share ofgroup
indirectlyaffected
Totalaffected
(thousands)
Shareof
groupwho areaffected
Group’sshare of
totalaffected
All workers 89,609 10,897 12.2% 5,617 6.3% 16,514 18.4% 100.0%
Gender
Women 43,466 6,789 15.6% 3,450 7.9% 10,239 23.6% 62.0%
Men 46,143 4,108 8.9% 2,167 4.7% 6,275 13.6% 38.0%
Age
Age 19 or younger 3,069 1,831 59.7% 195 6.3% 2,026 66.0% 12.3%
Age 20 or older 86,540 9,065 10.5% 5,423 6.3% 14,488 16.7% 87.7%
Ages 16–24 11,147 5,110 45.8% 1,213 10.9% 6,323 56.7% 38.3%
Ages 25–39 27,715 2,805 10.1% 2,000 7.2% 4,805 17.3% 29.1%
Ages 40–54 28,244 1,336 4.7% 1,226 4.3% 2,562 9.1% 15.5%
Age 55 or older 22,502 1,645 7.3% 1,178 5.2% 2,824 12.5% 17.1%
Family status
Married parent 22,567 1,091 4.8% 888 3.9% 1,979 8.8% 12.0%
Single parent 5,973 1,081 18.1% 601 10.1% 1,682 28.2% 10.2%
Married, no children 26,994 1,626 6.0% 1,280 4.7% 2,906 10.8% 17.6%
Unmarried, nochildren
34,076 7,099 20.8% 2,847 8.4% 9,947 29.2% 60.2%
Education
Less than highschool
4,707 1,842 39.1% 441 9.4% 2,283 48.5% 13.8%
High school 21,281 4,151 19.5% 2,151 10.1% 6,301 29.6% 38.2%
Some college, nodegree
20,398 3,641 17.9% 1,762 8.6% 5,404 26.5% 32.7%
Associate degree 8,947 758 8.5% 590 6.6% 1,348 15.1% 8.2%
Bachelor’s degreeor higher
34,276 505 1.5% 673 2.0% 1,178 3.4% 7.1%
Family income
Less than $25,000 7,959 3,425 43.0% 1,201 15.1% 4,626 58.1% 28.0%
$25,000–$49,999 14,773 2,235 15.1% 1,663 11.3% 3,898 26.4% 23.6%
$50,000–$74,999 15,564 1,631 10.5% 1,032 6.6% 2,663 17.1% 16.1%
$75,000–$99,999 13,481 1,118 8.3% 653 4.8% 1,771 13.1% 10.7%
$100,000–$149,999 18,796 1,258 6.7% 631 3.4% 1,890 10.1% 11.4%
$150,000 or more 18,288 849 4.6% 388 2.1% 1,237 6.8% 7.5%
Familyincome-to-povertyratio
At or below thepoverty line
4,687 2,530 54.0% 488 10.4% 3,018 64.4% 18.3%
100–199% poverty 8,952 2,722 30.4% 1,488 16.6% 4,211 47.0% 25.5%
200–399% poverty 25,890 3,164 12.2% 2,191 8.5% 5,355 20.7% 32.4%
400% or above 50,080 2,480 5.0% 1,450 2.9% 3,930 7.8% 23.8%
Work hours
Part-time (< 20hours)
5,505 1,840 33.4% 488 8.9% 2,327 42.3% 14.1%
Mid-time (20–34hours)
12,718 4,329 34.0% 1,407 11.1% 5,737 45.1% 34.7%
Full-time (35+hours)
71,386 4,727 6.6% 3,722 5.2% 8,450 11.8% 51.2%
Industry
38
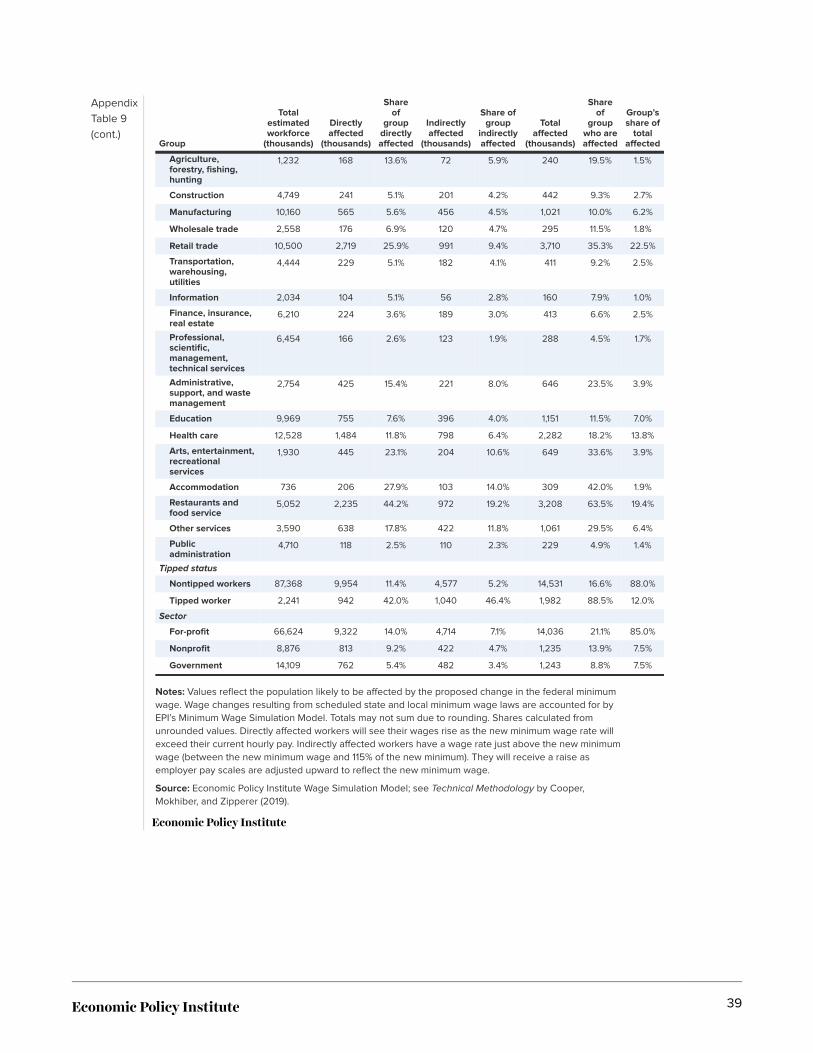
AppendixTable 9(cont.)
Group
Totalestimatedworkforce
(thousands)
Directlyaffected
(thousands)
Shareof
groupdirectlyaffected
Indirectlyaffected
(thousands)
Share ofgroup
indirectlyaffected
Totalaffected
(thousands)
Shareof
groupwho areaffected
Group’sshare of
totalaffected
Agriculture,forestry, fishing,hunting
1,232 168 13.6% 72 5.9% 240 19.5% 1.5%
Construction 4,749 241 5.1% 201 4.2% 442 9.3% 2.7%
Manufacturing 10,160 565 5.6% 456 4.5% 1,021 10.0% 6.2%
Wholesale trade 2,558 176 6.9% 120 4.7% 295 11.5% 1.8%
Retail trade 10,500 2,719 25.9% 991 9.4% 3,710 35.3% 22.5%
Transportation,warehousing,utilities
4,444 229 5.1% 182 4.1% 411 9.2% 2.5%
Information 2,034 104 5.1% 56 2.8% 160 7.9% 1.0%
Finance, insurance,real estate
6,210 224 3.6% 189 3.0% 413 6.6% 2.5%
Professional,scientific,management,technical services
6,454 166 2.6% 123 1.9% 288 4.5% 1.7%
Administrative,support, and wastemanagement
2,754 425 15.4% 221 8.0% 646 23.5% 3.9%
Education 9,969 755 7.6% 396 4.0% 1,151 11.5% 7.0%
Health care 12,528 1,484 11.8% 798 6.4% 2,282 18.2% 13.8%
Arts, entertainment,recreationalservices
1,930 445 23.1% 204 10.6% 649 33.6% 3.9%
Accommodation 736 206 27.9% 103 14.0% 309 42.0% 1.9%
Restaurants andfood service
5,052 2,235 44.2% 972 19.2% 3,208 63.5% 19.4%
Other services 3,590 638 17.8% 422 11.8% 1,061 29.5% 6.4%
Publicadministration
4,710 118 2.5% 110 2.3% 229 4.9% 1.4%
Tipped status
Nontipped workers 87,368 9,954 11.4% 4,577 5.2% 14,531 16.6% 88.0%
Tipped worker 2,241 942 42.0% 1,040 46.4% 1,982 88.5% 12.0%
Sector
For-profit 66,624 9,322 14.0% 4,714 7.1% 14,036 21.1% 85.0%
Nonprofit 8,876 813 9.2% 422 4.7% 1,235 13.9% 7.5%
Government 14,109 762 5.4% 482 3.4% 1,243 8.8% 7.5%
Notes: Values reflect the population likely to be affected by the proposed change in the federal minimumwage. Wage changes resulting from scheduled state and local minimum wage laws are accounted for byEPI’s Minimum Wage Simulation Model. Totals may not sum due to rounding. Shares calculated fromunrounded values. Directly affected workers will see their wages rise as the new minimum wage rate willexceed their current hourly pay. Indirectly affected workers have a wage rate just above the new minimumwage (between the new minimum wage and 115% of the new minimum). They will receive a raise asemployer pay scales are adjusted upward to reflect the new minimum wage.
Source: Economic Policy Institute Wage Simulation Model; see Technical Methodology by Cooper,Mokhiber, and Zipperer (2019).
39
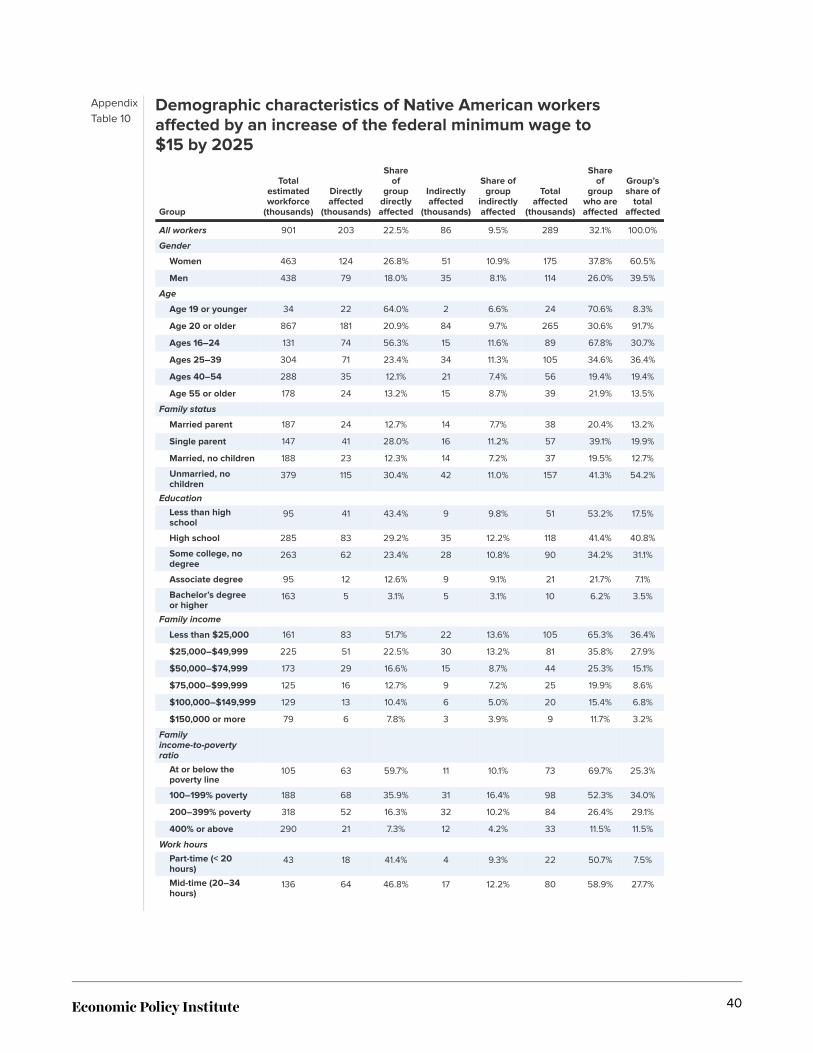
AppendixTable 10
Demographic characteristics of Native American workersaffected by an increase of the federal minimum wage to$15 by 2025
Group
Totalestimatedworkforce
(thousands)
Directlyaffected
(thousands)
Shareof
groupdirectlyaffected
Indirectlyaffected
(thousands)
Share ofgroup
indirectlyaffected
Totalaffected
(thousands)
Shareof
groupwho areaffected
Group’sshare of
totalaffected
All workers 901 203 22.5% 86 9.5% 289 32.1% 100.0%
Gender
Women 463 124 26.8% 51 10.9% 175 37.8% 60.5%
Men 438 79 18.0% 35 8.1% 114 26.0% 39.5%
Age
Age 19 or younger 34 22 64.0% 2 6.6% 24 70.6% 8.3%
Age 20 or older 867 181 20.9% 84 9.7% 265 30.6% 91.7%
Ages 16–24 131 74 56.3% 15 11.6% 89 67.8% 30.7%
Ages 25–39 304 71 23.4% 34 11.3% 105 34.6% 36.4%
Ages 40–54 288 35 12.1% 21 7.4% 56 19.4% 19.4%
Age 55 or older 178 24 13.2% 15 8.7% 39 21.9% 13.5%
Family status
Married parent 187 24 12.7% 14 7.7% 38 20.4% 13.2%
Single parent 147 41 28.0% 16 11.2% 57 39.1% 19.9%
Married, no children 188 23 12.3% 14 7.2% 37 19.5% 12.7%
Unmarried, nochildren
379 115 30.4% 42 11.0% 157 41.3% 54.2%
Education
Less than highschool
95 41 43.4% 9 9.8% 51 53.2% 17.5%
High school 285 83 29.2% 35 12.2% 118 41.4% 40.8%
Some college, nodegree
263 62 23.4% 28 10.8% 90 34.2% 31.1%
Associate degree 95 12 12.6% 9 9.1% 21 21.7% 7.1%
Bachelor’s degreeor higher
163 5 3.1% 5 3.1% 10 6.2% 3.5%
Family income
Less than $25,000 161 83 51.7% 22 13.6% 105 65.3% 36.4%
$25,000–$49,999 225 51 22.5% 30 13.2% 81 35.8% 27.9%
$50,000–$74,999 173 29 16.6% 15 8.7% 44 25.3% 15.1%
$75,000–$99,999 125 16 12.7% 9 7.2% 25 19.9% 8.6%
$100,000–$149,999 129 13 10.4% 6 5.0% 20 15.4% 6.8%
$150,000 or more 79 6 7.8% 3 3.9% 9 11.7% 3.2%
Familyincome-to-povertyratio
At or below thepoverty line
105 63 59.7% 11 10.1% 73 69.7% 25.3%
100–199% poverty 188 68 35.9% 31 16.4% 98 52.3% 34.0%
200–399% poverty 318 52 16.3% 32 10.2% 84 26.4% 29.1%
400% or above 290 21 7.3% 12 4.2% 33 11.5% 11.5%
Work hours
Part-time (< 20hours)
43 18 41.4% 4 9.3% 22 50.7% 7.5%
Mid-time (20–34hours)
136 64 46.8% 17 12.2% 80 58.9% 27.7%
40
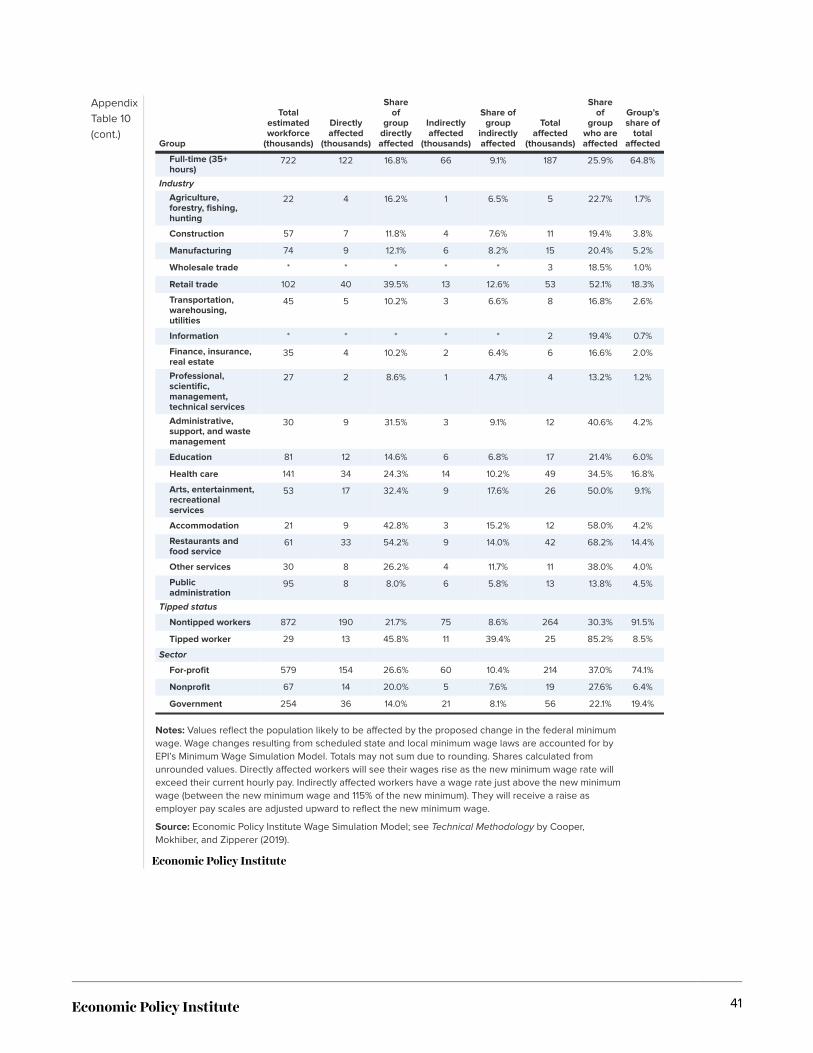
AppendixTable 10(cont.)
Group
Totalestimatedworkforce
(thousands)
Directlyaffected
(thousands)
Shareof
groupdirectlyaffected
Indirectlyaffected
(thousands)
Share ofgroup
indirectlyaffected
Totalaffected
(thousands)
Shareof
groupwho areaffected
Group’sshare of
totalaffected
Full-time (35+hours)
722 122 16.8% 66 9.1% 187 25.9% 64.8%
Industry
Agriculture,forestry, fishing,hunting
22 4 16.2% 1 6.5% 5 22.7% 1.7%
Construction 57 7 11.8% 4 7.6% 11 19.4% 3.8%
Manufacturing 74 9 12.1% 6 8.2% 15 20.4% 5.2%
Wholesale trade * * * * * 3 18.5% 1.0%
Retail trade 102 40 39.5% 13 12.6% 53 52.1% 18.3%
Transportation,warehousing,utilities
45 5 10.2% 3 6.6% 8 16.8% 2.6%
Information * * * * * 2 19.4% 0.7%
Finance, insurance,real estate
35 4 10.2% 2 6.4% 6 16.6% 2.0%
Professional,scientific,management,technical services
27 2 8.6% 1 4.7% 4 13.2% 1.2%
Administrative,support, and wastemanagement
30 9 31.5% 3 9.1% 12 40.6% 4.2%
Education 81 12 14.6% 6 6.8% 17 21.4% 6.0%
Health care 141 34 24.3% 14 10.2% 49 34.5% 16.8%
Arts, entertainment,recreationalservices
53 17 32.4% 9 17.6% 26 50.0% 9.1%
Accommodation 21 9 42.8% 3 15.2% 12 58.0% 4.2%
Restaurants andfood service
61 33 54.2% 9 14.0% 42 68.2% 14.4%
Other services 30 8 26.2% 4 11.7% 11 38.0% 4.0%
Publicadministration
95 8 8.0% 6 5.8% 13 13.8% 4.5%
Tipped status
Nontipped workers 872 190 21.7% 75 8.6% 264 30.3% 91.5%
Tipped worker 29 13 45.8% 11 39.4% 25 85.2% 8.5%
Sector
For-profit 579 154 26.6% 60 10.4% 214 37.0% 74.1%
Nonprofit 67 14 20.0% 5 7.6% 19 27.6% 6.4%
Government 254 36 14.0% 21 8.1% 56 22.1% 19.4%
Notes: Values reflect the population likely to be affected by the proposed change in the federal minimumwage. Wage changes resulting from scheduled state and local minimum wage laws are accounted for byEPI’s Minimum Wage Simulation Model. Totals may not sum due to rounding. Shares calculated fromunrounded values. Directly affected workers will see their wages rise as the new minimum wage rate willexceed their current hourly pay. Indirectly affected workers have a wage rate just above the new minimumwage (between the new minimum wage and 115% of the new minimum). They will receive a raise asemployer pay scales are adjusted upward to reflect the new minimum wage.
Source: Economic Policy Institute Wage Simulation Model; see Technical Methodology by Cooper,Mokhiber, and Zipperer (2019).
41
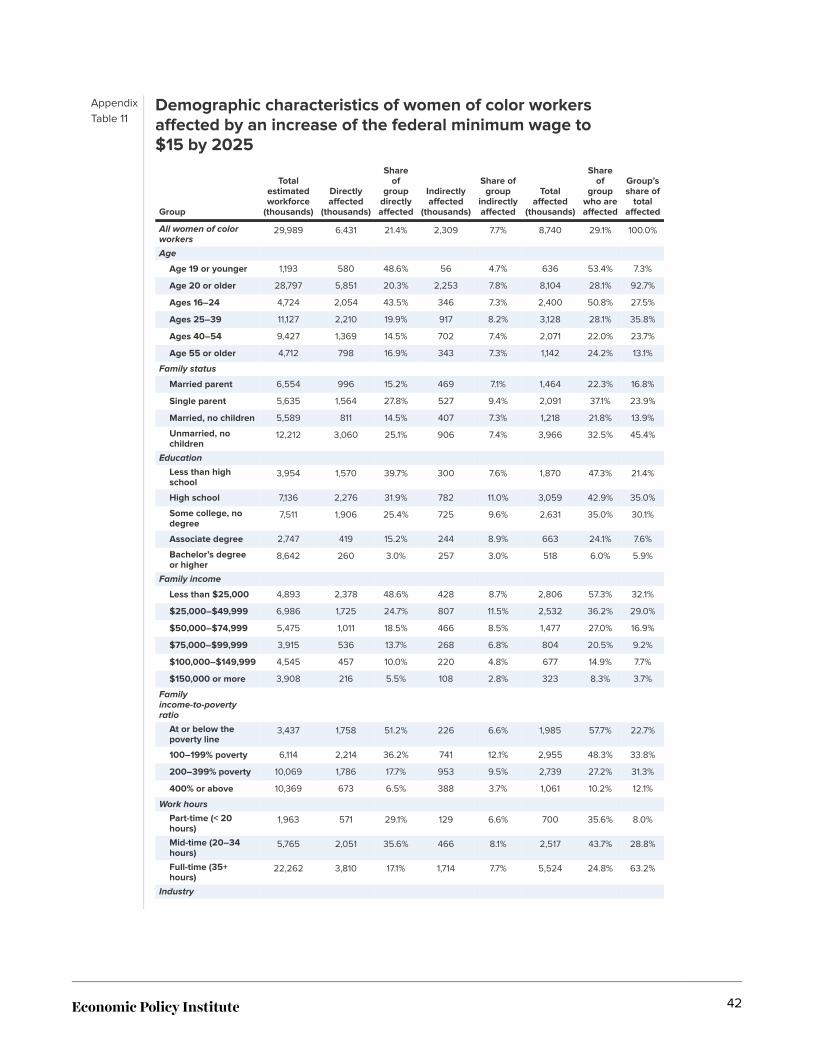
AppendixTable 11
Demographic characteristics of women of color workersaffected by an increase of the federal minimum wage to$15 by 2025
Group
Totalestimatedworkforce
(thousands)
Directlyaffected
(thousands)
Shareof
groupdirectlyaffected
Indirectlyaffected
(thousands)
Share ofgroup
indirectlyaffected
Totalaffected
(thousands)
Shareof
groupwho areaffected
Group’sshare of
totalaffected
All women of colorworkers
29,989 6,431 21.4% 2,309 7.7% 8,740 29.1% 100.0%
Age
Age 19 or younger 1,193 580 48.6% 56 4.7% 636 53.4% 7.3%
Age 20 or older 28,797 5,851 20.3% 2,253 7.8% 8,104 28.1% 92.7%
Ages 16–24 4,724 2,054 43.5% 346 7.3% 2,400 50.8% 27.5%
Ages 25–39 11,127 2,210 19.9% 917 8.2% 3,128 28.1% 35.8%
Ages 40–54 9,427 1,369 14.5% 702 7.4% 2,071 22.0% 23.7%
Age 55 or older 4,712 798 16.9% 343 7.3% 1,142 24.2% 13.1%
Family status
Married parent 6,554 996 15.2% 469 7.1% 1,464 22.3% 16.8%
Single parent 5,635 1,564 27.8% 527 9.4% 2,091 37.1% 23.9%
Married, no children 5,589 811 14.5% 407 7.3% 1,218 21.8% 13.9%
Unmarried, nochildren
12,212 3,060 25.1% 906 7.4% 3,966 32.5% 45.4%
Education
Less than highschool
3,954 1,570 39.7% 300 7.6% 1,870 47.3% 21.4%
High school 7,136 2,276 31.9% 782 11.0% 3,059 42.9% 35.0%
Some college, nodegree
7,511 1,906 25.4% 725 9.6% 2,631 35.0% 30.1%
Associate degree 2,747 419 15.2% 244 8.9% 663 24.1% 7.6%
Bachelor’s degreeor higher
8,642 260 3.0% 257 3.0% 518 6.0% 5.9%
Family income
Less than $25,000 4,893 2,378 48.6% 428 8.7% 2,806 57.3% 32.1%
$25,000–$49,999 6,986 1,725 24.7% 807 11.5% 2,532 36.2% 29.0%
$50,000–$74,999 5,475 1,011 18.5% 466 8.5% 1,477 27.0% 16.9%
$75,000–$99,999 3,915 536 13.7% 268 6.8% 804 20.5% 9.2%
$100,000–$149,999 4,545 457 10.0% 220 4.8% 677 14.9% 7.7%
$150,000 or more 3,908 216 5.5% 108 2.8% 323 8.3% 3.7%
Familyincome-to-povertyratio
At or below thepoverty line
3,437 1,758 51.2% 226 6.6% 1,985 57.7% 22.7%
100–199% poverty 6,114 2,214 36.2% 741 12.1% 2,955 48.3% 33.8%
200–399% poverty 10,069 1,786 17.7% 953 9.5% 2,739 27.2% 31.3%
400% or above 10,369 673 6.5% 388 3.7% 1,061 10.2% 12.1%
Work hours
Part-time (< 20hours)
1,963 571 29.1% 129 6.6% 700 35.6% 8.0%
Mid-time (20–34hours)
5,765 2,051 35.6% 466 8.1% 2,517 43.7% 28.8%
Full-time (35+hours)
22,262 3,810 17.1% 1,714 7.7% 5,524 24.8% 63.2%
Industry
42
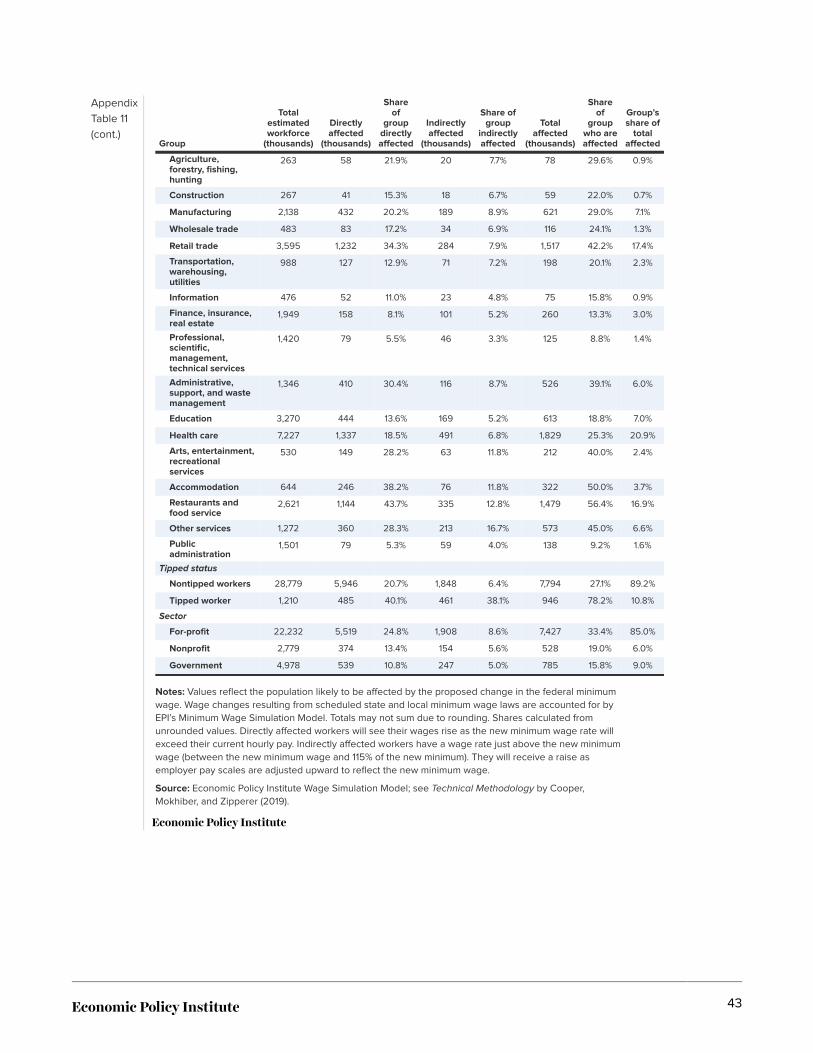
AppendixTable 11(cont.)
Group
Totalestimatedworkforce
(thousands)
Directlyaffected
(thousands)
Shareof
groupdirectlyaffected
Indirectlyaffected
(thousands)
Share ofgroup
indirectlyaffected
Totalaffected
(thousands)
Shareof
groupwho areaffected
Group’sshare of
totalaffected
Agriculture,forestry, fishing,hunting
263 58 21.9% 20 7.7% 78 29.6% 0.9%
Construction 267 41 15.3% 18 6.7% 59 22.0% 0.7%
Manufacturing 2,138 432 20.2% 189 8.9% 621 29.0% 7.1%
Wholesale trade 483 83 17.2% 34 6.9% 116 24.1% 1.3%
Retail trade 3,595 1,232 34.3% 284 7.9% 1,517 42.2% 17.4%
Transportation,warehousing,utilities
988 127 12.9% 71 7.2% 198 20.1% 2.3%
Information 476 52 11.0% 23 4.8% 75 15.8% 0.9%
Finance, insurance,real estate
1,949 158 8.1% 101 5.2% 260 13.3% 3.0%
Professional,scientific,management,technical services
1,420 79 5.5% 46 3.3% 125 8.8% 1.4%
Administrative,support, and wastemanagement
1,346 410 30.4% 116 8.7% 526 39.1% 6.0%
Education 3,270 444 13.6% 169 5.2% 613 18.8% 7.0%
Health care 7,227 1,337 18.5% 491 6.8% 1,829 25.3% 20.9%
Arts, entertainment,recreationalservices
530 149 28.2% 63 11.8% 212 40.0% 2.4%
Accommodation 644 246 38.2% 76 11.8% 322 50.0% 3.7%
Restaurants andfood service
2,621 1,144 43.7% 335 12.8% 1,479 56.4% 16.9%
Other services 1,272 360 28.3% 213 16.7% 573 45.0% 6.6%
Publicadministration
1,501 79 5.3% 59 4.0% 138 9.2% 1.6%
Tipped status
Nontipped workers 28,779 5,946 20.7% 1,848 6.4% 7,794 27.1% 89.2%
Tipped worker 1,210 485 40.1% 461 38.1% 946 78.2% 10.8%
Sector
For-profit 22,232 5,519 24.8% 1,908 8.6% 7,427 33.4% 85.0%
Nonprofit 2,779 374 13.4% 154 5.6% 528 19.0% 6.0%
Government 4,978 539 10.8% 247 5.0% 785 15.8% 9.0%
Notes: Values reflect the population likely to be affected by the proposed change in the federal minimumwage. Wage changes resulting from scheduled state and local minimum wage laws are accounted for byEPI’s Minimum Wage Simulation Model. Totals may not sum due to rounding. Shares calculated fromunrounded values. Directly affected workers will see their wages rise as the new minimum wage rate willexceed their current hourly pay. Indirectly affected workers have a wage rate just above the new minimumwage (between the new minimum wage and 115% of the new minimum). They will receive a raise asemployer pay scales are adjusted upward to reflect the new minimum wage.
Source: Economic Policy Institute Wage Simulation Model; see Technical Methodology by Cooper,Mokhiber, and Zipperer (2019).
43