Embed Size (px)
DESCRIPTION
Rainfall Thresholds for the Occurrence of Debris Flows in the Jiangjia Gully Yunnan Province China
Citation preview
Engineering Geology xxx (2015) xxx–xxx
ENGEO-04075; No of Pages 12
Contents lists available at ScienceDirect
Engineering Geology
j ourna l homepage: www.e lsev ie r .com/ locate /enggeo
Rainfall thresholds for the occurrence of debris flows in the Jiangjia Gully, YunnanProvince, China
Jianqi Zhuang a,b,⁎, Peng Cui c, Gonghui Wang d, Xiaoqing Chen c, Javed Iqbal e, Xiaojun Guo c
a School of Geological Engineering and Surveying of Chang'an University, Key Laboratory of Western China Mineral Resources and Geological Engineering, Xi'an 710054, Chinab Institute of Geo-hazards Mitigation of Chang'an University, Xi'an 710054, Chinac Institute of Mountain hazards and Environment, CAS, Chengdu 610064, Chinad Research Centre on Landslides, Disaster Prevention Research Institute, Kyoto University, Gokasho, Uji, Kyoto 611-0011, Japane Department of Earth Sciences, COMSATS Institute of Information Technology, Abbottabad, Pakistan
⁎ Corresponding author at: Institute of Geo-hazards MiXi'an 710054, China.
http://dx.doi.org/10.1016/j.enggeo.2015.06.0060013-7952/Crown Copyright © 2015 Published by Elsevie
Please cite this article as: Zhuang, J., et al., RaiGeol. (2015), http://dx.doi.org/10.1016/j.eng
a b s t r a c t
a r t i c l e i n f oArticle history:Received 24 September 2014Received in revised form 10 June 2015Accepted 14 June 2015Available online xxxx
Keywords:Debris flowPredictionRainfall thresholdsJiangjia Gully
The Jiangjia Gully (JJG), Yunnan Province, China, is one of several debris flow gullies that characterize the topog-raphy ofmountainous areas in China. Rainfall-triggered debris flows are frequent in the JJG. In order tomodel andpredict these debris flow occurrences, we analyzed precipitation parameters (including intensity–durationthresholds and rainfall event–duration thresholds) that triggered past debris flow events in the JJG. Since theJJG is unique, any model used for predicting debris flows in this gully must be developed using data from onlythis gully. Furthermore, the effects of normalized precipitation and antecedent precipitation on debris flows inthe JJG were considered. Debris flow data and precipitation data were compiled from 47 debris flow events in1993, 1994, 1998–2001, 2004 and 2006 in JJG. All of these debris flows were triggered following a precipitationevent with a duration of 6 h or less, with most of the precipitation events exhibiting a duration of 3 to 6 h. Onlythree rainfall events with a duration of less than 1 h and average intensity between 1.0 and 42.0 mm/h produceddebris flows. The 90%, 70% and 50% probability curves for debris flow events were then constructed. Intensity–duration (I–D) and rainfall event–duration (RE–D) thresholds were then used for debris flow modeling basedon preliminary tests and comparisons. Antecedent precipitation was found not to be a significant factor in trig-gering debris flows in the JJG; however, intraday precipitation played a significant role. Normalized precipitationthreshold curves from adjacent areas were not well-correlatedwith the patterns observed in the JJG. Determina-tion of unique thresholds for each gully is necessary for developing an effective prediction system.
Crown Copyright © 2015 Published by Elsevier B.V. All rights reserved.
1. Introduction
Debris flows occur in various mountainous regions around theworld,with effects on local economies, as well as on life and infrastructure (e.g.dams, roads) in nearby counties and villages. They are characterized bymass densities ranging from 1.3 to 2.3 t/m3, speeds of 3 to 15 m/s, flowdischarges from tens to thousands of times the normal stream flow inthe region, and a wide range in particle diameters, from 10−6 m to10 m (Cui et al., 2005; Zhuang et al., 2010). Rainfall, especially that fromshort duration rainstorms, has been identified to be one of the mostimportant factors responsible for triggering debris flows (Wieczorekand Guzzetti, 1999; Cui et al., 2005; Chen et al., 2006a,2006b; Guzzettiet al., 2007, 2008; Zhuang et al., 2009; Shieh et al., 2009; Floris et al.,2010; Cannon et al., 2011; Li et al., 2011; Hu et al., 2011; Guo et al.,2013). Therefore, it is vital to forecast the occurrence of such flows anddevelop effective warning systems based on the relationships betweenprecipitation and debris flow events (Crosta, 1998; Aleotti, 2004;
tigation of Chang'an University,
r B.V. All rights reserved.
nfall thresholds for the occurrgeo.2015.06.006
Guzzetti et al., 2007, 2008; Baum and Godt, 2010; Engel et al., 2011;Jakob et al., 2012). Many researchers have attempted to correlaterainfall/precipitation with debris flows (Wieczorek and Guzzetti, 1999;Guzzetti et al., 2008). Accordingly, many critical thresholds and modelsfor debris flow initiation have been suggested using different precipita-tion parameters, such as precipitation duration–precipitation intensity(I–D model) (Cannon et al., 2008, 2011), antecedent rainfall–cumulativerainfall (AR–R model) (Wieczorek and Guzzetti, 1999), antecedenteffective rainfall–cumulative rainfall (AER–R model) (Baum and Godt,2010), maximum hourly rainfall intensity–cumulative rainfall (Imax–Rmodel) (Guzzetti et al., 2007, 2008), normalized rainfall–cumulative rain-fall (Inorm–Rmodel) (Guzzetti et al., 2008), and daily rainfall–maximumhourly rainfall intensity (Imax–Rd model) (Guzzetti et al., 2007, 2008).The effective critical threshold for a precipitation-induced landslidemust take into account the local topography, geology, debris characteris-tics (distribution, volume and soil strength) and hydrogeological parame-ters (Cannon, 1988; Guzzetti et al., 2007, 2008; Cannon et al., 2008; BaumandGodt, 2010; Cannonet al., 2011). Among the critical thresholdmodelsthat have been proposed by researchers around the world, the corre-sponding rainfall durations/intensities differ by up to three orders of
ence of debris flows in the Jiangjia Gully, Yunnan Province, China, Eng.
2 J. Zhuang et al. / Engineering Geology xxx (2015) xxx–xxx
magnitude between certain models (Guzzetti et al., 2007, 2008). Evenwithin the same geographical zone, there can exist differences in rainfallduration and/or intensity of up to one order of magnitude; this variationarises from rainfall sampling resolution, and physiographical, geologicalor geomorphological differences. In other words, a limitation of regionalor even local precipitation thresholds is the fact that thresholds definedfor a particular area cannot be easily implemented for assessing surround-ing areas, including some areas that possess similar environmental condi-tions (Crosta and Frattini, 2008; Crosta, 1998).
The most common precipitation parameters used in determiningcritical thresholds for debris flows are antecedent rainfall, antecedenteffective rainfall, precipitation duration, precipitation intensity, cumula-tive rainfall, maximumhourly rainfall intensity, normalized rainfall, anddaily rainfall (Guzzetti et al., 2008). Rainfall thresholds can be groupedinto two broad categories; (i) empirical threshold, which uses historicaldebris flow and precipitation data (Guzzetti et al., 2007, 2008; Baumand Godt, 2010; Zhuang et al., 2014); (ii) physical threshold, whichemploys a hydro-mechanical model of debris flow occurrences(Takahashi, 1991; Cui, 1992; Iverson, 1997). Several decades of researchon debris flow initiation processes suggests that the former method ismore extensively used worldwide (Guzzetti et al., 2007; Baum andGodt, 2010). Empirical rainfall thresholds are defined by measuringrainfall events that have resulted in debris flows; the most commonlyused units of measurement for the parameters of these rainfall eventsinclude: (i) Intraday rainfall and antecedent effective rainfall (Tan andDuan, 1995; Wei et al., 2005; Cui et al., 2008; Zhuang et al., 2014), (ii)rainfall intensity–duration thresholds (Godt et al., 2006; Guzzettiet al., 2007; Cannon et al., 2008), (iii) cumulative rainfall event–durationthresholds (Kanji et al., 2003; Aleotti, 2004; Giannecchini, 2005), (iv)cumulative rainfall event–average rainfall intensity thresholds(Heyerdahl et al., 2003; Hong et al., 2005), and (v) other thresholds,including normalized cumulative rainfall events and normalized rainfallintensity (Cannon, 1988; Jibson, 1989; De Vita et al., 1998; Jakob andWeatherly, 2003). Numerous studies have analyzed the empiricalrelationship between rainfall and debris flow occurrences, proposingvarious critical thresholds and equations for different regions. For exam-ple, studies were conducted near San Francisco, CA, USA (Baum andGodt, 2010), wildfire-prone areas in the western USA (Cannon et al.,2008), the Alps in Europe (Guzzetti et al., 2007), Taiwan (Chen et al.,2006a, 2006b; Shieh et al., 2009; Kung et al., 2012), Hong Kong (Chanet al., 2003) and the Xiaojiang–Anning river basin in China (Tan andDuan, 1995;Wei et al., 2005; Cui et al., 2008; Hu et al., 2010). However,the agencies responsible for implementing safety protocols generally
0
5
10
15
20
25
30
1965 1970 1975 1980 1985
ecnerruccowolf
sirbedfo
rebme
N
Year
Number of debris flow
Sediment transport
Fig. 1. The number of debris flow events and annual sediment transport by
Please cite this article as: Zhuang, J., et al., Rainfall thresholds for the occurrGeol. (2015), http://dx.doi.org/10.1016/j.enggeo.2015.06.006
lack the necessary resources for the provision of continuous supportor expansion of services to other areas due to variation in local geolog-ical conditions.
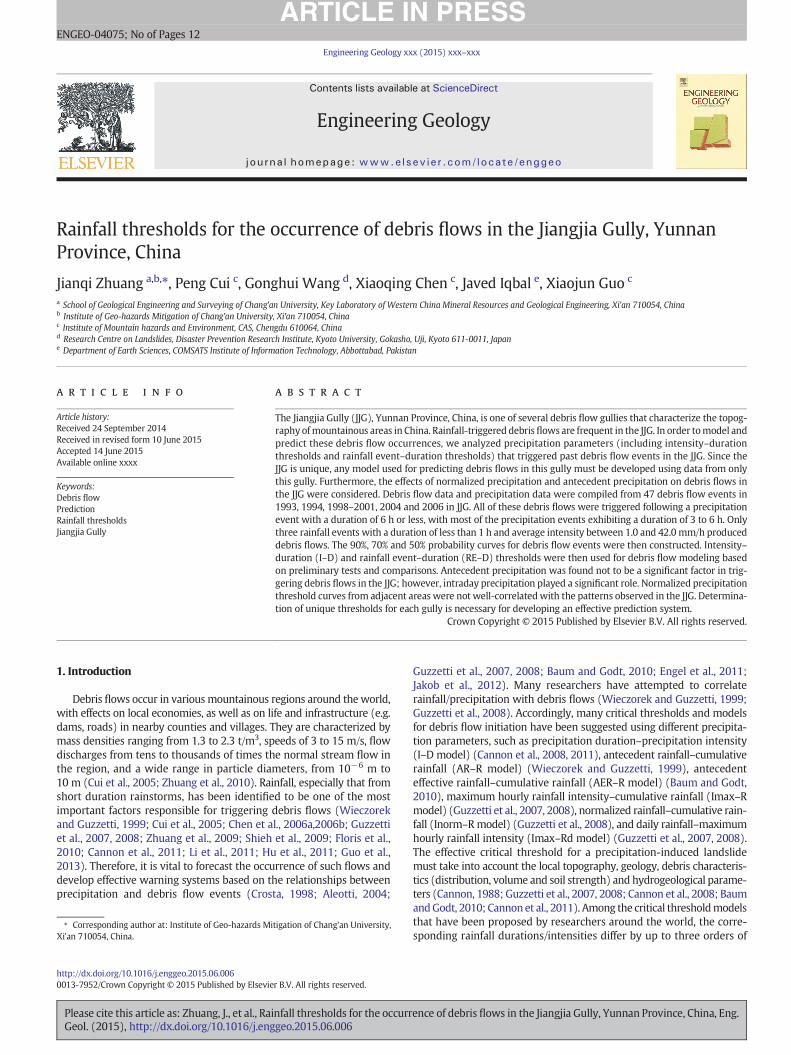
Rainfall-induced debris flows are relatively common in the JiangjiaGully (JJG), Yunnan Province, China. Located in mountainous south-western China, the debris flows in this gully are fairly typical of thosethat occur in other mountainous areas in China. Regular observationsand systematic data collection of debris flows in JJG have been conduct-ed by the Institute ofMountainHazards and Environment at the ChineseAcademy of Sciences since 1965. Typically, 10 to 20 min of high-intensity rainfall can initiate a debris flow from shallow landslides inthis gully, with an average debris flow density of 2.0 t/m3 (Kang et al.,2004; Cui et al., 2005). This is due to the presence of complex geologicalstructures, fragile rock formations, numerous shallow landslides, andabundant rainfall in the gully. During every rainy season (May–Octo-ber), about 12–20 debris flows occur in the region (Fig. 1). Severalprediction models have been proposed with respect to the JJG basedon intraday rainfall (Wei et al., 2005; Cui et al., 2008) and antecedent10-min rainfall (Wu et al., 1990; Guo et al., 2013) before debris flowoccurrences, but none of them have demonstrated acceptable accuracy.Meanwhile it is still unclear what the most influential rainfall parame-ters (antecedent rainfall, intraday rainfall and rainfall intensity) are, interms of the triggering of debris flows. In this study, we developedprediction models using different rainfall parameters and methods,and then validated the models using actual debris flow events. Basedon this, the influences of different rainfall parameters on debris flowoccurrence are discussed.
In order to forecast debris flows in the JJG, the characteristics of pastprecipitation events that triggered debris flows in the gully wereanalyzed to construct a comprehensive precipitation threshold model,including both I–D and RE–D models. Data was obtained fromDCDFORS (Dongchuan Debris Flow Observation and Research Station,located in Yunnan Province, China; Fig. 2). Finally, the effects of differentprecipitation parameters on debris flow occurrences are discussed.
2. Geological setting of the study area
The Jiangjia Gully is a tributary of the Xiaojiang River, which has 106other tributaries that are also subject to debris flows. The watershed ofthe Xiaojiang River is colloquially known in China as the “World'sNatural Museum of Debris Flows” (Cui et al., 2005). The drainagebasin intersects the Xiaojiang River at a distance of 31 km south of thejunction of the Xiaojiang River and the Jinsha River. The JJG has a
0
100
200
300
400
500
600
700
1990 1995 2000 2005
Sed
imen
t tra
nspo
rt / ×
104 m
3
debris flows during an average rainy season in the JJG, Yunnan, China.
ence of debris flows in the Jiangjia Gully, Yunnan Province, China, Eng.
Observation Section
Dongchuan Precipitation Observing Station and Dongchuan Debris Flow Observation and Research Station
Wanfangzi Precipitation Observing Station
Chenjialiangzi Precipitation Observing Station
Mayiping Precipitation Observing Station
Yinjiaao Precipitation Observing Station
Soil water content monitor site
Soil infiltration test site
High: 3177.2 m
Low: 1295.1 m
Beijing
Yellow RiverFirst terrace
Third-terrace
YangtzeRiver
Second-terrace
Kunming
Fig. 2.Map of the study area and the observation site (a: location of the JJG in China; b: observation area of the JJG; c: debris flow event locations; d: watershed of the JJG and observationstations).
3J. Zhuang et al. / Engineering Geology xxx (2015) xxx–xxx
trunk channel length of 13.9 km and covers a total area of 48.6 km2. It islocatedwithin theXiaojiang fault zone innortheastern YunnanProvincein Southwest China (N23°13′–23°17′, E103°6′–103°13′).
The study area is characterized by intense tectonism; about 80% ofthe exposed rocks are highly fractured and slightly metamorphosed.The predominant sandstone and slate can be easily differentiated by
Rainfaevent
Rainfaduratio
Antecedent precipitation
The interval time of no precipitation is more than 3 hours
Time
Precipita
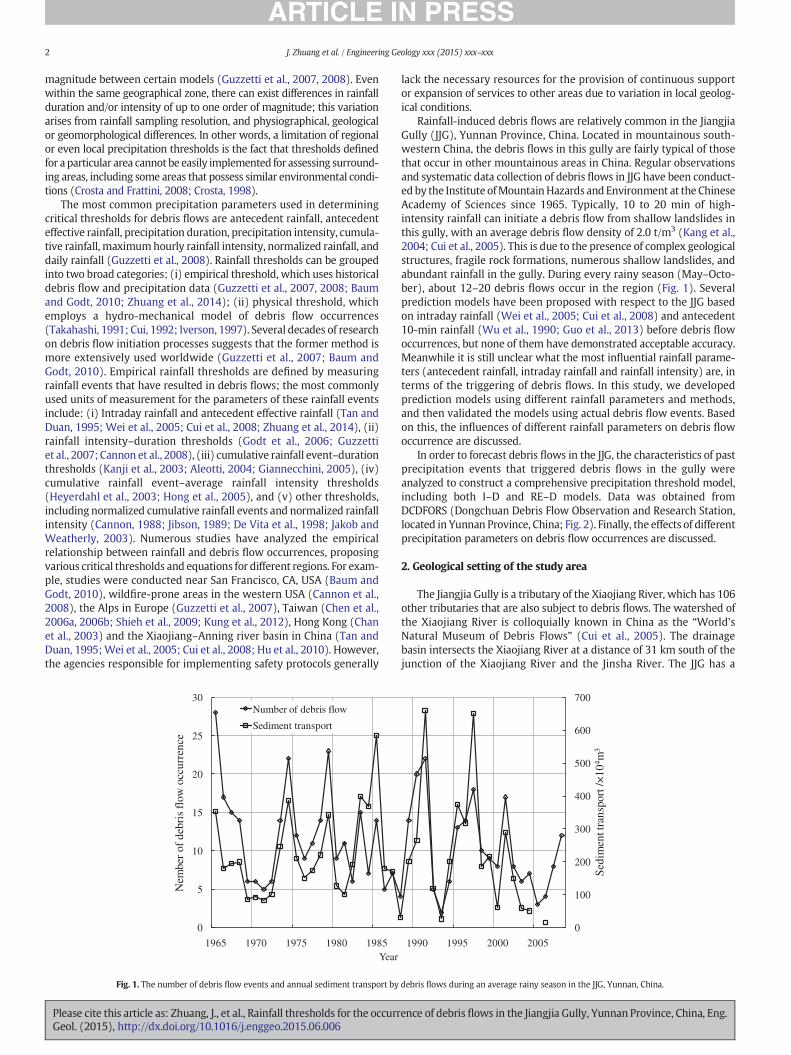
Fig. 3. List of the main precipitation items th
Please cite this article as: Zhuang, J., et al., Rainfall thresholds for the occurrGeol. (2015), http://dx.doi.org/10.1016/j.enggeo.2015.06.006
their color (light and dark, respectively). Both rock types are weak,and easily weathered and fragmented. Colluvium is widely distributedon slopes, which provide materials for shallow landslides. The totalcumulative volume of clastic detritus, which acts as potential sourcematerial for future debris flows, is estimated to be 1.2 × 10⁹ m3 (Wuet al., 1990). The main stream extends from the drainage basin at an
The time of the debris flow occurrence
ll
ll n
Precipitation
tion
at contribute to debris flow formation.
ence of debris flows in the Jiangjia Gully, Yunnan Province, China, Eng.
4 J. Zhuang et al. / Engineering Geology xxx (2015) xxx–xxx
altitude of 3269 m, westwards to the junction with the Xiaojiang Riverat an altitude of 1042 m. Slopes steeper than 25° comprise 55% of thebasin area, with an altitude difference of 500m (Wu et al., 1990) (Fig. 2).
During every rainy season (May–October), when 85% of the annualprecipitation falls, about 12–20 debris flows occur in the region. Therecord for the highest annual number of events was 28 in 1965. In1961, DCDFORS was established with the cooperation of the Instituteof Mountain Hazards and Environment at the Chinese Academy ofSciences. Since 1987, regular observations and systematic data collec-tion on debris flows have been conducted.
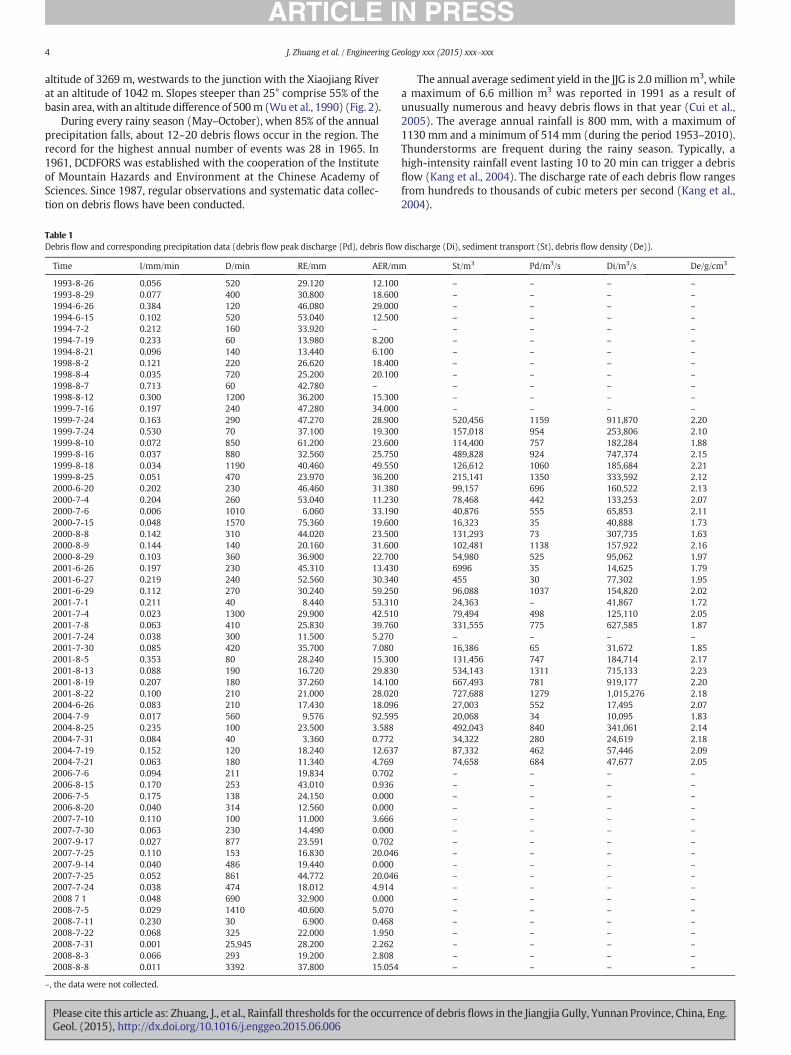
Table 1Debris flow and corresponding precipitation data (debris flow peak discharge (Pd), debris flow
Time I/mm/min D/min RE/mm AER/m
1993-8-26 0.056 520 29.120 12.1001993-8-29 0.077 400 30.800 18.6001994-6-26 0.384 120 46.080 29.0001994-6-15 0.102 520 53.040 12.5001994-7-2 0.212 160 33.920 –1994-7-19 0.233 60 13.980 8.2001994-8-21 0.096 140 13.440 6.1001998-8-2 0.121 220 26.620 18.4001998-8-4 0.035 720 25.200 20.1001998-8-7 0.713 60 42.780 –1998-8-12 0.300 1200 36.200 15.3001999-7-16 0.197 240 47.280 34.0001999-7-24 0.163 290 47.270 28.9001999-7-24 0.530 70 37.100 19.3001999-8-10 0.072 850 61.200 23.6001999-8-16 0.037 880 32.560 25.7501999-8-18 0.034 1190 40.460 49.5501999-8-25 0.051 470 23.970 36.2002000-6-20 0.202 230 46.460 31.3802000-7-4 0.204 260 53.040 11.2302000-7-6 0.006 1010 6.060 33.1902000-7-15 0.048 1570 75.360 19.6002000-8-8 0.142 310 44.020 23.5002000-8-9 0.144 140 20.160 31.6002000-8-29 0.103 360 36.900 22.7002001-6-26 0.197 230 45.310 13.4302001-6-27 0.219 240 52.560 30.3402001-6-29 0.112 270 30.240 59.2502001-7-1 0.211 40 8.440 53.3102001-7-4 0.023 1300 29.900 42.5102001-7-8 0.063 410 25.830 39.7602001-7-24 0.038 300 11.500 5.2702001-7-30 0.085 420 35.700 7.0802001-8-5 0.353 80 28.240 15.3002001-8-13 0.088 190 16.720 29.8302001-8-19 0.207 180 37.260 14.1002001-8-22 0.100 210 21.000 28.0202004-6-26 0.083 210 17.430 18.0962004-7-9 0.017 560 9.576 92.5952004-8-25 0.235 100 23.500 3.5882004-7-31 0.084 40 3.360 0.7722004-7-19 0.152 120 18.240 12.6372004-7-21 0.063 180 11.340 4.7692006-7-6 0.094 211 19.834 0.7022006-8-15 0.170 253 43.010 0.9362006-7-5 0.175 138 24.150 0.0002006-8-20 0.040 314 12.560 0.0002007-7-10 0.110 100 11.000 3.6662007-7-30 0.063 230 14.490 0.0002007-9-17 0.027 877 23.591 0.7022007-7-25 0.110 153 16.830 20.0462007-9-14 0.040 486 19.440 0.0002007-7-25 0.052 861 44.772 20.0462007-7-24 0.038 474 18.012 4.9142008 7 1 0.048 690 32.900 0.0002008-7-5 0.029 1410 40.600 5.0702008-7-11 0.230 30 6.900 0.4682008-7-22 0.068 325 22.000 1.9502008-7-31 0.001 25,945 28.200 2.2622008-8-3 0.066 293 19.200 2.8082008-8-8 0.011 3392 37.800 15.054
–, the data were not collected.
Please cite this article as: Zhuang, J., et al., Rainfall thresholds for the occurrGeol. (2015), http://dx.doi.org/10.1016/j.enggeo.2015.06.006
The annual average sediment yield in the JJG is 2.0 million m3, whilea maximum of 6.6 million m3 was reported in 1991 as a result ofunusually numerous and heavy debris flows in that year (Cui et al.,2005). The average annual rainfall is 800 mm, with a maximum of1130 mm and a minimum of 514 mm (during the period 1953–2010).Thunderstorms are frequent during the rainy season. Typically, ahigh-intensity rainfall event lasting 10 to 20 min can trigger a debrisflow (Kang et al., 2004). The discharge rate of each debris flow rangesfrom hundreds to thousands of cubic meters per second (Kang et al.,2004).
discharge (Di), sediment transport (St), debris flow density (De)).
m St/m3 Pd/m3/s Di/m3/s De/g/cm3
– – – –– – – –– – – –– – – –– – – –– – – –– – – –– – – –– – – –– – – –– – – –– – – –520,456 1159 911,870 2.20157,018 954 253,806 2.10114,400 757 182,284 1.88489,828 924 747,374 2.15126,612 1060 185,684 2.21215,141 1350 333,592 2.1299,157 696 160,522 2.1378,468 442 133,253 2.0740,876 555 65,853 2.1116,323 35 40,888 1.73131,293 73 307,735 1.63102,481 1138 157,922 2.1654,980 525 95,062 1.976996 35 14,625 1.79455 30 77,302 1.9596,088 1037 154,820 2.0224,363 – 41,867 1.7279,494 498 125,110 2.05331,555 775 627,585 1.87– – – –16,386 65 31,672 1.85131,456 747 184,714 2.17534,143 1311 715,133 2.23667,493 781 919,177 2.20727,688 1279 1,015,276 2.1827,003 552 17,495 2.0720,068 34 10,095 1.83492,043 840 341,061 2.1434,322 280 24,619 2.1887,332 462 57,446 2.0974,658 684 47,677 2.05– – – –– – – –– – – –– – – –– – – –– – – –– – – –– – – –– – – –– – – –– – – –– – – –– – – –– – – –– – – –– – – –– – – –– – – –
ence of debris flows in the Jiangjia Gully, Yunnan Province, China, Eng.
0.1
1.0
10.0
100.0
0.1 1.0 10.0 100.0
Curve 90%
Curve 70%
Curve 50%
D
A
B
CInte
nsity
(m
m/h
)
Duration (h)
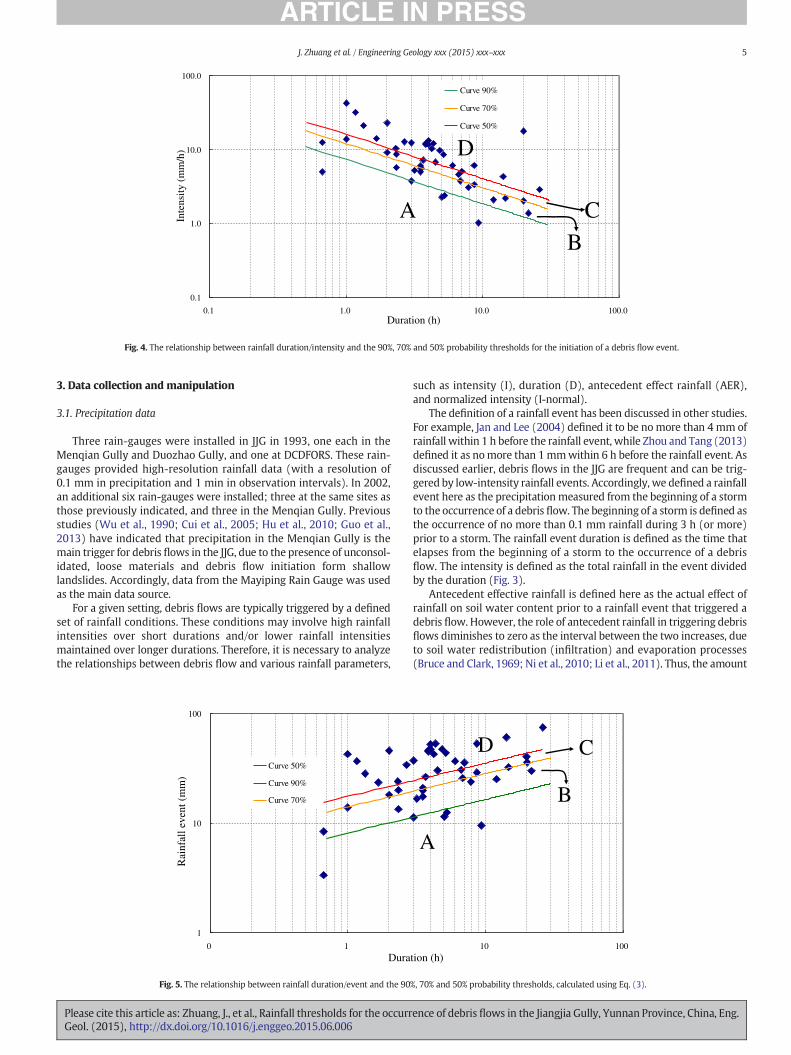
Fig. 4. The relationship between rainfall duration/intensity and the 90%, 70% and 50% probability thresholds for the initiation of a debris flow event.
5J. Zhuang et al. / Engineering Geology xxx (2015) xxx–xxx
3. Data collection and manipulation
3.1. Precipitation data
Three rain-gauges were installed in JJG in 1993, one each in theMenqian Gully and Duozhao Gully, and one at DCDFORS. These rain-gauges provided high-resolution rainfall data (with a resolution of0.1 mm in precipitation and 1 min in observation intervals). In 2002,an additional six rain-gauges were installed; three at the same sites asthose previously indicated, and three in the Menqian Gully. Previousstudies (Wu et al., 1990; Cui et al., 2005; Hu et al., 2010; Guo et al.,2013) have indicated that precipitation in the Menqian Gully is themain trigger for debris flows in the JJG, due to the presence of unconsol-idated, loose materials and debris flow initiation form shallowlandslides. Accordingly, data from the Mayiping Rain Gauge was usedas the main data source.
For a given setting, debris flows are typically triggered by a definedset of rainfall conditions. These conditions may involve high rainfallintensities over short durations and/or lower rainfall intensitiesmaintained over longer durations. Therefore, it is necessary to analyzethe relationships between debris flow and various rainfall parameters,
1
10
100
0 1
Curve 50%
Curve 90%
Curve 70%
Rai
nfal
l eve
nt (
mm
)
Dura
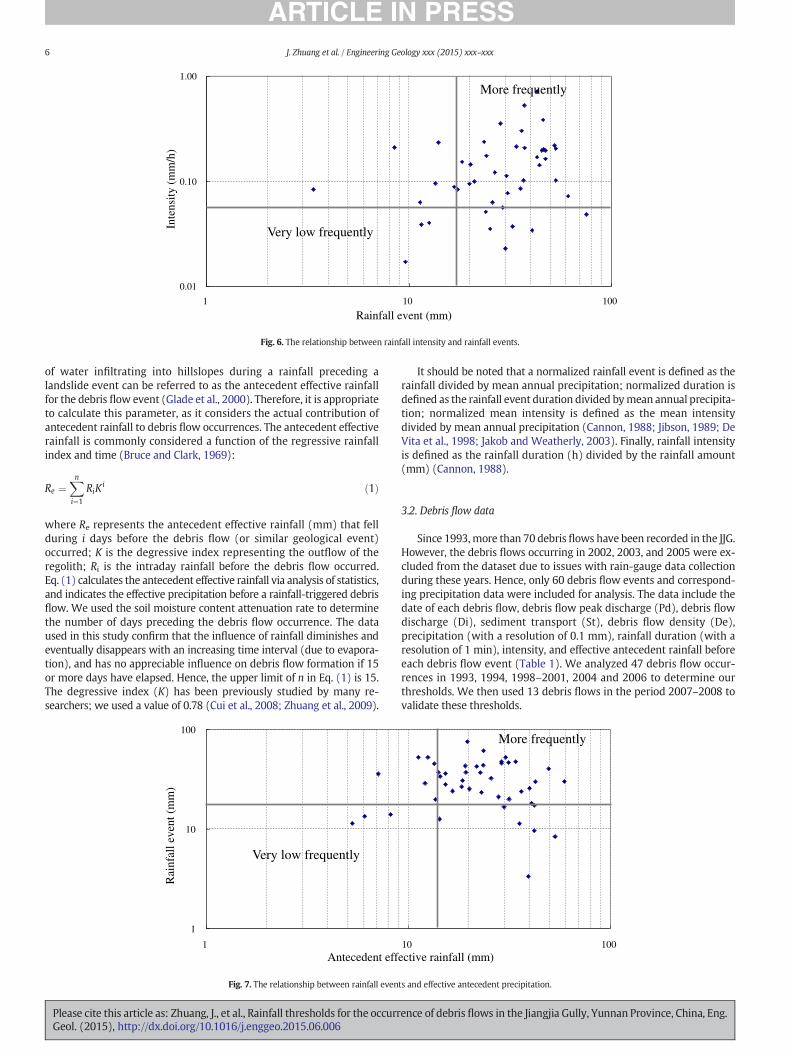
Fig. 5. The relationship between rainfall duration/event and the 90
Please cite this article as: Zhuang, J., et al., Rainfall thresholds for the occurrGeol. (2015), http://dx.doi.org/10.1016/j.enggeo.2015.06.006
such as intensity (I), duration (D), antecedent effect rainfall (AER),and normalized intensity (I-normal).
The definition of a rainfall event has been discussed in other studies.For example, Jan and Lee (2004) defined it to be nomore than 4 mm ofrainfall within 1 h before the rainfall event, while Zhou and Tang (2013)defined it as nomore than 1mmwithin 6 h before the rainfall event. Asdiscussed earlier, debris flows in the JJG are frequent and can be trig-gered by low-intensity rainfall events. Accordingly, we defined a rainfallevent here as the precipitationmeasured from the beginning of a stormto the occurrence of a debris flow. The beginning of a storm is defined asthe occurrence of no more than 0.1 mm rainfall during 3 h (or more)prior to a storm. The rainfall event duration is defined as the time thatelapses from the beginning of a storm to the occurrence of a debrisflow. The intensity is defined as the total rainfall in the event dividedby the duration (Fig. 3).
Antecedent effective rainfall is defined here as the actual effect ofrainfall on soil water content prior to a rainfall event that triggered adebris flow. However, the role of antecedent rainfall in triggering debrisflows diminishes to zero as the interval between the two increases, dueto soil water redistribution (infiltration) and evaporation processes(Bruce and Clark, 1969; Ni et al., 2010; Li et al., 2011). Thus, the amount
10 100
D
A
B
C
tion (h)
%, 70% and 50% probability thresholds, calculated using Eq. (3).
ence of debris flows in the Jiangjia Gully, Yunnan Province, China, Eng.
0.01
0.10
1.00
1 10 100
More frequently
Very low frequently Inte
nsity
(m
m/h
)
Rainfall event (mm)
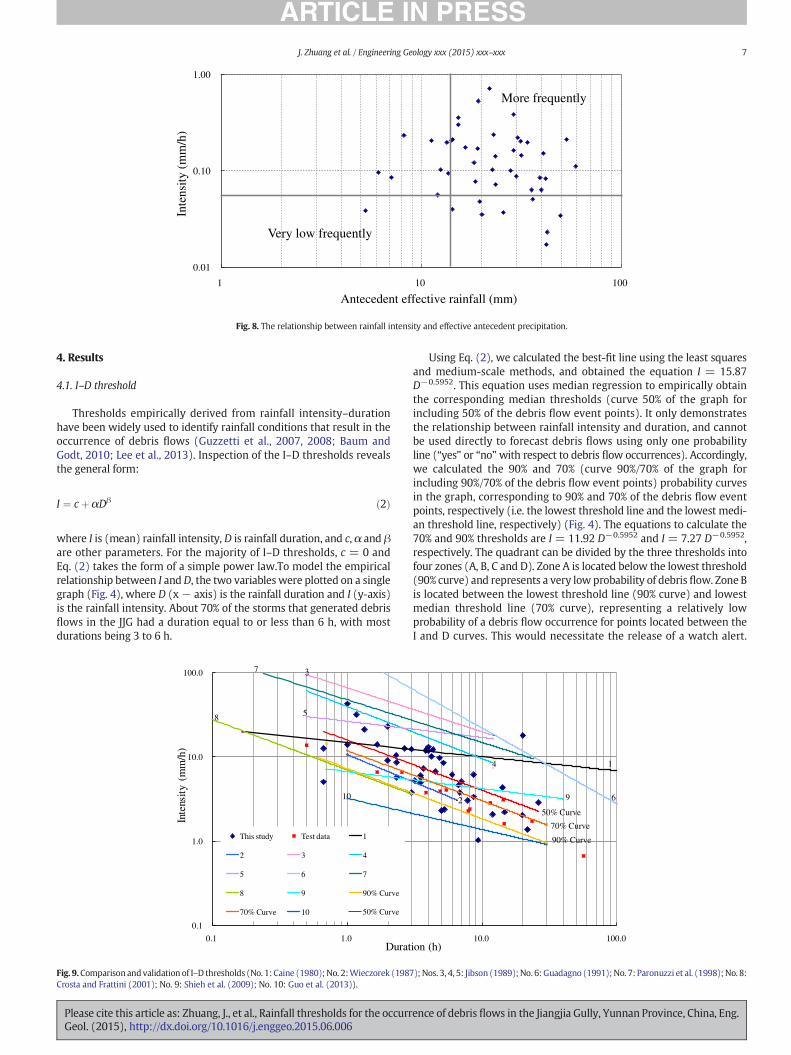
Fig. 6. The relationship between rainfall intensity and rainfall events.
6 J. Zhuang et al. / Engineering Geology xxx (2015) xxx–xxx
of water infiltrating into hillslopes during a rainfall preceding alandslide event can be referred to as the antecedent effective rainfallfor the debris flow event (Glade et al., 2000). Therefore, it is appropriateto calculate this parameter, as it considers the actual contribution ofantecedent rainfall to debris flow occurrences. The antecedent effectiverainfall is commonly considered a function of the regressive rainfallindex and time (Bruce and Clark, 1969):
Re ¼Xn
i¼1
RiKi ð1Þ
where Re represents the antecedent effective rainfall (mm) that fellduring i days before the debris flow (or similar geological event)occurred; K is the degressive index representing the outflow of theregolith; Ri is the intraday rainfall before the debris flow occurred.Eq. (1) calculates the antecedent effective rainfall via analysis of statistics,and indicates the effective precipitation before a rainfall-triggered debrisflow. We used the soil moisture content attenuation rate to determinethe number of days preceding the debris flow occurrence. The dataused in this study confirm that the influence of rainfall diminishes andeventually disappears with an increasing time interval (due to evapora-tion), and has no appreciable influence on debris flow formation if 15or more days have elapsed. Hence, the upper limit of n in Eq. (1) is 15.The degressive index (K) has been previously studied by many re-searchers; we used a value of 0.78 (Cui et al., 2008; Zhuang et al., 2009).
1
10
100
1
Very low frequently
Antecedent eff
Rai
nfal
l eve
nt (
mm
)
Fig. 7. The relationship between rainfall even
Please cite this article as: Zhuang, J., et al., Rainfall thresholds for the occurrGeol. (2015), http://dx.doi.org/10.1016/j.enggeo.2015.06.006
It should be noted that a normalized rainfall event is defined as therainfall divided by mean annual precipitation; normalized duration isdefined as the rainfall event duration divided bymean annual precipita-tion; normalized mean intensity is defined as the mean intensitydivided by mean annual precipitation (Cannon, 1988; Jibson, 1989; DeVita et al., 1998; Jakob and Weatherly, 2003). Finally, rainfall intensityis defined as the rainfall duration (h) divided by the rainfall amount(mm) (Cannon, 1988).
3.2. Debris flow data
Since 1993,more than 70 debris flows have been recorded in the JJG.However, the debris flows occurring in 2002, 2003, and 2005 were ex-cluded from the dataset due to issues with rain-gauge data collectionduring these years. Hence, only 60 debris flow events and correspond-ing precipitation data were included for analysis. The data include thedate of each debris flow, debris flow peak discharge (Pd), debris flowdischarge (Di), sediment transport (St), debris flow density (De),precipitation (with a resolution of 0.1 mm), rainfall duration (with aresolution of 1 min), intensity, and effective antecedent rainfall beforeeach debris flow event (Table 1). We analyzed 47 debris flow occur-rences in 1993, 1994, 1998–2001, 2004 and 2006 to determine ourthresholds. We then used 13 debris flows in the period 2007–2008 tovalidate these thresholds.
10 100
More frequently
ective rainfall (mm)
ts and effective antecedent precipitation.
ence of debris flows in the Jiangjia Gully, Yunnan Province, China, Eng.
0.01
0.10
1.00
1 10 100
More frequently
Very low frequently
Antecedent effective rainfall (mm)
Inte
nsity
(m
m/h
)
Fig. 8. The relationship between rainfall intensity and effective antecedent precipitation.
7J. Zhuang et al. / Engineering Geology xxx (2015) xxx–xxx
4. Results
4.1. I–D threshold
Thresholds empirically derived from rainfall intensity–durationhave been widely used to identify rainfall conditions that result in theoccurrence of debris flows (Guzzetti et al., 2007, 2008; Baum andGodt, 2010; Lee et al., 2013). Inspection of the I–D thresholds revealsthe general form:
I ¼ cþ αDβ ð2Þ
where I is (mean) rainfall intensity, D is rainfall duration, and c, α and βare other parameters. For the majority of I–D thresholds, c = 0 andEq. (2) takes the form of a simple power law.To model the empiricalrelationship between I andD, the two variableswere plotted on a singlegraph (Fig. 4), where D (x− axis) is the rainfall duration and I (y-axis)is the rainfall intensity. About 70% of the storms that generated debrisflows in the JJG had a duration equal to or less than 6 h, with mostdurations being 3 to 6 h.
3
5
7
8
10
0.1
1.0
10.0
100.0
0.1 1.0
Inte
nsity
(m
m/h
)
Durat
This study Test data 1
2 3 4
5 6 7
8 9 90% Curve
70% Curve 10 50% Curve
Fig. 9.Comparison andvalidation of I–D thresholds (No. 1: Caine (1980); No. 2:Wieczorek (1987Crosta and Frattini (2001); No. 9: Shieh et al. (2009); No. 10: Guo et al. (2013)).
Please cite this article as: Zhuang, J., et al., Rainfall thresholds for the occurrGeol. (2015), http://dx.doi.org/10.1016/j.enggeo.2015.06.006
Using Eq. (2), we calculated the best-fit line using the least squaresand medium-scale methods, and obtained the equation I = 15.87D−0.5952. This equation uses median regression to empirically obtainthe corresponding median thresholds (curve 50% of the graph forincluding 50% of the debris flow event points). It only demonstratesthe relationship between rainfall intensity and duration, and cannotbe used directly to forecast debris flows using only one probabilityline (“yes” or “no”with respect to debris flow occurrences). Accordingly,we calculated the 90% and 70% (curve 90%/70% of the graph forincluding 90%/70% of the debris flow event points) probability curvesin the graph, corresponding to 90% and 70% of the debris flow eventpoints, respectively (i.e. the lowest threshold line and the lowest medi-an threshold line, respectively) (Fig. 4). The equations to calculate the70% and 90% thresholds are I = 11.92 D−0.5952 and I = 7.27 D−0.5952,respectively. The quadrant can be divided by the three thresholds intofour zones (A, B, C and D). Zone A is located below the lowest threshold(90% curve) and represents a very low probability of debris flow. Zone Bis located between the lowest threshold line (90% curve) and lowestmedian threshold line (70% curve), representing a relatively lowprobability of a debris flow occurrence for points located between theI and D curves. This would necessitate the release of a watch alert.
1
2
4
69
90% Curve
10.0 100.0 ion (h)
70% Curve
50% Curve
); Nos. 3, 4, 5: Jibson (1989);No. 6: Guadagno (1991);No. 7: Paronuzzi et al. (1998); No. 8:
ence of debris flows in the Jiangjia Gully, Yunnan Province, China, Eng.
1
10
100
1000
0.1 1.0 10.0 100.0
Rai
nfal
l eve
nt (
mm
)
Duration (h)
This data Test data
50% Curve 90% Curve
70% Curve 1
2 3
4
3
4
1
2
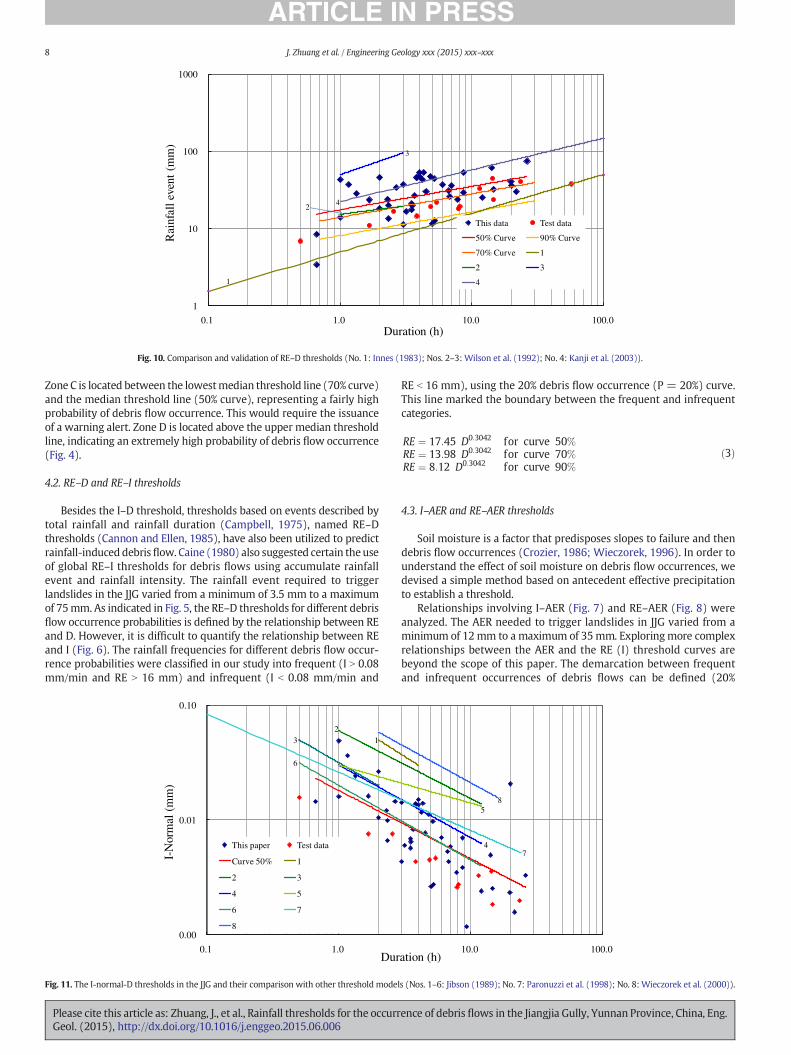
Fig. 10. Comparison and validation of RE–D thresholds (No. 1: Innes (1983); Nos. 2–3: Wilson et al. (1992); No. 4: Kanji et al. (2003)).
8 J. Zhuang et al. / Engineering Geology xxx (2015) xxx–xxx
Zone C is located between the lowestmedian threshold line (70% curve)and the median threshold line (50% curve), representing a fairly highprobability of debris flow occurrence. This would require the issuanceof a warning alert. Zone D is located above the upper median thresholdline, indicating an extremely high probability of debris flow occurrence(Fig. 4).
4.2. RE–D and RE–I thresholds
Besides the I–D threshold, thresholds based on events described bytotal rainfall and rainfall duration (Campbell, 1975), named RE–Dthresholds (Cannon and Ellen, 1985), have also been utilized to predictrainfall-induced debrisflow. Caine (1980) also suggested certain theuseof global RE–I thresholds for debris flows using accumulate rainfallevent and rainfall intensity. The rainfall event required to triggerlandslides in the JJG varied from a minimum of 3.5 mm to a maximumof 75mm. As indicated in Fig. 5, the RE–D thresholds for different debrisflow occurrence probabilities is defined by the relationship between REand D. However, it is difficult to quantify the relationship between REand I (Fig. 6). The rainfall frequencies for different debris flow occur-rence probabilities were classified in our study into frequent (I N 0.08mm/min and RE N 16 mm) and infrequent (I b 0.08 mm/min and
0.00
0.01
0.10
0.1 1.0
I-N
orm
al (
mm
)
Dur
This paper Test data
Curve 50% 1
2 3
4 5
6 7
8
12
6
3
Fig. 11. The I-normal-D thresholds in the JJG and their comparison with other threshold model
Please cite this article as: Zhuang, J., et al., Rainfall thresholds for the occurrGeol. (2015), http://dx.doi.org/10.1016/j.enggeo.2015.06.006
RE b 16 mm), using the 20% debris flow occurrence (P = 20%) curve.This line marked the boundary between the frequent and infrequentcategories.
RE ¼ 17:45 D0:3042 for curve 50%RE ¼ 13:98 D0:3042 for curve 70%RE ¼ 8:12 D0:3042 for curve 90%
ð3Þ
4.3. I–AER and RE–AER thresholds
Soil moisture is a factor that predisposes slopes to failure and thendebris flow occurrences (Crozier, 1986; Wieczorek, 1996). In order tounderstand the effect of soil moisture on debris flow occurrences, wedevised a simple method based on antecedent effective precipitationto establish a threshold.
Relationships involving I–AER (Fig. 7) and RE–AER (Fig. 8) wereanalyzed. The AER needed to trigger landslides in JJG varied from aminimum of 12mm to a maximum of 35mm. Exploringmore complexrelationships between the AER and the RE (I) threshold curves arebeyond the scope of this paper. The demarcation between frequentand infrequent occurrences of debris flows can be defined (20%
10.0 100.0 ation (h)
4
5
7
8
s (Nos. 1–6: Jibson (1989); No. 7: Paronuzzi et al. (1998); No. 8: Wieczorek et al. (2000)).
ence of debris flows in the Jiangjia Gully, Yunnan Province, China, Eng.
TimeLow Low
HighHigh
Prec
ipita
tion
Loo
se d
ebri
s
Loose debris
Threshold line
Precipitation
Debris flow occurs
Debris flow no-occurs
TimeLow Low
HighHigh
Prec
ipita
tion
Loe
ss d
ebri
s
Threshold line
Precipitation
Debris flow occurs
Debris flow no-occurs
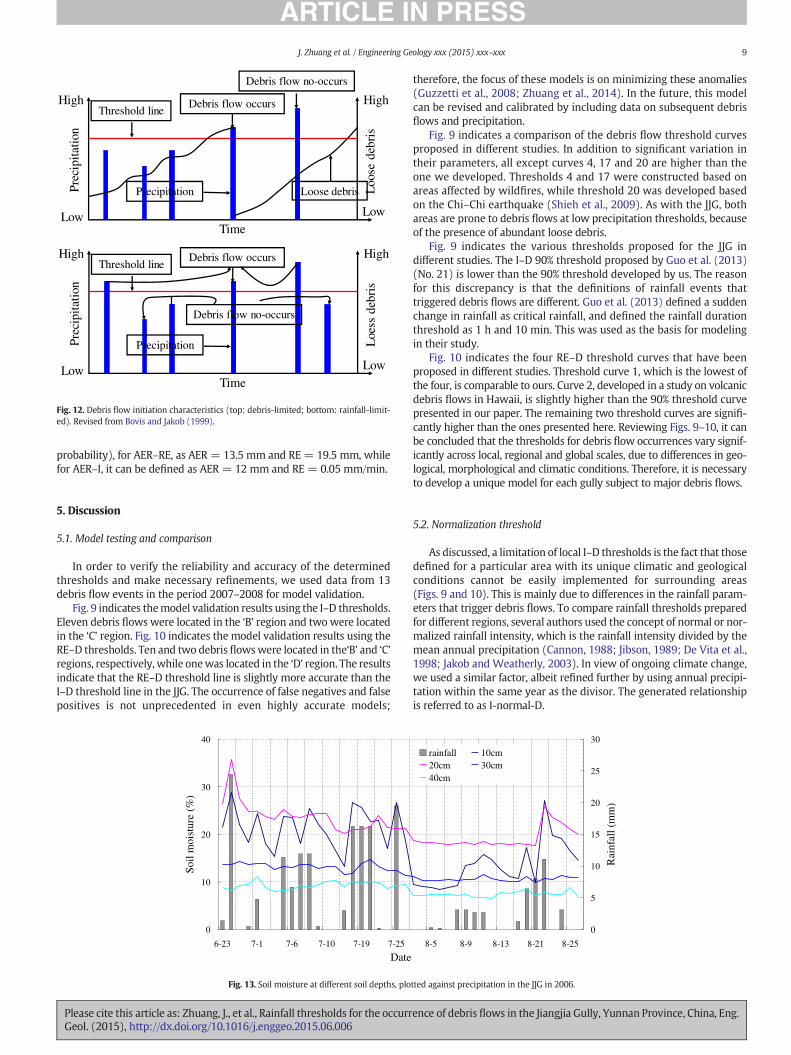
Fig. 12. Debris flow initiation characteristics (top: debris-limited; bottom: rainfall-limit-ed). Revised from Bovis and Jakob (1999).
9J. Zhuang et al. / Engineering Geology xxx (2015) xxx–xxx
probability), for AER–RE, as AER = 13.5 mm and RE = 19.5 mm, whilefor AER–I, it can be defined as AER = 12 mm and RE = 0.05 mm/min.
5. Discussion
5.1. Model testing and comparison
In order to verify the reliability and accuracy of the determinedthresholds and make necessary refinements, we used data from 13debris flow events in the period 2007–2008 for model validation.
Fig. 9 indicates themodel validation results using the I–D thresholds.Eleven debris flows were located in the ‘B’ region and two were locatedin the ‘C’ region. Fig. 10 indicates the model validation results using theRE–D thresholds. Ten and two debris flowswere located in the‘B’ and ‘C’regions, respectively, while onewas located in the ‘D’ region. The resultsindicate that the RE–D threshold line is slightly more accurate than theI–D threshold line in the JJG. The occurrence of false negatives and falsepositives is not unprecedented in even highly accurate models;
0
10
20
30
40
6-23 7-1 7-6 7-10 7-19 7-25
Date
Soil
moi
stur
e (%
)
Fig. 13. Soil moisture at different soil depths, plo
Please cite this article as: Zhuang, J., et al., Rainfall thresholds for the occurrGeol. (2015), http://dx.doi.org/10.1016/j.enggeo.2015.06.006
therefore, the focus of these models is on minimizing these anomalies(Guzzetti et al., 2008; Zhuang et al., 2014). In the future, this modelcan be revised and calibrated by including data on subsequent debrisflows and precipitation.
Fig. 9 indicates a comparison of the debris flow threshold curvesproposed in different studies. In addition to significant variation intheir parameters, all except curves 4, 17 and 20 are higher than theone we developed. Thresholds 4 and 17 were constructed based onareas affected by wildfires, while threshold 20 was developed basedon the Chi–Chi earthquake (Shieh et al., 2009). As with the JJG, bothareas are prone to debris flows at low precipitation thresholds, becauseof the presence of abundant loose debris.
Fig. 9 indicates the various thresholds proposed for the JJG indifferent studies. The I–D 90% threshold proposed by Guo et al. (2013)(No. 21) is lower than the 90% threshold developed by us. The reasonfor this discrepancy is that the definitions of rainfall events thattriggered debris flows are different. Guo et al. (2013) defined a suddenchange in rainfall as critical rainfall, and defined the rainfall durationthreshold as 1 h and 10 min. This was used as the basis for modelingin their study.
Fig. 10 indicates the four RE–D threshold curves that have beenproposed in different studies. Threshold curve 1, which is the lowest ofthe four, is comparable to ours. Curve 2, developed in a study on volcanicdebris flows in Hawaii, is slightly higher than the 90% threshold curvepresented in our paper. The remaining two threshold curves are signifi-cantly higher than the ones presented here. Reviewing Figs. 9–10, it canbe concluded that the thresholds for debris flow occurrences vary signif-icantly across local, regional and global scales, due to differences in geo-logical, morphological and climatic conditions. Therefore, it is necessaryto develop a unique model for each gully subject to major debris flows.
5.2. Normalization threshold
As discussed, a limitation of local I–D thresholds is the fact that thosedefined for a particular area with its unique climatic and geologicalconditions cannot be easily implemented for surrounding areas(Figs. 9 and 10). This is mainly due to differences in the rainfall param-eters that trigger debris flows. To compare rainfall thresholds preparedfor different regions, several authors used the concept of normal or nor-malized rainfall intensity, which is the rainfall intensity divided by themean annual precipitation (Cannon, 1988; Jibson, 1989; De Vita et al.,1998; Jakob and Weatherly, 2003). In view of ongoing climate change,we used a similar factor, albeit refined further by using annual precipi-tation within the same year as the divisor. The generated relationshipis referred to as I-normal-D.
8-5 8-9 8-13 8-21 8-25
0
5
10
15
20
25
30
Rai
nfal
l (m
m)
rainfall 10cm20cm 30cm40cm
tted against precipitation in the JJG in 2006.
ence of debris flows in the Jiangjia Gully, Yunnan Province, China, Eng.
0
4
8
12
0 5 10 15 20 25 30
wide-range and loose un-consolidate soil
20cm
Time (min)
Infi
ltrat
e ra
te (
cm/m
in)
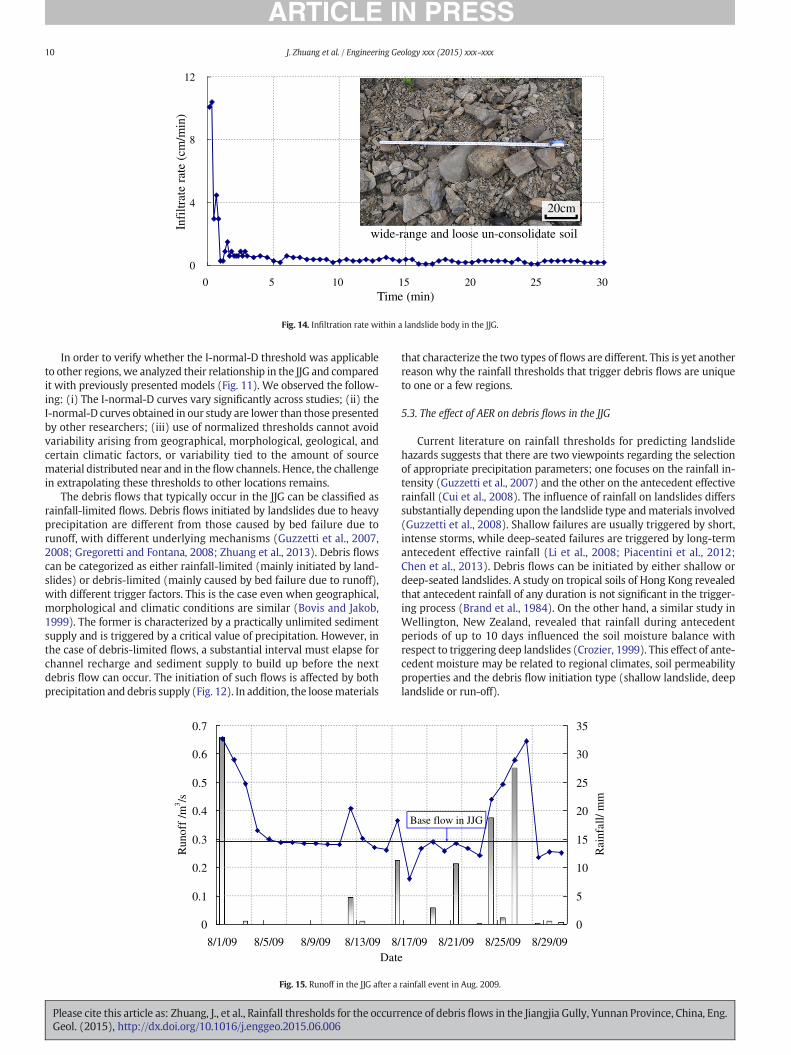
Fig. 14. Infiltration rate within a landslide body in the JJG.
10 J. Zhuang et al. / Engineering Geology xxx (2015) xxx–xxx
In order to verify whether the I-normal-D threshold was applicableto other regions, we analyzed their relationship in the JJG and comparedit with previously presented models (Fig. 11). We observed the follow-ing: (i) The I-normal-D curves vary significantly across studies; (ii) theI-normal-D curves obtained in our study are lower than those presentedby other researchers; (iii) use of normalized thresholds cannot avoidvariability arising from geographical, morphological, geological, andcertain climatic factors, or variability tied to the amount of sourcematerial distributed near and in the flow channels. Hence, the challengein extrapolating these thresholds to other locations remains.
The debris flows that typically occur in the JJG can be classified asrainfall-limited flows. Debris flows initiated by landslides due to heavyprecipitation are different from those caused by bed failure due torunoff, with different underlying mechanisms (Guzzetti et al., 2007,2008; Gregoretti and Fontana, 2008; Zhuang et al., 2013). Debris flowscan be categorized as either rainfall-limited (mainly initiated by land-slides) or debris-limited (mainly caused by bed failure due to runoff),with different trigger factors. This is the case even when geographical,morphological and climatic conditions are similar (Bovis and Jakob,1999). The former is characterized by a practically unlimited sedimentsupply and is triggered by a critical value of precipitation. However, inthe case of debris-limited flows, a substantial interval must elapse forchannel recharge and sediment supply to build up before the nextdebris flow can occur. The initiation of such flows is affected by bothprecipitation and debris supply (Fig. 12). In addition, the loosematerials
0
0.1
0.2
0.3
0.4
0.5
0.6
0.7
8/1/09 8/5/09 8/9/09 8/13/09 8/Date
Run
off
/m3 /s
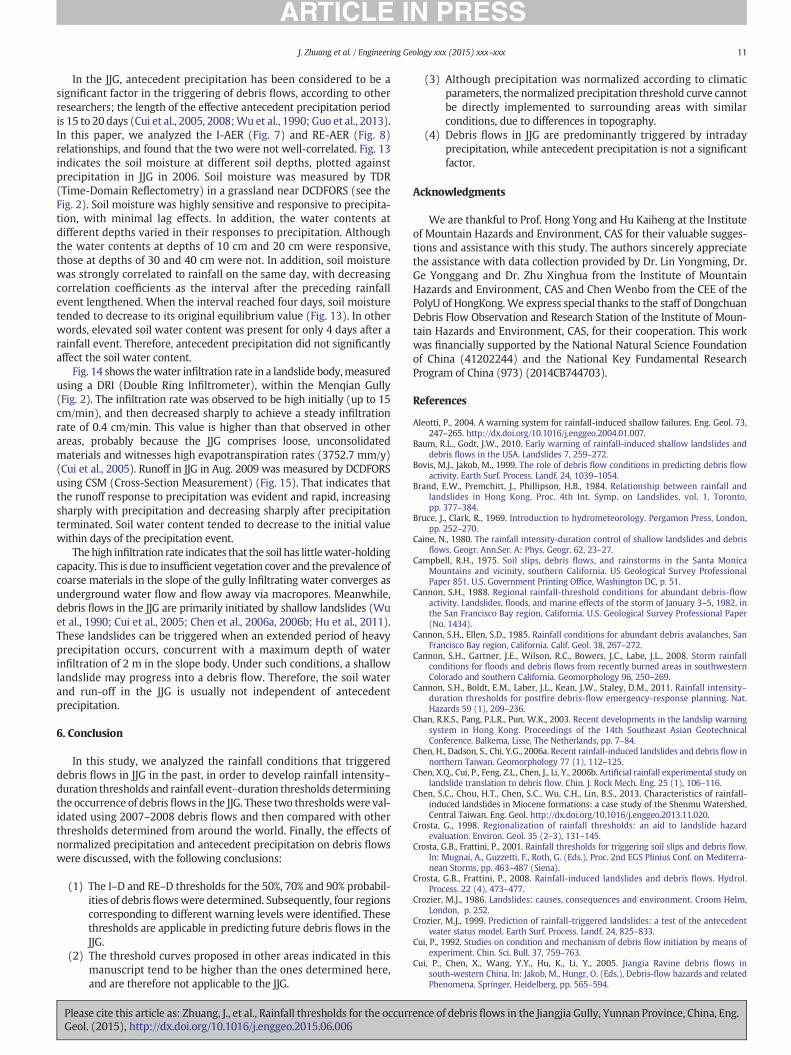
Fig. 15. Runoff in the JJG after a
Please cite this article as: Zhuang, J., et al., Rainfall thresholds for the occurrGeol. (2015), http://dx.doi.org/10.1016/j.enggeo.2015.06.006
that characterize the two types of flows are different. This is yet anotherreason why the rainfall thresholds that trigger debris flows are uniqueto one or a few regions.
5.3. The effect of AER on debris flows in the JJG
Current literature on rainfall thresholds for predicting landslidehazards suggests that there are two viewpoints regarding the selectionof appropriate precipitation parameters; one focuses on the rainfall in-tensity (Guzzetti et al., 2007) and the other on the antecedent effectiverainfall (Cui et al., 2008). The influence of rainfall on landslides differssubstantially depending upon the landslide type andmaterials involved(Guzzetti et al., 2008). Shallow failures are usually triggered by short,intense storms, while deep-seated failures are triggered by long-termantecedent effective rainfall (Li et al., 2008; Piacentini et al., 2012;Chen et al., 2013). Debris flows can be initiated by either shallow ordeep-seated landslides. A study on tropical soils of Hong Kong revealedthat antecedent rainfall of any duration is not significant in the trigger-ing process (Brand et al., 1984). On the other hand, a similar study inWellington, New Zealand, revealed that rainfall during antecedentperiods of up to 10 days influenced the soil moisture balance withrespect to triggering deep landslides (Crozier, 1999). This effect of ante-cedent moisture may be related to regional climates, soil permeabilityproperties and the debris flow initiation type (shallow landslide, deeplandslide or run-off).
17/09 8/21/09 8/25/09 8/29/09
0
5
10
15
20
25
30
35
Rai
nfal
l/ m
m
Base flow in JJG
rainfall event in Aug. 2009.
ence of debris flows in the Jiangjia Gully, Yunnan Province, China, Eng.
11J. Zhuang et al. / Engineering Geology xxx (2015) xxx–xxx
In the JJG, antecedent precipitation has been considered to be asignificant factor in the triggering of debris flows, according to otherresearchers; the length of the effective antecedent precipitation periodis 15 to 20 days (Cui et al., 2005, 2008;Wu et al., 1990; Guo et al., 2013).In this paper, we analyzed the I-AER (Fig. 7) and RE-AER (Fig. 8)relationships, and found that the two were not well-correlated. Fig. 13indicates the soil moisture at different soil depths, plotted againstprecipitation in JJG in 2006. Soil moisture was measured by TDR(Time-Domain Reflectometry) in a grassland near DCDFORS (see theFig. 2). Soil moisture was highly sensitive and responsive to precipita-tion, with minimal lag effects. In addition, the water contents atdifferent depths varied in their responses to precipitation. Althoughthe water contents at depths of 10 cm and 20 cm were responsive,those at depths of 30 and 40 cm were not. In addition, soil moisturewas strongly correlated to rainfall on the same day, with decreasingcorrelation coefficients as the interval after the preceding rainfallevent lengthened. When the interval reached four days, soil moisturetended to decrease to its original equilibrium value (Fig. 13). In otherwords, elevated soil water content was present for only 4 days after arainfall event. Therefore, antecedent precipitation did not significantlyaffect the soil water content.
Fig. 14 shows thewater infiltration rate in a landslide body,measuredusing a DRI (Double Ring Infiltrometer), within the Menqian Gully(Fig. 2). The infiltration rate was observed to be high initially (up to 15cm/min), and then decreased sharply to achieve a steady infiltrationrate of 0.4 cm/min. This value is higher than that observed in otherareas, probably because the JJG comprises loose, unconsolidatedmaterials and witnesses high evapotranspiration rates (3752.7 mm/y)(Cui et al., 2005). Runoff in JJG in Aug. 2009 was measured by DCDFORSusing CSM (Cross-Section Measurement) (Fig. 15). That indicates thatthe runoff response to precipitation was evident and rapid, increasingsharply with precipitation and decreasing sharply after precipitationterminated. Soil water content tended to decrease to the initial valuewithin days of the precipitation event.
The high infiltration rate indicates that the soil has littlewater-holdingcapacity. This is due to insufficient vegetation cover and the prevalence ofcoarse materials in the slope of the gully Infiltrating water converges asunderground water flow and flow away via macropores. Meanwhile,debris flows in the JJG are primarily initiated by shallow landslides (Wuet al., 1990; Cui et al., 2005; Chen et al., 2006a, 2006b; Hu et al., 2011).These landslides can be triggered when an extended period of heavyprecipitation occurs, concurrent with a maximum depth of waterinfiltration of 2 m in the slope body. Under such conditions, a shallowlandslide may progress into a debris flow. Therefore, the soil waterand run-off in the JJG is usually not independent of antecedentprecipitation.
6. Conclusion
In this study, we analyzed the rainfall conditions that triggereddebris flows in JJG in the past, in order to develop rainfall intensity–duration thresholds and rainfall event–duration thresholds determiningthe occurrence of debris flows in the JJG. These two thresholdswere val-idated using 2007–2008 debris flows and then compared with otherthresholds determined from around the world. Finally, the effects ofnormalized precipitation and antecedent precipitation on debris flowswere discussed, with the following conclusions:
(1) The I–D and RE–D thresholds for the 50%, 70% and 90% probabil-ities of debris flowswere determined. Subsequently, four regionscorresponding to different warning levels were identified. Thesethresholds are applicable in predicting future debris flows in theJJG.
(2) The threshold curves proposed in other areas indicated in thismanuscript tend to be higher than the ones determined here,and are therefore not applicable to the JJG.
Please cite this article as: Zhuang, J., et al., Rainfall thresholds for the occurrGeol. (2015), http://dx.doi.org/10.1016/j.enggeo.2015.06.006
(3) Although precipitation was normalized according to climaticparameters, the normalized precipitation threshold curve cannotbe directly implemented to surrounding areas with similarconditions, due to differences in topography.
(4) Debris flows in JJG are predominantly triggered by intradayprecipitation, while antecedent precipitation is not a significantfactor.
Acknowledgments
We are thankful to Prof. Hong Yong and Hu Kaiheng at the Instituteof Mountain Hazards and Environment, CAS for their valuable sugges-tions and assistance with this study. The authors sincerely appreciatethe assistance with data collection provided by Dr. Lin Yongming, Dr.Ge Yonggang and Dr. Zhu Xinghua from the Institute of MountainHazards and Environment, CAS and Chen Wenbo from the CEE of thePolyU of HongKong.We express special thanks to the staff of DongchuanDebris Flow Observation and Research Station of the Institute of Moun-tain Hazards and Environment, CAS, for their cooperation. This workwas financially supported by the National Natural Science Foundationof China (41202244) and the National Key Fundamental ResearchProgram of China (973) (2014CB744703).
References
Aleotti, P., 2004. A warning system for rainfall-induced shallow failures. Eng. Geol. 73,247–265. http://dx.doi.org/10.1016/j.enggeo.2004.01.007.
Baum, R.L., Godt, J.W., 2010. Early warning of rainfall-induced shallow landslides anddebris flows in the USA. Landslides 7, 259–272.
Bovis, M.J., Jakob, M., 1999. The role of debris flow conditions in predicting debris flowactivity. Earth Surf. Process. Landf. 24, 1039–1054.
Brand, E.W., Premchitt, J., Phillipson, H.B., 1984. Relationship between rainfall andlandslides in Hong Kong. Proc. 4th Int. Symp. on Landslides, vol. 1. Toronto,pp. 377–384.
Bruce, J., Clark, R., 1969. Introduction to hydrometeorology. Pergamon Press, London,pp. 252–270.
Caine, N., 1980. The rainfall intensity-duration control of shallow landslides and debrisflows. Geogr. Ann.Ser. A: Phys. Geogr. 62, 23–27.
Campbell, R.H., 1975. Soil slips, debris flows, and rainstorms in the Santa MonicaMountains and vicinity, southern California. US Geological Survey ProfessionalPaper 851. U.S. Government Printing Office, Washington DC, p. 51.
Cannon, S.H., 1988. Regional rainfall-threshold conditions for abundant debris-flowactivity. Landslides, floods, and marine effects of the storm of January 3–5, 1982, inthe San Francisco Bay region, California. U.S. Geological Survey Professional Paper(No. 1434).
Cannon, S.H., Ellen, S.D., 1985. Rainfall conditions for abundant debris avalanches, SanFrancisco Bay region, California. Calif. Geol. 38, 267–272.
Cannon, S.H., Gartner, J.E., Wilson, R.C., Bowers, J.C., Labe, J.L., 2008. Storm rainfallconditions for floods and debris flows from recently burned areas in southwesternColorado and southern California. Geomorphology 96, 250–269.
Cannon, S.H., Boldt, E.M., Laber, J.L., Kean, J.W., Staley, D.M., 2011. Rainfall intensity–duration thresholds for postfire debris-flow emergency-response planning. Nat.Hazards 59 (1), 209–236.
Chan, R.K.S., Pang, P.L.R., Pun, W.K., 2003. Recent developments in the landslip warningsystem in Hong Kong. Proceedings of the 14th Southeast Asian GeotechnicalConference. Balkema, Lisse, The Netherlands, pp. 7–84.
Chen, H., Dadson, S., Chi, Y.G., 2006a. Recent rainfall-induced landslides and debris flow innorthern Taiwan. Geomorphology 77 (1), 112–125.
Chen, X.Q., Cui, P., Feng, Z.L., Chen, J., Li, Y., 2006b. Artificial rainfall experimental study onlandslide translation to debris flow. Chin. J. Rock Mech. Eng. 25 (1), 106–116.
Chen, S.C., Chou, H.T., Chen, S.C., Wu, C.H., Lin, B.S., 2013. Characteristics of rainfall-induced landslides in Miocene formations: a case study of the Shenmu Watershed,Central Taiwan. Eng. Geol. http://dx.doi.org/10.1016/j.enggeo.2013.11.020.
Crosta, G., 1998. Regionalization of rainfall thresholds: an aid to landslide hazardevaluation. Environ. Geol. 35 (2–3), 131–145.
Crosta, G.B., Frattini, P., 2001. Rainfall thresholds for triggering soil slips and debris flow.In: Mugnai, A., Guzzetti, F., Roth, G. (Eds.), Proc. 2nd EGS Plinius Conf. on Mediterra-nean Storms, pp. 463–487 (Siena).
Crosta, G.B., Frattini, P., 2008. Rainfall-induced landslides and debris flows. Hydrol.Process. 22 (4), 473–477.
Crozier, M.J., 1986. Landslides: causes, consequences and environment. Croom Helm,London, p. 252.
Crozier, M.J., 1999. Prediction of rainfall-triggered landslides: a test of the antecedentwater status model. Earth Surf. Process. Landf. 24, 825–833.
Cui, P., 1992. Studies on condition and mechanism of debris flow initiation by means ofexperiment. Chin. Sci. Bull. 37, 759–763.
Cui, P., Chen, X., Wang, Y.Y., Hu, K., Li, Y., 2005. Jiangia Ravine debris flows insouth-western China. In: Jakob, M., Hungr, O. (Eds.), Debris-flow hazards and relatedPhenomena. Springer, Heidelberg, pp. 565–594.
ence of debris flows in the Jiangjia Gully, Yunnan Province, China, Eng.
12 J. Zhuang et al. / Engineering Geology xxx (2015) xxx–xxx
Cui, P., Zhu, Y.Y., Chen, J., 2008. Relationships between antecedent rainfall and debrisflows in Jiangjia Ravine, China. In: Chen, C.L., Rickenmann, D. (Eds.), Proceedings ofthe Fourth International Conference on Debris Flow. Springer Press, Wellington,pp. 1–9.
De Vita, P., Reichenbach, P., Bathurst, J.C., Borga, M., Crosta, G., Crozier, M., Wasowski, J.,1998. Rainfall-triggered landslides: a reference list. Environ. Geol. 35 (2), 219–233.
Engel, Z., Česák, Julius, Escobar, V.R., 2011. Rainfall-related debris flows in CarhuacochaValley, Cordillera Huayhuash, Peru. Landslides 8, 269–278.
Floris, M., D'Alpaos, A., Squarzoni, C., Genevois, R., Marani, M., 2010. Recent changes inrainfall characteristics and their influence on thresholds for debris flow triggeringin the Dolomitic area of Cortina d'Ampezzo, north-eastern Italian Alps. Nat. HazardsEarth Syst. Sci. 10 (3), 571–580.
Giannecchini, R., 2005. Rainfall triggering soil slips in the southern Apuane Alps (Tuscany,Italy). Adv. Geosci. 2, 21–24 (SRef-ID: 1680-7359/adgeo/2005-2-21).
Glade, T., Crozier, M.J., Smith, P., 2000. Applying probability determination to refinelandslide-triggering rainfall thresholds using an empirical. Antecedent Daily RainfallModel. Pure Appl. Geophys. 157 (6/8), 1059–1079. http://dx.doi.org/10.1007/s000240050017.
Godt, J.W., Baum, R.L., Chleborad, A.F., 2006. Rainfall characteristics for shallow landslid-ing in Seattle, Washington, USA. Earth Surf. Process. Landf. 31, 97–110. http://dx.doi.org/10.1002/esp.1237.
Gregoretti, C., Fontana, G.D., 2008. The triggering of debris flow due to channel-bed failurein some alpine headwater basins of the Dolomites: analyses of critical runoff. Hydrol.Process. 22 (13), 2248–2263.
Guadagno, F.M., 1991. Debris flows in the Campanian volcaniclastic soil (Southern Italy).Proc. Int. Conf. on slope stability. Thomas Telford, Isle of Wight, pp. 125–130.
Guo, X.J., Cui, P., Li, Y., 2013. Debris flowwarning threshold based on antecedent rainfall: acase study in Jiangjia Ravine, Yunnan, China. J. Mt. Sci. 10 (2), 305–314.
Guzzetti, F., Peruccacci, S., Rossi, M., Stark, C.P., 2007. Rainfall thresholds for the initiationof landslides in central and southern Europe. Meteorog. Atmos. Phys. 98, 239–267.
Guzzetti, F., Peruccacc, S., Ross, M., Stark, C.P., 2008. The rainfall intensity–duration controlof shallow landslides and debris flows: an update. Landslides 5, 3–17.
Heyerdahl, H., Harbitz, C.B., Domaas, U., Sandersen, F., Tronstad, K., Nowacki, F., Engen, A.,Kjekstad, O., Devoli, G., Buezo, S.G., Diaz, M.R., Hernandez, W., 2003. Rainfall inducedlahars in volcanic debris in Nicaragua and El Salvador: practical mitigation. Proc. Int.Conf. on Fast Slope Movements-Prediction and Prevention for risk Mitigation,IC-FSM2003. Patron Pub, Naples, pp. 275–282.
Hong, Y., Hiura, H., Shino, K., Sassa, K., Suemine, A., Fukuoka, H., Wang, G., 2005. Theinfluence of intense rainfall on the activity of large-scale crystalline schist landslidesin Shikoku Island, Japan. Landslides 2 (2), 97–105. http://dx.doi.org/10.1007/s10346-004-0043-z.
Hu, K.H., Cui, P., Wang, C.C., Li, Y., Lu, X.B., 2010. Characteristic rainfall for warning of de-bris flows. J. Mt. Sci. 7 (3), 207–214. http://dx.doi.org/10.1007/s11629-010-2022-2.
Hu, M., Wang, R., Shen, J., 2011. Rainfall, landslide and debris flow intergrowth relation-ship in Jiangjia Ravine. J. Mt. Sci. 8 (4), 603–610.
Innes, J.L., 1983. Debris flows. Prog. Phys. Geogr. 7, 469–501.Iverson, R.M., 1997. The physics of debris flows. Rev. Geophys. 35 (3), 245–296.Jakob, M., Weatherly, H., 2003. A hydroclimatic threshold for landslide initiation on the
North Shore Mountains of Vancouver, British Columbia. Geomorphology 54 (3),137–156.
Jakob, M., Owen, T., Simpson, T., 2012. A regional real-time debris-flow warning systemfor the District of North Vancouver, Canada. Landslides 9 (2), 165–178.
Jan, C.D., Lee, M.H., 2004. A debris flow rainfall-based warning model. J. Chin. Soil WaterConserv. 35 (3), 275–285.
Jibson, R.W., 1989. Debris flow in southern Porto Rico. Geol. Soc. Am. Spec. Pap. 236,29–55.
Kang, Z.C., Li, Z.F., Ma, A., Luo, J.T., 2004. Research on debris flow in China. Science Press,pp. 12–66.
Kanji, M.A., Massad, F., Cruz, P.T., 2003. Debris flows in areas of residual soils: occurrenceand characteristics. Int. Workshop on Occurrence and Mechanisms of Flows in
Please cite this article as: Zhuang, J., et al., Rainfall thresholds for the occurrGeol. (2015), http://dx.doi.org/10.1016/j.enggeo.2015.06.006
Natural Slopes and Earthfills. Iw-Flows 2003 2. Associacione Geotecnica Italiana,Sorrento, pp. 1–11.
Kung, H.Y., Chen, C.H., Ku, H.H., 2012. Designing intelligent disaster predictionmodels andsystems for debris-flow disasters in Taiwan. Expert Syst. Appl. 39 (5), 5838–5856.
Lee, D.H., Lai, M.H., Wu, J.H., Chi, Y.Y., Ko, W.T., Lee, B.L., 2013. Slope management criteriafor Alishan Highway based on database of heavy rainfall-induced slope failures. Eng.Geol. 162, 97–107.
Li, C.J., Ma, S.H., Zhu, X.S., 2008. Forecasting of landslide triggered by rainfall: thoery,methods and applications. Geological Publishing House 3–18.
Li, C.J., Ma, T.H., Zhu, X.S., Li, W., 2011. The power–law relationship between landslideoccurrence and rainfall level. Geomorphology 130 (3–4), 221–229. http://dx.doi.org/10.1016/j.geomorph.2011.03.018.
Ni, H.Y., Zheng,W.M., Li, Z.L., 2010. Recent catastrophic debris flows in Luding county, SWChina: geological hazards, rainfall analysis and dynamic characteristics. Nat. Hazards55, 523–542. http://dx.doi.org/10.1007/s11069-010-9545-2.
Paronuzzi, P., Coccolo, A., Garlatti, G., 1998, Eventi meteorici critical debris flows nei bacinimontani del Friuli. L'Acqua, Sezione I=Memorie, pp, 39–50.
Piacentini, D., Troiani, F., Soldati, M., Notarnicola, C., Savelli, D., Schneiderbauer, S., Strada,C., 2012. Statistical analysis for assessing shallow-landslide susceptibility in SouthTyrol (south-eastern Alps, Italy). Geomorphology 151–152, 196–206.
Shieh, C.L., Chen, Y.S., Tsai, Y.J., Wu, J.H., 2009. Variability in rainfall threshold for debrisflow after the Chi-Chi earthquake in central Taiwan, China. Int. J. Sediment Res. 24(2), 177–188.
Takahashi, T., 1991. Debris flow. Balkema, pp. 22–56.Tan, B.Y., Duan, A.Y., 1995. Study on prediction for rainstorm debris flow along mountain
district railways. J. Nat. Disasters 4 (2), 43–52.Wei, F.Q., Hu, K.H., Chen, J., 2005. Determination of effective antecedent rainfall for debris
flow forecast. J. Mt. Sci. 23 (4), 453–457.Wieczorek, G.F., 1987. Effect of rainfall intensity and duration on debris flows in central
Santa Cruz Mountains. In: Costa, J.E., Wieczorek, G.F. (Eds.), Debris flow andavalanches: process, recognition, and mitigationReviews in Engineering Geology 7.Geological Society of America, pp. 93–104.
Wieczorek, G.F., 1996. Landslide Triggering Mechanisms. Landslides Investigation andMitigation. In: Turner, A.K., Schuster, R.L. (Eds.), Transportation Research Board Na-tional Academcy of Sciences, Special Report 247, pp. 76–90.
Wieczorek, G.F., Guzzetti, F., 1999. A review of rainfall thresholds for triggering landslides.Proc. of the EGS Plinius Conference, Maratea, Italy, pp. 407–414.
Wieczorek, G.F., Morgan, B.A., Campbell, R.H., 2000. Debris flow hazards in the Blue Ridgeof Central Virginia. Environ. Eng. Geosci. 6, 3–23.
Wilson, R.C., Torikai, J.D., Ellen, S.D., 1992. Development of rainfall thresholds for debrisflows in the Honolulu District, Oahu. U.S. Geol. Surv. Open File Rep. 92–521, 45.
Wu, J., Kang, Z., Tian, L., Zhang, S., 1990. Observation and research of debris flow inJiangjiagou Ravine, Yunnan Province. Science Pressing, Beijing, pp. 67–145.
Zhou, W., Tang, C., 2013. Rainfall thresholds for debris flow occurrence in the Wenchuanearthquake area. Adv. Water Sci. 24 (6), 786–793.
Zhuang, J.Q., Cui, P., Ge, Y.G., Hong, Y., 2009. Relationship between rainfall characteristicsand total amount of debris flow. J. Beijing For. Univ. 31 (4), 77–83.
Zhuang, J.Q., Cui, P., Ge, Y.G., He, Y.P., Liu, Y.H., Guo, X.J., 2010. Probability assessment de-bris flow block themain river associateWenchuan Earthquake. Int. J. Remote Sens. 31(13), 3465–3478.
Zhuang, J.Q., Cui, P., Peng, J.B., Hu, K.H., Iqbal, J., 2013. Initiation process of debris flows ondifferent slopes due to surface flow and trigger-specific strategies for mitigatingpost-earthquake in old Beichuan County, China. Environ. Earth Sci. 68 (5),1391–1403.
Zhuang, J.Q., Iqbal, J., Peng, J.B., Liu, T.M., 2014. Probability prediction model for landslideoccurrences in Xi'an, Shaanxi Province, China. J. Mt. Sci. 11 (2), 345–359.
ence of debris flows in the Jiangjia Gully, Yunnan Province, China, Eng.


![2008 China, Yunnan [Shanghai Expatriates]](https://img.pdfslide.us/doc/110x75/54c6509a4a79591a6d8b4621/2008-china-yunnan-shanghai-expatriates.jpg)


![China Yunnan [Water]](https://img.pdfslide.us/doc/110x75/55a4df8b1a28aba00e8b4658/china-yunnan-water.jpg)