Embed Size (px)
Citation preview
U.S. Department of the Interior
Rainfall, Streamflow, and Water-Quality Data During Stormwater Monitoring, Halawa Stream Drainage Basin, Oahu, Hawaii, July 1, 2000 to June 30, 2001
U.S. GEOLOGICAL SURVEY
Open-File Report 01-256
Prepared in cooperation with the
STATE OF HAWAII DEPARTMENT OF TRANSPORTATION
Rainfall, Streamflow, and Water-Quality Data During Stormwater Monitoring, Halawa Stream Drainage Basin, Oahu, Hawaii, July 1, 2000 to June 30, 2001
By Todd K. Presley
U.S. GEOLOGICAL SURVEYOpen-File Report 01-256
Prepared in cooperation with the
STATE OF HAWAII DEPARTMENT OF TRANSPORTATION
Honolulu, Hawaii2001
U.S. DEPARTMENT OF THE INTERIOR
GALE A. NORTON, Secretary
U.S. GEOLOGICAL SURVEY
Charles G. Groat, Director
The use of firm, trade, and brand names in this report is for identification purposes only and does not constitute endorsement by the U.S. Geological Survey.
For additional information write to: Copies of this report can be purchased from:
District Chief U.S. Geological SurveyU.S. Geological Survey Branch of Information Services677 Ala Moana Blvd., Suite 415 Box 25286Honolulu, HI 96813 Denver, CO 80225-0286
U.S
. DEP
ARTMENT OF THEINTE
RIO
R
MARCH 3, 1849
Contents iii
CONTENTSAbstract . . . . . . . . . . . . . . . . . . . . . . . . . . . . . . . . . . . . . . . . . . . . . . . . . . . . . . . . . . . . . . . . . . . . . . . . . . . . . . . . . . . . . . . . . . 1
Introduction . . . . . . . . . . . . . . . . . . . . . . . . . . . . . . . . . . . . . . . . . . . . . . . . . . . . . . . . . . . . . . . . . . . . . . . . . . . . . . . . . . . . . . . 1
Data-Collection Network. . . . . . . . . . . . . . . . . . . . . . . . . . . . . . . . . . . . . . . . . . . . . . . . . . . . . . . . . . . . . . . . . . . . . . . . . . . . . 1
Rainfall and Streamflow Data . . . . . . . . . . . . . . . . . . . . . . . . . . . . . . . . . . . . . . . . . . . . . . . . . . . . . . . . . . . . . . . . . . . . . . . . . 3
Stormwater Sampling: Conditions and Results . . . . . . . . . . . . . . . . . . . . . . . . . . . . . . . . . . . . . . . . . . . . . . . . . . . . . . . . . . . . 3
Hydrologic Conditions During Sampling and Data Collection, Storm of June 5, 2001 . . . . . . . . . . . . . . . . . . . . . . . 3
Sampling and Discharge Measurement Methods, Storm of June 5, 2001 . . . . . . . . . . . . . . . . . . . . . . . . . . . . . . . . . . 3
Analytical Results and Loads, Storm of June 5, 2001 . . . . . . . . . . . . . . . . . . . . . . . . . . . . . . . . . . . . . . . . . . . . . . . . . 9
Quality Assurance . . . . . . . . . . . . . . . . . . . . . . . . . . . . . . . . . . . . . . . . . . . . . . . . . . . . . . . . . . . . . . . . . . . . . . . . . . . . . . . . . . 10
References . . . . . . . . . . . . . . . . . . . . . . . . . . . . . . . . . . . . . . . . . . . . . . . . . . . . . . . . . . . . . . . . . . . . . . . . . . . . . . . . . . . . . . . . 10
FIGURES
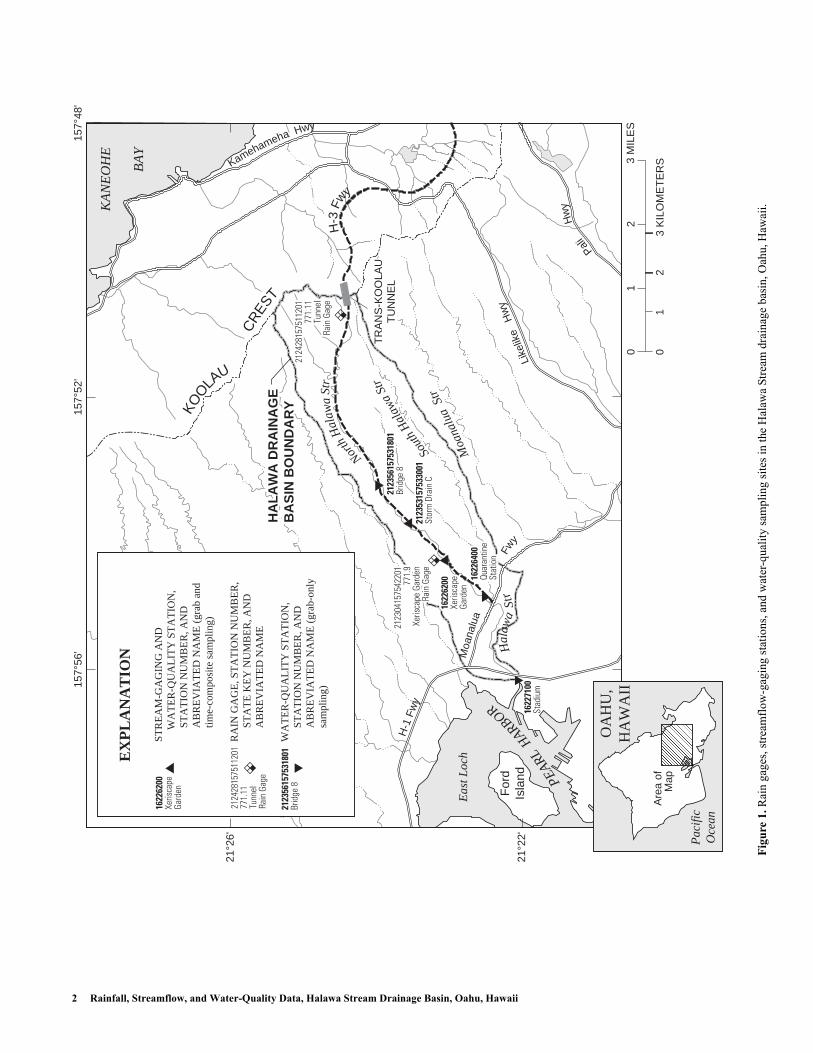
1. Map showing rain gages, streamflow-gaging stations, and water-quality sampling sites in the Halawa Stream drainage basin, Oahu, Hawaii . . . . . . . . . . . . . . . . . . . . . . . . . . . . . . . . . . . . . . . . . . . . . . . . . . 2
2.–4. Hydrographs showing:
2. Rainfall and stream discharge for stations within the Halawa Stream drainage basin, Oahu, Hawaii, for July 1, 2000 to June 30, 2001 . . . . . . . . . . . . . . . . . . . . . . . . . . . . . . . . . . . . . . . . . . . . . . . . . . . . . . . . 4
3. Stream discharge for Storm drain C (212353157533001) and Xeriscape garden (16226200) gaging stations, Oahu, Hawaii, for January 1 to March 31, 2001, and detailed hydrographs of the 2-day period from February 12-13, 2001 . . . . . . . . . . . . . . . . . . . . . . . . . . . . . . . . . . . . . . . . . . . . . . . . . . 5
4. Stream discharge for Storm drain C (212353157533001) and Xeriscape garden (16226200) gaging stations, Oahu, Hawaii, for April 1 to June 30, 2001, and detailed hydrographs of the 2-day period from 10:00 June 4, 2001 to 10:00 June 6, 2001. . . . . . . . . . . . . . . . . . . . . . . . . . . . . . . . . . . . . . . . 7
TABLES
1. Hydrologic conditions during grab-sample collection, June 5, 2001, Halawa Stream drainage basin, Oahu, Hawaii 9
2. Temperature, pH, and specific-conductance field measurements for grab samples collected on June 5, 2001, Halawa Stream drainage basin, Oahu, Hawaii . . . . . . . . . . . . . . . . . . . . . . . . . . . . . . . . . . . . . . . . . . . . . . . . . . . . 10
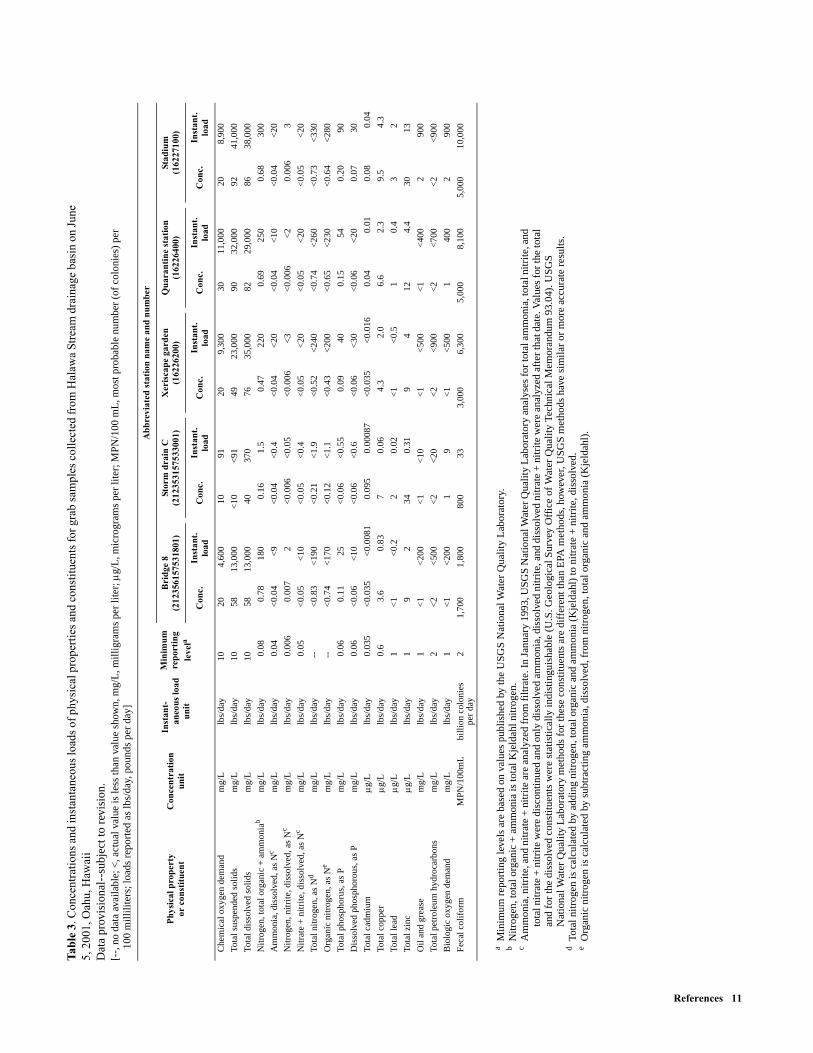
3. Concentrations and instantaneous loads of physical properties and constituents for grab samples collected from Halawa Stream drainage basin on June 5, 2001, Oahu, Hawaii. . . . . . . . . . . . . . . . . . . . . . . . . . . . . . . . . . . 11

Introduction 1
Abstract
The State of Hawaii Department of Transpor-tation Stormwater Monitoring Program was started on January 1, 2001. The program includes the col-lection of rainfall, streamflow, and water-quality data at selected sites in the Halawa Stream drainage basin. Rainfall and streamflow data were collected from July 1, 2000 to June 30, 2001. Few storms during the year met criteria for antecedent dry con-ditions or provided enough runoff to sample. The storm of June 5, 2001, was sufficiently large to cause runoff. On June 5, 2001, grab samples were collected at five sites along North Halawa and Hal-awa Streams. The five samples were later analyzed for nutrients, trace metals, oil and grease, total petroleum hydrocarbons, fecal coliform, biological and chemical oxygen demands, total suspended solids, and total dissolved solids.
INTRODUCTION
The State of Hawaii Department of Transportation (DOT) Stormwater Monitoring Program Plan (State of Hawaii Department of Transportation, 2000) was started on January 1, 2001, to monitor the Halawa Stream drainage basin, Oahu, Hawaii (fig. 1). The stormwater monitoring program plan was designed to fulfill permit requirements for the National Pollutant Discharge Elimination System (NPDES) program. The stormwater monitoring program plan includes the col-lection of rainfall, streamflow, and water-quality data at selected sites in the Halawa Stream drainage basin.
This report summarizes stormwater monitoring activities and water-quality data collected by the U.S. Geological Survey as part of the stormwater monitoring program plan. This report presents rainfall and stream-flow data collected during July 1, 2000 to June 30, 2001, as well as water-quality data for the period from the implementation of the stormwater monitoring pro-gram plan, January 1, 2001, to June 30, 2001. Included with the water-quality data are the descriptions of sam-pling activities during the 6-month sampling period.
DATA-COLLECTION NETWORK
As part of the ongoing stormwater monitoring pro-gram, rainfall, stream-stage, stream-discharge, and water-quality data are collected at selected sites in the Halawa Stream drainage basin (fig. 1). Rainfall data are collected at two sites, the North Halawa Valley rain gage at tunnel (abbreviated to Tunnel rain gage, 212428157511201) and the North Halawa rain gage near Honolulu (abbreviated to Xeriscape garden rain gage, 212304157542201). Stage and discharge data are collected at two sites within North Halawa Valley, at Storm drain C (212353157533001) and at Xeriscape garden streamflow-gaging station (16226200). A third streamflow-gaging station is under construction near the Quarantine station in North Halawa Valley. Rainfall and streamflow data are collected daily using cell phones and modems from the two rain gages and the two streamflow-gaging stations.
Water-quality data are collected at five sites, Bridge 8 (212356157531801), Storm drain C, Xeriscape garden, Quarantine station (16226400), and Stadium (16227100). The Bridge 8 site is located above
Rainfall, Streamflow, and Water-Quality Data During Stormwater Monitoring, Halawa Stream Drainage Basin, Oahu, Hawaii, July 1, 2000 to June 30, 2001
By Todd K. Presley
2 Rainfall, Streamflow, and Water-Quality Data, Halawa Stream Drainage Basin, Oahu, Hawaii
Sout
hH
alaw
aSt
r
Hal
awa
Str
North
Hal
awa
Str
Moa
nalu
aSt
r
Eas
t Loc
h
PEAR
LH
ARBOR
KA
NE
OH
E
BA
Y
HA
LA
WA
DR
AIN
AG
EH
AL
AW
A D
RA
INA
GE
BA
SIN
BO
UN
DA
RY
BA
SIN
BO
UN
DA
RY
2123
0415
7542
201
2123
0415
7542
201
771.
977
1.9
Xeris
cape
Gar
den
Xeris
cape
Gar
den
Rain
Gag
eRa
in G
age
2123
0415
7542
201
771.
9Xe
risca
pe G
arde
nRa
in G
age
1622
6400
1622
6400
Quar
antin
eQu
aran
tine
Stat
ion
Stat
ion
2123
5315
7533
001
2123
5315
7533
001
Stor
m D
rain
CSt
orm
Dra
in C
2123
5615
7531
801
2123
5615
7531
801
Brid
ge 8
Brid
ge 8
1622
6200
1622
6200
Xeris
cape
Xeris
cape
Gard
enGa
rden
1622
6400
Quar
antin
eSt
atio
n
2123
5315
7533
001
Stor
m D
rain
C
2123
5615
7531
801
Brid
ge 8
2124
2815
7511
201
2124
2815
7511
201
771.
1177
1.11
Tunn
elTu
nnel
Rain
Gag
eRa
in G
age
21°2
2'
21°2
6'
157°
52'
157°
56'
157°
48'
0 0
3 M
ILE
S2
23
KIL
OM
ET
ER
S
1
1
H-3
Fw
y
STR
EA
M-G
AG
ING
AN
D
W
AT
ER
-QU
AL
ITY
ST
AT
ION
,
STA
TIO
N N
UM
BE
R, A
ND
AB
RE
VIA
TE
D N
AM
E (
grab
and
time-
com
posi
te s
ampl
ing)
RA
IN G
AG
E, S
TA
TIO
N N
UM
BE
R,
ST
AT
E K
EY
NU
MB
ER
, AN
D
AB
RE
VIA
TE
D N
AM
E
WA
TE
R-Q
UA
LIT
Y S
TA
TIO
N,
ST
AT
ION
NU
MB
ER
, AN
D
A
BR
EV
IAT
ED
NA
ME
(gr
ab-o
nly
sa
mpl
ing)
TR
AN
S-K
OO
LAU
TU
NN
EL
KOO
LAU
CR
EST
EX
PL
AN
AT
ION
Kamehameha Hwy
H-1
Fwy
Moa
nalu
a
Fw
yLi
kelik
eH
wy
Pali
Hw
y
For
dIs
land
1622
6200
Xeris
cape
Gard
en
1622
7100
Stad
ium
1622
6200
Xeris
cape
Gard
en
2124
2815
7511
201
771.
11Tu
nnel
Rain
Gag
e
2124
2815
7511
201
771.
11Tu
nnel
Rain
Gag
e
2123
5615
7531
801
Brid
ge 8
1
1
1
HA
LA
WA
DR
AIN
AG
EB
AS
IN B
OU
ND
AR
Y
Are
a of
Map
OA
HU
,H
AW
AII
Pac
ific
Oce
an
Figu
re 1
. Rai
n ga
ges,
stre
amflo
w-g
agin
g st
atio
ns, a
nd w
ater
-qua
lity
sam
plin
g si
tes i
n th
e H
alaw
a St
ream
dra
inag
e ba
sin,
Oah
u, H
awai
i.

Rainfall and Streamflow Data 3
the discharge point of Storm drain C on North Halawa Stream. The Xeriscape garden gage is directly upstream from a light industrial area, the Quarantine station site is within the light industrial area, and both are on North Halawa Stream. The Stadium site is below the conflu-ence of North and South Halawa Streams, downstream from the crossing of H-1 freeway, and directly upstream from the mouth.
Water-quality samples are collected at least once per quarter from the five sites and include both grab and time-composite samples. In general, grab samples are collected manually using isokinetic, depth-integrating methods (Wilde and others, 1998), whereas time- composite samples are collected over a several-hour time period using an automatic (point) sampler. Isoki-netic sampling devices are designed with nozzles that allow stream water to enter the sample bottle at the same velocity as the ambient stream velocity. These sampling devices allow for the proper collection of sediment-laden stream water. Storm drain C and Xeriscape gar-den streamflow-gaging station are equipped with auto-matic samplers that allow composite samples to be collected from a single point in the storm drain or near the bank of the stream, respectively, for a minimum of 3 hours during the storm. A third automatic sampler is under construction at the Quarantine station site.
RAINFALL AND STREAMFLOW DATA
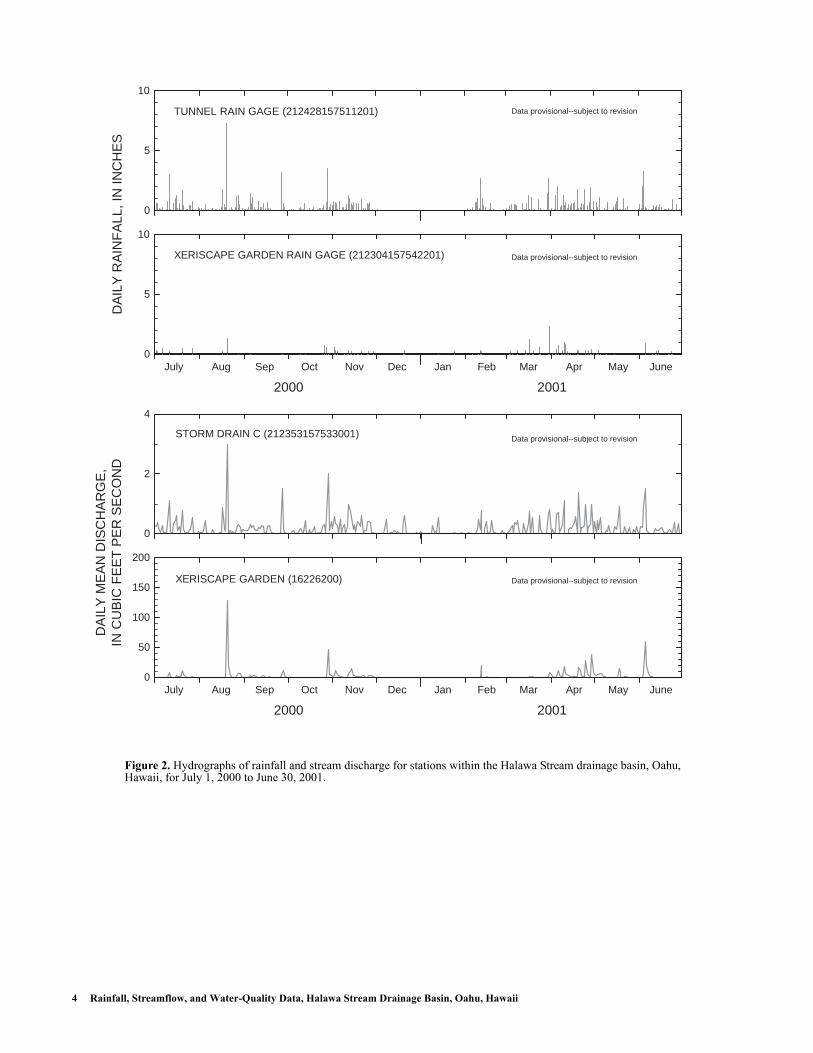
Hydrographs of daily rainfall and daily mean streamflow data for the period July 1, 2000 through June 30, 2001 are shown in figure 2. The highest daily rainfall at the Tunnel rain gage was 7.3 inches (in.) on August 20, 2000. Other days of high rainfall (daily rain-fall above 2.7 in.) at the Tunnel rain gage were July 11, September 27, and October 29, 2000, and February 12, March 31, and June 5, 2001. The highest daily rainfall at Xeriscape garden rain gage was 2.3 in. on March 31, 2001.
For Storm drain C, the highest daily mean dis-charge, 3.0 cubic feet per second (ft3/s), occurred on August 20, 2000. Daily mean discharge values greater than 1.5 ft3/s occurred on three other days within the 12-month period; September 27, 2000, October 29, 2000, and June 5, 2001. At Xeriscape garden streamflow- gaging station, the highest daily mean discharge also was on August 20, 2000, with a value of 129 ft3/s. Daily mean discharge values greater than 30 ft3/s also were recorded on October 29, 2000, April 29, 2001, and June 5, 2001.
STORMWATER SAMPLING: CONDITIONS AND RESULTS
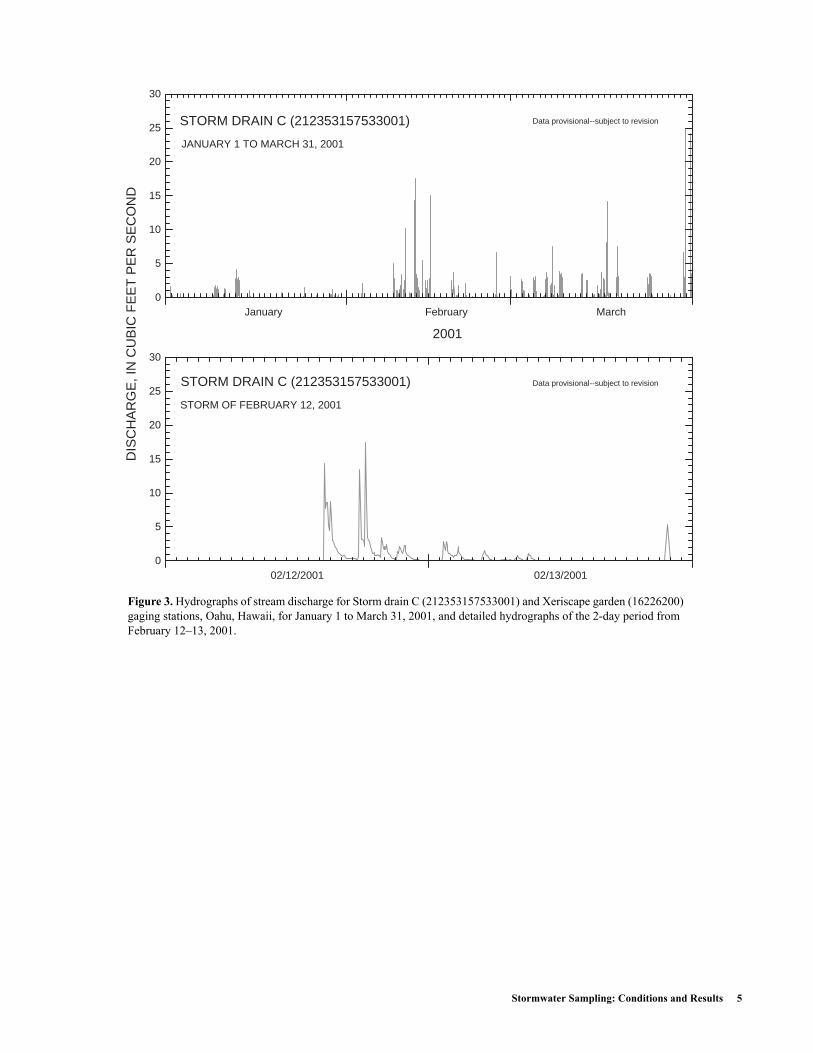
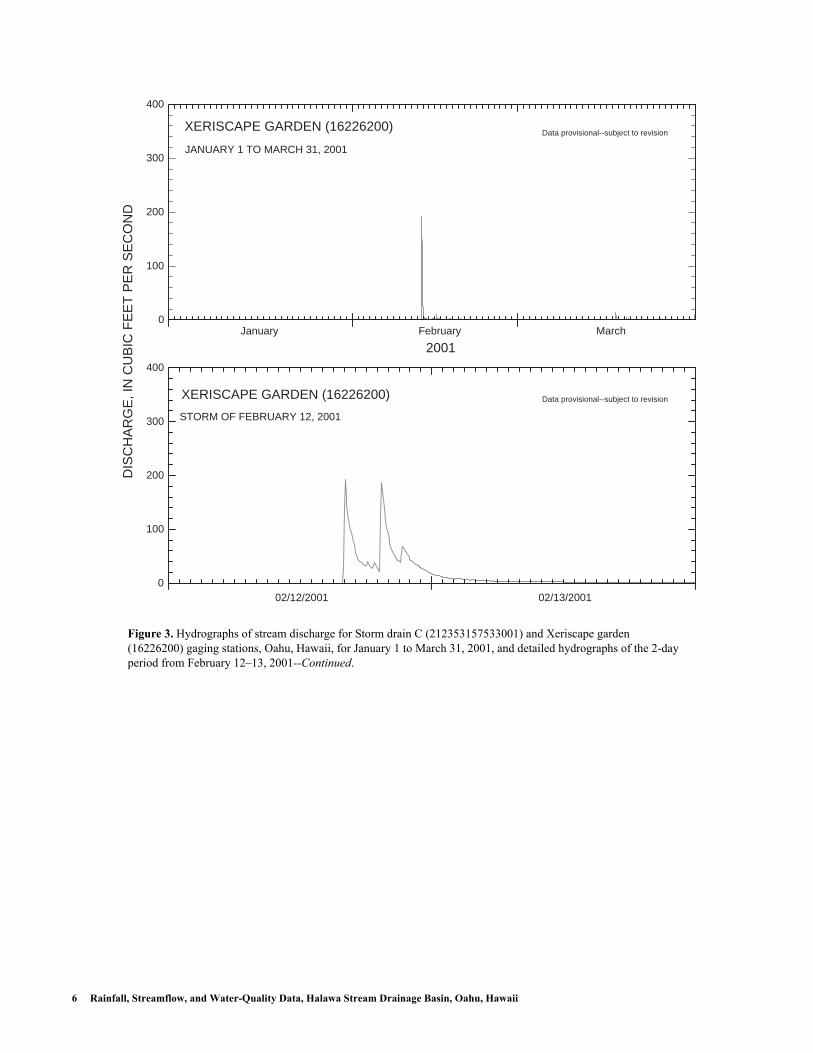
During the period January 1 through June 30, 2001, few storms met sampling criteria as outlined in the U.S. Environmental Protection Agency’s (USEPA) Storm Water Sampling Guidance Manual (U.S. Envi-ronmental Protection Agency, Office of Water, 1993). Only the June 5, 2001 storm was sampled. The February 12, 2001 storm met criteria to sample (fig. 3); however, this storm coincided with a week of instrumentation modifications, and no samples were collected. During April 2001, North Halawa Stream at the Xeriscape gar-den gage rose to a level high enough to sample on five different days (figs. 2 and 4). These events during April 2001 were not sampled because they did not meet ante-cedent dry weather criteria as outlined in the USEPA Storm Water Sampling Guidance Manual, which requires that sampling only should be performed on storms that are preceded by at least 72 hours of dry weather. At this gage, the stage that triggers the sampler is 1.24 ft over the stage of zero flow, which has been found by experimentation and previous experience to capture only the larger runoff events.
Hydrologic Conditions During Sampling and Data Collection, Storm of June 5, 2001
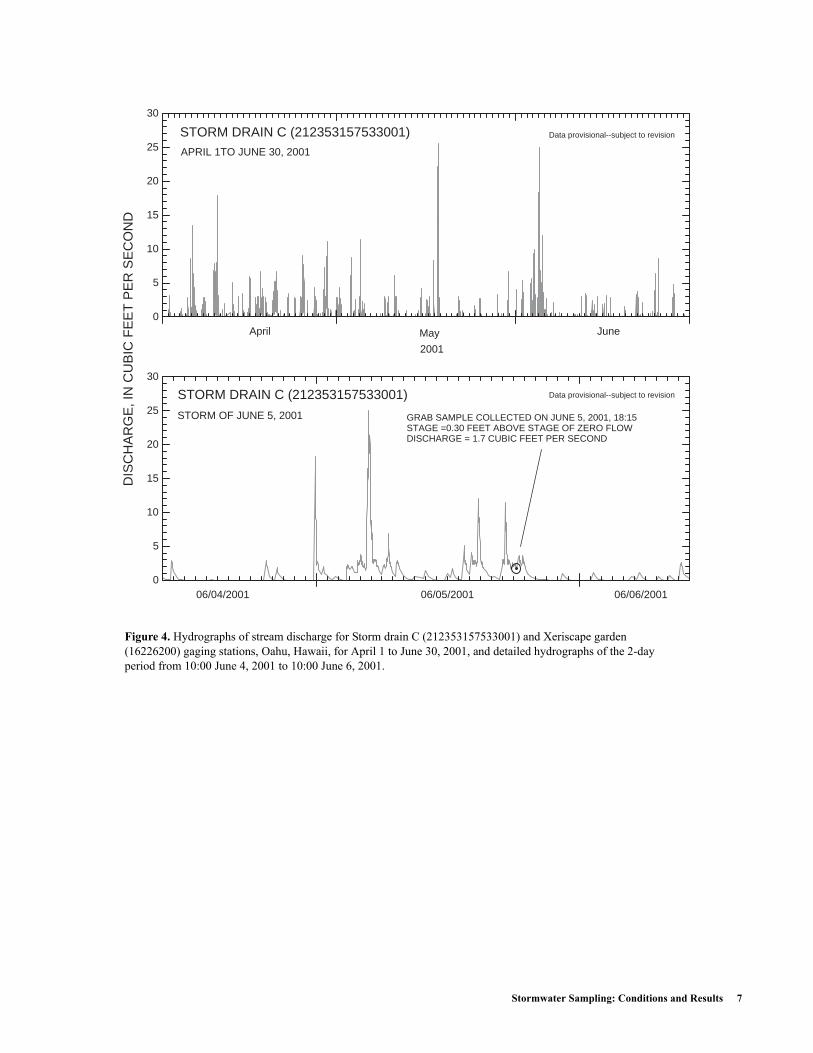
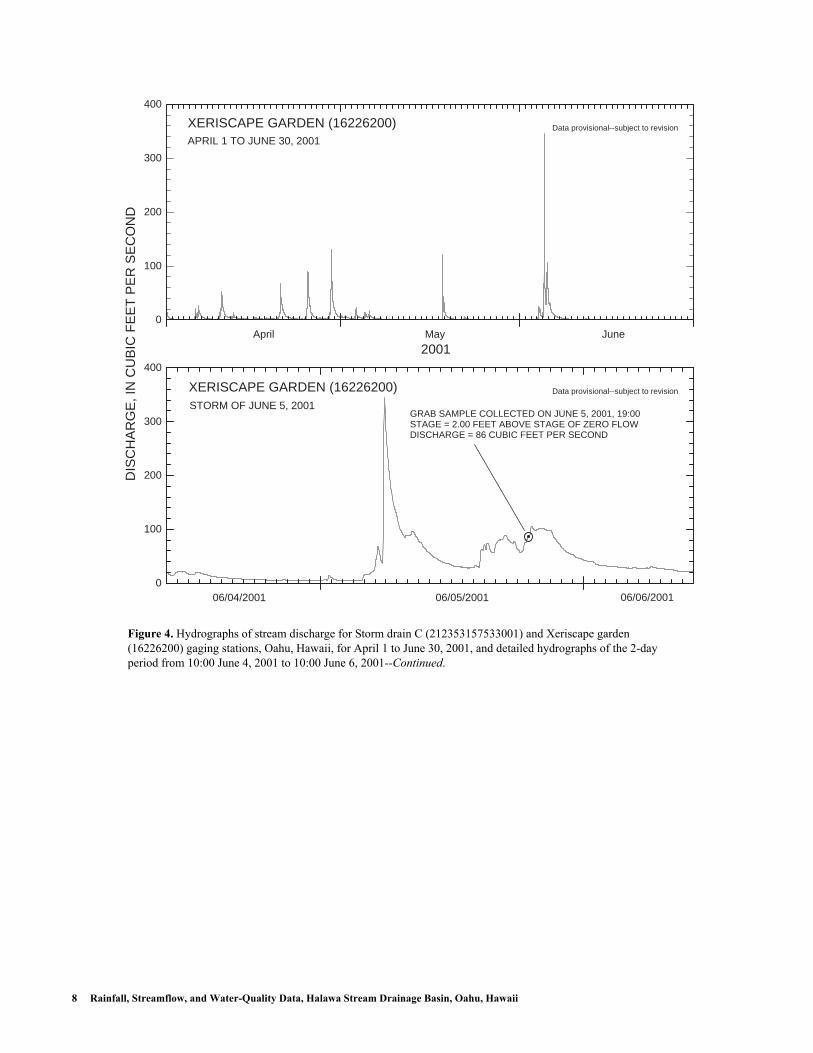
Hydrographs of streamflow at Storm drain C and Xeriscape garden during the storm of June 5, 2001 are shown in figure 4. Sample collection times also are dis-played in the storm hydrograph in figure 4. Time of sample collection and corresponding discharge at the time of sample collection are listed in table 1. Because of an equipment malfunction, samples were not col-lected until more than 12 hours after the peak of stream-flow. Ideally, samples should be collected as streamflow rises.
Sampling and Discharge Measurement Methods, Storm of June 5, 2001
Only grab samples were collected at five sites during the storm on June 5, 2001. Because of an equipment malfunction, composite samples were not collected at Storm drain C and Xeriscape garden streamflow-gaging station. No field duplicates were collected during this sampling.
4 Rainfall, Streamflow, and Water-Quality Data, Halawa Stream Drainage Basin, Oahu, Hawaii
Figure 2. Hydrographs of rainfall and stream discharge for stations within the Halawa Stream drainage basin, Oahu, Hawaii, for July 1, 2000 to June 30, 2001.
XERISCAPE GARDEN RAIN GAGE (212304157542201)
0
5
10
STORM DRAIN C (212353157533001)
0
2
4
DA
ILY
ME
AN
DIS
CH
AR
GE
, IN
CU
BIC
FE
ET
PE
R S
EC
ON
D
TUNNEL RAIN GAGE (212428157511201)
0
5
10
XERISCAPE GARDEN (16226200)
July Aug Sep Oct Nov Dec Jan Feb Mar Apr May June0
50
100
150
200
20012000
July Aug Sep Oct Nov Dec Jan Feb Mar Apr May June
20012000
Data provisional--subject to revision
Data provisional--subject to revision
Data provisional--subject to revision
Data provisional--subject to revision
DA
ILY
RA
INF
ALL
, IN
INC
HE
S
Stormwater Sampling: Conditions and Results 5
Figure 3. Hydrographs of stream discharge for Storm drain C (212353157533001) and Xeriscape garden (16226200) gaging stations, Oahu, Hawaii, for January 1 to March 31, 2001, and detailed hydrographs of the 2-day period from February 12–13, 2001.
JANUARY 1 TO MARCH 31, 2001
0
5
10
15
20
25
30
2001
January February March
STORM OF FEBRUARY 12, 2001
DIS
CH
AR
GE
, IN
CU
BIC
FE
ET
PE
R S
EC
ON
D
0
5
10
15
20
25
30
02/12/2001 02/13/2001
STORM DRAIN C (212353157533001)
STORM DRAIN C (212353157533001) Data provisional--subject to revision
Data provisional--subject to revision
6 Rainfall, Streamflow, and Water-Quality Data, Halawa Stream Drainage Basin, Oahu, Hawaii
Figure 3. Hydrographs of stream discharge for Storm drain C (212353157533001) and Xeriscape garden (16226200) gaging stations, Oahu, Hawaii, for January 1 to March 31, 2001, and detailed hydrographs of the 2-day period from February 12–13, 2001--Continued.
JANUARY 1 TO MARCH 31, 2001
0
100
200
300
400
2001January February March
STORM OF FEBRUARY 12, 2001
DIS
CH
AR
GE
, IN
CU
BIC
FE
ET
PE
R S
EC
ON
D
0
100
200
300
400
02/12/2001 02/13/2001
XERISCAPE GARDEN (16226200)
XERISCAPE GARDEN (16226200)
Data provisional--subject to revision
Data provisional--subject to revision
Stormwater Sampling: Conditions and Results 7
Figure 4. Hydrographs of stream discharge for Storm drain C (212353157533001) and Xeriscape garden (16226200) gaging stations, Oahu, Hawaii, for April 1 to June 30, 2001, and detailed hydrographs of the 2-day period from 10:00 June 4, 2001 to 10:00 June 6, 2001.
APRIL 1TO JUNE 30, 2001
May
0
5
10
15
20
25
30
2001
April June
STORM OF JUNE 5, 2001
DIS
CH
AR
GE
, IN
CU
BIC
FE
ET
PE
R S
EC
ON
D
0
5
10
15
20
25
30
06/04/2001 06/05/2001
GRAB SAMPLE COLLECTED ON JUNE 5, 2001, 18:15STAGE =0.30 FEET ABOVE STAGE OF ZERO FLOW DISCHARGE = 1.7 CUBIC FEET PER SECOND
STORM DRAIN C (212353157533001)
STORM DRAIN C (212353157533001)
06/06/2001
Data provisional--subject to revision
Data provisional--subject to revision
8 Rainfall, Streamflow, and Water-Quality Data, Halawa Stream Drainage Basin, Oahu, Hawaii
Figure 4. Hydrographs of stream discharge for Storm drain C (212353157533001) and Xeriscape garden (16226200) gaging stations, Oahu, Hawaii, for April 1 to June 30, 2001, and detailed hydrographs of the 2-day period from 10:00 June 4, 2001 to 10:00 June 6, 2001--Continued.
APRIL 1 TO JUNE 30, 2001
0
100
200
300
400
2001April May June
STORM OF JUNE 5, 2001
DIS
CH
AR
GE
, IN
CU
BIC
FE
ET
PE
R S
EC
ON
D
0
100
200
300
400
06/04/2001 06/05/2001
XERISCAPE GARDEN (16226200)
06/06/2001
XERISCAPE GARDEN (16226200)
GRAB SAMPLE COLLECTED ON JUNE 5, 2001, 19:00STAGE = 2.00 FEET ABOVE STAGE OF ZERO FLOW DISCHARGE = 86 CUBIC FEET PER SECOND
Data provisional--subject to revision
Data provisional--subject to revision

Stormwater Sampling: Conditions and Results 9
Bridge 8.-- Equal-width sampling technique (Wilde and others, 1998) was implemented using five evenly distributed sampling points along the cross sec-tion of the stream. Stream width was about 26 ft. A high-density polyethylene (HDPE) isokinetic sampling device was used to collect the sample. Discharge was estimated using float measurement techniques. Dis-charge was concentrated in the middle 6 feet of the stream cross section.
Storm drain C.--A grab sample was collected at the estimated centroid of flow by submersing the HDPE churn (sample splitting device). Discharge was deter-mined using the instantaneous stage at the time of sam-ple collection and the stage/discharge rating for this gage.
Xeriscape garden.--A grab sample was collected at the centroid of flow using an HDPE 1-liter open-mouth bottle. Discharge was determined using the stage at the mean time of sample collection and the stage/dis-charge rating for this gage. Sample water from this site also was used for “spiked” analyses of nutrients, metals and chemical oxygen demand.
Quarantine station.--Equal-width sampling tech-nique was implemented using 15 sampling points along the cross section of the stream. Stream width was about 20 ft. An HDPE isokinetic sampling device was used to collect the sample. Discharge was measured using a current meter.
Stadium.--A grab sample was collected at eight intervals spaced 5 to 6 ft apart, using an HDPE 1-liter open-mouth bottle due to the shallow depths and swift- moving water. Stream width was about 64 ft. Discharge measurement was made using a current meter. Sample water from this site also was used for duplicate analyses of nutrients, metals, and chemical oxygen demand.
Analytical Results and Loads, Storm of June 5, 2001
Field measurements of temperature, pH, and spe-cific conductance were measured by personnel. Fecal coliform and biological oxygen demand for the five grab samples were analyzed locally by Aecos Incorpo-rated laboratory, Oahu, Hawaii. All other analyses were completed by the National Water Quality Laboratory, Denver, Colorado.
Table 2 shows temperature, pH, and specific con-ductance for the five grab samples. Table 3 shows con-centrations and instantaneous loads of constituents required by the DOT Stormwater Monitoring Program plan (State of Hawaii Department of Transportation, 2000) for the five grab samples.
Table 1. Hydrologic conditions during grab-sample collection, June 5, 2001, Halawa Stream drainage basin, Oahu, HawaiiData provisional--subject to revision[--, no data available; ft3/s, cubic feet per second]
Abbreviated station name and station number
Time of peak discharge
Peak stage, in feet over stage of
zero flow
Peak discharge in ft3/s
Time of grab- sample
collection
Stage at time of grab- sample
collection, in feet over stage of
zero flow
Discharge at time of grab-
sample collection, in
ft3/s
Bridge 8 (212356157531801)
-- -- -- 17:15 -- 43
Storm drain C (212353157533001)
04:47 1.52 25 18:15 0.30 1.7
Xeriscape garden (16226200)
05:52 3.52 345 19:00 2.00 86
Quarantine station (16226400)
-- -- -- 17:20 -- 66
Stadium (16227100)
-- -- -- 16:05 -- 83

10 Rainfall, Streamflow, and Water-Quality Data, Halawa Stream Drainage Basin, Oahu, Hawaii
QUALITY ASSURANCE
Field and laboratory quality-assurance and quality-control procedures were implemented as described in the DOT Storm Water Monitoring Program Plan (State of Hawaii Department of Transportation, 2000). Rin-sate blanks were collected from the automatic sampler at Storm drain C before and after cleaning on April 2, 2001. The rinsate blanks were analyzed for nutrients, and for cadmium, copper, lead, and zinc. Concentra-tions of the analytes were at or below the minimum reporting level for the rinsate blank collected after cleaning the sampling lines. For the rinsate blank col-lected prior to cleaning, only zinc was above the mini-mum reporting level. The zinc concentration of this blank was 7 mg/L, and the minimum reporting level is 3 mg/L.
REFERENCES
State of Hawaii Department of Transportation, 2000, Storm water monitoring program plan, prepared by Belt Collins Consultants, 45 p.
U.S. Environmental Protection Agency, Office of water (1993), NPDES Storm water sampling guidance manual, prepared by C.K. Smoley, CRC Press, Inc. 165 p.
Wilde, F.D., Radtke, D.B., Gibs, Jacob, and Iwatsubo, R.T., 1998, National field manual for the collection of water-quality data, U.S. Geological Survey Techniques of Water-Resources Investigations, book 9, chapter A4, 114 p.
Table 2. Temperature, pH, and specific conductance field measurements for grab samples collected on June 5, 2001, Halawa Stream drainage basin, Oahu, HawaiiData provisional--subject to revision[°C, degrees Celsius; µS/cm, microsiemens per centimeter]
Physical property Unit Reporting
level
Abbreviated station name and number
Bridge 8(212356157531001)
Storm drain C (212353157533001)
Xeriscape garden (16226200)
Quarantine station
(16226400)
Stadium (16227100)
Temperature °C nearest 0.5°C 21.0 23.0 no measurement 23.0 25.0pH pH nearest 0.1 7.3 6.9 6.9 6.5 8.3Specific
conductance µS/cm 3 significant
figures88.8 65.6 94.5 101 116
References 11
Tabl
e 3.
Con
cent
ratio
ns a
nd in
stan
tane
ous l
oads
of p
hysi
cal p
rope
rties
and
con
stitu
ents
for g
rab
sam
ples
col
lect
ed fr
om H
alaw
a St
ream
dra
inag
e ba
sin
on Ju
ne
5, 2
001,
Oah
u, H
awai
iD
ata
prov
isio
nal-
-sub
ject
to r
evis
ion.
[--,
no
data
ava
ilabl
e; <
, act
ual v
alue
is le
ss th
an v
alue
sho
wn,
mg/
L, m
illig
ram
s pe
r lit
er; µ
g/L
, mic
rogr
ams
per
liter
; MPN
/100
mL
, mos
t pro
babl
e nu
mbe
r (o
f co
loni
es)
per
100
mill
ilite
rs; l
oads
rep
orte
d as
lbs/
day,
pou
nds
per
day]
aM
inim
um r
epor
ting
leve
ls a
re b
ased
on
valu
es p
ublis
hed
by th
e U
SGS
Nat
iona
l Wat
er Q
ualit
y L
abor
ator
y.
bN
itrog
en, t
otal
org
anic
+ a
mm
onia
is to
tal K
jeld
ahl n
itrog
en.
cA
mm
onia
, nitr
ite, a
nd n
itrat
e +
nitr
ite a
re a
naly
zed
from
filtr
ate.
In
Janu
ary
1993
, USG
S N
atio
nal W
ater
Qua
lity
Lab
orat
ory
anal
yses
for
tota
l am
mon
ia, t
otal
nitr
ite, a
nd
tota
l nitr
ate
+ n
itrite
wer
e di
scon
tinue
d an
d on
ly d
isso
lved
am
mon
ia, d
isso
lved
nit
rite
, and
dis
solv
ed n
itrat
e +
nitr
ite w
ere
anal
yzed
aft
er th
at d
ate.
Val
ues
for
the
tota
l an
d fo
r th
e di
ssol
ved
cons
titu
ents
wer
e st
atis
tical
ly in
dist
ingu
isha
ble
(U.S
. Geo
logi
cal S
urve
y O
ffic
e of
Wat
er Q
ualit
y Te
chni
cal M
emor
andu
m 9
3.04
). U
SG
S
Nat
iona
l Wat
er Q
ualit
y L
abor
ator
y m
etho
ds f
or th
ese
cons
titue
nts
are
diff
eren
t tha
n E
PA m
etho
ds, h
owev
er, U
SGS
met
hods
hav
e si
mila
r or
mor
e ac
cura
te r
esul
ts.
dTo
tal n
itro
gen
is c
alcu
late
d by
add
ing
nitr
ogen
, tot
al o
rgan
ic a
nd a
mm
onia
(K
jeld
ahl)
to n
itra
te +
nitr
ite, d
isso
lved
.e
Org
anic
nit
roge
n is
cal
cula
ted
by s
ubtr
acti
ng a
mm
onia
, dis
solv
ed, f
rom
nitr
ogen
, tot
al o
rgan
ic a
nd a
mm
onia
(K
jeld
ahl)
.
Phys
ical
pro
pert
y or
con
stitu
ent
Con
cent
ratio
n un
it
Inst
ant-
an
eous
load
unit
Min
imum
re
port
ing
leve
la
Abb
revi
ated
stat
ion
nam
e an
d nu
mbe
r
Bri
dge
8(2
1235
6157
5318
01)
Stor
m d
rain
C(2
1235
3157
5330
01)
Xer
isca
pe g
arde
n(1
6226
200)
Qua
rant
ine
stat
ion
(162
2640
0)St
adiu
m(1
6227
100)
Con
c.In
stan
t.lo
adC
onc.
Inst
ant.
load
Con
c.In
stan
t.lo
adC
onc.
Inst
ant.
load
Con
c.In
stan
t.lo
ad
Che
mic
al o
xyge
n de
man
dm
g/L
lbs/
day
1020
4,60
010
9120
9,30
030
11,0
0020
8,90
0
Tota
l sus
pend
ed s
olid
sm
g/L
lbs/
day
1058
13,0
00<
10<
9149
23,0
0090
32,0
0092
41,0
00
Tota
l dis
solv
ed s
olid
sm
g/L
lbs/
day
1058
13,0
0040
370
7635
,000
8229
,000
8638
,000
Nit
roge
n, to
tal o
rgan
ic +
am
mon
iab
mg/
Llb
s/da
y0.
080.
7818
00.
161.
50.
4722
00.
6925
00.
6830
0
Am
mon
ia, d
isso
lved
, as
Nc
mg/
Llb
s/da
y0.
04<
0.04
<9
<0.
04<
0.4
<0.
04<
20<
0.04
<10
<0.
04<
20
Nit
roge
n, n
itri
te, d
isso
lved
, as
Nc
mg/
Llb
s/da
y0.
006
0.00
72
<0.
006
<0.
05<
0.00
6<
3<
0.00
6<
20.
006
3
Nit
rate
+ n
itri
te, d
isso
lved
, as
Nc
mg/
Llb
s/da
y0.
05<
0.05
<10
<0.
05<
0.4
<0.
05<
20<
0.05
<20
<0.
05<
20
Tota
l nit
roge
n, a
s N
dm
g/L
lbs/
day
--<
0.83
<19
0<
0.21
<1.
9<
0.52
<24
0<
0.74
<26
0<
0.73
<33
0
Org
anic
nit
roge
n, a
s N
em
g/L
lbs/
day
--<
0.74
<17
0<
0.12
<1.
1<
0.43
<20
0<
0.65
<23
0<
0.64
<28
0
Tota
l pho
spho
rus,
as
Pm
g/L
lbs/
day
0.06
0.11
25<
0.06
<0.
550.
0940
0.15
540.
2090
Dis
solv
ed p
hosp
horo
us, a
s P
mg/
Llb
s/da
y0.
06<
0.06
<10
<0.
06<
0.6
<0.
06<
30<
0.06
<20
0.07
30
Tota
l cad
miu
mµg
/Llb
s/da
y0.
035
<0.
035
<0.
0081
0.09
50.
0008
7<
0.03
5<
0.01
60.
040.
010.
080.
04
Tota
l cop
per
µg/L
lbs/
day
0.6
3.6
0.83
70.
064.
32.
06.
62.
39.
54.
3
Tota
l lea
dµg
/Llb
s/da
y1
<1
<0.
22
0.02
<1
<0.
51
0.4
32
Tota
l zin
cµg
/Llb
s/da
y1
92
340.
319
412
4.4
3013
Oil
and
grea
sem
g/L
lbs/
day
1<
1<
200
<1
<10
<1
<50
0<
1<
400
290
0
Tota
l pet
role
um h
ydro
carb
ons
mg/
Llb
s/da
y2
<2
<50
0<
2<
20<
2<
900
<2
<70
0<
2<
900
Bio
logi
c ox
ygen
dem
and
mg/
Llb
s/da
y1
<1
<20
01
9<
1<
500
140
02
900
Fec
al c
olif
orm
MP
N/1
00m
Lbi
llio
n co
loni
es
per
day
21,
700
1,80
080
033
3,00
06,
300
5,00
08,
100
5,00
010
,000