Embed Size (px)
DESCRIPTION
Rain, Snow and Snowmelt changes in recent decades in western North America. Dan Cayan (1,2) Mike Dettinger (2,1) Iris Stewart (1) Noah Knowles (2) 1 SIO 2 USGS. - PowerPoint PPT Presentation
Citation preview

Rain, Snow and Snowmelt changes in recent decades in western North America
Dan Cayan (1,2) Mike Dettinger (2,1) Iris Stewart (1) Noah Knowles (2) 1 SIO 2 USGS
Climate of wet days is crucial to Western water.
An advance to earlier spring runoff timing from western snowmelt-dominated watersheds is observed since 1950’s.
What caused it? (precip timing, earlier melt, more rain, PDO shift)?

Western US Annual Precipitation
mountain precipitation is crucial resource
Topography

In the West, many of the wettest days occur during WARM storms when temperatures are near rain/snow
threshhold at middle (1000-2500m) elevations
PPT (mm)

In the Sierra Nevada, ~20 precip days provide 2/3 of annual precip
These days play out during a short season when N Pac storms are active.

mm/day
mm/day
Sacramento Headwaters
San Joaquin Headwaters Snowmelt
Hydrological effect of warmer mid-elevation and cooler high-elevation zonesis seen in comparing snowmelt runoff timingbtw Sacramento (lower elev)and San Joaquin (higher elev)
Noah Knowles

If the Sierrawarms by +2C
Yosemite loses
about 20% ofsnow covered
area
Mike Dettinger

With climate warming, California would lose much of its late spring Snowpack
By the end of the century California could lose half of its late spring snow pack due to climate warming. This simulation by Noah Knowles is guided by temperature changes from PCM’s Business-as-usual coupled climate simulation.
Noah Knowles
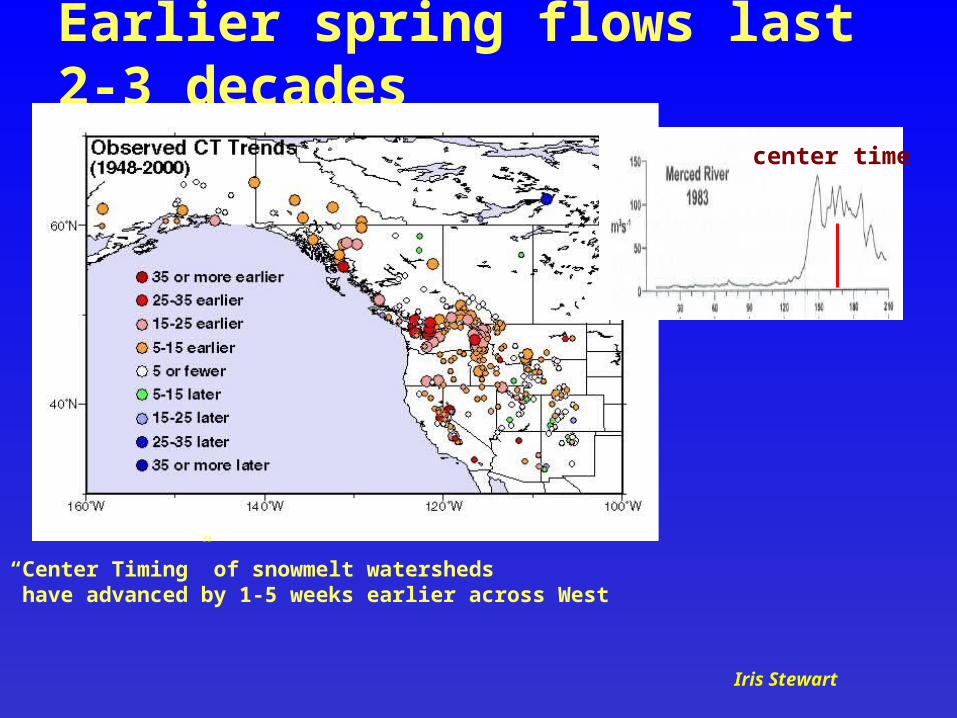
Earlier spring flows last 2-3 decades
“Center Timing” of snowmelt watersheds have advanced by 1-5 weeks earlier across West
Iris Stewart
center time

Precipitation Timing Trends
Earlier streamflow in recent decadesHas occurred despitePrecip coming later
But in the West,Precip has come later!
Streamflow Timing Trends

Earlier streamflow
Later streamflow
Atmospheric Circulation has driven warmer spring temperature and ealier runoff
Warming Trend Spring Iemp1950-1997

Warm phase of PDO yields earlier snowmelt

But, streamflow timing correlations are even stronger with spring temperature anomalies
TI is 4mo mean temp anompreceding &during month of CT

Partial correlations:streamflow timing fluctuations are quite strongly affected by spring temperature (TI)Warm TI anomalies Produce earlier CT’s.
PDO has evidently had an influence, but notas much as TI

Winter and especiallySpring temperatures were warmer in the western United States during 1977-1998relative to 1950-1976
But this map reflectsdry days (ppt=0) only—thisSuggests that there wasEarlier snowmelt
Dec-Feb
Mar-May
Examining temperature anomalies more carefully: 1977-1998 minus 1950-1976 Tmin dry days only

Dry days Wet days
Dec-Feb
But, in addition to dry days wet days were warmer during 1977-1998

Time spent in Warm-Wet patterns
pe
rce
nt
of
da
ys
pe
rce
nt
of
da
ys
Time spent in Cool-Wet patterns
Mike Dettinger
Changes in synoptic patterns were involved in the shift toward earlier spring flows:
a different mix of wet days

Peak temp changes occurred in March and April
Dec-Feb
Jan 1977-1998 minus 1950-1976 Tmin
wet days (>6mm precip)
Feb
Jan
Apr
Mar
May

Summary
Rain vs. snow is crucial to water issues in the West. In California’s Sierra Nevada, only 20-30 days deliver most of the year’s water.
Timing of spring runoff advanced 1-3 wks in decades after 1977 r.e. decades before Causes:
Winter and esp Spring temp Certainly dry days but also wet days were involved—this
suggests not only early snowmelt but more immediate rainfall runoff occurred.
PDO contributed, but other climate anomalies resulting in warmer winters & spring were evidently stronger influences.
Since 1998, PDO reversed but spring temp and spring flows did not reverted
Need more & better monitoring at mid-high elevations