Embed Size (px)
Citation preview
az1751
Rain Gauges for Range Management: Precipitation Monitoring Best Practices Guide
Michael A. Crimmins, Mitchel McClaran, Julie Brugger, Ashley Hall, Douglas Tolleson and Andrew Brischke
November 2017
IntroductionPrecipitation in the form of rain and snow is critical to
many aspects of working lands from controlling the growth of vegetation used in grazing by livestock and wildlife to recharging local water resources found in springs, tanks and riparian areas. Land management decisions often require some knowledge of how much precipitation fell within a management unit to assess how past actions have performed and what to do next. For example, do forage conditions reflect a lack of precipitation or grazing management? Did the next pasture or allotment in my rotation get any rainfall over the past season?
Given that precipitation monitoring is important, where and how do we usually get this information? Typically, we consult websites and maps that track precipitation observations from airports and backyard observers. These ‘official’ sites, managed by volunteer and federal agency programs, do a good job of maintaining a steady stream of high quality data, but often are located near cities away from rural and backcountry areas where the bulk of land management activities occur. Estimates provided by interpolating between these official gauges can provide just that, estimates. Knowing how much and when precipitation fell in your pasture, allotment or land management unit is a key variable for sound decision making and requires collecting precipitation data directly at that site.
Overall, this “best practices” guide will cover some of the basic approaches to collecting and using precipitation observations at remote sites in support of rangeland management including:
§ Tying observations to a drought plan
§ Where to place gauges and how often to record observations
§ Managing and using precipitation observations
This guide will also highlight some new tools that help put your precipitation observations into a longer-term climatological context. Knowing how much it rained is one thing, but knowing that observation is below average for that location and time period is additional insight critical to interpreting and using that piece of information to support a management decision.
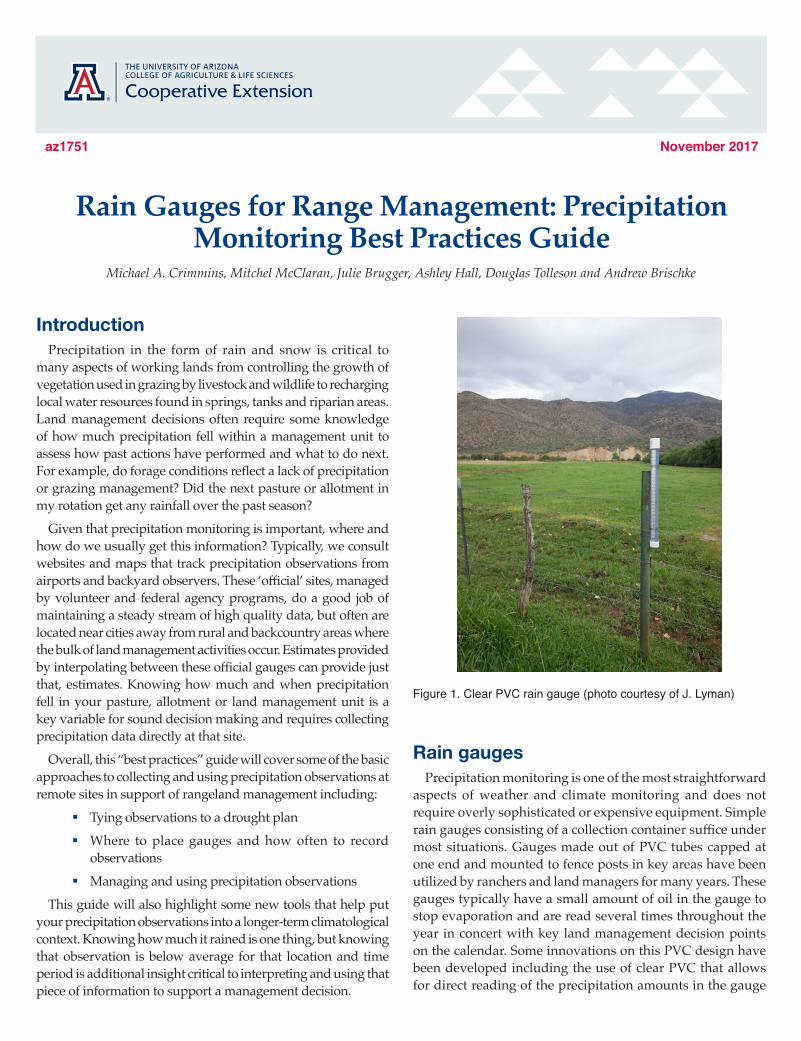
Figure 1. Clear PVC rain gauge (photo courtesy of J. Lyman)
Rain gaugesPrecipitation monitoring is one of the most straightforward
aspects of weather and climate monitoring and does not require overly sophisticated or expensive equipment. Simple rain gauges consisting of a collection container suffice under most situations. Gauges made out of PVC tubes capped at one end and mounted to fence posts in key areas have been utilized by ranchers and land managers for many years. These gauges typically have a small amount of oil in the gauge to stop evaporation and are read several times throughout the year in concert with key land management decision points on the calendar. Some innovations on this PVC design have been developed including the use of clear PVC that allows for direct reading of the precipitation amounts in the gauge
2 The University of Arizona Cooperative Extension
and a drainage valve that simplifies resetting the gauge each season [example in figure 1; see companion bulletin titled How to construct a rugged accumulation precipitation gauge for remote monitoring.]
More sophisticated precipitation monitoring approaches exist like using tipping bucket rain gauges with electronic dataloggers, but bring with them some tradeoffs when compared to simpler methods. Tipping bucket gauges can collect high resolution information on the timing and intensity of precipitation, but are expensive and can fail due to technical glitches or battery issues in remote locations. The added information on timing and intensity of precipitation is only useful if management actions can be tied to these data. Tipping buckets should be deployed with simple backup gauges to ensure that data on total precipitation is collected in the event that a dataloggers fails.
Developing a precipitation monitoring plan
Knowing how many gauges you need and where to place them requires some thought on the types of management decisions you have to make (e.g. grazing rotations, anticipating impacts to water sources) and the geography of your operation. The number of gauges and how often you read them and use their data will require an optimization of time and resources relative to your operation. More gauges, read more frequently, will clearly provide more information on precipitation across your management area, but this should match your management plan. For example, if you had grazing rotation that cycled through three pastures over the course of a year you could first assess how many rain gauges would be required to adequately capture the variability for those pastures. If the pastures were relatively small, one gauge in an open easily accessible area per pasture may suffice. If the pastures are large with large amounts of topographic relief, more gauges may be required (e.g. one for higher elevation area of the pasture and one for lower areas). Through your pasture rotation calendar, you could first read the gauge or gauges in your current pasture, then the next pasture in your rotation to anticipate how forage conditions may develop there. The final pasture could be read last to plan for conditions the following year or to assess if it could be used in a drought situation as a backup. Collecting information on forage conditions and water sources, with notes and photo points, is also critical at each gauge reading to make use of the precipitation data over time.
More gauges are better than fewer (or can’t hurt)
Tying gauge locations and a schedule for reading them directly into management plans is the best approach for making precipitation data useful (for examples of drought contingency plans – see University of Arizona extension
bulletin An Easy to Use System for Developing a Drought Management Contingency Plan (https://extension.arizona.edu/sites/extension.arizona.edu/files/pubs/az1725-2017.pdf.) Any approach, though, that facilitates the collection of observations at remote areas that can be used to support decision making is worth considering. Rugged, remote rain gauges that have an oil barrier to stop evaporation are relatively inexpensive, require little maintenance and can be read infrequently making them ideal for deployment at numerous locations. Some strategies to consider include:
▪ Collect data at house, ranch headquarters, or rangerstation – frequent observations at these locations canprovide good reference points from which to comparereadings made at remote gauges.
▪ Place gauges in locations you drive by often – gauges that are readily accessible for quick visits near roads allow formore frequent observations. Mounting gauges on fenceposts near gates may even allow for ‘drive thru’ readings.These may be close enough to other key monitoringareas to provide useful information in interpreting localconditions.
▪ Use topography as a guide – higher elevation areastypically get more precipitation than lower elevationareas, so capturing observations at the highest and lowest points of your management area can often give you anindication of the range of precipitation that occurred over the area. A couple of gauges in middle elevation areascan also serve as a check on this logic.
▪ No such thing as ‘too many gauges’ – since PVC gaugesare inexpensive to build and require little maintenancethere is no harm in placing gauges in locations where you don’t immediately need the information, but may needit at some point in the future. If a gauge is sufficientlytall, given the precipitation that typically occurs atthat location, it can continue to collect cumulativeprecipitation for seasons to years. This type of monitoring could be useful at especially remote sites that are visited every couple of years to assess longer term changes.
Managing and using precipitation dataA key part of your precipitation monitoring plan is
developing a way to log and interpret your observations. Ideally, the precipitation values you observe at each gauge will help guide a specific decision or management action. This requires tying different precipitation levels to specific time periods and decisions. For example, a ranching drought contingency plan can be set up to trigger different management actions when a location reaches different levels of drought intensity at different times of the year (see University of Arizona Extension Bulletin An Easy to Use System for Developing a Drought Management Contingency Plan (https://extension.arizona.edu/sites/extension.arizona.edu/files/pubs/az1725-2017.pdf). This requires being able to
3The University of Arizona Cooperative Extension
put your precipitation observations into some kind of long-term, climatological context. If you have a long-term set of observations (at least 10 years, but longer is better) at your rain gauge you can get a sense of whether or not the values are unusually wet or dry for the time of year at that location. Two new tools exist specifically for helping with tracking accumulated precipitation at new and existing gauges and providing climatological context for the observations:
▪ The Precipitation Logbook Generator (https://goo.gl/JswZJJ) allows you to create a printable logbook with reference climate information for any gauge location in the continental U.S. (See Appendix A, below, with guidance on how to use the Logbook generator)
▪ The myRAINge Log web application (https://myraingelog.arizona.edu) allows you to manage data for multiple gauges and provides tools to generate supporting reference climate information, precipitation alerts, and summary reports.
Both of these tools rely on using historical gridded climate data (for more info see Weiss J, Crimmins MA (2016) Gridded datasets of daily surface meteorological variables. Arizona Cooperative Extension az1704, https://extension.arizona.edu/sites/extension.arizona.edu/files/pubs/az1704-2016_0.pdf) to generate reference climate statistics for a specified location. Figure
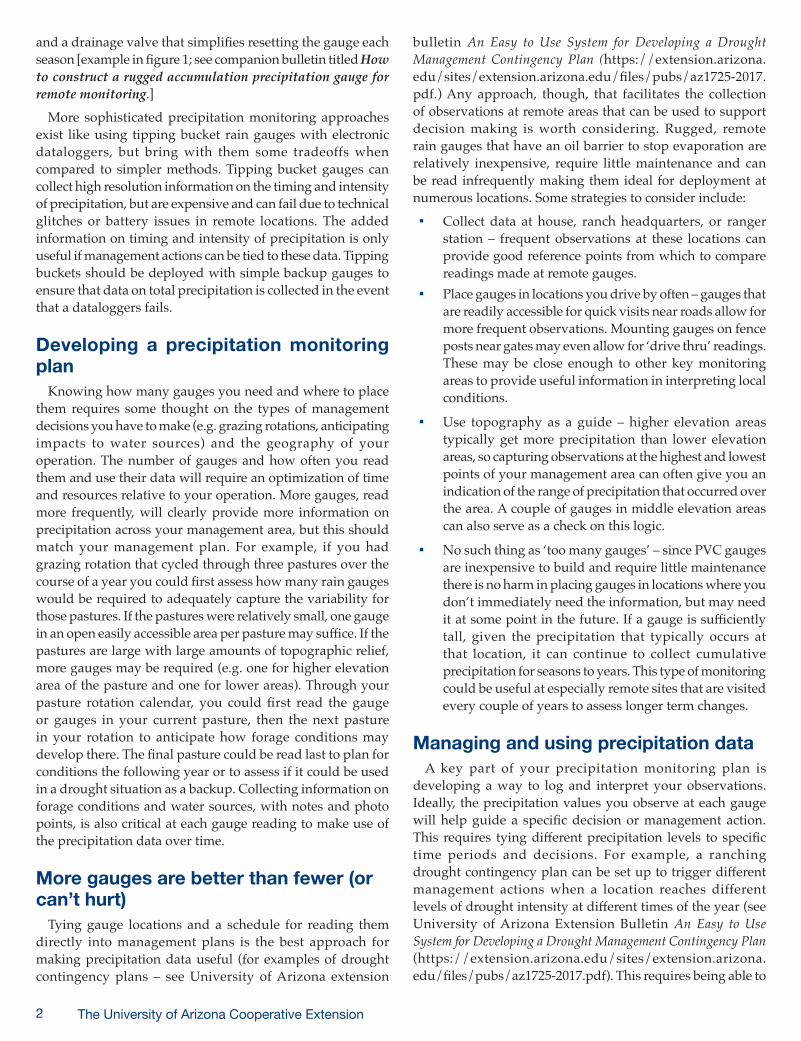
2 shows an example cumulative precipitation chart generated for a location in Arizona using the Precipitation Logbook. The chart was customized to track precipitation for the summer monsoon season from June 15th to September 30th. The smooth curves (dashed and solid black lines) were generated from 35 individual seasonal cumulative precipitation estimates for that location (1981-2015 time period). The curves represent how common or rare a particular cumulative precipitation total is relative to these historical estimates Generator (see inset box below for more information on the Cumulative Precipitation). The solid black line that runs through the middle of all of the curves is the median or 50th percentile value and is the middle of all observed historical cumulative values through the season. The other lines include:
▪ 2nd percentile: Very dry conditions, with only 2% of historical values at or below this precipitation amount; roughly corresponds to 2 standard deviations below average in a normal distribution.
▪ 16th percentile: Dry conditions, with 16% of historical values at or below this precipitation amount; roughly corresponds to 1 standard deviation below average in a normal distribution.
▪ 98th percentile: Very wet conditions, with 98% of historical values below this precipitation amount (inversely, only 2% of observations greater than this
Figure 2.Example cumulative precipitation reference climatology chart with observations plotted.
4 The University of Arizona Cooperative Extension
value); roughly corresponds to 2 standard deviations above average in a normal distribution.
The red line on the chart in Figure 2 provides an example of how actual observations could be entered and interpreted. In this example, the gauge is a typical PVC type gauge at a remote site with an oil evaporation barrier allowing precipitation to accumulate over time. The gauge is empty at the beginning of the monsoon season on June 15th. The first observation is made on July 12th and the gauge is still empty. The black line (median/50th percentile) indicates that this location typically receives 1” of cumulative precipitation between June 15th and the first observation date of July 12th. The zero inch observation falls on the 2nd percentile indicating that the site is very dry and rarely so for that date. It is early in the season, but this very dry observation could trigger a management action depending on the site and the objective.
The next observation is made on August 2nd and the gauge total has risen to 3.75”. On the chart, this cumulative total is now above the 84th percentile or into the ‘very wet’ part of the historical distribution. This quick turnaround from dry to wet is not uncommon in Arizona during the summer monsoon season where a handful (or even one) thunderstorm can drop several inches of rain. Another observation was made on August 16th with a value of 4.13”. This value was now slightly below the 84th percentile, but still above the
Cumulative precipitation is a bit different than the way we typically see precipitation represented in discrete daily, monthly or seasonal totals on maps and charts. This is the running total from some start date, consistent with the way precipitation accumulates in a PVC gauge over time. You can check the depth of water in the PVC gauge at various times over a season and this value will represent the cumulative precipitation amount until you empty the gauge.
median cumulative value for this time of year. The final two observations of 5.97” on August 31st and 6.74” on September 30th both fell between the 50th and 84th percentiles, indicating that cumulative precipitation kept pace ahead of the long-term median values and were wetter than historical values through the end of the season. The relatively frequent observations, every couple of weeks, help detect some subtle shifts in the timing of precipitation throughout the season. Reading the gauge once in the season at the end of the September would have missed the potential impact of the early season dry spell on subsequent range conditions and water resources.
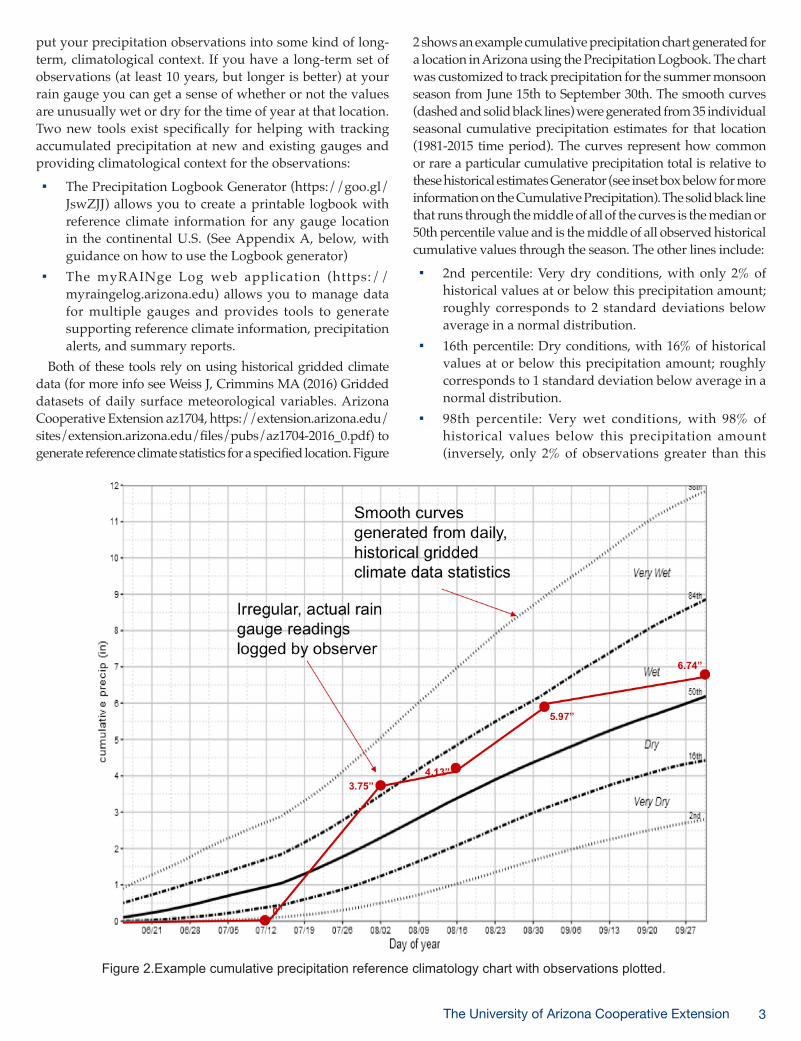
Figure 3. Example cumulative precipitation reference climatology chart with different set of precipitation observations plotted.

5The University of Arizona Cooperative Extension
Figure 3, shows an example with the exact seasonal total, but different sequence of rain events with the bulk of total precipitation coming later in the season. Very dry conditions prevailed right up until September where precipitation totals quickly rose to an above median seasonal total by the end of the month. This location was dry for most of the summer and presumably suffered significant drought impacts due to this pattern precipitation over the summer season. The frequent observations through the summer help capture this pattern and also help decipher why this location might be showing drought impacts even though the seasonal total is near what is expected for this time of year.
Checking a gauge more frequently and plotting these observations on a chart like the ones in Figures 1 and 2 can provide more insight into the timing, intensity and frequency of precipitation events throughout a season. This can help provide insight into, for example, why rangeland conditions don’t readily reflect the seasonal total captured in a gauge. It could be that all of the rainfall came in a handful of events at the end of the season which would cover up the fact that soil moisture levels were actually very poor throughout the early part of the season. This can be challenging and cost and time
prohibitive to do at very remote sites. Tying when and how often to check a gauge to the timing of specific management actions can help in developing an observation schedule.
Putting it all together: Connecting decisions with precipitation observations
Having a seasonal precipitation reference climatology chart, like the ones in figures 2 and 3, could help support developing a decision calendar. This would help you decide when to check precipitation observations at different management areas, and what to do if the observation represents drier or wetter conditions than would be expected for that date and location. Take figure 4 as an example of a record of cumulative summer monsoon season (June through September) precipitation at a location in Arizona. The monsoon season provides critical precipitation to support summer forage production. Subtle shifts in timing, intensity and rain event frequency can impact forage production in subtle, but profound ways. The figure shows a precipitation monitoring plan with three observation points through the summer to:
Figure 4: Example of likely decision points regarding livestock management over the course of a summer monsoon season.
6 The University of Arizona Cooperative Extension
1) anticipate the timing of forage “green up” in the current or next pasture in a rotation
2) assess ‘near peak’ forage production to assess whether or not adjustments to the rotation schedule are necessary
3) final check of conditions at the end of the season to assess total precipitation amounts and the carry over in production that will be available for subsequent seasons.
In this example, based on prior experience and ability to check gauges throughout the season, three dates were settled on for this plan. The first check at July 20th indicated that no precipitation had fallen yet at this location, which is unusual given the precipitation climatology curves on the chart. Zero precipitation at this date is near record dryness for this location falling below the 2nd percentile curve. This may indicate that a substantial delay in production will occur and may require delaying moving the herd into this pasture if forage “green up” was needed before entry.
The second observation point in this plan occurred on August 23rd, near the middle of the summer monsoon growing season. The expectation was that ‘near peak’ forage conditions would be occurring, based on experience with the receipt of normal rainfall up to this point. The observed precipitation was 3 inches at this point and just below the median expected cumulative precipitation for this date or slightly drier than expected. Forage conditions may be lagging behind expectations given this amount of precipitation. This mid-season observation can serve to assess how long you can stay in this pasture and whether or not any course corrections need to be made to the grazing schedule going forward.
The final observation, made at the end of the season on September 30th, served as a wrap up assessment of total precipitation and conditions at the site. The observation of 6.74” was just above the long-term median value and would suggest site conditions would be near average as well.
The three observations made during the course of the season-- the late start of precipitation at beginning of the season, slightly dry conditions at the midpoint, and the final near median observation--together tell a richer story than the just the final observation alone. Overall production at the site may be less than expected given the late start and meager precipitation in the middle of the season, even though the final total is near median. The final observation also gives you a chance to assess how much carryover forage will be available in subsequent seasons, allowing for moving directly into the next season’s plan. This type of monitoring plan can be made for any season or for the whole 12-month seasonal cycle if that makes more sense for your operation.
Collecting additional, supporting observations
Precipitation observations, even with climatological context, only provide part of the story when determining a management decision. When visiting a gauge, consider collecting additional observations of range and forage conditions, spring or water tank levels if nearby and any other observations that will help you interpret your precipitation values. These observations can be entered on your Precipitation Logbook sheet or in your myRAINge account or just jotted down in a field book. Also note if you took any management actions at that time based on your observations. Over time, these observations will grow into a valuable site specific dataset that will help tune up your management toolbox associated with different precipitation observations.
Another valuable way of collecting these types of observations is by taking photos of the site when visiting your gauge. Taking four photos, one in each cardinal direction (N-S-E-W), with the gauge in the foreground, provides a comprehensive view of the local site conditions. Here are several links to additional resources on rangeland photopoint monitoring::
▪ Using Repeat Color Photography as a Tool to Monitor Rangelands (L. Howery and P. Sundt, 1998) https://extension.arizona.edu/sites/extension.arizona.edu/files/pubs/az1024-2016_0.pdf
▪ Fast and easy rangeland monitoring using repeat photography (F. Mashiri, 2015) http://ucanr.edu/blogs/blogcore/postdetail.cfm?postnum=16616
▪ Photo Monitoring for Ranchers Technical Guide (A. Gearhart and K. Launchbaugh, 2015) https://catalog.extension.oregonstate.edu/pnw671
Contributors Rangeland Precipitation Monitoring Working Group
consisting of members of the Gila County Cattle Growers Association, ranchers with permits on the Tonto National Forest and staff with the U.S. Forest Service-Tonto National Forest.
Acknowledgements Special thanks to B. Benne, R. Tanner, and M. Hemovich
for providing initial project ideas and guidance. Funding provided by Western Extension Risk Management Education program.
7The University of Arizona Cooperative Extension
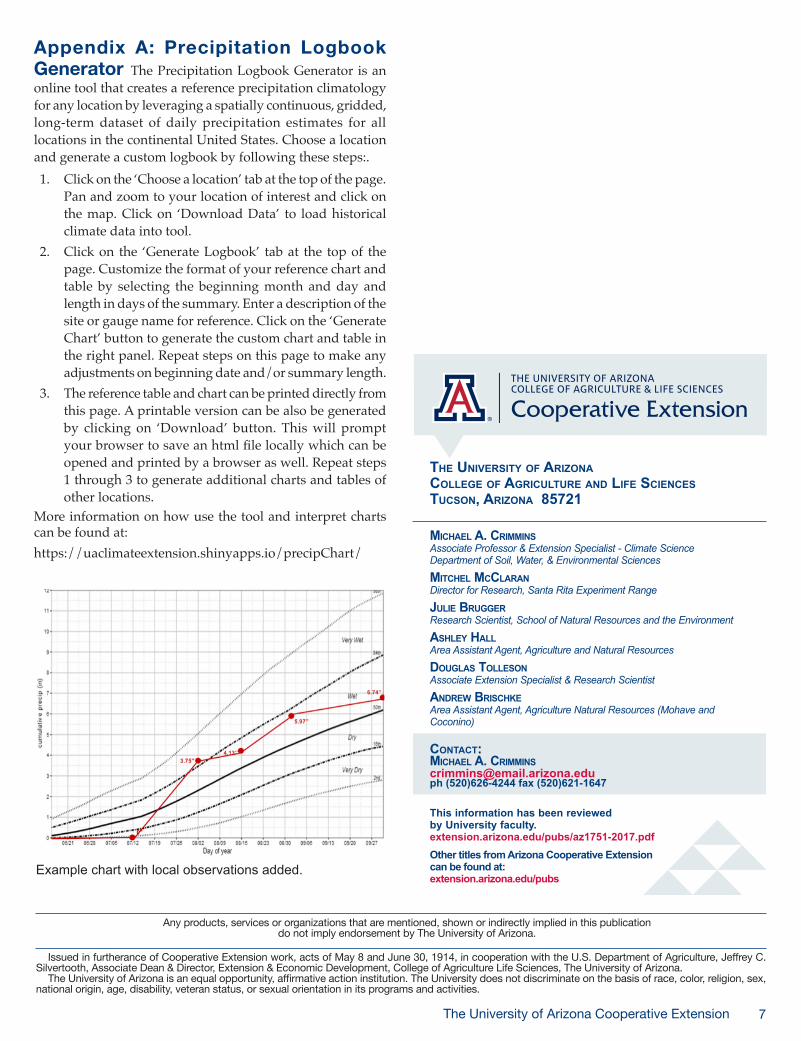
Appendix A: Precipitation Logbook Generator The Precipitation Logbook Generator is an online tool that creates a reference precipitation climatology for any location by leveraging a spatially continuous, gridded, long-term dataset of daily precipitation estimates for all locations in the continental United States. Choose a location and generate a custom logbook by following these steps:.1. Click on the ‘Choose a location’ tab at the top of the page.
Pan and zoom to your location of interest and click on the map. Click on ‘Download Data’ to load historical climate data into tool.
2. Click on the ‘Generate Logbook’ tab at the top of the page. Customize the format of your reference chart and table by selecting the beginning month and day and length in days of the summary. Enter a description of the site or gauge name for reference. Click on the ‘Generate Chart’ button to generate the custom chart and table in the right panel. Repeat steps on this page to make any adjustments on beginning date and/or summary length.
3. The reference table and chart can be printed directly from this page. A printable version can be also be generated by clicking on ‘Download’ button. This will prompt your browser to save an html file locally which can be opened and printed by a browser as well. Repeat steps 1 through 3 to generate additional charts and tables of other locations.
More information on how use the tool and interpret charts can be found at:https://uaclimateextension.shinyapps.io/precipChart/
Example chart with local observations added.
The UniversiTy of ArizonACollege of AgriCUlTUre And life sCienCesTUCson, ArizonA 85721
MiChAel A. CriMMins Associate Professor & Extension Specialist - Climate ScienceDepartment of Soil, Water, & Environmental Sciences
MiTChel MCClArAn Director for Research, Santa Rita Experiment Range
JUlie BrUgger Research Scientist, School of Natural Resources and the Environment
Ashley hAll Area Assistant Agent, Agriculture and Natural Resources
doUglAs Tolleson Associate Extension Specialist & Research Scientist
Andrew BrisChke Area Assistant Agent, Agriculture Natural Resources (Mohave and Coconino)
ConTACT:MiChAel A. [email protected] (520)626-4244 fax (520)621-1647
This information has been reviewed by University faculty.extension.arizona.edu/pubs/az1751-2017.pdfOther titles from Arizona Cooperative Extension can be found at:extension.arizona.edu/pubs
Any products, services or organizations that are mentioned, shown or indirectly implied in this publication do not imply endorsement by The University of Arizona.
Issued in furtherance of Cooperative Extension work, acts of May 8 and June 30, 1914, in cooperation with the U.S. Department of Agriculture, Jeffrey C. Silvertooth, Associate Dean & Director, Extension & Economic Development, College of Agriculture Life Sciences, The University of Arizona.
The University of Arizona is an equal opportunity, affirmative action institution. The University does not discriminate on the basis of race, color, religion, sex, national origin, age, disability, veteran status, or sexual orientation in its programs and activities.


![Report 99 00.wp [PFP#622204035] · 2020. 1. 28. · the measurement of the precipitation. The Belfort rain gauges have given erratic results, particularly during winter. These Belfort](https://img.pdfslide.us/doc/110x75/60b962d4b536960b3729688e/report-99-00wp-pfp622204035-2020-1-28-the-measurement-of-the-precipitation.jpg)


![rain[e]314 WEIGHING PRECIPITATION SENSOR](https://img.pdfslide.us/doc/110x75/61d3a6c570d2a1285014bbc9/raine314-weighing-precipitation-sensor.jpg)
![rain[e] WEIGHING PRECIPITATION SENSOR](https://img.pdfslide.us/doc/110x75/61d3a6c570d2a1285014bbcb/raine-weighing-precipitation-sensor.jpg)