Embed Size (px)
Citation preview

Rail VfM Alternative Railway Structures: Final Report – Volume 3 07 March 2011
iKbKhK=`çåëìäíáåÖ=EfåíÉêå~íáçå~äF=iáãáíÉÇI=QM=dêçëîÉåçê=mä~ÅÉI=içåÇçå=ptNu=TgiI=råáíÉÇ=háåÖÇçã
íW=QQKOMKTPUVKTOMM===ÑW=QQKOMKTPUVKTQQM===ïïïKäÉâKÅçã
Auckland Bangkok Beijing Boston Chicago London Los Angeles Melbourne Milan Mumbai Munich New Delhi New York Paris San Francisco Shanghai Singapore Sydney Tokyo Wroclaw
1

Agenda
Due to the DfT/ORR’s web-site constraints, the on-line version of this report has been split into three separate volumes
z Executive summary
z Introduction Volume 1
z Horizontal separation
z Vertical integration
z Vertical alignment Volume 2
z Cost and revenue sharing
z Implementation
z Appendix Volume 3
2
Agenda
Agenda
z Executive summary
z Introduction
z Horizontal separation
z Vertical integration
z Vertical alignment
z Cost and revenue sharing
z Implementation
z Appendix
- Stakeholder consultation programme and documents reviewed
- Financial baseline and option impact quantification
- Regional case studies
- Review of existing arrangements
3

Appendix - Stakeholder consultation programme and documents reviewed
L.E.K. has carried out an extensive programme of stakeholder consultation to understand the views of industry participants
z PTEG
z Railfreight Group
z Andrew McNaughton
z Catherine Doran
z Peter Swattridge
z Paul Plummer
z Ian Ballentine
z Stagecoach
z National Express
z MTR
z Grand Central
z First Group
z Danish State Railways
Already met
z ATOC
z Carillion / First Group
z Arriva
z Go Ahead
z Abellio
z Keolis
Other
NR
GB operator consultation
Workshop
Meeting type
z ORR
z DfT
z TfL
z Bill Davidson
z Jonny Allen
z Calvin Lloyd
z Andrew Newby
z Virgin Trains
z DB / Stagecoach
z Rail Freight Group
z Freightliner
z DB Schenker
z Serco
z Veolia Transport
1st industry workshop: NR, Abellio, Arriva, ATOC, DB Schenker, Freightliner, Go Ahead, Serco, Stagecoach, Virgin Trains
2nd industry workshop: NR, ATOC, Arriva, DB Schenker, First Group, Freightliner, Go Ahead, KS Consultants, Serco, Stagecoach Rail
Case study workshops: LNE and Chiltern
Stakeholders
4

Appendix - Stakeholder consultation programme and documents reviewed
L.E.K. has also reviewed a large number of relevant reports and other documents (1 of 3)
UK rail
Network Rail z Route Plans (various); 2008 & 2010 z CP4 Delivery Plan (various); 2009 & 2010 z Regional RUSs (various); 2008-2010 z Strategic Business Plan – CP4 (various); 2007 & 2008 z Route AMP – Doncaster-Peterborough, RACI; 2009 & 2010 z Network Rail Transformation Programme; 2010 z Organisation Restructure – Network Rail; 2009 z MIP and General Bonus Scheme – Overviews; 2008-11 z Operating Strategy Overview; 2010 z Industry Costs & Income – NR Operating Routes; 2010 z Asset Management Strategy; 2010 z Engineering Strategy; 2010 z Asset Management Policies; 2010 z Overview of Maintenance Activities; 2010
For the Rail Value for Money Study z Review of Rail Cross-industry Interfaces, Incentives, and Structures;
Arup/Oxera; 2010 z Effectiveness and efficiency of asset management and supply chain
management in the GB rail industry; Atkins; 2010 z Whole System Programme Management; Atkins; 2010 z Reviewing the Franchise Map; Jacobs; 2010 z Research Project on Unit Costs and Franchising;
PwC/Interfleet/Colin Buchanan; 2010 z Achieving VfM from a Railway System Authority; Risk Solutions /
SDG; 2010 z Leadership, Planning and Decision Making; SDG; 2010
ORR z Annual efficiency and finance assessment of Network Rail; 2008-10 z National Rail Trends Yearbook 2009-10; 2010 z Periodic Review 2008; 2008
Other z Better Alignment of Train and Track; ATOC; 2010
z High Level Review of Track Access Charges and Options for CP5;
CEPA; 2010 z InterCity East Coast Franchise; KPMG; 2004 z Passenger rail strategic objectives; STAR; 2010 z Rail VfM Study – PTEG Response; PTEG; 2010 z 2009 Best Practice Review [Asset Management]; AMCL; 2009 z Merseyrail – Outline Business Case; Merseytravel; 2006 & 2010 z Aims, Models and Powers of Rail Regulators; Trasse Schweiz; 2010 z Planning Ahead (various); Planning and Oversight Group; 2009 &
2010 z Privatizing British Railways: Are There Lessons for the World Bank
and its Borrowers?; Louis S Thompson; 2004 z British Rail 1974-1997; Gourvish; 2002 z Britain’s Railways 1997-2005 – Labour’s Strategic Experiment;
Gourvish; 2008 z National Rail website
5
Appendix - Stakeholder consultation programme and documents reviewed
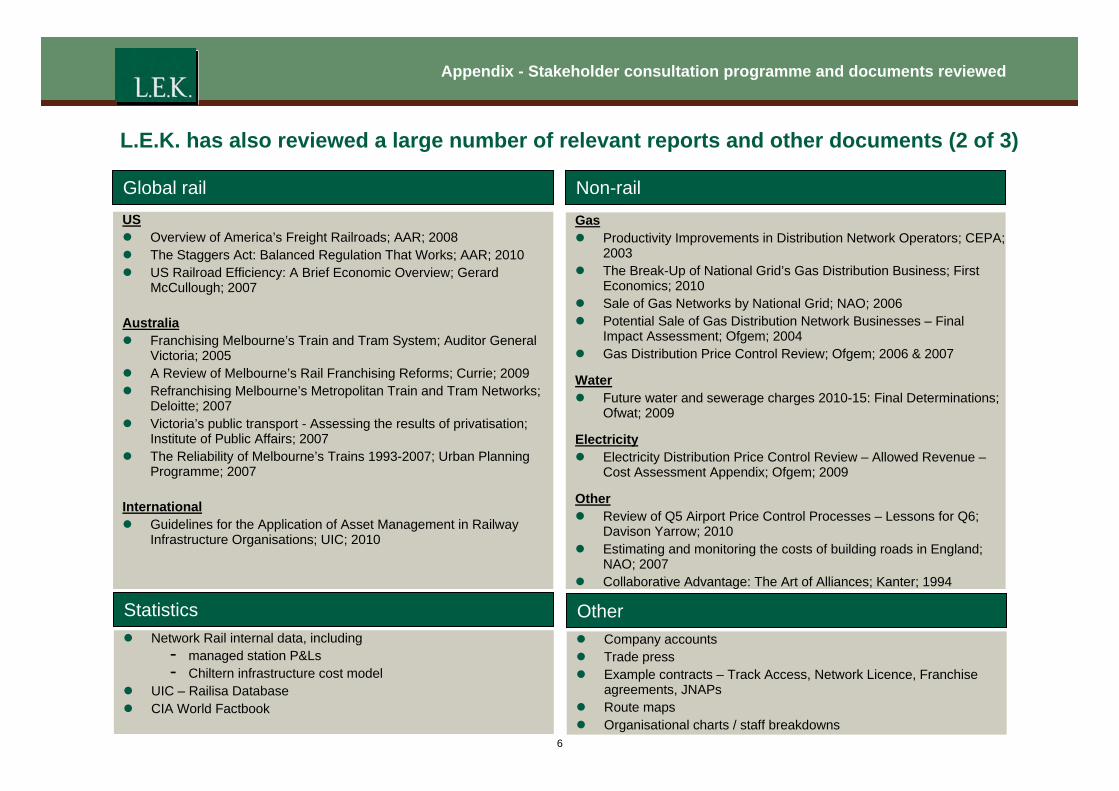
L.E.K. has also reviewed a large number of relevant reports and other documents (2 of 3)
Non-railGlobal rail US z Overview of America’s Freight Railroads; AAR; 2008 z The Staggers Act: Balanced Regulation That Works; AAR; 2010 z US Railroad Efficiency: A Brief Economic Overview; Gerard
McCullough; 2007
Australia z Franchising Melbourne’s Train and Tram System; Auditor General
Victoria; 2005 z A Review of Melbourne’s Rail Franchising Reforms; Currie; 2009 z Refranchising Melbourne’s Metropolitan Train and Tram Networks;
Deloitte; 2007 z Victoria’s public transport - Assessing the results of privatisation;
Institute of Public Affairs; 2007 z The Reliability of Melbourne’s Trains 1993-2007; Urban Planning
Programme; 2007
International z Guidelines for the Application of Asset Management in Railway
Infrastructure Organisations; UIC; 2010
Gas z Productivity Improvements in Distribution Network Operators; CEPA;
2003 z The Break-Up of National Grid’s Gas Distribution Business; First
Economics; 2010 z Sale of Gas Networks by National Grid; NAO; 2006 z Potential Sale of Gas Distribution Network Businesses – Final
Impact Assessment; Ofgem; 2004 z Gas Distribution Price Control Review; Ofgem; 2006 & 2007
Water z Future water and sewerage charges 2010-15: Final Determinations;
Ofwat; 2009
Electricity z Electricity Distribution Price Control Review – Allowed Revenue –
Cost Assessment Appendix; Ofgem; 2009
Other z Review of Q5 Airport Price Control Processes – Lessons for Q6;
Davison Yarrow; 2010 z Estimating and monitoring the costs of building roads in England;
NAO; 2007 z Collaborative Advantage: The Art of Alliances; Kanter; 1994
Statistics Other z Company accounts z Trade press z Example contracts – Track Access, Network Licence, Franchise
agreements, JNAPs z Route maps z Organisational charts / staff breakdowns
z Network Rail internal data, including - managed station P&Ls - Chiltern infrastructure cost model
z UIC – Railisa Database z CIA World Factbook
6
Appendix - Stakeholder consultation programme and documents reviewed
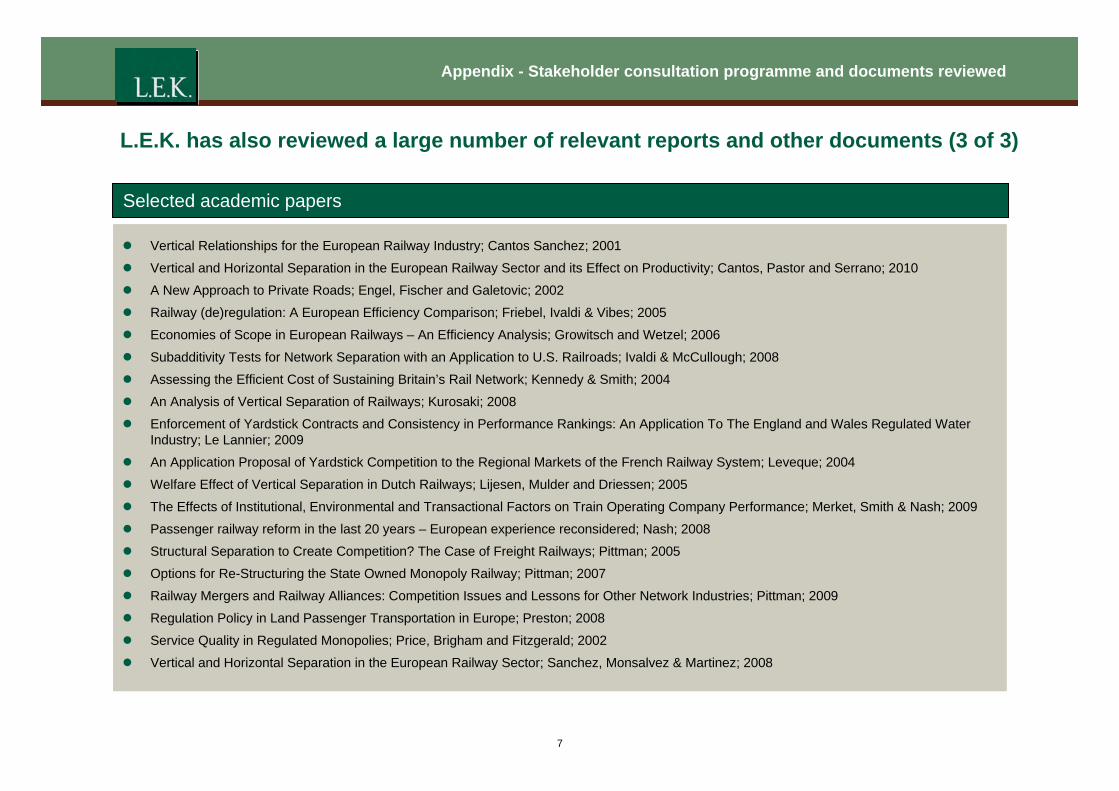
L.E.K. has also reviewed a large number of relevant reports and other documents (3 of 3)
Selected academic papers
z Vertical Relationships for the European Railway Industry; Cantos Sanchez; 2001
z Vertical and Horizontal Separation in the European Railway Sector and its Effect on Productivity; Cantos, Pastor and Serrano; 2010
z A New Approach to Private Roads; Engel, Fischer and Galetovic; 2002
z Railway (de)regulation: A European Efficiency Comparison; Friebel, Ivaldi & Vibes; 2005
z Economies of Scope in European Railways – An Efficiency Analysis; Growitsch and Wetzel; 2006
z Subadditivity Tests for Network Separation with an Application to U.S. Railroads; Ivaldi & McCullough; 2008
z Assessing the Efficient Cost of Sustaining Britain’s Rail Network; Kennedy & Smith; 2004
z An Analysis of Vertical Separation of Railways; Kurosaki; 2008
z Enforcement of Yardstick Contracts and Consistency in Performance Rankings: An Application To The England and Wales Regulated Water Industry; Le Lannier; 2009
z An Application Proposal of Yardstick Competition to the Regional Markets of the French Railway System; Leveque; 2004
z Welfare Effect of Vertical Separation in Dutch Railways; Lijesen, Mulder and Driessen; 2005
z The Effects of Institutional, Environmental and Transactional Factors on Train Operating Company Performance; Merket, Smith & Nash; 2009
z Passenger railway reform in the last 20 years – European experience reconsidered; Nash; 2008
z Structural Separation to Create Competition? The Case of Freight Railways; Pittman; 2005
z Options for Re-Structuring the State Owned Monopoly Railway; Pittman; 2007
z Railway Mergers and Railway Alliances: Competition Issues and Lessons for Other Network Industries; Pittman; 2009
z Regulation Policy in Land Passenger Transportation in Europe; Preston; 2008
z Service Quality in Regulated Monopolies; Price, Brigham and Fitzgerald; 2002
z Vertical and Horizontal Separation in the European Railway Sector; Sanchez, Monsalvez & Martinez; 2008
7
Agenda
Agenda
z Executive summary
z Introduction
z Horizontal separation
z Vertical integration
z Vertical alignment
z Cost and revenue sharing
z Implementation
z Appendix
- Stakeholder consultation programme and documents reviewed
- Financial baseline and option impact quantification
- Regional case studies
- Review of existing arrangements
8
Appendix - Financial baseline and option impact quantification
Introduction
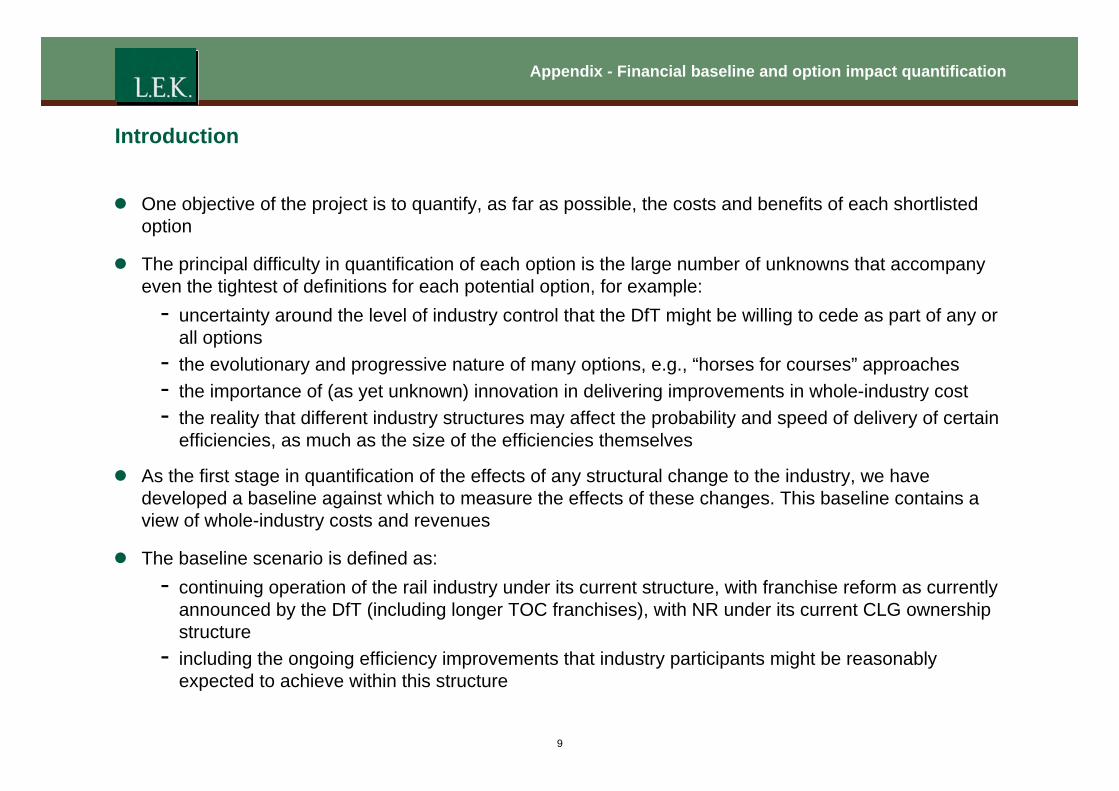
z One objective of the project is to quantify, as far as possible, the costs and benefits of each shortlisted option
z The principal difficulty in quantification of each option is the large number of unknowns that accompany even the tightest of definitions for each potential option, for example:
- uncertainty around the level of industry control that the DfT might be willing to cede as part of any or all options
- the evolutionary and progressive nature of many options, e.g., “horses for courses” approaches - the importance of (as yet unknown) innovation in delivering improvements in whole-industry cost - the reality that different industry structures may affect the probability and speed of delivery of certain
efficiencies, as much as the size of the efficiencies themselves
z As the first stage in quantification of the effects of any structural change to the industry, we have developed a baseline against which to measure the effects of these changes. This baseline contains a view of whole-industry costs and revenues
z The baseline scenario is defined as: - continuing operation of the rail industry under its current structure, with franchise reform as currently
announced by the DfT (including longer TOC franchises), with NR under its current CLG ownership structure
- including the ongoing efficiency improvements that industry participants might be reasonably expected to achieve within this structure
9

Appendix - Financial baseline and option impact quantification
Total GB rail industry revenue is c.£7.9bn and costs are c.£12.9bn p.a.
Rail industry money flows (£bn) (2009/10)
Government
NR
TOCs
ROSCOs
Direct grant: 3.7
NR costs
Other freight costs
Other TOC costs
1.4
Track access charges: 1.3
Stations and depots charges: 0.3
From PTEs: 0.3Passenger revenue: 6.2 Other TOC revenue: 0.6
Freight grants: 0.02
Other Government support
0.1
Freight revenue
0.9
Property, open access
4.4 6.4
0.2
0.8
Freight
0.4
Net franchise payments and performance
receipts: 0.4
TOC profit
0.2
Note: Total industry cost excludes Network Rail debt finance costs and TOC profit Source: Whole Industry Money Flows Study; DfT; L.E.K. analysis
10
Appendix - Financial baseline and option impact quantification
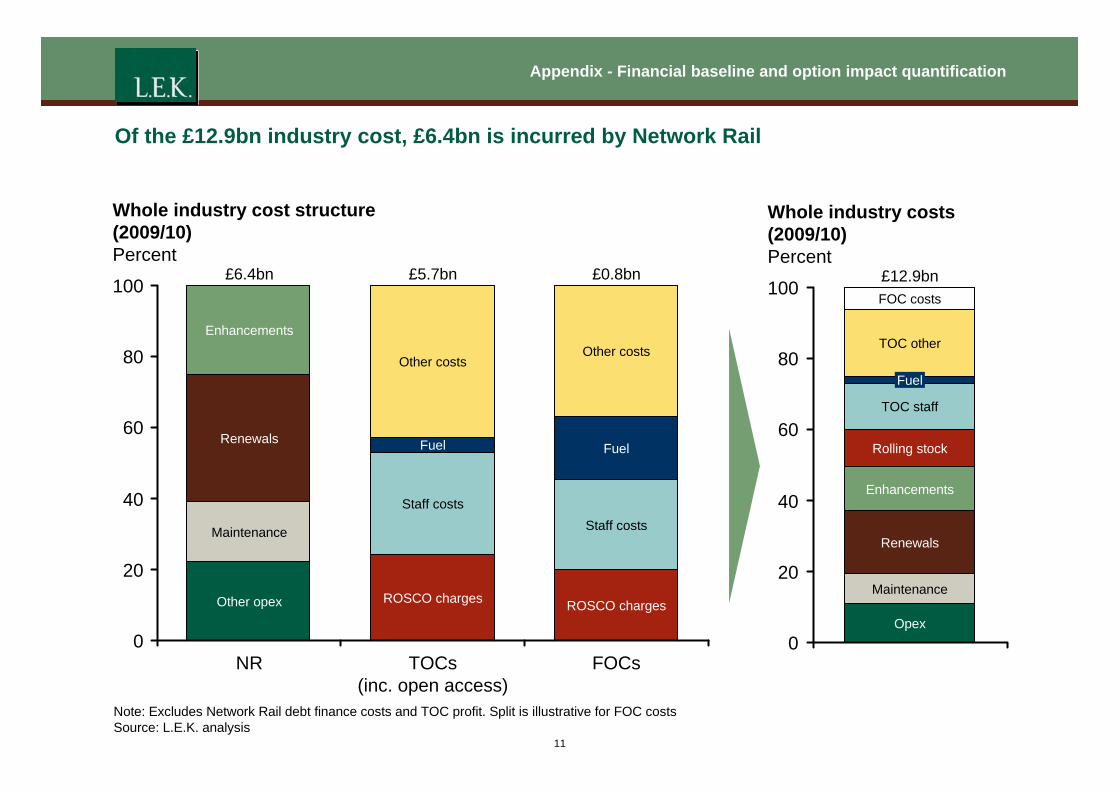
Of the £12.9bn industry cost, £6.4bn is incurred by Network Rail
Whole industry cost structure Whole industry costs (2009/10) (2009/10)Percent Percent
£6.4bn £5.7bn £0.8bn £12.9bn 100
Renewals
Enhancements
100
80
Fuel
Other costs
Fuel
Other costs 80
60 60
40
ROSCO charges
Staff costs
ROSCO charges
Staff costs
Other opex
Maintenance
40
20 20
0 0 NR TOCs FOCs
(inc. open access)
Opex
Maintenance
Enhancements
Rolling stock
TOC staff
Fuel
TOC other
FOC costs
Renewals
Note: Excludes Network Rail debt finance costs and TOC profit. Split is illustrative for FOC costs Source: L.E.K. analysis
11
Appendix - Financial baseline and option impact quantification
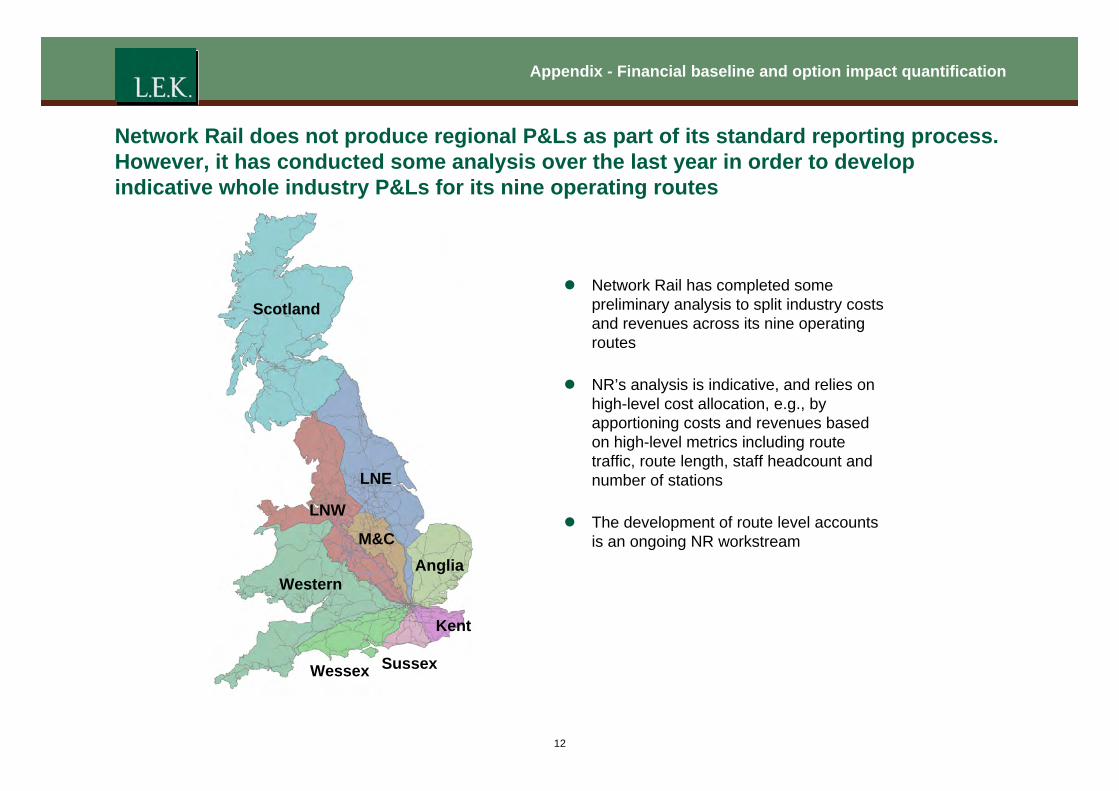
Network Rail does not produce regional P&Ls as part of its standard reporting process. However, it has conducted some analysis over the last year in order to develop indicative whole industry P&Ls for its nine operating routes
Scotland
LNE
Anglia
Kent
Sussex
Western
LNW
Wessex
M&C
z Network Rail has completed some preliminary analysis to split industry costs and revenues across its nine operating routes
z NR’s analysis is indicative, and relies on high-level cost allocation, e.g., by apportioning costs and revenues based on high-level metrics including route traffic, route length, staff headcount and number of stations
z The development of route level accounts is an ongoing NR workstream
12
Appendix - Financial baseline and option impact quantification
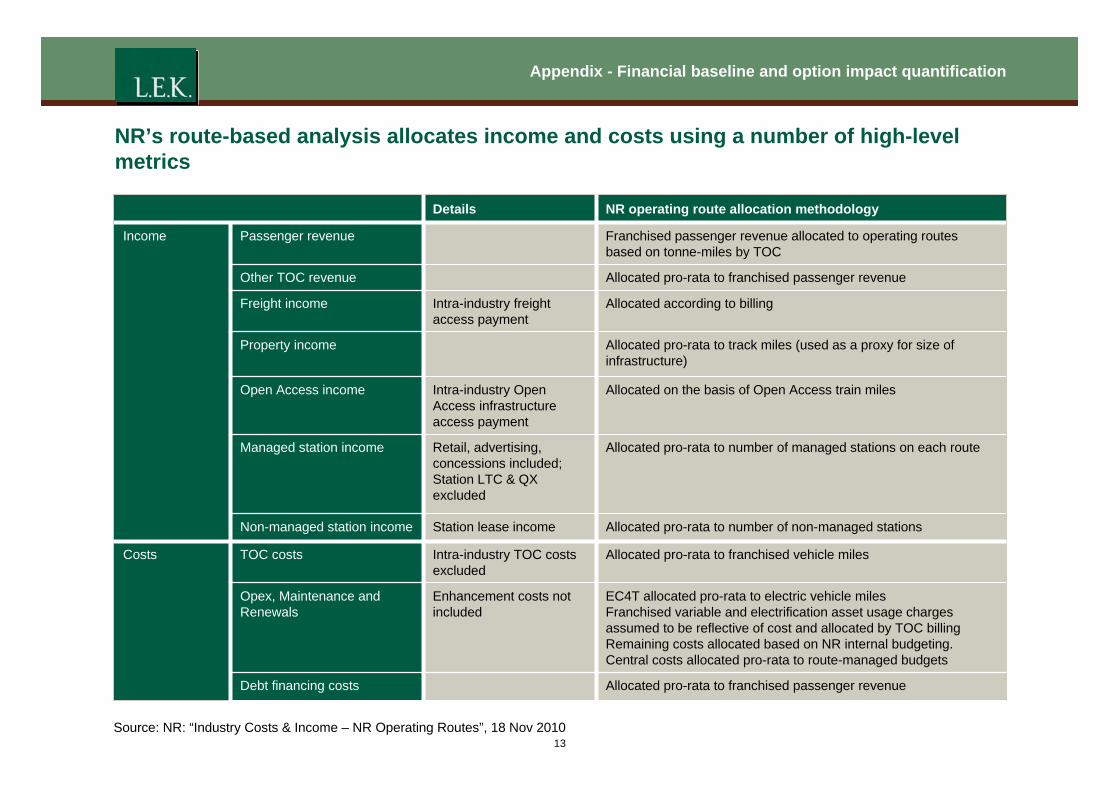
NR’s route-based analysis allocates income and costs using a number of high-level metrics
Allocated according to billing Intra-industry freight access payment
Freight income
EC4T allocated pro-rata to electric vehicle miles Franchised variable and electrification asset usage charges assumed to be reflective of cost and allocated by TOC billing Remaining costs allocated based on NR internal budgeting. Central costs allocated pro-rata to route-managed budgets
Enhancement costs not included
Opex, Maintenance and Renewals
Allocated pro-rata to number of managed stations on each route Retail, advertising, concessions included; Station LTC & QX excluded
Managed station income
Intra-industry TOC costs excluded
Station lease income
Intra-industry Open Access infrastructure access payment
Details
Costs
Allocated pro-rata to franchised passenger revenue Debt financing costs
Allocated on the basis of Open Access train miles Open Access income
Allocated pro-rata to franchised passenger revenue Other TOC revenue
Franchised passenger revenue allocated to operating routes based on tonne-miles by TOC
Passenger revenue
Allocated pro-rata to number of non-managed stations Non-managed station income
Income
Allocated pro-rata to franchised vehicle miles TOC costs
Allocated pro-rata to track miles (used as a proxy for size of infrastructure)
Property income
NR operating route allocation methodology
Source: NR: “Industry Costs & Income – NR Operating Routes”, 18 Nov 2010
13
Appendix - Financial baseline and option impact quantification
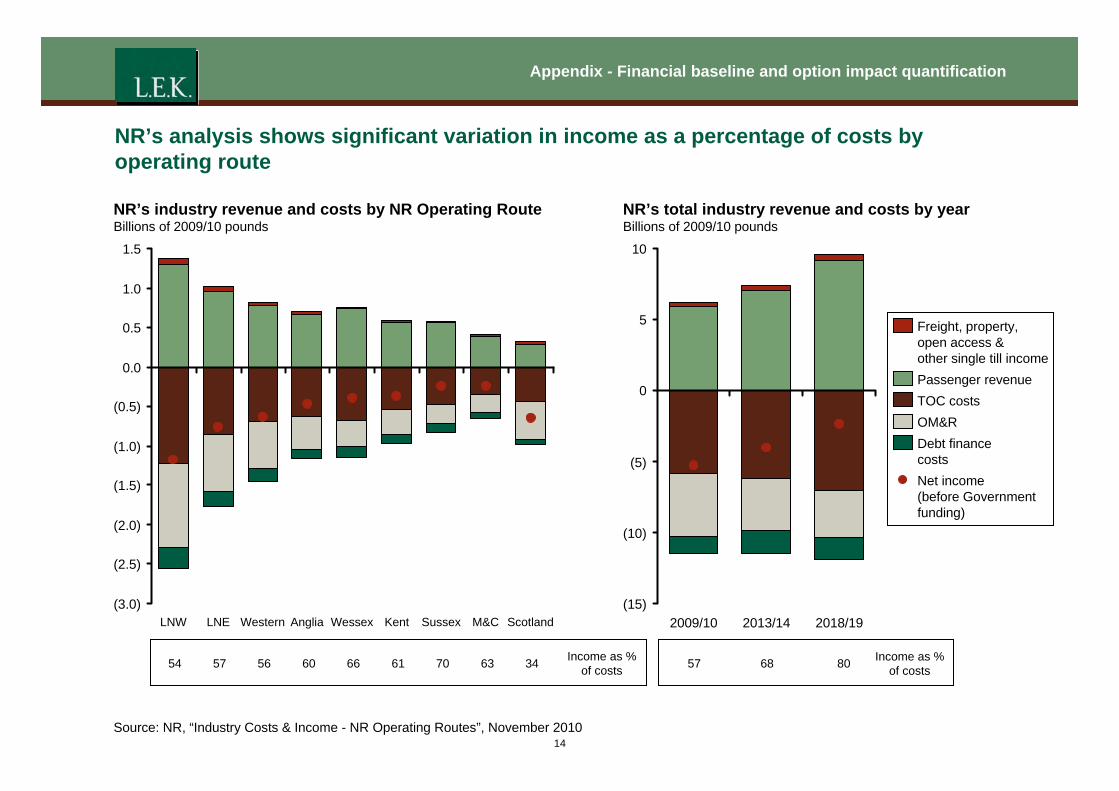
NR’s analysis shows significant variation in income as a percentage of costs by operating route
NR’s industry revenue and costs by NR Operating Route NR’s total industry revenue and costs by year Billions of 2009/10 pounds Billions of 2009/10 pounds
1.5 10
1.0
50.5
0.0
0 (0.5)
(1.0) (5)
(1.5)
(2.0) (10)
(2.5)
(3.0) (15) LNW LNE Western Anglia Wessex Kent Sussex M&C Scotland 2009/10 2013/14 2018/19
Freight, property, open access & other single till income Passenger revenue TOC costs OM&R Debt finance costs Net income (before Government funding)
Income as % Income as %54 57 56 60 66 61 70 63 34 57 68 80of costs of costs
Source: NR, “Industry Costs & Income - NR Operating Routes”, November 2010 14

Appendix - Financial baseline and option impact quantification
Regional split TOC split Differences in L.E.K. approach to regional
analysis vs. NR approach TOC allocation method
Income Passenger revenue Unchanged Inputs provided by the Rail VfM Team
Other TOC revenue Unchanged Inputs provided by the Rail VfM Team
Freight, property, open Intra-industry freight, open Allocated pro-rata to FTAC access & other single till access and station access income payments to NR excluded
FOC revenue Included. Allocated according to NR billing
Not included
Open Access operator Included. Allocated according to Not included revenue Open Access train miles
Costs TOC costs Unchanged Inputs provided by the Rail VfM Team
Opex, Maintenance and Renewals
Unchanged Allocated pro-rata to FTAC
Enhancements Included. Allocated pro-rata to renewals spend
Allocated pro-rata to FTAC
Debt financing costs Unchanged Allocated pro-rata to FTAC
FOC costs Included. Allocated pro-rata to freight income
Not included
Open Access operator Included. Allocated according to Not included costs Open Access train miles
Regulator costs* Included. Allocated pro-rata to track miles
Allocated pro-rata to FTAC
L.E.K. has reviewed the NR approach and used it to develop its own view of whole industry regional P&Ls, as well as indicative results by TOC
z L.E.K. has not attempted to verify NR’s calculations of regional splits for the allocation metrics used
z While the cost allocation based approach to identifying regional industry P&Ls is very high-level and therefore only indicative, L.E.K. and Network Rail believe the approach to be sufficiently robust to inform decision-making for purposes of this project
Note: * Includes RSSB, RAIB and DfT Rail costs Source: DfT; ORR; NR
15
Appendix - Financial baseline and option impact quantification
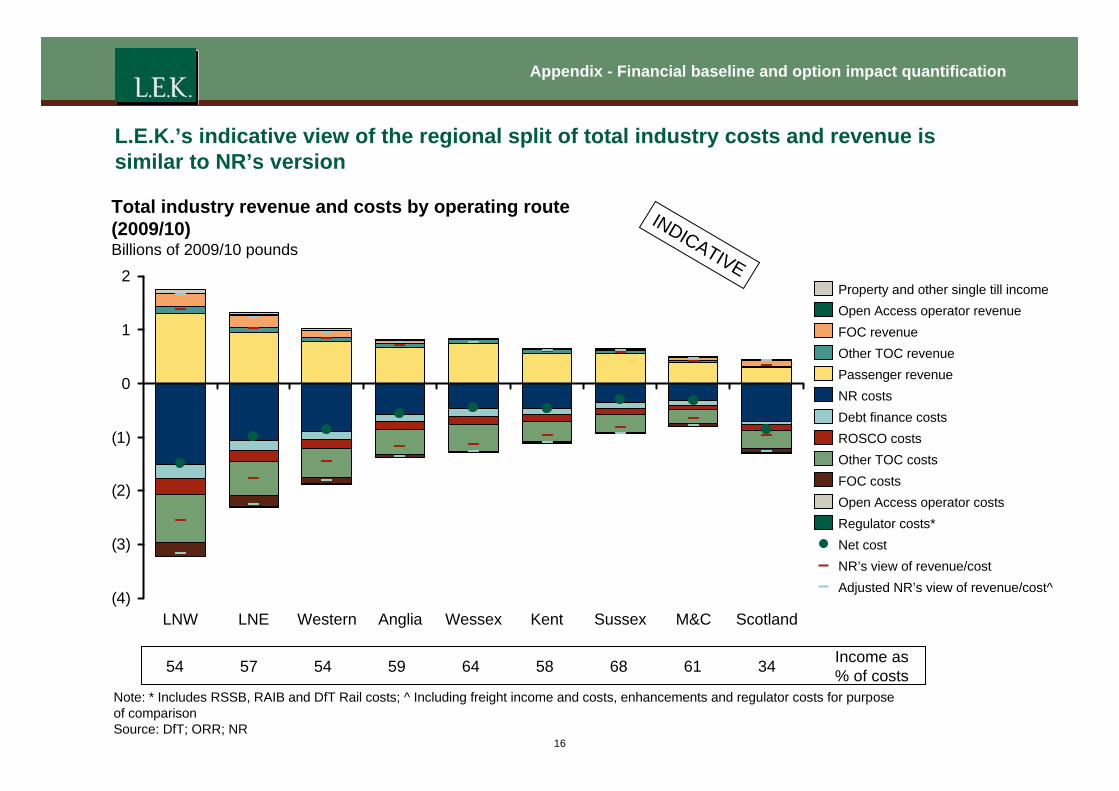
L.E.K.’s indicative view of the regional split of total industry costs and revenue is similar to NR’s version
Property and other single till income Open Access operator revenue FOC revenue Other TOC revenue Passenger revenue NR costs Debt finance costs ROSCO costs Other TOC costs FOC costs Open Access operator costs Regulator costs* Net cost NR’s view of revenue/cost Adjusted NR’s view of revenue/cost^
(4) LNW LNE Western Anglia Wessex Kent Sussex M&C Scotland
(3)
(2)
(1)
0
1
2
Total industry revenue and costs by operating route (2009/10) Billions of 2009/10 pounds
INDICATIVE
Income as 54 57 54 59 64 58 68 61 34 % of costs Note: * Includes RSSB, RAIB and DfT Rail costs; ^ Including freight income and costs, enhancements and regulator costs for purpose of comparison Source: DfT; ORR; NR
16
Appendix - Financial baseline and option impact quantification
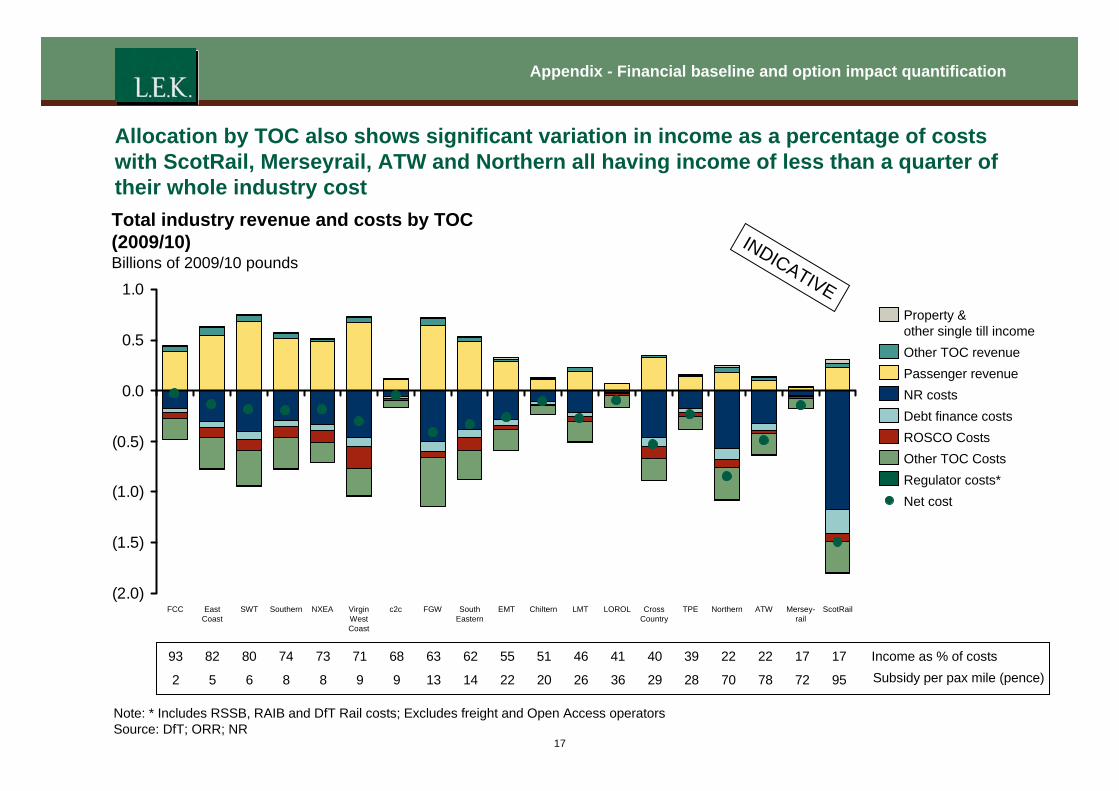
Allocation by TOC also shows significant variation in income as a percentage of costs with ScotRail, Merseyrail, ATW and Northern all having income of less than a quarter of their whole industry cost Total industry revenue and costs by TOC (2009/10) INDBillions of 2009/10 pounds ICATIVE1.0
0.5
0.0
(0.5)
(1.0)
(1.5)
(2.0) FCC East SWT Southern NXEA Virgin c2c FGW South EMT Chiltern LMT LOROL Cross TPE Northern ATW Mersey- ScotRail
Coast West Eastern Country rail Coast
Property & other single till income Other TOC revenue Passenger revenue NR costs Debt finance costs ROSCO Costs Other TOC Costs Regulator costs* Net cost
93 82 80 74 73 71 68 63 62 55 51 46 41 40 39 22 22 17 17 Income as % of costs
2 5 6 8 8 9 9 13 14 22 20 26 36 29 28 70 78 72 95 Subsidy per pax mile (pence)
Note: * Includes RSSB, RAIB and DfT Rail costs; Excludes freight and Open Access operators Source: DfT; ORR; NR
17
Appendix - Financial baseline and option impact quantification
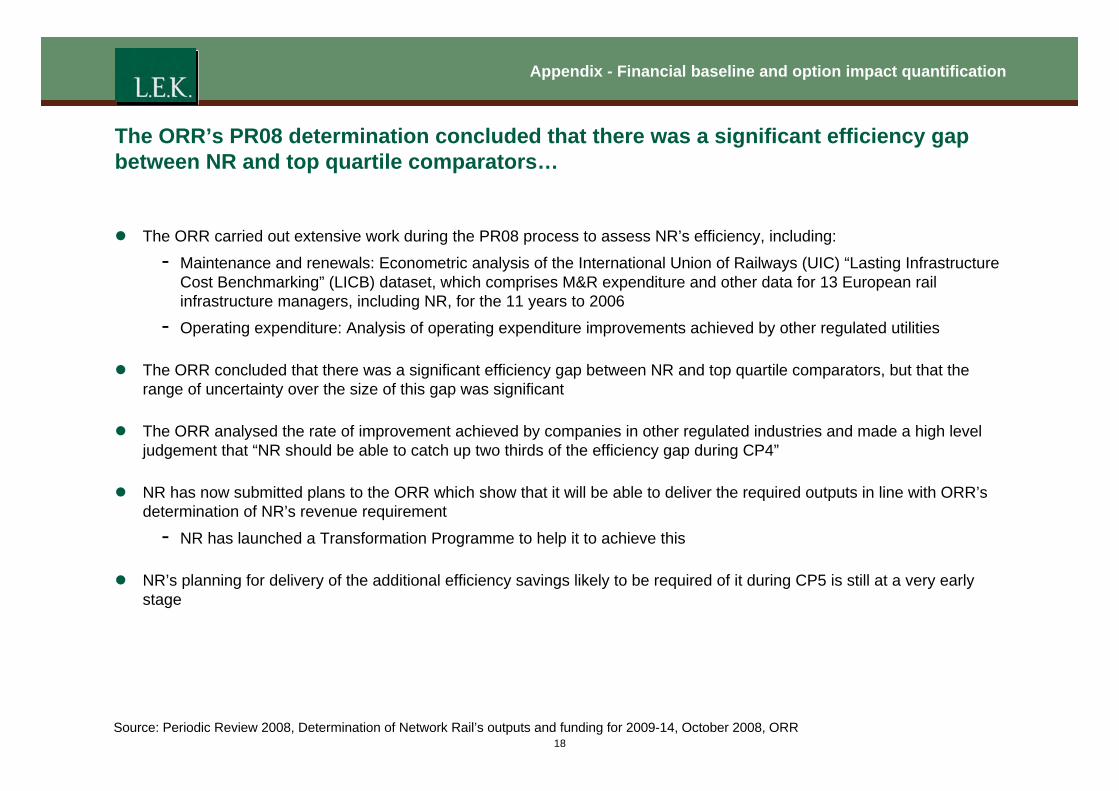
The ORR’s PR08 determination concluded that there was a significant efficiency gap between NR and top quartile comparators…
z The ORR carried out extensive work during the PR08 process to assess NR’s efficiency, including:
- Maintenance and renewals: Econometric analysis of the International Union of Railways (UIC) “Lasting Infrastructure Cost Benchmarking” (LICB) dataset, which comprises M&R expenditure and other data for 13 European rail infrastructure managers, including NR, for the 11 years to 2006
- Operating expenditure: Analysis of operating expenditure improvements achieved by other regulated utilities
z The ORR concluded that there was a significant efficiency gap between NR and top quartile comparators, but that the range of uncertainty over the size of this gap was significant
z The ORR analysed the rate of improvement achieved by companies in other regulated industries and made a high level judgement that “NR should be able to catch up two thirds of the efficiency gap during CP4”
z NR has now submitted plans to the ORR which show that it will be able to deliver the required outputs in line with ORR’s determination of NR’s revenue requirement
- NR has launched a Transformation Programme to help it to achieve this
z NR’s planning for delivery of the additional efficiency savings likely to be required of it during CP5 is still at a very early stage
Source: Periodic Review 2008, Determination of Network Rail’s outputs and funding for 2009-14, October 2008, ORR 18
Appendix - Financial baseline and option impact quantification
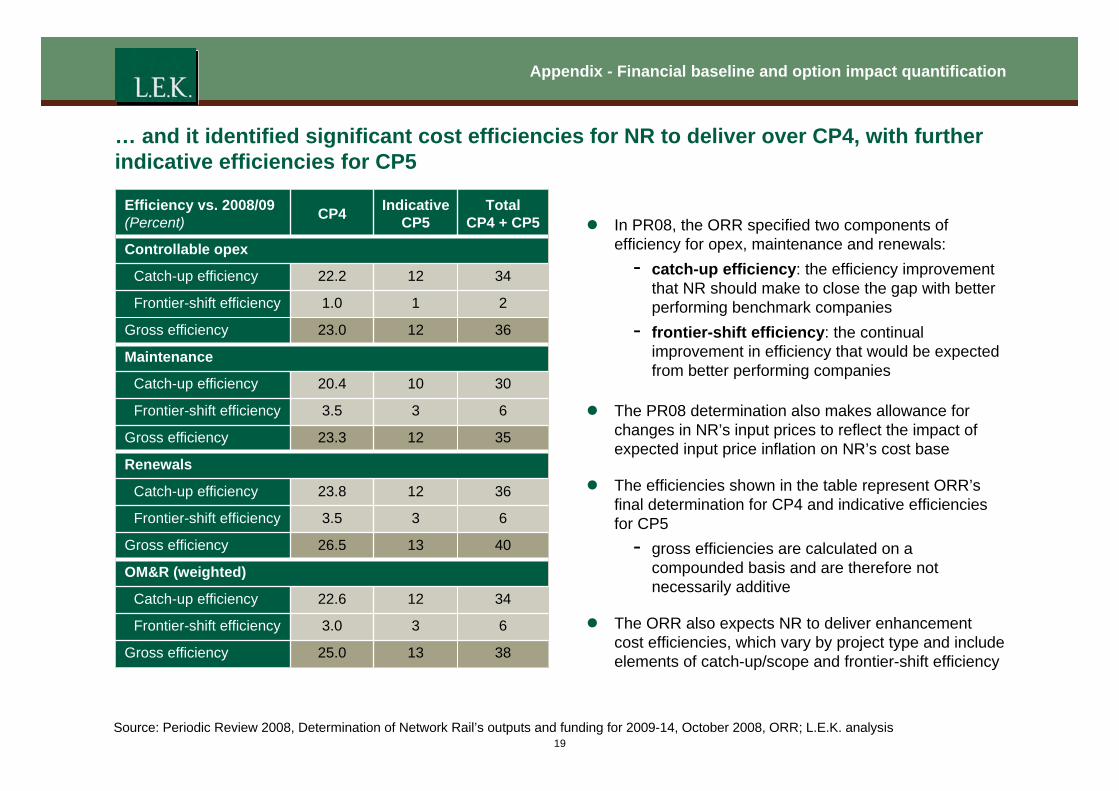
… and it identified significant cost efficiencies for NR to deliver over CP4, with further indicative efficiencies for CP5
Efficiency vs. 2008/09 (Percent) CP4 Indicative
CP5 Total
CP4 + CP5
Controllable opex
Catch-up efficiency 22.2 12 34
Frontier-shift efficiency 1.0 1 2
Gross efficiency 23.0 12 36
Maintenance
Catch-up efficiency 20.4 10 30
Frontier-shift efficiency 3.5 3 6
Gross efficiency 23.3 12 35
Renewals
Catch-up efficiency 23.8 12 36
Frontier-shift efficiency 3.5 3 6
Gross efficiency 26.5 13 40
OM&R (weighted)
Catch-up efficiency 22.6 12 34
Frontier-shift efficiency 3.0 3 6
Gross efficiency 25.0 13 38
z In PR08, the ORR specified two components of efficiency for opex, maintenance and renewals:
- catch-up efficiency: the efficiency improvement that NR should make to close the gap with better performing benchmark companies
- frontier-shift efficiency: the continual improvement in efficiency that would be expected from better performing companies
z The PR08 determination also makes allowance for changes in NR’s input prices to reflect the impact of expected input price inflation on NR’s cost base
z The efficiencies shown in the table represent ORR’s final determination for CP4 and indicative efficiencies for CP5
- gross efficiencies are calculated on a compounded basis and are therefore not necessarily additive
z The ORR also expects NR to deliver enhancement cost efficiencies, which vary by project type and include elements of catch-up/scope and frontier-shift efficiency
Source: Periodic Review 2008, Determination of Network Rail’s outputs and funding for 2009-14, October 2008, ORR; L.E.K. analysis 19
Appendix - Financial baseline and option impact quantification
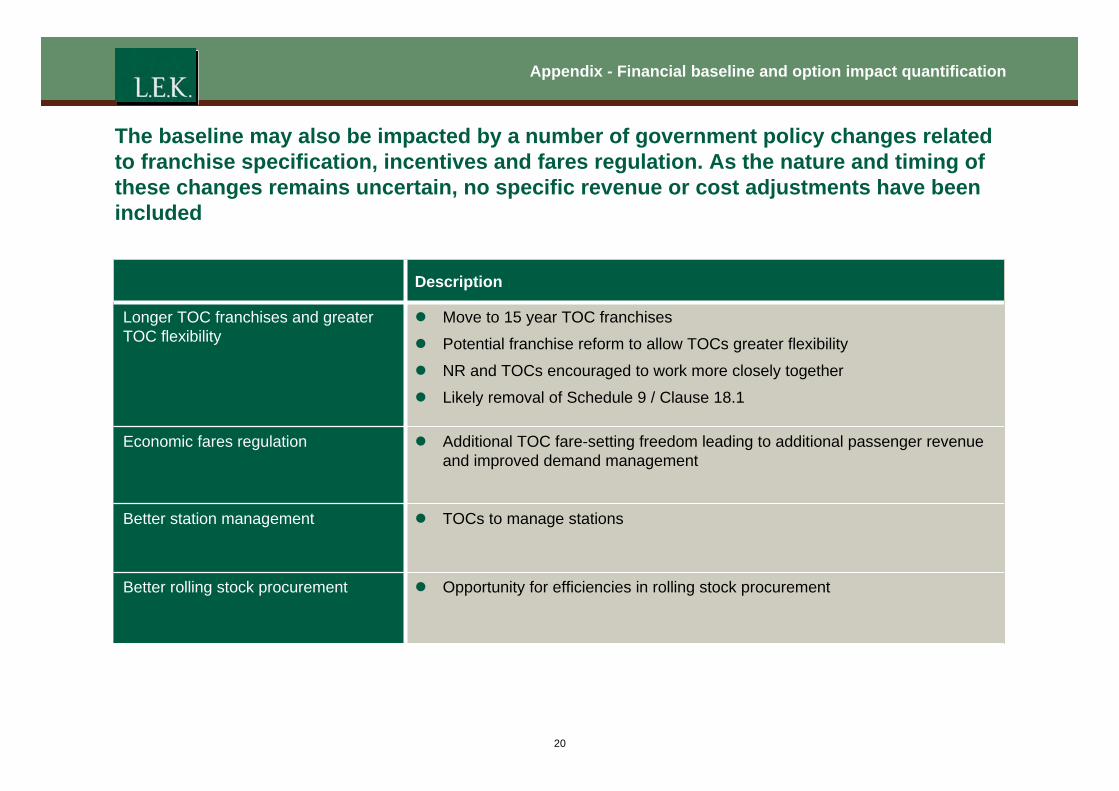
The baseline may also be impacted by a number of government policy changes related to franchise specification, incentives and fares regulation. As the nature and timing of these changes remains uncertain, no specific revenue or cost adjustments have been included
z TOCs to manage stations Better station management
z Opportunity for efficiencies in rolling stock procurement
z Additional TOC fare-setting freedom leading to additional passenger revenue and improved demand management
z Move to 15 year TOC franchises
z Potential franchise reform to allow TOCs greater flexibility
z NR and TOCs encouraged to work more closely together
z Likely removal of Schedule 9 / Clause 18.1
Description
Economic fares regulation
Longer TOC franchises and greater TOC flexibility
Better rolling stock procurement
20
Appendix - Financial baseline and option impact quantification
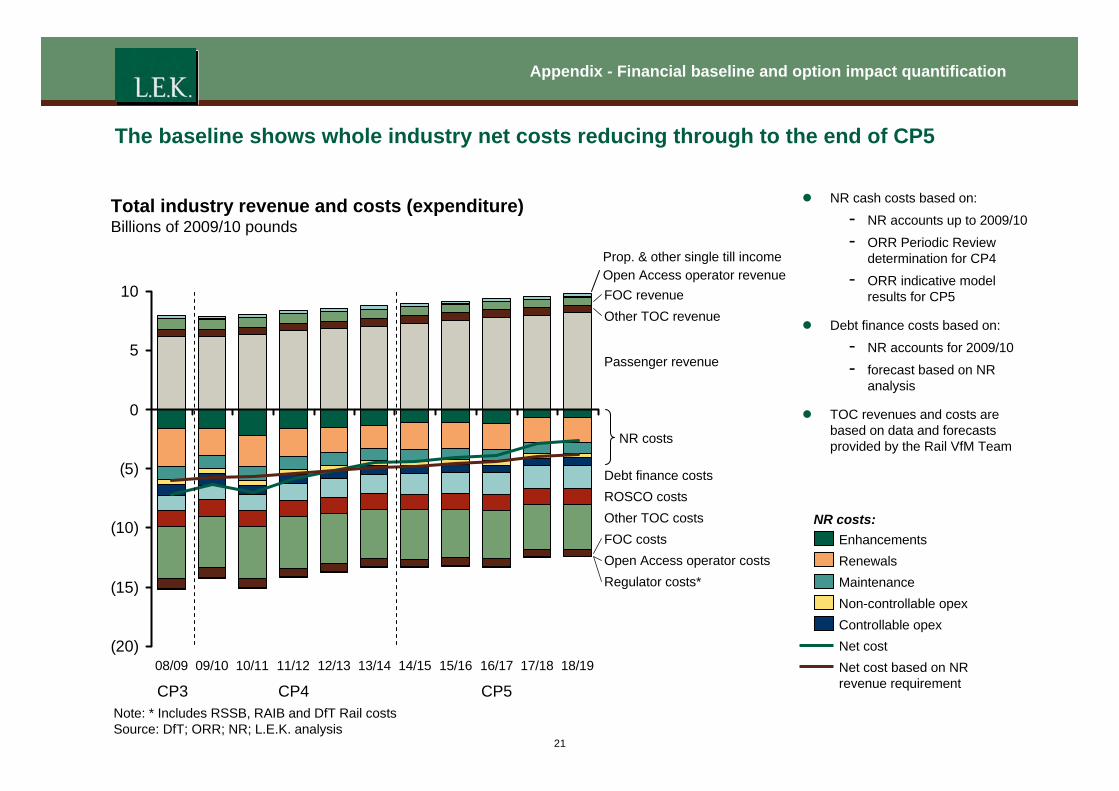
The baseline shows whole industry net costs reducing through to the end of CP5
z NR cash costs based on: Total industry revenue and costs (expenditure) - NR accounts up to 2009/10 Billions of 2009/10 pounds - ORR Periodic Review
Prop. & other single till income determination for CP4 Open Access operator revenue - ORR indicative model
10 FOC revenue results for CP5 Other TOC revenue
z Debt finance costs based on:
- NR accounts for 2009/10 5 Passenger revenue - forecast based on NR
analysis
0 z TOC revenues and costs are based on data and forecasts NR costs provided by the Rail VfM Team
(5) Debt finance costs ROSCO costs Other TOC costs NR costs: (10) FOC costs Enhancements Open Access operator costs Renewals Regulator costs* Maintenance (15)
Non-controllable opex Controllable opex Net cost
08/09 09/10 10/11 11/12 12/13 13/14 14/15 15/16 16/17 17/18 18/19 Net cost based on NR revenue requirement
(20)
CP3 CP4 CP5 Note: * Includes RSSB, RAIB and DfT Rail costs Source: DfT; ORR; NR; L.E.K. analysis
21
Appendix - Financial baseline and option impact quantification
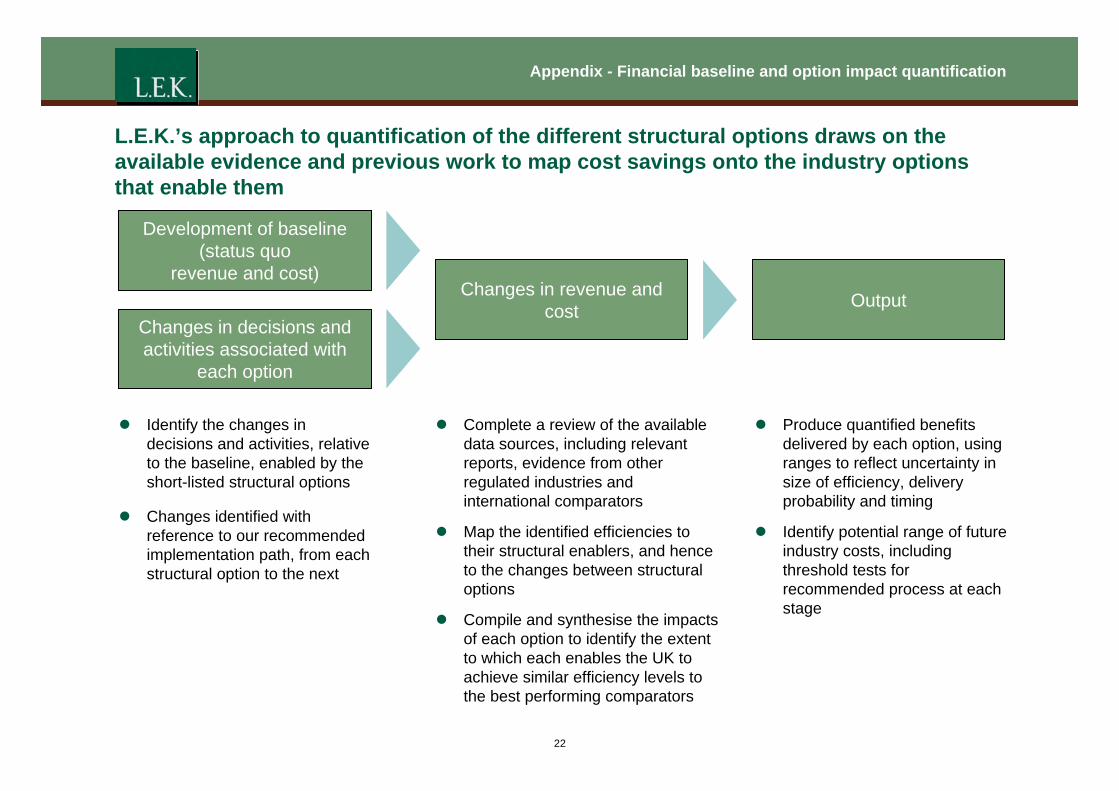
L.E.K.’s approach to quantification of the different structural options draws on the available evidence and previous work to map cost savings onto the industry options that enable them
Development of baseline (status quo
revenue and cost)
Changes in decisions and activities associated with
each option
Changes in revenue and cost Output
z Identify the changes in decisions and activities, relative to the baseline, enabled by the short-listed structural options
z Changes identified with reference to our recommended implementation path, from each structural option to the next
z Complete a review of the available data sources, including relevant reports, evidence from other regulated industries and international comparators
z Produce quantified benefits delivered by each option, using ranges to reflect uncertainty in size of efficiency, delivery probability and timing
z Map the identified efficiencies to their structural enablers, and hence to the changes between structural options
z Identify potential range of future industry costs, including threshold tests for recommended process at each
z Compile and synthesise the impacts of each option to identify the extent to which each enables the UK to
stage
achieve similar efficiency levels to the best performing comparators
22
Appendix - Financial baseline and option impact quantification
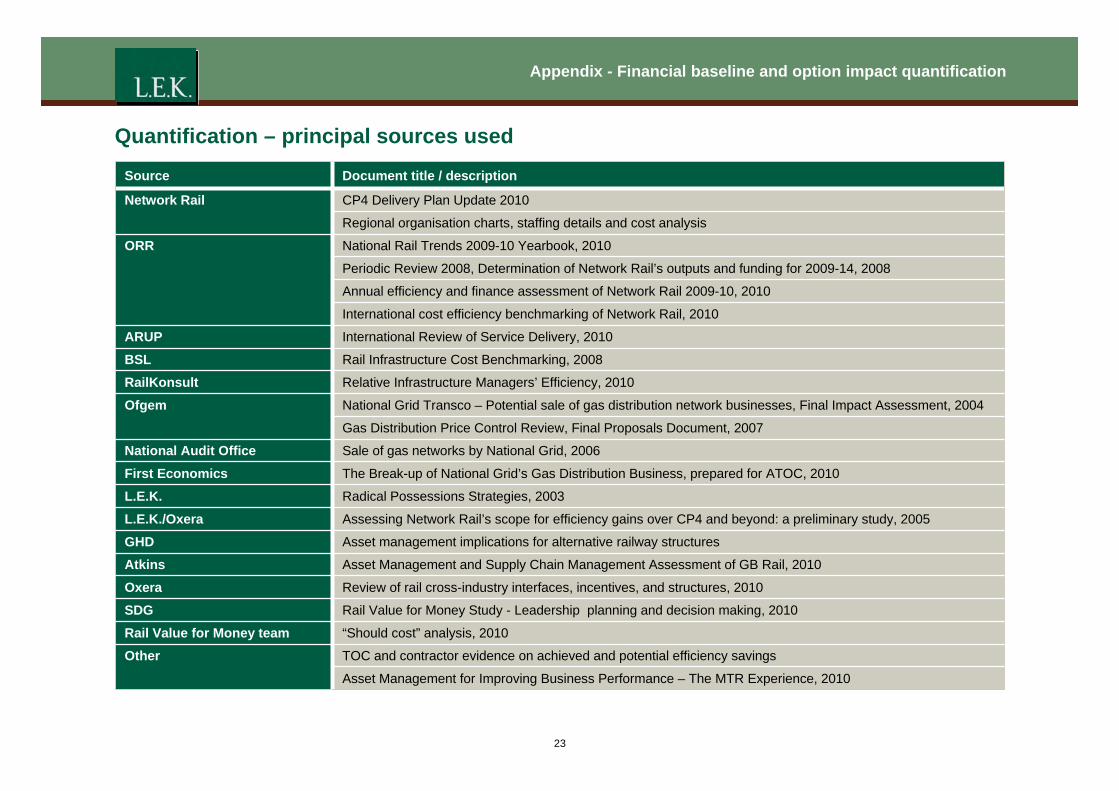
Quantification – principal sources used
Source Document title / description
Network Rail CP4 Delivery Plan Update 2010
Regional organisation charts, staffing details and cost analysis
ORR National Rail Trends 2009-10 Yearbook, 2010
Periodic Review 2008, Determination of Network Rail’s outputs and funding for 2009-14, 2008
Annual efficiency and finance assessment of Network Rail 2009-10, 2010
International cost efficiency benchmarking of Network Rail, 2010
ARUP International Review of Service Delivery, 2010
BSL Rail Infrastructure Cost Benchmarking, 2008
RailKonsult Relative Infrastructure Managers’ Efficiency, 2010
Ofgem National Grid Transco – Potential sale of gas distribution network businesses, Final Impact Assessment, 2004
Gas Distribution Price Control Review, Final Proposals Document, 2007
National Audit Office Sale of gas networks by National Grid, 2006
First Economics The Break-up of National Grid’s Gas Distribution Business, prepared for ATOC, 2010
L.E.K. Radical Possessions Strategies, 2003
L.E.K./Oxera Assessing Network Rail’s scope for efficiency gains over CP4 and beyond: a preliminary study, 2005
GHD Asset management implications for alternative railway structures
Atkins Asset Management and Supply Chain Management Assessment of GB Rail, 2010
Oxera Review of rail cross-industry interfaces, incentives, and structures, 2010
SDG Rail Value for Money Study - Leadership planning and decision making, 2010
Rail Value for Money team “Should cost” analysis, 2010
Other TOC and contractor evidence on achieved and potential efficiency savings
Asset Management for Improving Business Performance – The MTR Experience, 2010
23
Appendix - Financial baseline and option impact quantification
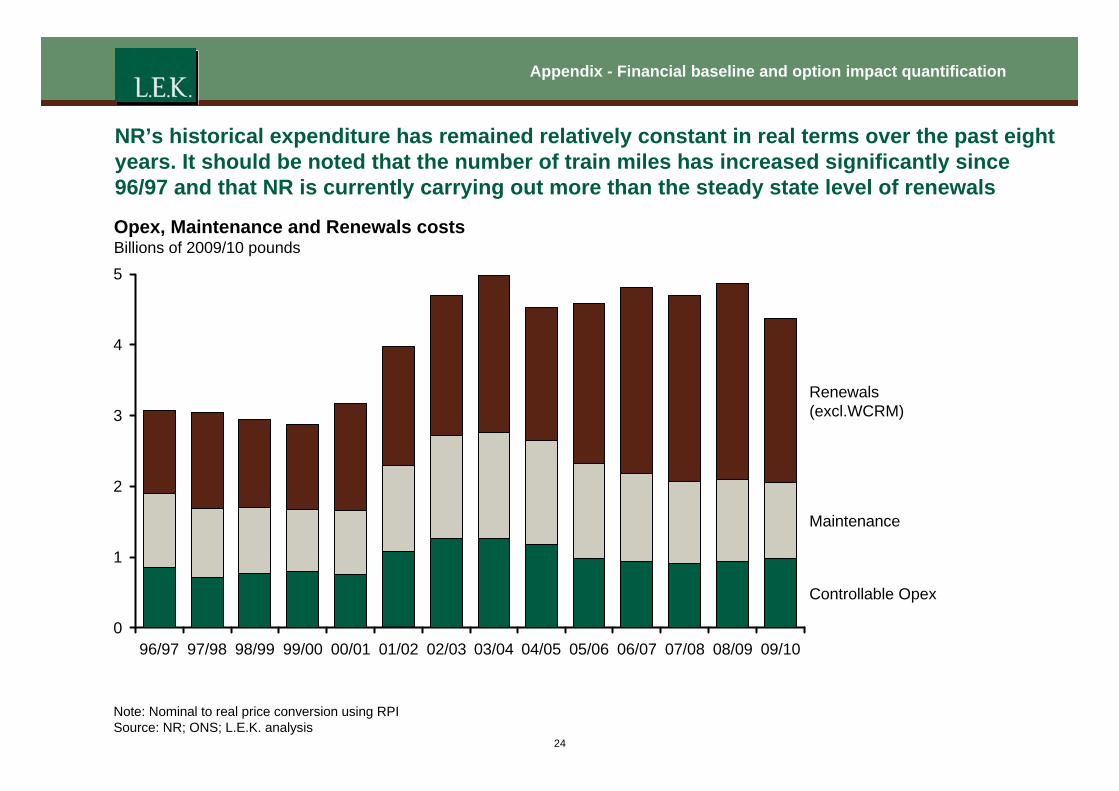
NR’s historical expenditure has remained relatively constant in real terms over the past eight years. It should be noted that the number of train miles has increased significantly since 96/97 and that NR is currently carrying out more than the steady state level of renewals
Opex, Maintenance and Renewals costs Billions of 2009/10 pounds 5
4
3
2
1
0
Renewals (excl.WCRM)
Maintenance
Controllable Opex
96/97 97/98 98/99 99/00 00/01 01/02 02/03 03/04 04/05 05/06 06/07 07/08 08/09 09/10
Note: Nominal to real price conversion using RPI Source: NR; ONS; L.E.K. analysis
24
Appendix - Financial baseline and option impact quantification
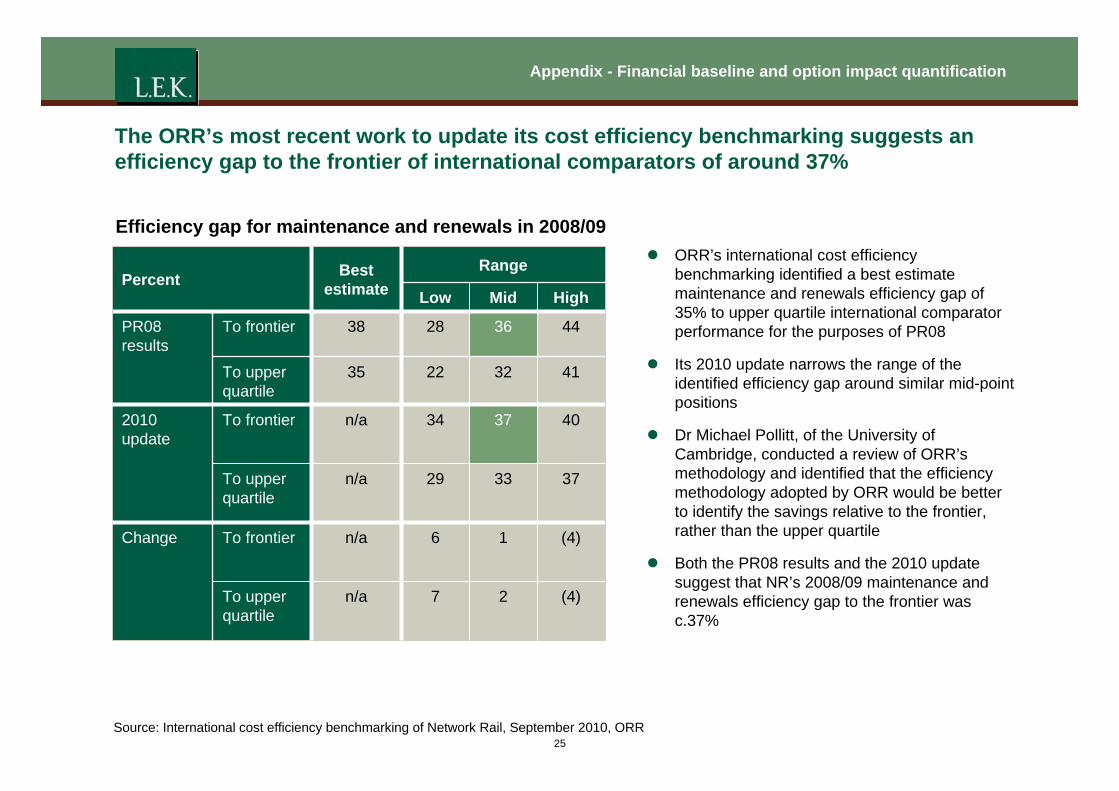
The ORR’s most recent work to update its cost efficiency benchmarking suggests an efficiency gap to the frontier of international comparators of around 37%
Efficiency gap for maintenance and renewals in 2008/09
Percent Best estimate
Range
Low Mid High
PR08 results
To frontier 38 28 36 44
To upper quartile
35 22 32 41
2010 update
To frontier n/a 34 37 40
To upper quartile
n/a 29 33 37
Change To frontier n/a 6 1 (4)
To upper quartile
n/a 7 2 (4)
z ORR’s international cost efficiency benchmarking identified a best estimate maintenance and renewals efficiency gap of 35% to upper quartile international comparator performance for the purposes of PR08
z Its 2010 update narrows the range of the identified efficiency gap around similar mid-point positions
z Dr Michael Pollitt, of the University of Cambridge, conducted a review of ORR’s methodology and identified that the efficiency methodology adopted by ORR would be better to identify the savings relative to the frontier, rather than the upper quartile
z Both the PR08 results and the 2010 update suggest that NR’s 2008/09 maintenance and renewals efficiency gap to the frontier was c.37%
Source: International cost efficiency benchmarking of Network Rail, September 2010, ORR 25
Appendix - Financial baseline and option impact quantification
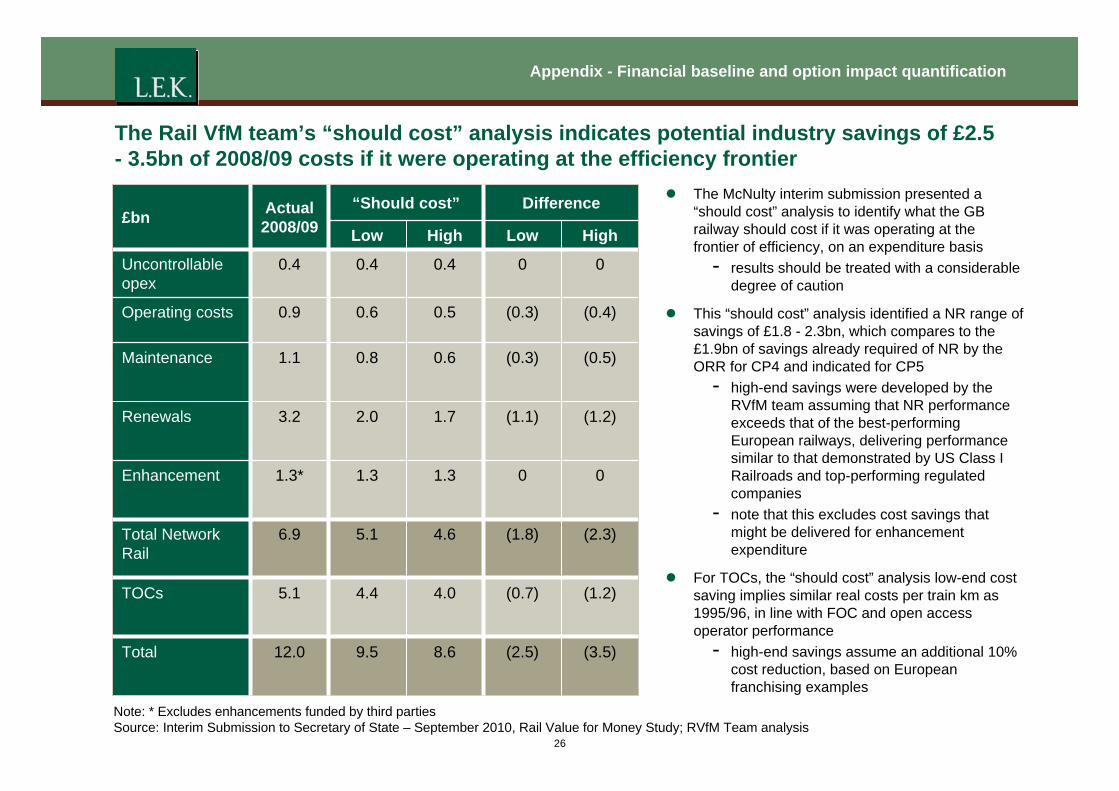
The Rail VfM team’s “should cost” analysis indicates potential industry savings of £2.5 - 3.5bn of 2008/09 costs if it were operating at the efficiency frontier
£bn Actual 2008/09
“Should cost” Difference
Low High Low High
Uncontrollable opex
0.4 0.4 0.4 0 0
Operating costs 0.9 0.6 0.5 (0.3) (0.4)
Maintenance 1.1 0.8 0.6 (0.3) (0.5)
Renewals 3.2 2.0 1.7 (1.1) (1.2)
Enhancement 1.3* 1.3 1.3 0 0
Total Network Rail
6.9 5.1 4.6 (1.8) (2.3)
TOCs 5.1 4.4 4.0 (0.7) (1.2)
Total 12.0 9.5 8.6 (2.5) (3.5)
z The McNulty interim submission presented a “should cost” analysis to identify what the GB railway should cost if it was operating at the frontier of efficiency, on an expenditure basis
- results should be treated with a considerable degree of caution
z This “should cost” analysis identified a NR range of savings of £1.8 - 2.3bn, which compares to the £1.9bn of savings already required of NR by the ORR for CP4 and indicated for CP5
- high-end savings were developed by the RVfM team assuming that NR performance exceeds that of the best-performing European railways, delivering performance similar to that demonstrated by US Class I Railroads and top-performing regulated companies
- note that this excludes cost savings that might be delivered for enhancement expenditure
z For TOCs, the “should cost” analysis low-end cost saving implies similar real costs per train km as 1995/96, in line with FOC and open access operator performance
- high-end savings assume an additional 10% cost reduction, based on European franchising examples
Note: * Excludes enhancements funded by third parties Source: Interim Submission to Secretary of State – September 2010, Rail Value for Money Study; RVfM Team analysis
26
Appendix - Financial baseline and option impact quantification
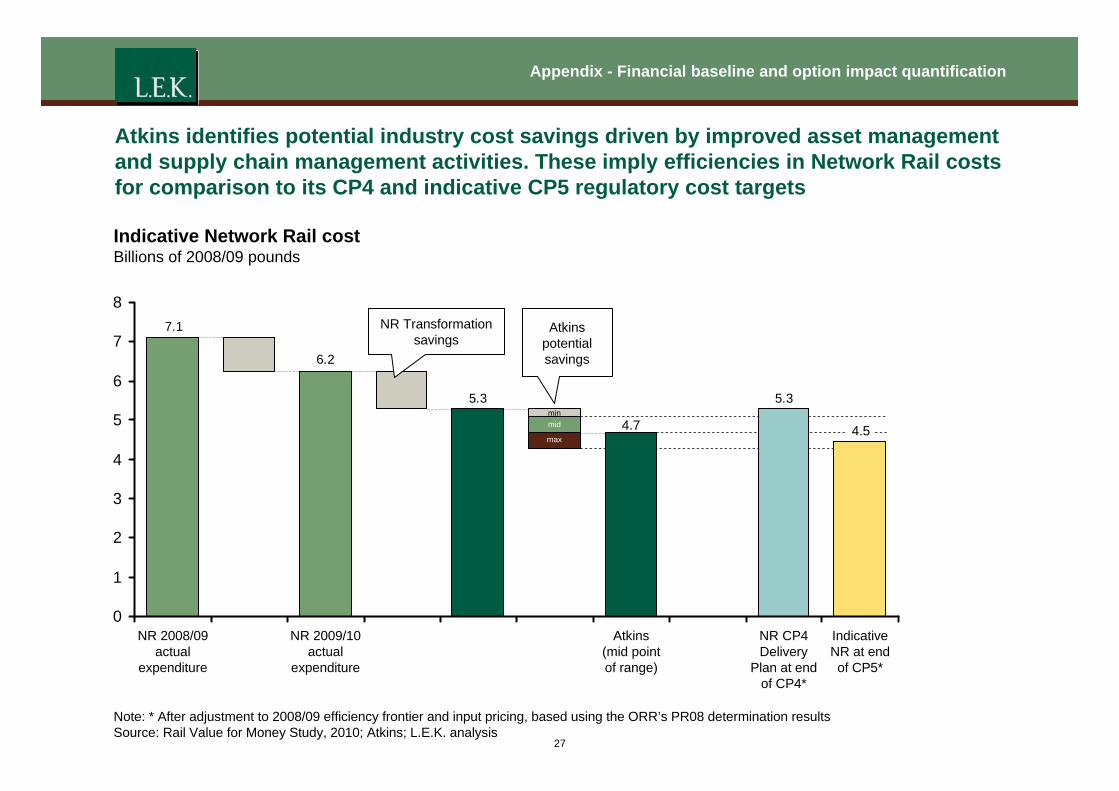
Atkins identifies potential industry cost savings driven by improved asset management and supply chain management activities. These imply efficiencies in Network Rail costs for comparison to its CP4 and indicative CP5 regulatory cost targets
Indicative Network Rail cost Billions of 2008/09 pounds
NR 2008/09 NR 2009/10 Atkins NR CP4 Indicative
actual actual (mid point Delivery NR at end
expenditure expenditure of range) Plan at end of CP5*
of CP4*
Note: * After adjustment to 2008/09 efficiency frontier and input pricing, based using the ORR’s PR08 determination results Source: Rail Value for Money Study, 2010; Atkins; L.E.K. analysis
27
5.3 5.3
6.2
7.1
0
1
2
3
4
5
6
7
8 NR Transformation
savings Atkins
potential savings
min mid
max 4.5 4.7
Appendix - Financial baseline and option impact quantification
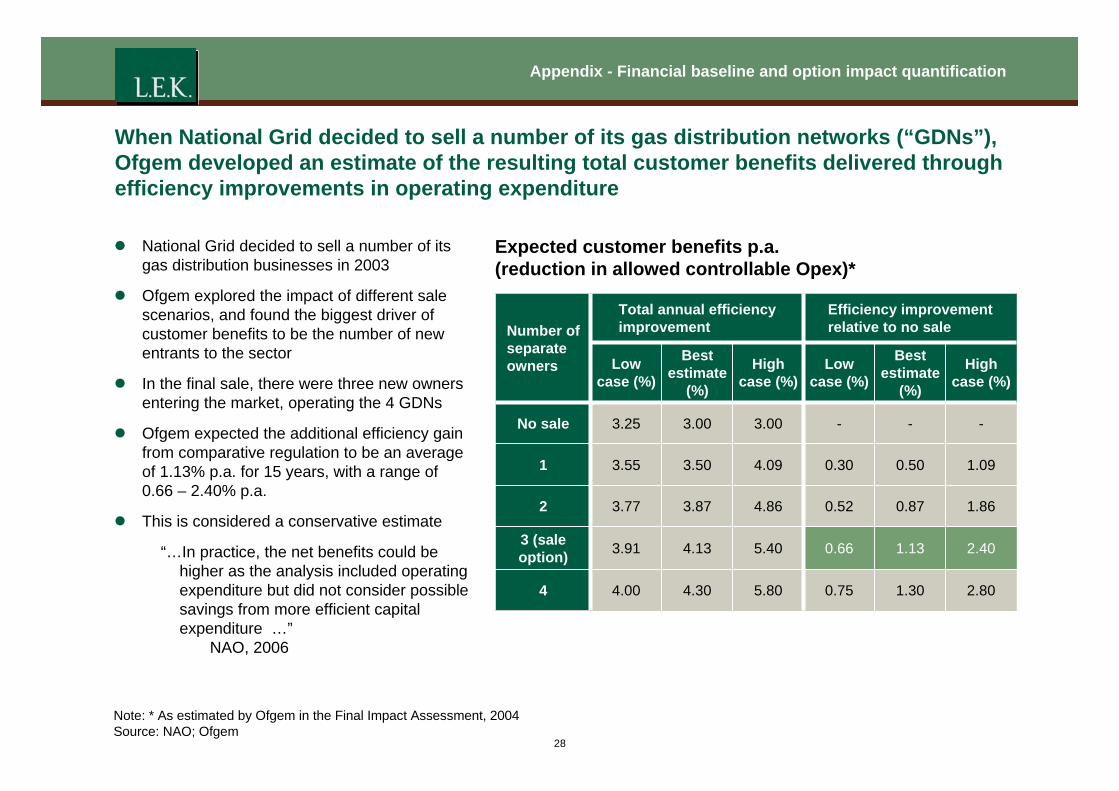
When National Grid decided to sell a number of its gas distribution networks (“GDNs”), Ofgem developed an estimate of the resulting total customer benefits delivered through efficiency improvements in operating expenditure
z National Grid decided to sell a number of its Expected customer benefits p.a. gas distribution businesses in 2003 (reduction in allowed controllable Opex)*
z Ofgem explored the impact of different sale scenarios, and found the biggest driver of customer benefits to be the number of new entrants to the sector
z In the final sale, there were three new owners entering the market, operating the 4 GDNs
z Ofgem expected the additional efficiency gain from comparative regulation to be an average of 1.13% p.a. for 15 years, with a range of 0.66 – 2.40% p.a.
z This is considered a conservative estimate
“…In practice, the net benefits could be higher as the analysis included operating expenditure but did not consider possible savings from more efficient capital expenditure …”
NAO, 2006
Number of Total annual efficiency improvement
Efficiency improvement relative to no sale
separate owners Low
case (%)
Best estimate
(%)
High case (%)
Low case (%)
Best estimate
(%)
High case (%)
No sale 3.25 3.00 3.00 - - -
1 3.55 3.50 4.09 0.30 0.50 1.09
2 3.77 3.87 4.86 0.52 0.87 1.86
3 (sale option) 3.91 4.13 5.40 0.66 1.13 2.40
4 4.00 4.30 5.80 0.75 1.30 2.80
Note: * As estimated by Ofgem in the Final Impact Assessment, 2004 Source: NAO; Ofgem
28

Appendix - Financial baseline and option impact quantification
For NR, a range of sources identify additional potential cost savings beyond that required by the PR08 determination, typically subject to significant uncertainty
Indicative Network Rail expenditure under different efficiency assumptions Indexed 2008/09 pounds (NR 2008/09 actual = 100)
100
80
60
40
20
0
Range of 100 potential efficient cost
7268 68 69 68 63
Base case 59
65 63 59 58
50
NR 2008/09 Indicative NR Top Efficiency frontier Atkins "Should cost" Ofgem actual at end of CP5* quartile
International comparators**
Note: Excluding enhancement spend. * After adjustment for 2008/09 outturn relative to ORR determination and to 2008/09 efficiency frontier and input pricing using the ORR’s PR08 determination results. ** For maintenance and renewals costs; Other costs based on Indicative NR at end of CP5 levels Source: NR; ORR; RVfM Team; RailKonsult; Atkins; L.E.K. analysis
29
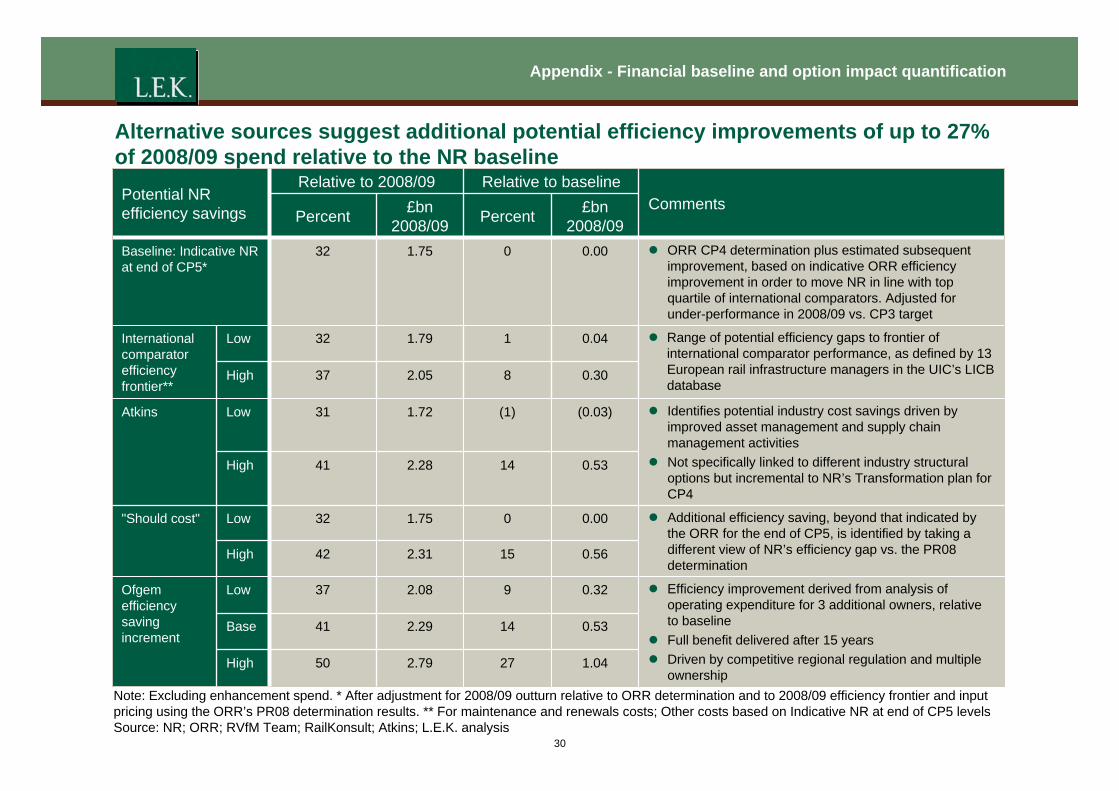
Appendix - Financial baseline and option impact quantification
Alternative sources suggest additional potential efficiency improvements of up to 27% of 2008/09 spend relative to the NR baseline Potential NR efficiency savings
Relative to 2008/09 Relative to baseline Comments
Percent £bn 2008/09 Percent £bn
2008/09 Baseline: Indicative NR at end of CP5*
32 1.75 0 0.00 z ORR CP4 determination plus estimated subsequent improvement, based on indicative ORR efficiency improvement in order to move NR in line with top quartile of international comparators. Adjusted for under-performance in 2008/09 vs. CP3 target
International comparator efficiency frontier**
Low 32 1.79 1 0.04
z Identifies potential industry cost savings driven by improved asset management and supply chain management activities
z Not specifically linked to different industry structural options but incremental to NR’s Transformation plan for CP4
z Range of potential efficiency gaps to frontier of international comparator performance, as defined by 13 European rail infrastructure managers in the UIC’s LICB database
z Additional efficiency saving, beyond that indicated by the ORR for the end of CP5, is identified by taking a different view of NR’s efficiency gap vs. the PR08 determination
High 37 2.05 8 0.30
Atkins Low 31 1.72 (1) (0.03)
High 41 2.28 14 0.53
"Should cost" Low 32 1.75 0 0.00
High 42 2.31 15 0.56
Ofgem efficiency saving increment
Low 37 2.08 9 0.32 z Efficiency improvement derived from analysis of operating expenditure for 3 additional owners, relative to baseline
z Full benefit delivered after 15 years z Driven by competitive regional regulation and multiple
ownership
Base 41 2.29 14 0.53
High 50 2.79 27 1.04
Note: Excluding enhancement spend. * After adjustment for 2008/09 outturn relative to ORR determination and to 2008/09 efficiency frontier and input pricing using the ORR’s PR08 determination results. ** For maintenance and renewals costs; Other costs based on Indicative NR at end of CP5 levels Source: NR; ORR; RVfM Team; RailKonsult; Atkins; L.E.K. analysis
30
Agenda
Agenda
z Executive summary
z Introduction
z Horizontal separation
z Vertical integration
z Vertical alignment
z Cost and revenue sharing
z Implementation
z Appendix
- Stakeholder consultation programme and documents reviewed
- Financial baseline and option impact quantification
- Regional case studies – Anglia
– LNE
– Chiltern
– Summary
- Review of existing arrangements
31
Appendix – Regional case studies - Anglia
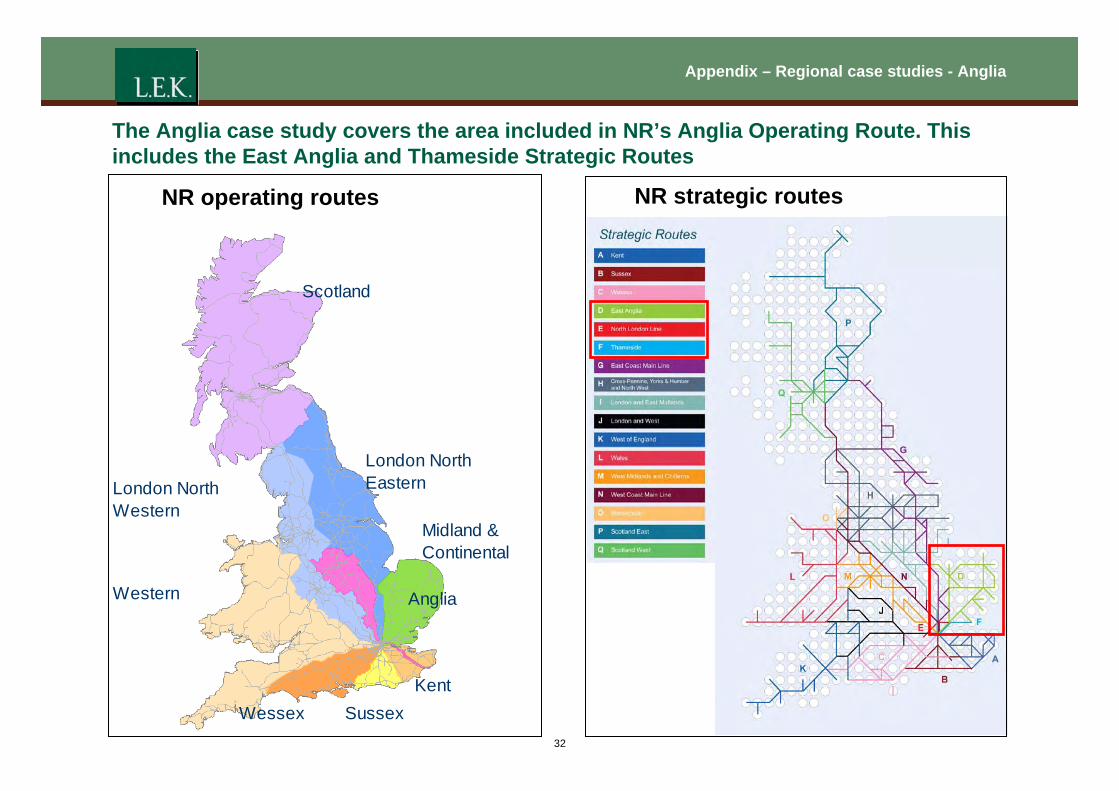
The Anglia case study covers the area included in NR’s Anglia Operating Route. This includes the East Anglia and Thameside Strategic Routes
NR operating routes
Anglia
Sussex Wessex
London North Eastern London North
Scotland
Kent
Midland & Continental
NR strategic routes
Western
Western
32
Appendix – Regional case studies - Anglia
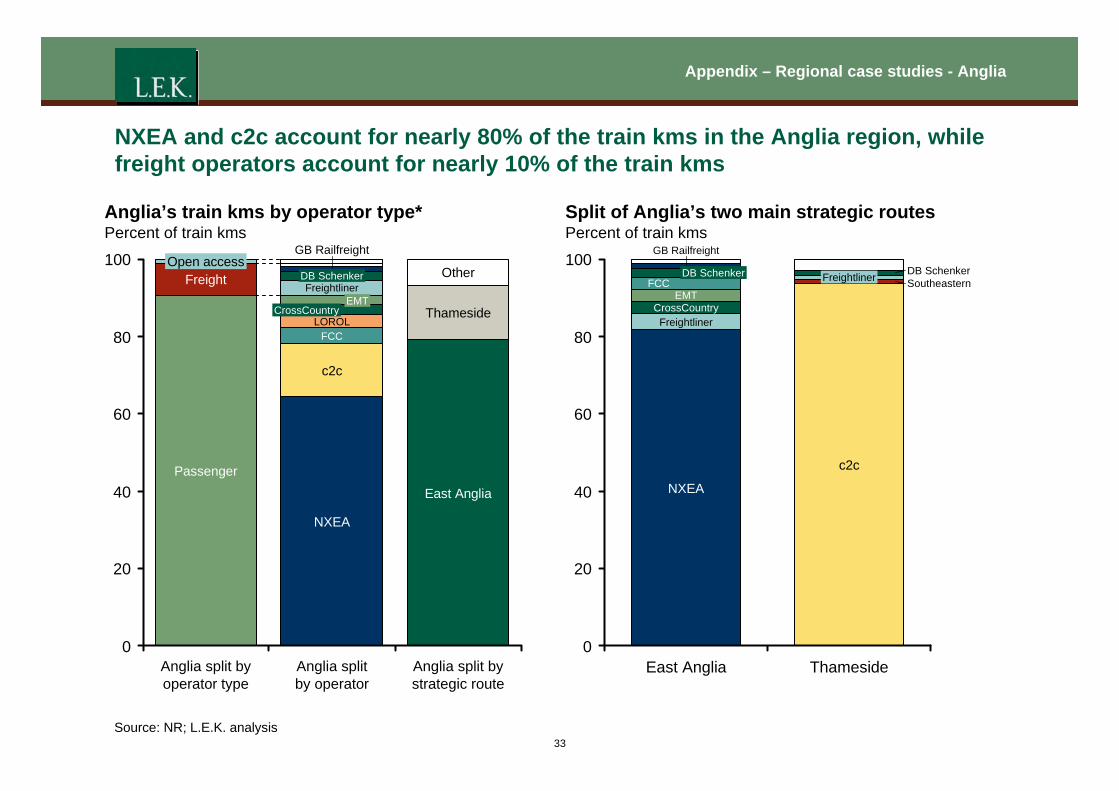
NXEA and c2c account for nearly 80% of the train kms in the Anglia region, while freight operators account for nearly 10% of the train kms
Anglia’s train kms by operator type* Percent of train kms
GB Railfreight 100
80
60
40
20
0
Freight Open access
Freightliner DB Schenker Other
CLOROL
rossCountry EMT
Thameside
FCC
c2c
Passenger
East Anglia
NXEA
Split of Anglia’s two main strategic routes Percent of train kms
GB Railfreight 100
DB Schenker Southeastern
80
60
40
20
0
CrossCountry
c2c
Freightliner FCC
NXEA
DB Schenker
Freightliner
EMT
Anglia split by Anglia split Anglia split by East Anglia Thameside operator type by operator strategic route
Source: NR; L.E.K. analysis 33
Appendix – Regional case studies - Anglia
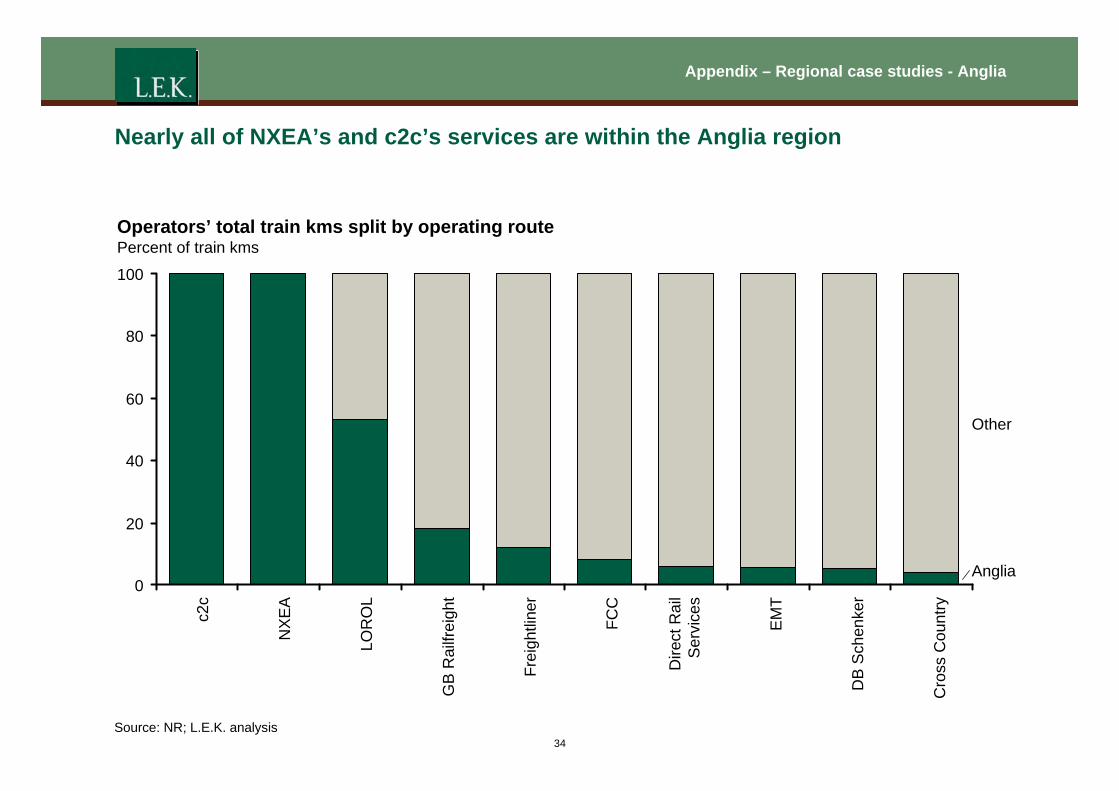
Nearly all of NXEA’s and c2c’s services are within the Anglia region
Operators’ total train kms split by operating route Percent of train kms
100
80
60 Other
40
20
Anglia 0
c2c
NXE
A
LOR
OL
GB
Rai
lfrei
ght
Frei
ghtli
ner
FCC
Dire
ct R
ail
Ser
vice
s
EM
T
DB
Sch
enke
r
Cro
ss C
ount
ry
Source: NR; L.E.K. analysis 34
Appendix – Regional case studies – Anglia
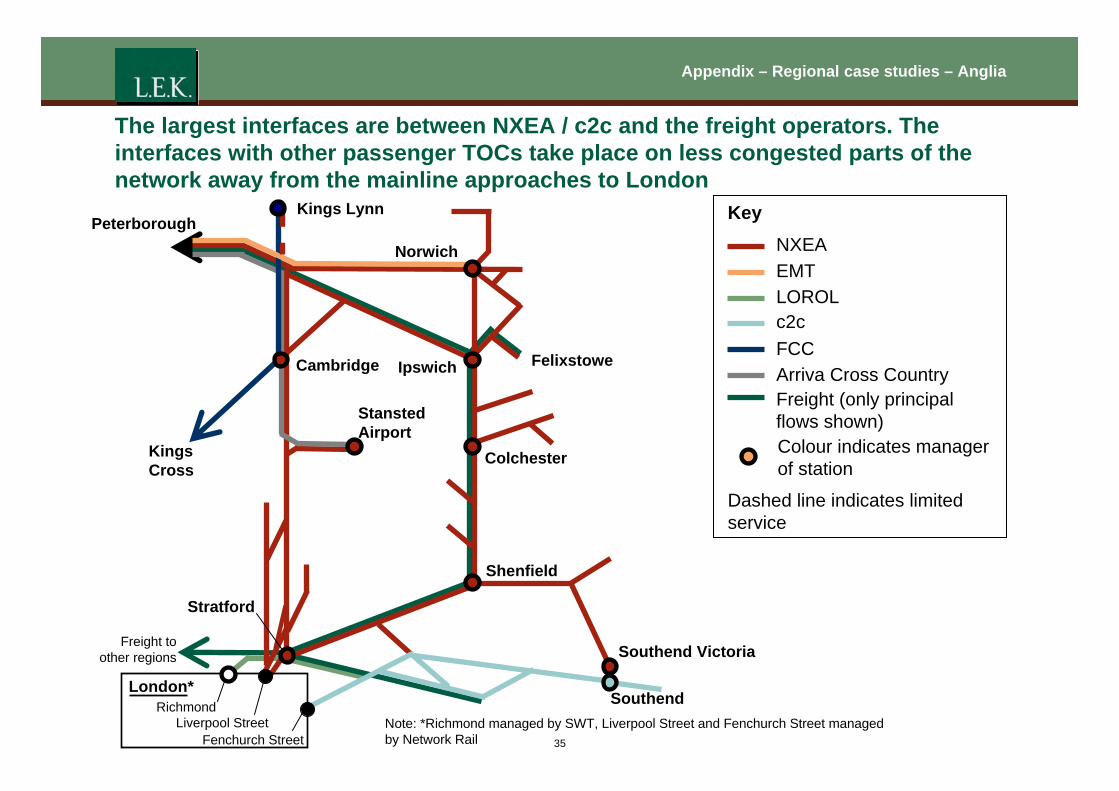
The largest interfaces are between NXEA / c2c and the freight operators. The interfaces with other passenger TOCs take place on less congested parts of the network away from the mainline approaches to London
35
Richmond Liverpool Street
Fenchurch Street
Southend Victoria
Shenfield
Colchester
Norwich
Ipswich
Stansted Airport
Cambridge
Kings Lynn
Kings Cross
London*
Stratford
Note: *Richmond managed by SWT, Liverpool Street and Fenchurch Street managed by Network Rail
Peterborough
Southend
Felixstowe
Freight to other regions
Key NXEA EMT LOROL c2c FCC Arriva Cross Country Freight (only principal flows shown) Colour indicates manager of station
Dashed line indicates limited service
Appendix – Regional case studies – Anglia
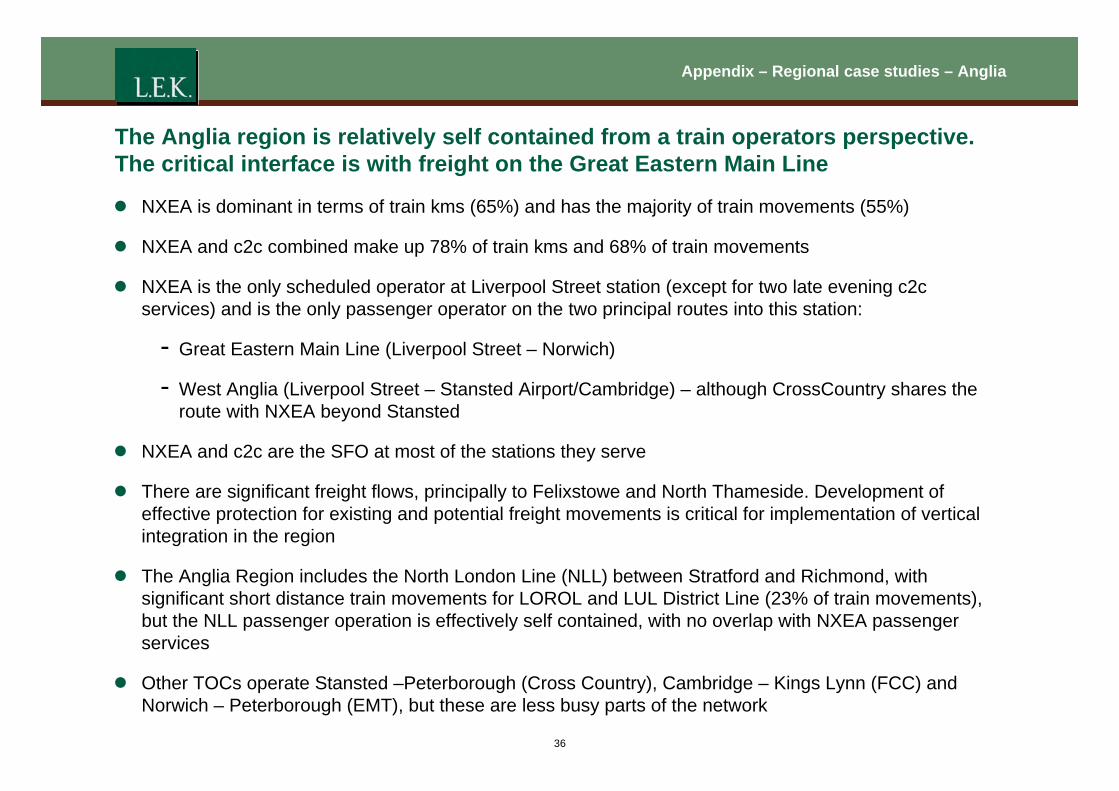
The Anglia region is relatively self contained from a train operators perspective. The critical interface is with freight on the Great Eastern Main Line
z NXEA is dominant in terms of train kms (65%) and has the majority of train movements (55%)
z NXEA and c2c combined make up 78% of train kms and 68% of train movements
z NXEA is the only scheduled operator at Liverpool Street station (except for two late evening c2c services) and is the only passenger operator on the two principal routes into this station:
- Great Eastern Main Line (Liverpool Street – Norwich)
- West Anglia (Liverpool Street – Stansted Airport/Cambridge) – although CrossCountry shares the route with NXEA beyond Stansted
z NXEA and c2c are the SFO at most of the stations they serve
z There are significant freight flows, principally to Felixstowe and North Thameside. Development of effective protection for existing and potential freight movements is critical for implementation of vertical integration in the region
z The Anglia Region includes the North London Line (NLL) between Stratford and Richmond, with significant short distance train movements for LOROL and LUL District Line (23% of train movements), but the NLL passenger operation is effectively self contained, with no overlap with NXEA passenger services
z Other TOCs operate Stansted –Peterborough (Cross Country), Cambridge – Kings Lynn (FCC) and Norwich – Peterborough (EMT), but these are less busy parts of the network
36

Appendix – Regional case studies – Anglia
The Anglia region is covered by three Infrastructure Maintenance Delivery Units
Kings Lynn
Peterborough Norwich
Felixstowe Cambridge Ipswich Stations covered by the Anglia Operating Route*
Stansted IMDU Tottenham Airport IMDU ColchesterKings
ColchesterCross IMDU Romford
Shenfield
Stratford
Southend
Victoria
London* Southend Richmond
Liverpool Street Note: *Richmond managed by SWT, Liverpool Street and Fenchurch Street managed by Network Rail Fenchurch Street
37
Appendix – Regional case studies – Anglia
(1.0)
(0.8)
(0.6)
(0.4)
(0.2)
0.0
0.2
0.4
0.6
0.8
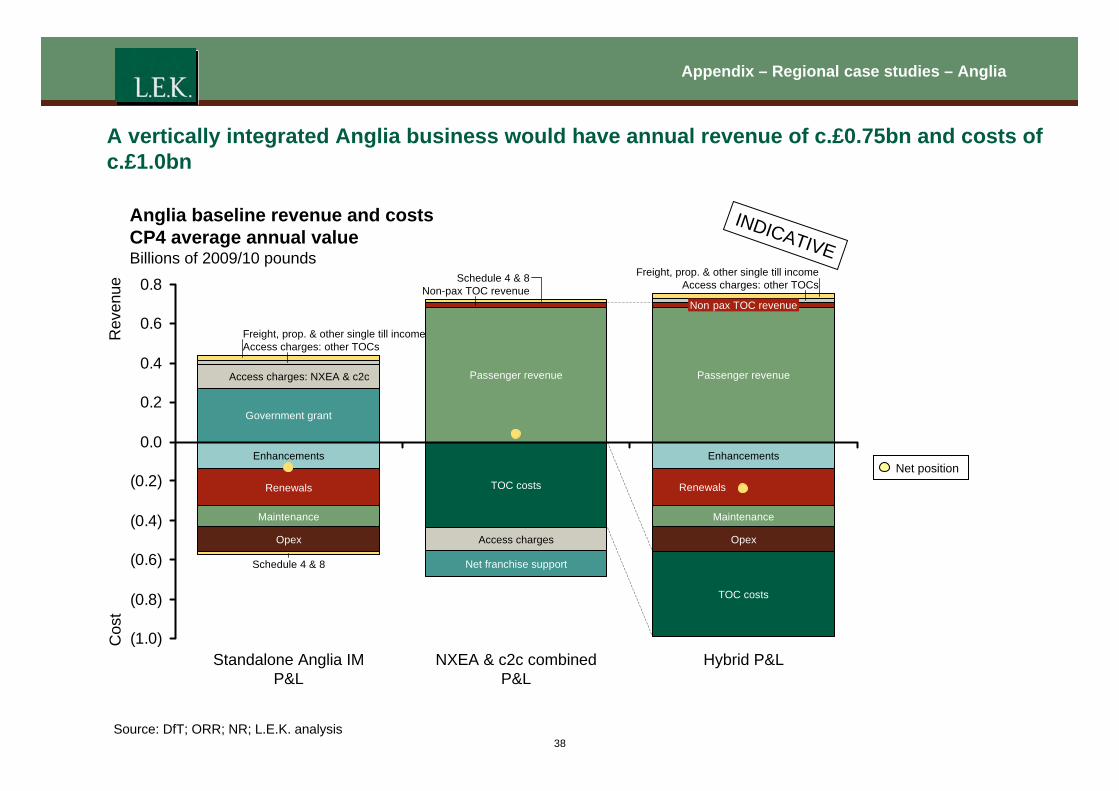
Anglia baseline revenue and costs CP4 average annual value Billions of 2009/10 pounds
TOC costs
Passenger revenue
Non pax TOC revenue
Access charges: other TOCs Freight, prop. & other single till income
Opex
Maintenance
Enhancements
Net franchise support
Access charges
TOC costs
Passenger revenue
Access charges: other TOCs Freight, prop. & other single till income
Opex
Maintenance
Renewals
Enhancements
Schedule 4 & 8
Schedule 4 & 8
Government grant
Access charges: NXEA & c2c
Non-pax TOC revenue
Cos
t R
even
ue
INDICATIVE
Renewals
Net position
A vertically integrated Anglia business would have annual revenue of c.£0.75bn and costs of c.£1.0bn
Standalone Anglia IM NXEA & c2c combined Hybrid P&L
P&L P&L
Source: DfT; ORR; NR; L.E.K. analysis 38
Agenda
Agenda
z Executive summary
z Introduction
z Horizontal separation
z Vertical integration
z Vertical alignment
z Cost and revenue sharing
z Implementation
z Appendix
- Stakeholder consultation programme and documents reviewed
- Financial baseline and option impact quantification
- Regional case studies – Anglia
– LNE
– Chiltern
– Summary
- Review of existing arrangements
39

Appendix – Regional case studies – LNE
The LNE case study covers the area included in NR’s LNE Operating Route. This includes the East Coast Main Line Strategic Route and part of Cross-Pennine, Yorks & Humber and North West Strategic Route
NR operating routes
40
Anglia
Sussex Wessex
London North Eastern London North
Scotland
Kent
Midland & Continental
NR strategic routes
Western
Western
Appendix – Regional case studies – LNE
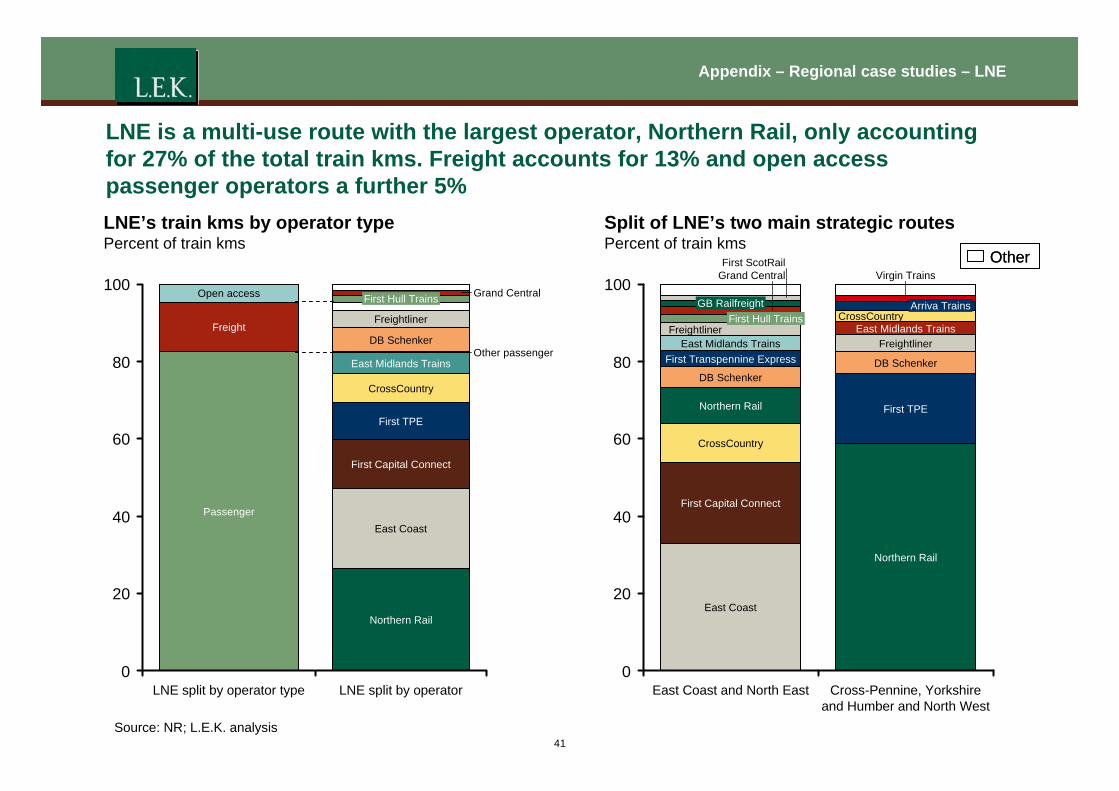
LNE is a multi-use route with the largest operator, Northern Rail, only accounting for 27% of the total train kms. Freight accounts for 13% and open access passenger operators a further 5% LNE’s train kms by operator type Split of LNE’s two main strategic routes Percent of train kms Percent of train kms
100
80
60
40
20
0
First ScotRail OtherOther
Northern Rail
East Coast
First Capital Connect
First TPE
CrossCountry
East Midlands Trains
DB Schenker
Freightliner
First Hull Trains
Passenger
Freight
Open access 100Grand Central
Other passenger 80
60
40
20
0
Northern Rail
First TPE
DB Schenker
Freightliner East Midlands Trains
CrossCountry Arriva Trains
First Capital Connect
CrossCountry
Northern Rail
DB Schenker
First Transpennine Express East Midlands Trains
Freightliner First Hull Trains
Grand Central
GB Railfreight
East Coast
Virgin Trains
LNE split by operator type LNE split by operator East Coast and North East Cross-Pennine, Yorkshire and Humber and North West
Source: NR; L.E.K. analysis 41
Appendix – Regional case studies – LNE
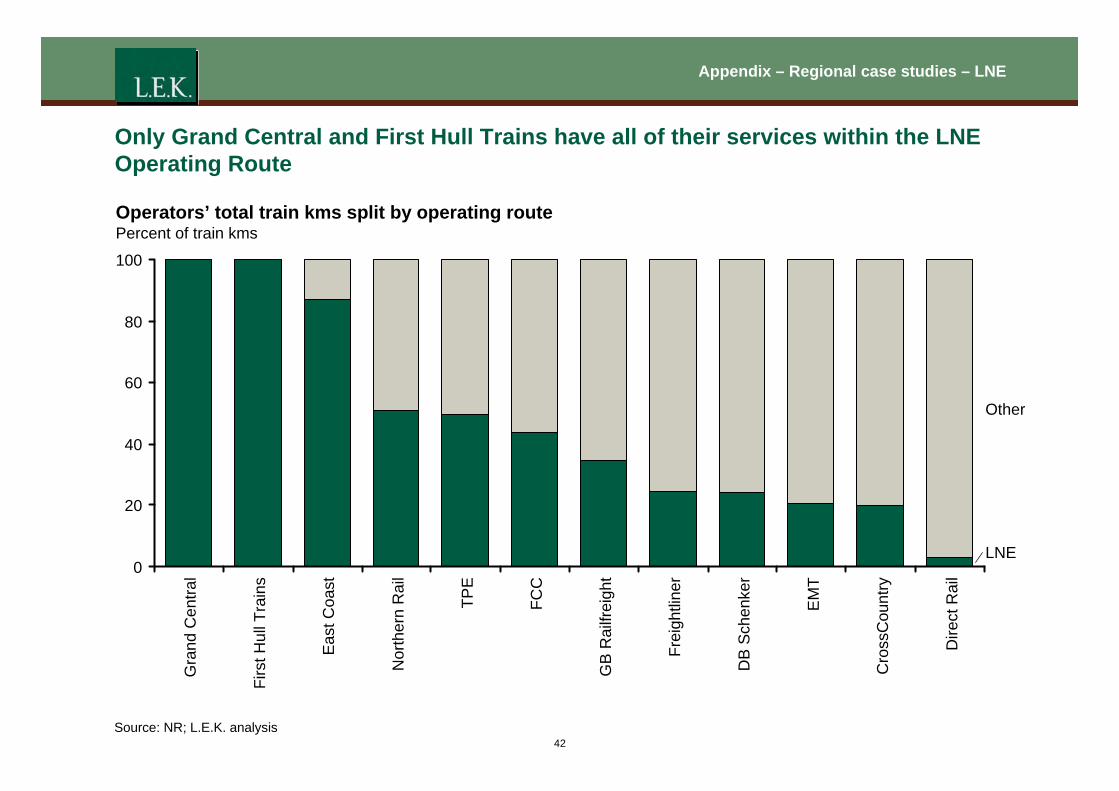
Only Grand Central and First Hull Trains have all of their services within the LNE Operating Route
Operators’ total train kms split by operating route Percent of train kms
LNE
Other
100
80
60
40
20
0
Gra
nd C
entra
l
Firs
t Hul
l Tra
ins
Eas
t Coa
st
Nor
ther
n R
ail
TPE
FCC
GB
Rai
lfrei
ght
Frei
ghtli
ner
DB
Sch
enke
r
EM
T
Cro
ssC
ount
ry
Dire
ct R
ail
Source: NR; L.E.K. analysis 42
Appendix – Regional case studies – LNE
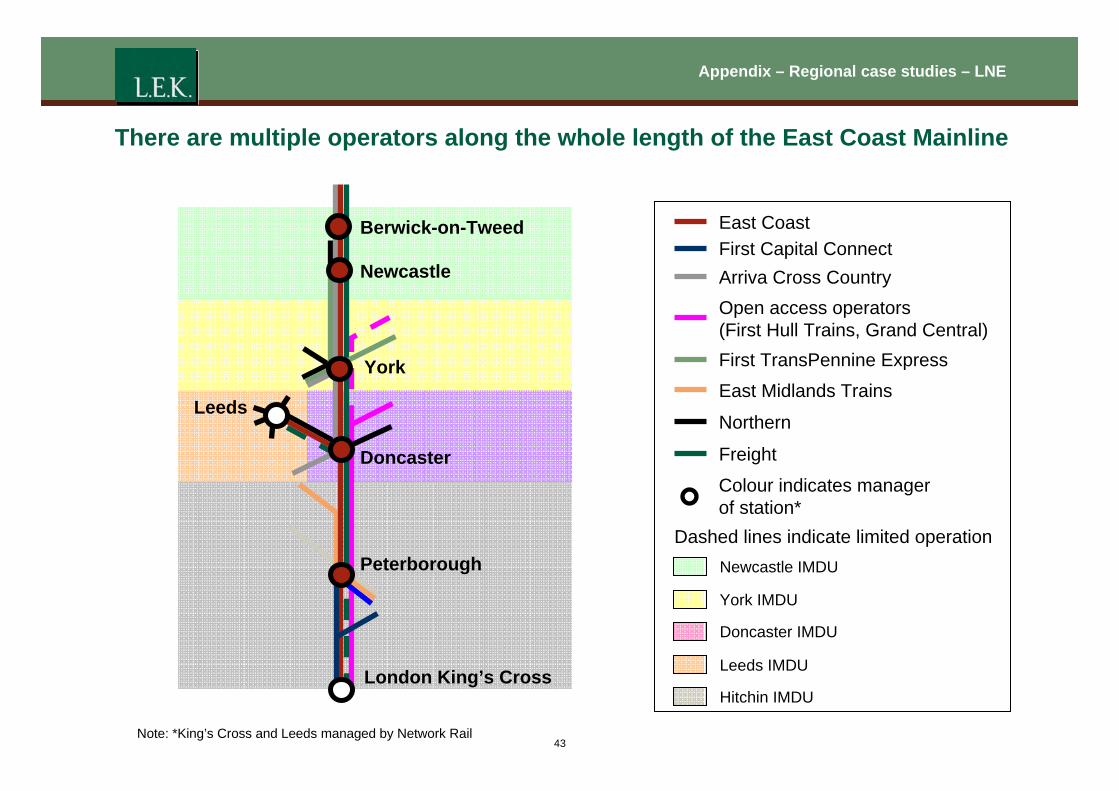
There are multiple operators along the whole length of the East Coast Mainline
Berwick-on-Tweed
Newcastle
York
Leeds
Doncaster
Peterborough
London King’s Cross
East Coast
First Capital Connect
Arriva Cross Country
Open access operators (First Hull Trains, Grand Central) First TransPennine Express East Midlands Trains
Northern
Freight
Colour indicates manager of station*
Dashed lines indicate limited operation Newcastle IMDU
York IMDU
Doncaster IMDU
Leeds IMDU
Hitchin IMDU
Note: *King’s Cross and Leeds managed by Network Rail 43
Appendix – Regional case studies – LNE
Views from the LNE workshop
z This is a complex, multi-use route
z All participants recognised that there is no single dominant operator
- There was concern that Railtrack/Network Rail had in the past tended to be too close to GNER
z There was some support for creation of a Network Rail “Northern” region, made up of secondary routes from LNE and LNW
- Greater alignment with First TransPennine Express and Northern Rail
- Improved focus on project development and infrastructure cost management in the Northern Rail area
z There was some nervousness about the impact of bespoke deals between, for example, Network Rail and East Coast. Other TOCs and FOCs saw a risk that their interests would be secondary
z There was support for devolution within Network Rail, but no support for independent ownership of Regional IMs or vertical integration on this geography, at least in the short/medium term
44
Agenda
Agenda
z Executive summary
z Introduction
z Horizontal separation
z Vertical integration
z Vertical alignment
z Cost and revenue sharing
z Implementation
z Appendix
- Stakeholder consultation programme and documents reviewed
- Financial baseline and option impact quantification
- Regional case studies – Anglia
– LNE
– Chiltern
– Summary
- Review of existing arrangements
45
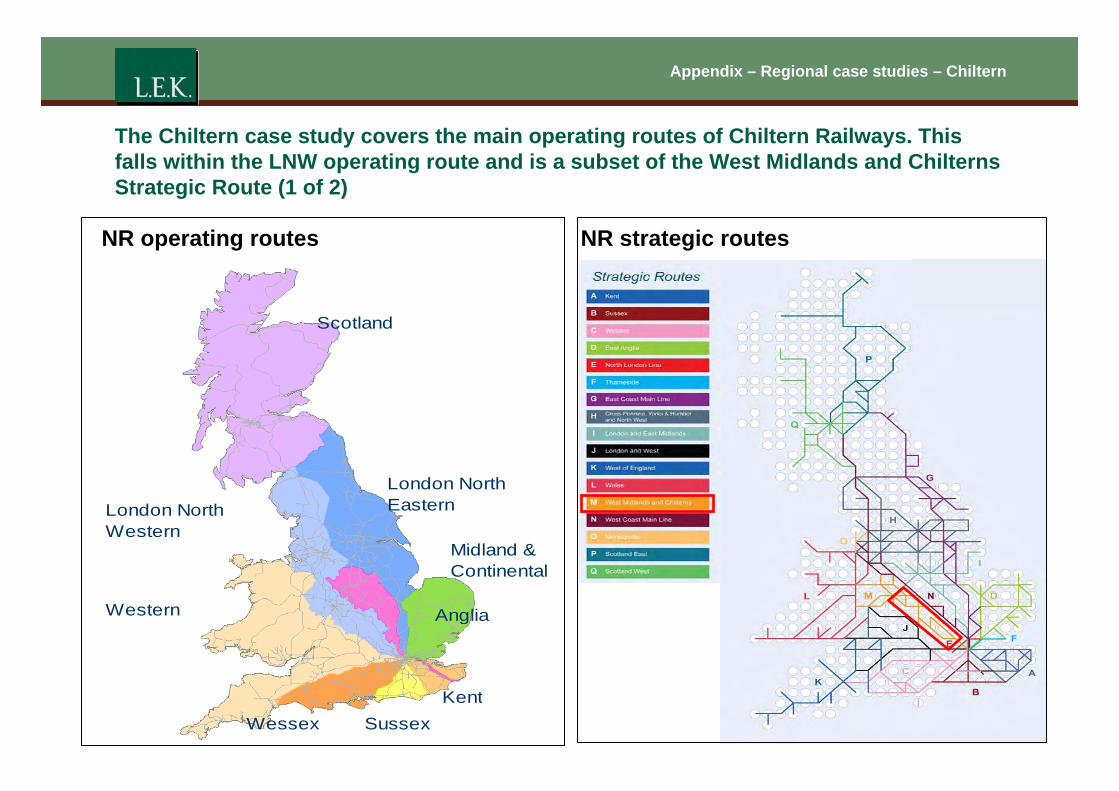
Appendix – Regional case studies – Chiltern
The Chiltern case study covers the main operating routes of Chiltern Railways. This falls within the LNW operating route and is a subset of the West Midlands and Chilterns Strategic Route (1 of 2)
NR operating routes
Anglia
Sussex Wessex
London North Eastern London North
Scotland
Kent
Midland & Continental
NR strategic routes
Western
Western
“Chiltern Operating Area”
Aynho Jn
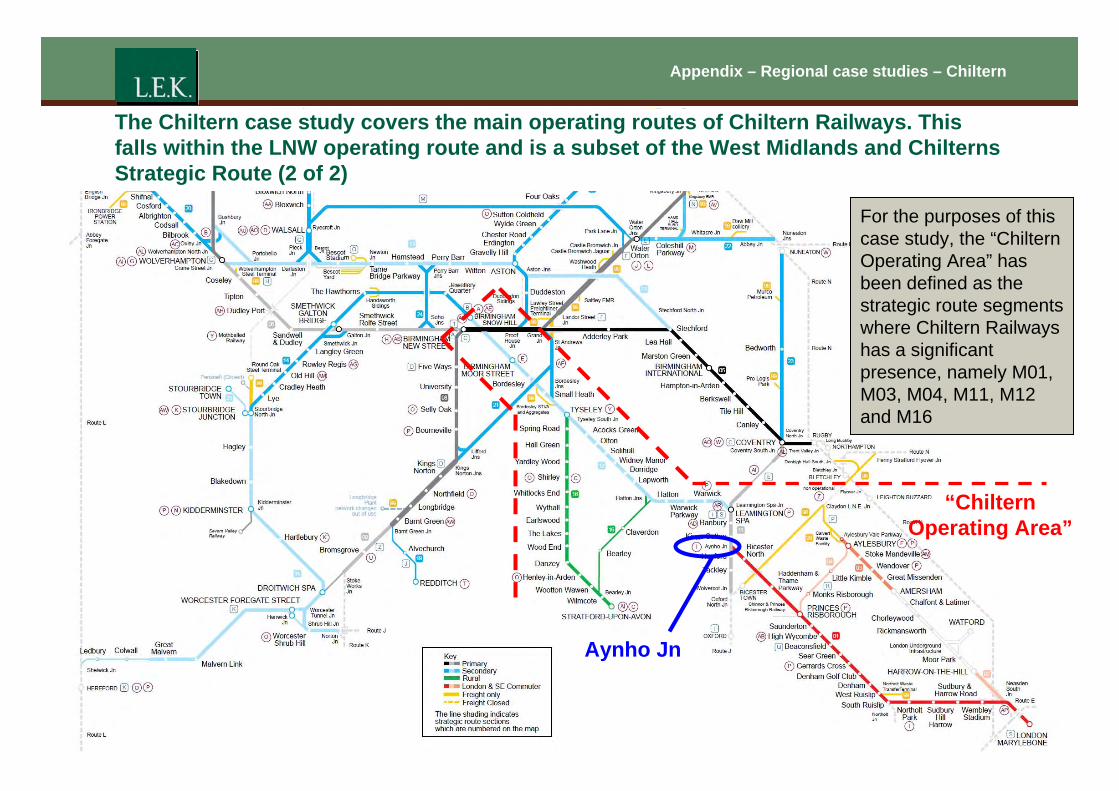
For the purposes of this case study, the “Chiltern Operating Area” has been defined as the strategic route segments where Chiltern Railways has a significant presence, namely M01, M03, M04, M11, M12 and M16
Appendix – Regional case studies – Chiltern
The Chiltern case study covers the main operating routes of Chiltern Railways. This falls within the LNW operating route and is a subset of the West Midlands and Chilterns Strategic Route (2 of 2)
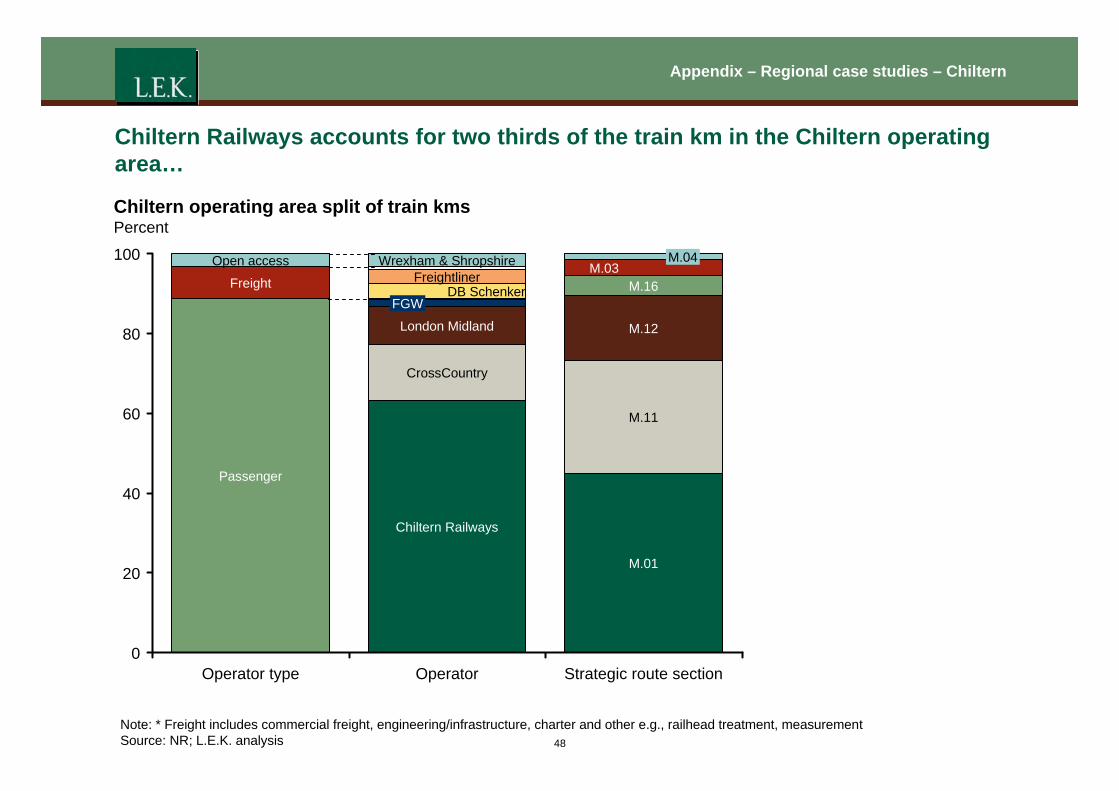
Appendix – Regional case studies – Chiltern
Chiltern Railways accounts for two thirds of the train km in the Chiltern operating area…
Chiltern operating area split of train kms Percent
Operator type Operator Strategic route section
Note: * Freight includes commercial freight, engineering/infrastructure, charter and other e.g., railhead treatment, measurement
Source: NR; L.E.K. analysis 48
0
100
20
M.11
M.12
M.01
M.16
40
60
80
DB Schenker Freightliner
Wrexham & Shropshire
Passenger
London Midland
Freight
Open access
FGW
Chiltern Railways
M.03 M.04
CrossCountry
Appendix – Regional case studies – Chiltern
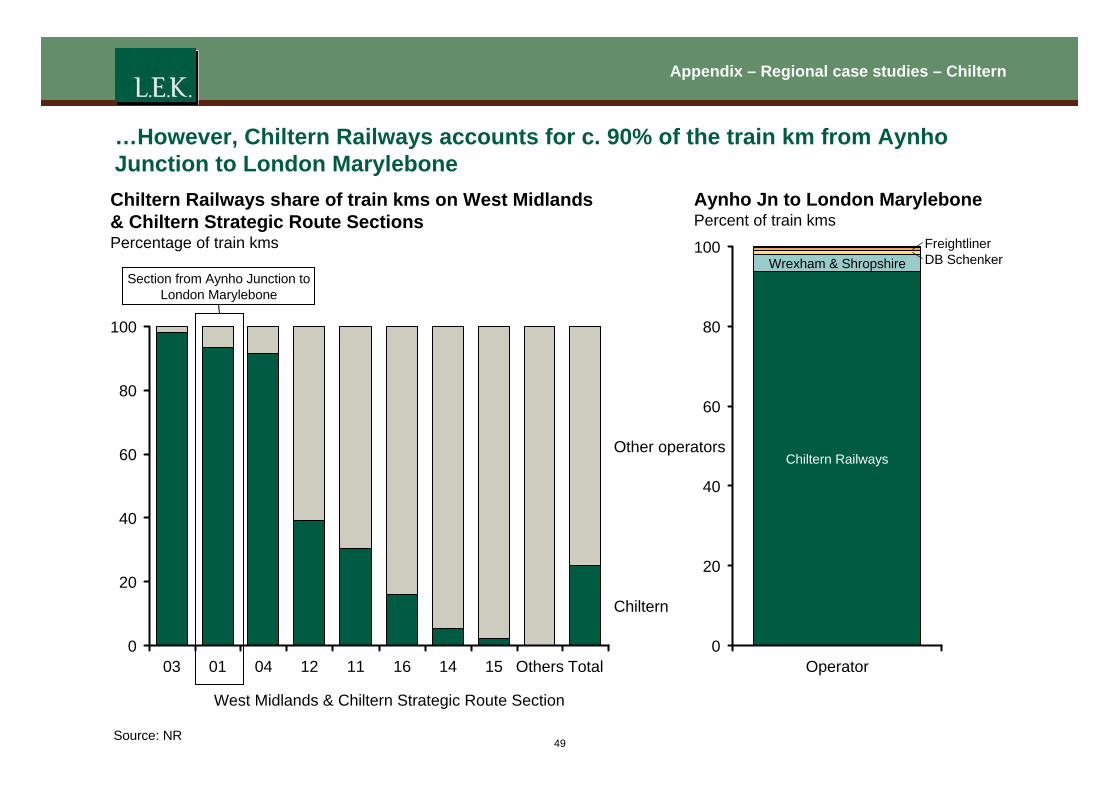
…However, Chiltern Railways accounts for c. 90% of the train km from Aynho Junction to London Marylebone Chiltern Railways share of train kms on West Midlands Aynho Jn to London Marylebone & Chiltern Strategic Route Sections Percent of train kms Percentage of train kms
Chiltern Railways
Wrexham & Shropshire Freightliner 100 DB Schenker
80
60
Other operators
40
20
Chiltern
0 Operator
80
60
40
20
100
0 TotalOthers01 151416110403 12
Section from Aynho Junction to London Marylebone
West Midlands & Chiltern Strategic Route Section
Source: NR 49
Appendix – Regional case studies – Chiltern
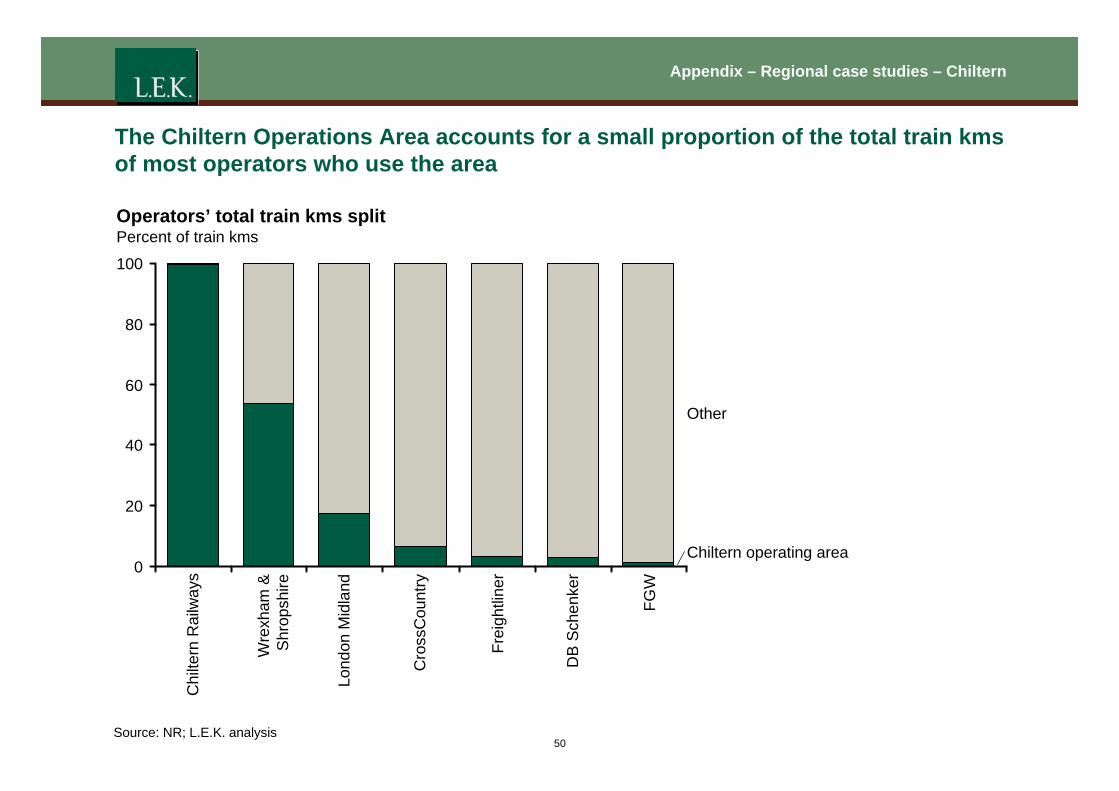
The Chiltern Operations Area accounts for a small proportion of the total train kms of most operators who use the area
Operators’ total train kms split Percent of train kms
Other
Chiltern operating area
40
20
100
0
60
80
Chi
ltern
Rai
lway
s
Wre
xham
&S
hrop
shire
Lond
on M
idla
nd
Cro
ssC
ount
ry
Frei
ghtli
ner
DB
Sch
enke
r
FGW
Source: NR; L.E.K. analysis 50
Appendix – Regional case studies – Chiltern
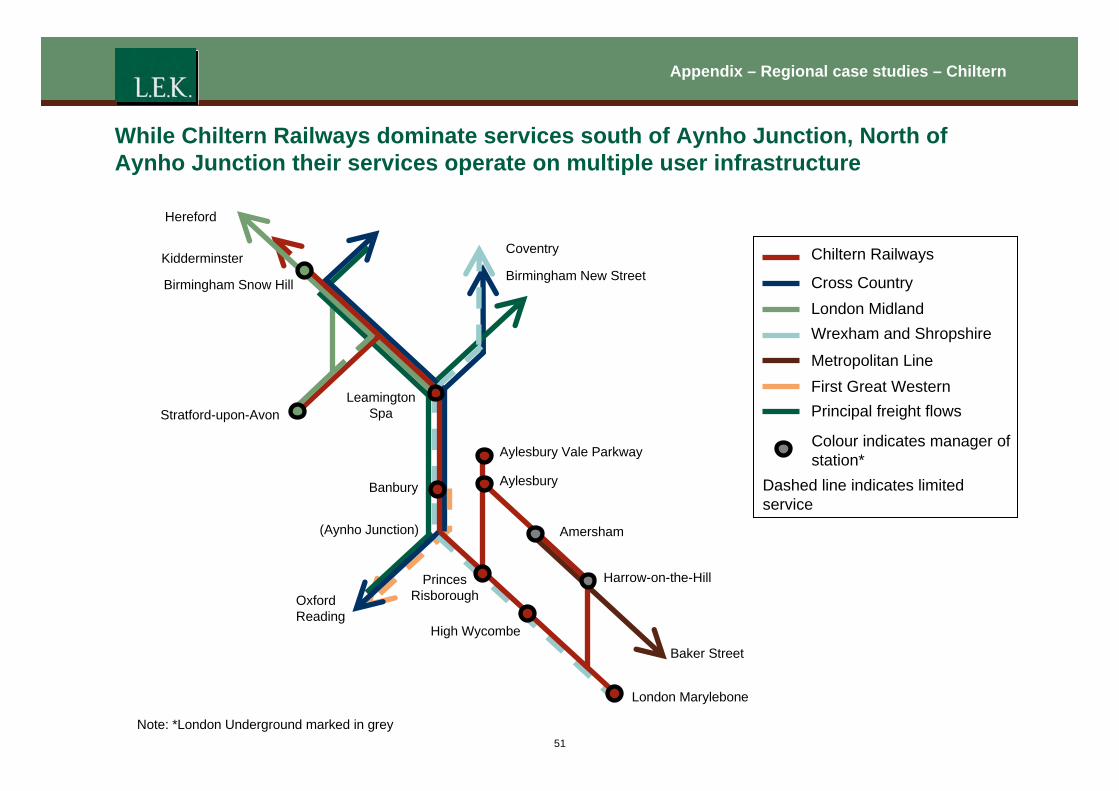
While Chiltern Railways dominate services south of Aynho Junction, North of Aynho Junction their services operate on multiple user infrastructure
Hereford
London Marylebone
Amersham
Aylesbury
Aylesbury Vale Parkway
High Wycombe
Princes Risborough
Banbury
Leamington Spa
Birmingham Snow Hill
Stratford-upon-Avon
(Aynho Junction)
Kidderminster Coventry
Birmingham New Street
Oxford Reading
Harrow-on-the-Hill
Baker Street
Chiltern Railways
Cross Country London Midland Wrexham and Shropshire
Metropolitan Line
Dashed line indicates limited service
First Great Western Principal freight flows
Colour indicates manager of station*
Note: *London Underground marked in grey 51
Appendix – Regional case studies – Chiltern
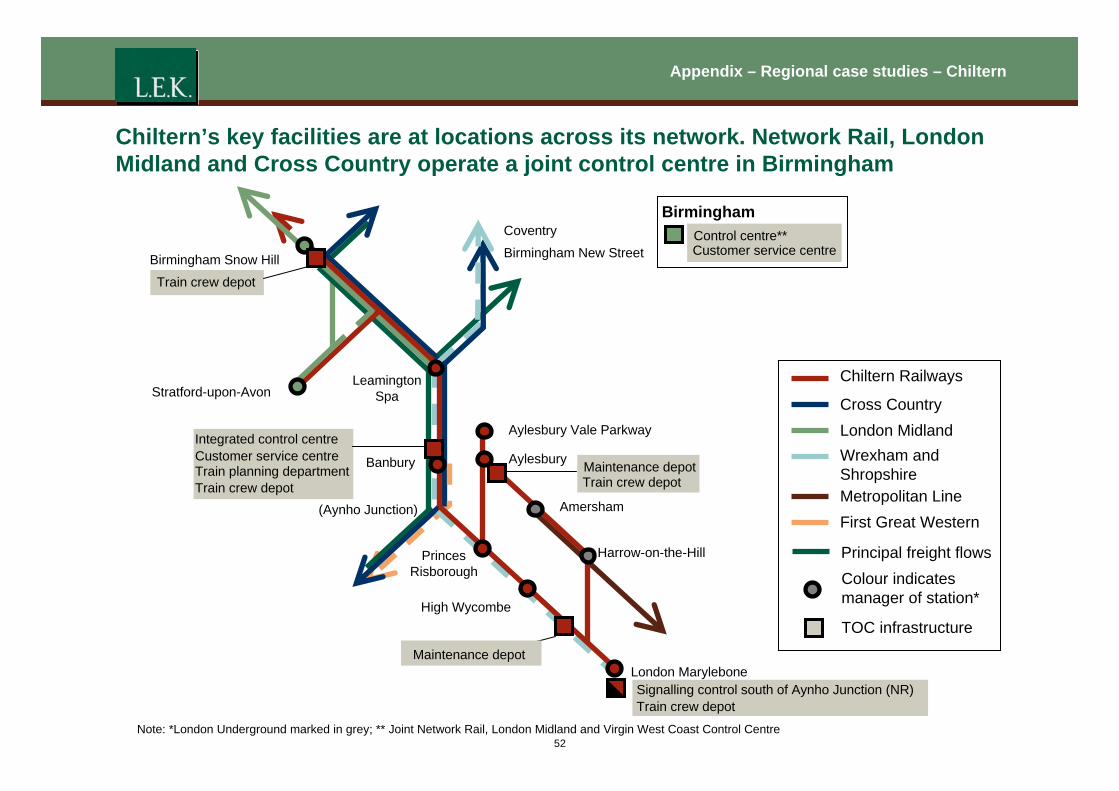
Chiltern’s key facilities are at locations across its network. Network Rail, London Midland and Cross Country operate a joint control centre in Birmingham
London Marylebone
Aylesbury
High Wycombe
Banbury
Leamington SpaStratford-upon-Avon
(Aynho Junction)
Coventry
Birmingham New Street
Chiltern Railways
Cross Country London Midland Wrexham and Shropshire Metropolitan Line First Great Western
Colour indicates manager of station*
Signalling control south of Aynho Junction (NR)
Customer service centre Integrated control centre
Train planning department
Control centre** Customer service centre
TOC infrastructure
Birmingham Snow Hill
Birmingham
Train crew depot
Aylesbury Vale Parkway
Amersham
Princes Risborough
Harrow-on-the-Hill
Train crew depot
Maintenance depot Train crew depot
Principal freight flows
Train crew depot
Maintenance depot
Note: *London Underground marked in grey; ** Joint Network Rail, London Midland and Virgin West Coast Control Centre 52
Appendix – Regional case studies – Chiltern
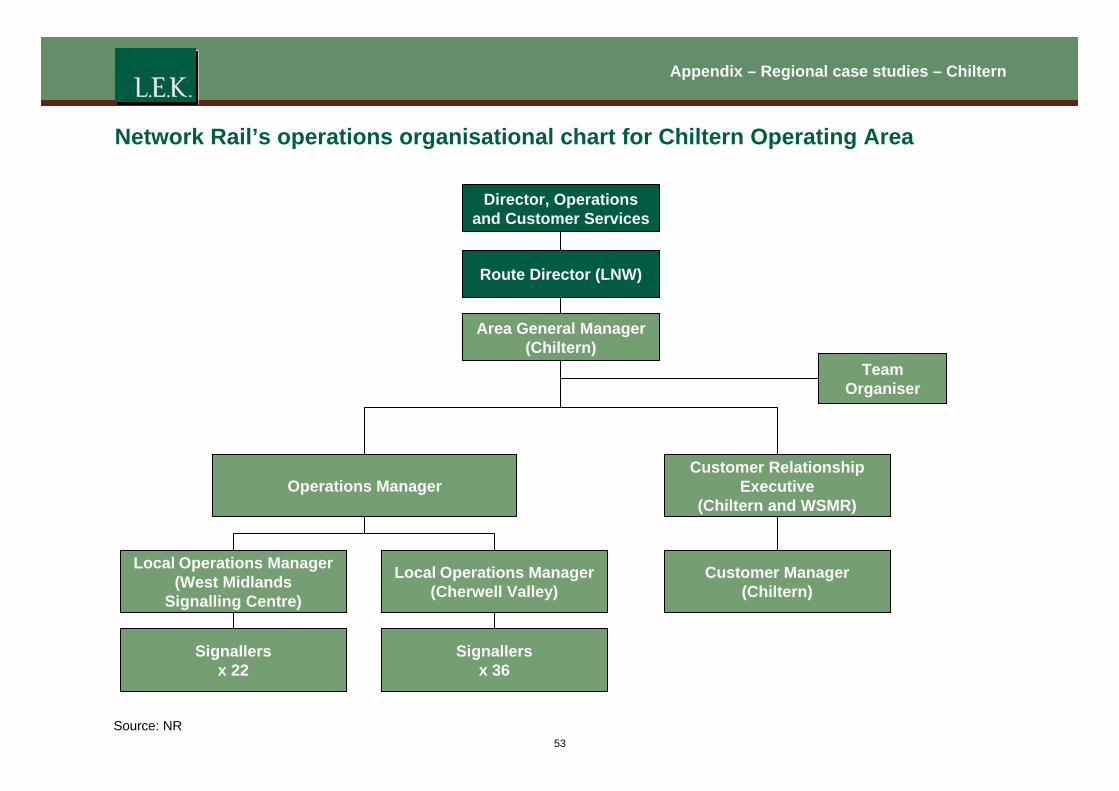
Network Rail’s operations organisational chart for Chiltern Operating Area
Area General Manager (Chiltern)
Local Operations Manager (Cherwell Valley)
Operations Manager
Customer Manager (Chiltern)
Signallers x 36
Customer Relationship Executive
(Chiltern and WSMR)
Team Organiser
Director, Operations and Customer Services
Route Director (LNW)
Local Operations Manager (West Midlands
Signalling Centre)
Signallers x 22
Source: NR 53
Appendix – Regional case studies – Chiltern
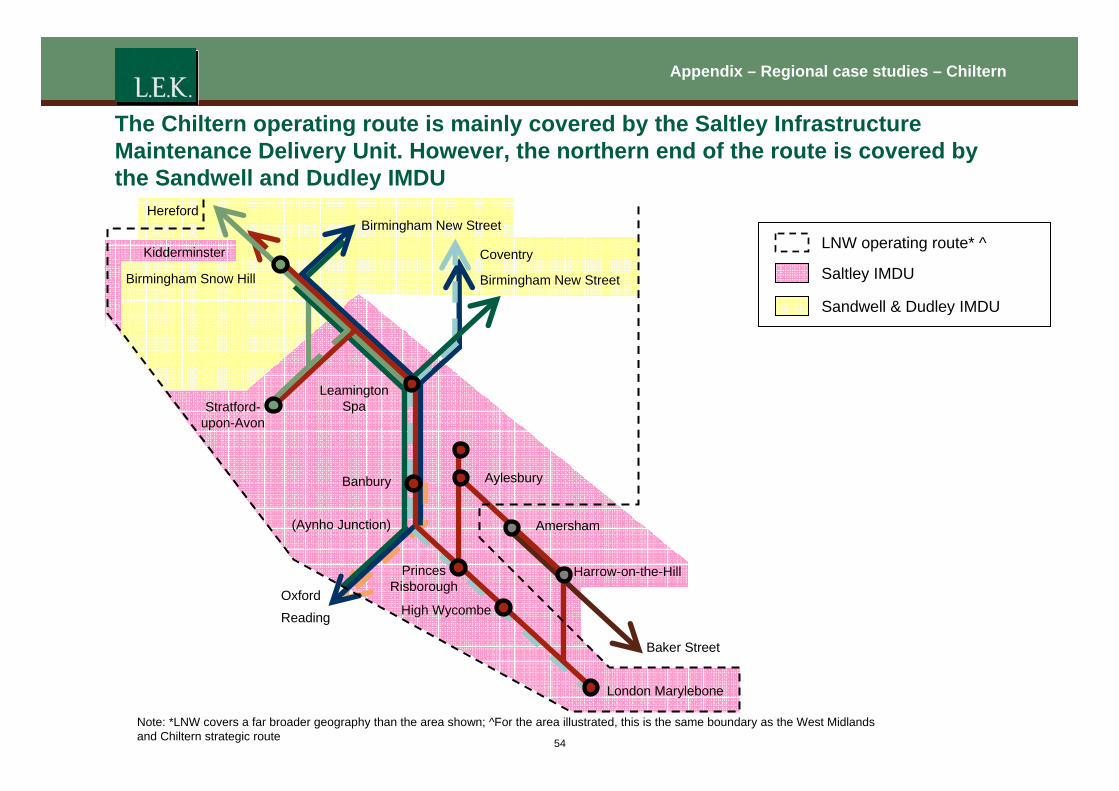
The Chiltern operating route is mainly covered by the Saltley Infrastructure Maintenance Delivery Unit. However, the northern end of the route is covered by the Sandwell and Dudley IMDU
Hereford Birmingham New Street
LNW operating route* ^ Kidderminster Coventry Saltley IMDU Birmingham Snow Hill Birmingham New Street
Sandwell & Dudley IMDU
Leamington
Stratford- Spa
upon-Avon
AylesburyBanbury
(Aynho Junction) Amersham
Princes Harrow-on-the-Hill Risborough
Oxford
High Wycombe Reading
Baker Street
London Marylebone
Note: *LNW covers a far broader geography than the area shown; ^For the area illustrated, this is the same boundary as the West Midlands
and Chiltern strategic route 54
55
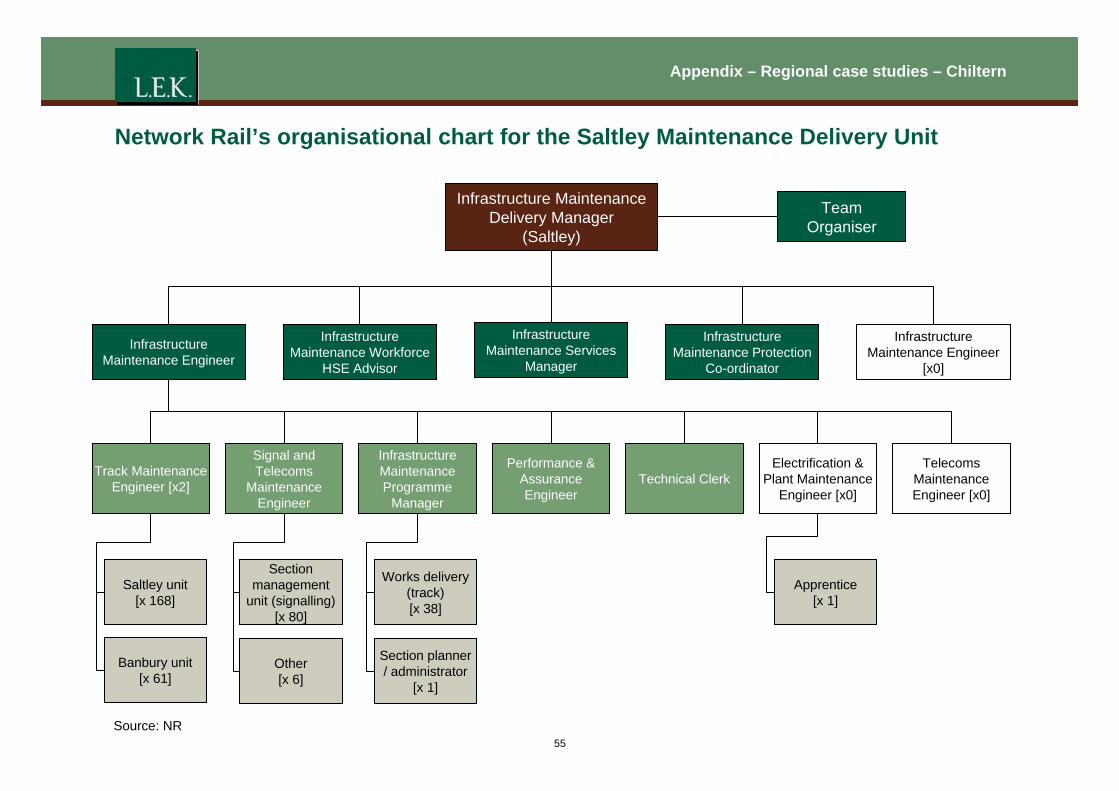
Network Rail’s organisational chart for the Saltley Maintenance Delivery Unit
Appendix – Regional case studies – Chiltern
Source: NR
Team Organiser
Infrastructure Maintenance Delivery Manager
(Saltley)
Infrastructure Maintenance Services
Manager
Infrastructure Maintenance Workforce
HSE Advisor
Infrastructure Maintenance Engineer
Infrastructure Maintenance Protection
Co-ordinator
Infrastructure Maintenance Engineer
[x0]
Track Maintenance Engineer [x2]
Signal and Telecoms
Maintenance Engineer
Electrification & Plant Maintenance
Engineer [x0]
Telecoms Maintenance Engineer [x0]
Performance & Assurance Engineer
Technical Clerk
Infrastructure Maintenance Programme
Manager
Saltley unit [x 168]
Banbury unit [x 61]
Section management
unit (signalling) [x 80]
Other [x 6]
Apprentice [x 1]
Works delivery (track) [x 38]
Section planner / administrator
[x 1]
Appendix – Regional case studies – Chiltern
Views from the Chiltern workshop
z Agreement that Chiltern is overwhelmingly dominant south of Aynho Junction – although there are some open access services and some limited freight movements. This is not typical for the network as a whole
z The section south of Ayhno Junction is a small area so there may be diseconomies of scale. It is significantly smaller thanthe Saltley IMDM area
z Incident recovery (MOMS) is shared with south end of the West Coast Main Line
z Chiltern Railways are very keen to evaluate initial horizontal separation, then a vertical alliance JV for the route south of Aynho Junction. Chiltern argued a number of benefits:
- Elimination of man marking
- Improved incident recovery , for example, training TOC station staff to wind and clip points, so reducing delays
- Better alignment of revenue and infrastructure spend
- Improved possessions strategy
- Faster, more focussed project development
- Scope for local innovation
z The workshop did not support horizontal separation or vertical integration for the Aynho Junction – Birmingham section
- A multi-user route
- Important for freight: a key part of the Southampton – Midlands/North intermodal corridor
- Would create new interfaces and significantly complicate management for network operators (Cross Country and freight)
56

Agenda
Agenda
z Executive summary
z Introduction
z Horizontal separation
z Vertical integration
z Vertical alignment
z Cost and revenue sharing
z Implementation
z Appendix
- Stakeholder consultation programme and documents reviewed
- Financial baseline and option impact quantification
- Regional case studies – Anglia
– LNE
– Chiltern
– Summary
- Review of existing arrangements
57
Appendix – Regional case studies – Summary
Conclusions from the case studies
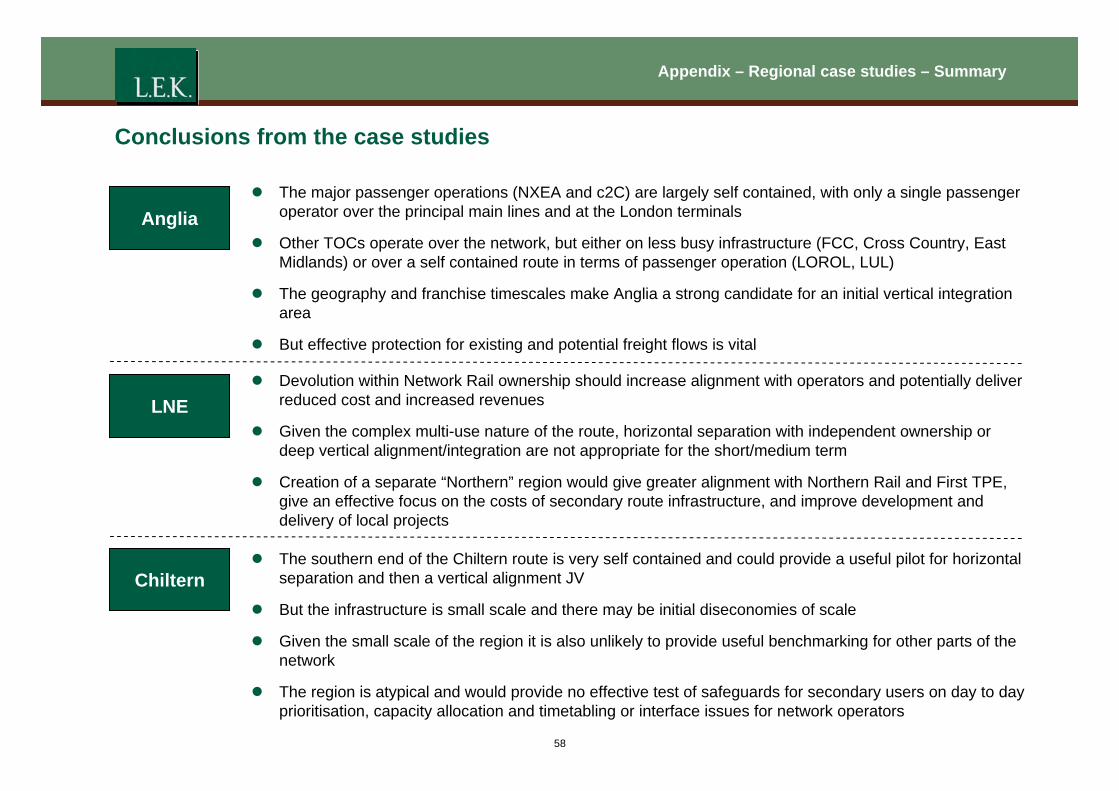
Anglia z The major passenger operations (NXEA and c2C) are largely self contained, with only a single passenger
operator over the principal main lines and at the London terminals
z Other TOCs operate over the network, but either on less busy infrastructure (FCC, Cross Country, East Midlands) or over a self contained route in terms of passenger operation (LOROL, LUL)
z The geography and franchise timescales make Anglia a strong candidate for an initial vertical integration area
z But effective protection for existing and potential freight flows is vital
LNE z Devolution within Network Rail ownership should increase alignment with operators and potentially deliver
reduced cost and increased revenues
z Given the complex multi-use nature of the route, horizontal separation with independent ownership or deep vertical alignment/integration are not appropriate for the short/medium term
z Creation of a separate “Northern” region would give greater alignment with Northern Rail and First TPE, give an effective focus on the costs of secondary route infrastructure, and improve development and delivery of local projects
Chiltern z The southern end of the Chiltern route is very self contained and could provide a useful pilot for horizontal
separation and then a vertical alignment JV
z But the infrastructure is small scale and there may be initial diseconomies of scale
z Given the small scale of the region it is also unlikely to provide useful benchmarking for other parts of the network
z The region is atypical and would provide no effective test of safeguards for secondary users on day to day prioritisation, capacity allocation and timetabling or interface issues for network operators
58
Agenda
Agenda
z Executive summary
z Introduction
z Horizontal separation
z Vertical integration
z Vertical alignment
z Cost and revenue sharing
z Implementation
z Appendix
- Stakeholder consultation programme and documents reviewed
- Financial baseline and option impact quantification
- Regional case studies
- Review of existing arrangements
59
Appendix - Review of existing arrangements
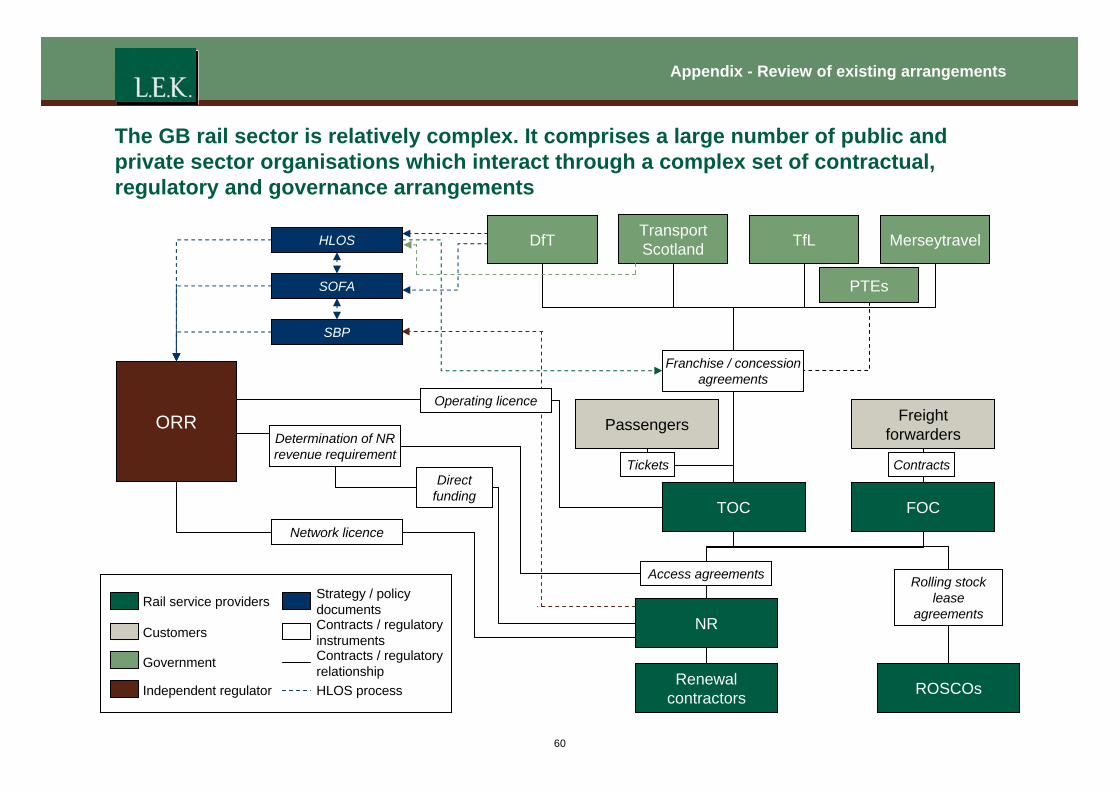
The GB rail sector is relatively complex. It comprises a large number of public and private sector organisations which interact through a complex set of contractual, regulatory and governance arrangements
Merseytravel TfLTransport Scotland
PTEs
NR
FOC
Renewal contractors ROSCOs
Passengers Freight forwarders
ORR
Franchise / concession agreements
Access agreements Rolling stock lease
agreements
Network licence
Direct funding
Determination of NR revenue requirement
Operating licence
SBP
SOFA
HLOS
Rail service providers
Customers
Government
Independent regulator
Strategy / policy documents Contracts / regulatory instruments Contracts / regulatory relationship HLOS process
Contracts Tickets
TOC
DfT
60
Appendix - Review of existing arrangements
This section of L.E.K.’s presentation is not intended to a comprehensive description of
the current GB rail industry arrangement. Instead, it summarises the key features of the
existing arrangements that have greatest bearing on alternative rail industry structures
Organisations and their governance arrangements Cross industry processes
Passenger train operators On the day operations
Freight train operators Capacity allocation and timetabling
Long term planning and enhancements
Network Rail Asset management, access management and delivery of MRE
Stations and depots
Rolling stock selection
61
Appendix - Review of existing arrangements
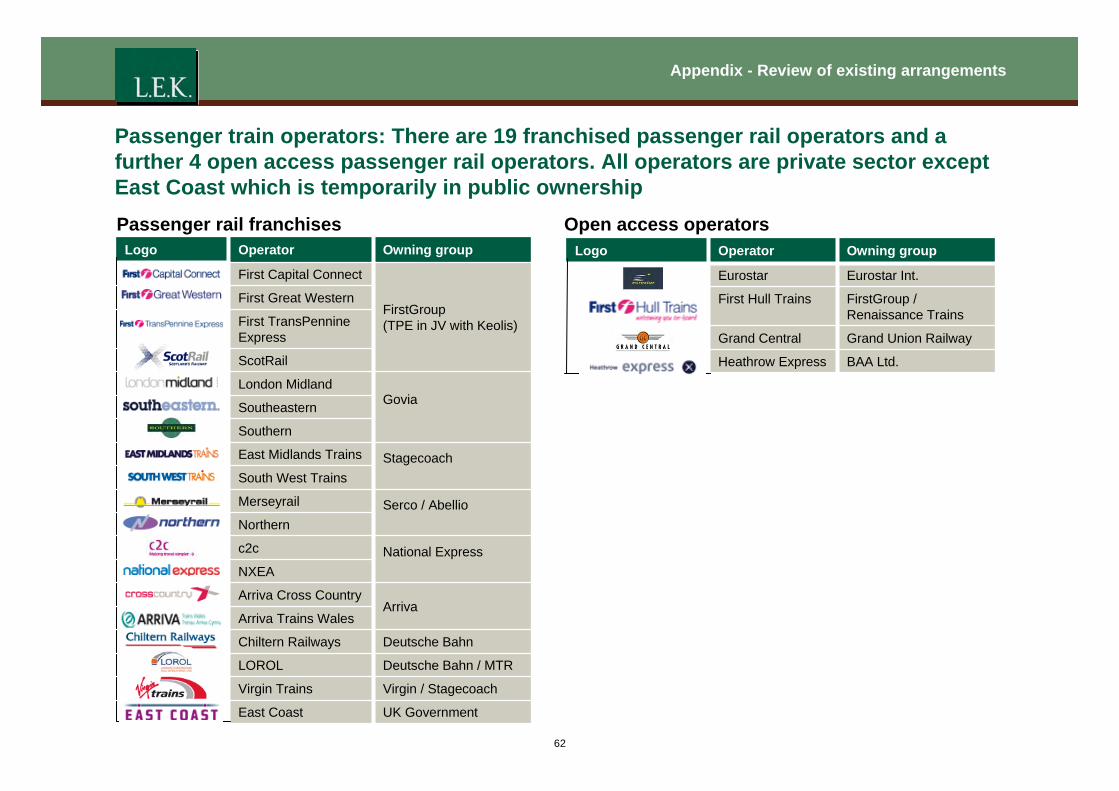
Passenger train operators: There are 19 franchised passenger rail operators and a further 4 open access passenger rail operators. All operators are private sector except East Coast which is temporarily in public ownership Passenger rail franchises Open access operators
Logo Operator Owning group
First Capital Connect
FirstGroup (TPE in JV with Keolis)
First Great Western
First TransPennine Express
ScotRail
London Midland Govia Southeastern
Southern
East Midlands Trains Stagecoach South West Trains
Merseyrail Serco / Abellio Northern
c2c National Express NXEA
Arriva Cross Country Arriva
Arriva Trains Wales
Chiltern Railways Deutsche Bahn
LOROL Deutsche Bahn / MTR
Virgin Trains Virgin / Stagecoach
East Coast UK Government
Logo Operator Owning group
Eurostar Eurostar Int.
First Hull Trains FirstGroup / Renaissance Trains
Grand Central Grand Union Railway
Heathrow Express BAA Ltd.
62
Appendix - Review of existing arrangements
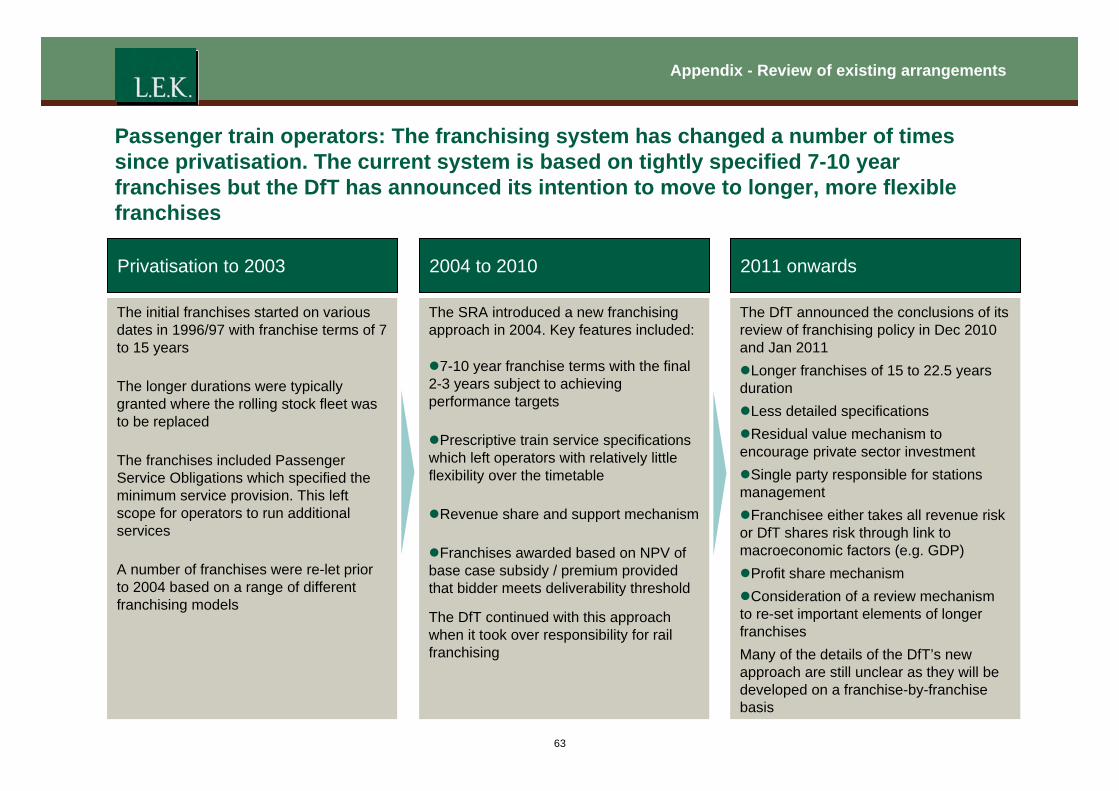
Passenger train operators: The franchising system has changed a number of times since privatisation. The current system is based on tightly specified 7-10 year franchises but the DfT has announced its intention to move to longer, more flexible franchises
Privatisation to 2003 2004 to 2010 2011 onwards
The initial franchises started on various dates in 1996/97 with franchise terms of 7 to 15 years
The longer durations were typically granted where the rolling stock fleet was to be replaced
The franchises included Passenger Service Obligations which specified the minimum service provision. This left scope for operators to run additional services
A number of franchises were re-let prior to 2004 based on a range of different franchising models
The SRA introduced a new franchising approach in 2004. Key features included:
z7-10 year franchise terms with the final 2-3 years subject to achieving performance targets
zPrescriptive train service specifications which left operators with relatively little flexibility over the timetable
zRevenue share and support mechanism
zFranchises awarded based on NPV of base case subsidy / premium provided that bidder meets deliverability threshold
The DfT continued with this approach when it took over responsibility for rail franchising
The DfT announced the conclusions of its review of franchising policy in Dec 2010 and Jan 2011 zLonger franchises of 15 to 22.5 years duration zLess detailed specifications zResidual value mechanism to encourage private sector investment zSingle party responsible for stations management zFranchisee either takes all revenue risk or DfT shares risk through link to macroeconomic factors (e.g. GDP) zProfit share mechanism zConsideration of a review mechanism to re-set important elements of longer franchises Many of the details of the DfT’s new approach are still unclear as they will be developed on a franchise-by-franchise basis
63
Appendix - Review of existing arrangements
Freight train operators are open access users of the network and pay only variable charges
z After a long period of decline, the amount of freight carried by the railway started to grow in the mid-1990s
- several factors have driven this growth, including increasing road congestion and growth in certain sectors such as larger distance movements of imported coal, which rail is particularly well placed to carry
- rail’s quality of service has also improved, driven by competition and investment
z Competition between road and rail has always been strong, and competition within the rail industry between different operators has intensified
- the position is further complicated by the nature of the freight market, where service providers need flexibility to respond to customer demand, which can vary at short notice. This means that NR’s timetable planning must allocate more space for freight than is actually used on a day-to-day basis
- rail is most competitive for high-volume flows over longer distances, and tends to become less attractive as volume and distance decline
z There are currently four major FOCs: DB Schenker, Freightliner, GB Railfreight and Direct Rail Services
z All FOCs are open access users of the network
z FOCs pay variable access charges but not fixed charges
- EU legislation requires access charges to be based on short run marginal cost plus a mark-up value where the market can bear it. In the case of freight, the mark-up only applies to the coal and nuclear markets and is applied to the variable access charge
z FOCs also pay a coal spillage charge, a capacity charge and EC4T
z FOCs receive flow specific freight grants from the Government (£21m in 2008/09)
Source: DfT, “Delivering a Sustainable Railway”; ORR, Periodic Review 2008; ORR, National Rail Trends 2009-10 Yearbook 64

Appendix - Review of existing arrangements
Network Rail is the owner-operator of the national network
z NR is the monopoly owner and operator of the national rail network, including track, signalling, power, civils and stations
- it was launched in Oct 2002 when it bought out Railtrack which entered administration in Oct 2001 (in large part a consequence of spiralling costs following the Hatfield crash and West Coast Main Line modernisation)
- it took a far more centralised approach than Railtrack in order to regain control over the business
z NR has Company Limited by Guarantee (CLG) status, which means it operates as a private company but profits are reinvested in the network. It does not have any equity and all of its debt is currently guaranteed by government
z NR’s board is accountable to about 100 members. It has two general classes of members: Public Members, who are drawn from the general public, and Industry Members from certain rail industry companies. In addition, the DfT is a member with special rights, such as to appoint a Director of NR (not currently exercised). A majority of the members must be Public Members
z NR’s “members” based governance regime is widely considered to be ineffective “…Members with significant experience and interest in the industry were in close agreement that the current membership structure and
approach is flawed. The views of the remaining members differed both from this view and from one another. The divergence of views between members interviewed seems to stem from a lack of consensus between members about their role. This is not conducive to the exercise of effective governance and suggests that there is a case for further review and potentially, some change to the current arrangements …”
Network Rail: Membership aspects of governance, KPMG, August 2008
“…There’s clearly conflicts of interest in the structure as it is… This is a unique structure and, at the heart of it, accountability, we are being told, is by individual members of Network Rail. We are not sure that is that effective …”
Evidence given to the Committee of Public Accounts for “Increasing Passenger Capacity”, September 2010
z Regulation, monitoring and reporting by ORR is currently the main mechanism through which NR is held to account “…I have made up the accountability deficit with the increased licence conditions, the stronger, streamlined and simplified access contracts and
many other things …” Tom Winsor, Rail Regulator, The Future of the Railway, House of Commons Transport Committee, March 2004
Source: NR; ORR; Gourvish, “Britain's Railways 1997-2005 - Labour’s Strategic Experiment” 65
Appendix - Review of existing arrangements
Network Rail’s required outputs and funding for Control Period 4 were set by the ORR’s 2008 Periodic Review
z The ORR’s 2008 Periodic Review determined, for Control Period 4 (Apr 09 - Mar 14): - the outputs that NR must deliver and its revenue requirements
- the track access charges to be paid by train operators for use of its infrastructure
z This was the first review since the passing of the Railways Act 2005, which introduced the process of the Secretary of State and Scottish Ministers issuing High Level Output Specifications (HLOSs) and Statements of Funds Available (SOFAs). This introduced the need for an understanding of whole industry costs and revenues
z NR’s output obligations include: - top-level output obligations covering safety, train service performance, capacity, network capability, station condition
and network availability
- HLOSs targets for selected performance measures in 2013/14 and major specified enhancement projects
z The ORR carried out extensive work during the PR08 process to assess NR’s efficiency. It concluded that there was a significant efficiency gap between NR and top quartile comparators, but that the range of uncertainty over the size of this gap was significant
“…the efficiency gap given by the various studies lies in a broad range, with a central range of 30% to 50% …” PR08 determination
z The ORR analysed the rate of improvement achieved by companies in other regulated industries and made a high level judgement that “NR should be able to catch up two thirds of the efficiency gap during CP4”
Source: ORR, Periodic Review 2008 66
Appendix - Review of existing arrangements
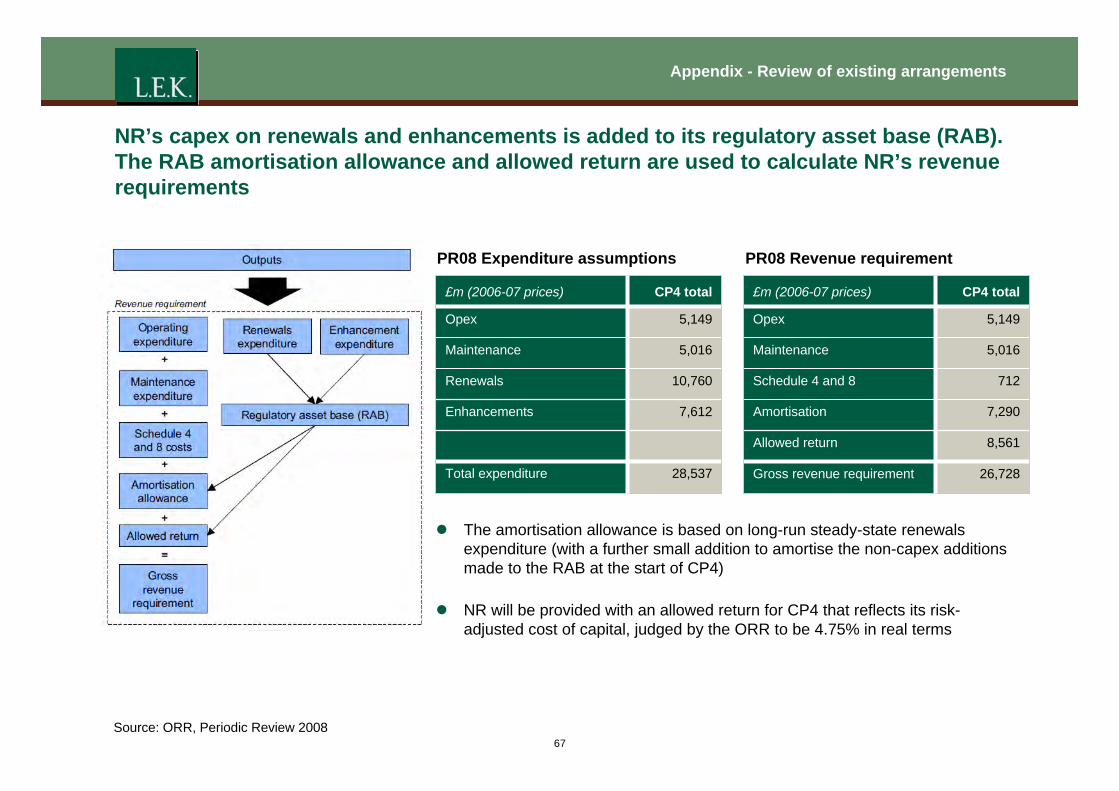
NR’s capex on renewals and enhancements is added to its regulatory asset base (RAB). The RAB amortisation allowance and allowed return are used to calculate NR’s revenue requirements
PR08 Expenditure assumptions PR08 Revenue requirement
£m (2006-07 prices) CP4 total
Opex 5,149
Maintenance 5,016
Renewals 10,760
Enhancements 7,612
Total expenditure 28,537
£m (2006-07 prices) CP4 total
Opex 5,149
Maintenance 5,016
Schedule 4 and 8 712
Amortisation 7,290
Allowed return 8,561
Gross revenue requirement 26,728
z The amortisation allowance is based on long-run steady-state renewals expenditure (with a further small addition to amortise the non-capex additions made to the RAB at the start of CP4)
z NR will be provided with an allowed return for CP4 that reflects its risk-adjusted cost of capital, judged by the ORR to be 4.75% in real terms
Source: ORR, Periodic Review 2008 67
Appendix - Review of existing arrangements
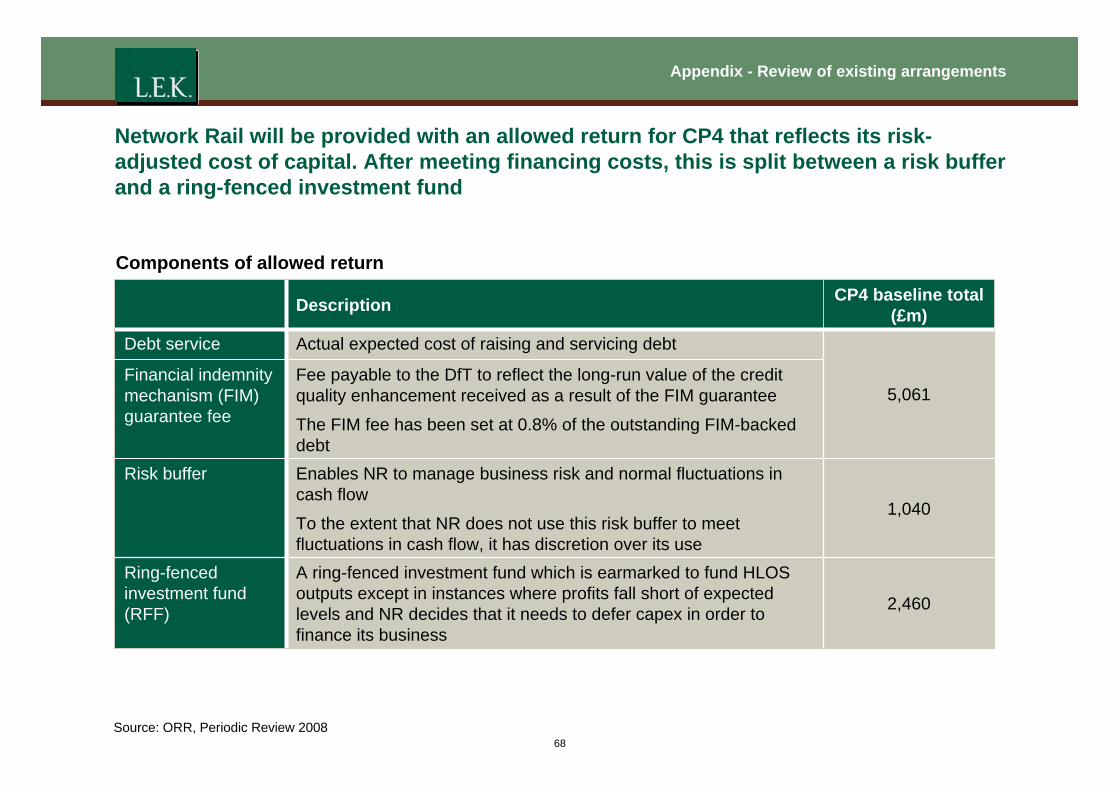
Network Rail will be provided with an allowed return for CP4 that reflects its risk-adjusted cost of capital. After meeting financing costs, this is split between a risk buffer and a ring-fenced investment fund
Components of allowed return
5,061
Actual expected cost of raising and servicing debtDebt service
A ring-fenced investment fund which is earmarked to fund HLOS outputs except in instances where profits fall short of expected levels and NR decides that it needs to defer capex in order to finance its business
Enables NR to manage business risk and normal fluctuations in cash flow
To the extent that NR does not use this risk buffer to meet fluctuations in cash flow, it has discretion over its use
Fee payable to the DfT to reflect the long-run value of the credit quality enhancement received as a result of the FIM guarantee
The FIM fee has been set at 0.8% of the outstanding FIM-backed debt
Description
2,460
Ring-fenced investment fund (RFF)
1,040
Risk buffer
Financial indemnity mechanism (FIM) guarantee fee
CP4 baseline total (£m)
Source: ORR, Periodic Review 2008
68
Appendix - Review of existing arrangements
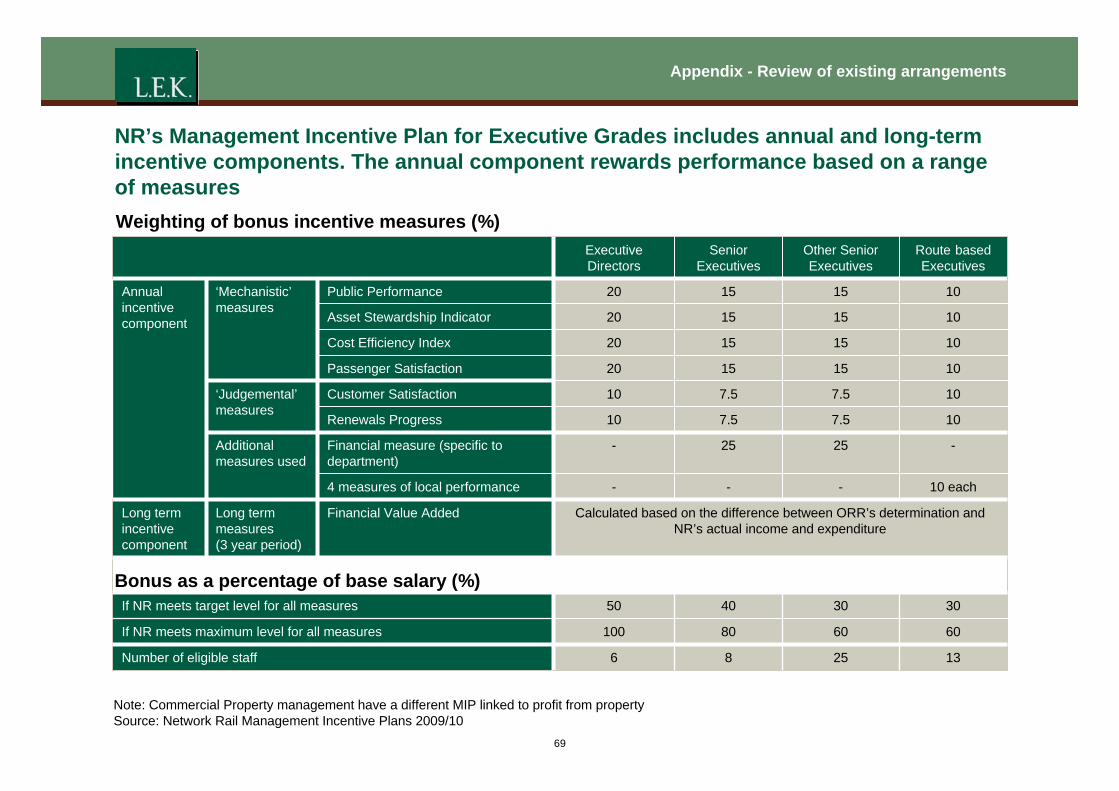
NR’s Management Incentive Plan for Executive Grades includes annual and long-term incentive components. The annual component rewards performance based on a range of measures Weighting of bonus incentive measures (%)
If NR meets target level for all measures
13
60
30
25
60
30
8
80
40
6Number of eligible staff
100
50
If NR meets maximum level for all measures
Long term incentive component
Annual incentive component
Additional measures used
Calculated based on the difference between ORR’s determination and NR’s actual income and expenditure
Financial Value Added
10 each---4 measures of local performance
-2525-Financial measure (specific to department)
Long term measures (3 year period)
‘Judgemental’ measures
‘Mechanistic’ measures
10151520Public Performance
10151520Asset Stewardship Indicator
107.5 7.5 10Renewals Progress
7.5
15
15
Other Senior Executives
107.5 10Customer Satisfaction
101520Passenger Satisfaction
101520Cost Efficiency Index
Route based Executives
Senior Executives
Executive Directors
Bonus as a percentage of base salary (%)
Note: Commercial Property management have a different MIP linked to profit from property Source: Network Rail Management Incentive Plans 2009/10
69
Appendix - Review of existing arrangements
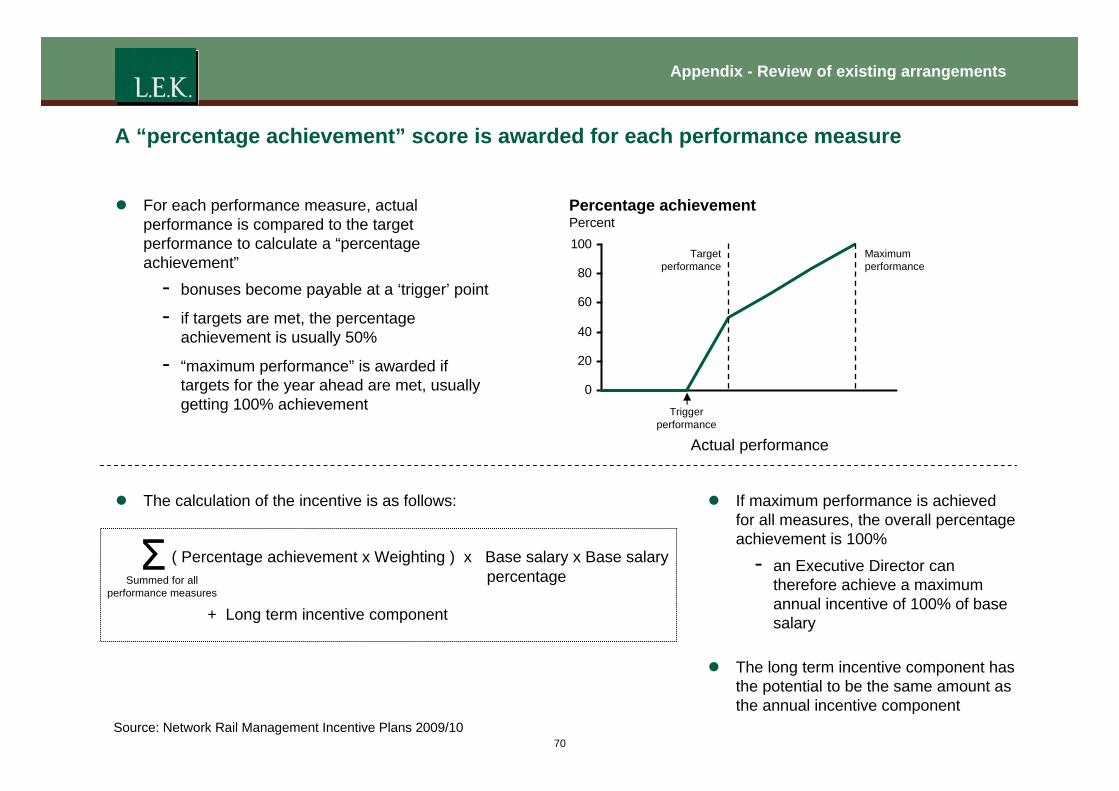
A “percentage achievement” score is awarded for each performance measure
z For each performance measure, actual Percentage achievement performance is compared to the target Percent performance to calculate a “percentage 100
Target Maximum achievement” performance performance 80 - bonuses become payable at a ‘trigger’ point 60 - if targets are met, the percentage
40achievement is usually 50%
- “maximum performance” is awarded if 20
targets for the year ahead are met, usually 0 getting 100% achievement
Actual performance
Trigger performance
( Percentage achievement x Weighting ) x
+ Long term incentive component
Σ
Summed for all performance measures
z The calculation of the incentive is as follows:
Base salary x Base salary percentage
z If maximum performance is achieved for all measures, the overall percentage achievement is 100%
- an Executive Director can therefore achieve a maximum annual incentive of 100% of base salary
z The long term incentive component has the potential to be the same amount as the annual incentive component
Source: Network Rail Management Incentive Plans 2009/10 70
Appendix - Review of existing arrangements
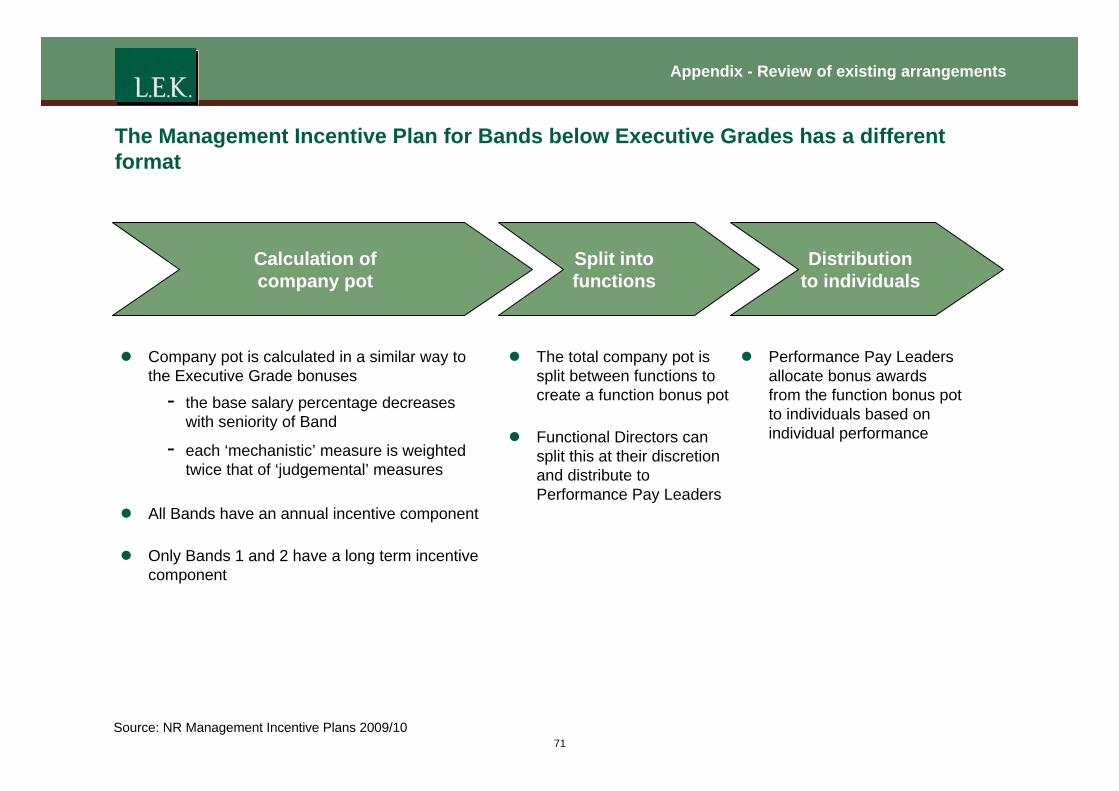
The Management Incentive Plan for Bands below Executive Grades has a different format
Calculation of company pot
Split into functions
Distribution to individuals
z Company pot is calculated in a similar way to the Executive Grade bonuses
- the base salary percentage decreases with seniority of Band
- each ‘mechanistic’ measure is weighted twice that of ‘judgemental’ measures
z
z
The total company pot is split between functions to create a function bonus pot
Functional Directors can split this at their discretion and distribute to
z Performance Pay Leaders allocate bonus awards from the function bonus pot to individuals based on individual performance
z All Bands have an annual incentive component Performance Pay Leaders
z Only Bands 1 and 2 have a long term incentive component
Source: NR Management Incentive Plans 2009/10 71
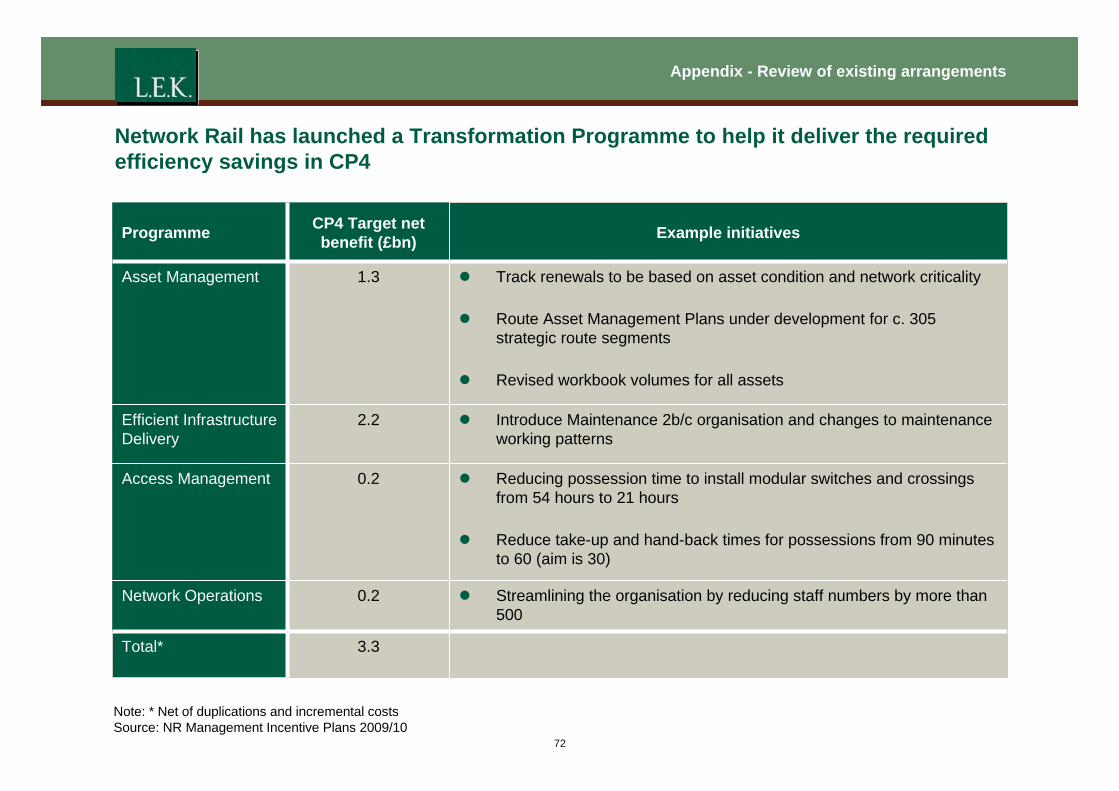
Appendix - Review of existing arrangements
Network Rail has launched a Transformation Programme to help it deliver the required efficiency savings in CP4
3.3Total*
z Streamlining the organisation by reducing staff numbers by more than 500
0.2Network Operations
z Track renewals to be based on asset condition and network criticality
z Route Asset Management Plans under development for c. 305 strategic route segments
z Revised workbook volumes for all assets
1.3Asset Management
z Introduce Maintenance 2b/c organisation and changes to maintenance working patterns
2.2Efficient Infrastructure Delivery
z Reducing possession time to install modular switches and crossings from 54 hours to 21 hours
z Reduce take-up and hand-back times for possessions from 90 minutes to 60 (aim is 30)
0.2Access Management
Example initiatives CP4 Target net benefit (£bn)Programme
Note: * Net of duplications and incremental costs Source: NR Management Incentive Plans 2009/10
72
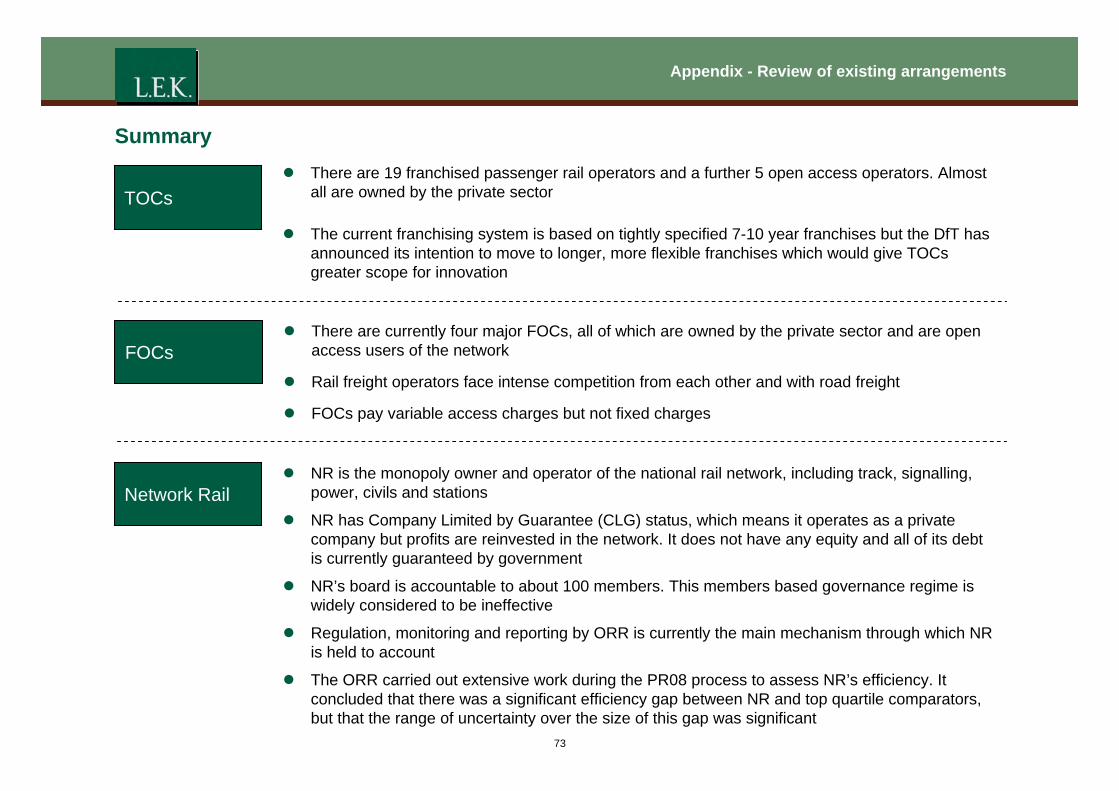
Appendix - Review of existing arrangements
Summary
TOCs z There are 19 franchised passenger rail operators and a further 5 open access operators. Almost
all are owned by the private sector
z The current franchising system is based on tightly specified 7-10 year franchises but the DfT has announced its intention to move to longer, more flexible franchises which would give TOCs greater scope for innovation
FOCs z There are currently four major FOCs, all of which are owned by the private sector and are open
access users of the network
z Rail freight operators face intense competition from each other and with road freight
z FOCs pay variable access charges but not fixed charges
Network Rail z NR is the monopoly owner and operator of the national rail network, including track, signalling,
power, civils and stations
z NR has Company Limited by Guarantee (CLG) status, which means it operates as a private company but profits are reinvested in the network. It does not have any equity and all of its debt is currently guaranteed by government
z NR’s board is accountable to about 100 members. This members based governance regime is widely considered to be ineffective
z Regulation, monitoring and reporting by ORR is currently the main mechanism through which NR is held to account
z The ORR carried out extensive work during the PR08 process to assess NR’s efficiency. It concluded that there was a significant efficiency gap between NR and top quartile comparators, but that the range of uncertainty over the size of this gap was significant
73
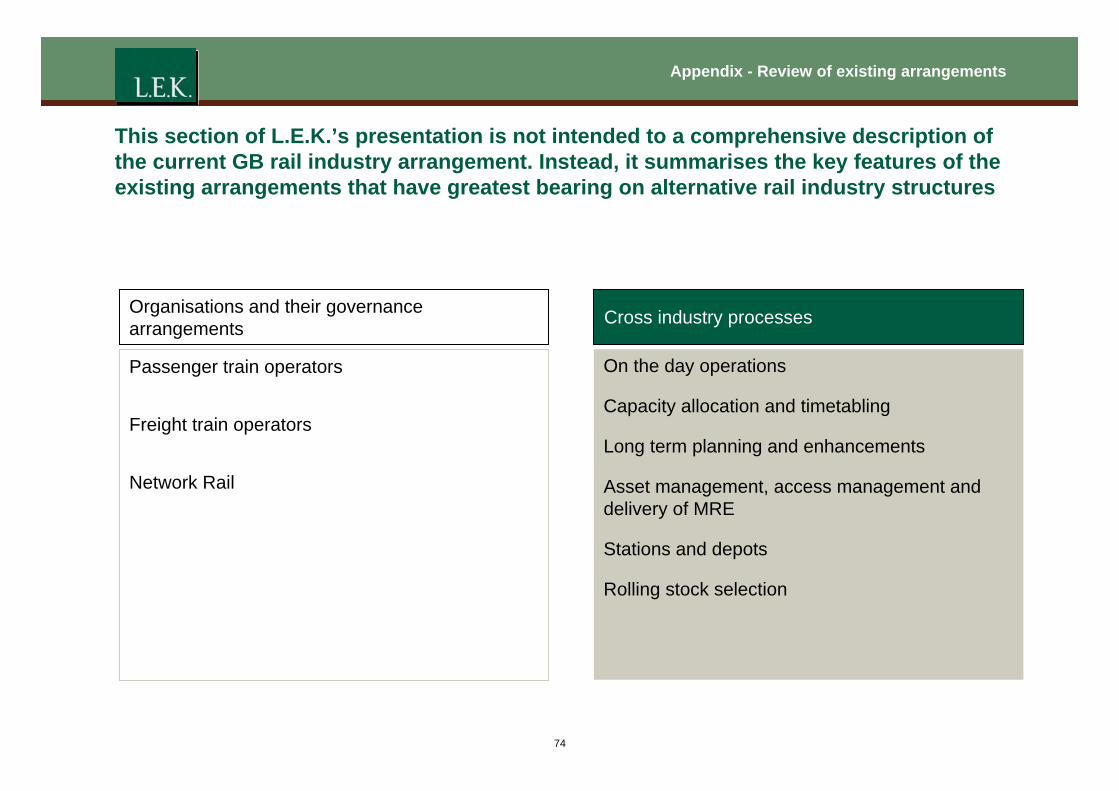
Appendix - Review of existing arrangements
This section of L.E.K.’s presentation is not intended to a comprehensive description of
the current GB rail industry arrangement. Instead, it summarises the key features of the
existing arrangements that have greatest bearing on alternative rail industry structures
Organisations and their governance arrangements Cross industry processes
Passenger train operators
Freight train operators
Network Rail
On the day operations
Capacity allocation and timetabling
Long term planning and enhancements
Asset management, access management and delivery of MRE
Stations and depots
Rolling stock selection
74
Appendix - Review of existing arrangements
On-the-day operations (1 of 2): Responsibilities are shared between TOCs and NR. There are several different mechanisms through which both parties are incentivised to improve operational performance
z On-the-day operations include:
- running trains - signalling and control - responding to incidents as they occur
z In the current setup:
- NR is responsible for signalling and overall control. Operators also have controllers, who communicate with NR controllers, who in turn communicate with signallers
- NR respond to infrastructure-related incidents and operators respond to rolling stock related incidents
z TOCs and NR have a variety of incentives to run on-the-day operations efficiently:
- TOCs are incentivised by increased passenger revenues that follow from improved performance - NR is required to deliver improvements in PPM* and cancellations, set out in the HLOS - the ORR also sets a target maximum number of delay minutes that should be attributable to NR - NR and TOCs are incentivised by Schedule 8, under which they have to pay each other for delay minutes
for which they are responsible. They also specify targets in JPIPs** - PPM statistics are published every period in the form of a TOC league table. This leads to competition
between TOCs to move up the rankings - there is also significant political pressure applied to both TOCs and NR to improve performance
Notes: * Public Performance Measure, the proportion of trains less than 5/10 minutes late; ** Joint Performance Improvement Plan 75
Appendix - Review of existing arrangements
On-the-day operations (2 of 2): Operational performance is one of the industry success stories over the last few years. However, stakeholders raised concerns about the design of Schedule 8 z Operational performance is one of the industry success stories over the last few years. Overall performance has
reached record levels, although significant variations in performance do still occur across the network. The existing incentives have generally been successful in driving improvements
z The main complaint from stakeholders is regarding the design of Schedule 8 - delay minute attribution process absorbs too much resource and drives counterproductive behaviours –
although the importance of data collection for root cause analysis purposes was recognised “…There is a lot of unproductive time spent allocating blame …”
“…It is cheaper to shift delay minutes to someone else than to find out the root cause …”
- Schedule 8 payments do not accurately reflect revenue impacts. In particular, the varying value of a delay minute or the knock on impact of delays to other TOCs
“…Schedule 8 never compensates us for all our losses …”
- a revenue based system might be preferable, but it would need to take some account of responsibility for delays
z TOCs and NR have agreed to override Schedule 8 in some regions in order to reduce the level of resources spent on unproductive fault attribution activities
z Some TOCs do not think that NR is properly incentivised to minimise train cancellations “… TOCs can lose their franchise on cancellations, but NR has no direct incentive on cancellations …”
z There is also an issue with train prioritisation for signallers. Nearly all trains are given the same Class 1 prioritisation which makes it difficult to prioritise trains when responding to incidents. Prioritisation often depends on the relationship between TOCs and NR
Source: L.E.K. stakeholder workshops 76
Appendix - Review of existing arrangements
Capacity and timetabling (1 of 2): NR has overall responsibility for capacity allocation and timetabling, but there are well established industry processes whereby train operators input into the timetabling process
z NR has overall responsibility for capacity allocation and timetabling, but there are well established industry processes whereby train operators input into this process
z TOCs have service level commitments (SLC) which specify in detail the minimum number and type of services that they are required to operate. The precise level of detail of the SLC varies between franchises but will often include: frequencies, journey times, minimum stops, and first and last trains
z TOCs are incentivised to maximise revenue from the services specified in their SLC so will communicate its preferences to NR. TOCs may also wish to operate additional services which are not specified in the SLC if it thinks that these are commercially viable
z FOCs need flexibility to respond to customer demand, which can vary at short notice. As a result, they need more train paths in the timetable than they will actually use on a day-to-day basis
z NR has to try to reconcile any conflicting train operator requirements. NR’s first responsibility is to ensure that it provides train paths to each operator that are in accordance with the firm rights specified in their Track Access Agreements
z In practice, the annual timetable development process is an incremental process whereby the previous year’s timetable is used as a starting point and incremental changes are made. It is very rare for major timetable recasts to take place. Major timetable changes are very difficult to implement in certain parts of the network (e.g. Birmingham) due to the number of constraints
z The Track Access Agreements do not provide any incentive on NR to accommodate requests for additional train paths. The incremental access charges that NR receives are only intended to recover NR’s efficiently incurred short run marginal costs. Furthermore, additional services would make it more difficult for NR to achieve its operational performance targets
z As a result, ORR included a Volume Incentive in PR08 to provide an incentive on NR to accommodate additional train services
77
Appendix - Review of existing arrangements
Capacity and timetabling (2 of 2): NR is generally considered to be not properly incentivised to maximise industry revenue by optimising the timetable
z Stakeholders have commented that the Volume Incentive is opaque and does not really have an impact on NR’s behaviour. Furthermore, the level of payment (even if reached) is too small to adequately incentivise the company. As such, NR is generally considered to be not properly incentivised to accommodate additional train services beyond the level required by HLOS
z Some stakeholders think that NR is not sufficiently flexible in its approach to timetable development. In particular, it does not make full use of the flexibility contained in Track Access Agreements to adjust the timing of established services in order to optimise across the network as a whole. This is a particular issue for multi-user routes
z Some stakeholders do not think that NR should be responsible for timetabling due to its lack of commercial incentives to grow industry revenue
z The timetabling process is also thought to be hampered by political interventions and prescriptive SLCs
- there is a tension between the DfT and ORR regarding the allocation of train paths to open access operators
- it has taken 10 years to develop the new Eureka timetable for the East Coast Mainline
78
Appendix - Review of existing arrangements
Planning and enhancements (1 of 2): Network Rail and the DfT take the leading roles with planning and enhancements
z NR is responsible for developing Route Utilisation Strategies (RUSs). These are medium-to-long term strategies for each route. They tend to focus mainly on identifying capacity bottlenecks and options for addressing these
z The DfT uses the RUSs to inform its High Level Output Statement (HLOS) of the outputs that it is seeking to procure from the rail industry during each control period. HLOS is accompanied by a Statement of Funds Available (SoFA) and a high level 30 year strategy
z CP4 HLOS enhancement schemes are being delivered through two main routes
- the ORR’s PR08 determination included an allowance for fixed infrastructure related schemes and these are being delivered by NR
- the DfT is negotiating changes to franchise agreements to implement timetable and rolling stock capacity related schemes
z NR, the DfT and other stakeholders also specify a few major enhancement schemes which are outside the HLOS process (e.g. Reading station)
z The ORR / NR have developed an Investment Framework to facilitate investments by other parties
z Enhancements can be initiated by TOCs but this is relatively unusual under the DfT’s current franchising system due to the prescriptive specifications, the relatively short franchise terms and the franchise award criteria. One of the key objectives of the DfT’s radical franchise reform proposals is to encourage more TOC led investment
z In many cases rail enhancements are not commercially viable in terms of their financial return, but government may be willing to fund them due to their broader economic benefits
“… One reason that the railway is so expensive is that there are lots of projects with no commercial benefit …”
z However, there are exceptions to this. Chiltern Railways’ Evergreen 3 enhancement is proceeding on a purely commercial basis. It should be noted that Chiltern Railways operates under a very different form of franchise agreement to the DfT’s current system
79
Appendix - Review of existing arrangements
Planning and enhancements (2 of 2): There are a number of issues with how enhancements are planned and delivered
z Some stakeholders think that giving NR responsibility for developing RUSs leads to them favouring infrastructure solutions over other forms of solution
z Train operator involvement in developing the CP4 HLOS schemes was relatively limited. It mainly happened indirectly through their input to NR’s RUSs. ATOC has initiated a process (“planning ahead”) to increase TOC involvement for CP5
z Some HLOS enhancement packages have been undermined by DfT only procuring part of the package. For example, platform lengthening has gone ahead without procuring the rolling stock that would use the enhancement
“… Network Rail have millions to spend on platform lengthening, but we have no vehicles yet …”
z There have also been instances of the DfT delaying schemes by changing its mind
“… The government decides what it wants to buy. Then we go through the process of writing the Strategic Business Plans. Then the government changes its mind. This stop start planning process doesn’t allow any smoothing of the supplier base …”
z One of the key issues with enhancements is that the industry sees enhancements as a free good. Neither NR nor TOCs normally have an incentive to value engineer schemes to ensure that they deliver the required capabilities and other outputs at the lowest cost. although NR enhancements are subject to ORR efficiency, which is established on a scheme by scheme basis. Delivery of value for money in terms of scope is largely dependent on ORR oversight
- NR is happy for the efficient cost of enhancements to be added to its RAB, as it receives an allowed return on its RAB, as long as the long term financeability of the company is not impaired
- TOCs are generally held harmless to changes in FTAC so do not end up paying for RAB funded enhancements (this does not apply for TOC self financing schemes where the TOC payments are ring fenced outside the periodic reviews for enhancements)
z Although NR is incentivised to deliver enhancements below budget many TOC stakeholders think that TOCs could deliver schemes much more efficiently (particularly for stations and depots)
80
Appendix - Review of existing arrangements
Network Rail is responsible for asset management, access management and delivery of MRE (1 of 2)
z Network Rail is responsible for:
- Asset management: Deciding what MRE work needs to be done, where and when
- Access management: Taking possession of sections of the network in order to carry out engineering works
- Deliver: Managing delivery of the work. Maintenance is carried out in-house, whereas renewals and enhancements are mainly contracted out
z Efficiency in asset management and MRE delivery are incentivised through the ORR’s periodic review process and the resulting price determination. NR also has a licence obligation to manage assets sustainably
- the ORR’s PR08 assessment was that NR was relatively inefficient at both asset management and deliver of MRE. NR recognises this and has made Asset Management and Efficient Infrastructure Delivery two of the key workstreams of its CP4 Transformation Programme
z A number of mechanisms are in place to incentivise the efficient planning and use of engineering possessions
- the ORR introduced new targets for NR in PR08 – these are called possessions disruption indices (PDI)
- NR pays financial compensation to train operators for taking disruptive possessions via the Schedule 4 and Network Change mechanisms
- PR08 also introduced the concept of Joint Network Availability Plans (JNAPs) which are intended to build on the success of JPIPs
81
Appendix - Review of existing arrangements
Network Rail is responsible for asset management, access management and delivery of MRE (2 of 2)
z Although the possessions planning process involves a number of TOC consultation stages, TOC stakeholders at L.E.K.’s workshops reported that they felt as though the consultation mainly involved TOCs being informed of what NR had decided
z NR should in theory be able to optimise possessions from a whole system perspective based on Schedule 4 payment rates. However, many TOCs reported that these rates did not accurately reflect the impact on their business, particularly for a lengthy series of possessions
- one of issues is that ORR adjusted the Schedule 4 payment rates in PR08 but the DfT has clawed back the change from TOCs through the Clause 18.1 change mechanism
“… 18.1 means that we pay everything back to the government, which isn’t doing the industry any good …”
z TOCs that have prepared JNAP are relatively positive about them. JNAPs have given them the opportunity to explain to NR the true revenue impact of different types of possessions in different areas – for example through a ranking of their routes by revenue
“…our JNAP has driven improvement between Didcot and Oxford. It has helped engineers to understand what the customer wants …”
z However, it was clear from our workshops that very few TOC managers were even aware of the existence of the JNAP concept – a full 20 months after it was introduced
“… what is a JNAP? …” Two TOC MDs, in separate workshops
z The high profile announcement by government of a 7-day railway was considered to be unhelpful as it reduces flexibility. There are some situations where TOCs highly value a 7-day railway but there are other times when they would prioritise other objectives
“… A good infrastructure is in everyone’s interest. A seven day railway is fine in principal but is not currently in our interest: Sunday can be used for works! …”
82
Appendix - Review of existing arrangements
Stations and depots (1 of 2): Network Rail manages some stations, but most are leased from Network Rail and managed by an operator
z NR manages some stations, but most are leased from NR and managed by an operator, referred to as the Station Facility Owner (SFO)
- NR is responsible for major maintenance work
- light maintenance and repairs are carried out by the SFO
z NR leases depots to Depot Facility Owners (DFOs)
- NR is typically responsible for renewals
- the DFO is responsible for repair and maintenance, and occasionally also for renewals
z SFOs are primarily incentivised by commercial considerations
- SFOs are incentivised by retail revenues
- some operators are incentivised through their franchise agreements, for example
– NPS targets form part of Southern’s franchise agreement
– the Service Quality Incentive Regime (SQUIRE) is part of ScotRail’s franchise agreement
83

Appendix - Review of existing arrangements
Stations and depots (2 of 2): There is widespread dissatisfaction with the current split of responsibilities at stations and depots
z Stakeholders at L.E.K.’s workshops were unanimous in declaring that the current contractual arrangements for stations and depots are far more complicated than they need to be. Moving to normal full repairing leases would greatly simplify the arrangements and address many of the current issues
“… How on earth did they come up with the current arrangements? You couldn’t invent a more complex system …”
z However, concern was raised over how stations would be funded under the new regime. For example, TOCs might be incentivised to “patch and mend” when renewal might be the better whole life solution
“… You have to be aware that we cannot afford big lumpy expenditure such as a new roof for Marylebone. We would just tape the roof. However, most other things you could do …”
z Stakeholders also reported that depots were largely overlooked during PR08 and are in need of significant investment
“… ORR didn’t give Network Rail any money to enhance depots. There is no incentive for a TOC to invest in depots because then they have to pay a higher lease charge, even if they used their own money to invest …”
“… Depots aren’t viewed as something which contributes to delivering outputs …”
84
Appendix - Review of existing arrangements
Rolling stock selection (1 of 2): TOCs procure new vehicles, but the rolling stock to be used is sometimes specified by DfT in franchise agreements
Note: This slide focuses solely on rolling stock issues relating to the interface between train operators and NR
z TOCs used to be responsible for deciding what rolling stock to use on their franchise and procuring new build vehicles if that is their preferred strategy
z However, the DfT has become increasingly involved with rolling stock selection and procurement over recent years. This has occurred through a number of mechanisms:
- specification of required fleet in the franchise bid ITT. This could either be directly, or more typically, indirectly through the required characteristics of the fleet
- direct procurement of rolling stock. Examples include the Southeastern Javelins and IEP
- management of rolling stock cascades. For example, to facilitate HLOS capacity enhancements
z Train operators pay Variable Track Access Charges (VTAC) to NR for operating rolling stock on its infrastructure. These charges are intended to compensate NR for the short run marginal cost of the wear and tear to its infrastructure
z Rolling stock selection also impact NR through the timetabling process because the acceleration and speed characteristics of rolling stock varies significantly
85
Appendix - Review of existing arrangements
Rolling stock selection (2 of 2): Current arrangements appear to work fairly well from a train operators – NR alignment perspective
Note: This slide focuses solely on rolling stock issues relating to the interface between train operators and NR
z Train operators have to take a wide range of factors into account when selecting or procuring rolling stock. The relative importance of VTAC charges to the decision making process varies significantly depending on the type of service being operated. In some cases VTAC is immaterial, whereas in other cases it is one of the key factors
z However, VTAC rates are generally considered to be cost reflective. As such, train operators have an appropriate incentive to select rolling stock which is less damaging to NR’s infrastructure
“… VTAC is probably the right mechanism to incentivise efficient rolling stock procurement …”
- but it can take a number of years for the damage characteristics of new rolling stock designs to be fully understood
“… Having a price list like at present is probably the right approach, although there are a few “funnies” in there …”
z There have been a few situations where commercially attractive opportunities to improve the track-friendliness of trains have been identified but industry contractual arrangements have acted as a barrier to implementation. One of the key barriers is the risk to TOCs of the DfT clawing back any VTAC savings through Clause 18.1
- the South West Trains Desiro fleet is a well documented example of this (although this situation has now been resolved)
86