Embed Size (px)
Citation preview

Rail Transit Impacts on Trip Making and Rail Transit Impacts on Trip Making and Land Development in Shanghai, ChinaLand Development in Shanghai, China
This study is jointly supported by This study is jointly supported by Natural Science Foundation of China (NSFC)Natural Science Foundation of China (NSFC)
the Lincoln Institute of Land Policy (Cambridge, MA) and the Lincoln Institute of Land Policy (Cambridge, MA) and the University of Texas at Austinthe University of Texas at Austin
Prepared byPrepared byHaixiao Pan, Ph.D.Haixiao Pan, Ph.D.
Professor, Department of urban PlanningProfessor, Department of urban PlanningTongji University, Shanghai, ChinaTongji University, Shanghai, China
E-mail: E-mail: [email protected]@online.sh.cn
Ming Zhang, Ph.D.Ming Zhang, Ph.D.Assistant Professor, Community & Regional PlanningAssistant Professor, Community & Regional PlanningThe University of Texas at Austin, Austin, TX 78712The University of Texas at Austin, Austin, TX 78712
E-mail: E-mail: [email protected]@mail.utexas.edu

The past ten years witnessed a major boom in rail The past ten years witnessed a major boom in rail transit development in China.transit development in China.
1.0 Introduction1.0 Introduction

· · Intention for the metro:Intention for the metro:
1 improve mobility1 improve mobility
2 spatial structuring against sprawl2 spatial structuring against sprawl
·· Purpose of the study: Purpose of the study:
1 How has the introduction of Shanghai’s 1 How has the introduction of Shanghai’s metro rail influenced trip making? metro rail influenced trip making?
2 Does the development of the metro 2 Does the development of the metro system affect land use around transit system affect land use around transit stations? stations?
1.0 Introduction1.0 Introduction
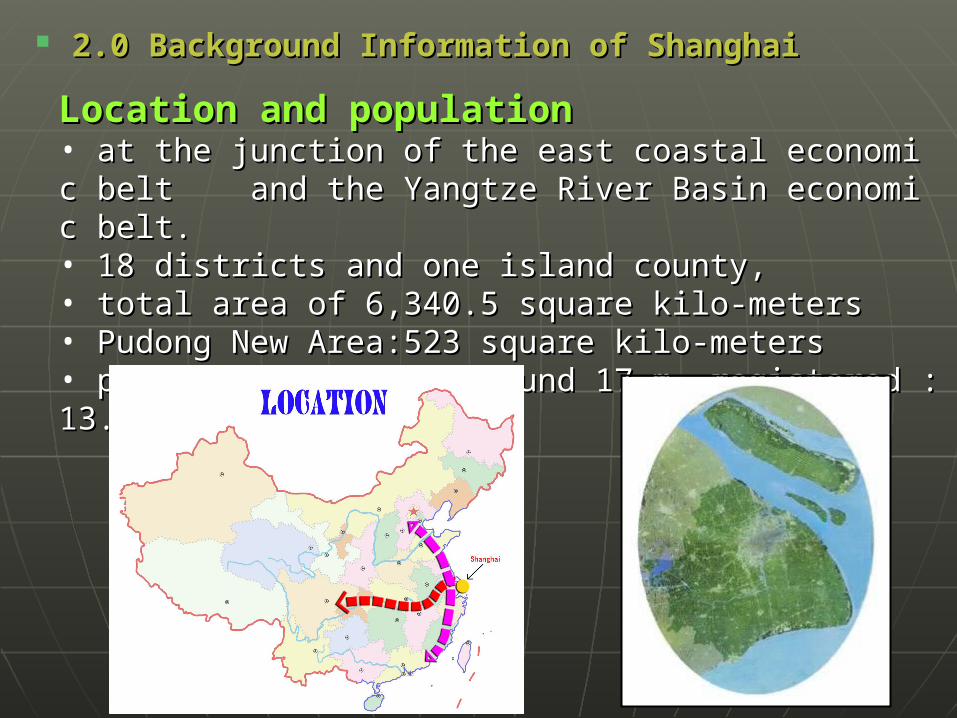
2.0 Background Information of Shanghai2.0 Background Information of Shanghai
Location and populationLocation and population• at the junction of the east coastal economic belt at the junction of the east coastal economic belt and thand the Yangtze River Basin economic belt. e Yangtze River Basin economic belt. • 18 districts and one island county,18 districts and one island county,• total area of 6,340.5 square kilo-meters total area of 6,340.5 square kilo-meters • Pudong New Area:523 square kilo-meters Pudong New Area:523 square kilo-meters • population total : around 17 m. registered :13.44m. population total : around 17 m. registered :13.44m.
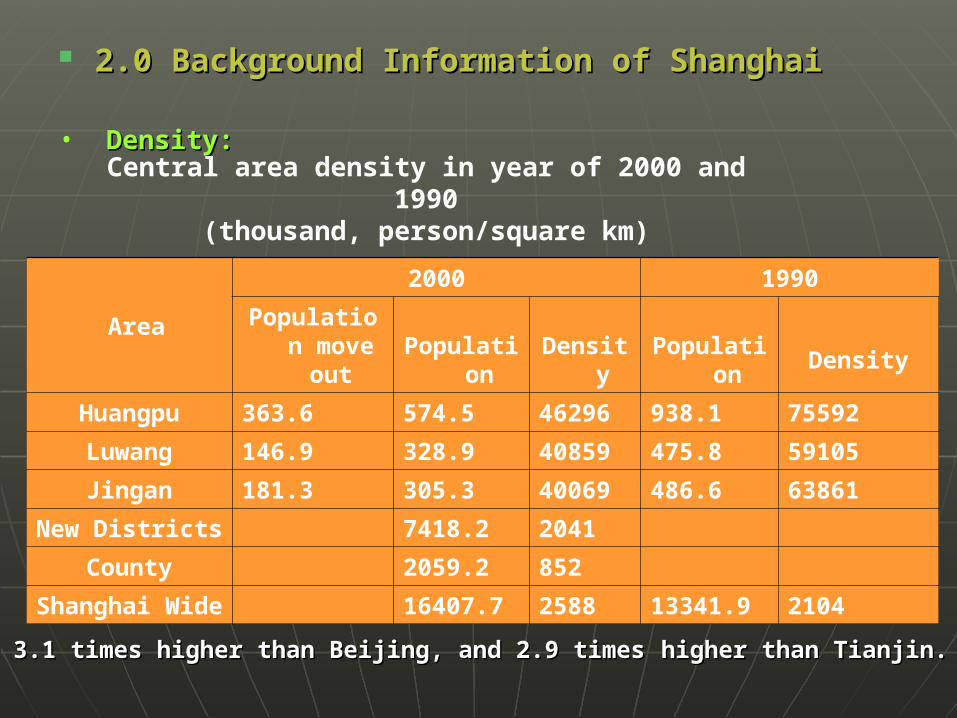
• Density:Density:
Central area density in year of 2000 and 1990(thousand, person/square km)
Area
2000 1990
Population move out Population Density Population Density
Huangpu 363.6 574.5 46296 938.1 75592
Luwang 146.9 328.9 40859 475.8 59105
Jingan 181.3 305.3 40069 486.6 63861
New Districts 7418.2 2041
County 2059.2 852
Shanghai Wide 16407.7 2588 13341.9 2104
3.1 times higher than Beijing, and 2.9 times3.1 times higher than Beijing, and 2.9 times higher than Tianjin.higher than Tianjin.
2.0 Background Information of Shanghai2.0 Background Information of Shanghai
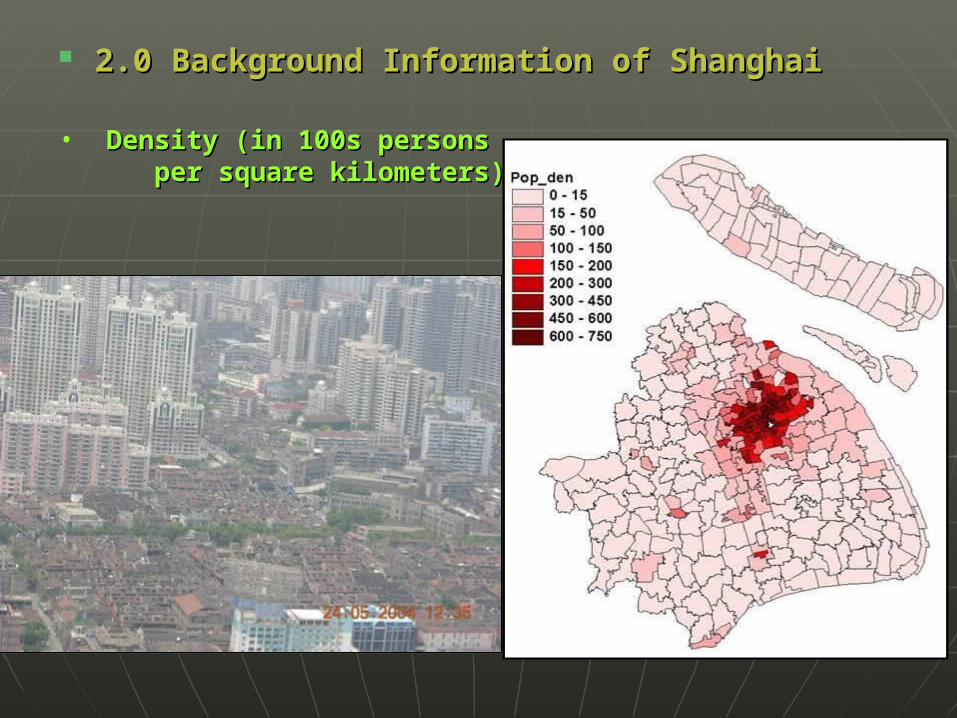
• Density (in 100s personsDensity (in 100s personsper square kilometers):per square kilometers):
2.0 Background Information of Shanghai2.0 Background Information of Shanghai

0
200
400
600
800
1000
1200
1 2 3 4 5 6 7 8 9 10 11 12 13 14
Di stance(km)
pers
on/h
a
Shanghai - 1994
Shanghai - 2000
Par i s
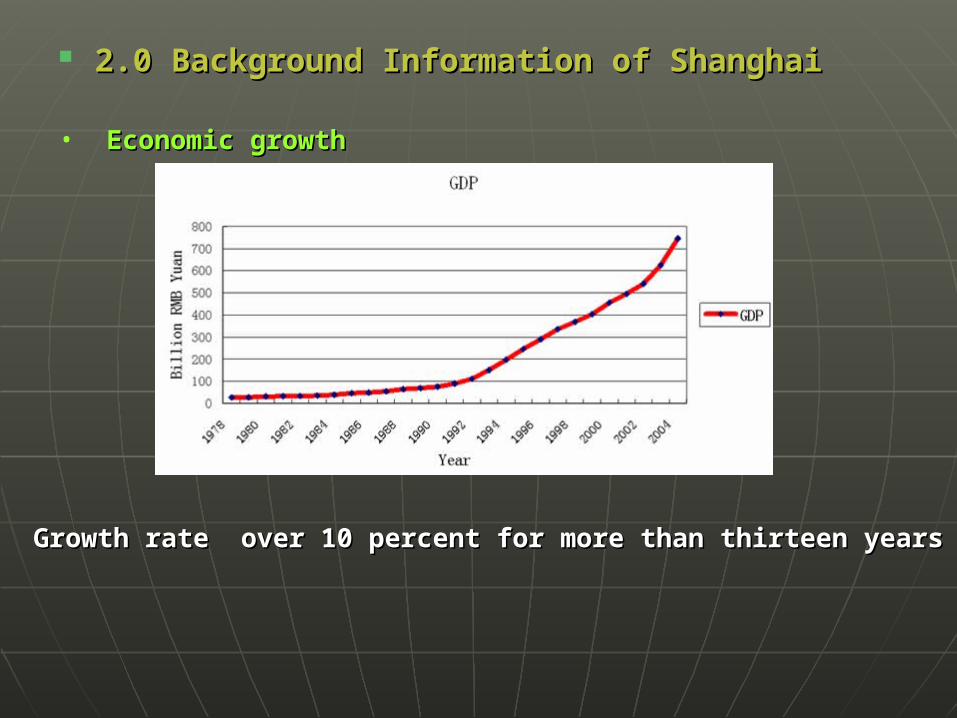
• Economic growthEconomic growth
Growth rate over 10 percent for more than thirteen yearsGrowth rate over 10 percent for more than thirteen years
2.0 Background Information of Shanghai2.0 Background Information of Shanghai
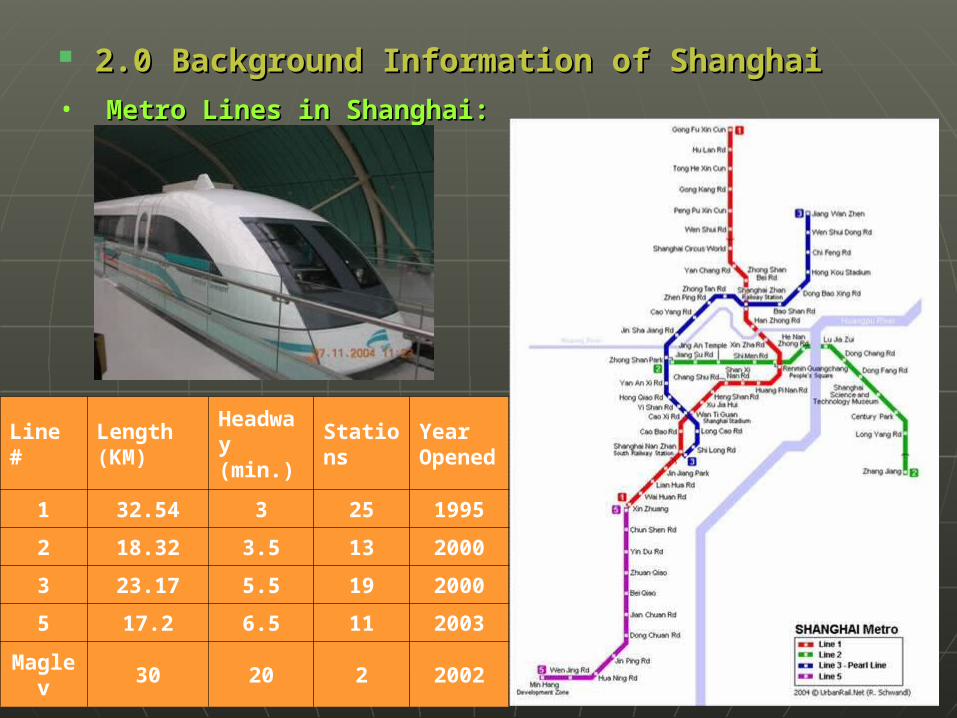
• Metro Lines in Shanghai:Metro Lines in Shanghai:
2.0 Background Information of Shanghai2.0 Background Information of Shanghai
Line #Length (KM)
Headway (min.)
StationsYear Opened
1 32.54 3 25 1995
2 18.32 3.5 13 2000
3 23.17 5.5 19 2000
5 17.2 6.5 11 2003
Maglev 30 20 2 2002
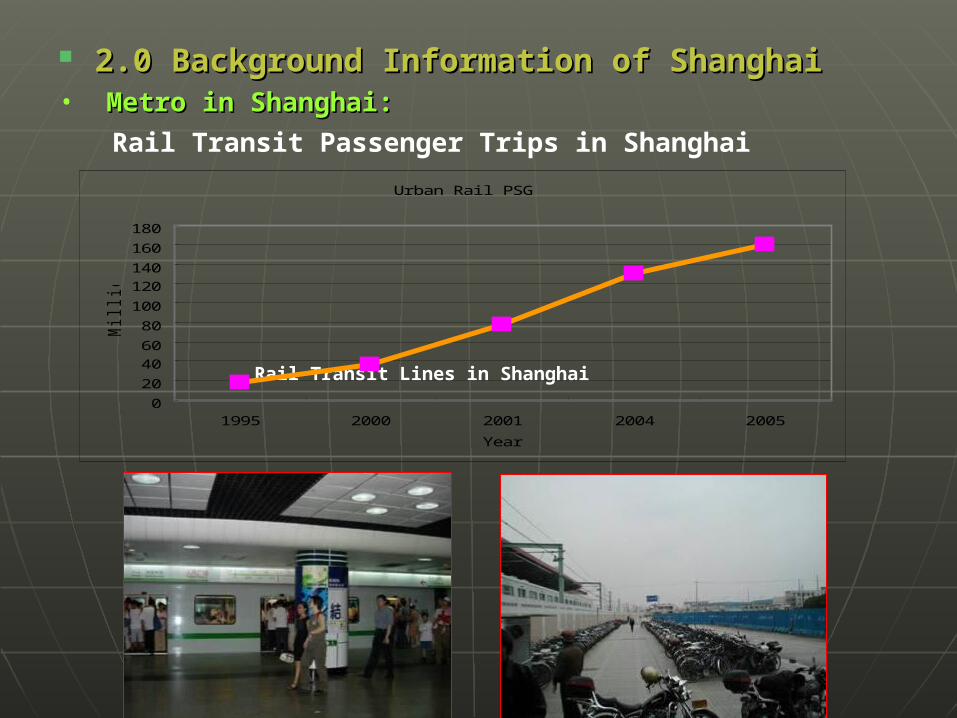
• Metro in Shanghai:Metro in Shanghai:
2.0 Background Information of Shanghai2.0 Background Information of Shanghai
Rail Transit Lines in Shanghai
Urban Rai l PSG
0
20
4060
80
100
120140
160
180
1995 2000 2001 2004 2005
Year
Million
Rail Transit Passenger Trips in Shanghai
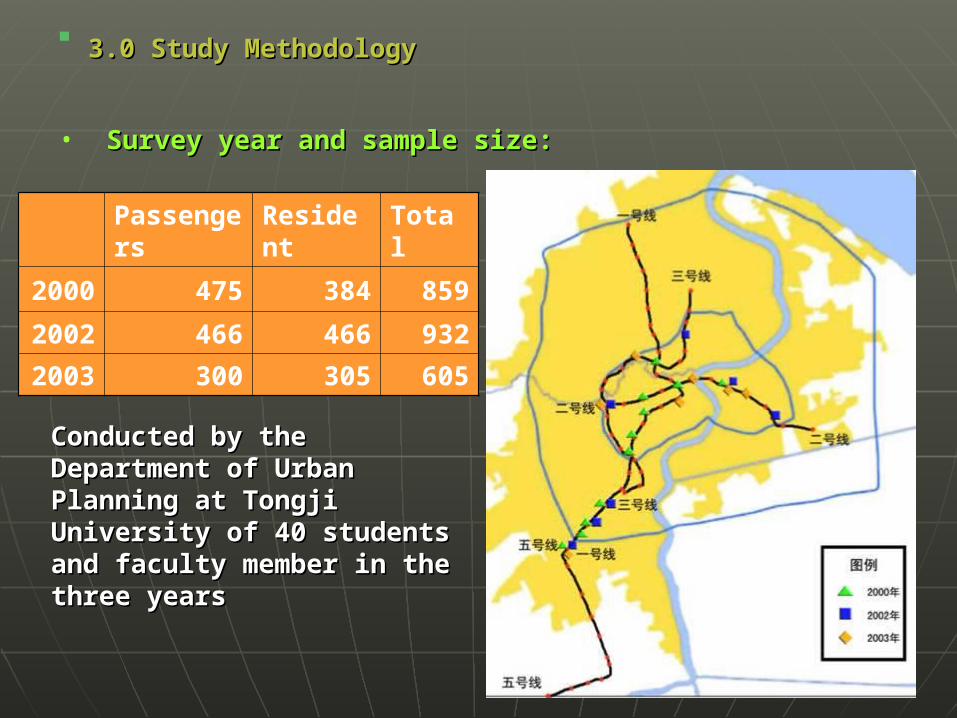
• Survey year and sample size:Survey year and sample size:
Passengers Resident Total
2000 475 384 859
2002 466 466 932
2003 300 305 605
Conducted by the Conducted by the Department of Urban Department of Urban Planning at Tongji Planning at Tongji University of 40 students University of 40 students and faculty member in the and faculty member in the three yearsthree years
3.0 Study3.0 Study MethodologyMethodology
• Interview: passengers and residents :Interview: passengers and residents :
passengers waiting for the trainpassengers waiting for the train
residents within the buffer zoneresidents within the buffer zone Trip purpose Trip purpose
Trip Modes Trip Modes
Changes in Trip Times Changes in Trip Times
Frequency of downtown visitFrequency of downtown visit
Opinion: facility, service, connecting transportOpinion: facility, service, connecting transport
3.0 Study3.0 Study MethodologyMethodology

Functional composition:Functional composition:
• Create two buffer zones around each of the rail stationCreate two buffer zones around each of the rail station
• Compare shares of each type of land use between the two bufferCompare shares of each type of land use between the two bufferss
• Studies land use for between the 0-500 meter buffer and the 50Studies land use for between the 0-500 meter buffer and the 500-1,000-meter buffer for suburban stations.0-1,000-meter buffer for suburban stations.
Development intensity:Development intensity:
• compare in 200-500 and 500-1000 meters in peripherycompare in 200-500 and 500-1000 meters in periphery
• density in low(FAR< 1.0),medium(FAR 1.0~2.5), high(FAR>2.5)density in low(FAR< 1.0),medium(FAR 1.0~2.5), high(FAR>2.5)
3.0 Study Methodology: Field survey:3.0 Study Methodology: Field survey:

3.0 Study3.0 Study MethodologyMethodology

Year Work SchoolPersonal Business Shopping Recreational Other
2000 20.4% 6.58% 3.29% 26.75% 30.5% 12.5%
2002 24.6% 3.8% 4.7% 33.9% 17.4% 15.6%
2003 36.5% 5.2% 10.9% 28.6% 9.4% 9.4%
•1 influence on trip making characteristics in Shanghai 1 influence on trip making characteristics in Shanghai
4.0 Study4.0 Study Results:Results:
Trip purposeTrip purpose::
rail transit is mostly used for work commuterail transit is mostly used for work commute
In 2000 less developed service in suburban ,more In 2000 less developed service in suburban ,more travel for recreationtravel for recreation

•1 influence on trip making characteristics in Shanghai 1 influence on trip making characteristics in Shanghai
4.0 Study4.0 Study Results:Results:

•1 influence on trip making characteristics in Shanghai 1 influence on trip making characteristics in Shanghai
4.0 Study4.0 Study Results:Results:
Year 2002

4.0 Study4.0 Study Results:Results:
Trip ModesTrip Modes
Walk BicyclePowered Bicycle
Motorcycle Bus Car Metro Other
Before Metro Opening
11.45% 14.48% 4.04% 1.68% 63.30% 2.36% 0 2.70%
Current 9.42% 14.86% 3.26% 0.36% 17.39% 1.45% 52.90% 0.36%
Big shift from bus to metro.Big shift from bus to metro.
Less passenger in 2000 due to:Less passenger in 2000 due to:
fare too high. fare too high.
not direct link to destinations not direct link to destinations
inconvenient for transfersinconvenient for transfers
•1 influence on trip making characteristics in Shanghai 1 influence on trip making characteristics in Shanghai
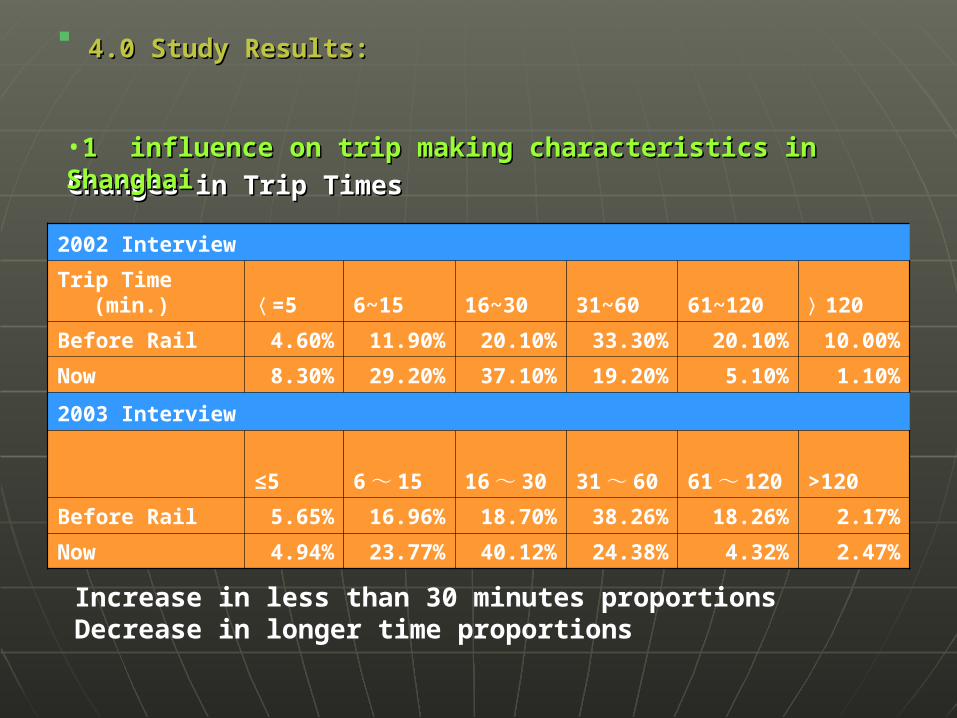
Changes in Trip TimesChanges in Trip Times
2002 Interview
Trip Time (min.) 〈 =5 6~15 16~30 31~60 61~120 〉 120
Before Rail 4.60% 11.90% 20.10% 33.30% 20.10% 10.00%
Now 8.30% 29.20% 37.10% 19.20% 5.10% 1.10%
2003 Interview
≤5 6 ~ 15 16 ~ 30 31 ~ 60 61 ~ 120 >120
Before Rail 5.65% 16.96% 18.70% 38.26% 18.26% 2.17%
Now 4.94% 23.77% 40.12% 24.38% 4.32% 2.47%
4.0 Study4.0 Study Results:Results:
Increase in less than 30 minutes proportionsDecrease in longer time proportions
•1 influence on trip making characteristics in Shanghai 1 influence on trip making characteristics in Shanghai
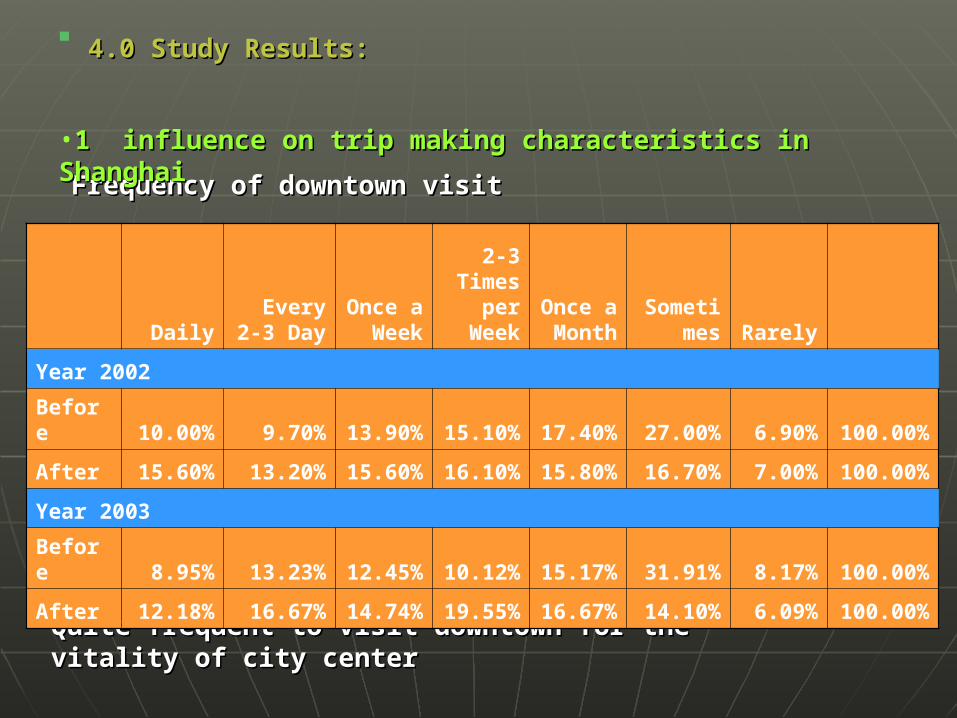
Frequency of downtown visitFrequency of downtown visit
4.0 Study4.0 Study Results:Results:
Quite frequent to visit downtown for the Quite frequent to visit downtown for the vitality of city centervitality of city center
DailyEvery 2-
3 DayOnce a
Week
2-3 Times
per Week
Once a Month
Sometimes Rarely
Year 2002
Before 10.00% 9.70% 13.90% 15.10% 17.40% 27.00% 6.90% 100.00%
After 15.60% 13.20% 15.60% 16.10% 15.80% 16.70% 7.00% 100.00%
Year 2003
Before 8.95% 13.23% 12.45% 10.12% 15.17% 31.91% 8.17% 100.00%
After 12.18% 16.67% 14.74% 19.55% 16.67% 14.10% 6.09% 100.00%
•1 influence on trip making characteristics in Shanghai 1 influence on trip making characteristics in Shanghai

4.0 Study4.0 Study Results:Results:

4.0 Study4.0 Study Results:Results:
•2 Land use near the station2 Land use near the station Land Use Composition :Land Use Composition :
Residential Office Commer.Other public
Industrial /Warehouse
Green Space Transp.
Vacant Total
Metro Line-1
Inner Buffer 24.5 3.0 24.0 8.1 0.9 16.7 18.8 4 100
Outer Buffer 36.6 4.8 16.3 7.4 2.2 11.8 16.0 4.9 100
Differences +12.1 +1.8 -7.7 -0.7 +1.3 -4.9 -2.8
Metro Line-2
Inner Buffer 26.4 6.3 18.1 5.5 0.5 15.9 22.4 4.9 100
Outer Buffer 35.3 4.2 15.5 7.0 3.2 14.2 14.4 6.2 100
Differences +8.9 -2.1 -2.61 +1.5 +2.7 -1.7 -8.0
Metro Line-3
Inner Buffer 25.7 2.8 10.7 3.5 8.6 7.7 38.6 2.4 100
Outer Buffer 45.1 2.0 8.9 9.2 8.7 3.5 20.2 2.4 100
Differences +19.4 -0.8 -1.8 +5.7 +0.1 -4.2 -18.4
land use compositions in 0-200 vs. 200-500 buffer
4.0 Study4.0 Study Results:Results:
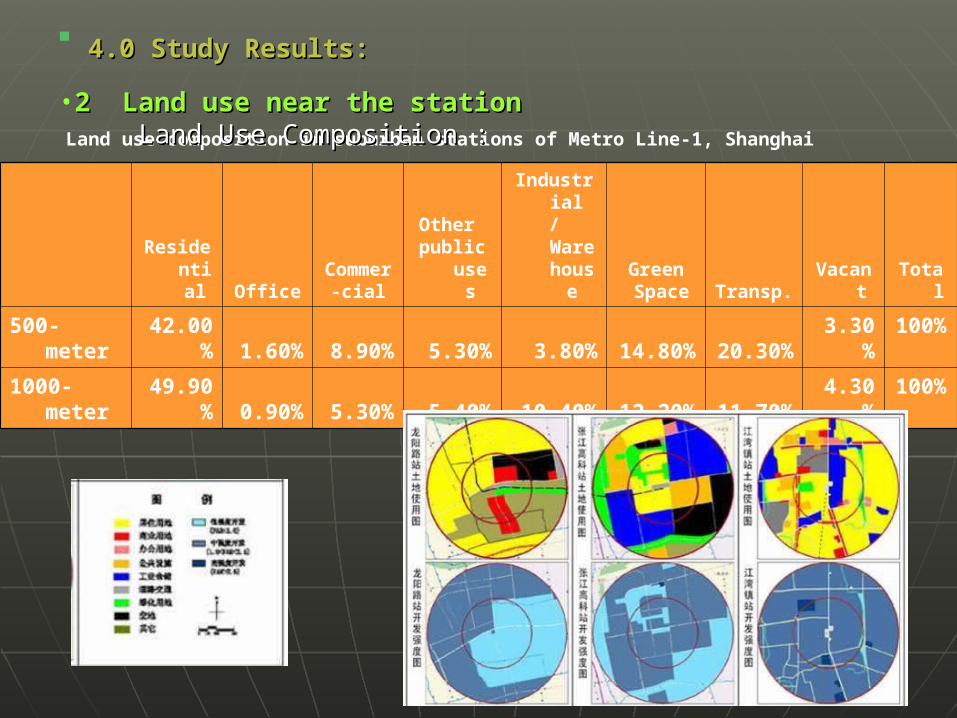
Residential Office
Commer-cial
Other public
uses
Industrial /Warehouse
Green Space Transp. Vacant Total
500-meter42.00
% 1.60% 8.90% 5.30% 3.80% 14.80% 20.30% 3.30%100%
1000-meter49.90
% 0.90% 5.30% 5.40% 10.40% 12.20% 11.70% 4.30%100%
Land use composition in suburban stations of Metro Line-1, Shanghai
•2 Land use near the station2 Land use near the station Land Use Composition :Land Use Composition :

4.0 Study4.0 Study Results:Results:
•Land use near the station: Land use near the station:
4.0 Study4.0 Study Results:Results:
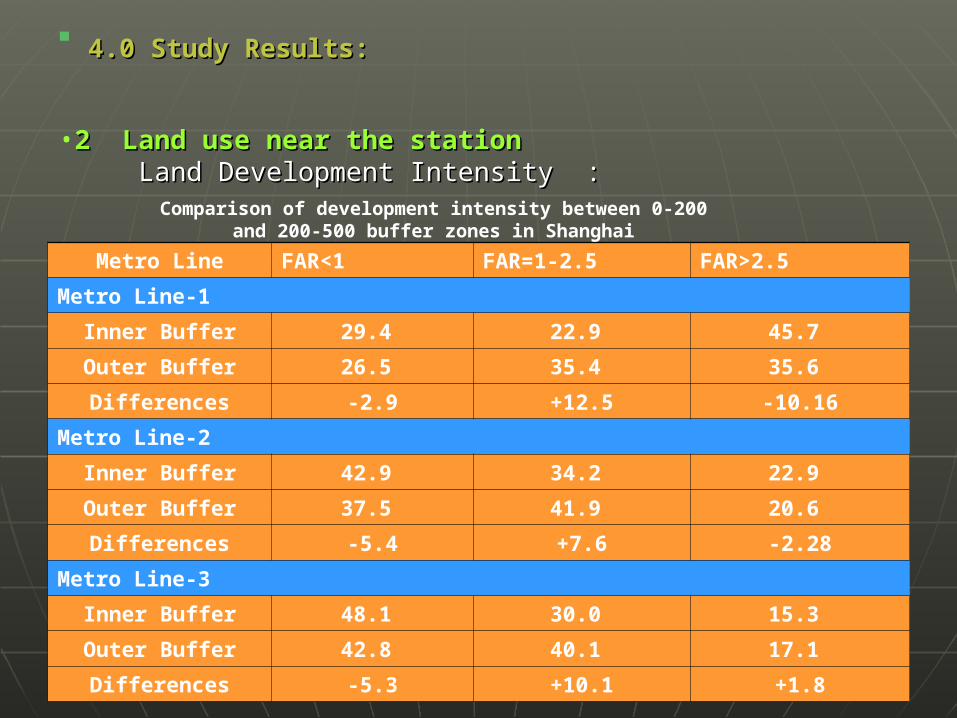
Metro Line FAR<1 FAR=1-2.5 FAR>2.5
Metro Line-1
Inner Buffer 29.4 22.9 45.7
Outer Buffer 26.5 35.4 35.6
Differences -2.9 +12.5 -10.16
Metro Line-2
Inner Buffer 42.9 34.2 22.9
Outer Buffer 37.5 41.9 20.6
Differences -5.4 +7.6 -2.28
Metro Line-3
Inner Buffer 48.1 30.0 15.3
Outer Buffer 42.8 40.1 17.1
Differences -5.3 +10.1 +1.8
Comparison of development intensity between 0-200 and 200-500 buffer zones in Shanghai
•2 Land use near the station2 Land use near the station Land Development Intensity :Land Development Intensity :

4.0 Study4.0 Study Results:Results:
compare the land uses between 2000 and 2003 for Xinzhcompare the land uses between 2000 and 2003 for Xinzhuang Station:uang Station:
more commercial and office uses replaced more commercial and office uses replaced residential uses in areas closer to the stationresidential uses in areas closer to the station
•2 Land use near the station2 Land use near the station Land Development Intensity :Land Development Intensity :

4.0 Study4.0 Study Results:Results:
Development intensity among three metro lines in Shanghai
Metro FAR<1 FAR=1-2.5 FAR>2.5
L-1 26.9 33.4 37.2
L-2 38.4 40.6 21
L-3 43.6 38.5 16.8
Line-1 is more intense than Line-2Line-1 is more intense than Line-2Line-2 is more intense than Line-3Line-2 is more intense than Line-3
•2 Land use near the station2 Land use near the station Land Development Intensity :Land Development Intensity :

4.0 Study4.0 Study Results:Results:
zhongshan Park Station(RMB/Sq.M)
0100020003000400050006000700080009000
10000
0-500m 500-1000m
200120022003
J i angwan Station Area Property Value(RMB/Sq.M)
0
1000
2000
3000
4000
5000
6000
7000
0-500m 500-1000m 1000-1500m
200120022003
Change in Housing Prices
Sun Yat-sen Park StationSun Yat-sen Park Station Jiang wan Zhen Station, the North terJiang wan Zhen Station, the North terminal of Line-3minal of Line-3

4.0 Study4.0 Study Results:Results:
•3 The case of Sun Yat-sen Park Station 3 The case of Sun Yat-sen Park Station • Interchange of line-1 and line-2Interchange of line-1 and line-2 • 320 thousand residents In an area of 1.5 kilometers 320 thousand residents In an area of 1.5 kilometers in radiusin radius 918 thousand residents In an area of 3.0 kilometers in radius918 thousand residents In an area of 3.0 kilometers in radius

4.0 Study4.0 Study Results:Results:
•3 The case of Sun Yat-sen Park Station 3 The case of Sun Yat-sen Park Station • land useland use site: part of Shanghai Steel and Iron Company Unit-3.site: part of Shanghai Steel and Iron Company Unit-3.

4.0 Study4.0 Study Results:Results:
•3 The case of Sun Yat-sen Park Station 3 The case of Sun Yat-sen Park Station • Dream of Dragon project:Dream of Dragon project:

4.0 Study4.0 Study Results:Results:
•3 The case of Sun Yat-sen Park Station 3 The case of Sun Yat-sen Park Station
• Planning concept of evolution:Planning concept of evolution: Follow Japan and Hongkong, take the advantage of the metro interFollow Japan and Hongkong, take the advantage of the metro interchangechange relocate the Park Station of Line-2 500 meter west. relocate the Park Station of Line-2 500 meter west. three facilities on the site three facilities on the site attracted interests from many developers. attracted interests from many developers. Shanghai Changfeng Inc. won the projectShanghai Changfeng Inc. won the project
• Dream of Dragon project:Dream of Dragon project: investment:investment:US$366 millionsUS$366 millions construction started in June 2002construction started in June 2002 , part open in December 2005 floor space area :320 thousand square meters floor space area :320 thousand square meters 25 thousand sqm for office use25 thousand sqm for office use 5-star hotel with 780 guest rooms. 5-star hotel with 780 guest rooms. 200 thousand square meters Shopping center200 thousand square meters Shopping center

4.0 Study4.0 Study Results:Results:
•3 The case of Sun Yat-sen Park Station 3 The case of Sun Yat-sen Park Station

4.0 Study4.0 Study Results:Results:
•3 The case of Sun Yat-sen Park Station 3 The case of Sun Yat-sen Park Station •Dream of Dragon project:Dream of Dragon project: transport connection transport connection 1000-square meter lobby to the station1000-square meter lobby to the station 1500-sqm transfer area for taxi and bus1500-sqm transfer area for taxi and bus 45-meter long skyway connect with line-345-meter long skyway connect with line-3 750 parking spaces for cars. 750 parking spaces for cars. Key elements:Key elements: willingness of various stakeholders willingness of various stakeholders institutional supports, FAR bonusinstitutional supports, FAR bonus
•More terminal complex TODMore terminal complex TOD
Lot Size (m2)
Planned FAR
Public Space Bonus (m2)
Building Area (m2)
Actual FAR
Vehicle Parking (Spaces)
Bicycle Parking (m2)
Green Space (%)
25899 6.7 34705 208228 8.04 900 2803 21
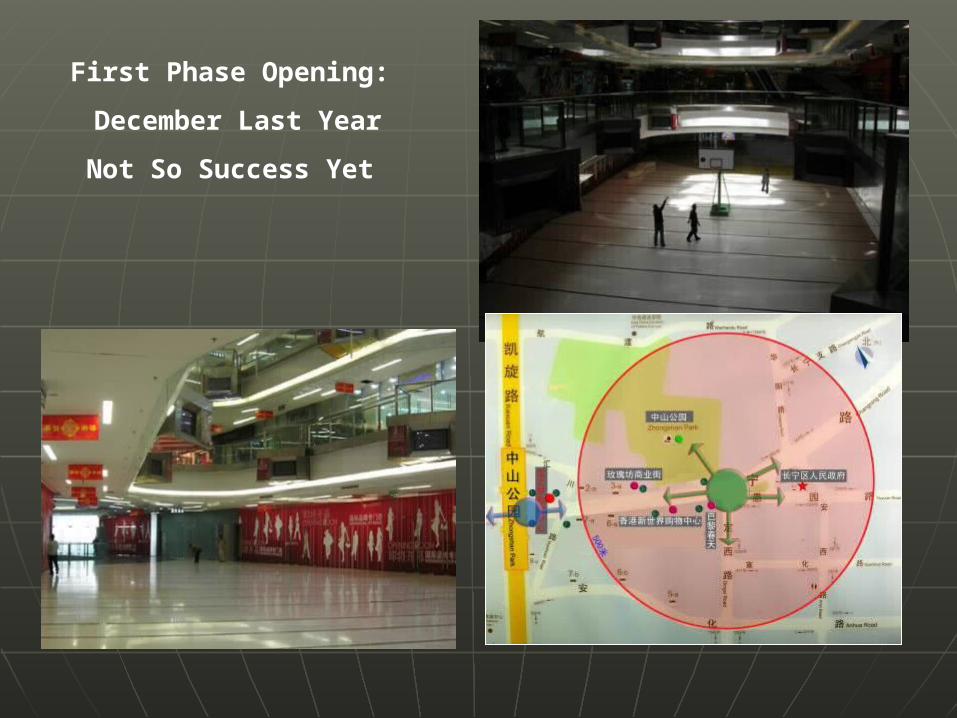
First Phase Opening:
December Last Year
Not So Success Yet
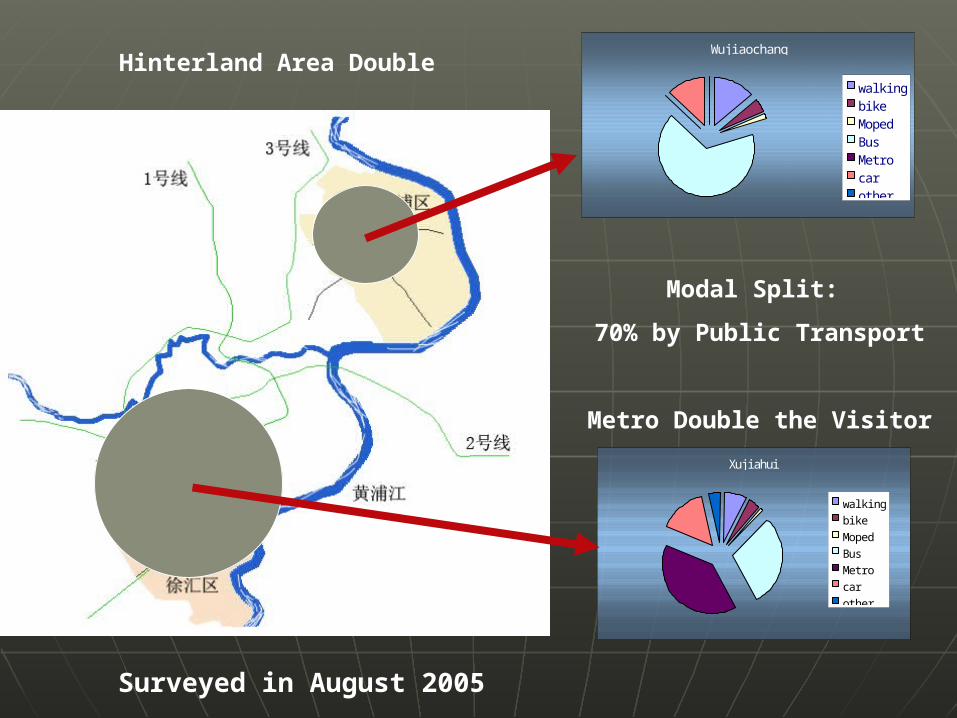
Hinterland Area Double
Xuj i ahui
wal ki ngbi keMopedBusMet rocarother
Wuj i aochang
wal ki ngbi keMopedBusMet rocarother
Modal Split:
70% by Public Transport
Metro Double the Visitor
Surveyed in August 2005

5.0 Conclusion:5.0 Conclusion:
• Rail transit in Shanghai does change Rail transit in Shanghai does change the trip making characteristics of those the trip making characteristics of those living near the stationsliving near the stations
• Changes in land use patterns Changes in land use patterns associated with the rail transit are also associated with the rail transit are also consistent with the urban economics consistent with the urban economics theory: theory:
• Rail transit does affect land use in Rail transit does affect land use in areas where the system goes in areas where the system goes in Shanghai Shanghai

5.0 Conclusion: (con’t)5.0 Conclusion: (con’t)
•The private sector is playing an The private sector is playing an increasingly important role in China’s increasingly important role in China’s transportation planning and land use transportation planning and land use decisionsdecisions
• City wide transport strategy is critical City wide transport strategy is critical to guarantee the relative accessibilityto guarantee the relative accessibility
• The influence range of a station is far The influence range of a station is far beyond the 5 minutes , so connecting beyond the 5 minutes , so connecting transport is very important to be transport is very important to be concerned.concerned.