Embed Size (px)
Citation preview
Rail Safety Data Report
Rail Transit Safety Data
2007 – 2015
September 2018

This page intentionally left blank
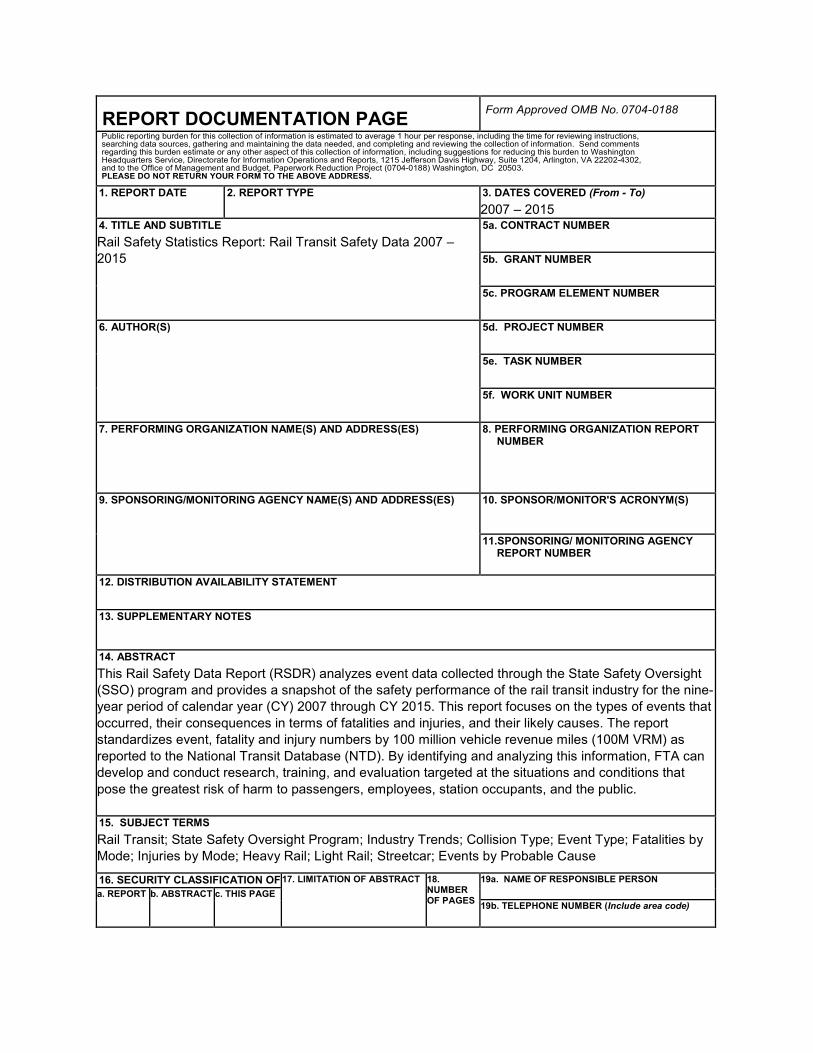
REPORT DOCUMENTATION PAGE Form Approved OMB No. 0704-0188
Public reporting burden for this collection of information is estimated to average 1 hour per response, including the time for reviewing instructions, searching data sources, gathering and maintaining the data needed, and completing and reviewing the collection of information. Send comments regarding this burden estimate or any other aspect of this collection of information, including suggestions for reducing this burden to Washington Headquarters Service, Directorate for Information Operations and Reports, 1215 Jefferson Davis Highway, Suite 1204, Arlington, VA 22202-4302, and to the Office of Management and Budget, Paperwork Reduction Project (0704-0188) Washington, DC 20503. PLEASE DO NOT RETURN YOUR FORM TO THE ABOVE ADDRESS.
1. REPORT DATE
2. REPORT TYPE
3. DATES COVERED (From - To) 2007 – 2015
4. TITLE AND SUBTITLE Rail Safety Statistics Report: Rail Transit Safety Data 2007 – 2015
5a. CONTRACT NUMBER 5b. GRANT NUMBER 5c. PROGRAM ELEMENT NUMBER
6. AUTHOR(S)
5d. PROJECT NUMBER 5e. TASK NUMBER 5f. WORK UNIT NUMBER
7. PERFORMING ORGANIZATION NAME(S) AND ADDRESS(ES)
8. PERFORMING ORGANIZATION REPORT NUMBER
9. SPONSORING/MONITORING AGENCY NAME(S) AND ADDRESS(ES)
10. SPONSOR/MONITOR'S ACRONYM(S)
11.SPONSORING/ MONITORING AGENCY REPORT NUMBER
12. DISTRIBUTION AVAILABILITY STATEMENT 13. SUPPLEMENTARY NOTES
14. ABSTRACT This Rail Safety Data Report (RSDR) analyzes event data collected through the State Safety Oversight (SSO) program and provides a snapshot of the safety performance of the rail transit industry for the nine-year period of calendar year (CY) 2007 through CY 2015. This report focuses on the types of events that occurred, their consequences in terms of fatalities and injuries, and their likely causes. The report standardizes event, fatality and injury numbers by 100 million vehicle revenue miles (100M VRM) as reported to the National Transit Database (NTD). By identifying and analyzing this information, FTA can develop and conduct research, training, and evaluation targeted at the situations and conditions that pose the greatest risk of harm to passengers, employees, station occupants, and the public.
15. SUBJECT TERMS Rail Transit; State Safety Oversight Program; Industry Trends; Collision Type; Event Type; Fatalities by Mode; Injuries by Mode; Heavy Rail; Light Rail; Streetcar; Events by Probable Cause
16. SECURITY CLASSIFICATION OF 17. LIMITATION OF ABSTRACT
18. NUMBER OF PAGES
19a. NAME OF RESPONSIBLE PERSON
a. REPORT
b. ABSTRACT
c. THIS PAGE
19b. TELEPHONE NUMBER (Include area code)

This page intentionally left blank
Rail Safety Data Report
Page | i
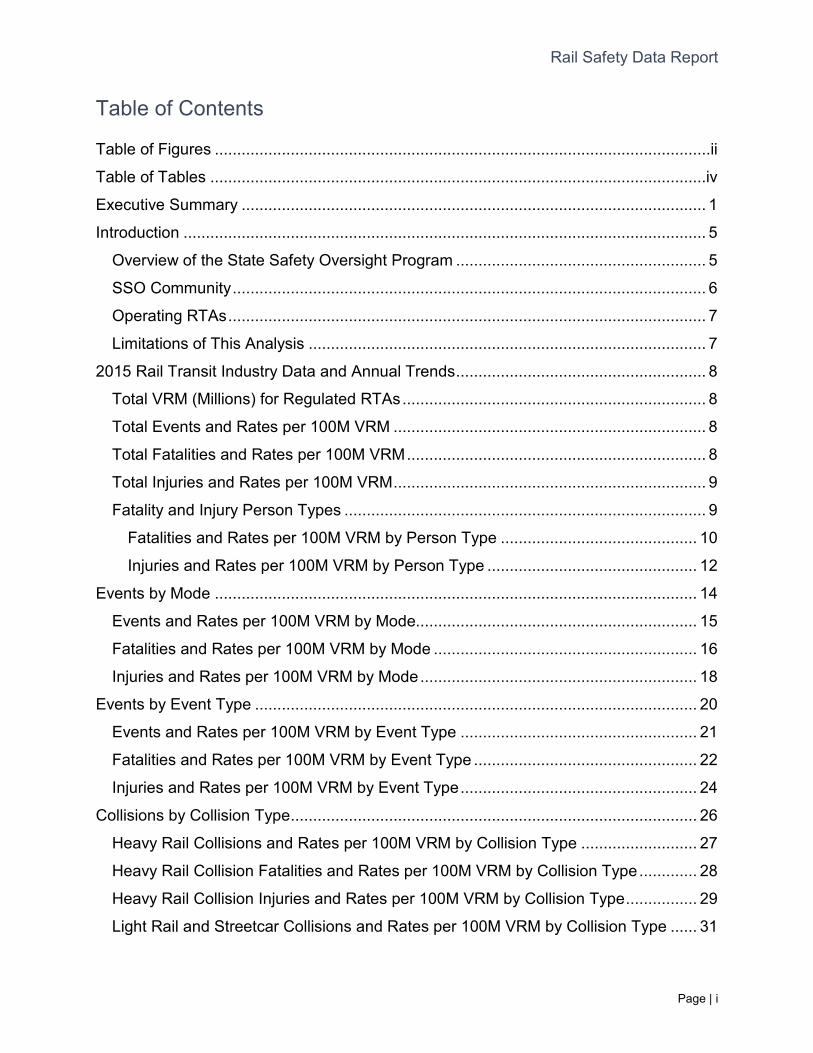
Table of Contents
Table of Figures ...............................................................................................................ii
Table of Tables ...............................................................................................................iv
Executive Summary ........................................................................................................ 1
Introduction ..................................................................................................................... 5
Overview of the State Safety Oversight Program ........................................................ 5
SSO Community .......................................................................................................... 6
Operating RTAs ........................................................................................................... 7
Limitations of This Analysis ......................................................................................... 7
2015 Rail Transit Industry Data and Annual Trends ........................................................ 8
Total VRM (Millions) for Regulated RTAs .................................................................... 8
Total Events and Rates per 100M VRM ...................................................................... 8
Total Fatalities and Rates per 100M VRM ................................................................... 8
Total Injuries and Rates per 100M VRM ...................................................................... 9
Fatality and Injury Person Types ................................................................................. 9
Fatalities and Rates per 100M VRM by Person Type ............................................ 10
Injuries and Rates per 100M VRM by Person Type ............................................... 12
Events by Mode ............................................................................................................ 14
Events and Rates per 100M VRM by Mode............................................................... 15
Fatalities and Rates per 100M VRM by Mode ........................................................... 16
Injuries and Rates per 100M VRM by Mode .............................................................. 18
Events by Event Type ................................................................................................... 20
Events and Rates per 100M VRM by Event Type ..................................................... 21
Fatalities and Rates per 100M VRM by Event Type .................................................. 22
Injuries and Rates per 100M VRM by Event Type ..................................................... 24
Collisions by Collision Type ........................................................................................... 26
Heavy Rail Collisions and Rates per 100M VRM by Collision Type .......................... 27
Heavy Rail Collision Fatalities and Rates per 100M VRM by Collision Type ............. 28
Heavy Rail Collision Injuries and Rates per 100M VRM by Collision Type ................ 29
Light Rail and Streetcar Collisions and Rates per 100M VRM by Collision Type ...... 31
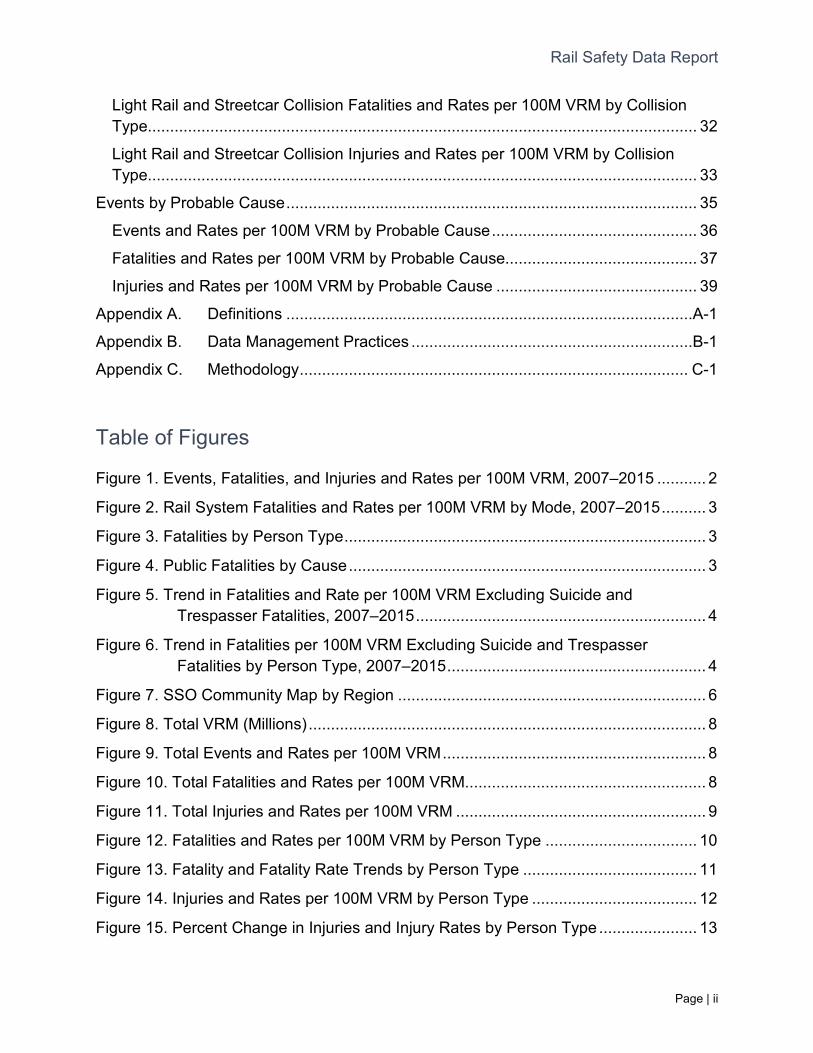
Rail Safety Data Report
Page | ii
Light Rail and Streetcar Collision Fatalities and Rates per 100M VRM by Collision Type........................................................................................................................... 32
Light Rail and Streetcar Collision Injuries and Rates per 100M VRM by Collision Type........................................................................................................................... 33
Events by Probable Cause ............................................................................................ 35
Events and Rates per 100M VRM by Probable Cause .............................................. 36
Fatalities and Rates per 100M VRM by Probable Cause........................................... 37
Injuries and Rates per 100M VRM by Probable Cause ............................................. 39
Appendix A. Definitions ...........................................................................................A-1
Appendix B. Data Management Practices ...............................................................B-1
Appendix C. Methodology ....................................................................................... C-1
Table of Figures
Figure 1. Events, Fatalities, and Injuries and Rates per 100M VRM, 2007–2015 ........... 2
Figure 2. Rail System Fatalities and Rates per 100M VRM by Mode, 2007–2015 .......... 3
Figure 3. Fatalities by Person Type ................................................................................. 3
Figure 4. Public Fatalities by Cause ................................................................................ 3
Figure 5. Trend in Fatalities and Rate per 100M VRM Excluding Suicide and Trespasser Fatalities, 2007–2015 ................................................................. 4
Figure 6. Trend in Fatalities per 100M VRM Excluding Suicide and Trespasser Fatalities by Person Type, 2007–2015 .......................................................... 4
Figure 7. SSO Community Map by Region ..................................................................... 6
Figure 8. Total VRM (Millions) ......................................................................................... 8
Figure 9. Total Events and Rates per 100M VRM ........................................................... 8
Figure 10. Total Fatalities and Rates per 100M VRM...................................................... 8
Figure 11. Total Injuries and Rates per 100M VRM ........................................................ 9
Figure 12. Fatalities and Rates per 100M VRM by Person Type .................................. 10
Figure 13. Fatality and Fatality Rate Trends by Person Type ....................................... 11
Figure 14. Injuries and Rates per 100M VRM by Person Type ..................................... 12
Figure 15. Percent Change in Injuries and Injury Rates by Person Type ...................... 13
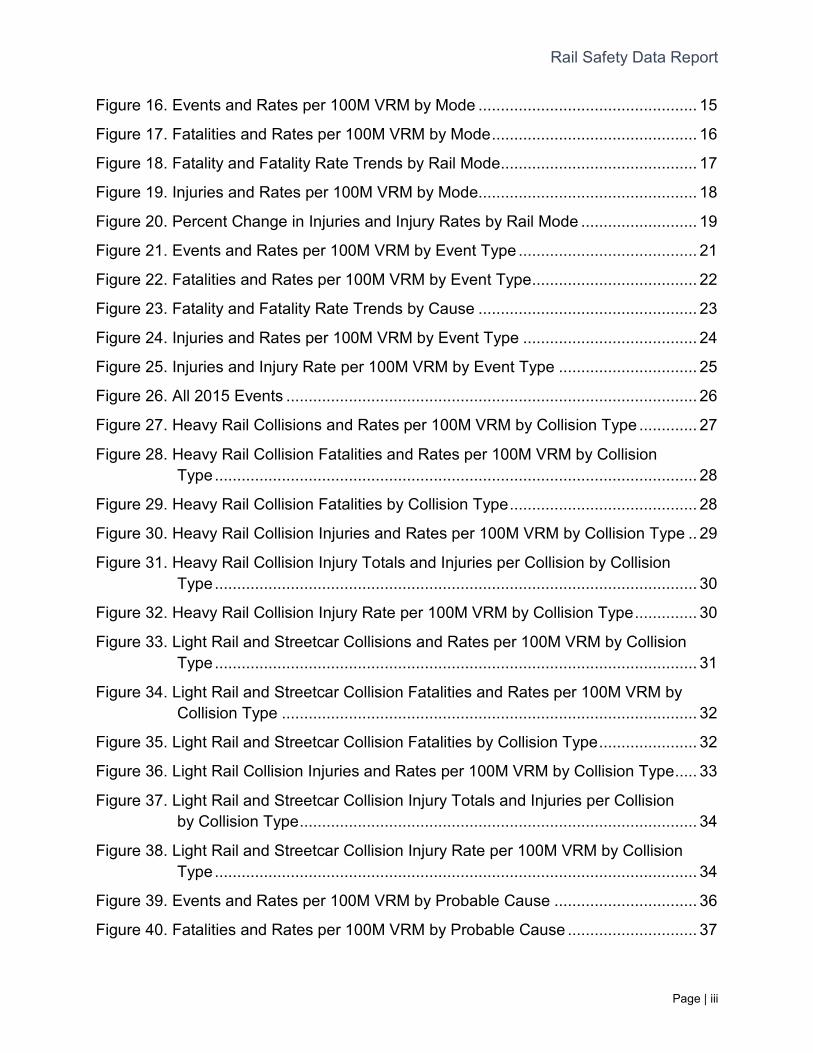
Rail Safety Data Report
Page | iii
Figure 16. Events and Rates per 100M VRM by Mode ................................................. 15
Figure 17. Fatalities and Rates per 100M VRM by Mode .............................................. 16
Figure 18. Fatality and Fatality Rate Trends by Rail Mode ............................................ 17
Figure 19. Injuries and Rates per 100M VRM by Mode................................................. 18
Figure 20. Percent Change in Injuries and Injury Rates by Rail Mode .......................... 19
Figure 21. Events and Rates per 100M VRM by Event Type ........................................ 21
Figure 22. Fatalities and Rates per 100M VRM by Event Type ..................................... 22
Figure 23. Fatality and Fatality Rate Trends by Cause ................................................. 23
Figure 24. Injuries and Rates per 100M VRM by Event Type ....................................... 24
Figure 25. Injuries and Injury Rate per 100M VRM by Event Type ............................... 25
Figure 26. All 2015 Events ............................................................................................ 26
Figure 27. Heavy Rail Collisions and Rates per 100M VRM by Collision Type ............. 27
Figure 28. Heavy Rail Collision Fatalities and Rates per 100M VRM by Collision Type ............................................................................................................ 28
Figure 29. Heavy Rail Collision Fatalities by Collision Type .......................................... 28
Figure 30. Heavy Rail Collision Injuries and Rates per 100M VRM by Collision Type .. 29
Figure 31. Heavy Rail Collision Injury Totals and Injuries per Collision by Collision Type ............................................................................................................ 30
Figure 32. Heavy Rail Collision Injury Rate per 100M VRM by Collision Type .............. 30
Figure 33. Light Rail and Streetcar Collisions and Rates per 100M VRM by Collision Type ............................................................................................................ 31
Figure 34. Light Rail and Streetcar Collision Fatalities and Rates per 100M VRM by Collision Type ............................................................................................. 32
Figure 35. Light Rail and Streetcar Collision Fatalities by Collision Type ...................... 32
Figure 36. Light Rail Collision Injuries and Rates per 100M VRM by Collision Type ..... 33
Figure 37. Light Rail and Streetcar Collision Injury Totals and Injuries per Collision by Collision Type ......................................................................................... 34
Figure 38. Light Rail and Streetcar Collision Injury Rate per 100M VRM by Collision Type ............................................................................................................ 34
Figure 39. Events and Rates per 100M VRM by Probable Cause ................................ 36
Figure 40. Fatalities and Rates per 100M VRM by Probable Cause ............................. 37
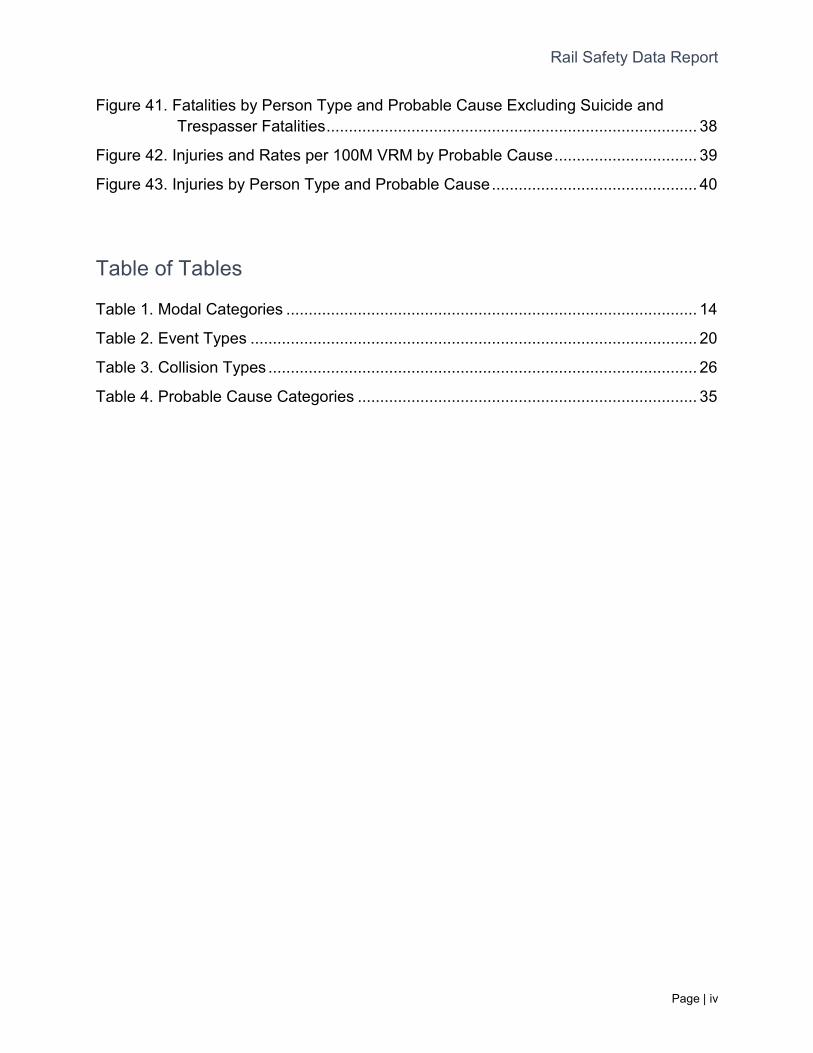
Rail Safety Data Report
Page | iv
Figure 41. Fatalities by Person Type and Probable Cause Excluding Suicide and Trespasser Fatalities ................................................................................... 38
Figure 42. Injuries and Rates per 100M VRM by Probable Cause ................................ 39
Figure 43. Injuries by Person Type and Probable Cause .............................................. 40
Table of Tables
Table 1. Modal Categories ............................................................................................ 14
Table 2. Event Types .................................................................................................... 20
Table 3. Collision Types ................................................................................................ 26
Table 4. Probable Cause Categories ............................................................................ 35
Rail Safety Data Report
Page | 1
Executive Summary
This Rail Safety Data Report (RSDR) is a data analysis prepared by the Federal Transit Administration (FTA) to illustrate rail transit safety outcomes and present trends and patterns in rail safety and security event data. This RSDR focuses on safety outcomes in 2015 and the trend of the data between 2007 and 2015. The FTA plans to publish additional RSDRs as future annual transit safety data becomes available.
The data used in the RSDR come from State Safety Oversight Agencies (SSOAs) in accordance with 49 C.F.R. § 659.39(c). The FTA oversees SSOAs through the State Safety Oversight (SSO) program. The SSOAs in turn oversee safety at rail transit agencies that receive Federal funding. The Federal Railroad Administration (FRA) oversees a small number of rail transit agencies that this report does not include. Data on vehicle revenue miles (VRM) come from the National Transit Database (NTD). These data are used to standardize safety outcomes by 100 million (100M) VRM to account for the distinct levels of service provided by different modes and by the rail transit industry each year.
From 2007 to 2015, FTA required SSOAs to submit reports on all events that resulted in a fatality, two or more injuries, $25,000 or more in property damage, a life safety evacuation, a mainline derailment, a collision at a grade crossing, a collision between a train and a person, or a collision between two rail transit vehicles. See Appendix A for more precise definitions and thresholds. However, some reporting requirements changed during this timeframe, and for that reason the RSDR limits some analyses to the 2011–2015 period. The FTA is currently transitioning to a new SSO rule (codified at 49 C.F.R. Part 674), which will result in changes to data collection within this program in future years.
Rail Safety Data Report
Page | 2
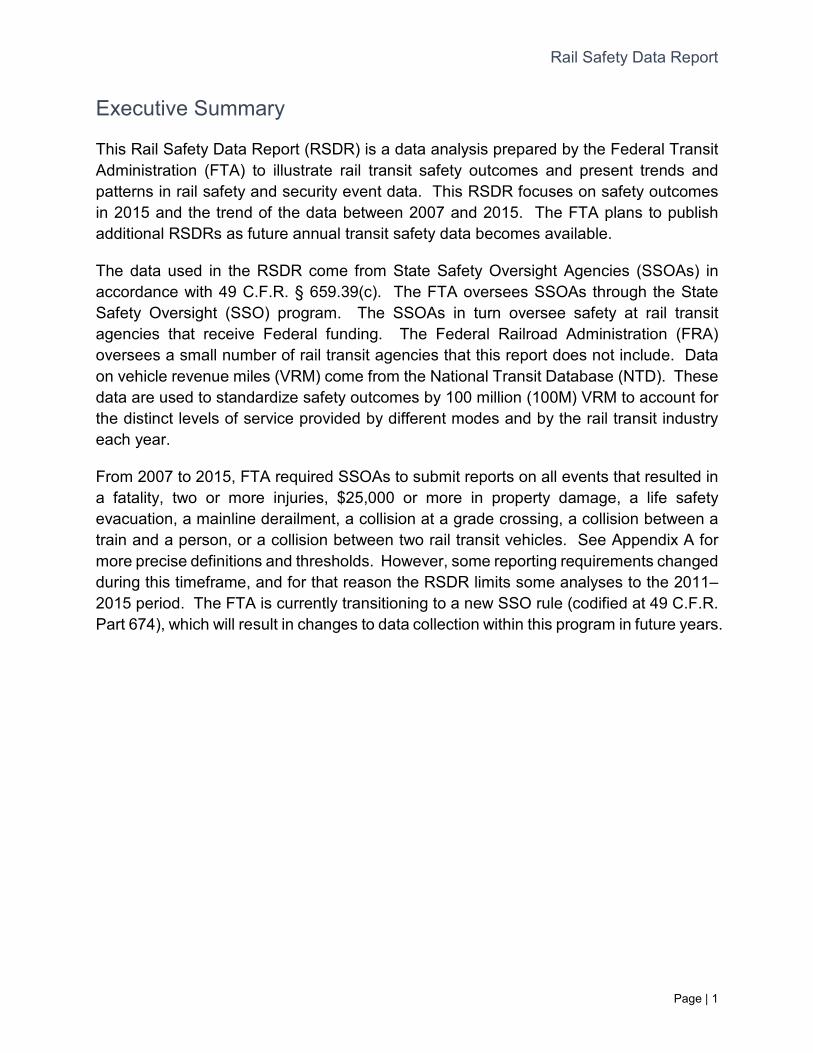
Events, Fatalities, and Injuries
In 2015, SSOAs reported
• 1,396 events that resulted in
o 152 fatalities and
o 732 injuries
All three of these annual totals increased between 2014 and 2015.
• Events increased 25.5% and averaged an increase of 7.7% per year after 2007.
• Fatalities increased 12.6% and averaged an increase of 1.6% per year after 2007.
• Injuries increased 8.6% and averaged an increase of 3.2% per year after 2007.
Figure 1. Events, Fatalities, and
Injuries and Rates per 100M VRM, 2007–2015
The charts above take into account increasing rail service levels by standardizing event, fatality, and injury totals by VRM to calculate rates (red line). While the rates have also increased, the amount of increase is lower than the increases in raw values due to increasing service levels. In the nine-year period from 2007 to 2015
• Events per 100M VRM increased at an average of 6.5% per year;
• Fatalities per 100M VRM increased at an average of 0.4% per year; and
• Injuries per 100M VRM increased at an average of 2.0% per year.
769 971 1,029 1,023 1,032 1,000 1,099 1,112 1,396
108.14132.61 137.97 140.30 143.25 137.23 145.98 146.78
179.08
2007 2008 2009 2010 2011 2012 2013 2014 2015
Safety Events Event Rate (per 100M VRM)
134 107 145 130 137 156 159 135 152
2011 2012 2013 2014 2015
Fatality Rate (per 100M VRM)
18.84
14.61
19.4417.83 19.02
21.41 21.1217.82
19.50
2007 2008 2009 2010
Fatalities
569 693 633 704 624 643 610 674 732
94.6484.87
96.5586.62 88.24
81.0288.96 93.90
80.01
2007 2008 2009 2010 2011 2012 2013 2014 2015
Injuries Injury Rate (per 100M VRM)
Rail Safety Data Report
Page | 3
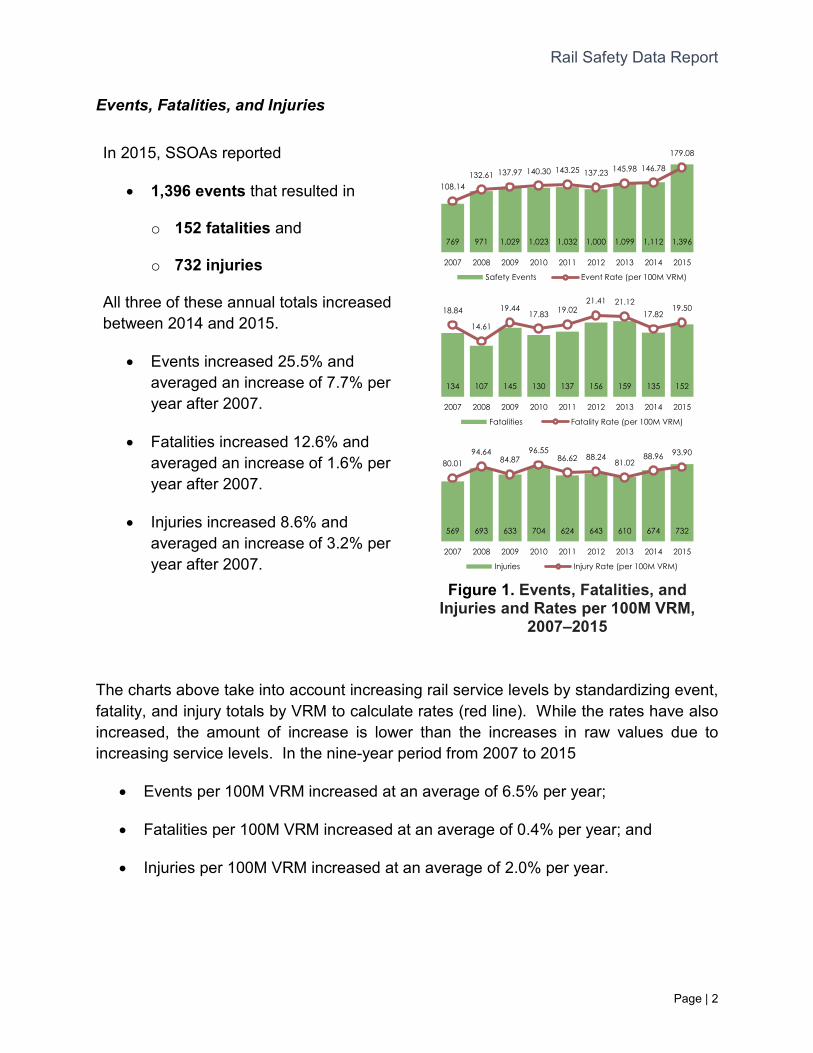
Fatalities by Rail Transit Mode
The following charts show fatalities by rail transit mode. See Appendix A for precise definitions of the modes shown.
Figure 2. Rail System Fatalities and Rates per 100M VRM by Mode, 2007–2015 • The majority (73%) of fatalities occurred at heavy rail systems; however,
standardizing by 100M VRM shows that the fewest number of fatalities occurredin those systems on a per revenue mile basis.
Fatalities by Person Type and Cause
The charts below show fatalities both by types of person and probable cause. See Appendix A for precise definitions of the person types and causes shown.
Figure 3. Fatalities by Person Type
Figure 4. Public Fatalities by Cause
• The majority (78%) of fatalities were members of the public (neither transit agencycustomers nor workers).
• Of these members of the public, the majority (80%) were trespassers or personscommitting suicide.
Heavy Rail73% (917)
Light Rail25% (311)
Streetcar1% (13)
Other1% (14)
Fatalities, 2007-2015
15.91
37.64
29.16
58.64
Heavy Rail
Light Rail
Streetcar
Other
Fatality Rate, 2007-2015
Passenger5% (62)
Patron15% (192)
Public78% (973)Worker
2% (28)
Fatalities, 2007-2015
Suicides or Trespassers80% (776)
Any Other Cause
20% (197)
Public Fatalities, 2007-2015
Rail Safety Data Report
Page | 4
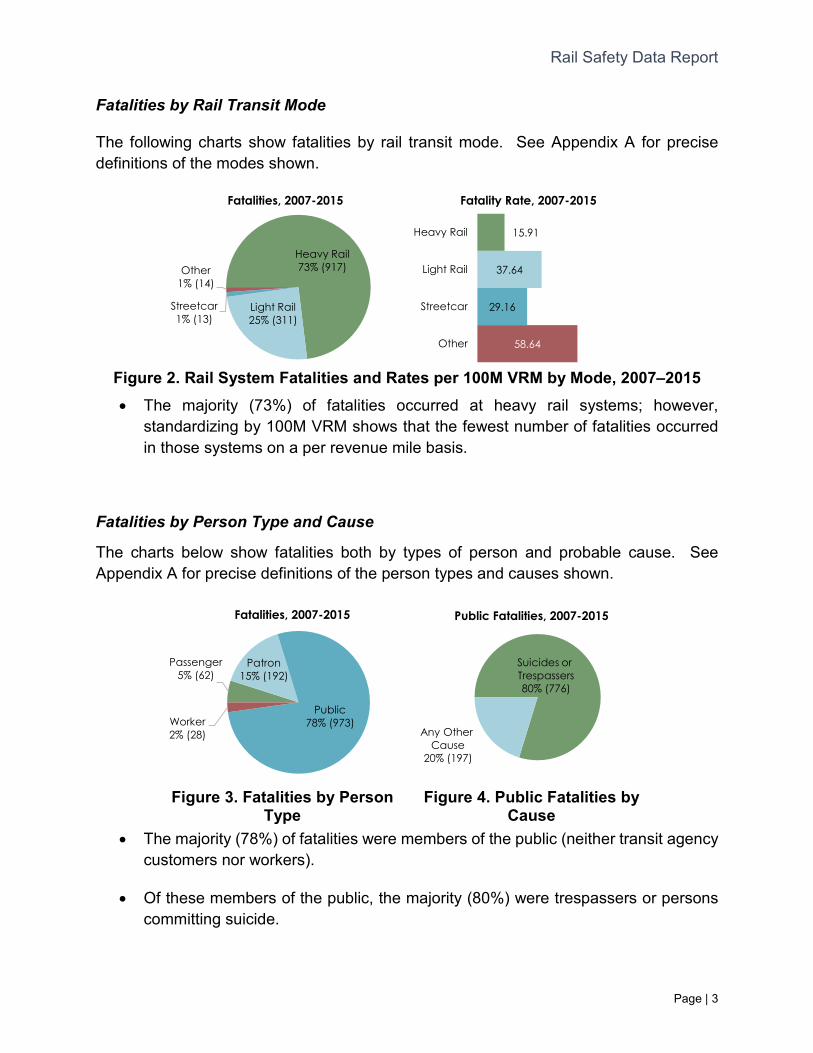
2007 2008 2009 2010 2011 2012 2013 2014 2015
Figure 5. Trend in Fatalities and Rate per 100M VRM Excluding Suicide and Trespasser Fatalities, 2007–2015
• After excluding suicide and trespasser fatalities, the trend in fatalities still increased between 2007 and 2015.
• 7.95 such fatalities per 100M VRM occurred in 2015 compared to 6.61 in 2007, reflecting an average annual increase of 2.3% between those years.
2007 2008 2009 2010 2011 2012 2013 2014 2015
2007 2008 2009 2010 2011 2012 2013 2014 2015
2007 2008 2009 2010 2011 2012 2013 2014 2015
2007 2008 2009 2010 2011 2012 2013 2014 2015
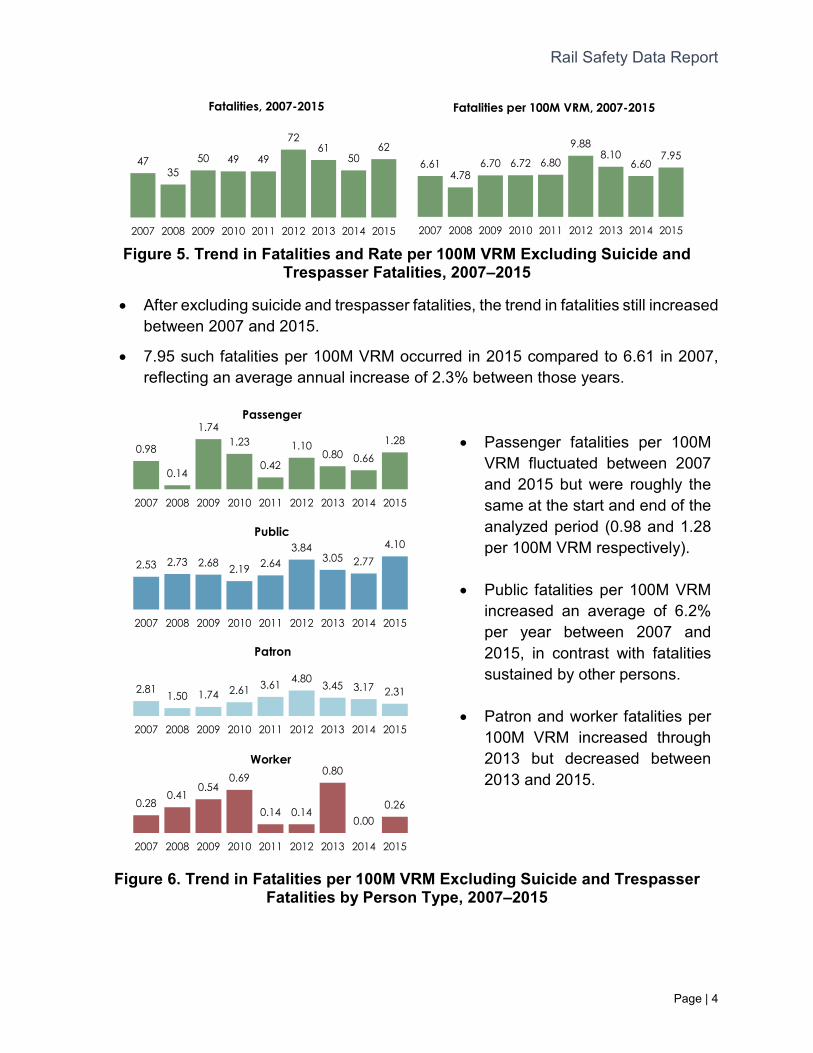
Figure 6. Trend in Fatalities per 100M VRM Excluding Suicide and Trespasser Fatalities by Person Type, 2007–2015
• Passenger fatalities per 100M VRM fluctuated between 2007 and 2015 but were roughly the same at the start and end of the analyzed period (0.98 and 1.28 per 100M VRM respectively).
• Public fatalities per 100M VRM increased an average of 6.2% per year between 2007 and 2015, in contrast with fatalities sustained by other persons.
• Patron and worker fatalities per 100M VRM increased through 2013 but decreased between 2013 and 2015.
4735
50 49 49
7261
5062
2007 2008 2009 2010 2011 2012 2013 2014 2015
Fatalities, 2007-2015
6.614.78
6.70 6.72 6.80
9.888.10
6.607.95
Fatalities per 100M VRM, 2007-2015
0.98
0.14
1.741.23
0.42
1.100.80 0.66
1.28
Passenger
2.53 2.73 2.68 2.19 2.643.84
3.05 2.774.10
Public
2.81 1.50 1.74 2.61 3.61 4.80 3.45 3.17 2.31
Patron
0.280.41
0.540.69
0.14 0.14
0.80
0.000.26
Worker
Rail Safety Data Report
Page | 5
Introduction
The Rail Safety Data Report (RSDR) is a data analysis prepared by the Federal Transit Administration (FTA). The goal of the RSDR is to present and summarize rail transit safety and security event data with a focus on patterns and trends in event frequency, fatality, and injury data within the report’s period of study. This RSDR presents data reported through the State Safety Oversight (SSO) program for the years 2007 through 2015. This report highlights totals and rates from 2015, the most recent year of data available for analysis, and provides trends across the nine-year study period.
Overview of the State Safety Oversight Program
The FTA oversees State Safety Oversight Agencies (SSOAs) to ensure a broad, systems-oriented safety strategy for the rail fixed guideway public transportation industry. Through audits, training, and outreach, FTA supports compliance with the State Safety Oversight rule at 49 C.F.R. Part 659; professional development of rail transit and state safety managers and staff; and the advancement of system safety principles in the design, engineering, construction, operations, and maintenance of rail transit systems. In accordance with 49 C.F.R. § 659.39(c), SSOAs report a variety of information to FTA, including rail transit agency event data, which give FTA greater insight into rail transit safety performance.
This RSDR analyzes event data collected through the SSOAs and provides a snapshot of the safety performance of the rail transit industry for the nine-year period of calendar year (CY) 2007 through CY 2015. Specifically, this report focuses on the types of events that occurred, their consequences in terms of fatalities and injuries, and their likely causes. This report standardizes event, fatality, and injury numbers by 100 million vehicle revenue miles (100M VRM) as reported to the National Transit Database (NTD). By identifying and analyzing this information, FTA can develop and conduct research, training, and evaluation targeted at the situations and conditions that pose the greatest risk of harm to passengers, employees, station occupants, and the public.
On March 16, 2016, FTA issued a new rule for State Safety Oversight of the rail fixed guideway public transportation industry that will replace the longstanding rule at 49 C.F.R. Part 659 (see 51 Federal Register 14230-62). The new rule, codified at 49 C.F.R. Part 674, establishes a different regimen for rail transit system notification and reporting of accidents, incidents, and occurrences to FTA and the SSOAs. However, until SSOAs and rail transit agencies come into compliance with the new rule at Part 674, they will continue to comply with the rule at Part 659.
Rail Safety Data Report
Page | 6
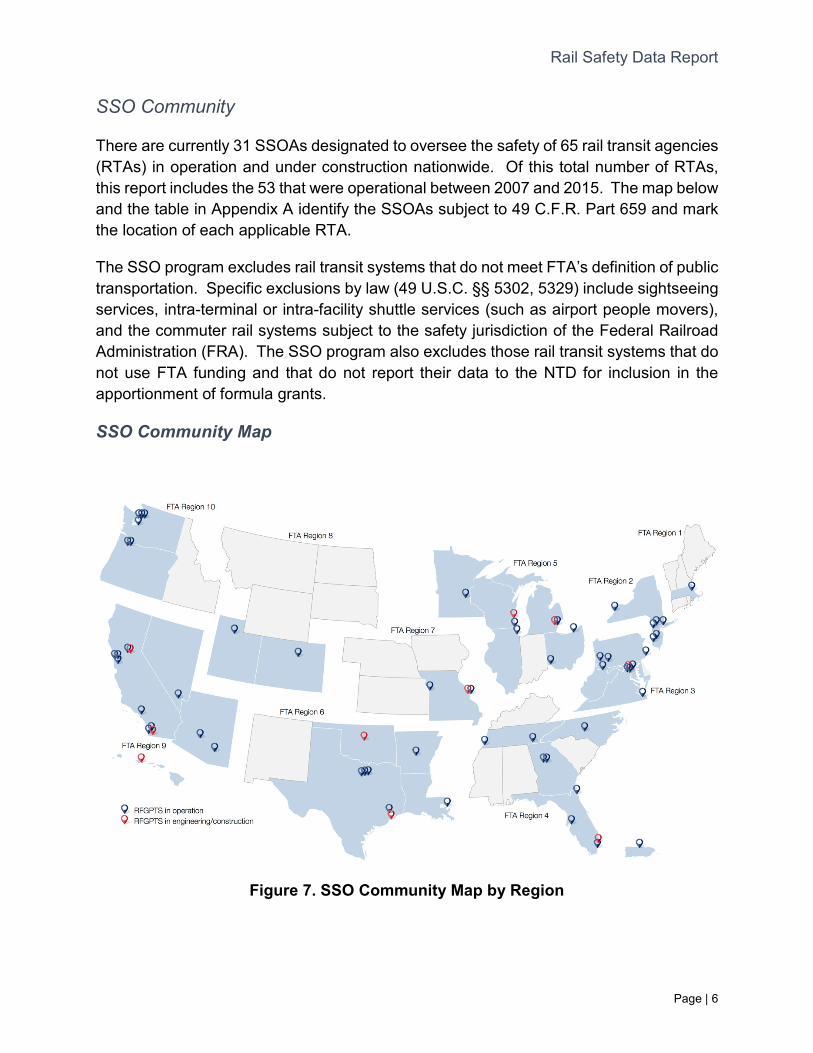
SSO Community
There are currently 31 SSOAs designated to oversee the safety of 65 rail transit agencies (RTAs) in operation and under construction nationwide. Of this total number of RTAs, this report includes the 53 that were operational between 2007 and 2015. The map below and the table in Appendix A identify the SSOAs subject to 49 C.F.R. Part 659 and mark the location of each applicable RTA.
The SSO program excludes rail transit systems that do not meet FTA’s definition of public transportation. Specific exclusions by law (49 U.S.C. §§ 5302, 5329) include sightseeing services, intra-terminal or intra-facility shuttle services (such as airport people movers), and the commuter rail systems subject to the safety jurisdiction of the Federal Railroad Administration (FRA). The SSO program also excludes those rail transit systems that do not use FTA funding and that do not report their data to the NTD for inclusion in the apportionment of formula grants.
SSO Community Map
Figure 7. SSO Community Map by Region
Rail Safety Data Report
Page | 7
Operating RTAs
As of the date of this report, there are 56 RTAs in operation across the country, with an additional 9 in engineering or under construction. Of these 56 RTAs, 13 operate heavy rail, 23 operate light rail, and 2 operate hybrid rail (included in the light rail totals in this analysis). Nineteen operate streetcars and 10 operate other rail modes, including 6 automated guideway systems, 3 inclined plane systems, and 1 cable car system. Nine agencies operate 2 modes and a single agency (the San Francisco Municipal Railway) operates 3 modes, accounting for the difference in total agencies and the sum of modes operated. See Appendix A for a full list of agencies and the modes they operate.
Limitations of This Analysis
This report presents safety data as provided to the SSO program and normalized using service data as provided to the NTD program. All analyses in this report provide descriptive statistics illustrating the distribution and trends in rail transit safety outcomes between 2007 and 2015. This report does not estimate or otherwise draw conclusions on safety outcomes beyond 2015.
Rail Safety Data Report
Page | 8
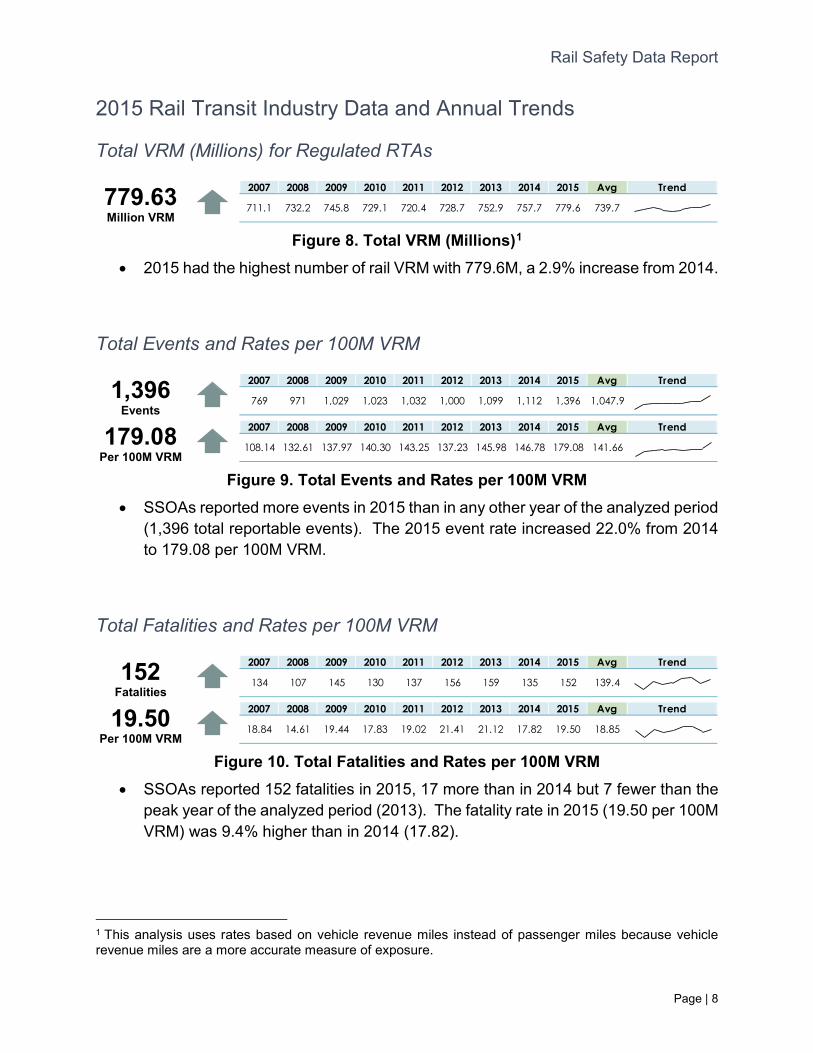
2015 Rail Transit Industry Data and Annual Trends
Total VRM (Millions) for Regulated RTAs
779.63 Million VRM
2007 2008 2009 2010 2011 2012 2013 2014 2015 Avg Trend
711.1 732.2 745.8 729.1 720.4 728.7 752.9 757.7 779.6 739.7
Figure 8. Total VRM (Millions)1 • 2015 had the highest number of rail VRM with 779.6M, a 2.9% increase from 2014.
Total Events and Rates per 100M VRM
1,396 Events
179.08 Per 100M VRM
2007 2008 2009 2010 2011 2012 2013 2014 2015 Avg Trend
769 971 1,029 1,023 1,032 1,000 1,099 1,112 1,396 1,047.9
2007 2008 2009 2010 2011 2012 2013 2014 2015 Avg Trend
108.14 132.61 137.97 140.30 143.25 137.23 145.98 146.78 179.08 141.66
Figure 9. Total Events and Rates per 100M VRM • SSOAs reported more events in 2015 than in any other year of the analyzed period
(1,396 total reportable events). The 2015 event rate increased 22.0% from 2014 to 179.08 per 100M VRM.
Total Fatalities and Rates per 100M VRM
152 Fatalities
19.50 Per 100M VRM
2007 2008 2009 2010 2011 2012 2013 2014 2015 Avg Trend
134 107 145 130 137 156 159 135 152 139.4
2007 2008 2009 2010 2011 2012 2013 2014 2015 Avg Trend
18.84 14.61 19.44 17.83 19.02 21.41 21.12 17.82 19.50 18.85
Figure 10. Total Fatalities and Rates per 100M VRM • SSOAs reported 152 fatalities in 2015, 17 more than in 2014 but 7 fewer than the
peak year of the analyzed period (2013). The fatality rate in 2015 (19.50 per 100M VRM) was 9.4% higher than in 2014 (17.82).
1 This analysis uses rates based on vehicle revenue miles instead of passenger miles because vehicle revenue miles are a more accurate measure of exposure.
Rail Safety Data Report
Page | 9
Total Injuries and Rates per 100M VRM
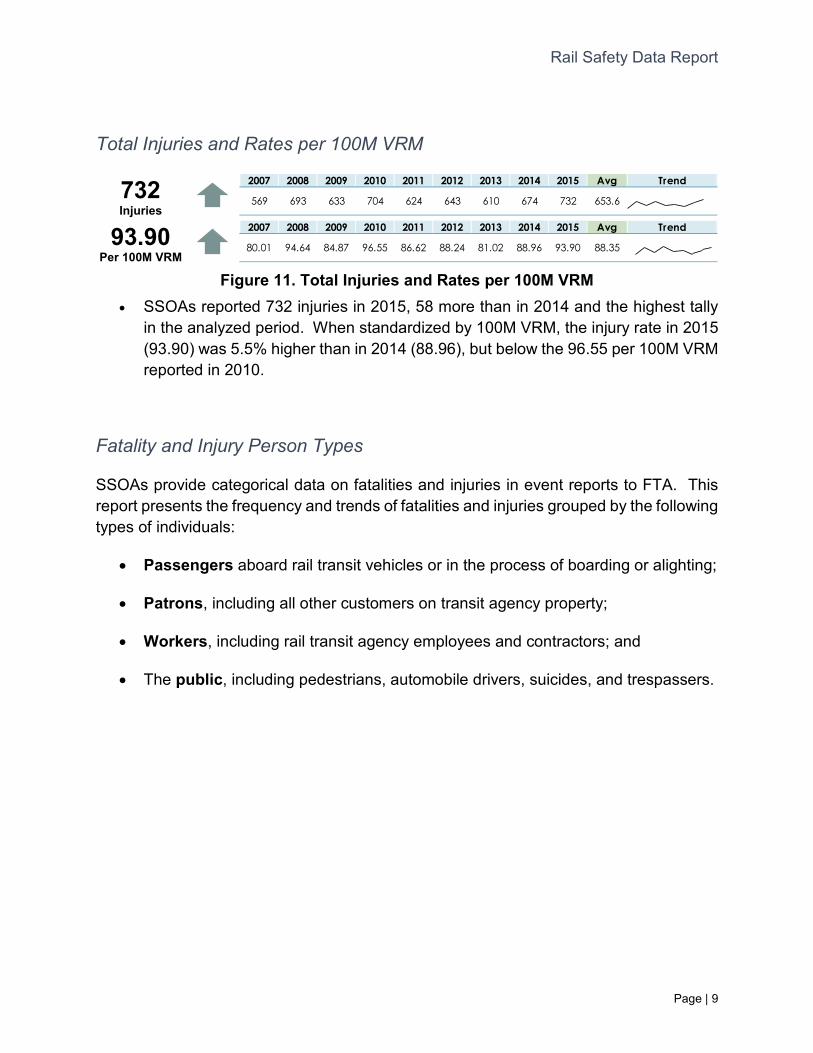
Figure 11. Total Injuries and Rates per 100M VRM
732 Injuries
93.90 Per 100M VRM
2007 2008 2009 2010 2011 2012 2013 2014 2015 Avg Trend
569 693 633 704 624 643 610 674 732 653.6
2007 2008 2009 2010 2011 2012 2013 2014 2015 Avg Trend
80.01 94.64 84.87 96.55 86.62 88.24 81.02 88.96 93.90 88.35
• SSOAs reported 732 injuries in 2015, 58 more than in 2014 and the highest tally in the analyzed period. When standardized by 100M VRM, the injury rate in 2015 (93.90) was 5.5% higher than in 2014 (88.96), but below the 96.55 per 100M VRM reported in 2010.
Fatality and Injury Person Types
SSOAs provide categorical data on fatalities and injuries in event reports to FTA. This report presents the frequency and trends of fatalities and injuries grouped by the following types of individuals:
• Passengers aboard rail transit vehicles or in the process of boarding or alighting;
• Patrons, including all other customers on transit agency property;
• Workers, including rail transit agency employees and contractors; and
• The public, including pedestrians, automobile drivers, suicides, and trespassers.
Rail Safety Data Report
Page | 10
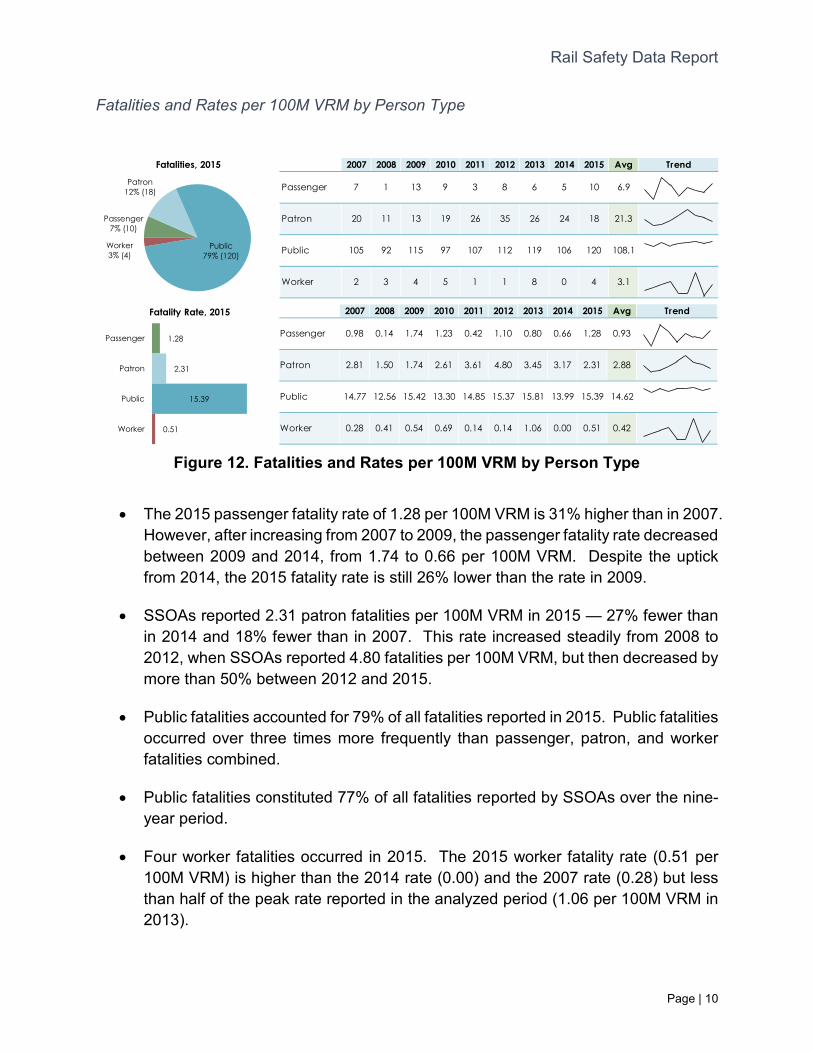
Fatalities and Rates per 100M VRM by Person Type
Figure 12. Fatalities and Rates per 100M VRM by Person Type
2007 2008 2009 2010 2011 2012 2013 2014 2015 Avg Trend
Passenger 7 1 13 9 3 8 6 5 10 6.9
Patron 20 11 13 19 26 35 26 24 18 21.3
Public 105 92 115 97 107 112 119 106 120 108.1
Worker 2 3 4 5 1 1 8 0 4 3.1
2007 2008 2009 2010 2011 2012 2013 2014 2015 Avg Trend
Passenger 0.98 0.14 1.74 1.23 0.42 1.10 0.80 0.66 1.28 0.93
Patron 2.81 1.50 1.74 2.61 3.61 4.80 3.45 3.17 2.31 2.88
Public 14.77 12.56 15.42 13.30 14.85 15.37 15.81 13.99 15.39 14.62
Worker 0.28 0.41 0.54 0.69 0.14 0.14 1.06 0.00 0.51 0.42
• The 2015 passenger fatality rate of 1.28 per 100M VRM is 31% higher than in 2007. However, after increasing from 2007 to 2009, the passenger fatality rate decreased between 2009 and 2014, from 1.74 to 0.66 per 100M VRM. Despite the uptick from 2014, the 2015 fatality rate is still 26% lower than the rate in 2009.
• SSOAs reported 2.31 patron fatalities per 100M VRM in 2015 — 27% fewer than in 2014 and 18% fewer than in 2007. This rate increased steadily from 2008 to 2012, when SSOAs reported 4.80 fatalities per 100M VRM, but then decreased by more than 50% between 2012 and 2015.
• Public fatalities accounted for 79% of all fatalities reported in 2015. Public fatalities occurred over three times more frequently than passenger, patron, and worker fatalities combined.
• Public fatalities constituted 77% of all fatalities reported by SSOAs over the nine-year period.
• Four worker fatalities occurred in 2015. The 2015 worker fatality rate (0.51 per 100M VRM) is higher than the 2014 rate (0.00) and the 2007 rate (0.28) but less than half of the peak rate reported in the analyzed period (1.06 per 100M VRM in 2013).
Passenger7% (10)
Patron12% (18)
Public79% (120)
Worker3% (4)
Fatality Rate, 2015
Fatalities, 2015
1.28
2.31
15.39
0.51
Passenger
Patron
Public
Worker
Rail Safety Data Report
Page | 11
Fatalities Fatalities per 100M VRM Passengers
2007 2008 2009 2010 2011 2012 2013 2014 2015
Patrons
Public
Workers
2007 2008 2009 2010 2011 2012 2013 2014 2015
4.80
3.45 3.17
2.31
2012 2013 2014 2015
2007 2008 2009 2010 2011 2012 2013 2014 2015 2007 2008 2009 2010 2011 2012 2013 2014 2015
2007 2008 2009 2010 2011 2012 2013 2014 2015
0.14 0.14
1.06
0.00
0.51
2011 2012 2013 2014 2015
Figure 13. Fatality and Fatality Rate Trends by Person Type
7
1
13
9
3
8
65
10
2007 2008 2009 2010 2011 2012 2013 2014 2015
0.98
0.14
1.74
1.23
0.42
1.10
0.800.66
1.28
20
11 13
19
26
35
26 24
18 2.81
1.50 1.74
2.61
3.61
2007 2008 2009 2010 2011
10592
11597
107 112 119106
120 14.7712.56
15.4213.30
14.85 15.37 15.8113.99
15.39
23
45
1 1
8
0
4
0.280.41
0.540.69
2007 2008 2009 2010
Rail Safety Data Report
Page | 12
Injuries and Rates per 100M VRM by Person Type
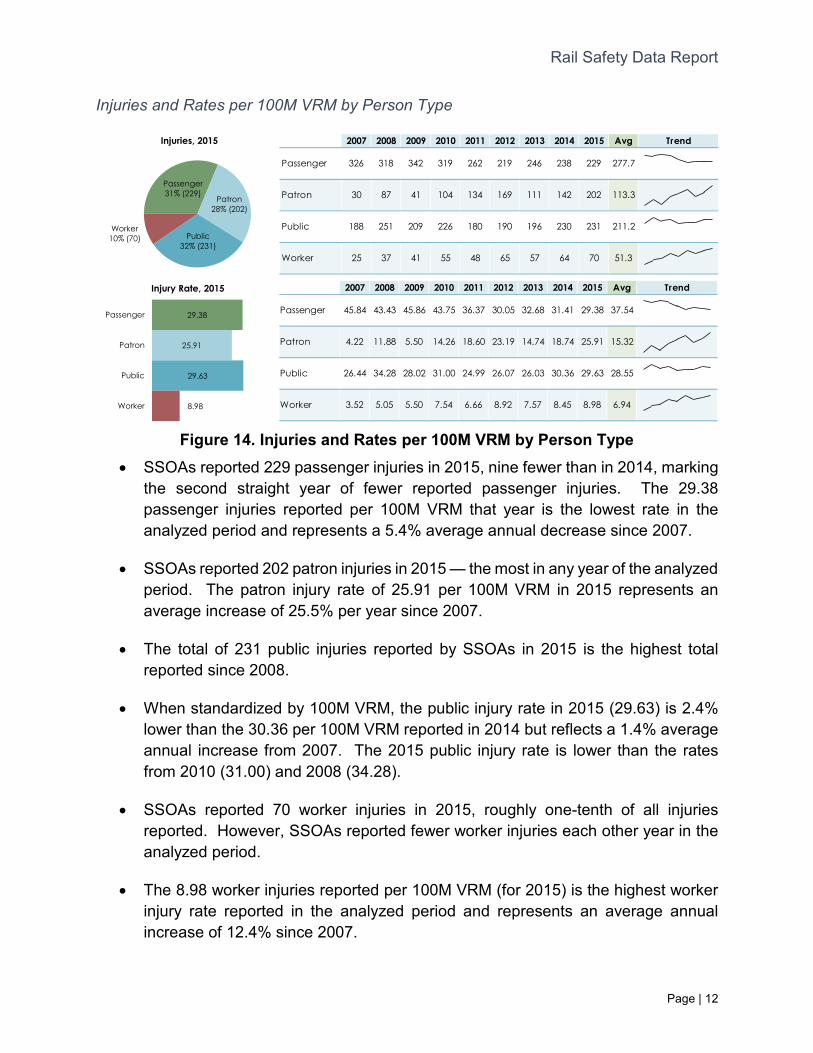
Figure 14. Injuries and Rates per 100M VRM by Person Type
2007 2008 2009 2010 2011 2012 2013 2014 2015 Avg Trend
Passenger 326 318 342 319 262 219 246 238 229 277.7
Patron 30 87 41 104 134 169 111 142 202 113.3
Public 188 251 209 226 180 190 196 230 231 211.2
Worker 25 37 41 55 48 65 57 64 70 51.3
2007 2008 2009 2010 2011 2012 2013 2014 2015 Avg Trend
Passenger 45.84 43.43 45.86 43.75 36.37 30.05 32.68 31.41 29.38 37.54
Patron 4.22 11.88 5.50 14.26 18.60 23.19 14.74 18.74 25.91 15.32
Public 26.44 34.28 28.02 31.00 24.99 26.07 26.03 30.36 29.63 28.55
Worker 3.52 5.05 5.50 7.54 6.66 8.92 7.57 8.45 8.98 6.94
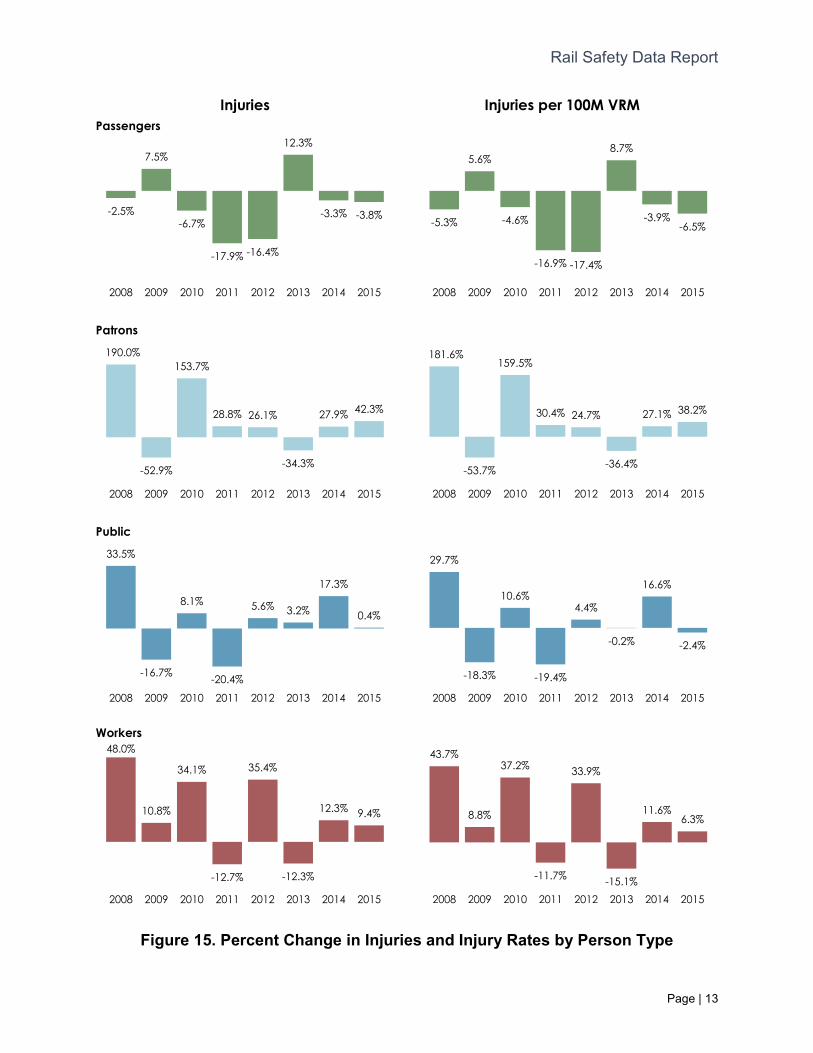
• SSOAs reported 229 passenger injuries in 2015, nine fewer than in 2014, marking the second straight year of fewer reported passenger injuries. The 29.38 passenger injuries reported per 100M VRM that year is the lowest rate in the analyzed period and represents a 5.4% average annual decrease since 2007.
• SSOAs reported 202 patron injuries in 2015 — the most in any year of the analyzed period. The patron injury rate of 25.91 per 100M VRM in 2015 represents an average increase of 25.5% per year since 2007.
• The total of 231 public injuries reported by SSOAs in 2015 is the highest total reported since 2008.
• When standardized by 100M VRM, the public injury rate in 2015 (29.63) is 2.4% lower than the 30.36 per 100M VRM reported in 2014 but reflects a 1.4% average annual increase from 2007. The 2015 public injury rate is lower than the rates from 2010 (31.00) and 2008 (34.28).
• SSOAs reported 70 worker injuries in 2015, roughly one-tenth of all injuries reported. However, SSOAs reported fewer worker injuries each other year in the analyzed period.
• The 8.98 worker injuries reported per 100M VRM (for 2015) is the highest worker injury rate reported in the analyzed period and represents an average annual increase of 12.4% since 2007.
Passenger31% (229)
Patron28% (202)
Public32% (231)
Worker10% (70)
Injuries, 2015
29.38
25.91
29.63
8.98
Passenger
Patron
Public
Worker
Injury Rate, 2015
Rail Safety Data Report
Page | 13
Injuries
7.5%
Injuries per 100M VRM
-5.3%
5.6%
-4.6%
-16.9% -17.4%
8.7%
-3.9%-6.5%
Passengers
2008 2009 2010 2011 2012 2013 2014 2015
Patrons
-52.9% -34.3%
2008 2009 2010 2011 2012 2013 2014 2015
-53.7% -36.4%
2008 2009 2010 2011 2012 2013 2014 2015
Public
33.5%
-20.4%
2008 2009 2010 2012 2013 2014 2015 2008 2009 2010 2011 2012 2013 2014 2015
-12.7% -12.3%
2008 2009 2010 2011 2012 2013 2014 2015
-11.7% -15.1%2008 2009 2010 2011 2012 2013 2014 2015
Figure 15. Percent Change in Injuries and Injury Rates by Person Type
-2.5%-6.7%
-17.9% -16.4%
12.3%
-3.3% -3.8%
2008 2009 2010 2011 2012 2013 2014 2015
190.0%153.7%
28.8% 26.1% 27.9% 42.3%
181.6%159.5%
30.4% 24.7% 27.1% 38.2%
-16.7%
8.1% 5.6% 3.2%
17.3%
0.4%
2011
29.7%
-18.3%
10.6%4.4%
-0.2%
16.6%
-2.4%
-19.4%
Workers 48.0%
10.8%
34.1% 35.4%
12.3% 9.4%
43.7%
8.8%
37.2% 33.9%
11.6%6.3%
Rail Safety Data Report
Page | 14
Events by Mode
The FTA divides rail transit service into nine distinct modes. Seven of these modes fall under the SSO program; the Federal Railroad Administration (FRA) has safety oversight for the remaining two (Commuter Rail and Alaska Railroad). This report groups the seven SSO-applicable modes into four modal categories for analysis purposes. See Appendix A for details on these modal groupings. The analyses in this section present the trend and distribution of events using the four modal categories shown below.
Mode Description
Heavy Rail Local rail service typically characterized by long trains, exclusive right-of-way (ROW), and powered by a third rail.
Light Rail Local rail service typically characterized by shorter trains, a mix of street-running and exclusive ROW with grade crossings and powered by overhead wires.
Streetcar Local rail service typically characterized by street running, single-car trains powered by overhead wires.
Other Any other local rail services with unique operating characteristics (cable cars, inclined planes, monorails, etc.)
Table 1. Modal Categories
Rail Safety Data Report
Page | 15
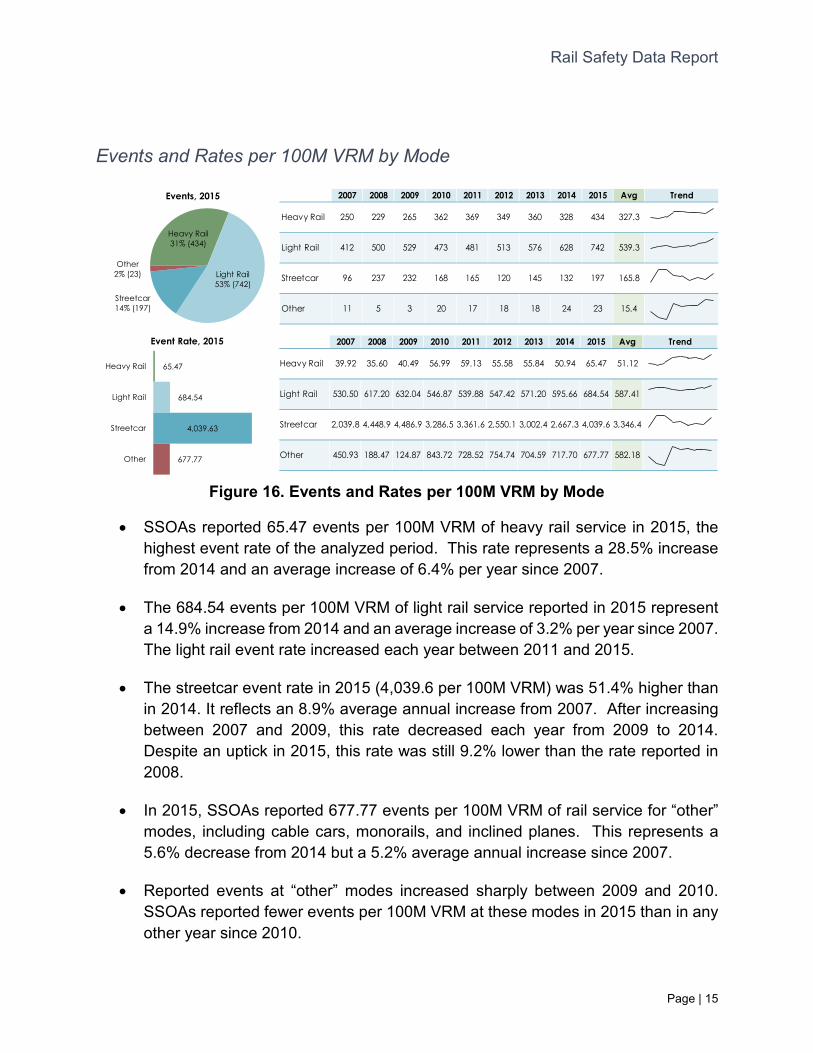
Events and Rates per 100M VRM by Mode
Figure 16. Events and Rates per 100M VRM by Mode
2007 2008 2009 2010 2011 2012 2013 2014 2015 Avg Trend
Heavy Rail 250 229 265 362 369 349 360 328 434 327.3
Light Rail 412 500 529 473 481 513 576 628 742 539.3
Streetcar 96 237 232 168 165 120 145 132 197 165.8
Other 11 5 3 20 17 18 18 24 23 15.4
2007 2008 2009 2010 2011 2012 2013 2014 2015 Avg Trend
Heavy Rail 39.92 35.60 40.49 56.99 59.13 55.58 55.84 50.94 65.47 51.12
Light Rail 530.50 617.20 632.04 546.87 539.88 547.42 571.20 595.66 684.54 587.41
Streetcar 2,039.8 4,448.9 4,486.9 3,286.5 3,361.6 2,550.1 3,002.4 2,667.3 4,039.6 3,346.4
Other 450.93 188.47 124.87 843.72 728.52 754.74 704.59 717.70 677.77 582.18
• SSOAs reported 65.47 events per 100M VRM of heavy rail service in 2015, the highest event rate of the analyzed period. This rate represents a 28.5% increase from 2014 and an average increase of 6.4% per year since 2007.
• The 684.54 events per 100M VRM of light rail service reported in 2015 represent a 14.9% increase from 2014 and an average increase of 3.2% per year since 2007. The light rail event rate increased each year between 2011 and 2015.
• The streetcar event rate in 2015 (4,039.6 per 100M VRM) was 51.4% higher than in 2014. It reflects an 8.9% average annual increase from 2007. After increasing between 2007 and 2009, this rate decreased each year from 2009 to 2014. Despite an uptick in 2015, this rate was still 9.2% lower than the rate reported in 2008.
• In 2015, SSOAs reported 677.77 events per 100M VRM of rail service for “other” modes, including cable cars, monorails, and inclined planes. This represents a 5.6% decrease from 2014 but a 5.2% average annual increase since 2007.
• Reported events at “other” modes increased sharply between 2009 and 2010. SSOAs reported fewer events per 100M VRM at these modes in 2015 than in any other year since 2010.
Heavy Rail31% (434)
Light Rail53% (742)
Streetcar14% (197)
Other2% (23)
Event Rate, 2015
Events, 2015
65.47
684.54
4,039.63
677.77
Heavy Rail
Light Rail
Streetcar
Other
Rail Safety Data Report
Page | 16
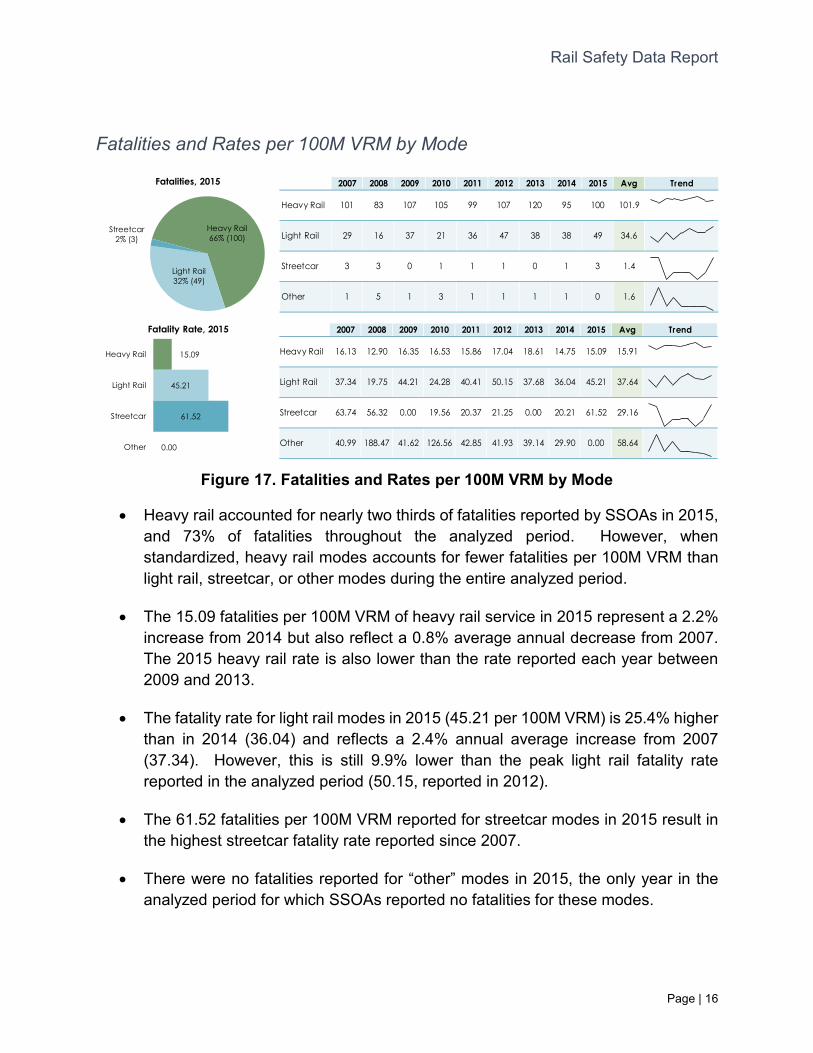
Fatalities and Rates per 100M VRM by Mode
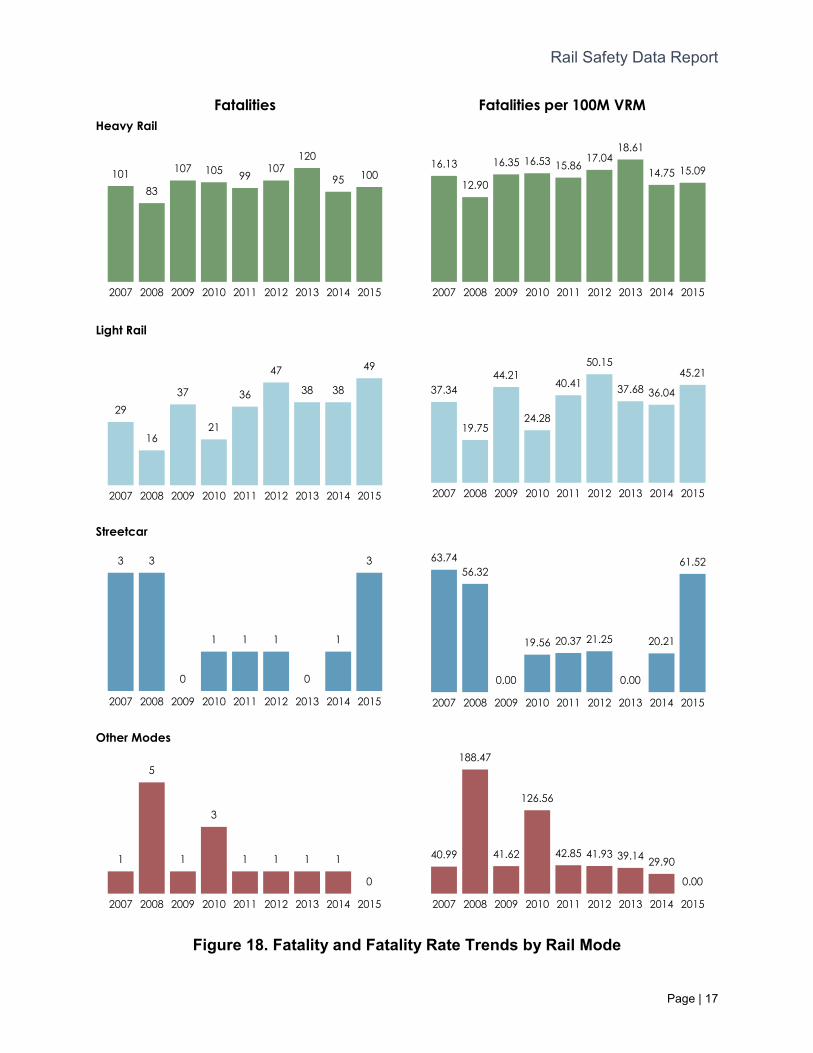
Figure 17. Fatalities and Rates per 100M VRM by Mode
2007 2008 2009 2010 2011 2012 2013 2014 2015 Avg Trend
Heavy Rail 101 83 107 105 99 107 120 95 100 101.9
Light Rail 29 16 37 21 36 47 38 38 49 34.6
Streetcar 3 3 0 1 1 1 0 1 3 1.4
Other 1 5 1 3 1 1 1 1 0 1.6
2007 2008 2009 2010 2011 2012 2013 2014 2015 Avg Trend
Heavy Rail 16.13 12.90 16.35 16.53 15.86 17.04 18.61 14.75 15.09 15.91
Light Rail 37.34 19.75 44.21 24.28 40.41 50.15 37.68 36.04 45.21 37.64
Streetcar 63.74 56.32 0.00 19.56 20.37 21.25 0.00 20.21 61.52 29.16
Other 40.99 188.47 41.62 126.56 42.85 41.93 39.14 29.90 0.00 58.64
• Heavy rail accounted for nearly two thirds of fatalities reported by SSOAs in 2015, and 73% of fatalities throughout the analyzed period. However, when standardized, heavy rail modes accounts for fewer fatalities per 100M VRM than light rail, streetcar, or other modes during the entire analyzed period.
• The 15.09 fatalities per 100M VRM of heavy rail service in 2015 represent a 2.2% increase from 2014 but also reflect a 0.8% average annual decrease from 2007. The 2015 heavy rail rate is also lower than the rate reported each year between 2009 and 2013.
• The fatality rate for light rail modes in 2015 (45.21 per 100M VRM) is 25.4% higher than in 2014 (36.04) and reflects a 2.4% annual average increase from 2007 (37.34). However, this is still 9.9% lower than the peak light rail fatality rate reported in the analyzed period (50.15, reported in 2012).
• The 61.52 fatalities per 100M VRM reported for streetcar modes in 2015 result in the highest streetcar fatality rate reported since 2007.
• There were no fatalities reported for “other” modes in 2015, the only year in the analyzed period for which SSOAs reported no fatalities for these modes.
Heavy Rail66% (100)
Light Rail32% (49)
Streetcar2% (3)
Fatalities, 2015
15.09
45.21
61.52
0.00
Heavy Rail
Light Rail
Streetcar
Other
Fatality Rate, 2015
Rail Safety Data Report
Page | 17
Fatalities Fatalities per 100M VRM Heavy Rail
2007 2008 2009 2010 2011 2012 2013 2014 2015 2007 2008 2009 2010 2011 2012 2013 2014 2015
Light Rail
2007 2008 2009 2010 2011 2012 2013 2014 2015 2007 2008 2009 2010 2011 2012 2013 2014 2015
Streetcar
3 3
2007 2008 2009 2010 2011 2012 2013 2014 2015
21.25
0.00
20.21
61.52
2012 2013 2014 2015
Other Modes
Figure 18. Fatality and Fatality Rate Trends by Rail Mode
10183
107 105 99107
120
95 10016.13
12.90
16.35 16.53 15.8617.04
18.61
14.75 15.09
29
16
37
21
36
47
38 38
49
37.34
19.75
44.21
24.28
40.41
50.15
37.68 36.04
45.21
0
1 1 1
0
1
3 63.7456.32
0.00
19.56 20.37
2007 2008 2009 2010 2011
1
5
1
3
1 1 1 1
0
2007 2008 2009 2010 2011 2012 2013 2014 2015
29.90
0.00
2014 2015
40.99 41.62
2007 2008 2009
188.47
126.56
42.85 41.93 39.14
2010 2011 2012 2013
Rail Safety Data Report
Page | 18
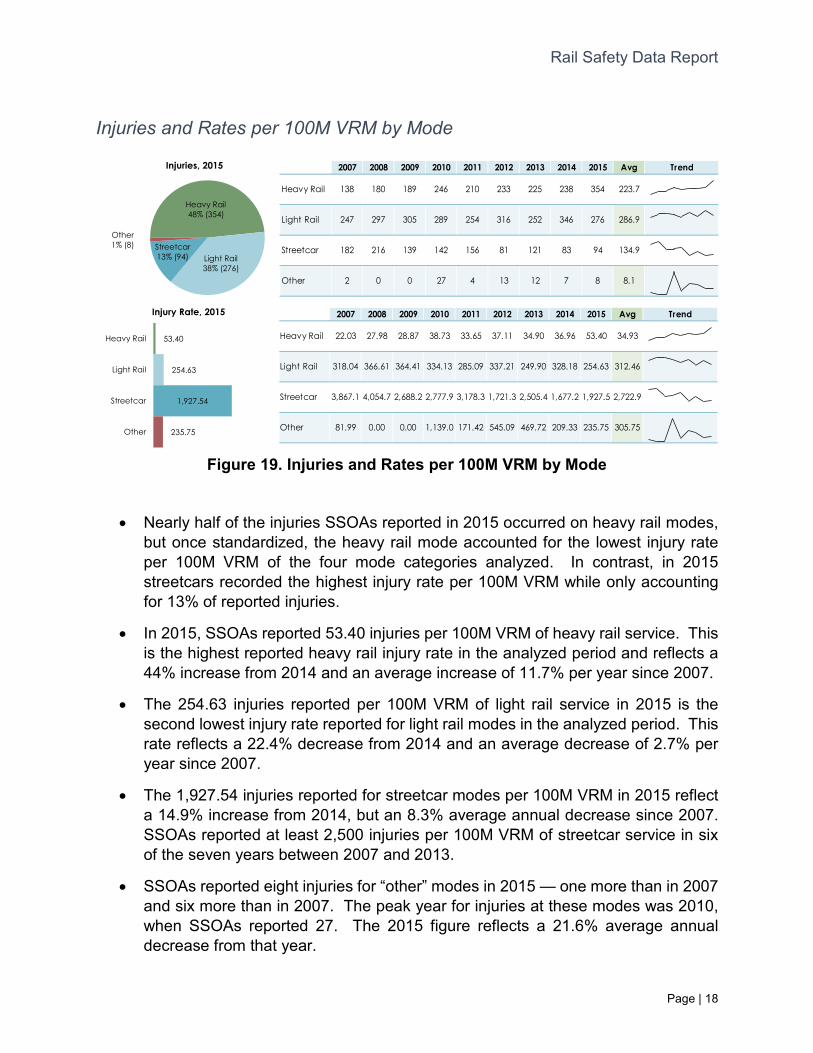
Injuries and Rates per 100M VRM by Mode
Figure 19. Injuries and Rates per 100M VRM by Mode
2007 2008 2009 2010 2011 2012 2013 2014 2015 Avg Trend
Heavy Rail 138 180 189 246 210 233 225 238 354 223.7
Light Rail 247 297 305 289 254 316 252 346 276 286.9
Streetcar 182 216 139 142 156 81 121 83 94 134.9
Other 2 0 0 27 4 13 12 7 8 8.1
2007 2008 2009 2010 2011 2012 2013 2014 2015 Avg Trend
Heavy Rail 22.03 27.98 28.87 38.73 33.65 37.11 34.90 36.96 53.40 34.93
Light Rail 318.04 366.61 364.41 334.13 285.09 337.21 249.90 328.18 254.63 312.46
Streetcar 3,867.1 4,054.7 2,688.2 2,777.9 3,178.3 1,721.3 2,505.4 1,677.2 1,927.5 2,722.9
Other 81.99 0.00 0.00 1,139.0 171.42 545.09 469.72 209.33 235.75 305.75
• Nearly half of the injuries SSOAs reported in 2015 occurred on heavy rail modes, but once standardized, the heavy rail mode accounted for the lowest injury rate per 100M VRM of the four mode categories analyzed. In contrast, in 2015 streetcars recorded the highest injury rate per 100M VRM while only accounting for 13% of reported injuries.
• In 2015, SSOAs reported 53.40 injuries per 100M VRM of heavy rail service. This is the highest reported heavy rail injury rate in the analyzed period and reflects a 44% increase from 2014 and an average increase of 11.7% per year since 2007.
• The 254.63 injuries reported per 100M VRM of light rail service in 2015 is the second lowest injury rate reported for light rail modes in the analyzed period. This rate reflects a 22.4% decrease from 2014 and an average decrease of 2.7% per year since 2007.
• The 1,927.54 injuries reported for streetcar modes per 100M VRM in 2015 reflect a 14.9% increase from 2014, but an 8.3% average annual decrease since 2007. SSOAs reported at least 2,500 injuries per 100M VRM of streetcar service in six of the seven years between 2007 and 2013.
• SSOAs reported eight injuries for “other” modes in 2015 — one more than in 2007 and six more than in 2007. The peak year for injuries at these modes was 2010, when SSOAs reported 27. The 2015 figure reflects a 21.6% average annual decrease from that year.
Heavy Rail48% (354)
Light Rail38% (276)
Streetcar13% (94)
Other1% (8)
Injuries, 2015
53.40
254.63
1,927.54
235.75
Heavy Rail
Light Rail
Streetcar
Other
Injury Rate, 2015
Rail Safety Data Report
Page | 19
Injuries Injuries per 100M VRM Heavy Rail
Light Rail
Streetcar
Other Modes
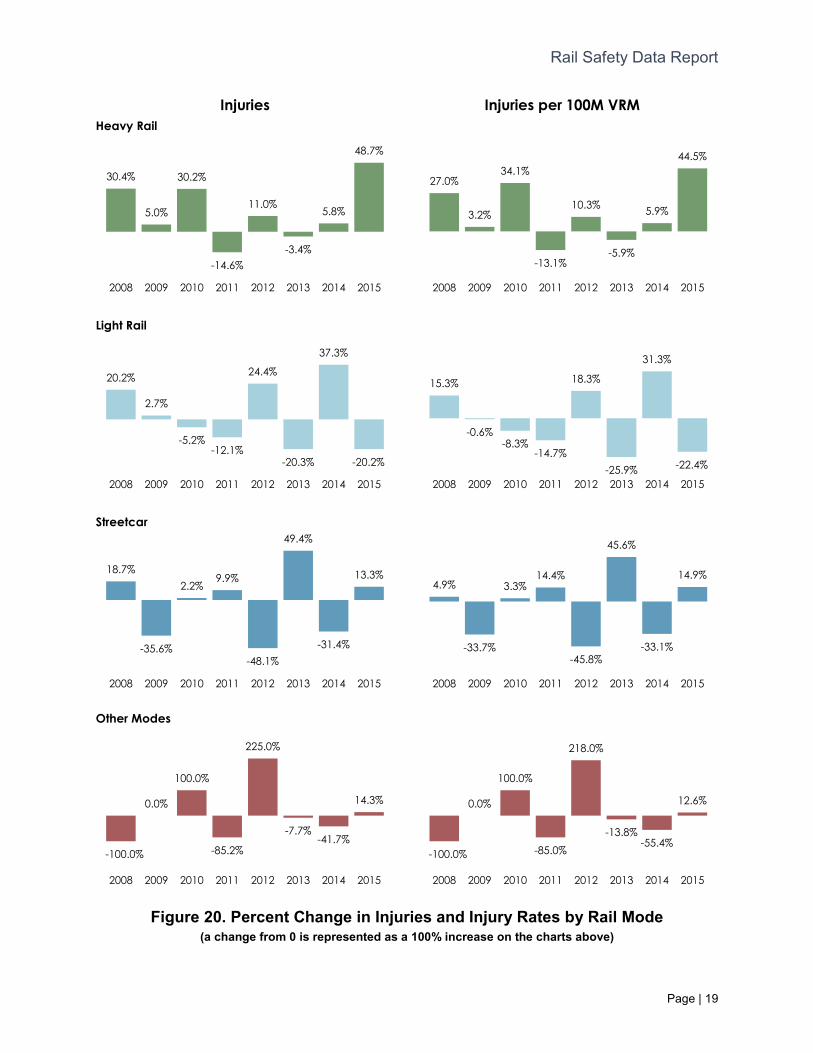
Figure 20. Percent Change in Injuries and Injury Rates by Rail Mode (a change from 0 is represented as a 100% increase on the charts above)
30.4%
5.0%
30.2%
11.0%5.8%
48.7%
-14.6%-3.4%
2008 2009 2010 2011 2012 2013 2014 2015
27.0%
3.2%
34.1%
10.3% 5.9%
44.5%
-13.1%
2008 2009 2010 2011 2012
-5.9%
2013 2014 2015
20.2%
2.7%
-5.2%-12.1%
24.4%
37.3%
-20.3% -20.2%
2008 2009 2010 2011 2012 2013 2014 2015
15.3%
-0.6%-8.3%
-14.7%
2008 2009 2010 2011
18.3%
31.3%
-25.9% -22.4%
2012 2013 2014 2015
18.7%
-35.6%
2.2%9.9%
49.4%
-48.1%-31.4%
13.3%
2008 2009 2010 2011 2012 2013 2014 2015
4.9%
-33.7%
3.3%14.4%
-45.8%
45.6%
-33.1%
14.9%
2008 2009 2010 2011 2012 2013 2014 2015
-100.0% -85.2%
-7.7%-41.7%
0.0%
100.0%
225.0%
14.3%
2008 2009 2010 2011 2012 2013 2014 2015
-100.0%
2008 2009 2010 2011 2012 2013 2014 2015
0.0%
100.0%
-85.0%
218.0%
-13.8%-55.4%
12.6%
Rail Safety Data Report
Page | 20
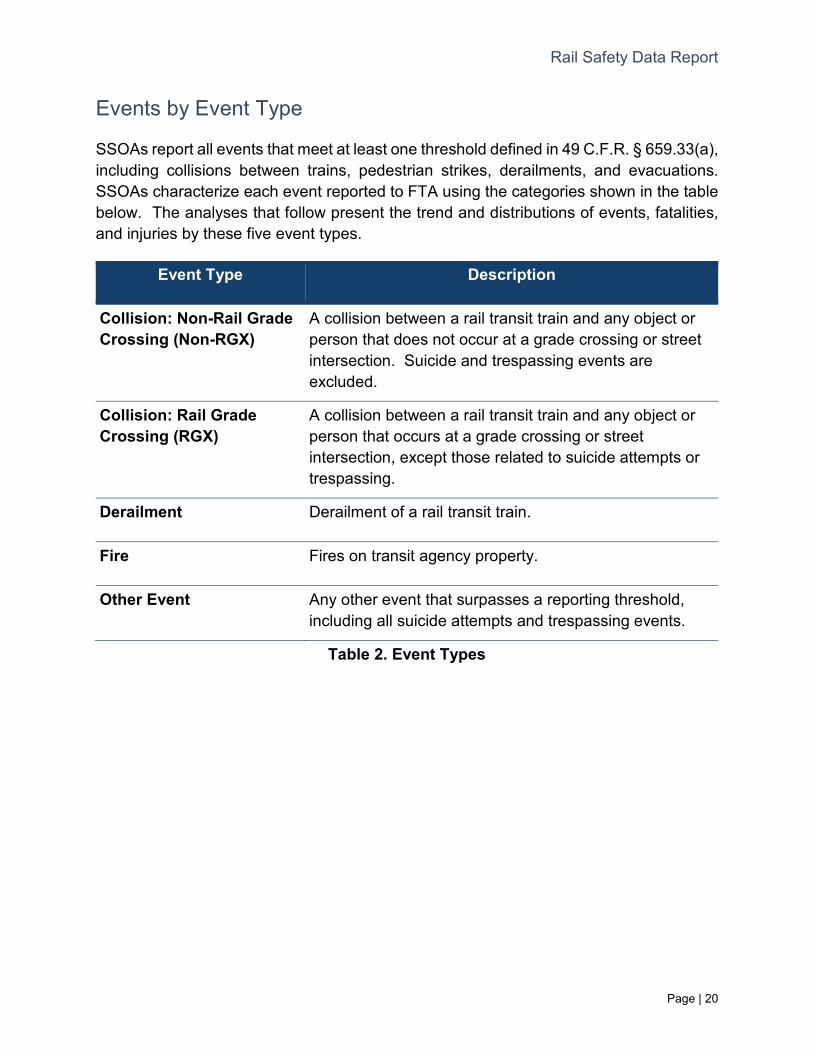
Events by Event Type
SSOAs report all events that meet at least one threshold defined in 49 C.F.R. § 659.33(a), including collisions between trains, pedestrian strikes, derailments, and evacuations. SSOAs characterize each event reported to FTA using the categories shown in the table below. The analyses that follow present the trend and distributions of events, fatalities, and injuries by these five event types.
Event Type Description
Collision: Non-Rail Grade Crossing (Non-RGX)
A collision between a rail transit train and any object or person that does not occur at a grade crossing or street intersection. Suicide and trespassing events are excluded.
Collision: Rail Grade Crossing (RGX)
A collision between a rail transit train and any object or person that occurs at a grade crossing or street intersection, except those related to suicide attempts or trespassing.
Derailment Derailment of a rail transit train.
Fire Fires on transit agency property.
Other Event Any other event that surpasses a reporting threshold, including all suicide attempts and trespassing events.
Table 2. Event Types
Rail Safety Data Report
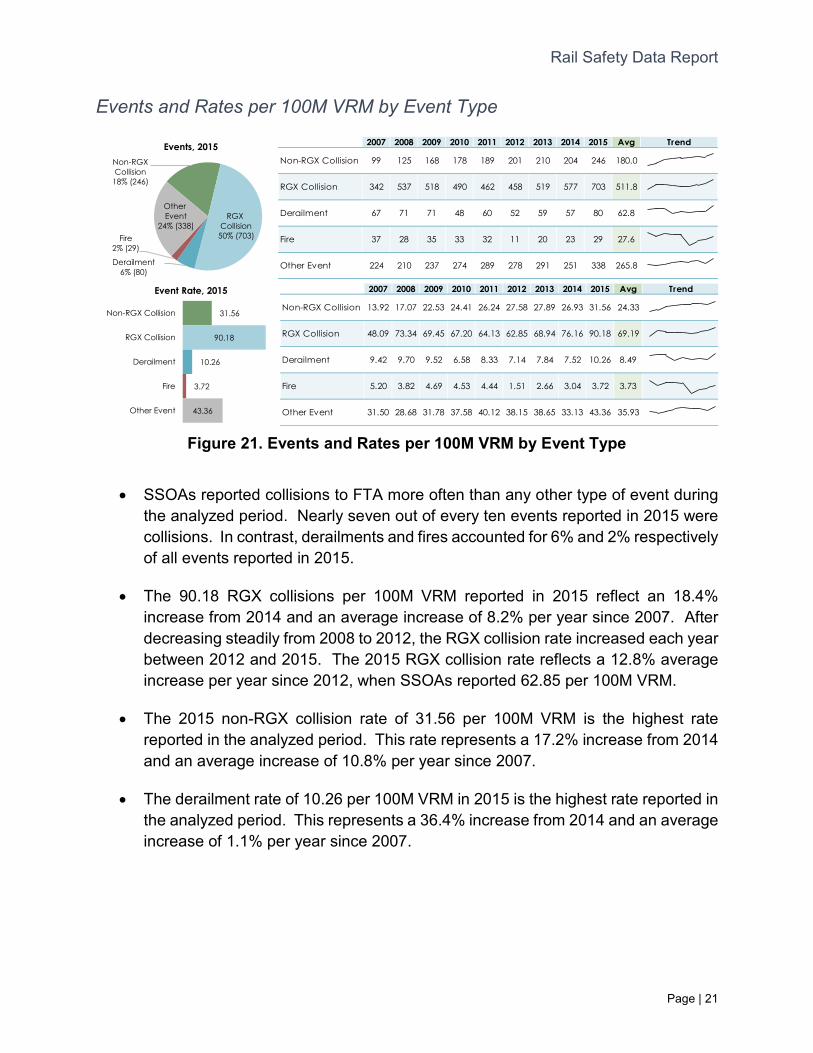
Page | 21
Events and Rates per 100M VRM by Event Type
Figure 21. Events and Rates per 100M VRM by Event Type
2007 2008 2009 2010 2011 2012 2013 2014 2015 Avg Trend
Non-RGX Collision 99 125 168 178 189 201 210 204 246 180.0
RGX Collision 342 537 518 490 462 458 519 577 703 511.8
Derailment 67 71 71 48 60 52 59 57 80 62.8
Fire 37 28 35 33 32 11 20 23 29 27.6
Other Event 224 210 237 274 289 278 291 251 338 265.8
2007 2008 2009 2010 2011 2012 2013 2014 2015 Avg Trend
Non-RGX Collision 13.92 17.07 22.53 24.41 26.24 27.58 27.89 26.93 31.56 24.33
RGX Collision 48.09 73.34 69.45 67.20 64.13 62.85 68.94 76.16 90.18 69.19
Derailment 9.42 9.70 9.52 6.58 8.33 7.14 7.84 7.52 10.26 8.49
Fire 5.20 3.82 4.69 4.53 4.44 1.51 2.66 3.04 3.72 3.73
Other Event 31.50 28.68 31.78 37.58 40.12 38.15 38.65 33.13 43.36 35.93
• SSOAs reported collisions to FTA more often than any other type of event during the analyzed period. Nearly seven out of every ten events reported in 2015 were collisions. In contrast, derailments and fires accounted for 6% and 2% respectively of all events reported in 2015.
• The 90.18 RGX collisions per 100M VRM reported in 2015 reflect an 18.4% increase from 2014 and an average increase of 8.2% per year since 2007. After decreasing steadily from 2008 to 2012, the RGX collision rate increased each year between 2012 and 2015. The 2015 RGX collision rate reflects a 12.8% average increase per year since 2012, when SSOAs reported 62.85 per 100M VRM.
• The 2015 non-RGX collision rate of 31.56 per 100M VRM is the highest rate reported in the analyzed period. This rate represents a 17.2% increase from 2014 and an average increase of 10.8% per year since 2007.
• The derailment rate of 10.26 per 100M VRM in 2015 is the highest rate reported in the analyzed period. This represents a 36.4% increase from 2014 and an average increase of 1.1% per year since 2007.
Non-RGXCollision
18% (246)
RGX Collision
50% (703)
Derailment6% (80)
Fire2% (29)
Other Event
24% (338)
Events, 2015
31.56
90.18
10.26
3.72
43.36
Non-RGX Collision
RGX Collision
Derailment
Fire
Other Event
Event Rate, 2015
Rail Safety Data Report
Page | 22
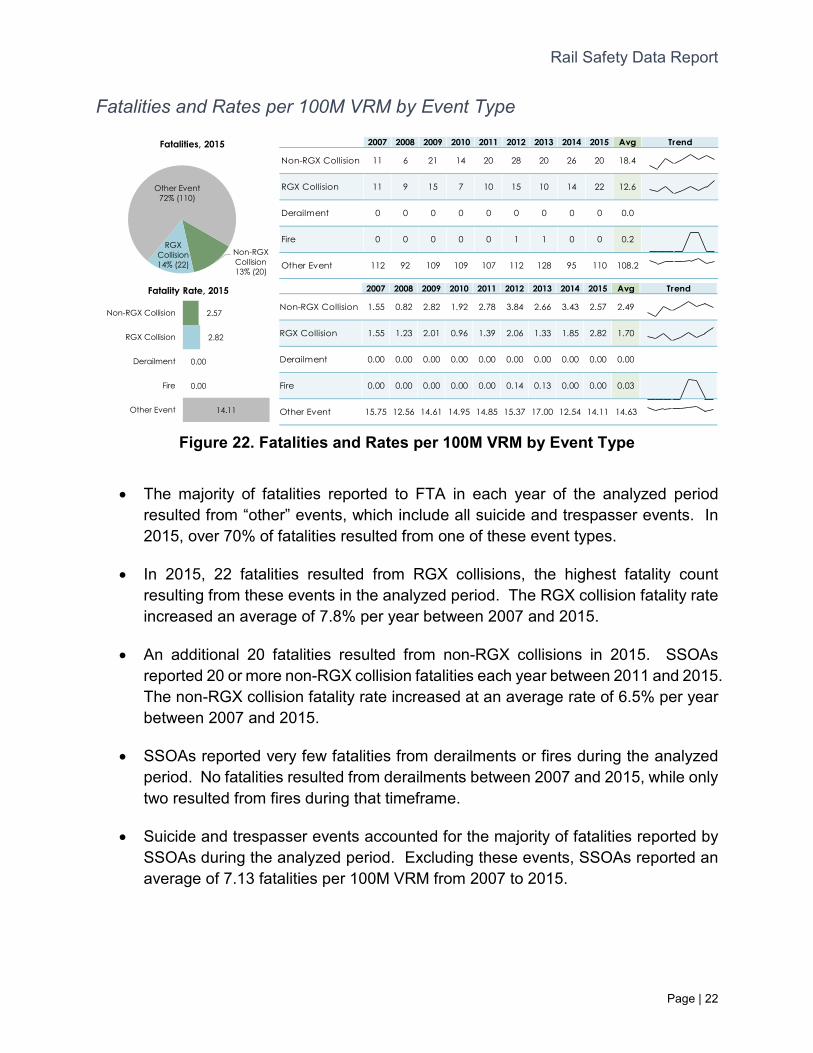
Fatalities and Rates per 100M VRM by Event Type
Figure 22. Fatalities and Rates per 100M VRM by Event Type
2007 2008 2009 2010 2011 2012 2013 2014 2015 Avg Trend
Non-RGX Collision 11 6 21 14 20 28 20 26 20 18.4
RGX Collision 11 9 15 7 10 15 10 14 22 12.6
Derailment 0 0 0 0 0 0 0 0 0 0.0
Fire 0 0 0 0 0 1 1 0 0 0.2
Other Event 112 92 109 109 107 112 128 95 110 108.2
2007 2008 2009 2010 2011 2012 2013 2014 2015 Avg Trend
Non-RGX Collision 1.55 0.82 2.82 1.92 2.78 3.84 2.66 3.43 2.57 2.49
RGX Collision 1.55 1.23 2.01 0.96 1.39 2.06 1.33 1.85 2.82 1.70
Derailment 0.00 0.00 0.00 0.00 0.00 0.00 0.00 0.00 0.00 0.00
Fire 0.00 0.00 0.00 0.00 0.00 0.14 0.13 0.00 0.00 0.03
Other Event 15.75 12.56 14.61 14.95 14.85 15.37 17.00 12.54 14.11 14.63
• The majority of fatalities reported to FTA in each year of the analyzed period resulted from “other” events, which include all suicide and trespasser events. In 2015, over 70% of fatalities resulted from one of these event types.
• In 2015, 22 fatalities resulted from RGX collisions, the highest fatality count resulting from these events in the analyzed period. The RGX collision fatality rate increased an average of 7.8% per year between 2007 and 2015.
• An additional 20 fatalities resulted from non-RGX collisions in 2015. SSOAs reported 20 or more non-RGX collision fatalities each year between 2011 and 2015. The non-RGX collision fatality rate increased at an average rate of 6.5% per year between 2007 and 2015.
• SSOAs reported very few fatalities from derailments or fires during the analyzed period. No fatalities resulted from derailments between 2007 and 2015, while only two resulted from fires during that timeframe.
• Suicide and trespasser events accounted for the majority of fatalities reported by SSOAs during the analyzed period. Excluding these events, SSOAs reported an average of 7.13 fatalities per 100M VRM from 2007 to 2015.
Non-RGXCollision13% (20)
RGXCollision14% (22)
Other Event72% (110)
Fatalities, 2015
2.57
2.82
0.00
0.00
14.11
Non-RGX Collision
RGX Collision
Derailment
Fire
Other Event
Fatality Rate, 2015
Rail Safety Data Report
Page | 23
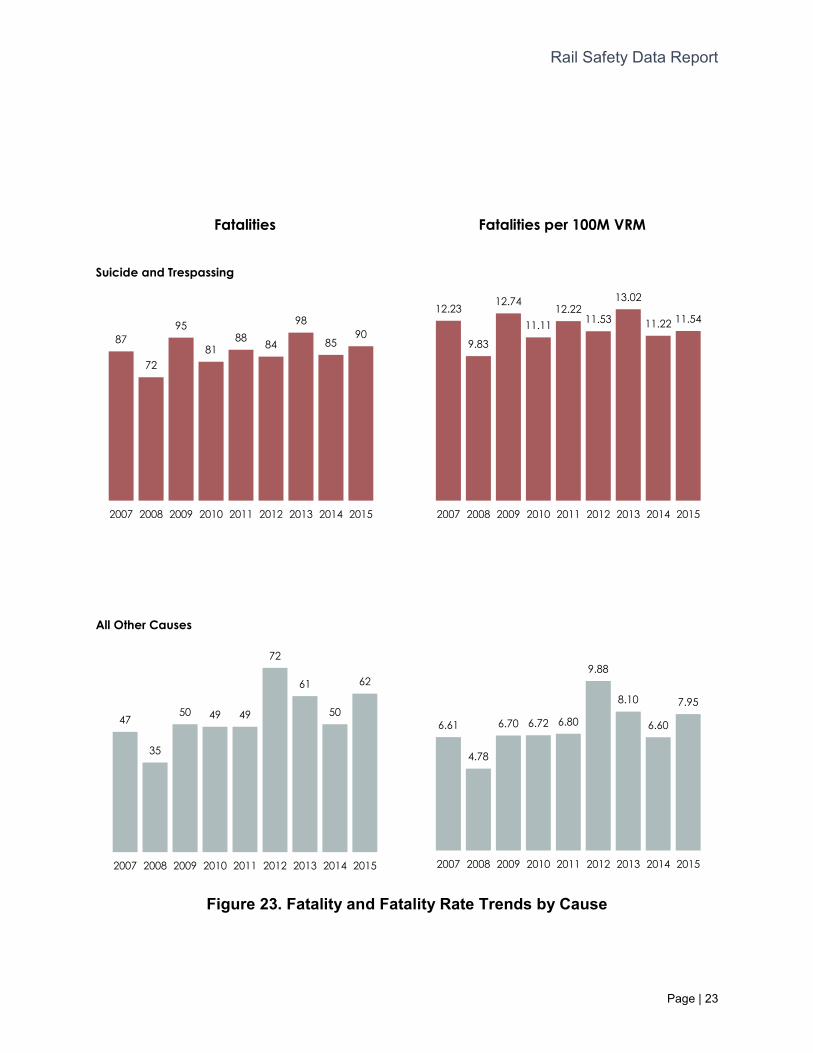
Fatalities Fatalities per 100M VRM
Suicide and Trespassing
2007 2008 2009 2010 2011 2012 2013 2014 2015 2007 2008 2009 2010 2011 2012 2013 2014 2015
All Other Causes
2007 2008 2009 2010 2011 2012 2013 2014 2015 2007 2008 2009 2010 2011 2012 2013 2014 2015
Figure 23. Fatality and Fatality Rate Trends by Cause
87
72
95
8188 84
98
8590
12.23
9.83
12.74
11.1112.22
11.53
13.02
11.22 11.54
47
35
50 49 49
72
61
50
62
6.61
4.78
6.70 6.72 6.80
9.88
8.10
6.60
7.95
Rail Safety Data Report
Page | 24
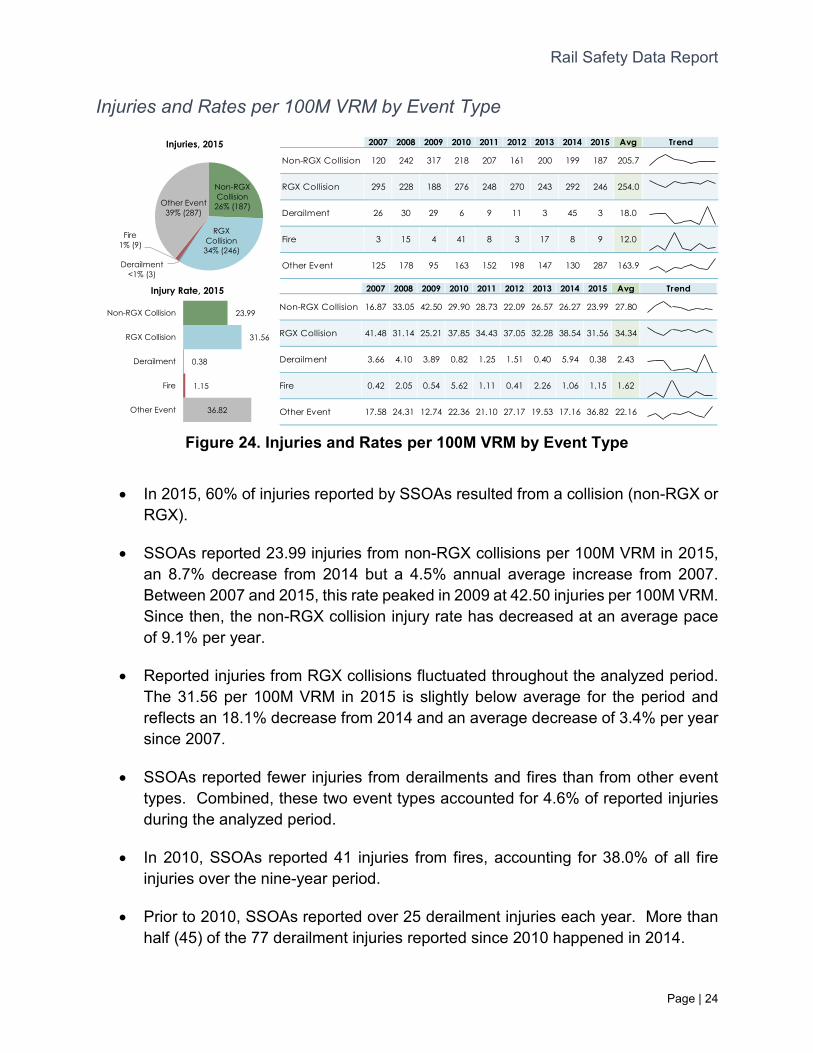
Injuries and Rates per 100M VRM by Event Type
Figure 24. Injuries and Rates per 100M VRM by Event Type
2007 2008 2009 2010 2011 2012 2013 2014 2015 Avg Trend
Non-RGX Collision 120 242 317 218 207 161 200 199 187 205.7
RGX Collision 295 228 188 276 248 270 243 292 246 254.0
Derailment 26 30 29 6 9 11 3 45 3 18.0
Fire 3 15 4 41 8 3 17 8 9 12.0
Other Event 125 178 95 163 152 198 147 130 287 163.9
2007 2008 2009 2010 2011 2012 2013 2014 2015 Avg Trend
Non-RGX Collision 16.87 33.05 42.50 29.90 28.73 22.09 26.57 26.27 23.99 27.80
RGX Collision 41.48 31.14 25.21 37.85 34.43 37.05 32.28 38.54 31.56 34.34
Derailment 3.66 4.10 3.89 0.82 1.25 1.51 0.40 5.94 0.38 2.43
Fire 0.42 2.05 0.54 5.62 1.11 0.41 2.26 1.06 1.15 1.62
Other Event 17.58 24.31 12.74 22.36 21.10 27.17 19.53 17.16 36.82 22.16
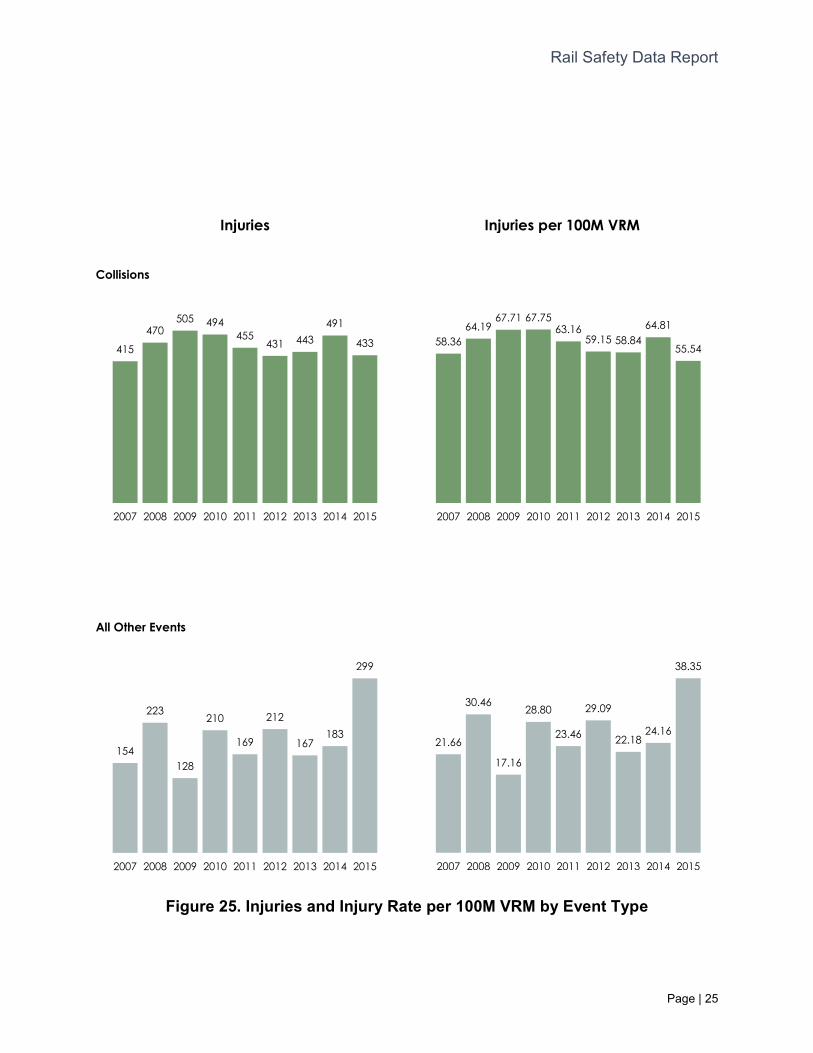
• In 2015, 60% of injuries reported by SSOAs resulted from a collision (non-RGX or RGX).
• SSOAs reported 23.99 injuries from non-RGX collisions per 100M VRM in 2015, an 8.7% decrease from 2014 but a 4.5% annual average increase from 2007. Between 2007 and 2015, this rate peaked in 2009 at 42.50 injuries per 100M VRM. Since then, the non-RGX collision injury rate has decreased at an average pace of 9.1% per year.
• Reported injuries from RGX collisions fluctuated throughout the analyzed period. The 31.56 per 100M VRM in 2015 is slightly below average for the period and reflects an 18.1% decrease from 2014 and an average decrease of 3.4% per year since 2007.
• SSOAs reported fewer injuries from derailments and fires than from other event types. Combined, these two event types accounted for 4.6% of reported injuries during the analyzed period.
• In 2010, SSOAs reported 41 injuries from fires, accounting for 38.0% of all fire injuries over the nine-year period.
• Prior to 2010, SSOAs reported over 25 derailment injuries each year. More than half (45) of the 77 derailment injuries reported since 2010 happened in 2014.
Non-RGXCollision
26% (187)
RGXCollision
34% (246)
Derailment<1% (3)
Fire1% (9)
Other Event39% (287)
Injuries, 2015
23.99
31.56
0.38
1.15
36.82
Non-RGX Collision
RGX Collision
Derailment
Fire
Other Event
Injury Rate, 2015
Rail Safety Data Report
Page | 25
Injuries Injuries per 100M VRM
Collisions
2007 2008 2009 2010 2011 2012 2013 2014 2015
All Other Events
2007 2008 2009 2010 2011 2012 2013 2014 2015
Figure 25. Injuries and Injury Rate per 100M VRM by Event Type
415
470505 494
455431 443
491
433
2007 2008 2009 2010 2011 2012 2013 2014 2015
58.3664.19
67.71 67.7563.16
59.15 58.8464.81
55.54
154
223
128
210
169
212
167183
299
2007 2008 2009 2010 2011 2012 2013 2014 2015
21.66
30.46
17.16
28.80
23.46
29.09
22.1824.16
38.35
Rail Safety Data Report
Page | 26
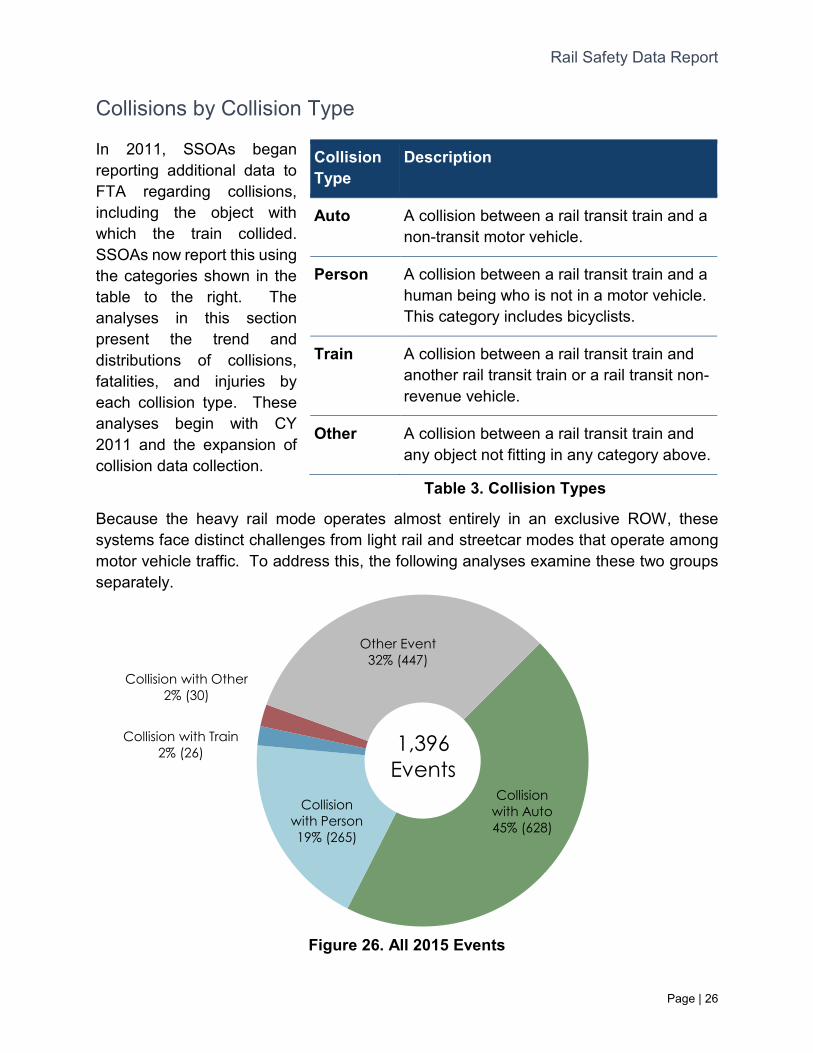
Collisions by Collision Type
In 2011, SSOAs began reporting additional data to FTA regarding collisions, including the object with which the train collided. SSOAs now report this using the categories shown in the table to the right. The analyses in this section present the trend and distributions of collisions, fatalities, and injuries by each collision type. These analyses begin with CY 2011 and the expansion of collision data collection.
Because the heavy rail mode operates almost entirely in an exclusive ROW, these systems face distinct challenges from light rail and streetcar modes that operate among motor vehicle traffic. To address this, the following analyses examine these two groups separately.
Figure 26. All 2015 Events
Collisionwith Auto45% (628)
Collision with Person19% (265)
Collision with Train2% (26)
Collision with Other2% (30)
Other Event32% (447)
1,396Events
Collision Type
Description
Auto A collision between a rail transit train and a non-transit motor vehicle.
Person A collision between a rail transit train and a human being who is not in a motor vehicle. This category includes bicyclists.
Train A collision between a rail transit train and another rail transit train or a rail transit non-revenue vehicle.
Other A collision between a rail transit train and any object not fitting in any category above.
Table 3. Collision Types
Rail Safety Data Report
This section of the RSDR only presents data on heavy rail mode collisions. Page | 27
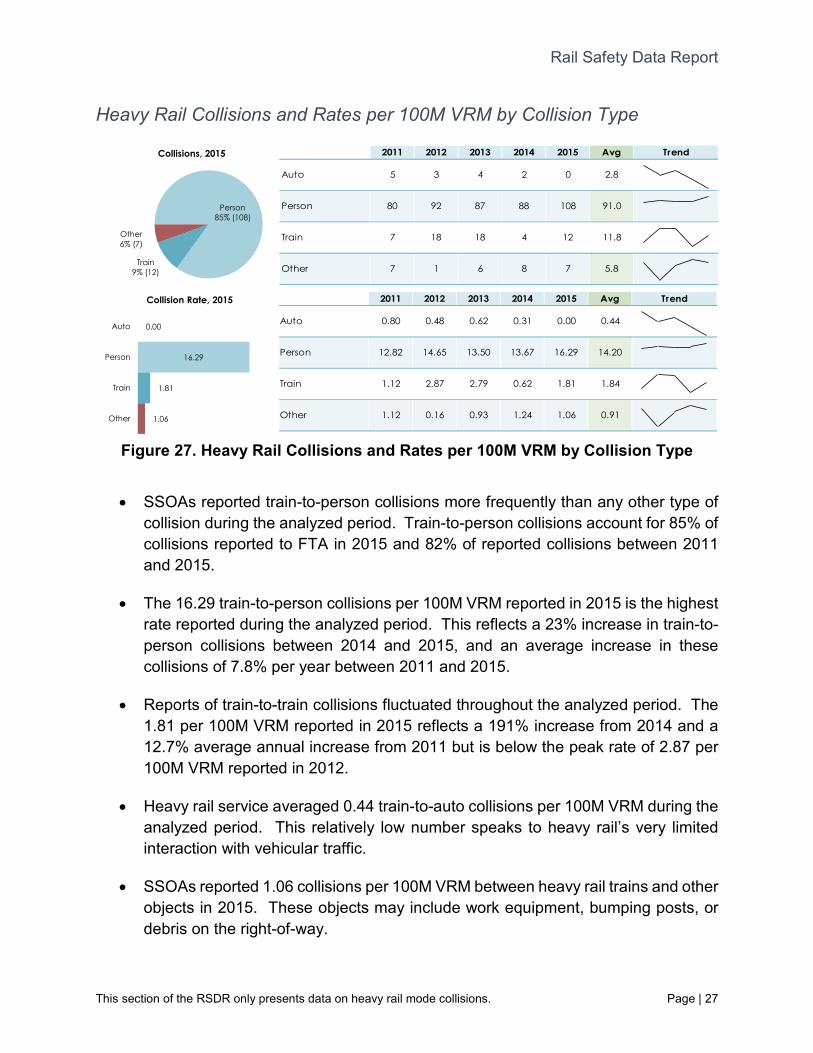
Heavy Rail Collisions and Rates per 100M VRM by Collision Type
Figure 27. Heavy Rail Collisions and Rates per 100M VRM by Collision Type
2011 2012 2013 2014 2015 Avg Trend
Auto 5 3 4 2 0 2.8
Person 80 92 87 88 108 91.0
Train 7 18 18 4 12 11.8
Other 7 1 6 8 7 5.8
2011 2012 2013 2014 2015 Avg Trend
Auto 0.80 0.48 0.62 0.31 0.00 0.44
Person 12.82 14.65 13.50 13.67 16.29 14.20
Train 1.12 2.87 2.79 0.62 1.81 1.84
Other 1.12 0.16 0.93 1.24 1.06 0.91
• SSOAs reported train-to-person collisions more frequently than any other type of collision during the analyzed period. Train-to-person collisions account for 85% of collisions reported to FTA in 2015 and 82% of reported collisions between 2011 and 2015.
• The 16.29 train-to-person collisions per 100M VRM reported in 2015 is the highest rate reported during the analyzed period. This reflects a 23% increase in train-to-person collisions between 2014 and 2015, and an average increase in these collisions of 7.8% per year between 2011 and 2015.
• Reports of train-to-train collisions fluctuated throughout the analyzed period. The 1.81 per 100M VRM reported in 2015 reflects a 191% increase from 2014 and a 12.7% average annual increase from 2011 but is below the peak rate of 2.87 per 100M VRM reported in 2012.
• Heavy rail service averaged 0.44 train-to-auto collisions per 100M VRM during the analyzed period. This relatively low number speaks to heavy rail’s very limited interaction with vehicular traffic.
• SSOAs reported 1.06 collisions per 100M VRM between heavy rail trains and other objects in 2015. These objects may include work equipment, bumping posts, or debris on the right-of-way.
Person85% (108)
Train9% (12)
Other6% (7)
Collisions, 2015
0.00
16.29
1.81
1.06
Auto
Person
Train
Other
Collision Rate, 2015
Rail Safety Data Report
This section of the RSDR only presents data on heavy rail mode collisions. Page | 28
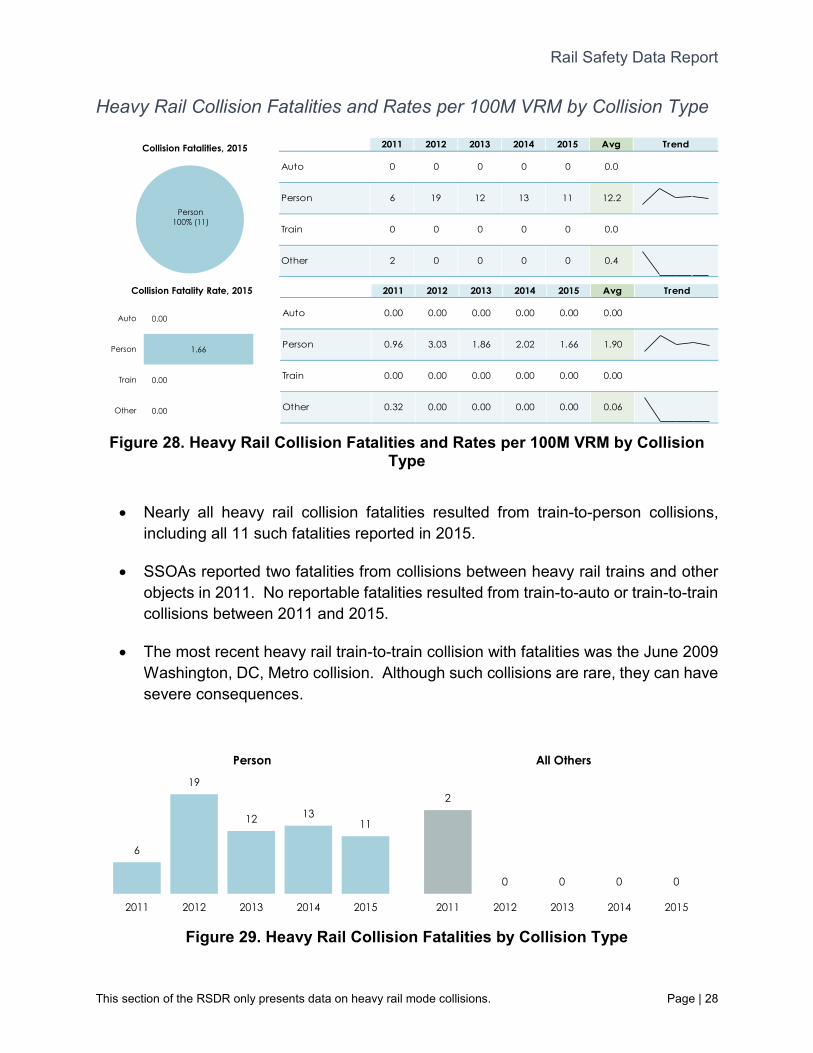
Heavy Rail Collision Fatalities and Rates per 100M VRM by Collision Type
Figure 28. Heavy Rail Collision Fatalities and Rates per 100M VRM by Collision
Type
2011 2012 2013 2014 2015 Avg Trend
Auto 0 0 0 0 0 0.0
Person 6 19 12 13 11 12.2
Train 0 0 0 0 0 0.0
Other 2 0 0 0 0 0.4
0.00uto
rson 1.66
0.00
0.00
rain
ther
2011 2012 2013 2014 2015 Avg Trend
Auto 0.00 0.00 0.00 0.00 0.00 0.00
Person 0.96 3.03 1.86 2.02 1.66 1.90
Train 0.00 0.00 0.00 0.00 0.00 0.00
Other 0.32 0.00 0.00 0.00 0.00 0.06
• Nearly all heavy rail collision fatalities resulted from train-to-person collisions, including all 11 such fatalities reported in 2015.
• SSOAs reported two fatalities from collisions between heavy rail trains and other objects in 2011. No reportable fatalities resulted from train-to-auto or train-to-train collisions between 2011 and 2015.
• The most recent heavy rail train-to-train collision with fatalities was the June 2009 Washington, DC, Metro collision. Although such collisions are rare, they can have severe consequences.
Figure 29. Heavy Rail Collision Fatalities by Collision Type
Person100% (11)
Collision Fatalities, 2015
A
Pe
Collision Fatality Rate, 2015
T
O
6
19
12 1311
2011 2012 2013 2014 2015
Person All Others
2011 2012 2013 2014 2015
2
0 0 0 0
Rail Safety Data Report
This section of the RSDR only presents data on heavy rail mode collisions. Page | 29
Heavy Rail Collision Injuries and Rates per 100M VRM by Collision Type
Figure 30. Heavy Rail Collision Injuries and Rates per 100M VRM by Collision
Type
2011 2012 2013 2014 2015 Avg Trend
Auto 26 3 1 1 0 6.2
Person 52 69 57 55 81 62.8
Train 2 7 36 5 3 10.6
Other 2 0 8 39 2 10.2
0.00Auto
12.22
0.45
0.30
Person
Train
Other
2011 2012 2013 2014 2015 Avg Trend
Auto 4.17 0.48 0.16 0.16 0.00 0.97
Person 8.33 10.99 8.84 8.54 12.22 9.80
Train 0.32 1.11 5.58 0.78 0.45 1.65
Other 0.32 0.00 1.24 6.06 0.30 1.59
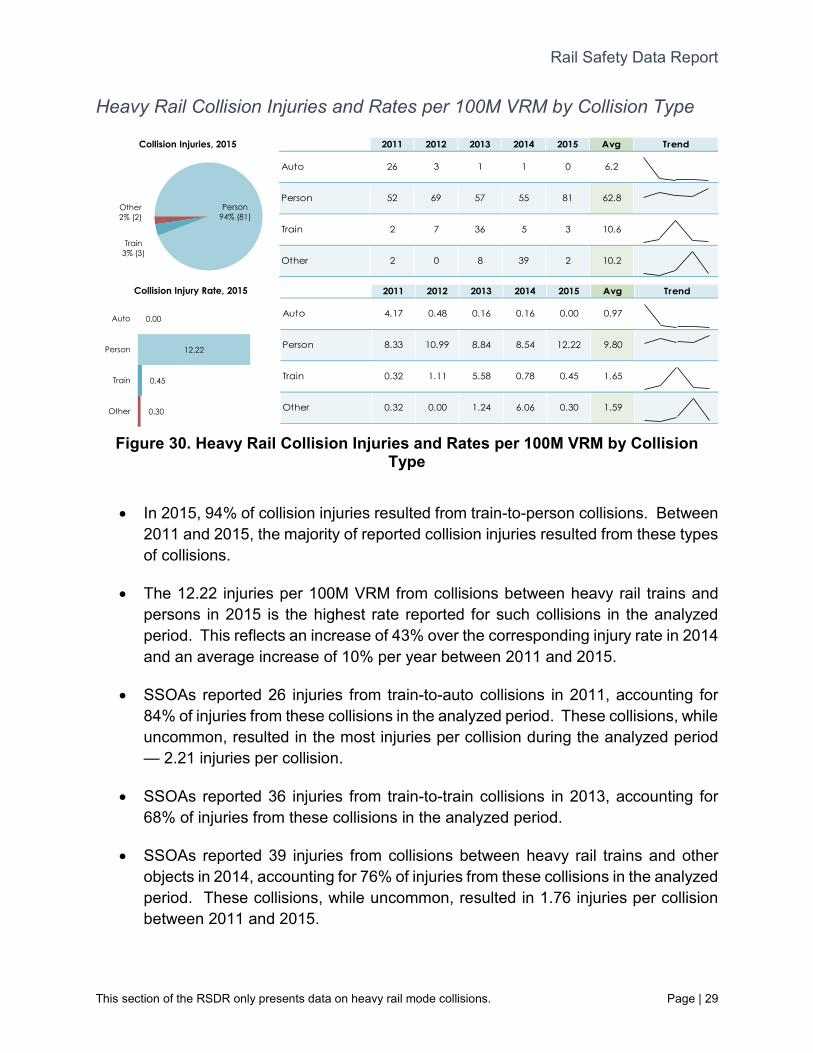
• In 2015, 94% of collision injuries resulted from train-to-person collisions. Between 2011 and 2015, the majority of reported collision injuries resulted from these types of collisions.
• The 12.22 injuries per 100M VRM from collisions between heavy rail trains and persons in 2015 is the highest rate reported for such collisions in the analyzed period. This reflects an increase of 43% over the corresponding injury rate in 2014 and an average increase of 10% per year between 2011 and 2015.
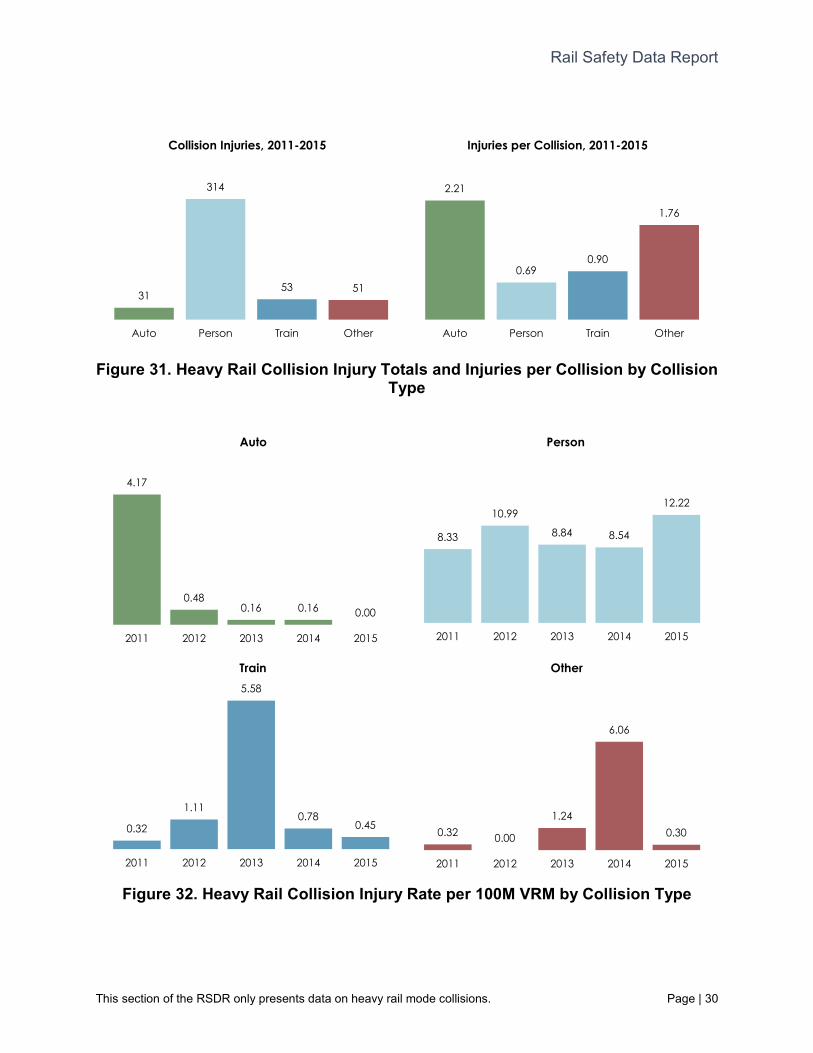
• SSOAs reported 26 injuries from train-to-auto collisions in 2011, accounting for 84% of injuries from these collisions in the analyzed period. These collisions, while uncommon, resulted in the most injuries per collision during the analyzed period — 2.21 injuries per collision.
• SSOAs reported 36 injuries from train-to-train collisions in 2013, accounting for 68% of injuries from these collisions in the analyzed period.
• SSOAs reported 39 injuries from collisions between heavy rail trains and other objects in 2014, accounting for 76% of injuries from these collisions in the analyzed period. These collisions, while uncommon, resulted in 1.76 injuries per collision between 2011 and 2015.
Person94% (81)
Train3% (3)
Other2% (2)
Collision Injuries, 2015
Collision Injury Rate, 2015
Rail Safety Data Report
This section of the RSDR only presents data on heavy rail mode collisions. Page | 30
Figure 31. Heavy Rail Collision Injury Totals and Injuries per Collision by Collision
Type
5.58
Train
3153 51
314 2.21
Injuries per Collision, 2011-2015
Auto Person Train Other
Collision Injuries, 2011-2015
0.690.90
1.76
Auto Person Train Other
Figure 32. Heavy Rail Collision Injury Rate per 100M VRM by Collision Type
Auto
2011 2012 2013 2014 2015
4.17
0.480.16 0.16 0.00
8.33
10.99
8.84 8.54
12.22
2011 2012 2013 2014 2015
Person
0.32
1.110.78
0.45
2011 2012 2013 2014 2015
0.32 0.00
1.240.30
6.06
2011 2012 2013 2014 2015
Other
Rail Safety Data Report
This section of the RSDR only presents data on light rail and streetcar mode collisions. Page | 31
Light Rail and Streetcar Collisions and Rates per 100M VRM by Collision Type
Figure 33. Light Rail and Streetcar Collisions and Rates per 100M VRM by
Collision Type
2011 2012 2013 2014 2015 Avg Trend
Auto 414 421 453 505 619 482.4
Person 100 96 122 114 155 117.4
Train 21 8 22 15 13 15.8
Other 5 9 6 24 23 13.4
2011 2012 2013 2014 2015 Avg Trend
Auto 440.41 427.77 428.69 457.52 546.48 462.30
Person 106.38 97.54 115.45 103.28 136.84 112.51
Train 22.34 8.13 20.82 13.59 11.48 15.14
Other 5.32 9.14 5.68 21.74 20.31 12.84
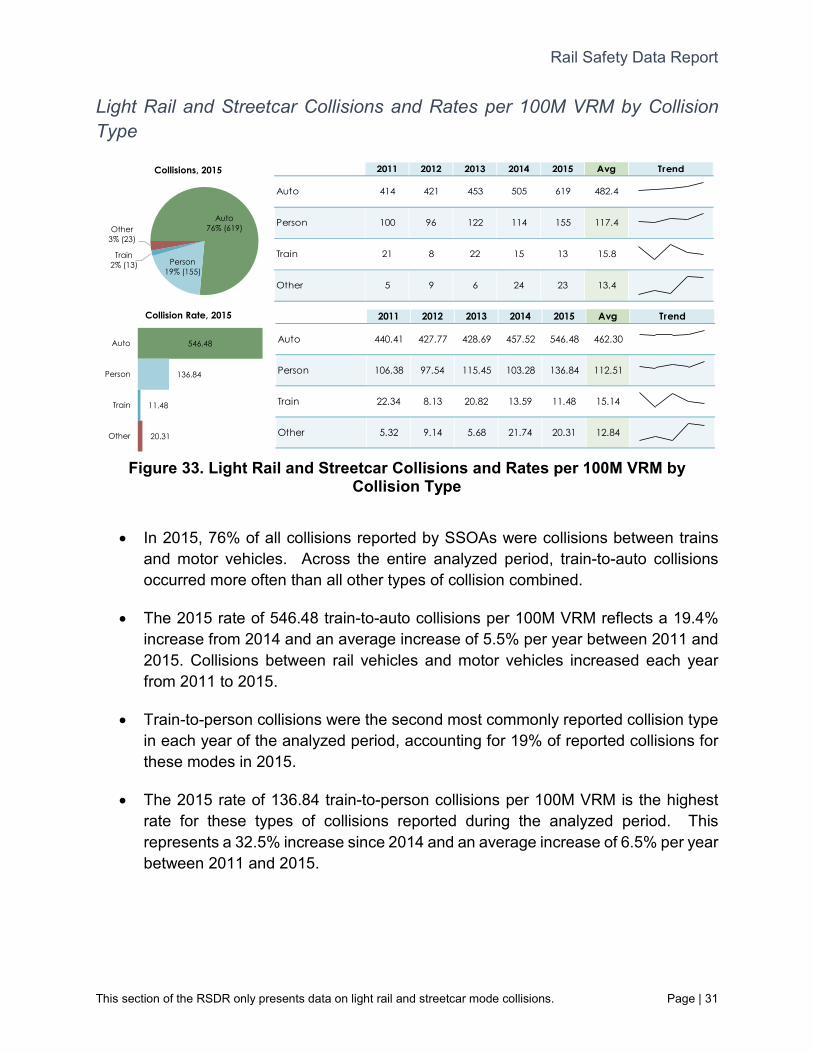
• In 2015, 76% of all collisions reported by SSOAs were collisions between trains and motor vehicles. Across the entire analyzed period, train-to-auto collisions occurred more often than all other types of collision combined.
• The 2015 rate of 546.48 train-to-auto collisions per 100M VRM reflects a 19.4% increase from 2014 and an average increase of 5.5% per year between 2011 and 2015. Collisions between rail vehicles and motor vehicles increased each year from 2011 to 2015.
• Train-to-person collisions were the second most commonly reported collision type in each year of the analyzed period, accounting for 19% of reported collisions for these modes in 2015.
• The 2015 rate of 136.84 train-to-person collisions per 100M VRM is the highest rate for these types of collisions reported during the analyzed period. This represents a 32.5% increase since 2014 and an average increase of 6.5% per year between 2011 and 2015.
Auto76% (619)
Person19% (155)
Train2% (13)
Other3% (23)
Collisions, 2015
546.48
136.84
11.48
20.31
Auto
Person
Train
Other
Collision Rate, 2015
Rail Safety Data Report
This section of the RSDR only presents data on light rail and streetcar mode collisions. Page | 32
Light Rail and Streetcar Collision Fatalities and Rates per 100M VRM by Collision Type
Figure 34. Light Rail and Streetcar Collision Fatalities and Rates per 100M VRM by
Collision Type
2011 2012 2013 2014 2015 Avg Trend
Auto 0 7 3 3 6 3.8
Person 22 16 14 20 25 19.4
Train 0 0 0 0 0 0.0
Other 0 1 0 3 0 0.8
5.30
22.07
0.00
0.00
Auto
Person
Train
Other
2011 2012 2013 2014 2015 Avg Trend
Auto 0.00 7.11 2.84 2.72 5.30 3.64
Person 23.40 16.26 13.25 18.12 22.07 18.59
Train 0.00 0.00 0.00 0.00 0.00 0.00
Other 0.00 1.02 0.00 2.72 0.00 0.77
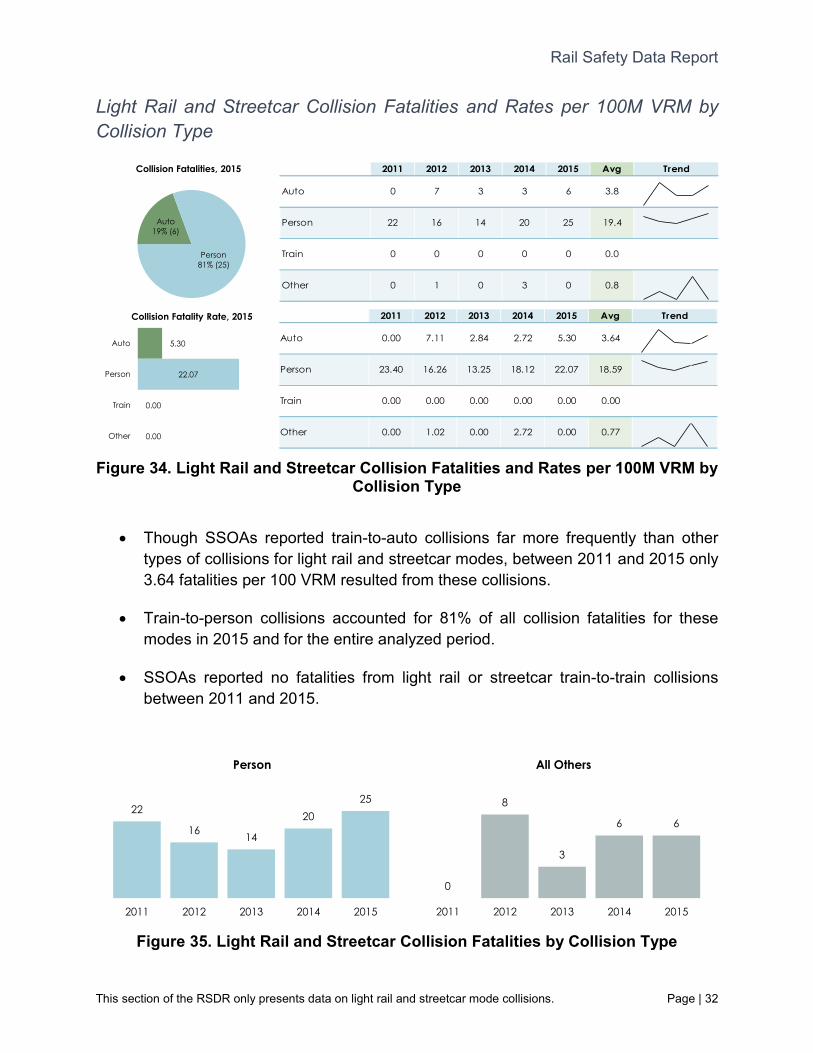
• Though SSOAs reported train-to-auto collisions far more frequently than other types of collisions for light rail and streetcar modes, between 2011 and 2015 only 3.64 fatalities per 100 VRM resulted from these collisions.
• Train-to-person collisions accounted for 81% of all collision fatalities for these modes in 2015 and for the entire analyzed period.
• SSOAs reported no fatalities from light rail or streetcar train-to-train collisions between 2011 and 2015.
Figure 35. Light Rail and Streetcar Collision Fatalities by Collision Type
Auto19% (6)
Person81% (25)
Collision Fatalities, 2015
Collision Fatality Rate, 2015
22
16 14
2025
2011 2012 2013 2014 2015
Person
8
All Others
0
3
6 6
2011 2012 2013 2014 2015
Rail Safety Data Report
This section of the RSDR only presents data on light rail and streetcar mode collisions. Page | 33
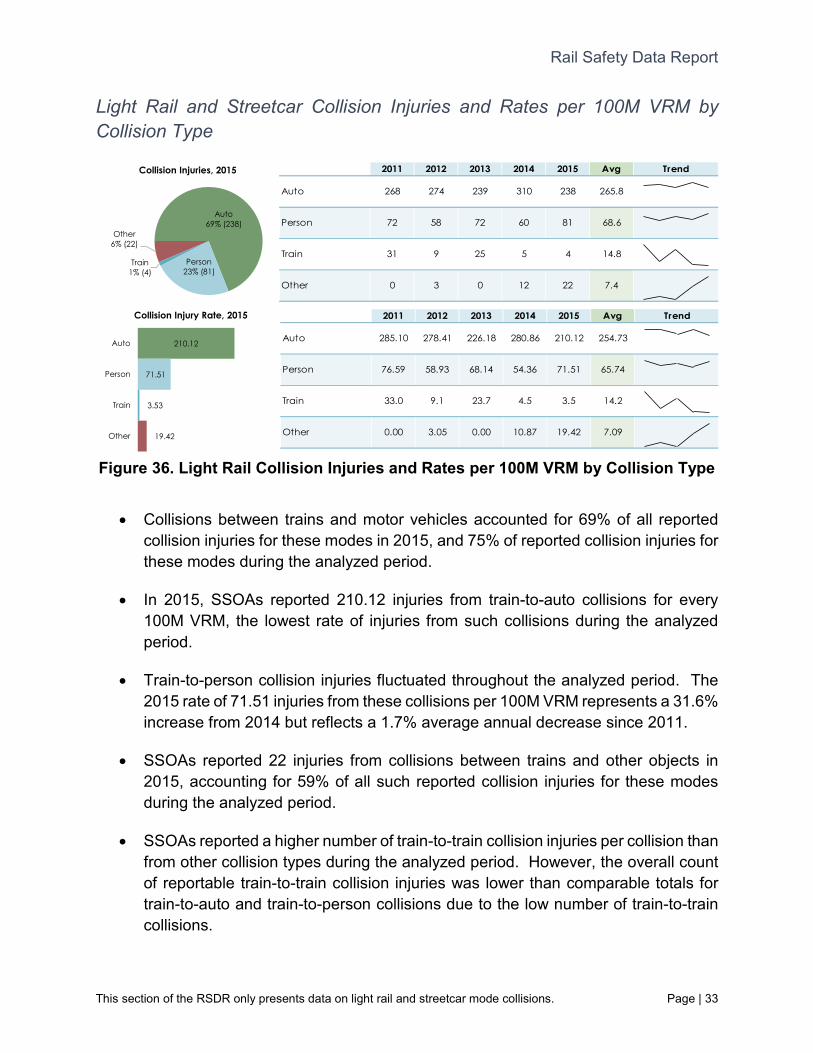
Light Rail and Streetcar Collision Injuries and Rates per 100M VRM by Collision Type
Figure 36. Light Rail Collision Injuries and Rates per 100M VRM by Collision Type
2011 2012 2013 2014 2015 Avg Trend
Auto 268 274 239 310 238 265.8
Person 72 58 72 60 81 68.6
Train 31 9 25 5 4 14.8
Other 0 3 0 12 22 7.4
2011 2012 2013 2014 2015 Avg Trend
Auto 285.10 278.41 226.18 280.86 210.12 254.73
Person 76.59 58.93 68.14 54.36 71.51 65.74
Train 33.0 9.1 23.7 4.5 3.5 14.2
Other 0.00 3.05 0.00 10.87 19.42 7.09
• Collisions between trains and motor vehicles accounted for 69% of all reported collision injuries for these modes in 2015, and 75% of reported collision injuries for these modes during the analyzed period.
• In 2015, SSOAs reported 210.12 injuries from train-to-auto collisions for every 100M VRM, the lowest rate of injuries from such collisions during the analyzed period.
• Train-to-person collision injuries fluctuated throughout the analyzed period. The 2015 rate of 71.51 injuries from these collisions per 100M VRM represents a 31.6% increase from 2014 but reflects a 1.7% average annual decrease since 2011.
• SSOAs reported 22 injuries from collisions between trains and other objects in 2015, accounting for 59% of all such reported collision injuries for these modes during the analyzed period.
• SSOAs reported a higher number of train-to-train collision injuries per collision than from other collision types during the analyzed period. However, the overall count of reportable train-to-train collision injuries was lower than comparable totals for train-to-auto and train-to-person collisions due to the low number of train-to-train collisions.
Auto69% (238)
Person23% (81)
Train1% (4)
Other6% (22)
Collision Injuries, 2015
210.12
71.51
3.53
19.42
Auto
Person
Train
Other
Collision Injury Rate, 2015
Rail Safety Data Report
This section of the RSDR only presents data on light rail and streetcar mode collisions. Page | 34
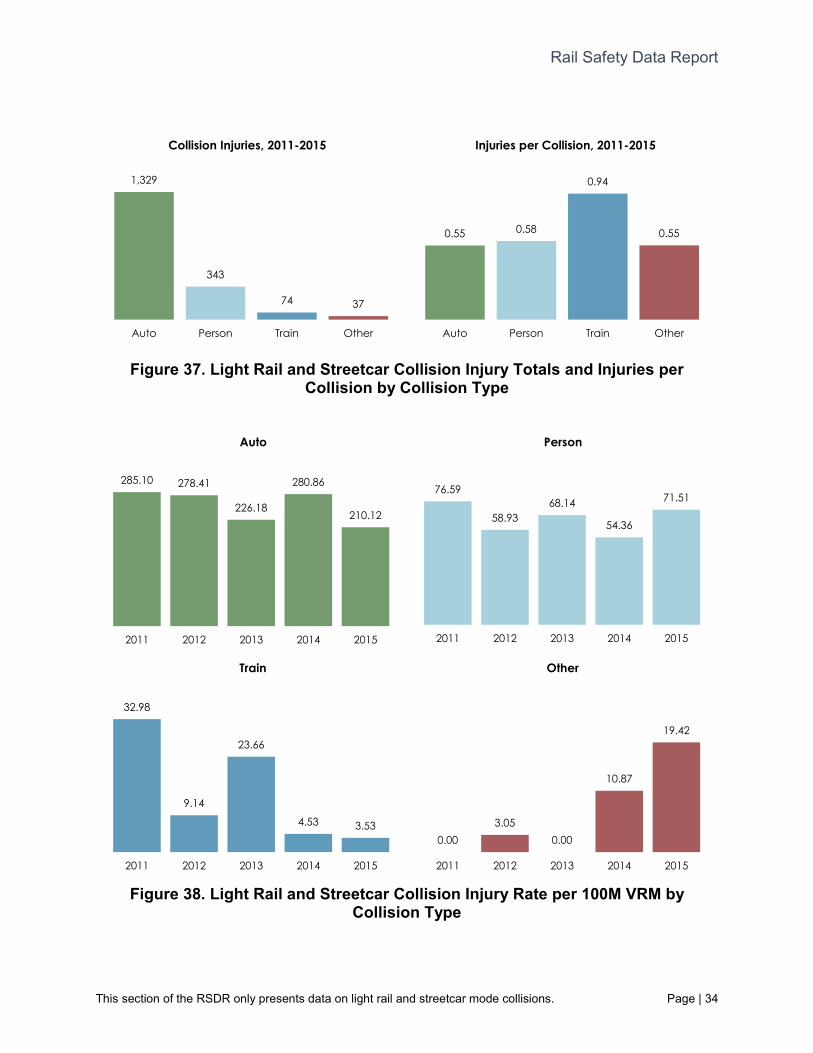
Figure 37. Light Rail and Streetcar Collision Injury Totals and Injuries per
Collision by Collision Type
1,329
343
74 37
Auto Person Train Other
Collision Injuries, 2011-2015
0.55 0.58
0.94
0.55
Injuries per Collision, 2011-2015
Auto Person Train Other
Figure 38. Light Rail and Streetcar Collision Injury Rate per 100M VRM by Collision Type
285.10 278.41
226.18
280.86
210.12
2011 2012 2013 2014 2015
Train
Auto Person
76.59
58.9368.14
54.36
71.51
2011 2012 2013 2014 2015
32.98
9.14
23.66
4.53 3.53
2011 2012 2013 2014 2015
19.42
Other
0.003.05
0.00
10.87
2011 2012 2013 2014 2015
Rail Safety Data Report
Page | 35
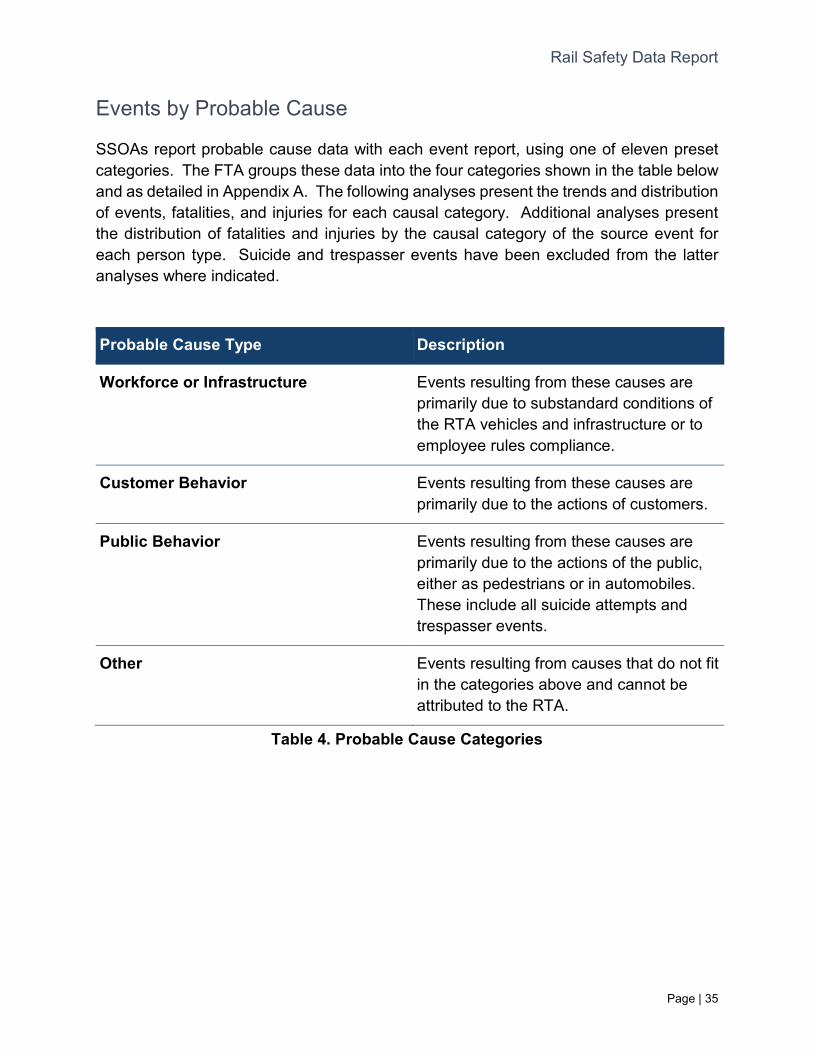
Events by Probable Cause
SSOAs report probable cause data with each event report, using one of eleven preset categories. The FTA groups these data into the four categories shown in the table below and as detailed in Appendix A. The following analyses present the trends and distribution of events, fatalities, and injuries for each causal category. Additional analyses present the distribution of fatalities and injuries by the causal category of the source event for each person type. Suicide and trespasser events have been excluded from the latter analyses where indicated.
Table 4. Probable Cause Categories
Probable Cause Type Description
Workforce or Infrastructure Events resulting from these causes are primarily due to substandard conditions of the RTA vehicles and infrastructure or to employee rules compliance.
Customer Behavior Events resulting from these causes are primarily due to the actions of customers.
Public Behavior Events resulting from these causes are primarily due to the actions of the public, either as pedestrians or in automobiles. These include all suicide attempts and trespasser events.
Other Events resulting from causes that do not fit in the categories above and cannot be attributed to the RTA.
Rail Safety Data Report
Page | 36
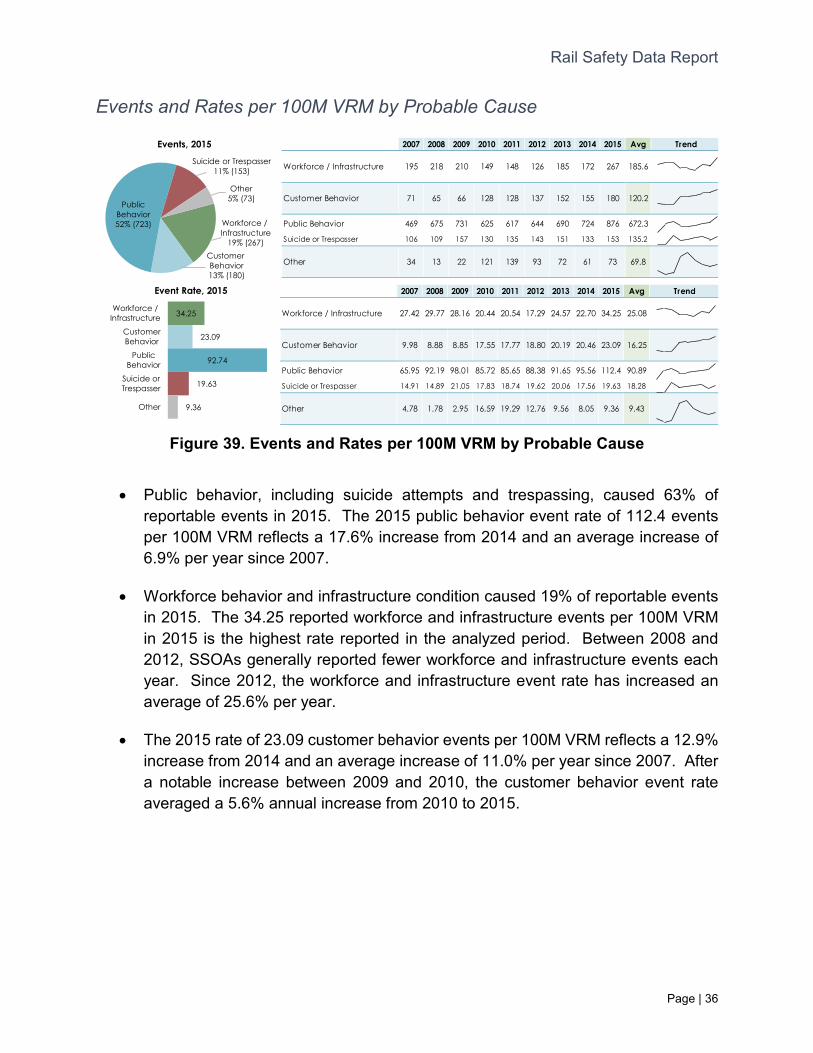
Events and Rates per 100M VRM by Probable Cause
Figure 39. Events and Rates per 100M VRM by Probable Cause
Workforce / Infrastructure
19% (267)Customer Behavior13% (180)
PublicBehavior52% (723)
Suicide or Trespasser11% (153)
Other5% (73)
Events, 2015
Event Rate, 2015
2007 2008 2009 2010 2011 2012 2013 2014 2015 Avg Trend
Workforce / Infrastructure 195 218 210 149 148 126 185 172 267 185.6
Customer Behavior 71 65 66 128 128 137 152 155 180 120.2
Public Behavior 469 675 731 625 617 644 690 724 876 672.3
Suicide or Trespasser 106 109 157 130 135 143 151 133 153 135.2
Other 34 13 22 121 139 93 72 61 73 69.8
2007 2008 2009 2010 2011 2012 2013 2014 2015 Avg Trend
Workforce / Infrastructure 27.42 29.77 28.16 20.44 20.54 17.29 24.57 22.70 34.25 25.08
Customer Behavior 9.98 8.88 8.85 17.55 17.77 18.80 20.19 20.46 23.09 16.25
Public Behavior 65.95 92.19 98.01 85.72 85.65 88.38 91.65 95.56 112.4 90.89
Suicide or Trespasser 14.91 14.89 21.05 17.83 18.74 19.62 20.06 17.56 19.63 18.28
Other 4.78 1.78 2.95 16.59 19.29 12.76 9.56 8.05 9.36 9.43
• Public behavior, including suicide attempts and trespassing, caused 63% of reportable events in 2015. The 2015 public behavior event rate of 112.4 events per 100M VRM reflects a 17.6% increase from 2014 and an average increase of 6.9% per year since 2007.
• Workforce behavior and infrastructure condition caused 19% of reportable events in 2015. The 34.25 reported workforce and infrastructure events per 100M VRM in 2015 is the highest rate reported in the analyzed period. Between 2008 and 2012, SSOAs generally reported fewer workforce and infrastructure events each year. Since 2012, the workforce and infrastructure event rate has increased an average of 25.6% per year.
• The 2015 rate of 23.09 customer behavior events per 100M VRM reflects a 12.9% increase from 2014 and an average increase of 11.0% per year since 2007. After a notable increase between 2009 and 2010, the customer behavior event rate averaged a 5.6% annual increase from 2010 to 2015.
34.25
23.09
92.74
19.63
9.36
Workforce /Infrastructure
CustomerBehavior
PublicBehavior
Suicide orTrespasser
Other
Rail Safety Data Report
Page | 37
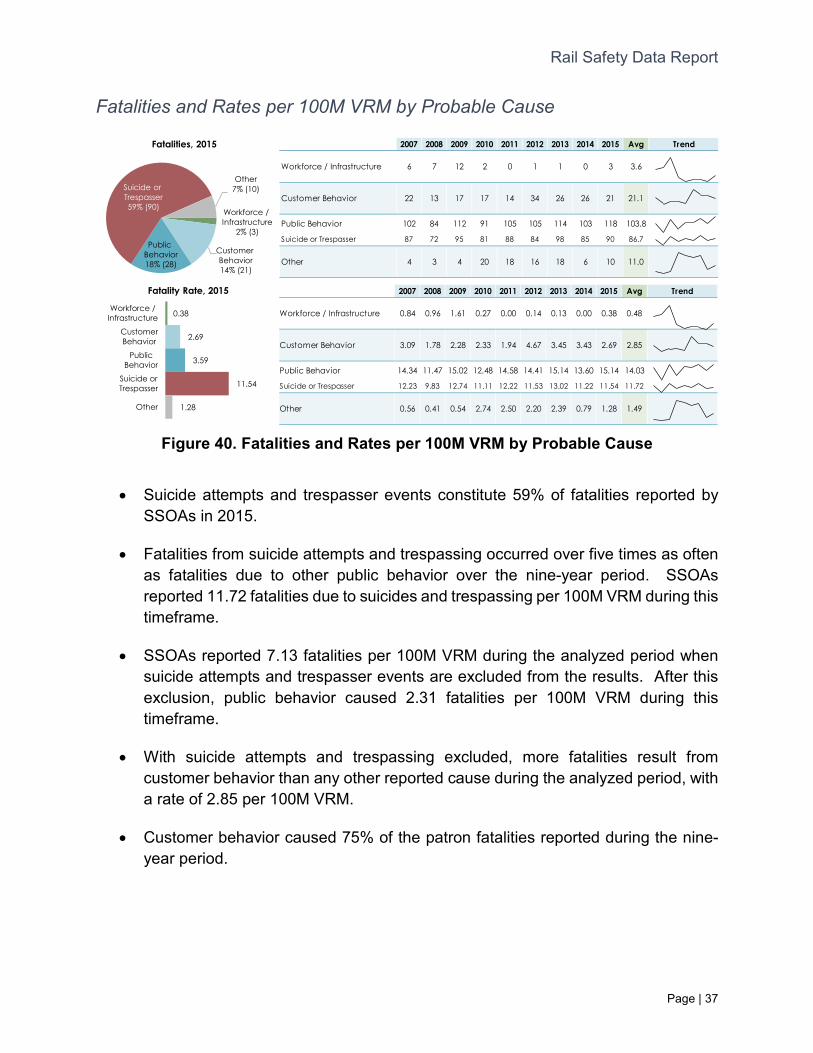
Fatalities and Rates per 100M VRM by Probable Cause
Figure 40. Fatalities and Rates per 100M VRM by Probable Cause
2007 2008 2009 2010 2011 2012 2013 2014 2015 Avg Trend
Workforce / Infrastructure 6 7 12 2 0 1 1 0 3 3.6
Customer Behavior 22 13 17 17 14 34 26 26 21 21.1
Public Behavior 102 84 112 91 105 105 114 103 118 103.8
Suicide or Trespasser 87 72 95 81 88 84 98 85 90 86.7
Other 4 3 4 20 18 16 18 6 10 11.0
2007 2008 2009 2010 2011 2012 2013 2014 2015 Avg Trend
Workforce / Infrastructure 0.84 0.96 1.61 0.27 0.00 0.14 0.13 0.00 0.38 0.48
Customer Behavior 3.09 1.78 2.28 2.33 1.94 4.67 3.45 3.43 2.69 2.85
Public Behavior 14.34 11.47 15.02 12.48 14.58 14.41 15.14 13.60 15.14 14.03
Suicide or Trespasser 12.23 9.83 12.74 11.11 12.22 11.53 13.02 11.22 11.54 11.72
Other 0.56 0.41 0.54 2.74 2.50 2.20 2.39 0.79 1.28 1.49
• Suicide attempts and trespasser events constitute 59% of fatalities reported by SSOAs in 2015.
• Fatalities from suicide attempts and trespassing occurred over five times as often as fatalities due to other public behavior over the nine-year period. SSOAs reported 11.72 fatalities due to suicides and trespassing per 100M VRM during this timeframe.
• SSOAs reported 7.13 fatalities per 100M VRM during the analyzed period when suicide attempts and trespasser events are excluded from the results. After this exclusion, public behavior caused 2.31 fatalities per 100M VRM during this timeframe.
• With suicide attempts and trespassing excluded, more fatalities result from customer behavior than any other reported cause during the analyzed period, with a rate of 2.85 per 100M VRM.
• Customer behavior caused 75% of the patron fatalities reported during the nine-year period.
Workforce / Infrastructure
2% (3)
Customer Behavior14% (21)
Public Behavior18% (28)
Other7% (10)Suicide or
Trespasser59% (90)
Fatalities, 2015
0.38
2.69
3.59
1.28
11.54
Workforce /Infrastructure
CustomerBehavior
PublicBehavior
Suicide orTrespasser
Other
Fatality Rate, 2015
Rail Safety Data Report
Page | 38
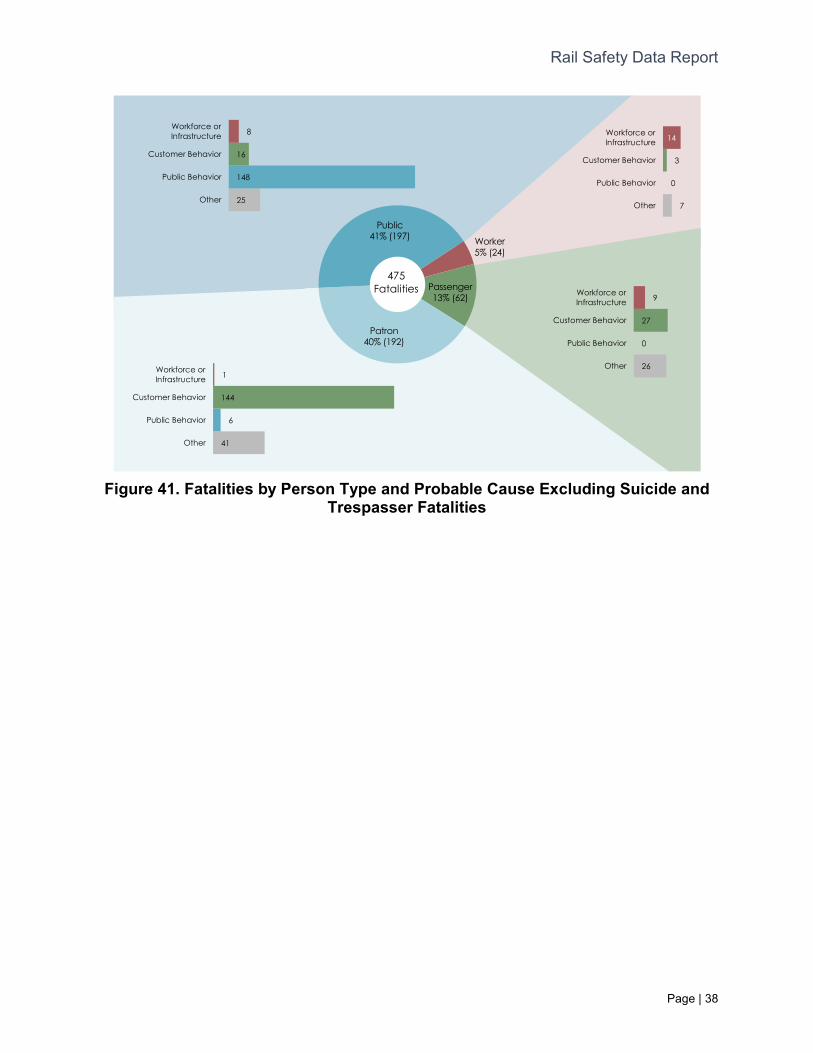
Figure 41. Fatalities by Person Type and Probable Cause Excluding Suicide and
Trespasser Fatalities
Rail Safety Data Report
Page | 39
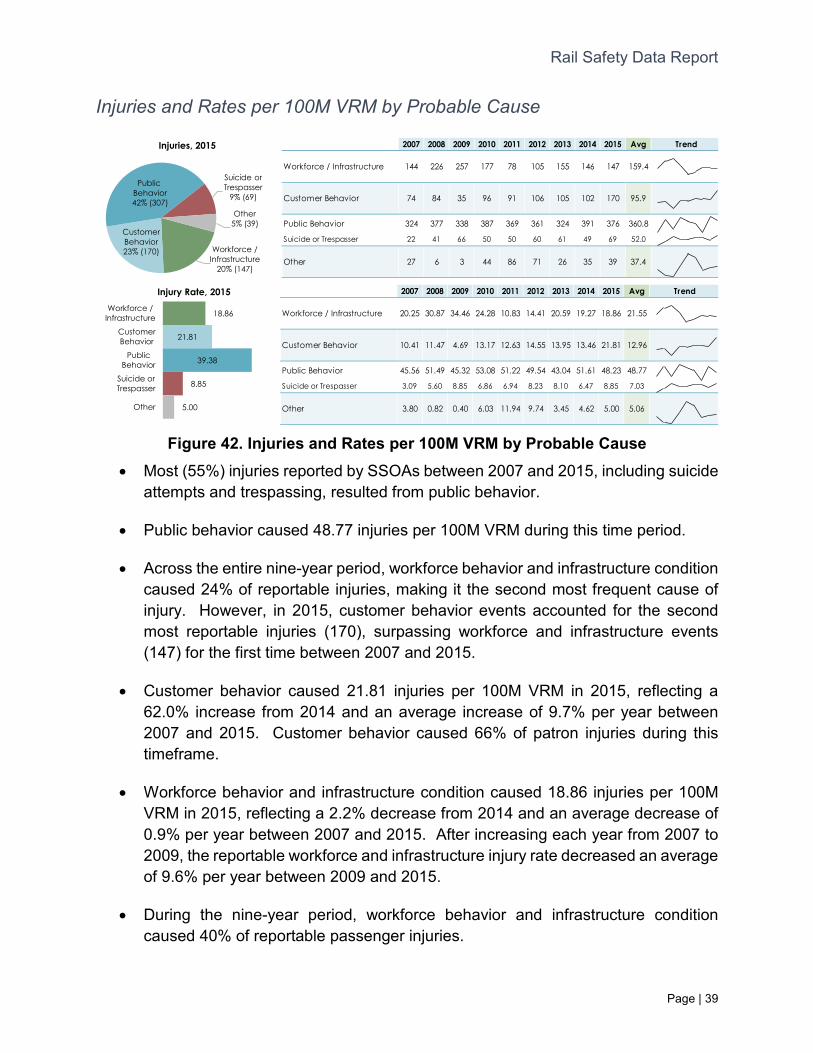
Injuries and Rates per 100M VRM by Probable Cause
Figure 42. Injuries and Rates per 100M VRM by Probable Cause
2007 2008 2009 2010 2011 2012 2013 2014 2015 Avg Trend
Workforce / Infrastructure 144 226 257 177 78 105 155 146 147 159.4
Customer Behavior 74 84 35 96 91 106 105 102 170 95.9
Public Behavior 324 377 338 387 369 361 324 391 376 360.8
Suicide or Trespasser 22 41 66 50 50 60 61 49 69 52.0
Other 27 6 3 44 86 71 26 35 39 37.4
2007 2008 2009 2010 2011 2012 2013 2014 2015 Avg Trend
Workforce / Infrastructure 20.25 30.87 34.46 24.28 10.83 14.41 20.59 19.27 18.86 21.55
Customer Behavior 10.41 11.47 4.69 13.17 12.63 14.55 13.95 13.46 21.81 12.96
Public Behavior 45.56 51.49 45.32 53.08 51.22 49.54 43.04 51.61 48.23 48.77
Suicide or Trespasser 3.09 5.60 8.85 6.86 6.94 8.23 8.10 6.47 8.85 7.03
Other 3.80 0.82 0.40 6.03 11.94 9.74 3.45 4.62 5.00 5.06
• Most (55%) injuries reported by SSOAs between 2007 and 2015, including suicide attempts and trespassing, resulted from public behavior.
• Public behavior caused 48.77 injuries per 100M VRM during this time period.
• Across the entire nine-year period, workforce behavior and infrastructure condition caused 24% of reportable injuries, making it the second most frequent cause of injury. However, in 2015, customer behavior events accounted for the second most reportable injuries (170), surpassing workforce and infrastructure events (147) for the first time between 2007 and 2015.
• Customer behavior caused 21.81 injuries per 100M VRM in 2015, reflecting a 62.0% increase from 2014 and an average increase of 9.7% per year between 2007 and 2015. Customer behavior caused 66% of patron injuries during this timeframe.
• Workforce behavior and infrastructure condition caused 18.86 injuries per 100M VRM in 2015, reflecting a 2.2% decrease from 2014 and an average decrease of 0.9% per year between 2007 and 2015. After increasing each year from 2007 to 2009, the reportable workforce and infrastructure injury rate decreased an average of 9.6% per year between 2009 and 2015.
• During the nine-year period, workforce behavior and infrastructure condition caused 40% of reportable passenger injuries.
Workforce /Infrastructure
20% (147)
CustomerBehavior23% (170)
Public Behavior42% (307)
Suicide orTrespasser
9% (69)
Other5% (39)
Injuries, 2015
18.86
21.81
39.38
8.85
5.00
Workforce /Infrastructure
CustomerBehavior
PublicBehavior
Suicide orTrespasser
Other
Injury Rate, 2015
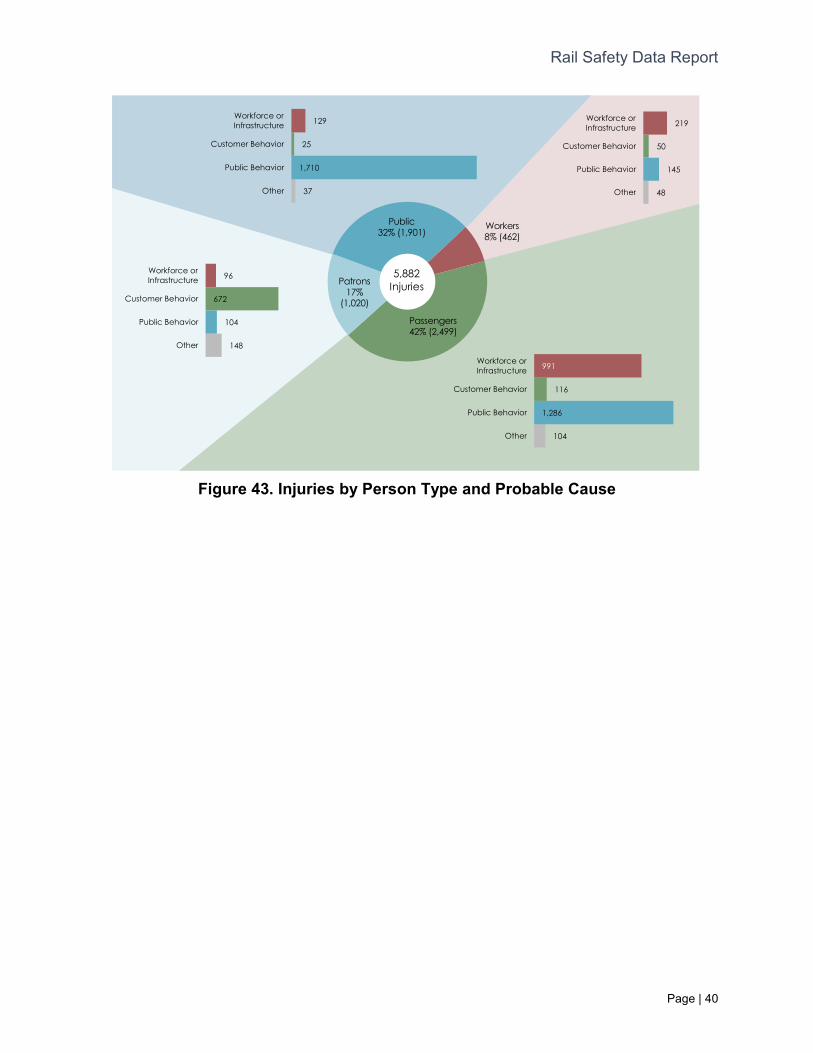
Rail Safety Data Report
Page | 40
Figure 43. Injuries by Person Type and Probable Cause
Rail Safety Data Report
Appendix | A-1
Appendix A. Definitions
Collision Type
For every reportable collision, SSOAs identify the object with which the rail transit train collided using one of the following categories:
• Auto: A non-transit motor vehicle
• Person: A human being who is not within a motor vehicle, including bicyclists
• Train: Another rail transit train, or a transit non-revenue vehicle
• Other: Any other object
Event
States require rail transit agencies to notify them within two hours of any event meeting the notification thresholds established at 49 C.F.R. § 659.33(a). The following thresholds define a reportable event:
• A fatality, as defined below;
• Injuries, as defined below, to two or more individuals;
• Property damage to rail transit vehicles, non-rail transit vehicles, other rail transit property or facilities, or non-transit property that equals or exceeds $25,000;
• An evacuation for reasons of life safety;
• A mainline derailment;
• A collision with an individual on a rail right-of-way; and
• A collision between a rail transit vehicle and a second rail transit vehicle or a rail transit non-revenue vehicle.
Event Type
SSOAs categorize every reportable event into one of the following five groups:
• Non-RGX Collisions: A reportable collision between a rail transit vehicle and any object or person that does NOT occur at a rail grade crossing or street intersection.
Rail Safety Data Report
Appendix | A-2
• RGX Collisions: A reportable collision between a rail transit vehicle and any other object or person that occurs at a rail grade crossing, including street intersections where trains are running at-grade.
• Derailments: Derailment of a rail transit vehicle from mainline or non-revenue track.
• Fires: Fires on transit agency property.
• Other: Any other event that surpasses the thresholds defined in the events section above. This report categorizes all suicide- and trespasser-related events as other events.
Fatality
Loss of life due to injuries sustained during a rail transit event, either confirmed at the scene of a rail transit event or within 30 days. This threshold is defined in 49 C.F.R. § 659.33(a).
Injury
Injuries sustained during a rail transit event that require immediate medical attention away from the scene. This threshold is defined at 49 C.F.R. § 659.33(a), and the data in this report reflects this definition.
Note that FTA has since promulgated 49 C.F.R. Part 674, which establishes a new definition of injury for the SSO program and SSOAs. As States move under the new rule, the injury threshold for investigation will change from “injury” to “serious injury.” 49 C.F.R. § 674.7 defines a serious injury as any injury that
• Requires hospitalization for more than 48 hours, commencing within seven days from the date the injury was received;
• Results in a fracture of any bone (except simple fractures of fingers, toes, or nose);
• Causes severe hemorrhages, or nerve, muscle, or tendon damage;
• Involves any internal organ; or
• Involves second- or third-degree burns, or any burns affecting more than five percent of the body surface.
Rail Safety Data Report
Appendix | A-3
Mode
A mode is a system for carrying passengers defined by a specific right-of-way, technology, and operational feature. As part of the SSO program, every SSOA identifies the modes operated by the transit agencies they oversee. For each reportable event, the SSOA identifies the applicable mode. Each mode is defined below:
• Heavy Rail: An electric railway that typically operates in long trains (six or more cars) on an exclusive right-of-way. (Note: One heavy rail system, the Port Authority Trans-Hudson (PATH), is regulated by the FRA and is not part of the SSO program).
• Light Rail: An electric railway that typically operates in short trains (up to four cars) on a combination of mixed traffic and exclusive rights-of-way with grade crossings.
• Streetcar: A rail system that typically operates in single-car trains with electric propulsion on mixed traffic rights-of-way.
• Hybrid Rail: A rail system that typically operates in short trains (up to four cars) with either electric or diesel propulsion on the national system of railroads. (Note: Three hybrid rail systems, the Portland Tri-Met Westside Express, the Austin Capital MetroRail, and the Denton County A-Train, are regulated by the FRA and are not included in the SSO program).
• Cable Car: A rail system that operates in single-car trains propelled by cables beneath the street on mixed traffic rights-of-way.
• Inclined Plane: A rail system operating on steep grades with vehicles powered by moving cables.
• Monorail/Automated Guideway: A rail system that typically operates in trains on a single rail guideway in an exclusive right-of-way.
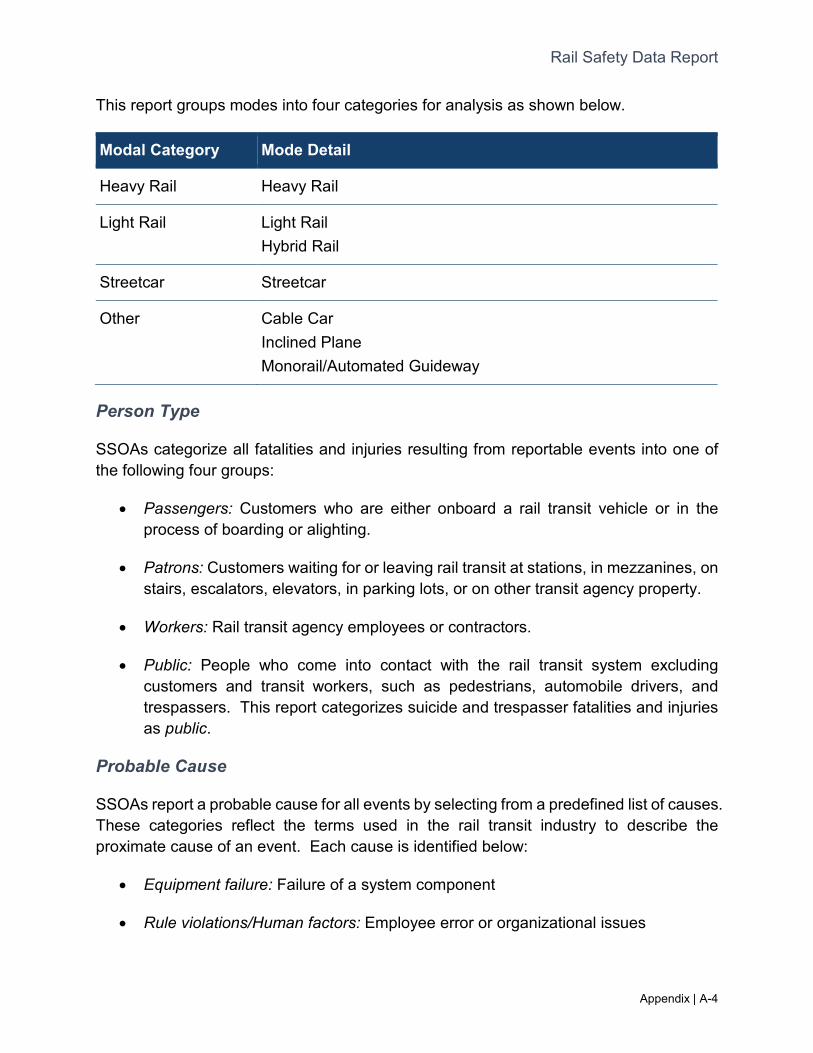
Rail Safety Data Report
Appendix | A-4
This report groups modes into four categories for analysis as shown below.
Modal Category Mode Detail
Heavy Rail Heavy Rail
Light Rail Light Rail Hybrid Rail
Streetcar Streetcar
Other Cable Car Inclined Plane Monorail/Automated Guideway
Person Type
SSOAs categorize all fatalities and injuries resulting from reportable events into one of the following four groups:
• Passengers: Customers who are either onboard a rail transit vehicle or in the process of boarding or alighting.
• Patrons: Customers waiting for or leaving rail transit at stations, in mezzanines, on stairs, escalators, elevators, in parking lots, or on other transit agency property.
• Workers: Rail transit agency employees or contractors.
• Public: People who come into contact with the rail transit system excluding customers and transit workers, such as pedestrians, automobile drivers, and trespassers. This report categorizes suicide and trespasser fatalities and injuries as public.
Probable Cause
SSOAs report a probable cause for all events by selecting from a predefined list of causes. These categories reflect the terms used in the rail transit industry to describe the proximate cause of an event. Each cause is identified below:
• Equipment failure: Failure of a system component
• Rule violations/Human factors: Employee error or organizational issues
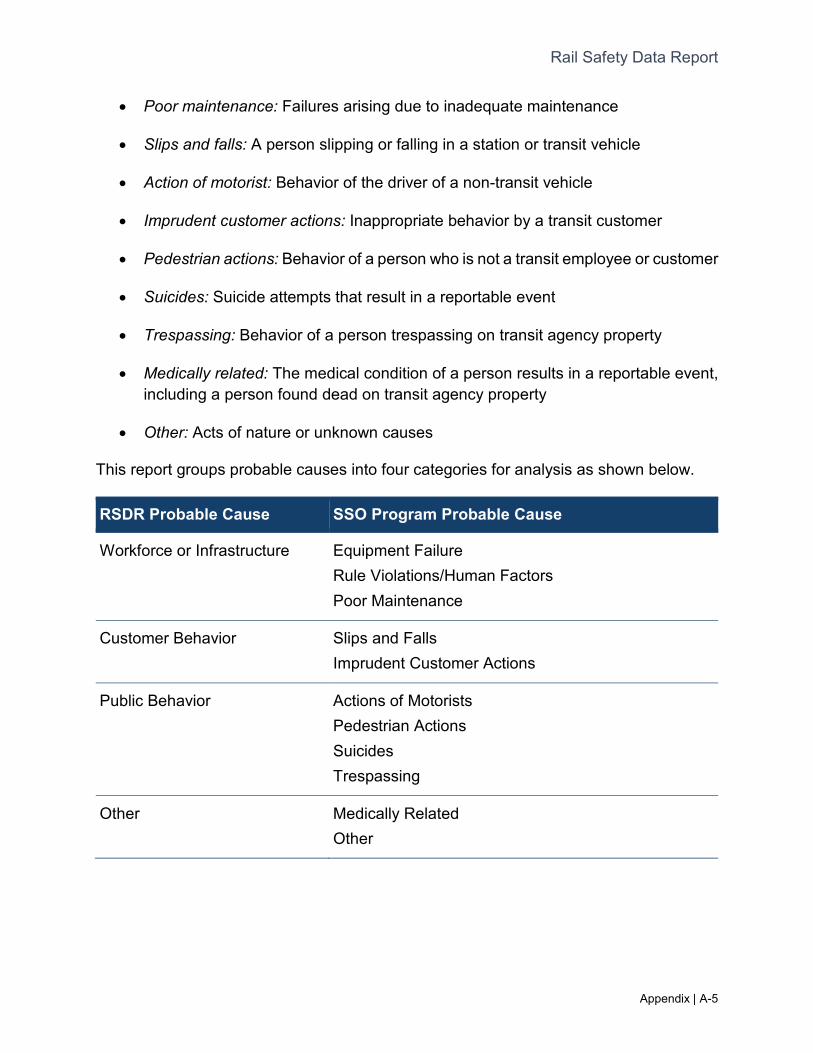
Rail Safety Data Report
Appendix | A-5
• Poor maintenance: Failures arising due to inadequate maintenance
• Slips and falls: A person slipping or falling in a station or transit vehicle
• Action of motorist: Behavior of the driver of a non-transit vehicle
• Imprudent customer actions: Inappropriate behavior by a transit customer
• Pedestrian actions: Behavior of a person who is not a transit employee or customer
• Suicides: Suicide attempts that result in a reportable event
• Trespassing: Behavior of a person trespassing on transit agency property
• Medically related: The medical condition of a person results in a reportable event, including a person found dead on transit agency property
• Other: Acts of nature or unknown causes
This report groups probable causes into four categories for analysis as shown below.
RSDR Probable Cause SSO Program Probable Cause
Workforce or Infrastructure Equipment Failure Rule Violations/Human Factors Poor Maintenance
Customer Behavior Slips and Falls Imprudent Customer Actions
Public Behavior Actions of Motorists Pedestrian Actions Suicides Trespassing
Other Medically Related Other
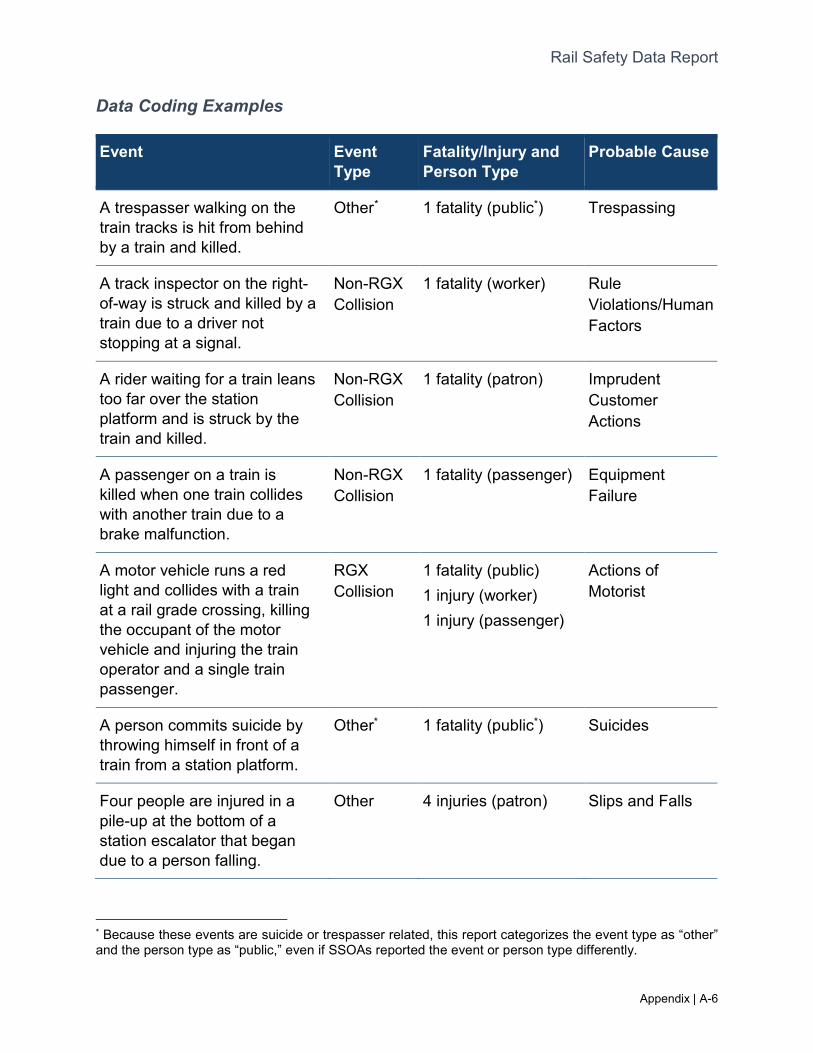
Rail Safety Data Report
Appendix | A-6
Data Coding Examples
Event Event Type
Fatality/Injury and Person Type
Probable Cause
A trespasser walking on the train tracks is hit from behind by a train and killed.
Other* 1 fatality (public*) Trespassing
A track inspector on the right-of-way is struck and killed by a train due to a driver not stopping at a signal.
Non-RGX Collision
1 fatality (worker) Rule Violations/Human Factors
A rider waiting for a train leans too far over the station platform and is struck by the train and killed.
Non-RGX Collision
1 fatality (patron) Imprudent Customer Actions
A passenger on a train is killed when one train collides with another train due to a brake malfunction.
Non-RGX Collision
1 fatality (passenger) Equipment Failure
A motor vehicle runs a red light and collides with a train at a rail grade crossing, killing the occupant of the motor vehicle and injuring the train operator and a single train passenger.
RGX Collision
1 fatality (public) 1 injury (worker) 1 injury (passenger)
Actions of Motorist
A person commits suicide by throwing himself in front of a train from a station platform.
Other* 1 fatality (public*) Suicides
Four people are injured in a pile-up at the bottom of a station escalator that began due to a person falling.
Other 4 injuries (patron) Slips and Falls
* Because these events are suicide or trespasser related, this report categorizes the event type as “other” and the person type as “public,” even if SSOAs reported the event or person type differently.
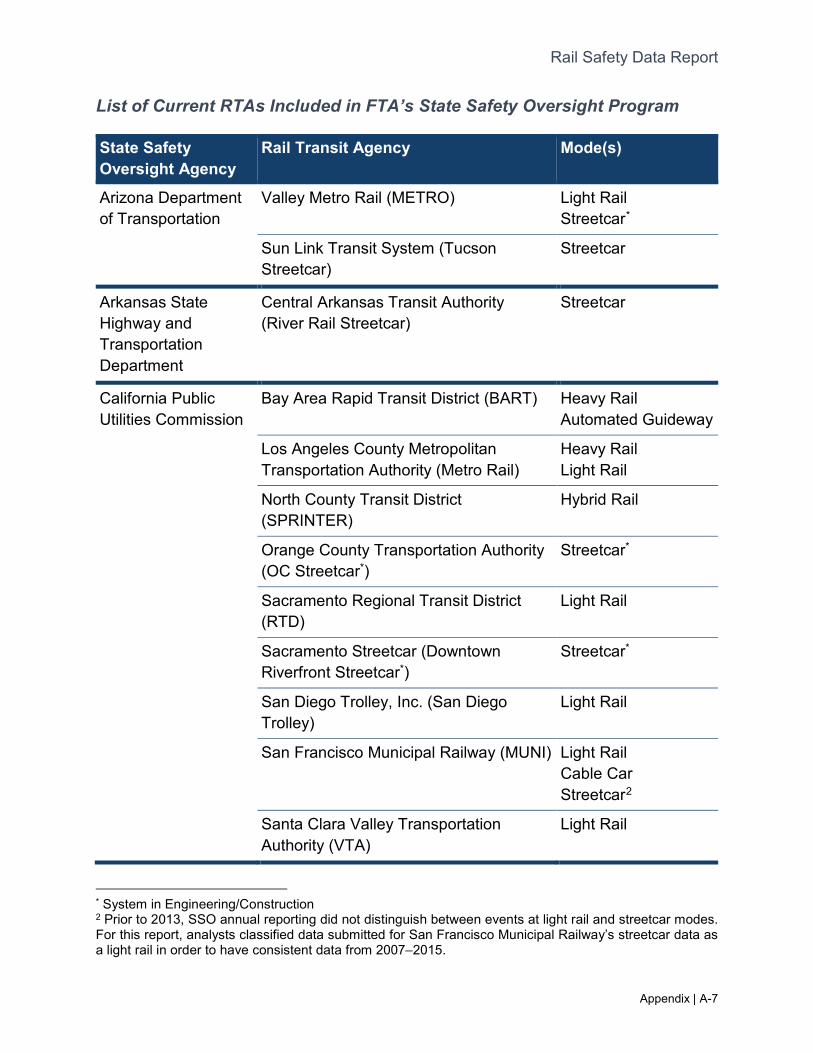
Rail Safety Data Report
Appendix | A-7
List of Current RTAs Included in FTA’s State Safety Oversight Program
State Safety Oversight Agency
Rail Transit Agency Mode(s)
Arizona Department of Transportation
Valley Metro Rail (METRO) Light Rail Streetcar*
- Sun Link Transit System (Tucson Streetcar)
Streetcar
Arkansas State Highway and Transportation Department
Central Arkansas Transit Authority (River Rail Streetcar)
Streetcar
California Public Utilities Commission
Bay Area Rapid Transit District (BART) Heavy Rail Automated Guideway
- Los Angeles County Metropolitan Transportation Authority (Metro Rail)
Heavy Rail Light Rail
- North County Transit District (SPRINTER)
Hybrid Rail
- Orange County Transportation Authority (OC Streetcar*)
Streetcar*
- Sacramento Regional Transit District (RTD)
Light Rail
- Sacramento Streetcar (Downtown Riverfront Streetcar*)
Streetcar*
- San Diego Trolley, Inc. (San Diego Trolley)
Light Rail
- San Francisco Municipal Railway (MUNI) Light Rail Cable Car Streetcar2
- Santa Clara Valley Transportation Authority (VTA)
Light Rail
* System in Engineering/Construction 2 Prior to 2013, SSO annual reporting did not distinguish between events at light rail and streetcar modes. For this report, analysts classified data submitted for San Francisco Municipal Railway’s streetcar data as a light rail in order to have consistent data from 2007–2015.
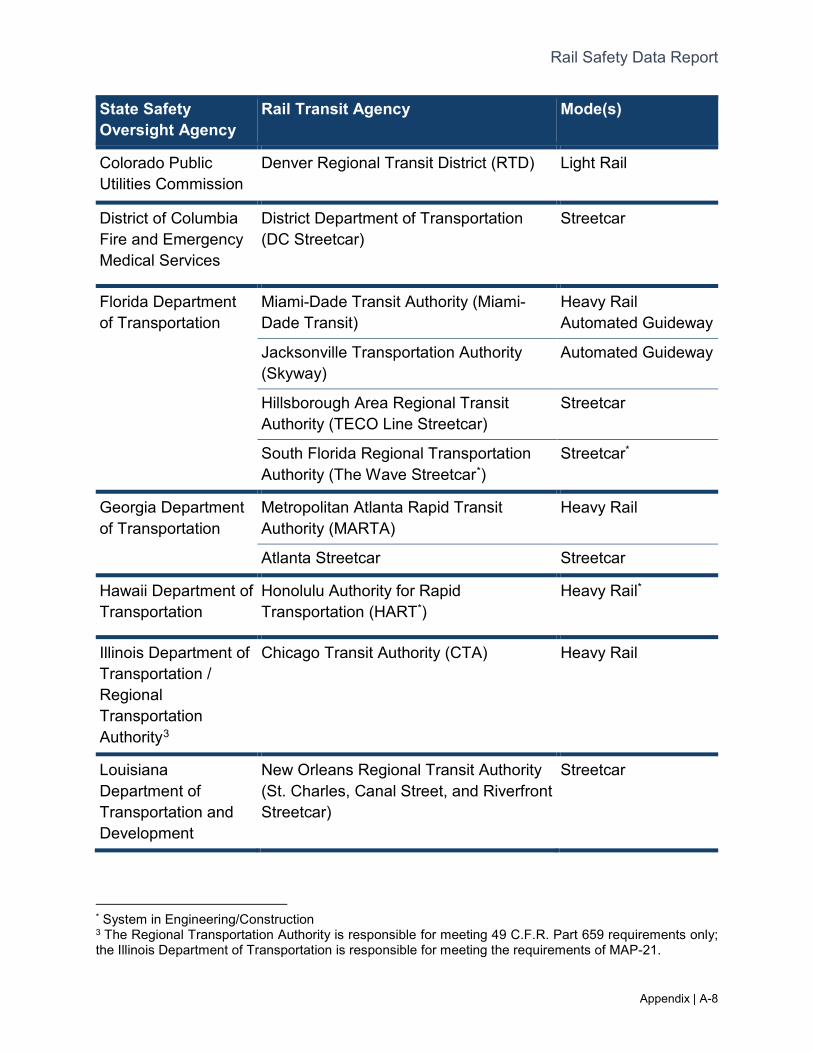
Rail Safety Data Report
Appendix | A-8
State Safety Oversight Agency
Rail Transit Agency Mode(s)
Colorado Public Utilities Commission
Denver Regional Transit District (RTD) Light Rail
District of Columbia Fire and Emergency Medical Services
District Department of Transportation (DC Streetcar)
Streetcar
Florida Department of Transportation
Miami-Dade Transit Authority (Miami-Dade Transit)
Heavy Rail Automated Guideway
- Jacksonville Transportation Authority (Skyway)
Automated Guideway
- Hillsborough Area Regional Transit Authority (TECO Line Streetcar)
Streetcar
- South Florida Regional Transportation Authority (The Wave Streetcar*)
Streetcar*
Georgia Department of Transportation
Metropolitan Atlanta Rapid Transit Authority (MARTA)
Heavy Rail
- Atlanta Streetcar Streetcar
Hawaii Department of Transportation
Honolulu Authority for Rapid Transportation (HART*)
Heavy Rail*
Illinois Department of Transportation / Regional Transportation Authority3
Chicago Transit Authority (CTA) Heavy Rail
Louisiana Department of Transportation and Development
New Orleans Regional Transit Authority (St. Charles, Canal Street, and Riverfront Streetcar)
Streetcar
* System in Engineering/Construction 3 The Regional Transportation Authority is responsible for meeting 49 C.F.R. Part 659 requirements only; the Illinois Department of Transportation is responsible for meeting the requirements of MAP-21.
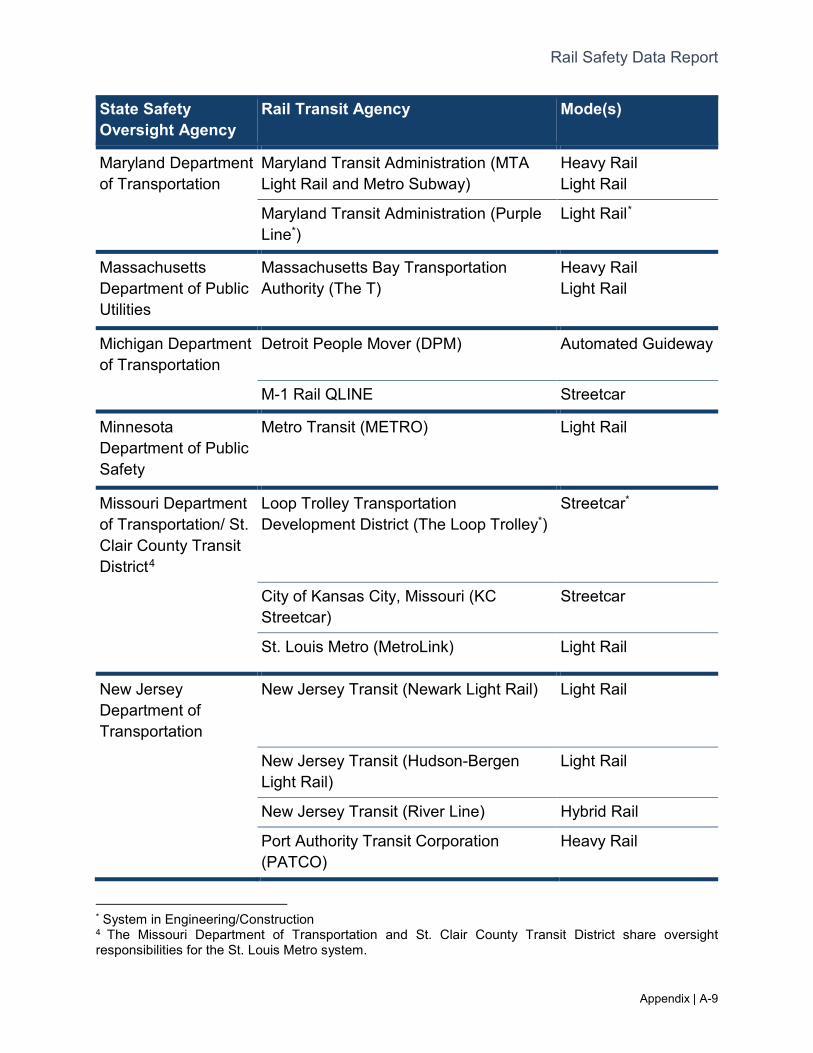
Rail Safety Data Report
Appendix | A-9
State Safety Oversight Agency
Rail Transit Agency Mode(s)
Maryland Department of Transportation
Maryland Transit Administration (MTA Light Rail and Metro Subway)
Heavy Rail Light Rail
- Maryland Transit Administration (Purple Line*)
Light Rail*
Massachusetts Department of Public Utilities
Massachusetts Bay Transportation Authority (The T)
Heavy Rail Light Rail
Michigan Department of Transportation
Detroit People Mover (DPM) Automated Guideway
- M-1 Rail QLINE Streetcar
Minnesota Department of Public Safety
Metro Transit (METRO) Light Rail
Missouri Department of Transportation/ St. Clair County Transit District4
Loop Trolley Transportation Development District (The Loop Trolley*)
Streetcar*
- City of Kansas City, Missouri (KC Streetcar)
Streetcar
- St. Louis Metro (MetroLink) Light Rail
New Jersey Department of Transportation
New Jersey Transit (Newark Light Rail) Light Rail
- New Jersey Transit (Hudson-Bergen Light Rail)
Light Rail
- New Jersey Transit (River Line) Hybrid Rail
- Port Authority Transit Corporation (PATCO)
Heavy Rail
* System in Engineering/Construction 4 The Missouri Department of Transportation and St. Clair County Transit District share oversight responsibilities for the St. Louis Metro system.
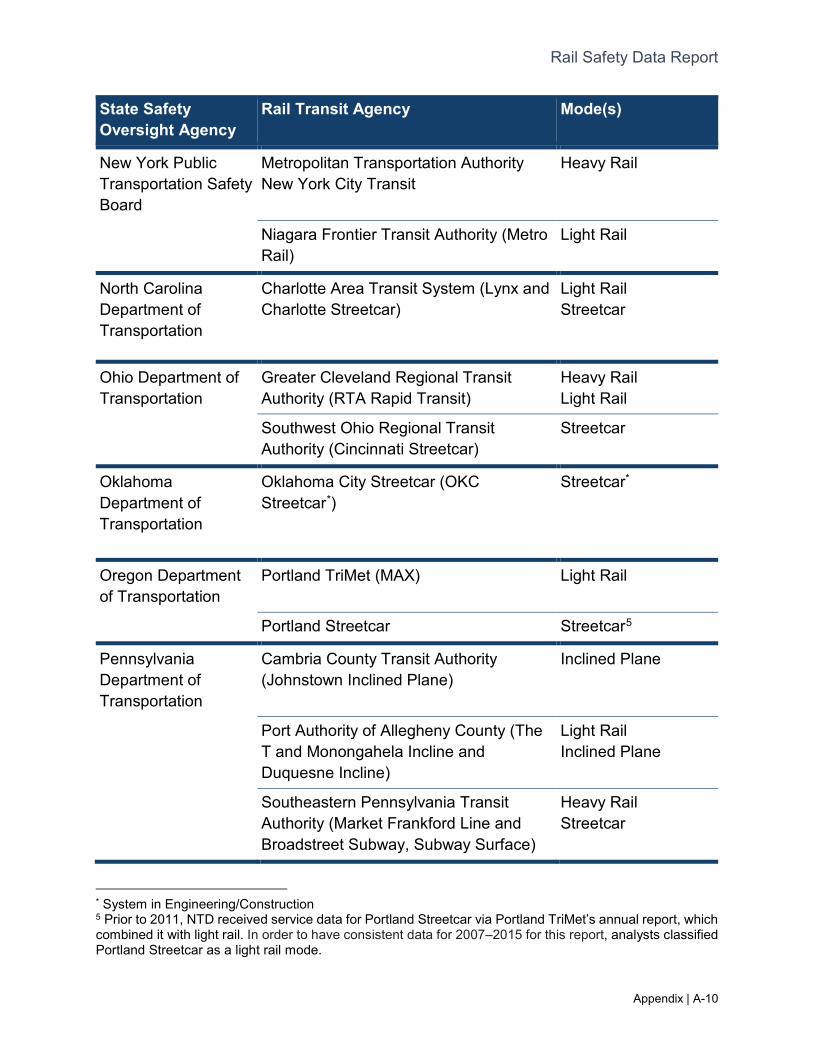
Rail Safety Data Report
Appendix | A-10
State Safety Oversight Agency
Rail Transit Agency Mode(s)
New York Public Transportation Safety Board
Metropolitan Transportation Authority New York City Transit
Heavy Rail
- Niagara Frontier Transit Authority (Metro Rail)
Light Rail
North Carolina Department of Transportation
Charlotte Area Transit System (Lynx and Charlotte Streetcar)
Light Rail Streetcar
Ohio Department of Transportation
Greater Cleveland Regional Transit Authority (RTA Rapid Transit)
Heavy Rail Light Rail
- Southwest Ohio Regional Transit Authority (Cincinnati Streetcar)
Streetcar
Oklahoma Department of Transportation
Oklahoma City Streetcar (OKC Streetcar*)
Streetcar*
Oregon Department of Transportation
Portland TriMet (MAX) Light Rail
- Portland Streetcar Streetcar5
Pennsylvania Department of Transportation
Cambria County Transit Authority (Johnstown Inclined Plane)
Inclined Plane
- Port Authority of Allegheny County (The T and Monongahela Incline and Duquesne Incline)
Light Rail Inclined Plane
- Southeastern Pennsylvania Transit Authority (Market Frankford Line and Broadstreet Subway, Subway Surface)
Heavy Rail Streetcar
* System in Engineering/Construction 5 Prior to 2011, NTD received service data for Portland Streetcar via Portland TriMet’s annual report, which combined it with light rail. In order to have consistent data for 2007–2015 for this report, analysts classified Portland Streetcar as a light rail mode.
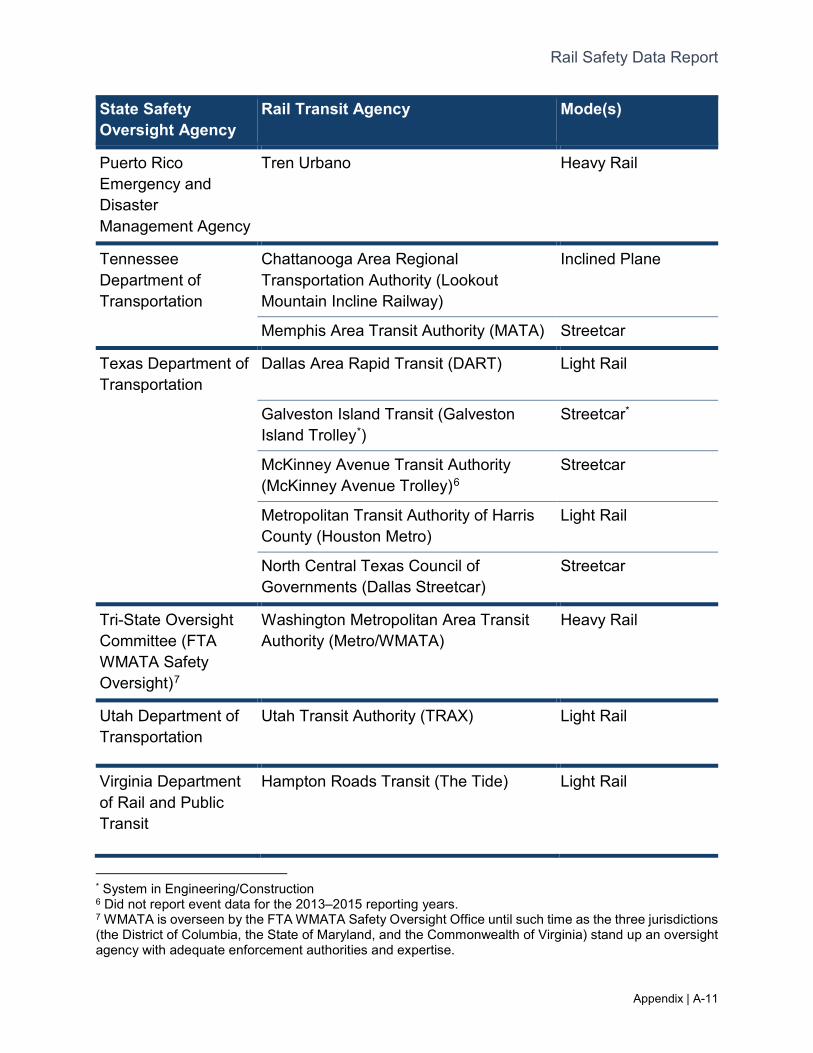
Rail Safety Data Report
Appendix | A-11
State Safety Oversight Agency
Rail Transit Agency Mode(s)
Puerto Rico Emergency and Disaster Management Agency
Tren Urbano Heavy Rail
Tennessee Department of Transportation
Chattanooga Area Regional Transportation Authority (Lookout Mountain Incline Railway)
Inclined Plane
- Memphis Area Transit Authority (MATA) Streetcar
Texas Department of Transportation
Dallas Area Rapid Transit (DART) Light Rail
- Galveston Island Transit (Galveston Island Trolley*)
Streetcar*
- McKinney Avenue Transit Authority (McKinney Avenue Trolley)6
Streetcar
- Metropolitan Transit Authority of Harris County (Houston Metro)
Light Rail
- North Central Texas Council of Governments (Dallas Streetcar)
Streetcar
Tri-State Oversight Committee (FTA WMATA Safety Oversight)7
Washington Metropolitan Area Transit Authority (Metro/WMATA)
Heavy Rail
Utah Department of Transportation
Utah Transit Authority (TRAX) Light Rail
Virginia Department of Rail and Public Transit
Hampton Roads Transit (The Tide) Light Rail
* System in Engineering/Construction 6 Did not report event data for the 2013–2015 reporting years. 7 WMATA is overseen by the FTA WMATA Safety Oversight Office until such time as the three jurisdictions (the District of Columbia, the State of Maryland, and the Commonwealth of Virginia) stand up an oversight agency with adequate enforcement authorities and expertise.
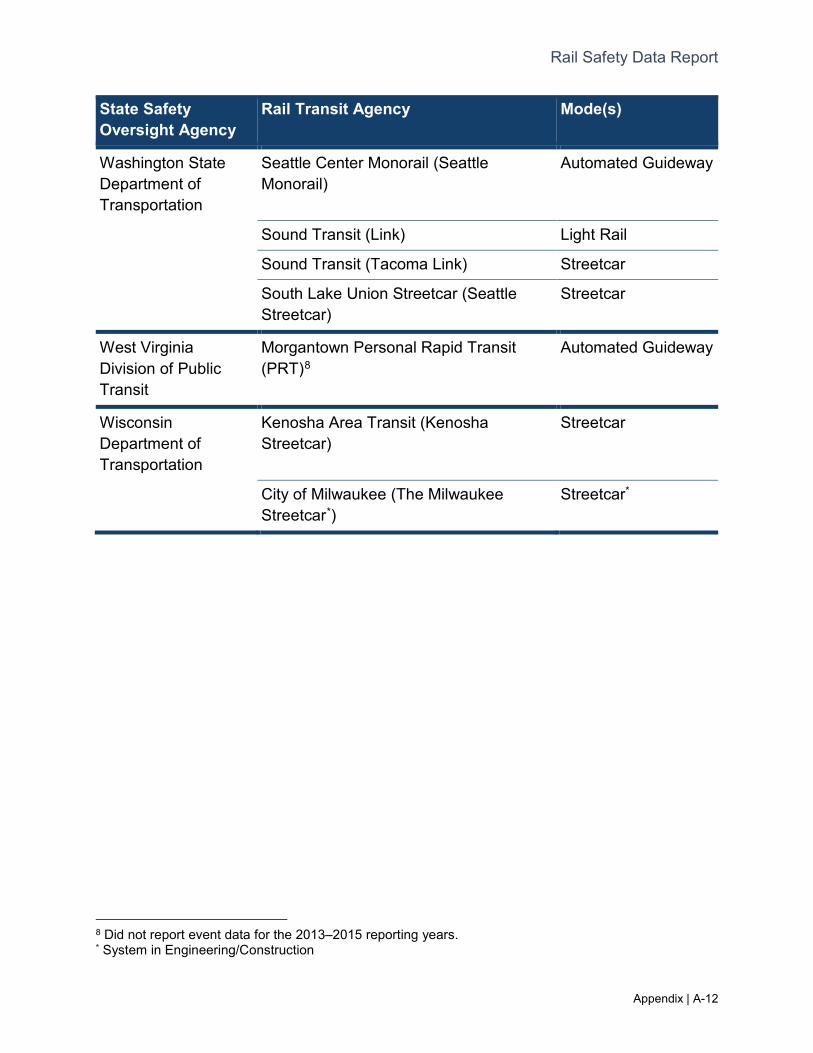
Rail Safety Data Report
Appendix | A-12
State Safety Oversight Agency
Rail Transit Agency Mode(s)
Washington State Department of Transportation
Seattle Center Monorail (Seattle Monorail)
Automated Guideway
- Sound Transit (Link) Light Rail
- Sound Transit (Tacoma Link) Streetcar
- South Lake Union Streetcar (Seattle Streetcar)
Streetcar
West Virginia Division of Public Transit
Morgantown Personal Rapid Transit (PRT)8
Automated Guideway
Wisconsin Department of Transportation
Kenosha Area Transit (Kenosha Streetcar)
Streetcar
- City of Milwaukee (The Milwaukee Streetcar*)
Streetcar*
8 Did not report event data for the 2013–2015 reporting years. * System in Engineering/Construction
Rail Safety Data Report
Appendix | B-1
Appendix B. Data Management Practices
For the years reviewed in this report, the SSO program captured event and associated probable causes for all events meeting the thresholds established in 49 C.F.R. § 659.33. Part 659 requires SSOAs to investigate (or trigger the investigation of) any event meeting at least one of the thresholds. Please see Table 2 of this report for these thresholds.
During the same period, the NTD program used different reporting thresholds for rail transit agencies. As a result, there are events in the NTD that are not represented in the SSO program dataset (no SSOA investigation was required). And, similarly, there are some events that required SSOA investigation but did not meet NTD reporting thresholds.
The RSDR relies on probable cause data for its analyses. For this reason, the report uses SSO program event data and not NTD data.
Since FTA’s last publication of SSO rail safety performance data in 2010, the Government Accountability Office (GAO) and the USDOT Office of Inspector General (OIG) have both issued recommendations to FTA regarding safety and security data management practices. The FTA responded to the GAO and OIG concerns through actions to address safety data issues as detailed in the text that follows.
The FTA has executed the Legacy Data Project to resolve discrepancies between the older SSO and NTD datasets. The FTA analysts have compared each safety and security event reported to the SSO program against all events reported to the NTD between 2007 and 2011. These efforts have resulted in a revised SSO Rail Event Database based on the cross-validation and subsequent data confirmation with SSOAs.
The FTA reviewed the datasets to identify discrepancies, such as events reported in one database and not the other, as well as discrepancies in specific fields, including date, location, event type, injury/fatality count, person type, property damage, and collision details. The FTA identified approximately 1,300 issues for reconciliation.
The FTA conducted an outreach effort to review all identified issues with representatives at the responsible SSOAs. SSOAs resubmitted event information where applicable, and FTA updated the SSO Rail Event Database based on these revised data.
In 2011, FTA revised its SSO program Excel-based event data collection tool to include systematic internal controls and validation checks to prevent data submission errors. The data tool includes logic that informs users of data issues
Rail Safety Data Report
Appendix | B-2
and notifies them when no issues remain in entered data and the report is ready for submission to FTA.
Beginning with 2012, FTA has implemented a cross-comparison between NTD and SSO datasets to resolve discrepancies. The FTA has executed changes to NTD reporting thresholds and definitions to support this capability. The FTA also developed the SSO Rail Event Database revision procedures. These procedures strengthen the SSO Rail Event Database internal controls by strictly defining how records can be updated. Under these stricter procedures, FTA only updates SSO rail event data following a formal submission from an SSOA. The FTA uses these procedures for any modifications of the dataset, including revisions resulting from the Legacy Data Project.
In 2014, FTA launched its web-based data collection module to streamline reporting for SSOAs, increase transparency, and enforce enhanced form-level data validation and controls.
Current Data Management Activity
FTA is currently in the process of further integrating its SSO program and NTD safety data collection mechanisms. When complete, this integration effort will provide SSOAs with access to event records their overseen rail transit agencies have submitted to the NTD and will allow SSOAs to add investigation details, such as probable cause data. This effort will reduce overall reporting burden on SSOAs and will improve data quality by identifying discrepancies earlier and resolving them sooner. These changes help FTA release updates to the RSDR and produce other safety analyses on a faster schedule than was supported by the previous data structure.
.
Rail Safety Data Report
Appendix | C-1
Appendix C. Methodology
Rationale for Study Period
The current version of 49 C.F.R. Part 659 has been in effect since May 1, 2006. The amendments to those rules include significant changes to the thresholds that define reportable events and affect event reporting and investigation requirements. Although some SSOAs submitted their 2006 annual reports in compliance with the new requirements, others had not tracked events that occurred prior to May 2006 in accordance with the new thresholds. As such, 2007 marks the first full year that the SSO community uniformly applied the revised Part 659 reporting criteria. Thus, data from 2007 are the first data available for use in this analysis.
Data Collection
Part 659 requires SSOAs to provide annual reports to FTA. These annual reports include data related to events defined by 49 C.F.R. § 659.33(a), which is summarized in the event definition in Appendix A.
Ongoing Data Validation
Since 2010, FTA has used event data submitted to the National Transit Database (NTD) by rail transit agencies to validate event data submitted by SSOAs. While the NTD data do not include causal information, FTA can use a rail transit agency's NTD event report to validate event details reported by SSOAs.
The FTA evaluates each event submitted by an SSOA to ensure that the information is not in conflict with data submitted by rail transit agencies to the NTD. FTA analysts coordinate with States and rail transit agencies to resolve discrepancies. Depending on the discrepancy, the rail transit agency may revise an NTD report, or, alternatively, the SSOA may resubmit event data to the SSO program.
Data Analysis
Once SSO program event data have been collected and validated, FTA analyzes the data using conventional techniques in order to characterize rail transit event trends across the industry, including:
• Fatalities
• Injuries
Rail Safety Data Report
Appendix | C-2
• Person type of fatalities and injuries
• Rail transit mode
• Event type
• Object collided with (collision events for heavy rail, light rail, and streetcar mode categories only)
• Probable cause (in causal groups)
Unless otherwise noted, this report calculates annual average percentage change over multiple years as
𝑟𝑟 = (𝐶𝐶𝑎𝑎𝐶𝐶𝑏𝑏
)1𝑦𝑦 − 1,
which is a transformation of
𝐶𝐶𝑎𝑎 = 𝐶𝐶𝑏𝑏(1 + 𝑟𝑟)𝑦𝑦.
𝐶𝐶𝑎𝑎 is the count in the later year; 𝐶𝐶𝑏𝑏 is the count in the earlier year; 𝑟𝑟 is the annual average rate of change; 𝑦𝑦 is the number of years between the two counts.
In the calculation, 𝑟𝑟 reflects a uniform annual change rate across a 𝑦𝑦 year period, with the first-year count 𝐶𝐶𝑎𝑎 and the last-year count 𝐶𝐶𝑏𝑏. This calculation method results in a number that is more comparable to a single year percentage change than the results of other calculation methods.
Data Normalization
The FTA normalizes data prior to some data analyses in order to account for the different amounts of service provided by each mode and the rail transit industry across time. The FTA calculates a rate per 100M VRM for all standardization in these analyses.
FTA analysts obtain VRM data from NTD’s annual reporting service module. Rail transit agencies report these data on NTD form S-10 for each reporting year.