Embed Size (px)
Citation preview
Brazil TAV: Vol 4 – Rail Operations & Technology – Pt 1 – Final Report TAV-HA-OPE-REP-40034-01
BRAZIL TAV PROJECT
Halcrow – Sinergia Consortium
June 2009
VOLUME 4
RAIL OPERATIONS AND TECHNOLOGY
Part 1: Rail OperationsFinal Report
Brazil TAV: Vol 4 – Rail Operations & Technology – Pt 1 – Final Report TAV-HA-OPE-REP-40034-01
Brazil TAV
Halcrow - Sinergia Consortium
VOLUME 4
Rail Operations and Technology
Part 1: Rail Operations
Final Report
Contents Amendment Record
This report has been issued and amended as follows:
Issue Revision Description Date Initial
0 0 Draft Report compiled 27/11/08 MJ
0 1 Draft Report checked 05/12/08 RB
0 2 Comments from Client added 12/02/09 CH
0 2 Comments from Client added 12/02/09 CH
1 0 Preliminary Report 13/03/09 MJ
1 1 Preliminary Report updated 17/03/09 RB
2 1 Draft Final Report compiled 28/03/09 DR
2 2 Draft Final Report formatchecked
28/03/09 MJ
3 1 3rd
revision of Draft FinalReport
28/05/09 MJ
4 1 Final Report following Rio deJaneiro meetings
22/06/09 MJ
Brazil TAV: Vol 4 – Rail Operations & Technology – Pt 1 – Final Report TAV-HA-OPE-REP-40034-01
Contents
1 Overview ................................................................................................................. 1
1.1 Introduction to TAV Project ........................................................................................... 1
1.2 Update on previous reports........................................................................................... 1
1.3 Introduction to High Speed Rail .................................................................................... 2
1.4 TAV Engineering Standards ......................................................................................... 3
1.5 TAV Alignment and Stations......................................................................................... 4
1.6 Timetable Development ................................................................................................ 6
2 Timetabling and Operations ................................................................................ 11
2.1 Introduction ................................................................................................................. 11
2.2 Timetable Planning ..................................................................................................... 11
2.3 Timetable Planning Tools ........................................................................................... 13
2.4 Railsys Journey Time Simulation................................................................................ 15
2.5 TAV Stations and Depots............................................................................................ 23
2.6 VoyagerPlan Timetabling............................................................................................ 29
2.7 Turnaround Times & Unit Numbers ............................................................................ 33
3 TAV Operating Costs ........................................................................................... 36
3.1 Introduction ................................................................................................................. 36
3.2 Basis of Operating Costs ............................................................................................ 37
3.3 Permanent Way .......................................................................................................... 38
3.4 Maintenance of Structures .......................................................................................... 41
3.5 Train and Customer Service ....................................................................................... 41
3.6 Rolling Stock Maintenance ......................................................................................... 41
3.7 Complementary Costs ................................................................................................ 44
3.8 Opex Summary ........................................................................................................... 44
Appendix A: Guarulhos Airport Technical Note.......................................................... 47
Appendix B: PROMPT Engenharia OPEX Analysis......................................................48
Index of Figures
Figure 1-1: TAV Study .........................................................................................................................2
Figure 1-2: TAV Schematic .................................................................................................................4
Figure 2-1: Key Train Planning Process............................................................................................12
Figure 2-2: 2014 Peak Hour Service Standard Pattern.....................................................................19
Figure 2-3: Barão De Mauá Station lay-out .......................................................................................24
Figure 2-4: Barão De Mauá Station approach...................................................................................24
Brazil TAV: Vol 4 – Rail Operations & Technology – Pt 1 – Final Report TAV-HA-OPE-REP-40034-01
Figure 2-5: Galeão International Airport Station showing access to terminals..................................24
Figure 2-6: Galeão International Airport Station layout .....................................................................25
Figure 2-7: Barra Mansa/Volta Redonda Station layout....................................................................25
Figure 2-8: São José dos Campos Station layout .............................................................................25
Figure 2-9: Guarulhos International Airport Station layout ................................................................25
Figure 2-10: Campo de Marte Station lay-out ...................................................................................26
Figure 2-11: Viracopos Airport Station layout....................................................................................26
Figure 2-12: Campinas Station layout ...............................................................................................26
Figure 2-13: Proposed Route Layout ................................................................................................28
Figure 2-14: VoyagerPlan Train Service Output ...............................................................................32
Figure 2-15: VoyagerPlan Platform Occupation................................................................................33
Figure 3-1: Opex Profile 2014 – 2034 (R$ k Constant) .....................................................................46
Index of Tables
Table 1-1: Total Traffic Forecast by Origin & Destination Station (000 Trips): 2014 ..........................7
Table 1-2: Total Traffic Forecast by Origin & Destination Station (000 Trips): 2024 ..........................8
Table 1-3: Total Traffic Forecast by Origin & Destination Station (000 Trips): 2034 ..........................8
Table 1-4: Total Traffic Forecast by Origin & Destination Station (000 Trips): 2044 ..........................9
Table 2-1: High Speed Train Characteristics ....................................................................................14
Table 2-2: Location of Major Tunnels and Speed Restrictions .........................................................17
Table 2-3: TAV Frequency by Station ...............................................................................................18
Table 2-4: Express Train Service Journey Times at 300km/h...........................................................20
Table 2-5: Regional Long Distance Services at 300km/h .................................................................20
Table 2-6: Regional Short Distance Trains at 300km/h.....................................................................20
Table 2-7: Train Service Running Times (300 km/h).........................................................................22
Table 2-8: Station Characteristics and Locations..............................................................................23
Table 2-9: Average Occupation by Type of Service..........................................................................30
Brazil TAV: Vol 4 – Rail Operations & Technology – Pt 1 – Final Report TAV-HA-OPE-REP-40034-01
Table 2-10: Basic Service Pattern by Type of Service and Year ......................................................31
Table 2-11: Train Service Turnaround Times....................................................................................34
Table 2-12: Number of Train Sets by year ........................................................................................35
Table 3-1: Cost Drivers for Operating Cost Model ............................................................................36
Table 3-2: Exchange Rates 2009 ......................................................................................................38
Table 3-3: Permanent Way Maintenance Costs................................................................................39
Table 3-4: Cost of Infrastructure Maintenance by Country (2002/2009 prices, €/ track km).............40
Table 3-5: 2014 Profiled Maintenance Costs ....................................................................................40
Table 3-6: Maintenance of Structures ...............................................................................................41
Table 3-7: 2014 Annual Staff Costs...................................................................................................42
Table 3-8: Traction & Rolling Stock Annual Maintenance.................................................................42
Table 3-9: Energy Consuption - Barão de Mauá to Campinas .........................................................43
Table 3-10: Energy Consumption - Campinas to Barão de Mauá ....................................................43
Table 3-11: Energy Consumption - Barão de Mauá to Campo de Marte (Non-Stop) .......................43
Table 3-12: Energy Consumption - Campo de Marte to Barão de Mauá (Non-Stop) .......................44
Table 3-13: Complementary Costs....................................................................................................44
Table 3-14: Summary of Opex, 2014, 2024, 2034 and 2044 R$k.....................................................45
Brazil TAV: Vol 4 – Rail Operations & Technology – Pt 1 – Final Report TAV-HA-OPE-REP-40034-01
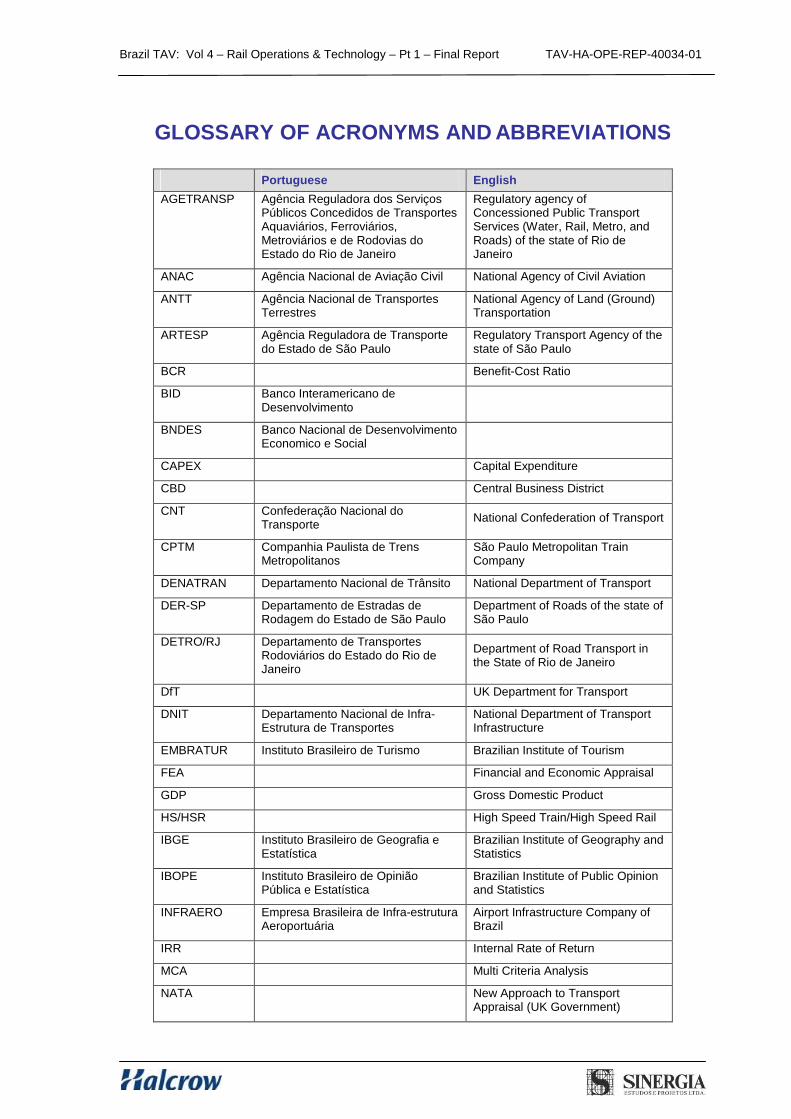
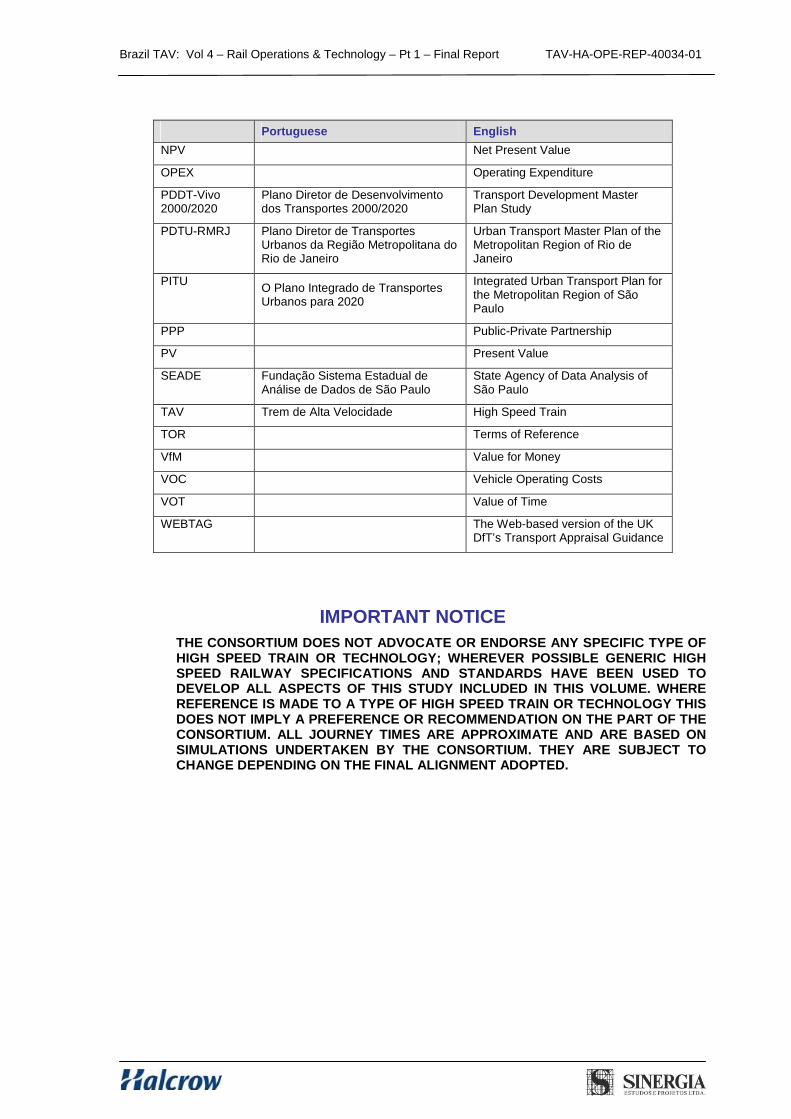
GLOSSARY OF ACRONYMS AND ABBREVIATIONS
Portuguese English
AGETRANSP Agência Reguladora dos ServiçosPúblicos Concedidos de TransportesAquaviários, Ferroviários,Metroviários e de Rodovias doEstado do Rio de Janeiro
Regulatory agency ofConcessioned Public TransportServices (Water, Rail, Metro, andRoads) of the state of Rio deJaneiro
ANAC Agência Nacional de Aviação Civil National Agency of Civil Aviation
ANTT Agência Nacional de TransportesTerrestres
National Agency of Land (Ground)Transportation
ARTESP Agência Reguladora de Transportedo Estado de São Paulo
Regulatory Transport Agency of thestate of São Paulo
BCR Benefit-Cost Ratio
BID Banco Interamericano deDesenvolvimento
BNDES Banco Nacional de DesenvolvimentoEconomico e Social
CAPEX Capital Expenditure
CBD Central Business District
CNT Confederação Nacional doTransporte
National Confederation of Transport
CPTM Companhia Paulista de TrensMetropolitanos
São Paulo Metropolitan TrainCompany
DENATRAN Departamento Nacional de Trânsito National Department of Transport
DER-SP Departamento de Estradas deRodagem do Estado de São Paulo
Department of Roads of the state ofSão Paulo
DETRO/RJ Departamento de TransportesRodoviários do Estado do Rio deJaneiro
Department of Road Transport inthe State of Rio de Janeiro
DfT UK Department for Transport
DNIT Departamento Nacional de Infra-Estrutura de Transportes
National Department of TransportInfrastructure
EMBRATUR Instituto Brasileiro de Turismo Brazilian Institute of Tourism
FEA Financial and Economic Appraisal
GDP Gross Domestic Product
HS/HSR High Speed Train/High Speed Rail
IBGE Instituto Brasileiro de Geografia eEstatística
Brazilian Institute of Geography andStatistics
IBOPE Instituto Brasileiro de OpiniãoPública e Estatística
Brazilian Institute of Public Opinionand Statistics
INFRAERO Empresa Brasileira de Infra-estruturaAeroportuária
Airport Infrastructure Company ofBrazil
IRR Internal Rate of Return
MCA Multi Criteria Analysis
NATA New Approach to TransportAppraisal (UK Government)
Brazil TAV: Vol 4 – Rail Operations & Technology – Pt 1 – Final Report TAV-HA-OPE-REP-40034-01
Portuguese English
NPV Net Present Value
OPEX Operating Expenditure
PDDT-Vivo2000/2020
Plano Diretor de Desenvolvimentodos Transportes 2000/2020
Transport Development MasterPlan Study
PDTU-RMRJ Plano Diretor de TransportesUrbanos da Região Metropolitana doRio de Janeiro
Urban Transport Master Plan of theMetropolitan Region of Rio deJaneiro
PITUO Plano Integrado de TransportesUrbanos para 2020
Integrated Urban Transport Plan forthe Metropolitan Region of SãoPaulo
PPP Public-Private Partnership
PV Present Value
SEADE Fundação Sistema Estadual deAnálise de Dados de São Paulo
State Agency of Data Analysis ofSão Paulo
TAV Trem de Alta Velocidade High Speed Train
TOR Terms of Reference
VfM Value for Money
VOC Vehicle Operating Costs
VOT Value of Time
WEBTAG The Web-based version of the UKDfT’s Transport Appraisal Guidance
IMPORTANT NOTICE
THE CONSORTIUM DOES NOT ADVOCATE OR ENDORSE ANY SPECIFIC TYPE OFHIGH SPEED TRAIN OR TECHNOLOGY; WHEREVER POSSIBLE GENERIC HIGHSPEED RAILWAY SPECIFICATIONS AND STANDARDS HAVE BEEN USED TODEVELOP ALL ASPECTS OF THIS STUDY INCLUDED IN THIS VOLUME. WHEREREFERENCE IS MADE TO A TYPE OF HIGH SPEED TRAIN OR TECHNOLOGY THISDOES NOT IMPLY A PREFERENCE OR RECOMMENDATION ON THE PART OF THECONSORTIUM. ALL JOURNEY TIMES ARE APPROXIMATE AND ARE BASED ONSIMULATIONS UNDERTAKEN BY THE CONSORTIUM. THEY ARE SUBJECT TOCHANGE DEPENDING ON THE FINAL ALIGNMENT ADOPTED.
Brazil TAV: Vol 4 – Rail Operations & Technology – Pt 1 – Final Report TAV-HA-OPE-REP-40034-01
Page 1 of 48
1 Overview
1.1 Introduction to TAV Project
1.1.1 In 2008, the Inter-American Development Bank (IDB) commissioned Halcrow Group Ltd andSinergia Estudos e Projetos LTDA (together the “Consortium”) to prepare a feasibility studyfor a high speed railway line, with a maximum line speed of 350km/h, over 511 kilometresconnecting the cities of Rio de Janeiro, São Paulo and Campinas
1in Brazil.
1.1.2 The Consortium has undertaken detailed studies summarised in the following volumes, asfollows:
Executive Summary;
Volume 1: Demand and Revenue Forecasts;
Volume 2: Alignment Studies;
Volume 3: Finance and Economics Appraisal and Concessioning;
Volume 4: Part 1- Rail Operations and Volume 4: Part 2 - Technology;
Volume 5: TAV Capital Cost; and
Volume 6: Real Estate.
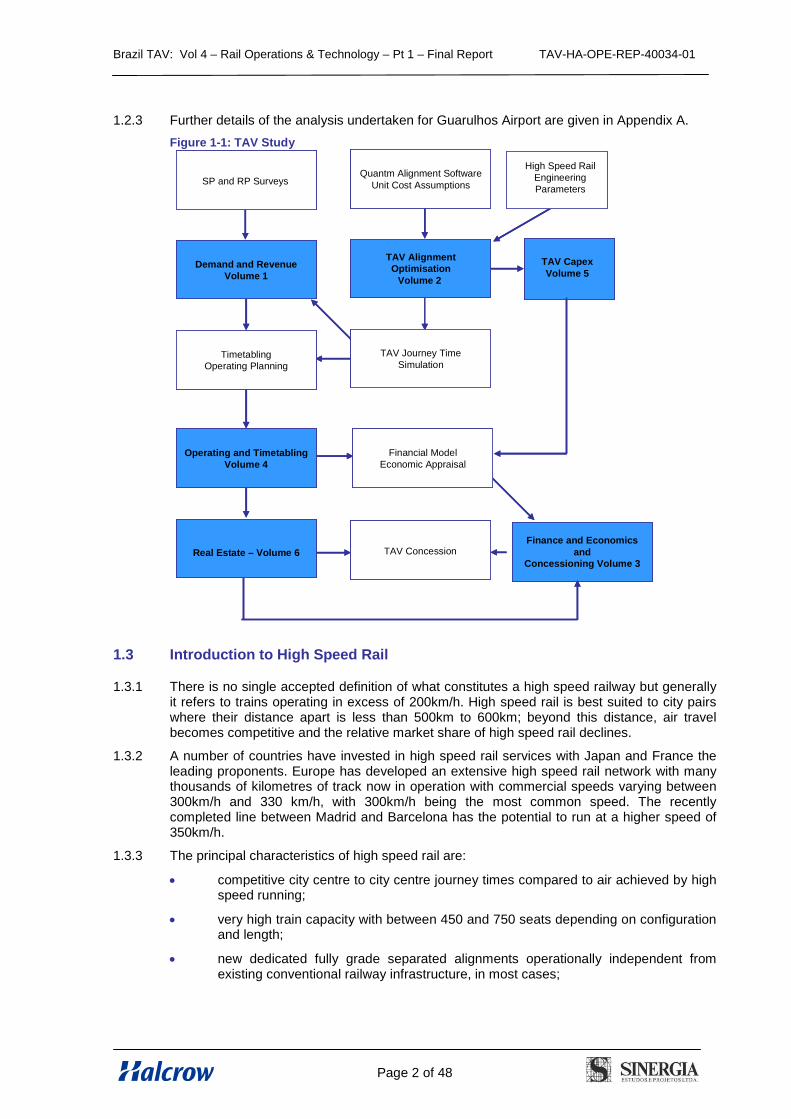
1.1.3 Figure 1-1 shows the overall relationship between each study volume.
1.1.4 This volume presents the results of the work in Volume 4: Part 1 - Operations and isorganised as follows:
Chapter 2: Timetabling and Operations; and
Chapter 3: Operating Cost estimates (OPEX).
1.2 Update on previous reports
1.2.1 Previous versions of this report considered the operation of an airport shuttle serviceconnecting Campo de Marte and Guarulhos International Airport in São Paulo State. Initialestimates of demand for the airport shuttle service gave a forecast of 5.2 million passengersin 2008. This volume of passengers required a minimum of three trains per hour throughoutthe day which led to capacity issues between Campo de Marte and Guarulhos requiring afour-tack alignment. It has therefore been assumed that the demand expected betweenCampo de Marte and Guarulhos Airport is NOT included in the analysis presented here andis therefore not being covered by the proposed TAV. Although TAV will operate trainsbetween these two stations, no passengers are assumed to board other than for longdistance trips e.g. Campinas to Guarulhos International Airport.
1.2.2 As outlined in Volume 1, Section 3.7 there are two potential projects to provide a fixed raillink between Barra Funda and Guarulhos International Airport. Either of these projects couldin theory provide sufficient capacity between central São Paulo and Guarulhos. This wouldthen allow TAV to focus on serving long distance markets to the airport e.g. from Campinasand São José dos Campos to Guarulhos. As noted in Volume 1, it would also allow someinternal flights between Galeão and Guarulhos to be replaced by rail, therefore freeingairport capacity.
1Throughout this Executive Summary the project is referred to generically as TAV (Trem de Alta
Velocidade in Portuguese)
Brazil TAV: Vol 4 – Rail Operations & Technology – Pt 1 – Final Report TAV-HA-OPE-REP-40034-01
Page 2 of 48
1.2.3 Further details of the analysis undertaken for Guarulhos Airport are given in Appendix A.
Figure 1-1: TAV Study
TAV AlignmentOptimisation
Volume 2
TAV Journey TimeSimulation
Finance and Economicsand
Concessioning Volume 3
Financial ModelEconomic Appraisal
TAV Concession
Quantm Alignment SoftwareUnit Cost Assumptions
High Speed RailEngineeringParameters
SP and RP Surveys
Demand and RevenueVolume 1
TimetablingOperating Planning
Operating and TimetablingVolume 4
Real Estate – Volume 6
TAV CapexVolume 5
1.3 Introduction to High Speed Rail
1.3.1 There is no single accepted definition of what constitutes a high speed railway but generallyit refers to trains operating in excess of 200km/h. High speed rail is best suited to city pairswhere their distance apart is less than 500km to 600km; beyond this distance, air travelbecomes competitive and the relative market share of high speed rail declines.
1.3.2 A number of countries have invested in high speed rail services with Japan and France theleading proponents. Europe has developed an extensive high speed rail network with manythousands of kilometres of track now in operation with commercial speeds varying between300km/h and 330 km/h, with 300km/h being the most common speed. The recentlycompleted line between Madrid and Barcelona has the potential to run at a higher speed of350km/h.
1.3.3 The principal characteristics of high speed rail are:
competitive city centre to city centre journey times compared to air achieved by highspeed running;
very high train capacity with between 450 and 750 seats depending on configurationand length;
new dedicated fully grade separated alignments operationally independent fromexisting conventional railway infrastructure, in most cases;
Brazil TAV: Vol 4 – Rail Operations & Technology – Pt 1 – Final Report TAV-HA-OPE-REP-40034-01
Page 3 of 48
frequent clock-face services with limited station stops to achieve competitive journeytimes;
high levels of passenger comfort including executive and economy classes andcatering services;
high performance and punctuality; and
conveniently located stations, often with better accessibility compared with airports.
1.4 TAV Engineering Standards
1.4.1 The design for TAV is based on generic high speed rail technology with specific provision fora dedicated, fully segregated alignment to maximise running speed and ensure highoperational performance in terms of reliability and punctuality, in accordance with thecharacteristics set out above.
1.4.2 It is not envisaged in the current feasibility studies that TAV will share any existing track oruse joint running with existing Brazilian rail or metro services. The TAV alignment providesfor dedicated tracks to the main station in each city with the alignment often located intunnels in dense urban areas. A schematic layout of TAV is shown in Figure 1-2.
1.4.3 The TAV alignment has been developed based on international high speed line standards,more specifically:
a maximum design speed of 350 km/h and 1,435 mm gauge with electrified track.This should not be confused with the maximum operating speed which in thiscase is set at 300km/h (see section 2.4);
a maximum design gradient of 3.5% and 25 ton axle load2;
twin and single bore tunnels designed where applicable for 350km/h operation, anda maximum viaduct height of 70 metres for major bridges;
stations with ‘by-pass’, or ‘through’ lines to maintain high speed running andplatforms capable of accommodating 400m trains. ‘Through’ lines avoid the need fortrains to slow for safety reasons which would be the case if passing throughplatforms;
a signalling system capable of operating at 3 minute headways with in-cab signallingand cab-secure radio;
TSI Infrastructure Standards (used for operational modelling and CAPEX definitionpurposes the standard Interoperability of the Trans-European National StandardsOrganisation, dated 19/03/2008);
European standards were also used generically for CEN (European Centre forStandardisation), CENELEC (European Committee for ElectrotechnicalStandardisation, and ETSI (European Telecommunications Standards Institute; and
UIC (Union Internationale Des Chemins de Fer) leaflets and ABNT (AssociaçãoBrasileira de Normas Técnicas) standards.
1.4.4 The precise engineering parameters are set out in the Terms of Reference for this study(Annex 2, Section 2-14).
2Please note that HSR trains commonly have an axle weight of circa 17 tons. Recent Japanese high
speed trains have an even lower axle load at 11 tons. However, during construction and maintenanceperiods freight trains would be used, which have a higher axle load, but lighter axle loads during actualoperation will have an impact on track wear and maintenance. The axle load of 25 tons is specified inthe Terms of Reference (Annex 2 - Section 2-14).
Brazil TAV: Vol 4 – Rail Operations & Technology – Pt 1 – Final Report TAV-HA-OPE-REP-40034-01
Page 4 of 48
1.5 TAV Alignment and Stations
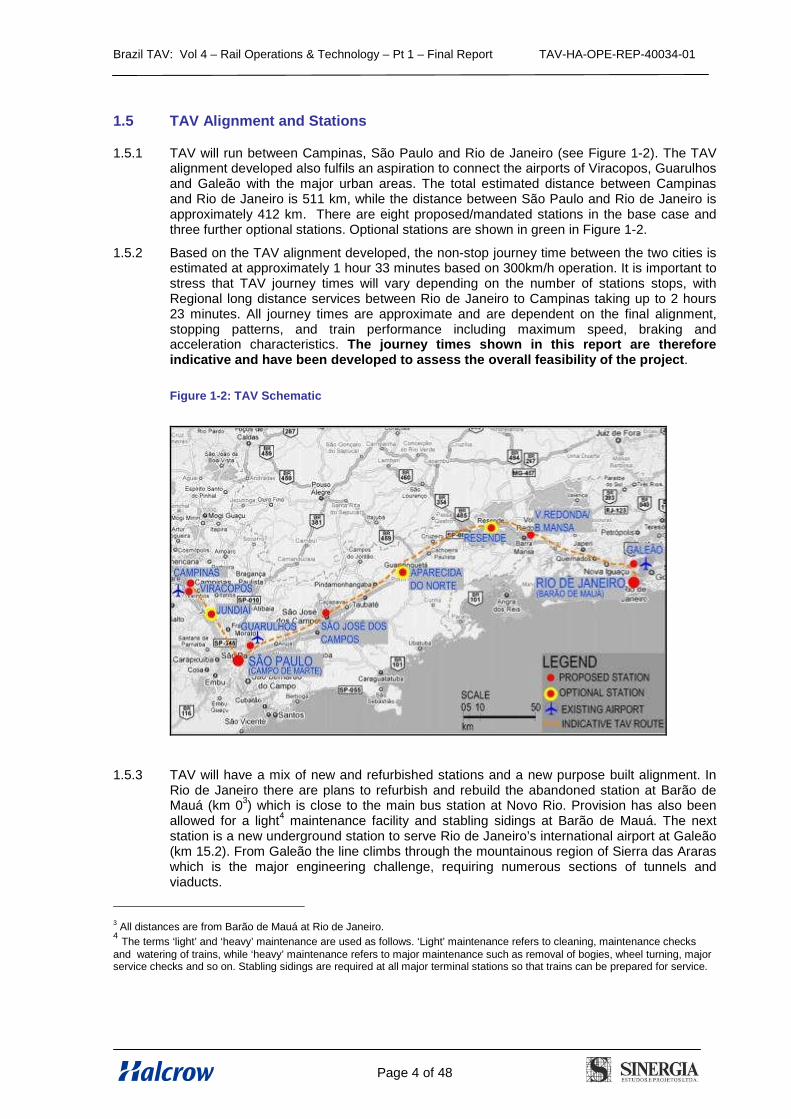
1.5.1 TAV will run between Campinas, São Paulo and Rio de Janeiro (see Figure 1-2). The TAValignment developed also fulfils an aspiration to connect the airports of Viracopos, Guarulhosand Galeão with the major urban areas. The total estimated distance between Campinasand Rio de Janeiro is 511 km, while the distance between São Paulo and Rio de Janeiro isapproximately 412 km. There are eight proposed/mandated stations in the base case andthree further optional stations. Optional stations are shown in green in Figure 1-2.
1.5.2 Based on the TAV alignment developed, the non-stop journey time between the two cities isestimated at approximately 1 hour 33 minutes based on 300km/h operation. It is important tostress that TAV journey times will vary depending on the number of stations stops, withRegional long distance services between Rio de Janeiro to Campinas taking up to 2 hours23 minutes. All journey times are approximate and are dependent on the final alignment,stopping patterns, and train performance including maximum speed, braking andacceleration characteristics. The journey times shown in this report are thereforeindicative and have been developed to assess the overall feasibility of the project.
Figure 1-2: TAV Schematic
1.5.3 TAV will have a mix of new and refurbished stations and a new purpose built alignment. InRio de Janeiro there are plans to refurbish and rebuild the abandoned station at Barão deMauá (km 0
3) which is close to the main bus station at Novo Rio. Provision has also been
allowed for a light4
maintenance facility and stabling sidings at Barão de Mauá. The nextstation is a new underground station to serve Rio de Janeiro’s international airport at Galeão(km 15.2). From Galeão the line climbs through the mountainous region of Sierra das Araraswhich is the major engineering challenge, requiring numerous sections of tunnels andviaducts.
3 All distances are from Barão de Mauá at Rio de Janeiro.4
The terms ‘light’ and ‘heavy’ maintenance are used as follows. ‘Light’ maintenance refers to cleaning, maintenance checksand watering of trains, while ‘heavy’ maintenance refers to major maintenance such as removal of bogies, wheel turning, majorservice checks and so on. Stabling sidings are required at all major terminal stations so that trains can be prepared for service.
Brazil TAV: Vol 4 – Rail Operations & Technology – Pt 1 – Final Report TAV-HA-OPE-REP-40034-01
Page 5 of 48
1.5.4 A further station is planned at Volta Redonda/Barra Mansa (km 118.3), located within thestate of Rio de Janeiro. Volta Redonda is an important industrial area with Latin America’slargest steel mill. There is also provision for an optional station in the future at Resende
5, to
the west of Volta Redonda/Barra Mansa.
1.5.5 Travelling westwards TAV then crosses the state border between São Paulo and Rio deJaneiro states. Provision has been made for a possible spur from the main alignment toserve a new optional station at Aparecida. Aparecida is an important pilgrim site whichgenerates 9.5 million visitors per year (2008).
1.5.6 After Aparecida TAV then reaches the large industrial city of São José dos Campos (km328.7). São José dos Campos is an important centre for high technology centred onaerospace and engineering, with a population of 1.4 million. This city is the proposedlocation of the rolling stock maintenance depot, as it has access to the main highwaynetwork, has a well developed regional airport, houses the Embraer assembly factory andhas available land to accommodate high impact land use.
1.5.7 Westwards from São José dos Campos the next station is at São Paulo’s internationalairport at Guarulhos (km 390.4), which will be built underground.
1.5.8 Upon reaching São Paulo, a preferred station site has been identified at Campo de Marte(Km 412.2), which is currently a federal airfield in the north of the city. In the Consortium’sopinion, the selection of Campo de Marte provides an opportunity to build a major land markstation, but improvements will be needed to deal with the distribution of passengers withinSão Paulo, as the site is not served by the metro system.
1.5.9 Campo de Marte station will have a number of ‘through’ platforms to allow trains to run fromSão José dos Campos to São Paulo and then north westwards towards Campinas, withoutreversing.
São Paulo to Campinas
1.5.10 From São Paulo, the TAV alignment then turns north westwards towards Campinas. Furtheranalysis was undertaken by the Consortium to examine the potential to reduce the maximumline speed between Campo de Marte and Campinas. Given concerns over the high overallconstruction costs, reducing the maximum line speed is a potential strategy to reduce thecapital cost by allowing TAV to avoid natural obstacles rather than use tunnels or bridges tomeet strict geometric criteria for 350km/h running. This is also sensible from a demandperspective because even at relatively modest speeds, TAV will enjoy considerablecompetitive advantage over existing bus and car modes because of traffic congestion in thecorridor between Campinas and São Paulo. However, due to the topography between SãoPaulo and Campinas, which contains a series of small hills lying across the alignment, asignificant speed reduction, potentially below 100km/h, would be required before any realcost savings could be achieved and for this reason no further analysis was undertaken.Reducing the maximum line speed of this section to Campinas would also impact on anyfuture aspirations for TAV to serve stations beyond Campinas in future projects.
1.5.11 On the alignment there is provision for an optional parkway style station at Jundiaí, locatedbetween Anhanguera and Bandeirantes highways. The TAV alignment then proceedsnorthwards to include a further station at Viracopos airport (Km 487.6). Thus the TAValignment fulfils an aspiration of the Government to connect the airports of Viracopos,Guarulhos and Galeão with the major urban areas. The final station is at Campinas (Km510.7), the third largest city in the state of São Paulo after São Paulo and Guarulhos. Thiswill also be a refurbished station including stabling sidings.
5The alignment has been straightened to allow for a station at Resende.
Brazil TAV: Vol 4 – Rail Operations & Technology – Pt 1 – Final Report TAV-HA-OPE-REP-40034-01
Page 6 of 48
1.6 Timetable Development
1.6.1 This section describes how the demand forecasts set out in Volume 1 are used to develop atimetable for TAV. The first task is to identify individual flows between stations and allocatethese to service groups. In simple terms, the largest flow of passengers within each servicegroup determines the number of trains required and their frequency.
1.6.2 Based on the demand forecasts developed in Volume 1, three main train service groups canbe identified which reflect distinct markets for TAV. One of the strengths of the TAV project isthat it is not dependent on a single market or revenue stream and the importance ofcommuting flows into São Paulo should not be under estimated as they account for morethan 40% of revenues. The potential for TAV to serve three of region’s major airports is alsoa further strength, as they generate considerable demand
6. The grouping of TAV services
also allows for the possibility of different types of train, which are customised to the marketsthey serve e.g. different seating configuration, door design, catering facilities, luggage spaceand so on.
1.6.3 The three proposed TAV service groups are as follows:
Express services from São Paulo to Rio de Janeiro7
operating non-stop; Expressservices will primarily compete against existing air services between the two cities;
Regional long distance services operating between Campinas and Rio de Janeiro,with stops at Viracopos, São Paulo, Guarulhos International Airport, São José dosCampos, Volta Redonda/Barra Mansa, and Galeão International Airport. This servicealso performs an “airport” role by stopping at Viracopos, Guarulhos and Galeãoairports and all major urban areas in the area of influence; and
Regional short distance services operating between Campinas and São José dosCampos, with stops at São Paulo and Guarulhos International Airport. These servicesare primarily aimed at the commuting market between Campinas and São Paulo, andSão José dos Campos and São Paulo. These services do not call at ViracoposAirport.
1.6.4 The terms ‘Express’, ‘Regional short distance’ and ‘Regional long distance service’ areadopted in this report to ensure consistency with the terms used in Volume 1: Demand andRevenue Forecasts. The demand forecasts presented in Volume 1 are developed as the‘Express sub-model’ and ’regional sub-model’, and are used as the basis for developing thetrain plan detailed in this report.
Rio de Janeiro - Campinas
1.6.5 Note that the flow between Campinas and Rio de Janeiro, while developed in the expresssub-model (because of the need to consider air competition) in the demand report, isconsidered to be a regional long distance service in this volume. At this stage, a non-stopservice between Campinas and Rio de Janeiro could not be justified because of the smallmarket (See Table 1-1). One alternative is to extend the Express service to Campinas butthis would increase the size of the estimated Express fleet and for this reason it wasrejected. In any case Regional long distance services provide a direct connection betweenthese stations without the need to change trains, and the time penalty for additional stationstops is minimal.
1.6.6 As will be discussed later trains in all three TAV service groups will run at identical maximumspeeds and will have similar acceleration and braking characteristics. While the internallayout of the Regional and Express trains could vary it is not recommended to operate trainswith a large variation in performance due to the impact on capacity.
6Most major international airports are served by a rail link, with the design contemplated here being
similar to that recently opened to serve Charles de Gaulle Airport in Paris.7
Note in Volume 1 the flow between Rio de Janeiro and Campinas is included in the express sub-model. In the train planning work presented here this flow is allocated to the regional services.
Brazil TAV: Vol 4 – Rail Operations & Technology – Pt 1 – Final Report TAV-HA-OPE-REP-40034-01
Page 7 of 48
1.6.7 It should be noted that the eventual operator may decide to brand Regional and Expressservices using market-oriented terms (such as ‘Javelin’ used for the new Channel TunnelRail Link high speed commuter service in the UK, or ‘Eurostar’ used for the high speed railservice between London, Paris and Brussels, or ‘Thalys’ for services between Paris andBrussels). We use the above nomenclature purely as descriptive terms for this study and toensure consistency with the terms used in the demand forecasts.
Allocation of Demand Flows
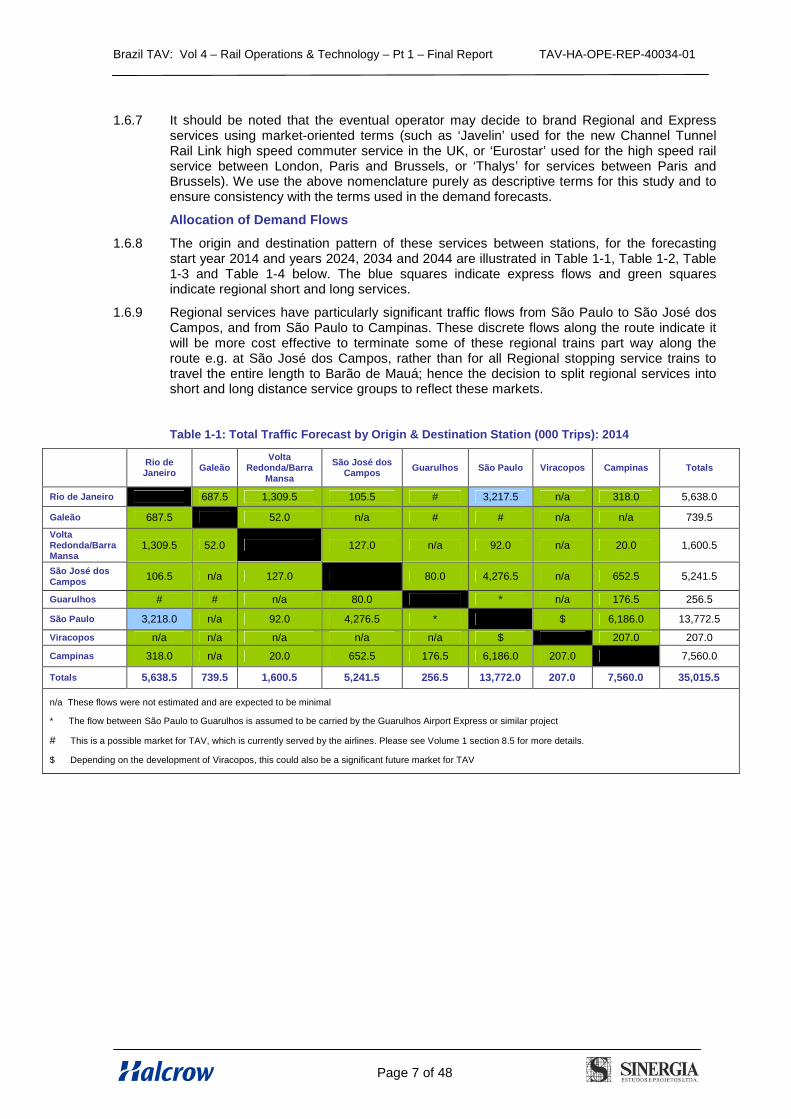
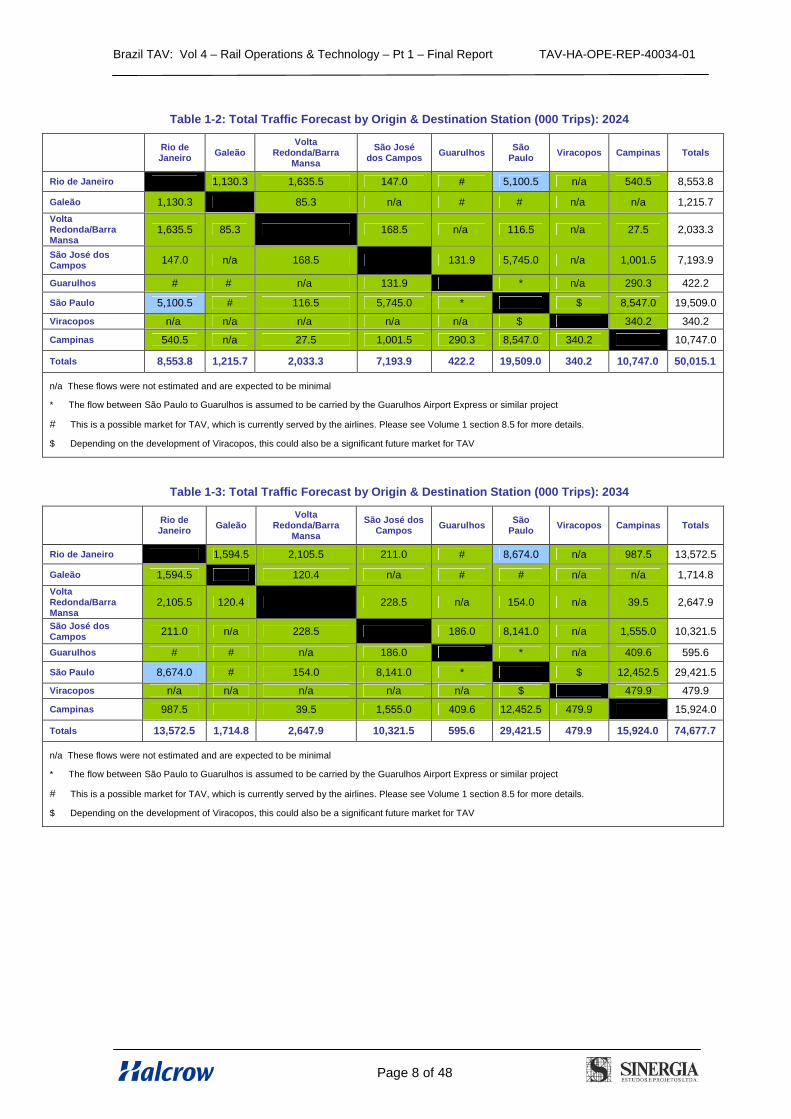
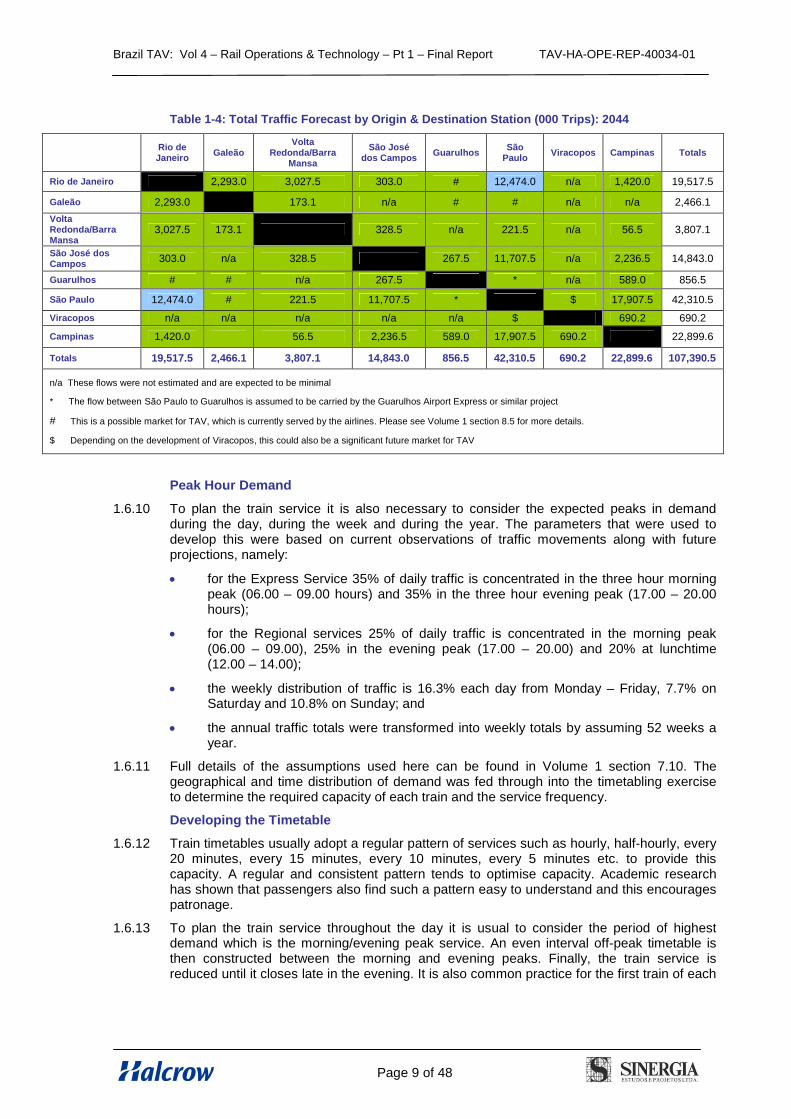
1.6.8 The origin and destination pattern of these services between stations, for the forecastingstart year 2014 and years 2024, 2034 and 2044 are illustrated in Table 1-1, Table 1-2, Table1-3 and Table 1-4 below. The blue squares indicate express flows and green squaresindicate regional short and long services.
1.6.9 Regional services have particularly significant traffic flows from São Paulo to São José dosCampos, and from São Paulo to Campinas. These discrete flows along the route indicate itwill be more cost effective to terminate some of these regional trains part way along theroute e.g. at São José dos Campos, rather than for all Regional stopping service trains totravel the entire length to Barão de Mauá; hence the decision to split regional services intoshort and long distance service groups to reflect these markets.
Table 1-1: Total Traffic Forecast by Origin & Destination Station (000 Trips): 2014
Rio deJaneiro
GaleãoVolta
Redonda/BarraMansa
São José dosCampos
Guarulhos São Paulo Viracopos Campinas Totals
Rio de Janeiro 687.5 1,309.5 105.5 # 3,217.5 n/a 318.0 5,638.0
Galeão 687.5 52.0 n/a # # n/a n/a 739.5
VoltaRedonda/BarraMansa
1,309.5 52.0 127.0 n/a 92.0 n/a 20.0 1,600.5
São José dosCampos
106.5 n/a 127.0 80.0 4,276.5 n/a 652.5 5,241.5
Guarulhos # # n/a 80.0 * n/a 176.5 256.5
São Paulo 3,218.0 n/a 92.0 4,276.5 * $ 6,186.0 13,772.5
Viracopos n/a n/a n/a n/a n/a $ 207.0 207.0
Campinas 318.0 n/a 20.0 652.5 176.5 6,186.0 207.0 7,560.0
Totals 5,638.5 739.5 1,600.5 5,241.5 256.5 13,772.0 207.0 7,560.0 35,015.5
n/a These flows were not estimated and are expected to be minimal
* The flow between São Paulo to Guarulhos is assumed to be carried by the Guarulhos Airport Express or similar project
# This is a possible market for TAV, which is currently served by the airlines. Please see Volume 1 section 8.5 for more details.
$ Depending on the development of Viracopos, this could also be a significant future market for TAV
Brazil TAV: Vol 4 – Rail Operations & Technology – Pt 1 – Final Report TAV-HA-OPE-REP-40034-01
Page 8 of 48
Table 1-2: Total Traffic Forecast by Origin & Destination Station (000 Trips): 2024
Rio deJaneiro
GaleãoVolta
Redonda/BarraMansa
São Josédos Campos
GuarulhosSão
PauloViracopos Campinas Totals
Rio de Janeiro 1,130.3 1,635.5 147.0 # 5,100.5 n/a 540.5 8,553.8
Galeão 1,130.3 85.3 n/a # # n/a n/a 1,215.7
VoltaRedonda/BarraMansa
1,635.5 85.3 168.5 n/a 116.5 n/a 27.5 2,033.3
São José dosCampos
147.0 n/a 168.5 131.9 5,745.0 n/a 1,001.5 7,193.9
Guarulhos # # n/a 131.9 * n/a 290.3 422.2
São Paulo 5,100.5 # 116.5 5,745.0 * $ 8,547.0 19,509.0
Viracopos n/a n/a n/a n/a n/a $ 340.2 340.2
Campinas 540.5 n/a 27.5 1,001.5 290.3 8,547.0 340.2 10,747.0
Totals 8,553.8 1,215.7 2,033.3 7,193.9 422.2 19,509.0 340.2 10,747.0 50,015.1
n/a These flows were not estimated and are expected to be minimal
* The flow between São Paulo to Guarulhos is assumed to be carried by the Guarulhos Airport Express or similar project
# This is a possible market for TAV, which is currently served by the airlines. Please see Volume 1 section 8.5 for more details.
$ Depending on the development of Viracopos, this could also be a significant future market for TAV
Table 1-3: Total Traffic Forecast by Origin & Destination Station (000 Trips): 2034
Rio deJaneiro
GaleãoVolta
Redonda/BarraMansa
São José dosCampos
GuarulhosSão
PauloViracopos Campinas Totals
Rio de Janeiro 1,594.5 2,105.5 211.0 # 8,674.0 n/a 987.5 13,572.5
Galeão 1,594.5 120.4 n/a # # n/a n/a 1,714.8
VoltaRedonda/BarraMansa
2,105.5 120.4 228.5 n/a 154.0 n/a 39.5 2,647.9
São José dosCampos
211.0 n/a 228.5 186.0 8,141.0 n/a 1,555.0 10,321.5
Guarulhos # # n/a 186.0 * n/a 409.6 595.6
São Paulo 8,674.0 # 154.0 8,141.0 * $ 12,452.5 29,421.5
Viracopos n/a n/a n/a n/a n/a $ 479.9 479.9
Campinas 987.5 39.5 1,555.0 409.6 12,452.5 479.9 15,924.0
Totals 13,572.5 1,714.8 2,647.9 10,321.5 595.6 29,421.5 479.9 15,924.0 74,677.7
n/a These flows were not estimated and are expected to be minimal
* The flow between São Paulo to Guarulhos is assumed to be carried by the Guarulhos Airport Express or similar project
# This is a possible market for TAV, which is currently served by the airlines. Please see Volume 1 section 8.5 for more details.
$ Depending on the development of Viracopos, this could also be a significant future market for TAV
Brazil TAV: Vol 4 – Rail Operations & Technology – Pt 1 – Final Report TAV-HA-OPE-REP-40034-01
Page 9 of 48
Table 1-4: Total Traffic Forecast by Origin & Destination Station (000 Trips): 2044
Rio deJaneiro
GaleãoVolta
Redonda/BarraMansa
São Josédos Campos
GuarulhosSão
PauloViracopos Campinas Totals
Rio de Janeiro 2,293.0 3,027.5 303.0 # 12,474.0 n/a 1,420.0 19,517.5
Galeão 2,293.0 173.1 n/a # # n/a n/a 2,466.1
VoltaRedonda/BarraMansa
3,027.5 173.1 328.5 n/a 221.5 n/a 56.5 3,807.1
São José dosCampos
303.0 n/a 328.5 267.5 11,707.5 n/a 2,236.5 14,843.0
Guarulhos # # n/a 267.5 * n/a 589.0 856.5
São Paulo 12,474.0 # 221.5 11,707.5 * $ 17,907.5 42,310.5
Viracopos n/a n/a n/a n/a n/a $ 690.2 690.2
Campinas 1,420.0 56.5 2,236.5 589.0 17,907.5 690.2 22,899.6
Totals 19,517.5 2,466.1 3,807.1 14,843.0 856.5 42,310.5 690.2 22,899.6 107,390.5
n/a These flows were not estimated and are expected to be minimal
* The flow between São Paulo to Guarulhos is assumed to be carried by the Guarulhos Airport Express or similar project
# This is a possible market for TAV, which is currently served by the airlines. Please see Volume 1 section 8.5 for more details.
$ Depending on the development of Viracopos, this could also be a significant future market for TAV
Peak Hour Demand
1.6.10 To plan the train service it is also necessary to consider the expected peaks in demandduring the day, during the week and during the year. The parameters that were used todevelop this were based on current observations of traffic movements along with futureprojections, namely:
for the Express Service 35% of daily traffic is concentrated in the three hour morningpeak (06.00 – 09.00 hours) and 35% in the three hour evening peak (17.00 – 20.00hours);
for the Regional services 25% of daily traffic is concentrated in the morning peak(06.00 – 09.00), 25% in the evening peak (17.00 – 20.00) and 20% at lunchtime(12.00 – 14.00);
the weekly distribution of traffic is 16.3% each day from Monday – Friday, 7.7% onSaturday and 10.8% on Sunday; and
the annual traffic totals were transformed into weekly totals by assuming 52 weeks ayear.
1.6.11 Full details of the assumptions used here can be found in Volume 1 section 7.10. Thegeographical and time distribution of demand was fed through into the timetabling exerciseto determine the required capacity of each train and the service frequency.
Developing the Timetable
1.6.12 Train timetables usually adopt a regular pattern of services such as hourly, half-hourly, every20 minutes, every 15 minutes, every 10 minutes, every 5 minutes etc. to provide thiscapacity. A regular and consistent pattern tends to optimise capacity. Academic researchhas shown that passengers also find such a pattern easy to understand and this encouragespatronage.
1.6.13 To plan the train service throughout the day it is usual to consider the period of highestdemand which is the morning/evening peak service. An even interval off-peak timetable isthen constructed between the morning and evening peaks. Finally, the train service isreduced until it closes late in the evening. It is also common practice for the first train of each
Brazil TAV: Vol 4 – Rail Operations & Technology – Pt 1 – Final Report TAV-HA-OPE-REP-40034-01
Page 10 of 48
day to run at reduced speed for safety reasons prior the commencement of high speedrunning.
1.6.14 In planning the service pattern it is necessary to integrate the various train service groupstogether in a way which ensures that the slower trains do not delay the faster ones. Passingloops at stations allow faster trains to overtake slower ones and these “overtaking”movements are built into the timetable; for example, slower trains are timetabled to departfrom terminating stations “behind” the fast Express services (see Figure 2-3).
1.6.15 Many high speed railways have a daily maintenance period free of all train services for a fewhours, normally during the early morning. This allows regular checks and small scalemaintenance to be made to the infrastructure overnight. With the intensity of the trainservices operating at high speeds, it is very important to maintain the safety and integrity ofthe infrastructure.
1.6.16 At this feasibility study stage it is not sensible to specify a preferred rolling stock strategy, butto leave this open to bidders to encourage competition. For this reason, a generic high speedtrain was considered for the purposes of planning of both the express and regional services.
1.6.17 However, the two regional service groups have different market demands and it isrecognised that the internal configuration of these may differ (e.g. the Campinas to São Josédos Campos trains could have higher density seating of around 600 compared with the 458of the Express service). However, there are considerable advantages from operating astandardised fleet in terms of operations, maintenance and procurement, and this will needto be considered by bidders.
Brazil TAV: Vol 4 – Rail Operations & Technology – Pt 1 – Final Report TAV-HA-OPE-REP-40034-01
Page 11 of 48
2 Timetabling and Operations
2.1 Introduction
2.1.1 This feasibility study and the planning of the TAV system has been market led and theoperational plan has been similarly configured to meet the projected demand for the railway.The aim of the timetable and operating plan are two-fold:
to specify the service and resource requirements necessary to serve the projecteddemand; and
to provide a basis for estimation of the operating costs of TAV.
2.1.2 This chapter covers the following areas:
a summary of timetable planning and the process of train planning;
a description of the main timetable planning tools used in the analysis;
a description of the Railsys simulation of journey times;
a summary of the specification of the route and station layouts;
a description of the VoyagerPlan timetabling simulation;
a consideration of future timetabling developments and issues; and
an assessment of the rolling stock requirements.
2.1.3 It should be noted that the timetable, and operating costs which flow from it, have beendeveloped to meet the demand forecasted in Volume 1 of the study. The timetable presentedhas been developed to show how TAV could be operated and the frequency and capacity oftrains required commensurate with a feasibility study. However, most railways are based onan “asset sweating” philosophy whereby minor changes are made to optimise stoppingpatterns and journey times to find the best balance of operating costs versus revenue, giventhat a large proportion of costs are fixed. For example, the timetables presented here arebased on standardised stopping patterns between peak and off peak services while in realitymany off peak services may have additional stops to reflect the fact that users are lesssensitive to journey times in these periods. Many of these changes can only be incorporatedto the timetable once TAV is operating.
2.2 Timetable Planning
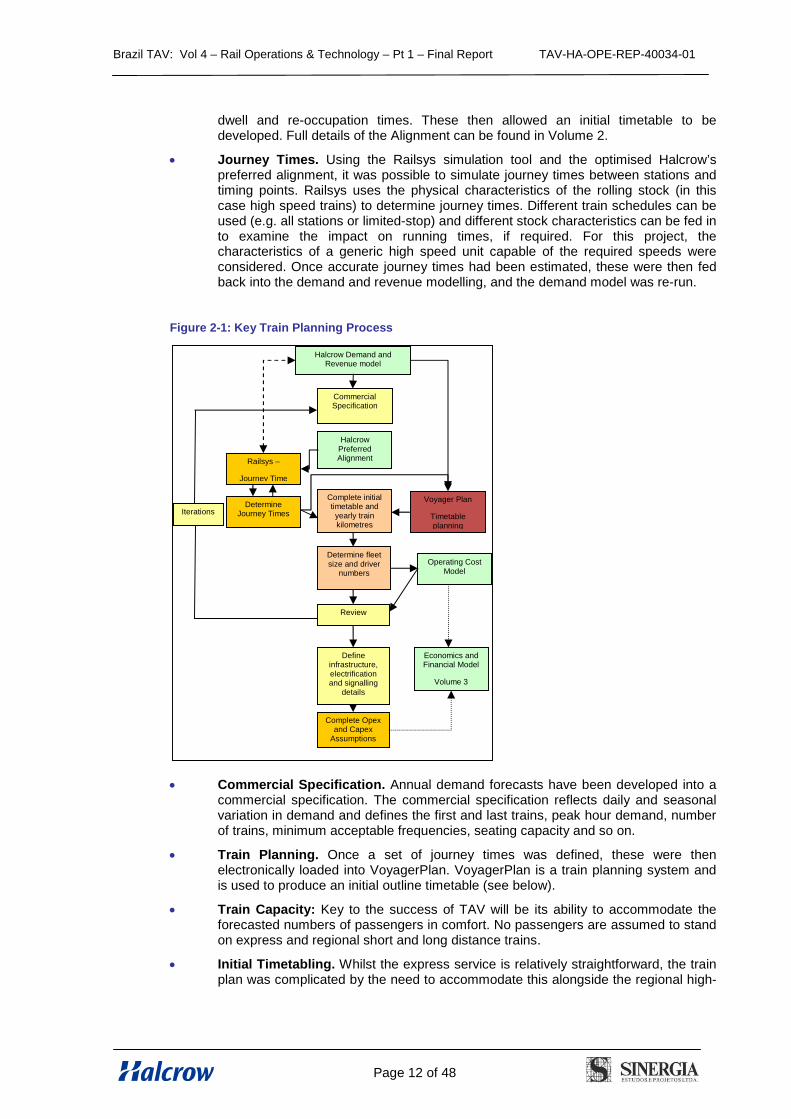
2.2.1 There has been considerable reliance on the outputs from other parts of the TAV study inproducing the timetable and operating plans. Figure 2-1 shows the interdependenciesbetween operations, train planning, and other work-streams.
2.2.2 The key activities undertaken to produce the train plan are described below, beginning withclose reference to the demand forecasts and ending with the generation of operating costdata. Section 2.3 provides a more detailed technical description of the train planning processand the software used.
Demand and Revenue Forecasts. As discussed in Volume 1, detailed ridershipforecasts have been developed based on initial journey times taken from previousstudies. These were later refined based on the alignment proposed in this study,once this was completed.
TAV Alignment. Based on Halcrow’s preferred alignment, important operationalparameters were selected such as signalling headways, junction margins, platform
Brazil TAV: Vol 4 – Rail Operations & Technology – Pt 1 – Final Report TAV-HA-OPE-REP-40034-01
Page 12 of 48
Halcrow Demand andRevenue model
CommercialSpecification
DetermineJourney Times
Defineinfrastructure,electrificationand signalling
details
Determine fleetsize and driver
numbers
Complete initialtimetable and
yearly trainkilometres
Review
Operating CostModel
Complete Opexand Capex
Assumptions
Iterations
Railsys –
Journey Time
Voyager Plan
Timetableplanning
Economics andFinancial Model
Volume 3
HalcrowPreferredAlignment
dwell and re-occupation times. These then allowed an initial timetable to bedeveloped. Full details of the Alignment can be found in Volume 2.
Journey Times. Using the Railsys simulation tool and the optimised Halcrow’spreferred alignment, it was possible to simulate journey times between stations andtiming points. Railsys uses the physical characteristics of the rolling stock (in thiscase high speed trains) to determine journey times. Different train schedules can beused (e.g. all stations or limited-stop) and different stock characteristics can be fed into examine the impact on running times, if required. For this project, thecharacteristics of a generic high speed unit capable of the required speeds wereconsidered. Once accurate journey times had been estimated, these were then fedback into the demand and revenue modelling, and the demand model was re-run.
Figure 2-1: Key Train Planning Process
Commercial Specification. Annual demand forecasts have been developed into acommercial specification. The commercial specification reflects daily and seasonalvariation in demand and defines the first and last trains, peak hour demand, numberof trains, minimum acceptable frequencies, seating capacity and so on.
Train Planning. Once a set of journey times was defined, these were thenelectronically loaded into VoyagerPlan. VoyagerPlan is a train planning system andis used to produce an initial outline timetable (see below).
Train Capacity: Key to the success of TAV will be its ability to accommodate theforecasted numbers of passengers in comfort. No passengers are assumed to standon express and regional short and long distance trains.
Initial Timetabling. Whilst the express service is relatively straightforward, the trainplan was complicated by the need to accommodate this alongside the regional high-
Brazil TAV: Vol 4 – Rail Operations & Technology – Pt 1 – Final Report TAV-HA-OPE-REP-40034-01
Page 13 of 48
speed stopping service. The need to inter-weave some services from Campinas andthe airport shuttle into the main timetable added further complications. A need alsoexisted to ensure the timetable specifications met all the infrastructure constraintsand provided adequate levels of service to meet demand.
Rolling Stock: Once the timetable was defined and had been proved to beworkable, a set of rolling stock diagrams were constructed. These define theservices each unit will work each day starting with its move from overnight stablinglocation and the number of trains it then works before finishing at night. The rollingstock diagrams also determine which train formations need to be strengthened toaccommodate the additional demand in peak hours. This exercise is vital forinforming fleet size and the running costs of the network. The number of ‘undermaintenance’ units needed to support the timetable was also determined by thisexercise. Unit diagrams were then produced for a number of purposes includingdetermining the number of drivers and guards/conductors required, which is then fedinto the operational cost modelling. The size of the rolling stock fleet also determinesother parameters such as depot maintenance facilities and rolling stockmaintenance, which also inputs into the cost modelling.
Cross-checking: infrastructure, electrification and signalling. A further keystage involved ensuring that infrastructure design remained consistent with the trainplan. This involved such issues as station platform lengths, power supply capacity,signalling and depots.
2.3 Timetable Planning Tools
2.3.1 The RailSys and VoyagerPlan systems were used to determine train running times anddevelop the resulting timetable. These are sophisticated rail industry train planning systemsused by operators around the world. This section describes in detail how the train plan wasdeveloped using these systems.
RailSys
2.3.2 Railsys is used to estimate running times based on gradients, curvature, tractioncharacteristics and so on. Railsys is used to remove the ‘guesswork’ from all stages of railservice planning. It is useful to civil engineers to allow accurate evaluation of the impact ofnew infrastructure on a route (such as eased speed limits) and it is used to assist signalengineers in the assessment of new or revised signalling schemes.
2.3.3 The infrastructure model of the TAV alignment was built in Railsys version 6. This is the UKstandard rail simulation system tool, which is also used by consultants and rail operatorsthroughout the world.
2.3.4 The Rolling Stock characteristics for a high speed train were imported into the model fromthe demonstration network of Railsys, which is based on actual data supplied by themanufacturers from high speed rail systems around the world. The TAV running timesimulation was then run for the generic high speed train on the preferred route, to find theminimum running times between stations.
2.3.5 Trains are entered with different stations stops in accordance with the three defined servicegroups to allow a full range of stopping and passing running times between all stations. Forexample, stopping at only the end points of the route, stopping at all stations, and then atalternative stops. Both the minimum technical running times (flat-out full speed runningaccording to the maximum line speed and gradients), and suggested timetabling runningtimes (which includes a 6% allowance for recoverability), have been calculated in this way.
2.3.6 These calculated times were then used to construct the timetable during the train planningprocess described below.
Brazil TAV: Vol 4 – Rail Operations & Technology – Pt 1 – Final Report TAV-HA-OPE-REP-40034-01
Page 14 of 48
VoyagerPlan
2.3.7 VoyagerPlan is a timetable and scheduling system used to develop timetable scenarios andundertake timetable and train diagramming (resources planning, e.g. train crew, and theirassociated costs) studies for a range of clients. It is the tool of choice for most UK TrainOperators and Government authorities, but also used by operators around the world.
2.3.8 To support the generation of operating plans reference was made to the route geography,station locations and other interval markers which define the running lines and running timesfor each stock type. Running time information was derived from the RailSys modelling of theroute.
TAV Train Specification
2.3.9 It was decided to use a generic train specification rather than one particular manufacturer’sunit. This train specification was established from a combination of known and tested highspeed train characteristics held within the RailSys modelling tool (as supplied by themanufacturers). These data were then used to set the parameters for the TAV RailSysmodel to calculate running times based on the TAV alignment, as set out in Volume 2.
2.3.10 To this end, a train or unit type was selected that offered both tested running characteristicsand the relevant line speed required for TAV. Different variants of high speed rail technologywill have slightly different performance characteristics. As several manufacturers currentlyoffer high speed trains operating commercially at 300 km/h, this was used as the maximumoperating speed for the timetable simulations. Please see Part 2 - Technology of this volumefor more details on train performance.
2.3.11 It is understood that a number of manufacturers are currently marketing trains with amaximum speed of 350km/h or higher. The precise decision on the maximum speed shouldbe left to bidders who will have to decide between proven technologies, i.e. 300 km/h versusthe technology and performance risks of running at higher commercially unproven speeds. Itshould be stressed that the alignment has been designed for a maximum line speed of350km/h, with restrictions only due to geometry or safety constraints (see section 2.4.5).
2.3.12 A key characteristic of HSR is the ability to meet punctuality and reliability targets and thesetargets should form part of the performance regime between the concessionaire and theGovernment (see Volume 3 for further details). In the demand study (Volume 1), TAV is onlyassumed to suffer 5 minutes of delay on average compared to air travel, which has 30minutes of delay. The maximum line speed of 350km/h allows some scope for time recoveryon late-running or delayed services and thus supports the study’s train performanceassumptions, if 300km/h running is assumed.
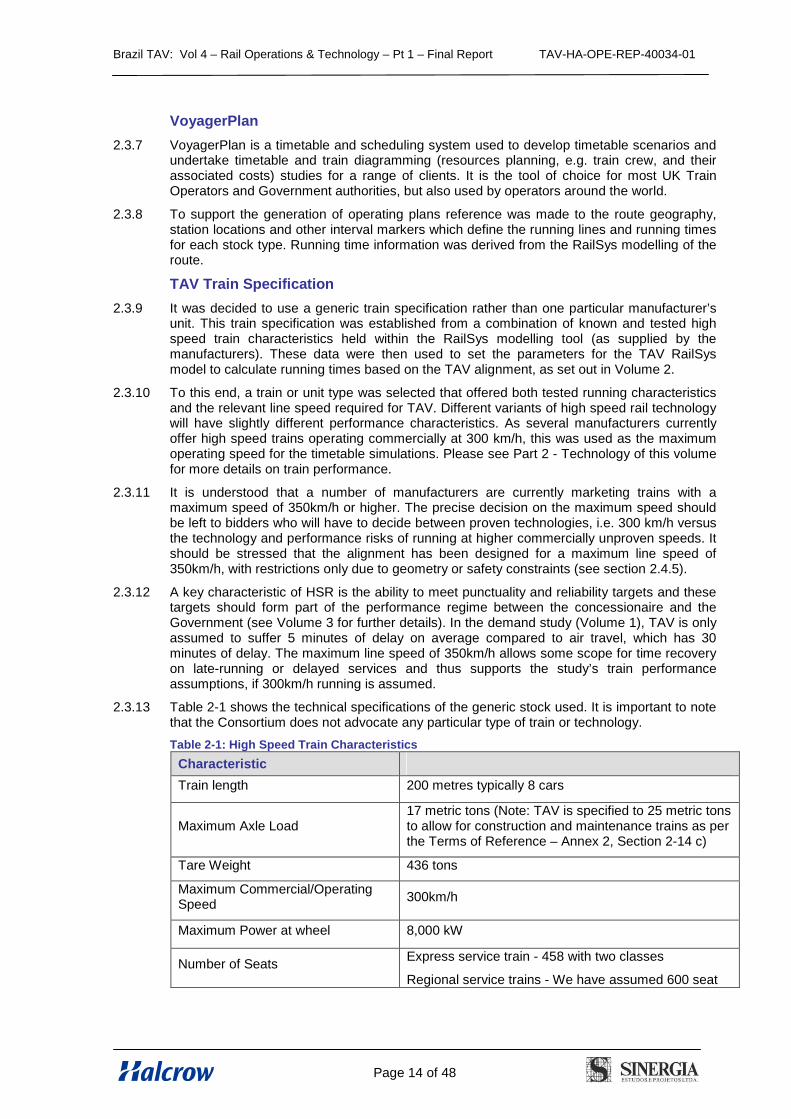
2.3.13 Table 2-1 shows the technical specifications of the generic stock used. It is important to notethat the Consortium does not advocate any particular type of train or technology.
Table 2-1: High Speed Train Characteristics
Characteristic
Train length 200 metres typically 8 cars
Maximum Axle Load17 metric tons (Note: TAV is specified to 25 metric tonsto allow for construction and maintenance trains as perthe Terms of Reference – Annex 2, Section 2-14 c)
Tare Weight 436 tons
Maximum Commercial/OperatingSpeed
300km/h
Maximum Power at wheel 8,000 kW
Number of SeatsExpress service train - 458 with two classes
Regional service trains - We have assumed 600 seat
Brazil TAV: Vol 4 – Rail Operations & Technology – Pt 1 – Final Report TAV-HA-OPE-REP-40034-01
Page 15 of 48
Characteristic
trains on regional services between Campinas and SãoJose dos Campos in a single class.
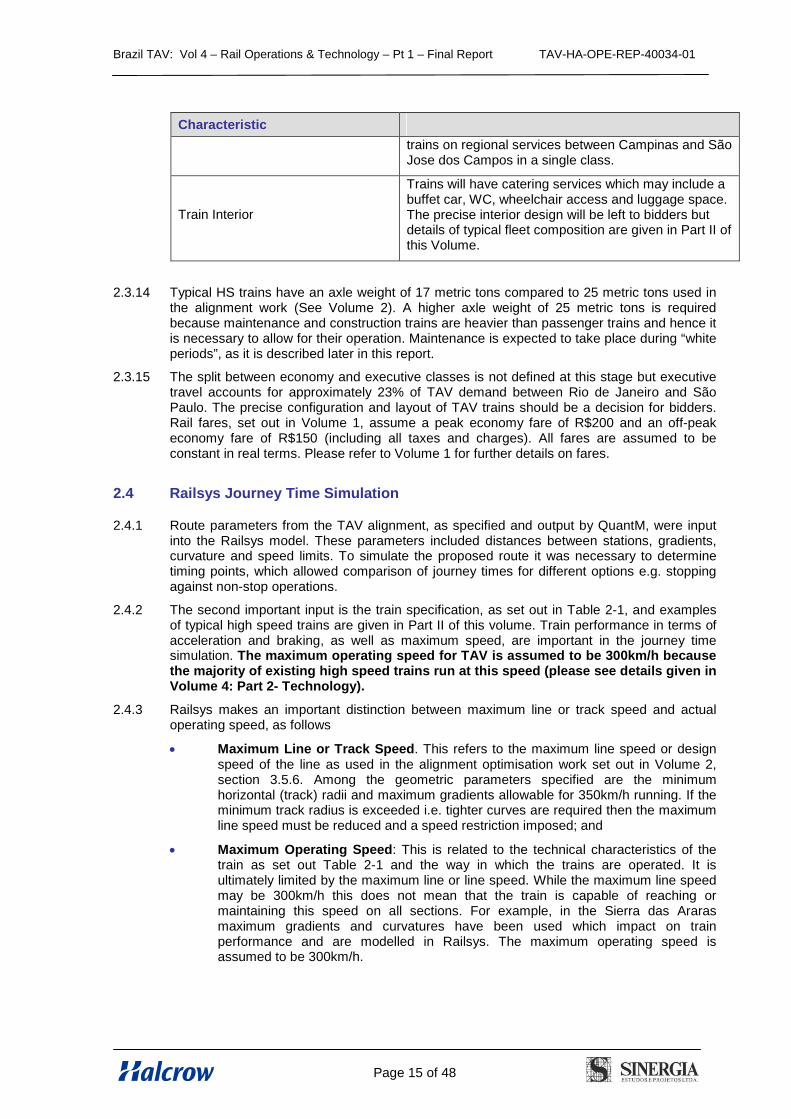
Train Interior
Trains will have catering services which may include abuffet car, WC, wheelchair access and luggage space.The precise interior design will be left to bidders butdetails of typical fleet composition are given in Part II ofthis Volume.
2.3.14 Typical HS trains have an axle weight of 17 metric tons compared to 25 metric tons used inthe alignment work (See Volume 2). A higher axle weight of 25 metric tons is requiredbecause maintenance and construction trains are heavier than passenger trains and hence itis necessary to allow for their operation. Maintenance is expected to take place during “whiteperiods”, as it is described later in this report.
2.3.15 The split between economy and executive classes is not defined at this stage but executivetravel accounts for approximately 23% of TAV demand between Rio de Janeiro and SãoPaulo. The precise configuration and layout of TAV trains should be a decision for bidders.Rail fares, set out in Volume 1, assume a peak economy fare of R$200 and an off-peakeconomy fare of R$150 (including all taxes and charges). All fares are assumed to beconstant in real terms. Please refer to Volume 1 for further details on fares.
2.4 Railsys Journey Time Simulation
2.4.1 Route parameters from the TAV alignment, as specified and output by QuantM, were inputinto the Railsys model. These parameters included distances between stations, gradients,curvature and speed limits. To simulate the proposed route it was necessary to determinetiming points, which allowed comparison of journey times for different options e.g. stoppingagainst non-stop operations.
2.4.2 The second important input is the train specification, as set out in Table 2-1, and examplesof typical high speed trains are given in Part II of this volume. Train performance in terms ofacceleration and braking, as well as maximum speed, are important in the journey timesimulation. The maximum operating speed for TAV is assumed to be 300km/h becausethe majority of existing high speed trains run at this speed (please see details given inVolume 4: Part 2- Technology).
2.4.3 Railsys makes an important distinction between maximum line or track speed and actualoperating speed, as follows
Maximum Line or Track Speed. This refers to the maximum line speed or designspeed of the line as used in the alignment optimisation work set out in Volume 2,section 3.5.6. Among the geometric parameters specified are the minimumhorizontal (track) radii and maximum gradients allowable for 350km/h running. If theminimum track radius is exceeded i.e. tighter curves are required then the maximumline speed must be reduced and a speed restriction imposed; and
Maximum Operating Speed: This is related to the technical characteristics of thetrain as set out Table 2-1 and the way in which the trains are operated. It isultimately limited by the maximum line or line speed. While the maximum line speedmay be 300km/h this does not mean that the train is capable of reaching ormaintaining this speed on all sections. For example, in the Sierra das Ararasmaximum gradients and curvatures have been used which impact on trainperformance and are modelled in Railsys. The maximum operating speed isassumed to be 300km/h.
Brazil TAV: Vol 4 – Rail Operations & Technology – Pt 1 – Final Report TAV-HA-OPE-REP-40034-01
Page 16 of 48
2.4.4 A third concept is the commercial or average speed which is estimated by simply the totaljourney time divided by the length of the line. Average speeds will therefore vary dependingon the number of station stops and the timetable assumptions.
Alignment Speed Restrictions
2.4.5 As noted above the alignment optimisation work, as outlined in Volume 2 of this study, isbased on a maximum line speed of 350km/h, provided the geometric criteria are met. Allintermediate stations are based on four-track alignment which includes two by-pass lines inaddition to two platforms, which avoids the need for any speed restrictions.
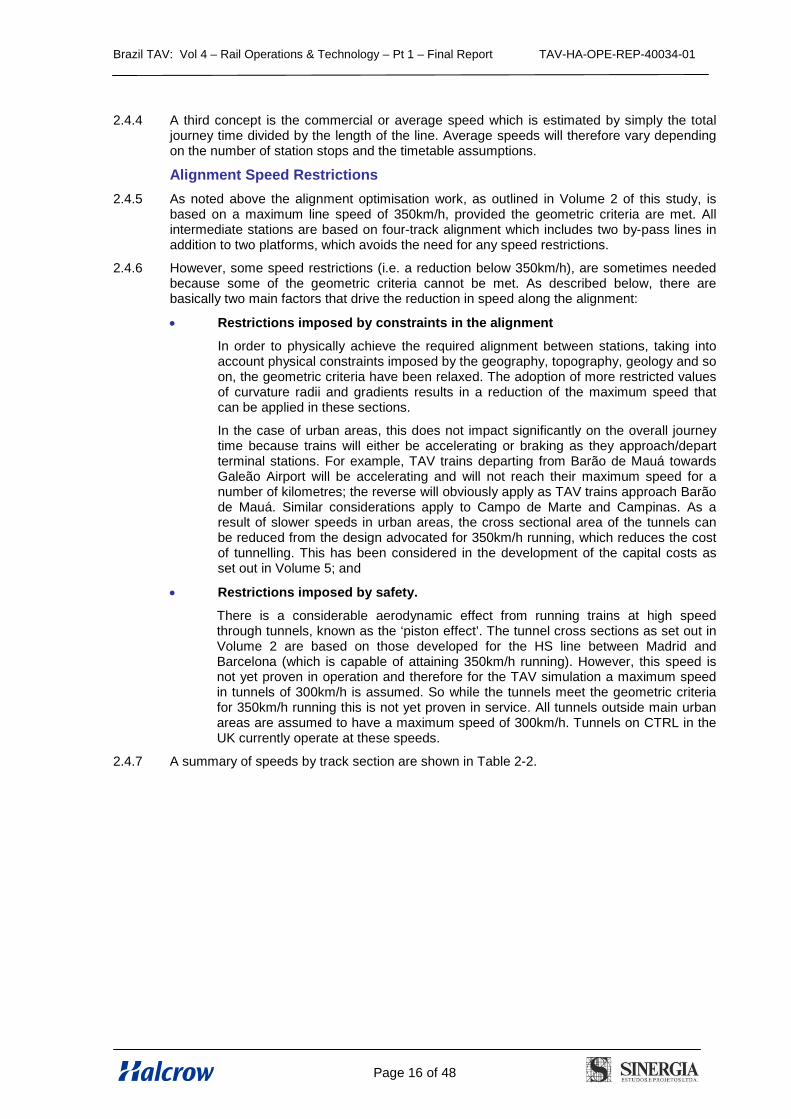
2.4.6 However, some speed restrictions (i.e. a reduction below 350km/h), are sometimes neededbecause some of the geometric criteria cannot be met. As described below, there arebasically two main factors that drive the reduction in speed along the alignment:
Restrictions imposed by constraints in the alignment
In order to physically achieve the required alignment between stations, taking intoaccount physical constraints imposed by the geography, topography, geology and soon, the geometric criteria have been relaxed. The adoption of more restricted valuesof curvature radii and gradients results in a reduction of the maximum speed thatcan be applied in these sections.
In the case of urban areas, this does not impact significantly on the overall journeytime because trains will either be accelerating or braking as they approach/departterminal stations. For example, TAV trains departing from Barão de Mauá towardsGaleão Airport will be accelerating and will not reach their maximum speed for anumber of kilometres; the reverse will obviously apply as TAV trains approach Barãode Mauá. Similar considerations apply to Campo de Marte and Campinas. As aresult of slower speeds in urban areas, the cross sectional area of the tunnels canbe reduced from the design advocated for 350km/h running, which reduces the costof tunnelling. This has been considered in the development of the capital costs asset out in Volume 5; and
Restrictions imposed by safety.
There is a considerable aerodynamic effect from running trains at high speedthrough tunnels, known as the ‘piston effect’. The tunnel cross sections as set out inVolume 2 are based on those developed for the HS line between Madrid andBarcelona (which is capable of attaining 350km/h running). However, this speed isnot yet proven in operation and therefore for the TAV simulation a maximum speedin tunnels of 300km/h is assumed. So while the tunnels meet the geometric criteriafor 350km/h running this is not yet proven in service. All tunnels outside main urbanareas are assumed to have a maximum speed of 300km/h. Tunnels on CTRL in theUK currently operate at these speeds.
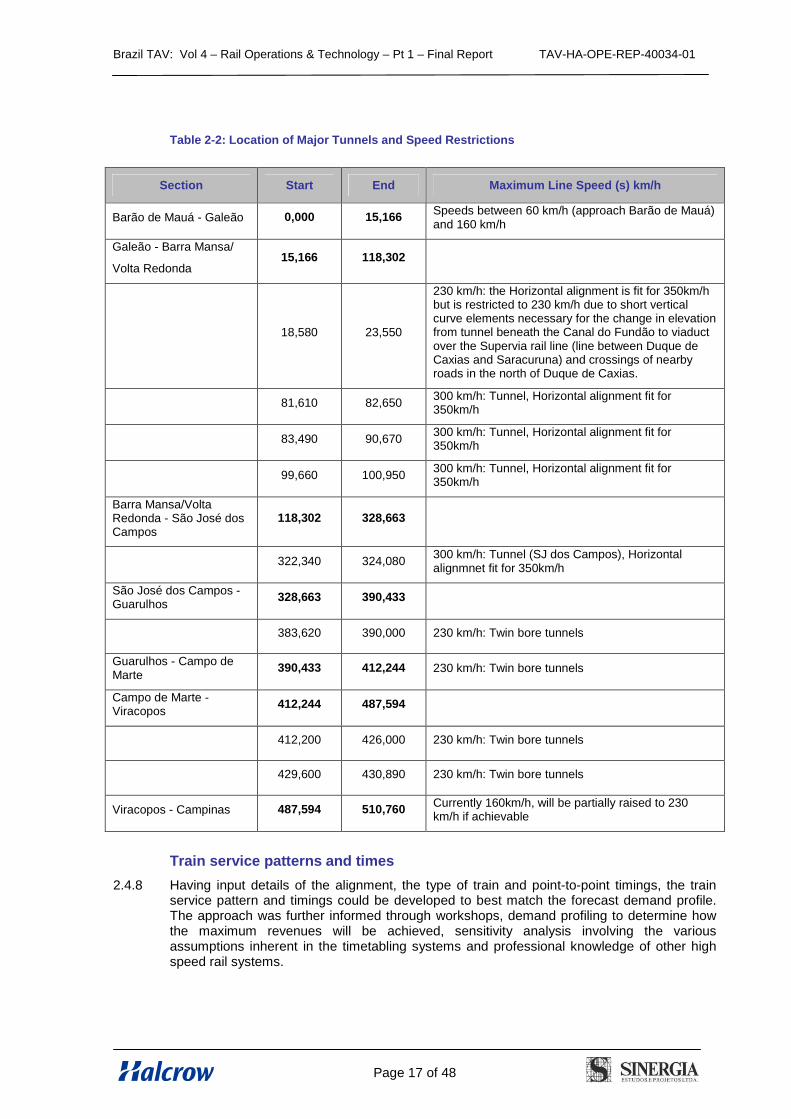
2.4.7 A summary of speeds by track section are shown in Table 2-2.
Brazil TAV: Vol 4 – Rail Operations & Technology – Pt 1 – Final Report TAV-HA-OPE-REP-40034-01
Page 17 of 48
Table 2-2: Location of Major Tunnels and Speed Restrictions
Section Start End Maximum Line Speed (s) km/h
Barão de Mauá - Galeão 0,000 15,166Speeds between 60 km/h (approach Barão de Mauá)and 160 km/h
Galeão - Barra Mansa/
Volta Redonda15,166 118,302
18,580 23,550
230 km/h: the Horizontal alignment is fit for 350km/hbut is restricted to 230 km/h due to short verticalcurve elements necessary for the change in elevationfrom tunnel beneath the Canal do Fundão to viaductover the Supervia rail line (line between Duque deCaxias and Saracuruna) and crossings of nearbyroads in the north of Duque de Caxias.
81,610 82,650300 km/h: Tunnel, Horizontal alignment fit for350km/h
83,490 90,670300 km/h: Tunnel, Horizontal alignment fit for350km/h
99,660 100,950300 km/h: Tunnel, Horizontal alignment fit for350km/h
Barra Mansa/VoltaRedonda - São José dosCampos
118,302 328,663
322,340 324,080300 km/h: Tunnel (SJ dos Campos), Horizontalalignmnet fit for 350km/h
São José dos Campos -Guarulhos
328,663 390,433
383,620 390,000 230 km/h: Twin bore tunnels
Guarulhos - Campo deMarte
390,433 412,244 230 km/h: Twin bore tunnels
Campo de Marte -Viracopos
412,244 487,594
412,200 426,000 230 km/h: Twin bore tunnels
429,600 430,890 230 km/h: Twin bore tunnels
Viracopos - Campinas 487,594 510,760Currently 160km/h, will be partially raised to 230km/h if achievable
Train service patterns and times
2.4.8 Having input details of the alignment, the type of train and point-to-point timings, the trainservice pattern and timings could be developed to best match the forecast demand profile.The approach was further informed through workshops, demand profiling to determine howthe maximum revenues will be achieved, sensitivity analysis involving the variousassumptions inherent in the timetabling systems and professional knowledge of other highspeed rail systems.
Brazil TAV: Vol 4 – Rail Operations & Technology – Pt 1 – Final Report TAV-HA-OPE-REP-40034-01
Page 18 of 48
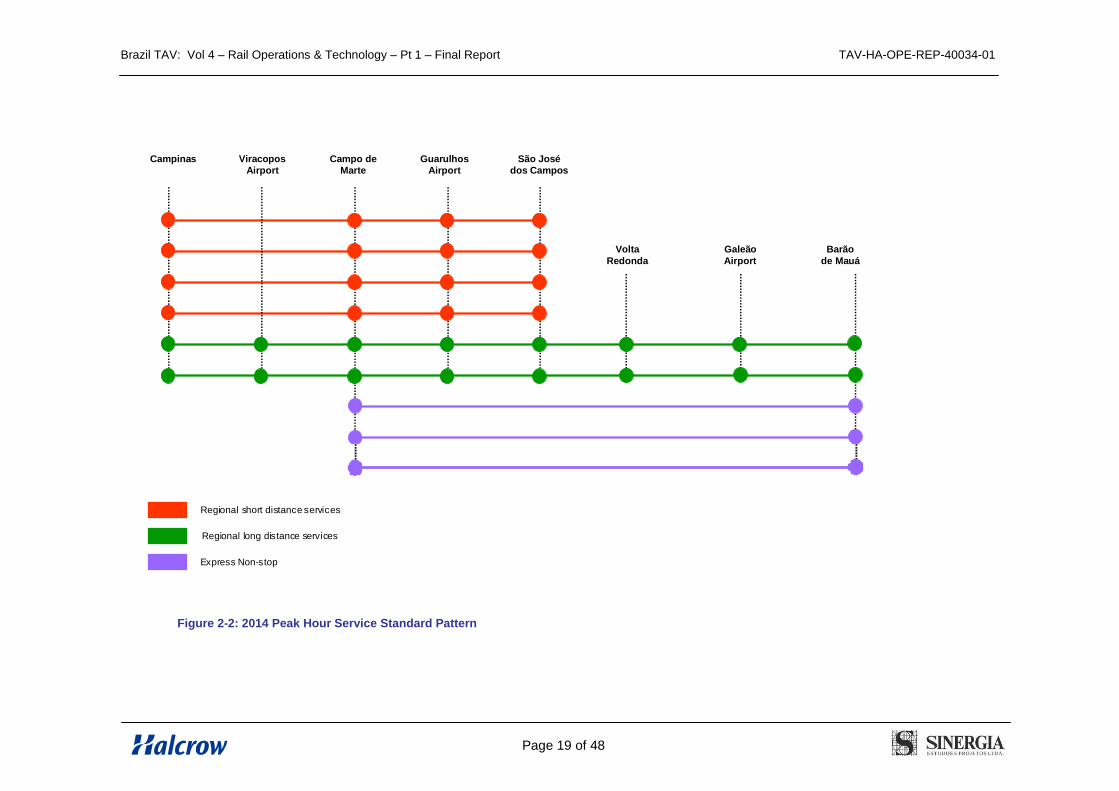
2.4.9 The resulting train plan optimised timings, service reliability and commercial attractiveness. Itincludes the three distinct but separate service operations as discussed in Section 1.6.3,shown below:
Express services from São Paulo to Rio de Janeiro;
Regional long distance services operating between Campinas and Rio de Janeiro,with stops at Viracoposo, São Paulo, Guarulhos International Airport, São José dosCampos, Volta Redonda/Barra Mansa, and Galeao International Airport. Thisservice also performs an “airport” role by stopping at Viracopos, Guarulhos andGaleão airports and all major urban areas in the area of influence; and
Regional short distance services operating between Campinas and São José dosCampos with stops at São Paulo and Guarulhos International Airport. This servicedoes not stop at Viracopos Airport.
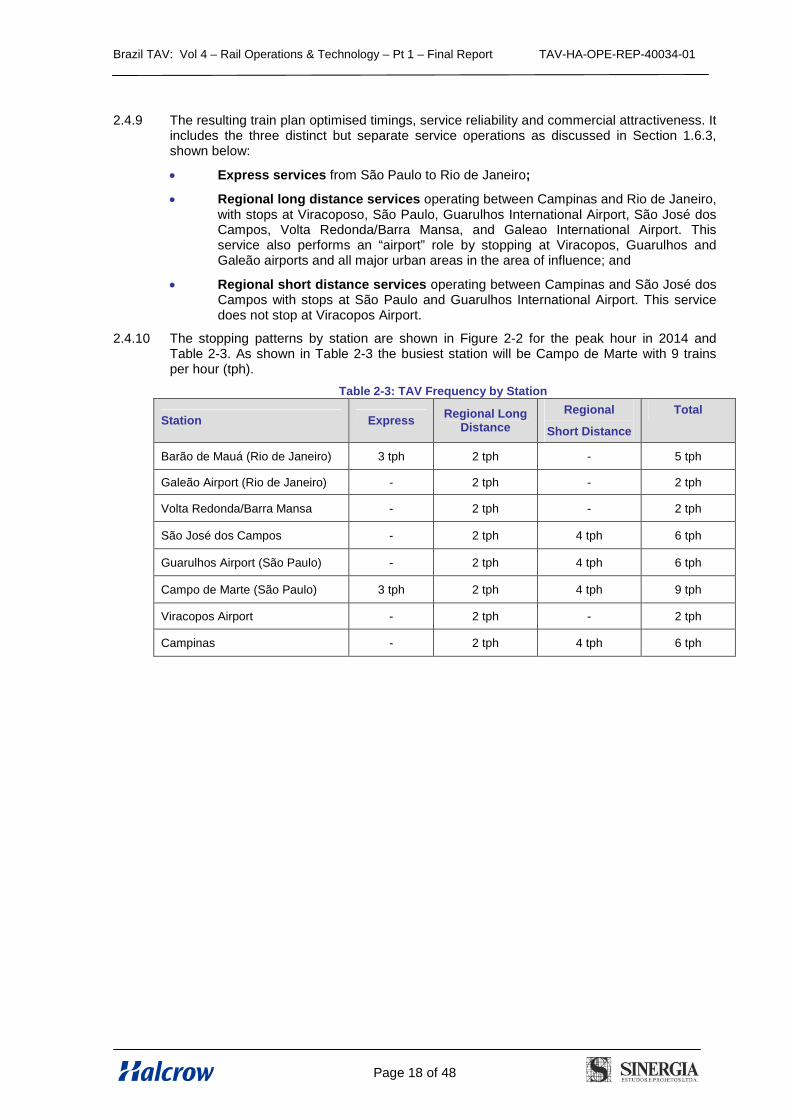
2.4.10 The stopping patterns by station are shown in Figure 2-2 for the peak hour in 2014 andTable 2-3. As shown in Table 2-3 the busiest station will be Campo de Marte with 9 trainsper hour (tph).
Table 2-3: TAV Frequency by Station
Station ExpressRegional Long
Distance
Regional
Short Distance
Total
Barão de Mauá (Rio de Janeiro) 3 tph 2 tph - 5 tph
Galeão Airport (Rio de Janeiro) - 2 tph - 2 tph
Volta Redonda/Barra Mansa - 2 tph - 2 tph
São José dos Campos - 2 tph 4 tph 6 tph
Guarulhos Airport (São Paulo) - 2 tph 4 tph 6 tph
Campo de Marte (São Paulo) 3 tph 2 tph 4 tph 9 tph
Viracopos Airport - 2 tph - 2 tph
Campinas - 2 tph 4 tph 6 tph
Brazil TAV: Vol 4 – Rail Operations & Technology – Pt 1 – Final Report TAV-HA-OPE-REP-40034-01
Page 19 of 48
Campinas Viracopos
Airport
Campo de
Marte
Guarulhos
Airport
São José
dos Campos
Volta
Redonda
B arão
de Mauá
Galeão
Airport
Regional long distance services
Express Non-stop
Regional short distance services
Campinas ViracoposAirport
Campo deMarte
GuarulhosAirport
São Josédos Campos
VoltaRedonda
Barãode Mauá
GaleãoAirport
Figure 2-2: 2014 Peak Hour Service Standard Pattern
Brazil TAV: Vol 4 – Rail Operations & Technology – Pt 1 – Final Report TAV-HA-OPE-REP-40034-01
Page 20 of 48
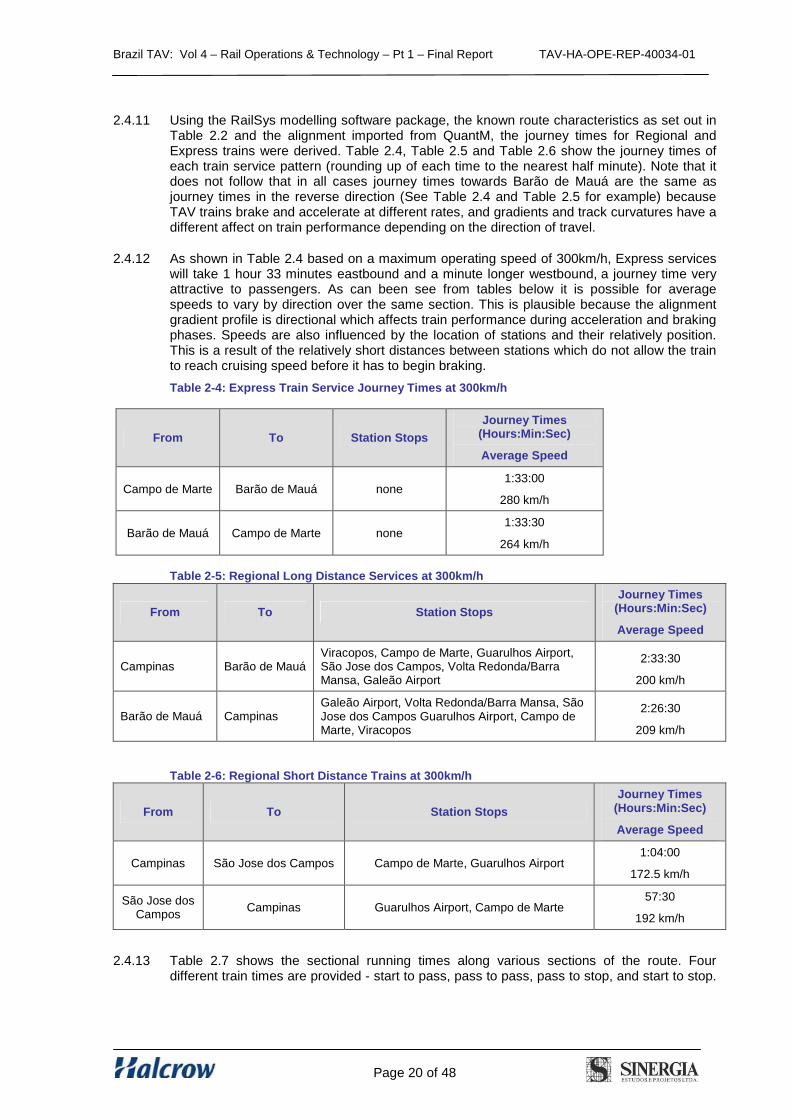
2.4.11 Using the RailSys modelling software package, the known route characteristics as set out inTable 2.2 and the alignment imported from QuantM, the journey times for Regional andExpress trains were derived. Table 2.4, Table 2.5 and Table 2.6 show the journey times ofeach train service pattern (rounding up of each time to the nearest half minute). Note that itdoes not follow that in all cases journey times towards Barão de Mauá are the same asjourney times in the reverse direction (See Table 2.4 and Table 2.5 for example) becauseTAV trains brake and accelerate at different rates, and gradients and track curvatures have adifferent affect on train performance depending on the direction of travel.
2.4.12 As shown in Table 2.4 based on a maximum operating speed of 300km/h, Express serviceswill take 1 hour 33 minutes eastbound and a minute longer westbound, a journey time veryattractive to passengers. As can been see from tables below it is possible for averagespeeds to vary by direction over the same section. This is plausible because the alignmentgradient profile is directional which affects train performance during acceleration and brakingphases. Speeds are also influenced by the location of stations and their relatively position.This is a result of the relatively short distances between stations which do not allow the trainto reach cruising speed before it has to begin braking.
Table 2-4: Express Train Service Journey Times at 300km/h
From To Station Stops
Journey Times(Hours:Min:Sec)
Average Speed
Campo de Marte Barão de Mauá none1:33:00
280 km/h
Barão de Mauá Campo de Marte none1:33:30
264 km/h
Table 2-5: Regional Long Distance Services at 300km/h
From To Station Stops
Journey Times(Hours:Min:Sec)
Average Speed
Campinas Barão de MauáViracopos, Campo de Marte, Guarulhos Airport,São Jose dos Campos, Volta Redonda/BarraMansa, Galeão Airport
2:33:30
200 km/h
Barão de Mauá CampinasGaleão Airport, Volta Redonda/Barra Mansa, SãoJose dos Campos Guarulhos Airport, Campo deMarte, Viracopos
2:26:30
209 km/h
Table 2-6: Regional Short Distance Trains at 300km/h
From To Station Stops
Journey Times(Hours:Min:Sec)
Average Speed
Campinas São Jose dos Campos Campo de Marte, Guarulhos Airport1:04:00
172.5 km/h
São Jose dosCampos
Campinas Guarulhos Airport, Campo de Marte57:30
192 km/h
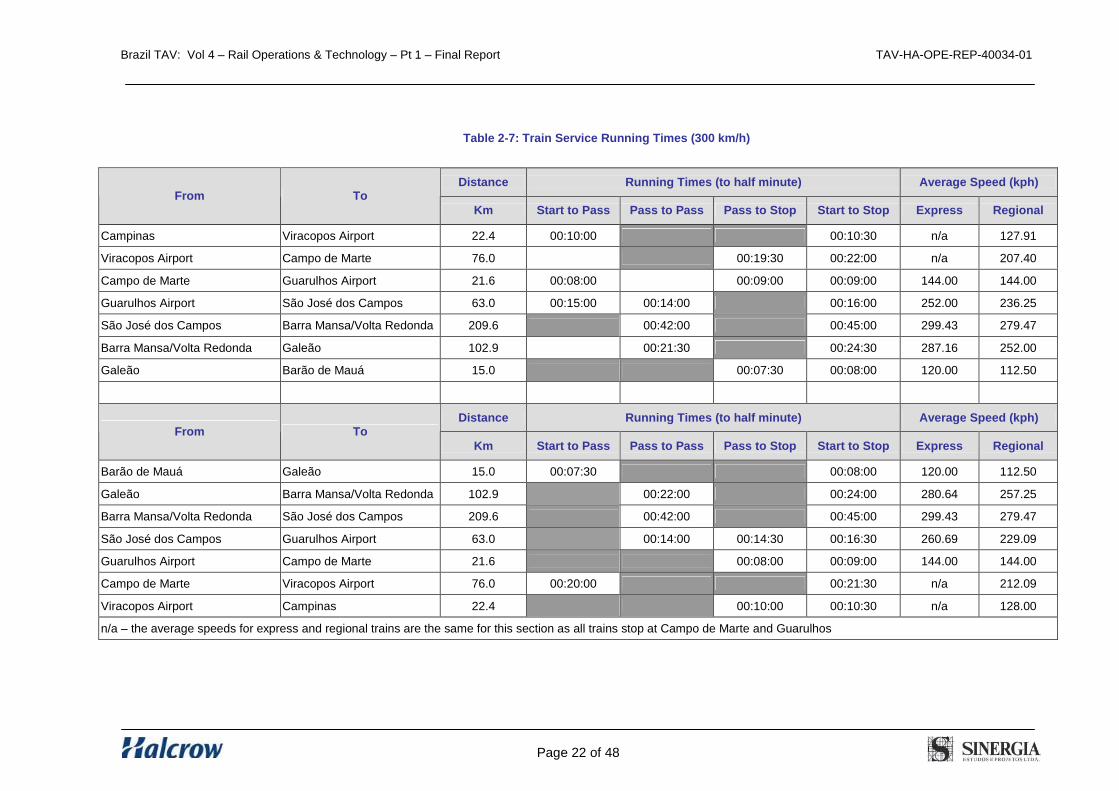
2.4.13 Table 2.7 shows the sectional running times along various sections of the route. Fourdifferent train times are provided - start to pass, pass to pass, pass to stop, and start to stop.
Brazil TAV: Vol 4 – Rail Operations & Technology – Pt 1 – Final Report TAV-HA-OPE-REP-40034-01
Page 21 of 48
‘Start to Pass’ means that the train ‘starts’ from first station but does not stop at the next.‘Pass to Pass’ assumes the train passes through both stations without stopping, and hencethese are the fastest section times. ‘Pass to Stop’ assumes the train passes the first stationbut stops at the next. ‘Start to Stop’ assumes the train starts from the first station and stopsat the next. Hence, Table 2.7 reflects the impact of including station stops. All station stopsare assumed to be two minutes in accordance with international operating standards.
2.4.14 On the basis of Table 2.7 the running time between Barão de Mauá and Campo de Martecan be estimated as follows:
Barão de Mauá to Galeão – start to pass – 07:30 minutes;
Galeão - Volta Redonda/Barra Mansa – pass to pass – 22:00 minutes;
Volta Redonda/Barra Mansa - São Jose dos Campos – pass to pass – 42:00minutes;
São Jose dos Campos to Guarulhos Airport – pass to pass – 14:00 minutes;
Guarulhos Airport to Campo de Marte – pass to stop – 08:00 minutes;
gives a total time of 93.5 minutes, or 1 hour 33.5 minutes, as shown in Table 2.4
2.4.15 The timings of Express services reflect the maximum speed along the route sections i.e.’Pass to Pass’. The section from São José dos Campos to Barra Mansa/Volta Redonda hasno speed restrictions and express trains achieve a 299 km/h average, very close to theirmaximum operating speed. On some sections there are small variations in eastbound andwestbound speeds which principally relate to the local topography e.g. the Serra das Araras,between Barra Mansa/Volta Redonda and Rio de Janeiro.
Brazil TAV: Vol 4 – Rail Operations & Technology – Pt 1 – Final Report TAV-HA-OPE-REP-40034-01
Page 22 of 48
Table 2-7: Train Service Running Times (300 km/h)
Distance Running Times (to half minute) Average Speed (kph)From To
Km Start to Pass Pass to Pass Pass to Stop Start to Stop Express Regional
Campinas Viracopos Airport 22.4 00:10:00 00:10:30 n/a 127.91
Viracopos Airport Campo de Marte 76.0 00:19:30 00:22:00 n/a 207.40
Campo de Marte Guarulhos Airport 21.6 00:08:00 00:09:00 00:09:00 144.00 144.00
Guarulhos Airport São José dos Campos 63.0 00:15:00 00:14:00 00:16:00 252.00 236.25
São José dos Campos Barra Mansa/Volta Redonda 209.6 00:42:00 00:45:00 299.43 279.47
Barra Mansa/Volta Redonda Galeão 102.9 00:21:30 00:24:30 287.16 252.00
Galeão Barão de Mauá 15.0 00:07:30 00:08:00 120.00 112.50
Distance Running Times (to half minute) Average Speed (kph)From To
Km Start to Pass Pass to Pass Pass to Stop Start to Stop Express Regional
Barão de Mauá Galeão 15.0 00:07:30 00:08:00 120.00 112.50
Galeão Barra Mansa/Volta Redonda 102.9 00:22:00 00:24:00 280.64 257.25
Barra Mansa/Volta Redonda São José dos Campos 209.6 00:42:00 00:45:00 299.43 279.47
São José dos Campos Guarulhos Airport 63.0 00:14:00 00:14:30 00:16:30 260.69 229.09
Guarulhos Airport Campo de Marte 21.6 00:08:00 00:09:00 144.00 144.00
Campo de Marte Viracopos Airport 76.0 00:20:00 00:21:30 n/a 212.09
Viracopos Airport Campinas 22.4 00:10:00 00:10:30 n/a 128.00
n/a – the average speeds for express and regional trains are the same for this section as all trains stop at Campo de Marte and Guarulhos
Brazil TAV: Vol 4 – Rail Operations & Technology – Pt 1 – Final Report TAV-HA-OPE-REP-40034-01
Page 23 of 48
2.5 TAV Stations and Depots
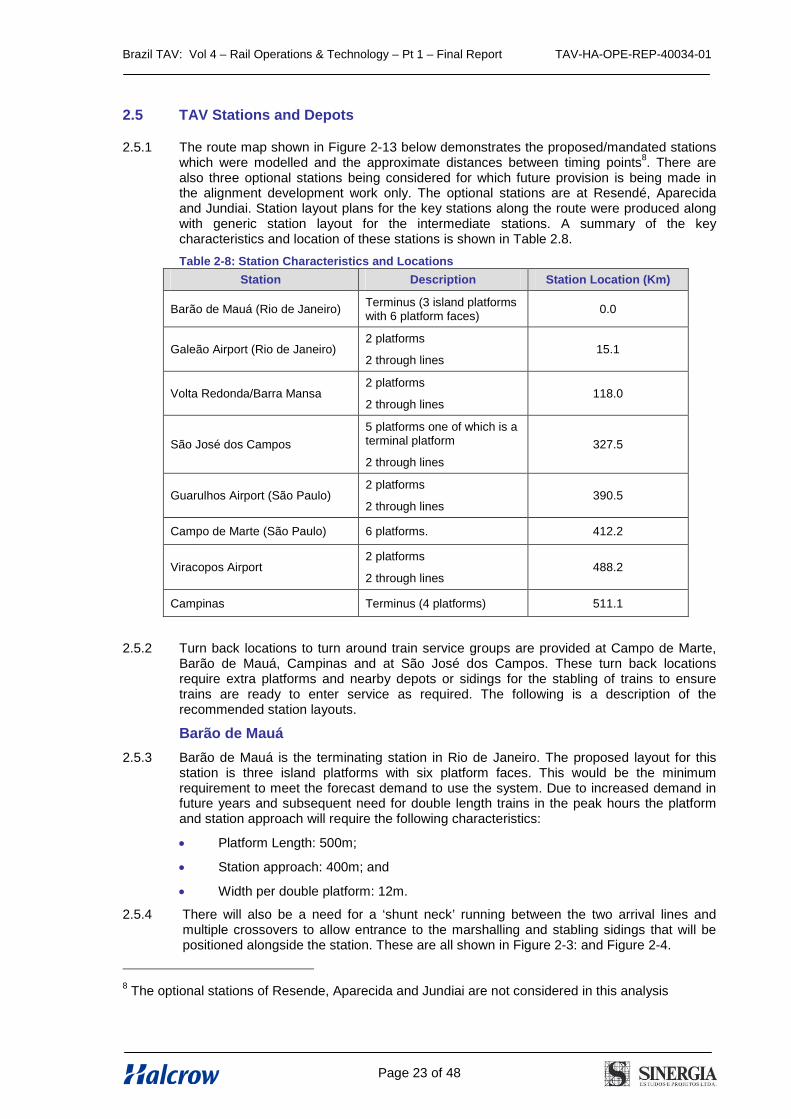
2.5.1 The route map shown in Figure 2-13 below demonstrates the proposed/mandated stationswhich were modelled and the approximate distances between timing points
8. There are
also three optional stations being considered for which future provision is being made inthe alignment development work only. The optional stations are at Resendé, Aparecidaand Jundiai. Station layout plans for the key stations along the route were produced alongwith generic station layout for the intermediate stations. A summary of the keycharacteristics and location of these stations is shown in Table 2.8.
Table 2-8: Station Characteristics and Locations
Station Description Station Location (Km)
Barão de Mauá (Rio de Janeiro)Terminus (3 island platformswith 6 platform faces)
0.0
Galeão Airport (Rio de Janeiro)2 platforms
2 through lines15.1
Volta Redonda/Barra Mansa2 platforms
2 through lines118.0
São José dos Campos
5 platforms one of which is aterminal platform
2 through lines
327.5
Guarulhos Airport (São Paulo)2 platforms
2 through lines390.5
Campo de Marte (São Paulo) 6 platforms. 412.2
Viracopos Airport2 platforms
2 through lines488.2
Campinas Terminus (4 platforms) 511.1
2.5.2 Turn back locations to turn around train service groups are provided at Campo de Marte,Barão de Mauá, Campinas and at São José dos Campos. These turn back locationsrequire extra platforms and nearby depots or sidings for the stabling of trains to ensuretrains are ready to enter service as required. The following is a description of therecommended station layouts.
Barão de Mauá
2.5.3 Barão de Mauá is the terminating station in Rio de Janeiro. The proposed layout for thisstation is three island platforms with six platform faces. This would be the minimumrequirement to meet the forecast demand to use the system. Due to increased demand infuture years and subsequent need for double length trains in the peak hours the platformand station approach will require the following characteristics:
Platform Length: 500m;
Station approach: 400m; and
Width per double platform: 12m.
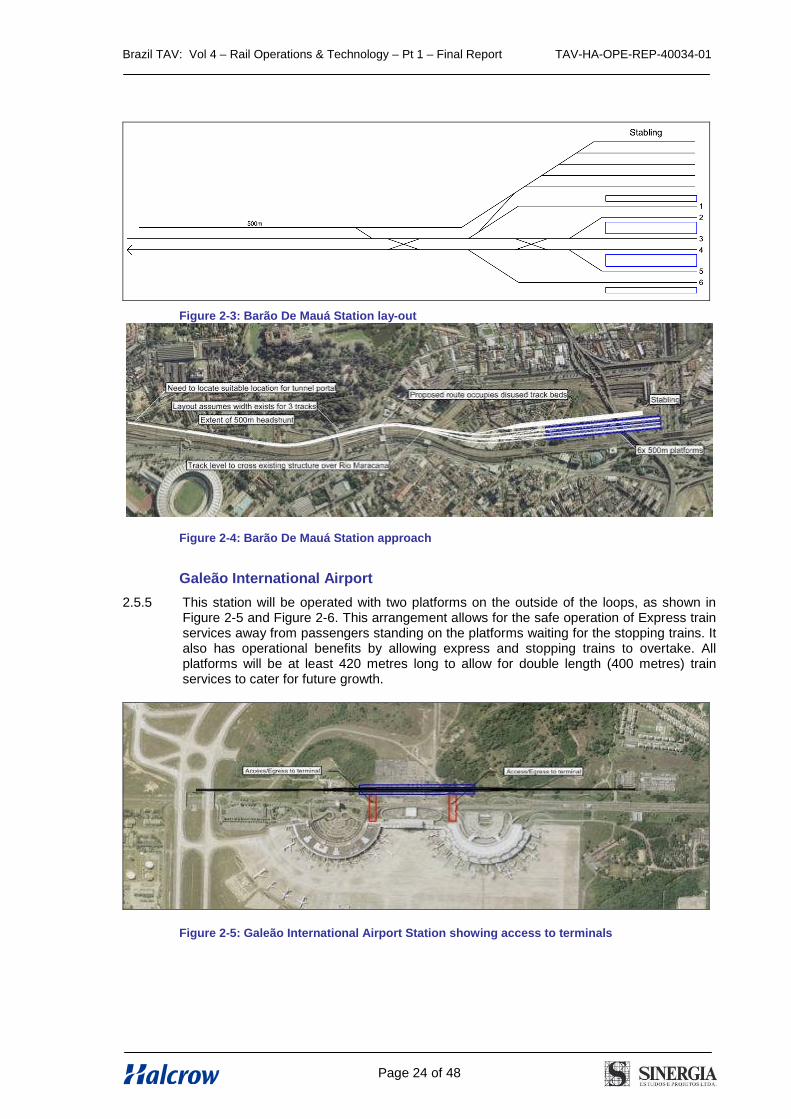
2.5.4 There will also be a need for a ‘shunt neck’ running between the two arrival lines andmultiple crossovers to allow entrance to the marshalling and stabling sidings that will bepositioned alongside the station. These are all shown in Figure 2-3: and Figure 2-4.
8The optional stations of Resende, Aparecida and Jundiai are not considered in this analysis
Brazil TAV: Vol 4 – Rail Operations & Technology – Pt 1 – Final Report TAV-HA-OPE-REP-40034-01
Page 24 of 48
Figure 2-3: Barão De Mauá Station lay-out
Figure 2-4: Barão De Mauá Station approach
Galeão International Airport
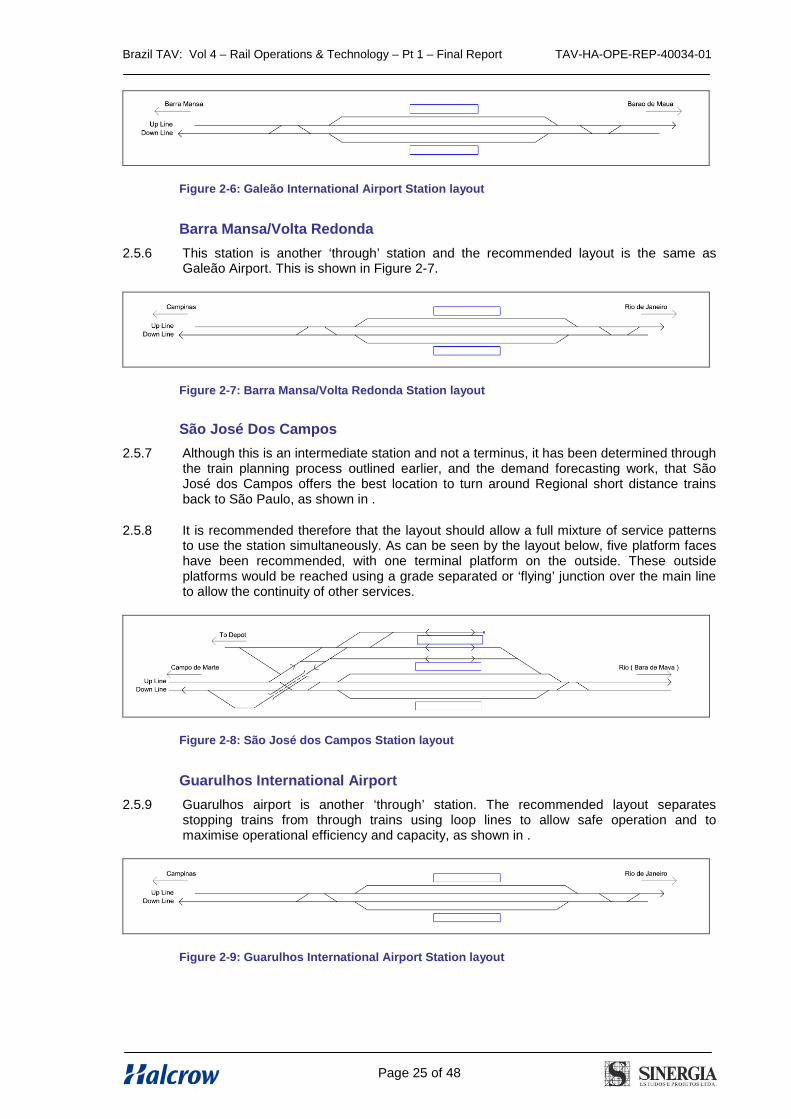
2.5.5 This station will be operated with two platforms on the outside of the loops, as shown inFigure 2-5 and Figure 2-6. This arrangement allows for the safe operation of Express trainservices away from passengers standing on the platforms waiting for the stopping trains. Italso has operational benefits by allowing express and stopping trains to overtake. Allplatforms will be at least 420 metres long to allow for double length (400 metres) trainservices to cater for future growth.
Figure 2-5: Galeão International Airport Station showing access to terminals
Brazil TAV: Vol 4 – Rail Operations & Technology – Pt 1 – Final Report TAV-HA-OPE-REP-40034-01
Page 25 of 48
Figure 2-6: Galeão International Airport Station layout
Barra Mansa/Volta Redonda
2.5.6 This station is another ‘through’ station and the recommended layout is the same asGaleão Airport. This is shown in Figure 2-7.
Figure 2-7: Barra Mansa/Volta Redonda Station layout
São José Dos Campos
2.5.7 Although this is an intermediate station and not a terminus, it has been determined throughthe train planning process outlined earlier, and the demand forecasting work, that SãoJosé dos Campos offers the best location to turn around Regional short distance trainsback to São Paulo, as shown in .
2.5.8 It is recommended therefore that the layout should allow a full mixture of service patternsto use the station simultaneously. As can be seen by the layout below, five platform faceshave been recommended, with one terminal platform on the outside. These outsideplatforms would be reached using a grade separated or ‘flying’ junction over the main lineto allow the continuity of other services.
Figure 2-8: São José dos Campos Station layout
Guarulhos International Airport
2.5.9 Guarulhos airport is another ‘through’ station. The recommended layout separatesstopping trains from through trains using loop lines to allow safe operation and tomaximise operational efficiency and capacity, as shown in .
Figure 2-9: Guarulhos International Airport Station layout
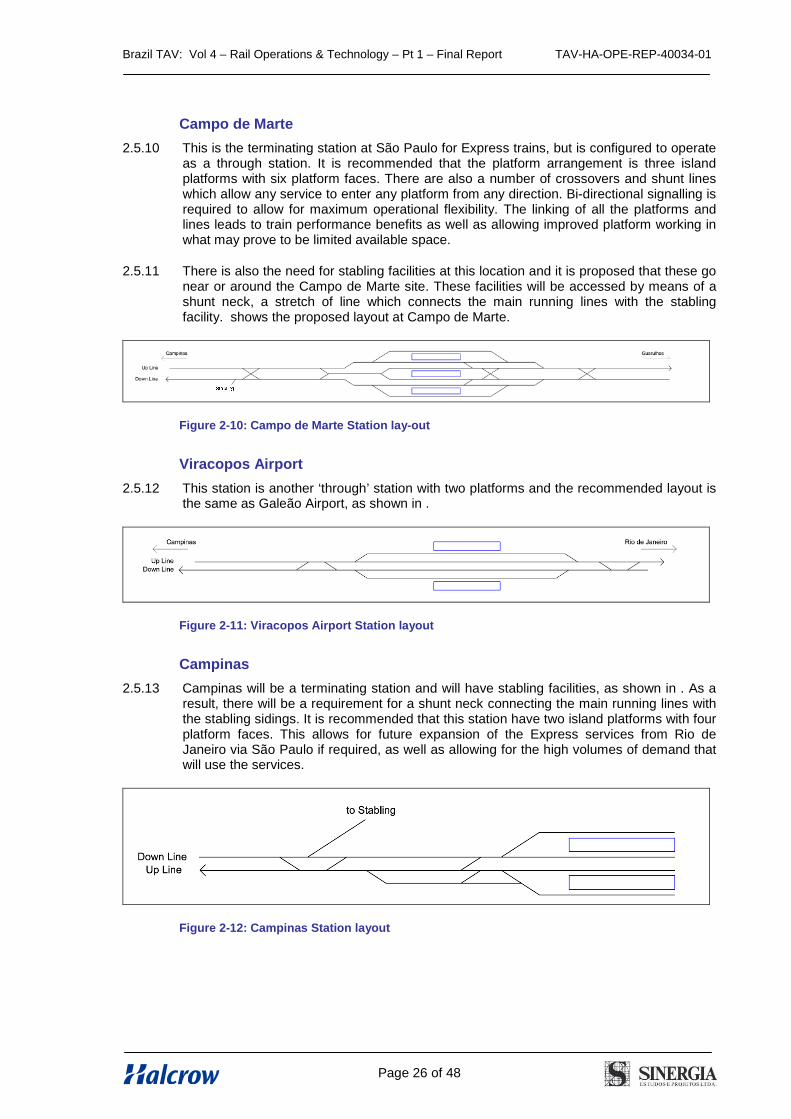
Brazil TAV: Vol 4 – Rail Operations & Technology – Pt 1 – Final Report TAV-HA-OPE-REP-40034-01
Page 26 of 48
Campo de Marte
2.5.10 This is the terminating station at São Paulo for Express trains, but is configured to operateas a through station. It is recommended that the platform arrangement is three islandplatforms with six platform faces. There are also a number of crossovers and shunt lineswhich allow any service to enter any platform from any direction. Bi-directional signalling isrequired to allow for maximum operational flexibility. The linking of all the platforms andlines leads to train performance benefits as well as allowing improved platform working inwhat may prove to be limited available space.
2.5.11 There is also the need for stabling facilities at this location and it is proposed that these gonear or around the Campo de Marte site. These facilities will be accessed by means of ashunt neck, a stretch of line which connects the main running lines with the stablingfacility. shows the proposed layout at Campo de Marte.
Figure 2-10: Campo de Marte Station lay-out
Viracopos Airport
2.5.12 This station is another ‘through’ station with two platforms and the recommended layout isthe same as Galeão Airport, as shown in .
Figure 2-11: Viracopos Airport Station layout
Campinas
2.5.13 Campinas will be a terminating station and will have stabling facilities, as shown in . As aresult, there will be a requirement for a shunt neck connecting the main running lines withthe stabling sidings. It is recommended that this station have two island platforms with fourplatform faces. This allows for future expansion of the Express services from Rio deJaneiro via São Paulo if required, as well as allowing for the high volumes of demand thatwill use the services.
Figure 2-12: Campinas Station layout
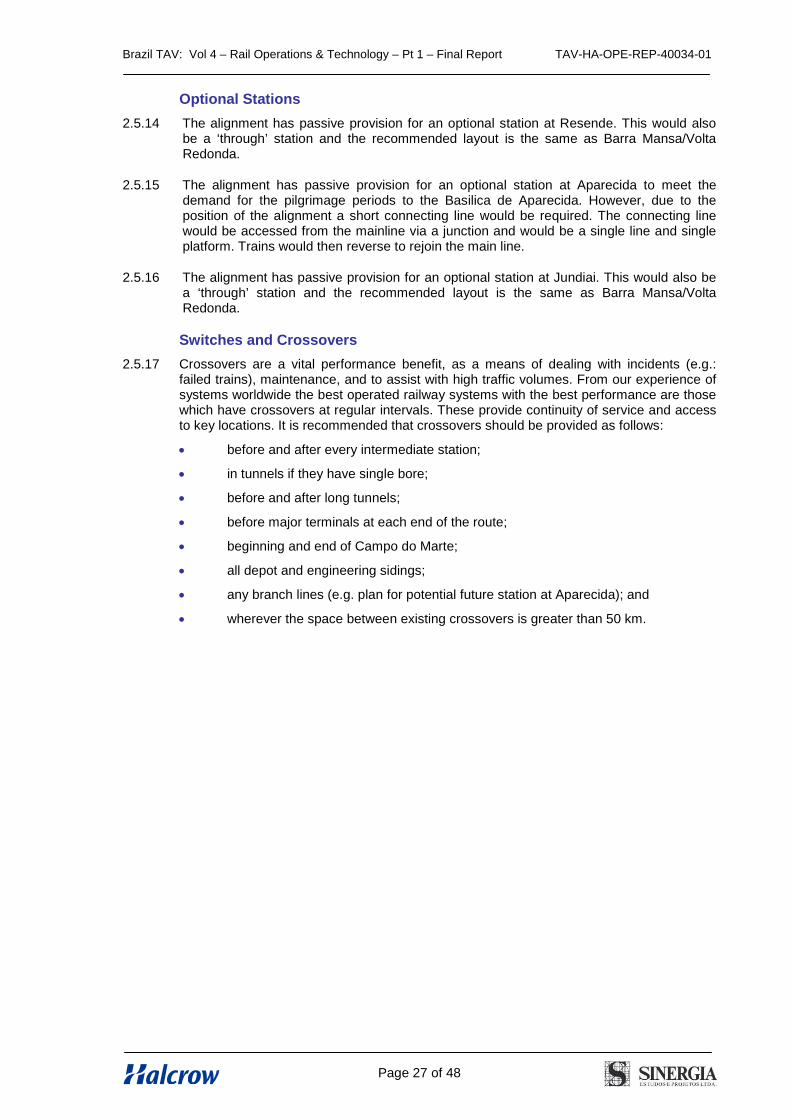
Brazil TAV: Vol 4 – Rail Operations & Technology – Pt 1 – Final Report TAV-HA-OPE-REP-40034-01
Page 27 of 48
Optional Stations
2.5.14 The alignment has passive provision for an optional station at Resende. This would alsobe a ‘through’ station and the recommended layout is the same as Barra Mansa/VoltaRedonda.
2.5.15 The alignment has passive provision for an optional station at Aparecida to meet thedemand for the pilgrimage periods to the Basilica de Aparecida. However, due to theposition of the alignment a short connecting line would be required. The connecting linewould be accessed from the mainline via a junction and would be a single line and singleplatform. Trains would then reverse to rejoin the main line.
2.5.16 The alignment has passive provision for an optional station at Jundiai. This would also bea ‘through’ station and the recommended layout is the same as Barra Mansa/VoltaRedonda.
Switches and Crossovers
2.5.17 Crossovers are a vital performance benefit, as a means of dealing with incidents (e.g.:failed trains), maintenance, and to assist with high traffic volumes. From our experience ofsystems worldwide the best operated railway systems with the best performance are thosewhich have crossovers at regular intervals. These provide continuity of service and accessto key locations. It is recommended that crossovers should be provided as follows:
before and after every intermediate station;
in tunnels if they have single bore;
before and after long tunnels;
before major terminals at each end of the route;
beginning and end of Campo do Marte;
all depot and engineering sidings;
any branch lines (e.g. plan for potential future station at Aparecida); and
wherever the space between existing crossovers is greater than 50 km.
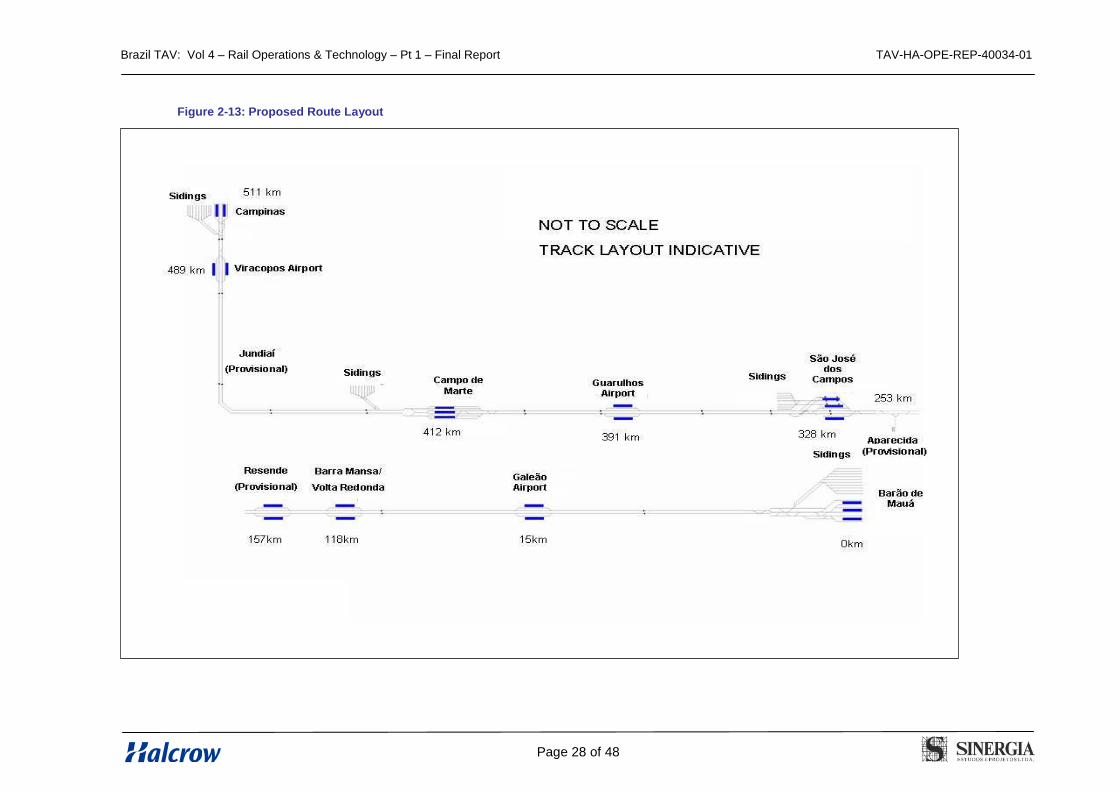
Brazil TAV: Vol 4 – Rail Operations & Technology – Pt 1 – Final Report TAV-HA-OPE-REP-40034-01
Page 28 of 48
Figure 2-13: Proposed Route Layout
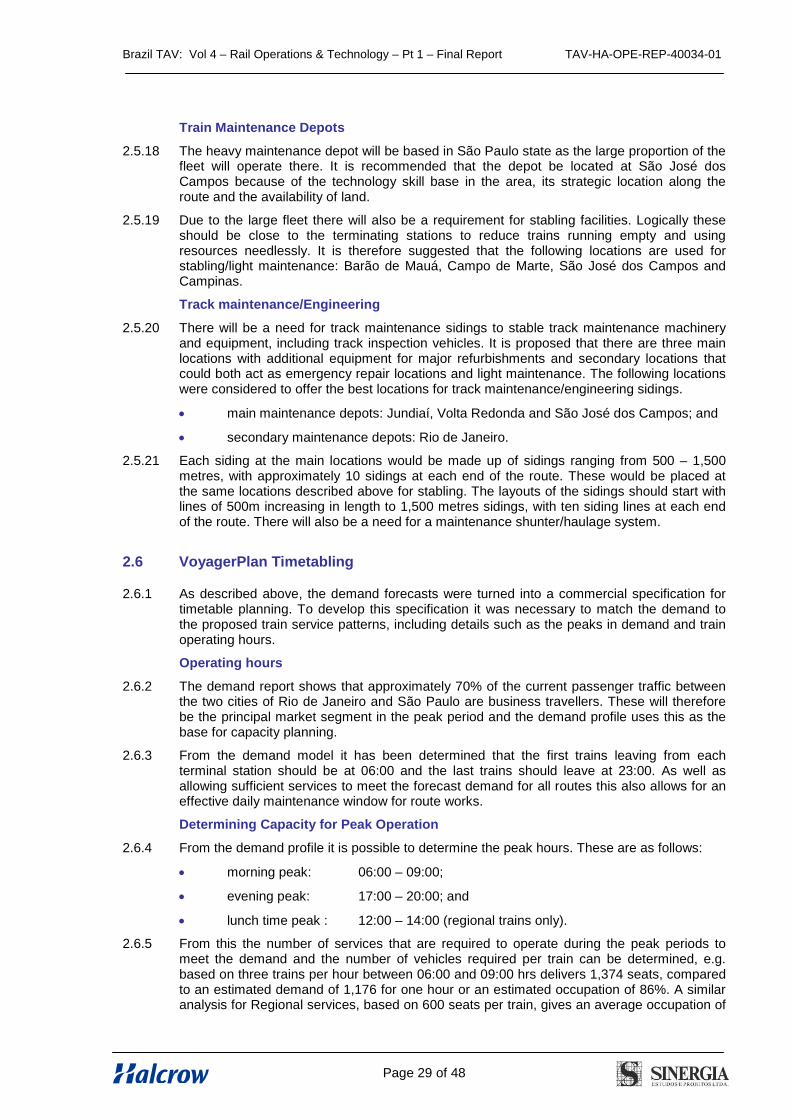
Brazil TAV: Vol 4 – Rail Operations & Technology – Pt 1 – Final Report TAV-HA-OPE-REP-40034-01
Page 29 of 48
Train Maintenance Depots
2.5.18 The heavy maintenance depot will be based in São Paulo state as the large proportion of thefleet will operate there. It is recommended that the depot be located at São José dosCampos because of the technology skill base in the area, its strategic location along theroute and the availability of land.
2.5.19 Due to the large fleet there will also be a requirement for stabling facilities. Logically theseshould be close to the terminating stations to reduce trains running empty and usingresources needlessly. It is therefore suggested that the following locations are used forstabling/light maintenance: Barão de Mauá, Campo de Marte, São José dos Campos andCampinas.
Track maintenance/Engineering
2.5.20 There will be a need for track maintenance sidings to stable track maintenance machineryand equipment, including track inspection vehicles. It is proposed that there are three mainlocations with additional equipment for major refurbishments and secondary locations thatcould both act as emergency repair locations and light maintenance. The following locationswere considered to offer the best locations for track maintenance/engineering sidings.
main maintenance depots: Jundiaí, Volta Redonda and São José dos Campos; and
secondary maintenance depots: Rio de Janeiro.
2.5.21 Each siding at the main locations would be made up of sidings ranging from 500 – 1,500metres, with approximately 10 sidings at each end of the route. These would be placed atthe same locations described above for stabling. The layouts of the sidings should start withlines of 500m increasing in length to 1,500 metres sidings, with ten siding lines at each endof the route. There will also be a need for a maintenance shunter/haulage system.
2.6 VoyagerPlan Timetabling
2.6.1 As described above, the demand forecasts were turned into a commercial specification fortimetable planning. To develop this specification it was necessary to match the demand tothe proposed train service patterns, including details such as the peaks in demand and trainoperating hours.
Operating hours
2.6.2 The demand report shows that approximately 70% of the current passenger traffic betweenthe two cities of Rio de Janeiro and São Paulo are business travellers. These will thereforebe the principal market segment in the peak period and the demand profile uses this as thebase for capacity planning.
2.6.3 From the demand model it has been determined that the first trains leaving from eachterminal station should be at 06:00 and the last trains should leave at 23:00. As well asallowing sufficient services to meet the forecast demand for all routes this also allows for aneffective daily maintenance window for route works.
Determining Capacity for Peak Operation
2.6.4 From the demand profile it is possible to determine the peak hours. These are as follows:
morning peak: 06:00 – 09:00;
evening peak: 17:00 – 20:00; and
lunch time peak : 12:00 – 14:00 (regional trains only).
2.6.5 From this the number of services that are required to operate during the peak periods tomeet the demand and the number of vehicles required per train can be determined, e.g.based on three trains per hour between 06:00 and 09:00 hrs delivers 1,374 seats, comparedto an estimated demand of 1,176 for one hour or an estimated occupation of 86%. A similaranalysis for Regional services, based on 600 seats per train, gives an average occupation of
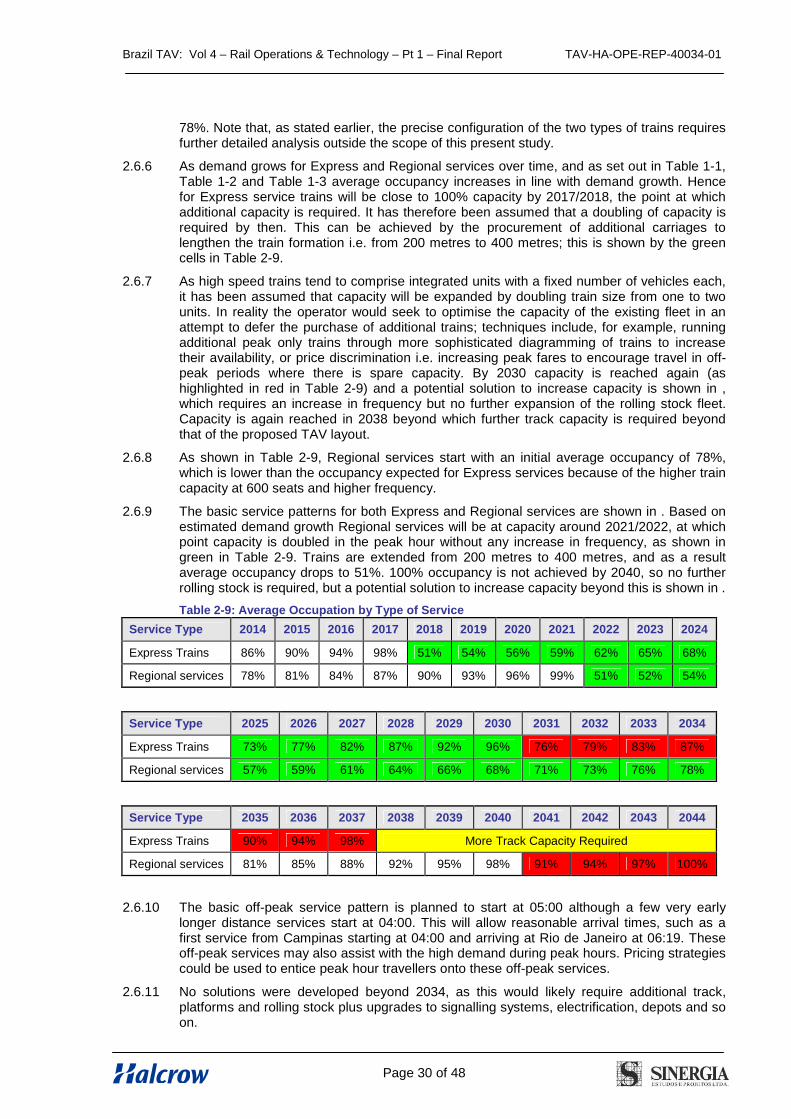
Brazil TAV: Vol 4 – Rail Operations & Technology – Pt 1 – Final Report TAV-HA-OPE-REP-40034-01
Page 30 of 48
78%. Note that, as stated earlier, the precise configuration of the two types of trains requiresfurther detailed analysis outside the scope of this present study.
2.6.6 As demand grows for Express and Regional services over time, and as set out in Table 1-1,Table 1-2 and Table 1-3 average occupancy increases in line with demand growth. Hencefor Express service trains will be close to 100% capacity by 2017/2018, the point at whichadditional capacity is required. It has therefore been assumed that a doubling of capacity isrequired by then. This can be achieved by the procurement of additional carriages tolengthen the train formation i.e. from 200 metres to 400 metres; this is shown by the greencells in Table 2-9.
2.6.7 As high speed trains tend to comprise integrated units with a fixed number of vehicles each,it has been assumed that capacity will be expanded by doubling train size from one to twounits. In reality the operator would seek to optimise the capacity of the existing fleet in anattempt to defer the purchase of additional trains; techniques include, for example, runningadditional peak only trains through more sophisticated diagramming of trains to increasetheir availability, or price discrimination i.e. increasing peak fares to encourage travel in off-peak periods where there is spare capacity. By 2030 capacity is reached again (ashighlighted in red in Table 2-9) and a potential solution to increase capacity is shown in ,which requires an increase in frequency but no further expansion of the rolling stock fleet.Capacity is again reached in 2038 beyond which further track capacity is required beyondthat of the proposed TAV layout.
2.6.8 As shown in Table 2-9, Regional services start with an initial average occupancy of 78%,which is lower than the occupancy expected for Express services because of the higher traincapacity at 600 seats and higher frequency.
2.6.9 The basic service patterns for both Express and Regional services are shown in . Based onestimated demand growth Regional services will be at capacity around 2021/2022, at whichpoint capacity is doubled in the peak hour without any increase in frequency, as shown ingreen in Table 2-9. Trains are extended from 200 metres to 400 metres, and as a resultaverage occupancy drops to 51%. 100% occupancy is not achieved by 2040, so no furtherrolling stock is required, but a potential solution to increase capacity beyond this is shown in .
Table 2-9: Average Occupation by Type of Service
Service Type 2014 2015 2016 2017 2018 2019 2020 2021 2022 2023 2024
Express Trains 86% 90% 94% 98% 51% 54% 56% 59% 62% 65% 68%
Regional services 78% 81% 84% 87% 90% 93% 96% 99% 51% 52% 54%
Service Type 2025 2026 2027 2028 2029 2030 2031 2032 2033 2034
Express Trains 73% 77% 82% 87% 92% 96% 76% 79% 83% 87%
Regional services 57% 59% 61% 64% 66% 68% 71% 73% 76% 78%
Service Type 2035 2036 2037 2038 2039 2040 2041 2042 2043 2044
Express Trains 90% 94% 98% More Track Capacity Required
Regional services 81% 85% 88% 92% 95% 98% 91% 94% 97% 100%
2.6.10 The basic off-peak service pattern is planned to start at 05:00 although a few very earlylonger distance services start at 04:00. This will allow reasonable arrival times, such as afirst service from Campinas starting at 04:00 and arriving at Rio de Janeiro at 06:19. Theseoff-peak services may also assist with the high demand during peak hours. Pricing strategiescould be used to entice peak hour travellers onto these off-peak services.
2.6.11 No solutions were developed beyond 2034, as this would likely require additional track,platforms and rolling stock plus upgrades to signalling systems, electrification, depots and soon.
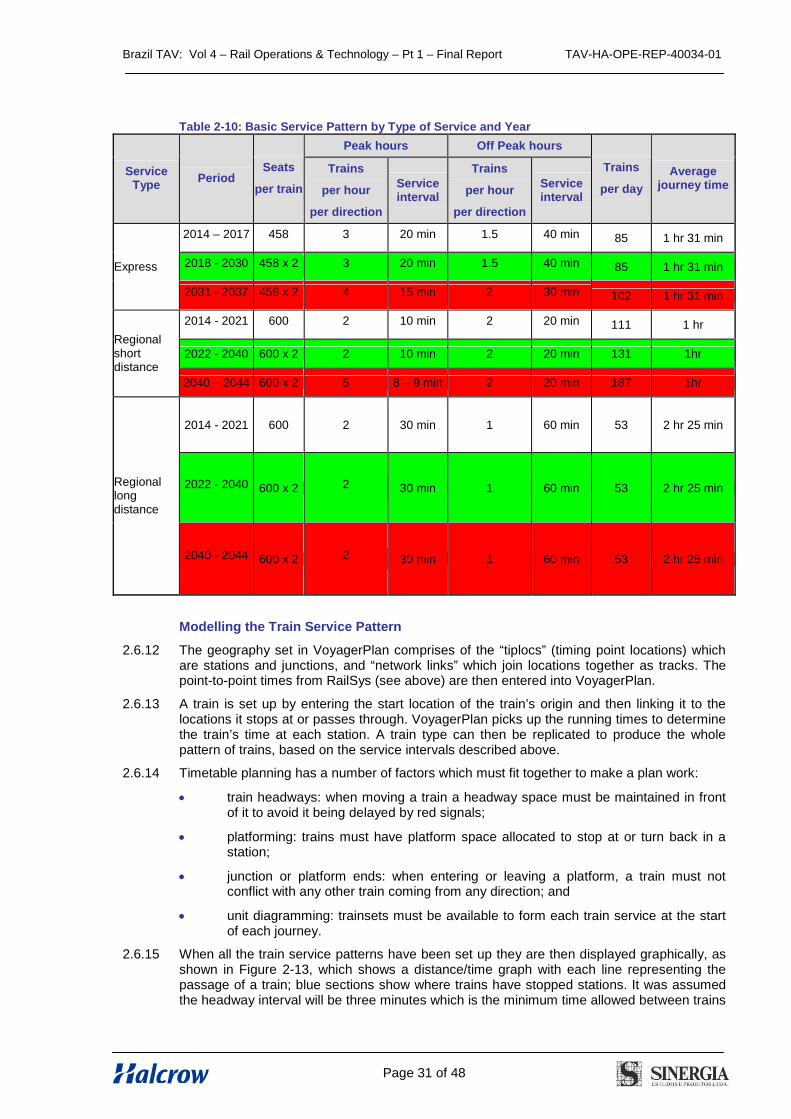
Brazil TAV: Vol 4 – Rail Operations & Technology – Pt 1 – Final Report TAV-HA-OPE-REP-40034-01
Page 31 of 48
Table 2-10: Basic Service Pattern by Type of Service and Year
Peak hours Off Peak hours
ServiceType
PeriodSeats
per train
Trains
per hour
per direction
Serviceinterval
Trains
per hour
per direction
Serviceinterval
Trains
per day
Averagejourney time
2014 – 2017 458 3 20 min 1.5 40 min 85 1 hr 31 min
2018 - 2030 458 x 2 3 20 min 1.5 40 min 85 1 hr 31 minExpress
2031 - 2037 458 x 2 4 15 min 2 30 min 102 1 hr 31 min
2014 - 2021 600 2 10 min 2 20 min 111 1 hr
2022 - 2040 600 x 2 2 10 min 2 20 min 131 1hrRegionalshortdistance
2040 – 2044 600 x 2 5 8 – 9 min 2 20 min 187 1hr
2014 - 2021 600 2 30 min 1 60 min 53 2 hr 25 min
2022 - 2040 600 x 2 2 30 min 1 60 min 53 2 hr 25 minRegionallongdistance
2040 - 2044 600 x 2 2 30 min 1 60 min 53 2 hr 25 min
Modelling the Train Service Pattern
2.6.12 The geography set in VoyagerPlan comprises of the “tiplocs” (timing point locations) whichare stations and junctions, and “network links” which join locations together as tracks. Thepoint-to-point times from RailSys (see above) are then entered into VoyagerPlan.
2.6.13 A train is set up by entering the start location of the train’s origin and then linking it to thelocations it stops at or passes through. VoyagerPlan picks up the running times to determinethe train’s time at each station. A train type can then be replicated to produce the wholepattern of trains, based on the service intervals described above.
2.6.14 Timetable planning has a number of factors which must fit together to make a plan work:
train headways: when moving a train a headway space must be maintained in frontof it to avoid it being delayed by red signals;
platforming: trains must have platform space allocated to stop at or turn back in astation;
junction or platform ends: when entering or leaving a platform, a train must notconflict with any other train coming from any direction; and
unit diagramming: trainsets must be available to form each train service at the startof each journey.
2.6.15 When all the train service patterns have been set up they are then displayed graphically, asshown in Figure 2-13, which shows a distance/time graph with each line representing thepassage of a train; blue sections show where trains have stopped stations. It was assumedthe headway interval will be three minutes which is the minimum time allowed between trains
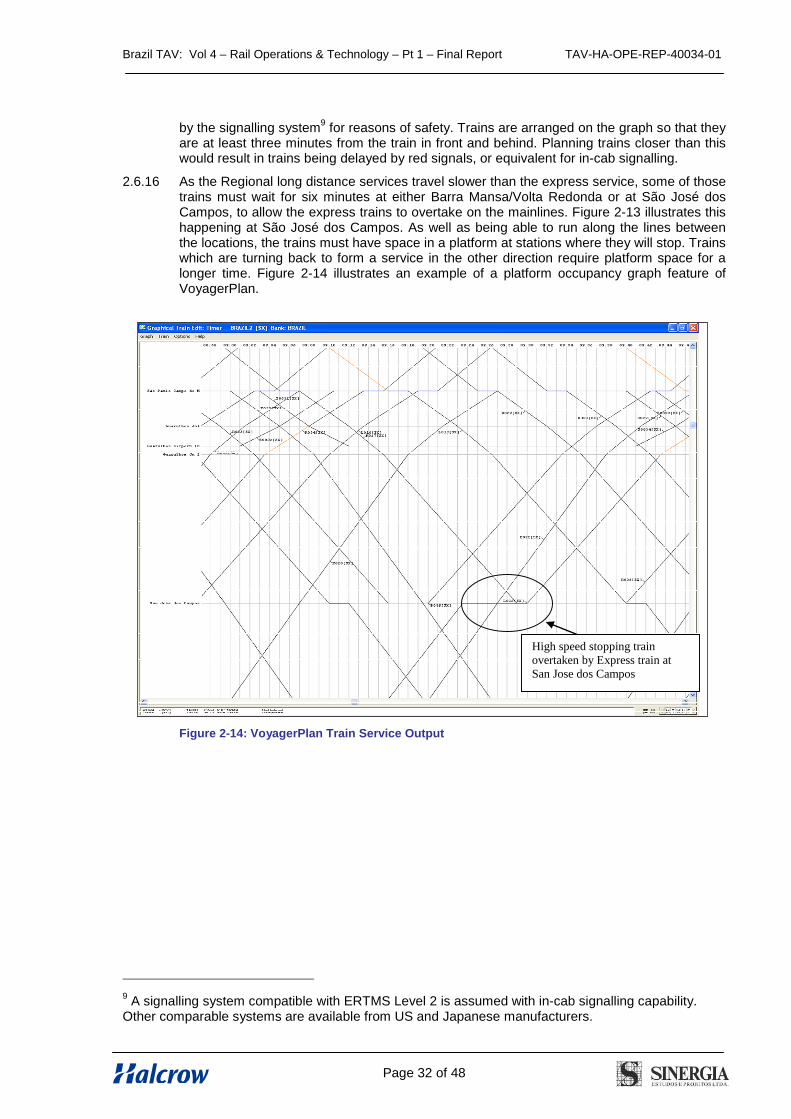
Brazil TAV: Vol 4 – Rail Operations & Technology – Pt 1 – Final Report TAV-HA-OPE-REP-40034-01
Page 32 of 48
High speed stopping trainovertaken by Express train atSan Jose dos Campos
by the signalling system9
for reasons of safety. Trains are arranged on the graph so that theyare at least three minutes from the train in front and behind. Planning trains closer than thiswould result in trains being delayed by red signals, or equivalent for in-cab signalling.
2.6.16 As the Regional long distance services travel slower than the express service, some of thosetrains must wait for six minutes at either Barra Mansa/Volta Redonda or at São José dosCampos, to allow the express trains to overtake on the mainlines. Figure 2-13 illustrates thishappening at São José dos Campos. As well as being able to run along the lines betweenthe locations, the trains must have space in a platform at stations where they will stop. Trainswhich are turning back to form a service in the other direction require platform space for alonger time. Figure 2-14 illustrates an example of a platform occupancy graph feature ofVoyagerPlan.
Figure 2-14: VoyagerPlan Train Service Output
9A signalling system compatible with ERTMS Level 2 is assumed with in-cab signalling capability.
Other comparable systems are available from US and Japanese manufacturers.
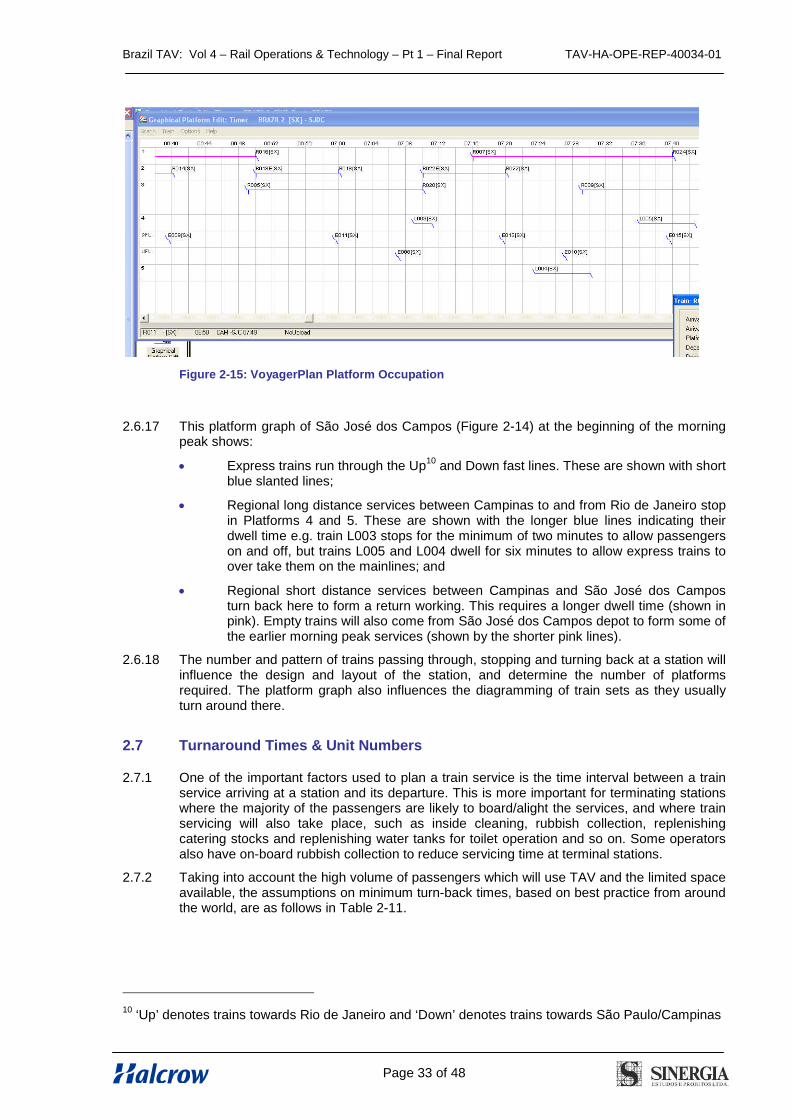
Brazil TAV: Vol 4 – Rail Operations & Technology – Pt 1 – Final Report TAV-HA-OPE-REP-40034-01
Page 33 of 48
Figure 2-15: VoyagerPlan Platform Occupation
2.6.17 This platform graph of São José dos Campos (Figure 2-14) at the beginning of the morningpeak shows:
Express trains run through the Up10
and Down fast lines. These are shown with shortblue slanted lines;
Regional long distance services between Campinas to and from Rio de Janeiro stopin Platforms 4 and 5. These are shown with the longer blue lines indicating theirdwell time e.g. train L003 stops for the minimum of two minutes to allow passengerson and off, but trains L005 and L004 dwell for six minutes to allow express trains toover take them on the mainlines; and
Regional short distance services between Campinas and São José dos Camposturn back here to form a return working. This requires a longer dwell time (shown inpink). Empty trains will also come from São José dos Campos depot to form some ofthe earlier morning peak services (shown by the shorter pink lines).
2.6.18 The number and pattern of trains passing through, stopping and turning back at a station willinfluence the design and layout of the station, and determine the number of platformsrequired. The platform graph also influences the diagramming of train sets as they usuallyturn around there.
2.7 Turnaround Times & Unit Numbers
2.7.1 One of the important factors used to plan a train service is the time interval between a trainservice arriving at a station and its departure. This is more important for terminating stationswhere the majority of the passengers are likely to board/alight the services, and where trainservicing will also take place, such as inside cleaning, rubbish collection, replenishingcatering stocks and replenishing water tanks for toilet operation and so on. Some operatorsalso have on-board rubbish collection to reduce servicing time at terminal stations.
2.7.2 Taking into account the high volume of passengers which will use TAV and the limited spaceavailable, the assumptions on minimum turn-back times, based on best practice from aroundthe world, are as follows in Table 2-11.
10‘Up’ denotes trains towards Rio de Janeiro and ‘Down’ denotes trains towards São Paulo/Campinas
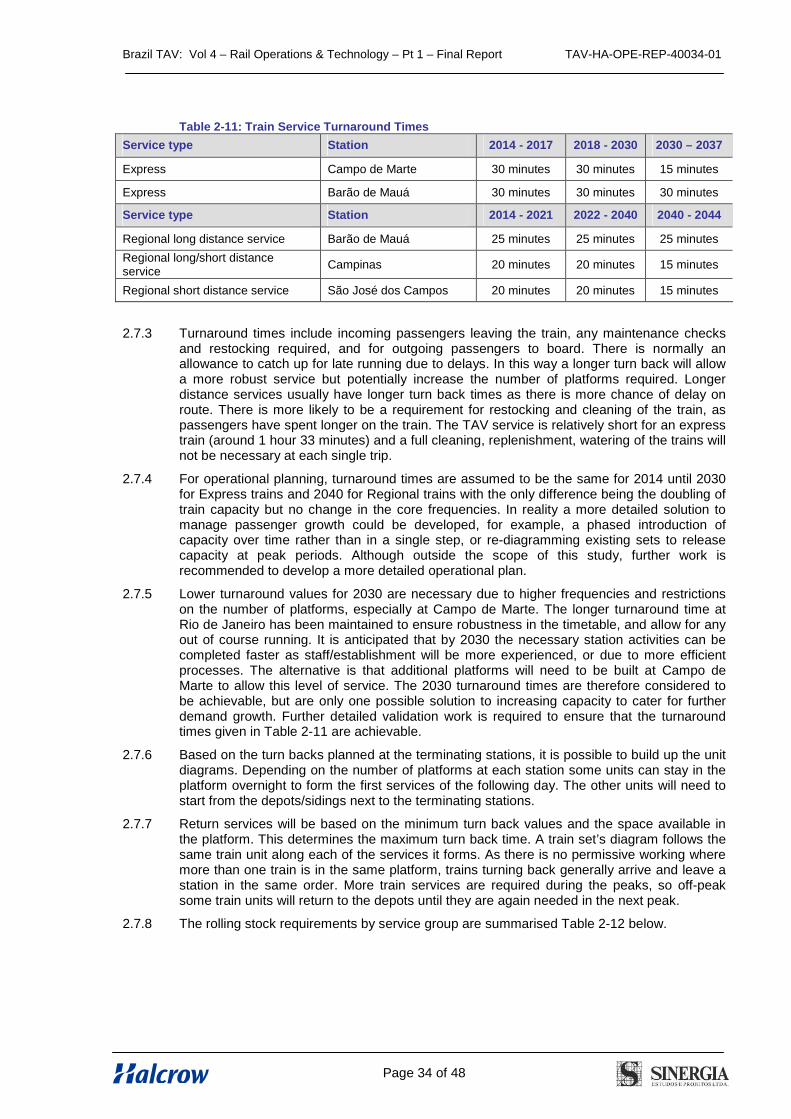
Brazil TAV: Vol 4 – Rail Operations & Technology – Pt 1 – Final Report TAV-HA-OPE-REP-40034-01
Page 34 of 48
Table 2-11: Train Service Turnaround Times
Service type Station 2014 - 2017 2018 - 2030 2030 – 2037
Express Campo de Marte 30 minutes 30 minutes 15 minutes
Express Barão de Mauá 30 minutes 30 minutes 30 minutes
Service type Station 2014 - 2021 2022 - 2040 2040 - 2044
Regional long distance service Barão de Mauá 25 minutes 25 minutes 25 minutes
Regional long/short distanceservice
Campinas 20 minutes 20 minutes 15 minutes
Regional short distance service São José dos Campos 20 minutes 20 minutes 15 minutes
2.7.3 Turnaround times include incoming passengers leaving the train, any maintenance checksand restocking required, and for outgoing passengers to board. There is normally anallowance to catch up for late running due to delays. In this way a longer turn back will allowa more robust service but potentially increase the number of platforms required. Longerdistance services usually have longer turn back times as there is more chance of delay onroute. There is more likely to be a requirement for restocking and cleaning of the train, aspassengers have spent longer on the train. The TAV service is relatively short for an expresstrain (around 1 hour 33 minutes) and a full cleaning, replenishment, watering of the trains willnot be necessary at each single trip.
2.7.4 For operational planning, turnaround times are assumed to be the same for 2014 until 2030for Express trains and 2040 for Regional trains with the only difference being the doubling oftrain capacity but no change in the core frequencies. In reality a more detailed solution tomanage passenger growth could be developed, for example, a phased introduction ofcapacity over time rather than in a single step, or re-diagramming existing sets to releasecapacity at peak periods. Although outside the scope of this study, further work isrecommended to develop a more detailed operational plan.
2.7.5 Lower turnaround values for 2030 are necessary due to higher frequencies and restrictionson the number of platforms, especially at Campo de Marte. The longer turnaround time atRio de Janeiro has been maintained to ensure robustness in the timetable, and allow for anyout of course running. It is anticipated that by 2030 the necessary station activities can becompleted faster as staff/establishment will be more experienced, or due to more efficientprocesses. The alternative is that additional platforms will need to be built at Campo deMarte to allow this level of service. The 2030 turnaround times are therefore considered tobe achievable, but are only one possible solution to increasing capacity to cater for furtherdemand growth. Further detailed validation work is required to ensure that the turnaroundtimes given in Table 2-11 are achievable.
2.7.6 Based on the turn backs planned at the terminating stations, it is possible to build up the unitdiagrams. Depending on the number of platforms at each station some units can stay in theplatform overnight to form the first services of the following day. The other units will need tostart from the depots/sidings next to the terminating stations.
2.7.7 Return services will be based on the minimum turn back values and the space available inthe platform. This determines the maximum turn back time. A train set’s diagram follows thesame train unit along each of the services it forms. As there is no permissive working wheremore than one train is in the same platform, trains turning back generally arrive and leave astation in the same order. More train services are required during the peaks, so off-peaksome train units will return to the depots until they are again needed in the next peak.
2.7.8 The rolling stock requirements by service group are summarised Table 2-12 below.
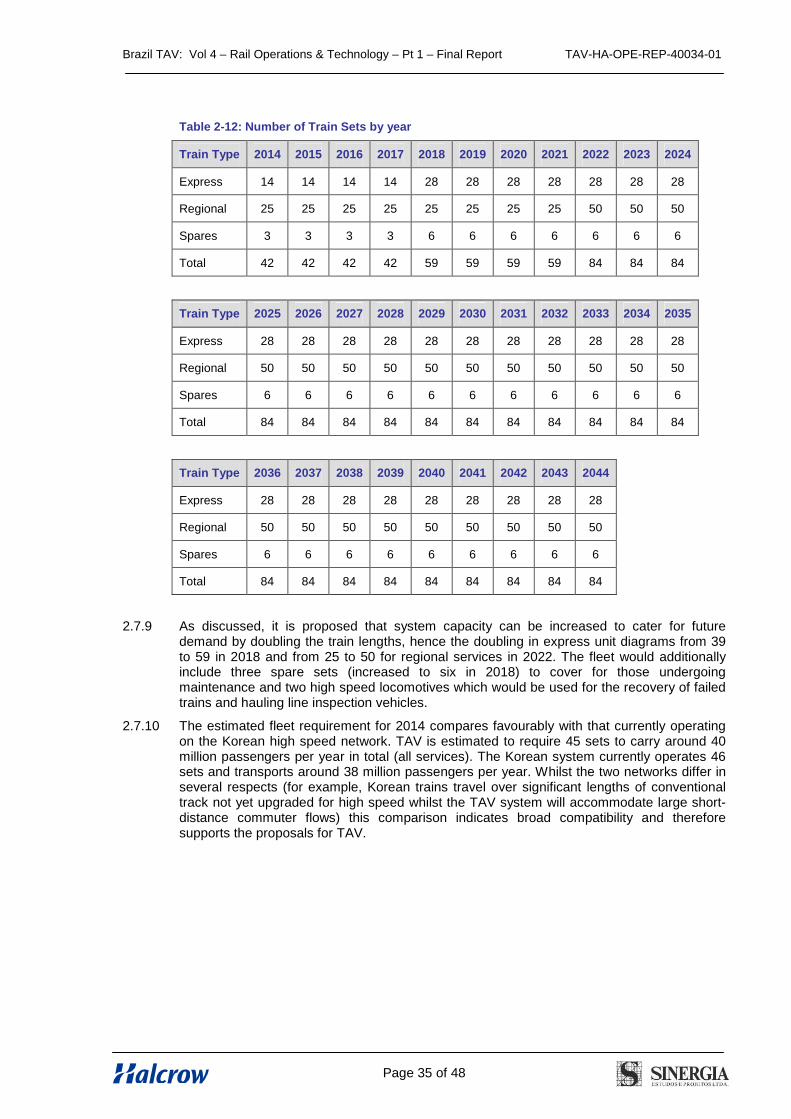
Brazil TAV: Vol 4 – Rail Operations & Technology – Pt 1 – Final Report TAV-HA-OPE-REP-40034-01
Page 35 of 48
Table 2-12: Number of Train Sets by year
Train Type 2014 2015 2016 2017 2018 2019 2020 2021 2022 2023 2024
Express 14 14 14 14 28 28 28 28 28 28 28
Regional 25 25 25 25 25 25 25 25 50 50 50
Spares 3 3 3 3 6 6 6 6 6 6 6
Total 42 42 42 42 59 59 59 59 84 84 84
Train Type 2025 2026 2027 2028 2029 2030 2031 2032 2033 2034 2035
Express 28 28 28 28 28 28 28 28 28 28 28
Regional 50 50 50 50 50 50 50 50 50 50 50
Spares 6 6 6 6 6 6 6 6 6 6 6
Total 84 84 84 84 84 84 84 84 84 84 84
Train Type 2036 2037 2038 2039 2040 2041 2042 2043 2044
Express 28 28 28 28 28 28 28 28 28
Regional 50 50 50 50 50 50 50 50 50
Spares 6 6 6 6 6 6 6 6 6
Total 84 84 84 84 84 84 84 84 84
2.7.9 As discussed, it is proposed that system capacity can be increased to cater for futuredemand by doubling the train lengths, hence the doubling in express unit diagrams from 39to 59 in 2018 and from 25 to 50 for regional services in 2022. The fleet would additionallyinclude three spare sets (increased to six in 2018) to cover for those undergoingmaintenance and two high speed locomotives which would be used for the recovery of failedtrains and hauling line inspection vehicles.
2.7.10 The estimated fleet requirement for 2014 compares favourably with that currently operatingon the Korean high speed network. TAV is estimated to require 45 sets to carry around 40million passengers per year in total (all services). The Korean system currently operates 46sets and transports around 38 million passengers per year. Whilst the two networks differ inseveral respects (for example, Korean trains travel over significant lengths of conventionaltrack not yet upgraded for high speed whilst the TAV system will accommodate large short-distance commuter flows) this comparison indicates broad compatibility and thereforesupports the proposals for TAV.
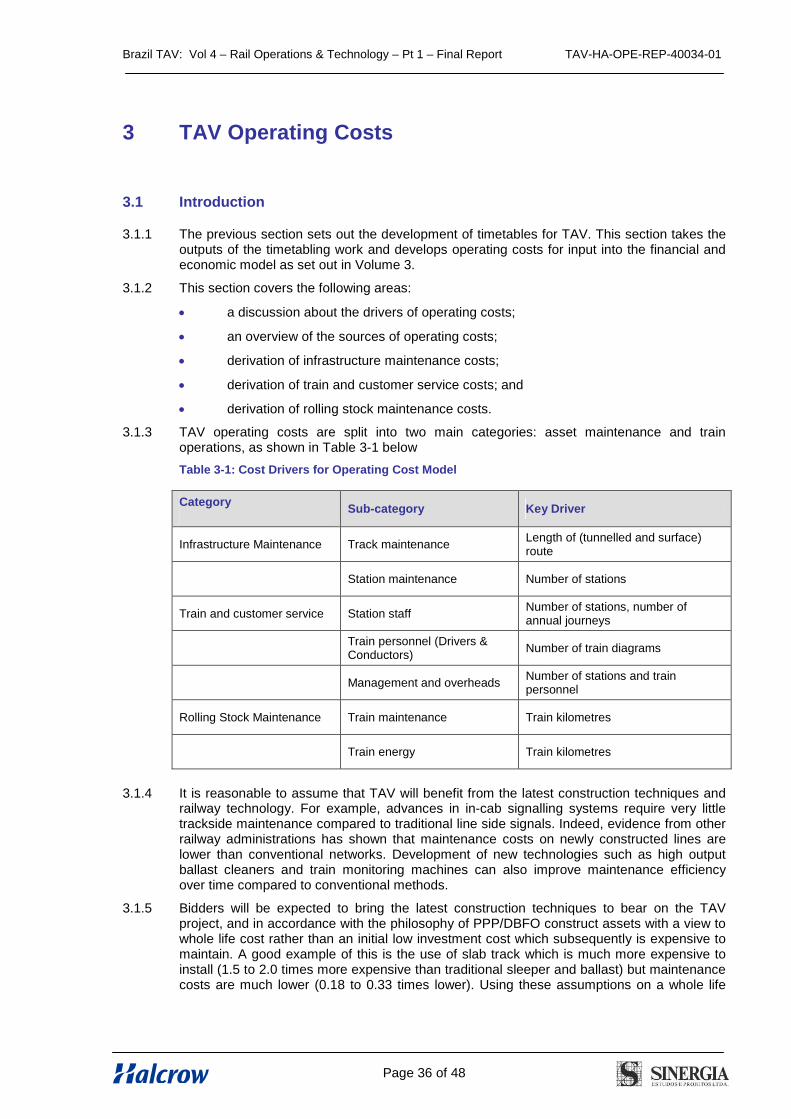
Brazil TAV: Vol 4 – Rail Operations & Technology – Pt 1 – Final Report TAV-HA-OPE-REP-40034-01
Page 36 of 48
3 TAV Operating Costs
3.1 Introduction
3.1.1 The previous section sets out the development of timetables for TAV. This section takes theoutputs of the timetabling work and develops operating costs for input into the financial andeconomic model as set out in Volume 3.
3.1.2 This section covers the following areas:
a discussion about the drivers of operating costs;
an overview of the sources of operating costs;
derivation of infrastructure maintenance costs;
derivation of train and customer service costs; and
derivation of rolling stock maintenance costs.
3.1.3 TAV operating costs are split into two main categories: asset maintenance and trainoperations, as shown in Table 3-1 below
Table 3-1: Cost Drivers for Operating Cost Model
CategorySub-category Key Driver
Infrastructure Maintenance Track maintenanceLength of (tunnelled and surface)route
Station maintenance Number of stations
Train and customer service Station staffNumber of stations, number ofannual journeys
Train personnel (Drivers &Conductors)
Number of train diagrams
Management and overheadsNumber of stations and trainpersonnel
Rolling Stock Maintenance Train maintenance Train kilometres
Train energy Train kilometres
3.1.4 It is reasonable to assume that TAV will benefit from the latest construction techniques andrailway technology. For example, advances in in-cab signalling systems require very littletrackside maintenance compared to traditional line side signals. Indeed, evidence from otherrailway administrations has shown that maintenance costs on newly constructed lines arelower than conventional networks. Development of new technologies such as high outputballast cleaners and train monitoring machines can also improve maintenance efficiencyover time compared to conventional methods.
3.1.5 Bidders will be expected to bring the latest construction techniques to bear on the TAVproject, and in accordance with the philosophy of PPP/DBFO construct assets with a view towhole life cost rather than an initial low investment cost which subsequently is expensive tomaintain. A good example of this is the use of slab track which is much more expensive toinstall (1.5 to 2.0 times more expensive than traditional sleeper and ballast) but maintenancecosts are much lower (0.18 to 0.33 times lower). Using these assumptions on a whole life
Brazil TAV: Vol 4 – Rail Operations & Technology – Pt 1 – Final Report TAV-HA-OPE-REP-40034-01
Page 37 of 48
cost basis slab track is 12% lower than traditional sleeper and ballast in total cost terms11
.Most countries have, however, opted for conventional ballasted track rather thanimplementing slab track. The final choice on slab track is a decision for bidders.
3.1.6 Maintenance regimes and equipment redundancy have a big impact on maintenance costswhich are hard to control across railway administrations. Maintenance on the Shinkansennetwork is based on a philosophy of extensive preventative maintenance, examinations, andmonitoring to a much higher standard than used in Europe.
3.1.7 Axle loading also has a big impact on track wear and it has been assumed here no highspeed freight trains will be operated on the TAV alignment. Moreover, the design gradient forTAV at 3.5% would be unsuitable for freight operation.
3.1.8 Worldwide, railway administrations use different accountancy standards for maintenancecosts and this makes comparisons between administrations hard to achieve on a like-for-likebasis. In Europe it is a legal requirement (91/440) to split costs between infrastructure andoperations, and this is reflected in the organisational structure of railway administrationswithin the European Union i.e. vertical separation.
3.1.9 The methodology used in this study is based on benchmarking of operating costs comparedto other railway administrations. Benchmarking of operating costs is difficult, for the reasonsstated above, and care is required to ensure transferability to TAV. It is, however, reasonableto assume that TAV will be maintained to international standards, and in any case this wouldbe a requirement of the concession agreement. Hence, international norms with regard tothe replacement of track, S&C, ballast cleaning and so on are assumed to apply to TAV, asis rail maintenance technology such as on-track machines: rail grinders, tampers, ballastcleaners and so on.
3.2 Basis of Operating Costs
3.2.1 The operating costs presented are on a “per track kilometre”, or “per unit” basis and areaverages taken from Halcrow’s in-house whole life cost databases which contain extensiveinternational experience. It should be noted that Halcrow was involved in a major technicalreview of the UK’s Network Rail maintenance and renewal costs for the Office of the RailRegulator (ORR) in 2008/2009, during which the long trends for maintenance costs wereexamined. The review considered the costs of maintenance and renewals for the UKnetwork as part of Network Rail’s periodic review in 2008/2009, and drew heavily oninternational experience to determine the potential for efficiency savings.
3.2.2 In those cases where the adoption of international operating costs might not reflect the localcosts, i.e. the cost of electricity, values given were based on rates supplied by PROMPTENGENHARIA LTDA. (“PROMPT”). Whenever this was the case, this has been highlightedin the sections below. Full details of PROMPT ENGENHARIA LTDA’s work are given inAppendix B.
3.2.3 The difficulty of estimating reliable operating costs should not be under estimated as railwaysare long-life assets and true maintenance costs may only emerge after many years ofoperation when renewals and refurbishment need to be considered. Some operating costsare fixed, such as signalling and safety management systems and depend on technical andsafety standards rather than traffic intensity.
3.2.4 Adjustments have been made for the fact that TAV will be a new railway, and will not use orshare any existing conventional railway infrastructure, and that infrastructure costs areexpected to be lower in the initial years of service, particularly for structures and tunnels.However, the scope for significantly lower track maintenance costs in Brazil, exploitingcheaper labour rates, is more limited because much of the work is mechanised e.g.tamping/ballast cleaning, and the equipment and tools will have to be imported. Plus thedecision to adopt a 1,435mm track gauge will mean that any existing maintenance
11WS Atkins (2002) High Speed Line Study Milestone 8 Cost Model Report prepared for the SRA
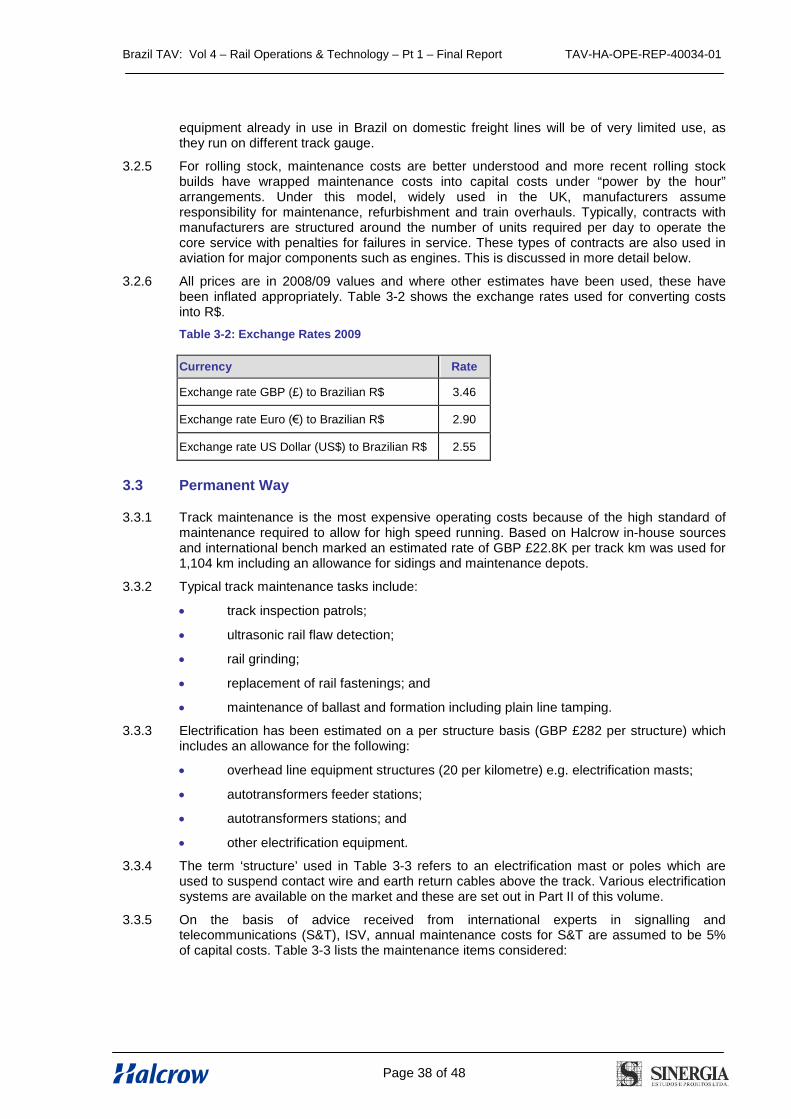
Brazil TAV: Vol 4 – Rail Operations & Technology – Pt 1 – Final Report TAV-HA-OPE-REP-40034-01
Page 38 of 48
equipment already in use in Brazil on domestic freight lines will be of very limited use, asthey run on different track gauge.
3.2.5 For rolling stock, maintenance costs are better understood and more recent rolling stockbuilds have wrapped maintenance costs into capital costs under “power by the hour”arrangements. Under this model, widely used in the UK, manufacturers assumeresponsibility for maintenance, refurbishment and train overhauls. Typically, contracts withmanufacturers are structured around the number of units required per day to operate thecore service with penalties for failures in service. These types of contracts are also used inaviation for major components such as engines. This is discussed in more detail below.
3.2.6 All prices are in 2008/09 values and where other estimates have been used, these havebeen inflated appropriately. Table 3-2 shows the exchange rates used for converting costsinto R$.
Table 3-2: Exchange Rates 2009
Currency Rate
Exchange rate GBP (£) to Brazilian R$ 3.46
Exchange rate Euro (€) to Brazilian R$ 2.90
Exchange rate US Dollar (US$) to Brazilian R$ 2.55
3.3 Permanent Way
3.3.1 Track maintenance is the most expensive operating costs because of the high standard ofmaintenance required to allow for high speed running. Based on Halcrow in-house sourcesand international bench marked an estimated rate of GBP £22.8K per track km was used for1,104 km including an allowance for sidings and maintenance depots.
3.3.2 Typical track maintenance tasks include:
track inspection patrols;
ultrasonic rail flaw detection;
rail grinding;
replacement of rail fastenings; and
maintenance of ballast and formation including plain line tamping.
3.3.3 Electrification has been estimated on a per structure basis (GBP £282 per structure) whichincludes an allowance for the following:
overhead line equipment structures (20 per kilometre) e.g. electrification masts;
autotransformers feeder stations;
autotransformers stations; and
other electrification equipment.
3.3.4 The term ‘structure’ used in Table 3-3 refers to an electrification mast or poles which areused to suspend contact wire and earth return cables above the track. Various electrificationsystems are available on the market and these are set out in Part II of this volume.
3.3.5 On the basis of advice received from international experts in signalling andtelecommunications (S&T), ISV, annual maintenance costs for S&T are assumed to be 5%of capital costs. Table 3-3 lists the maintenance items considered:
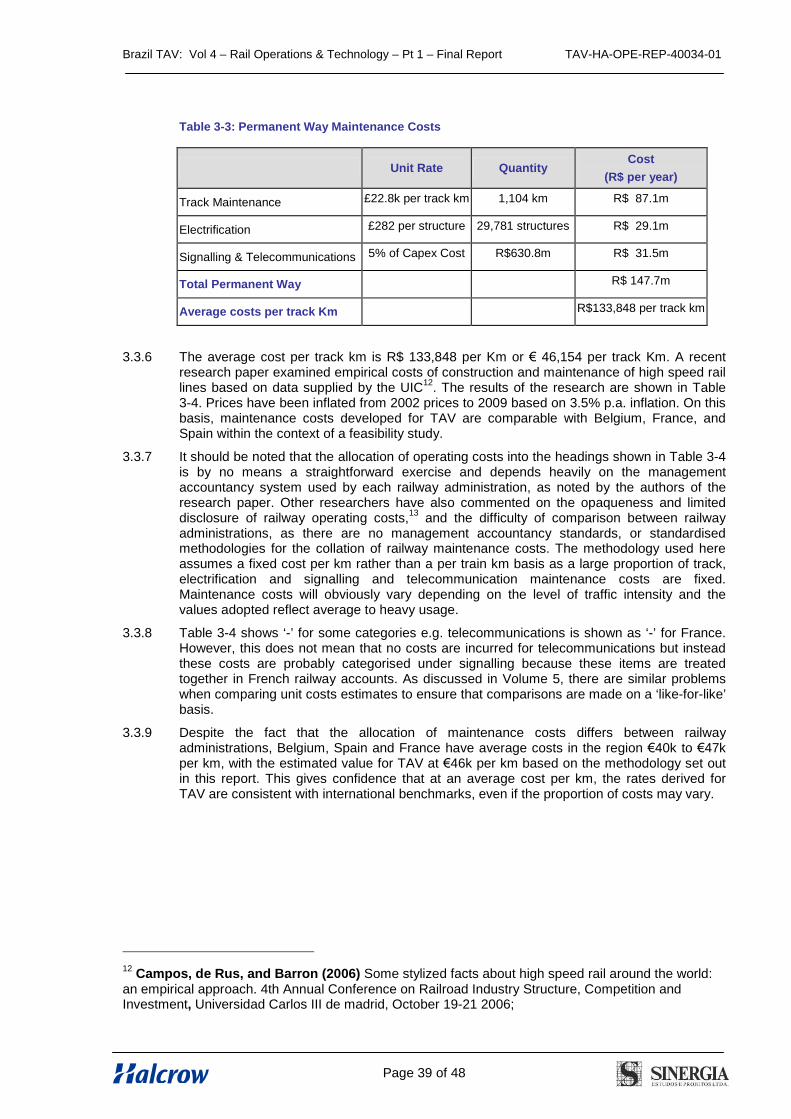
Brazil TAV: Vol 4 – Rail Operations & Technology – Pt 1 – Final Report TAV-HA-OPE-REP-40034-01
Page 39 of 48
Table 3-3: Permanent Way Maintenance Costs
Unit Rate QuantityCost
(R$ per year)
Track Maintenance £22.8k per track km 1,104 km R$ 87.1m
Electrification £282 per structure 29,781 structures R$ 29.1m
Signalling & Telecommunications 5% of Capex Cost R$630.8m R$ 31.5m
Total Permanent Way R$ 147.7m
Average costs per track Km R$133,848 per track km
3.3.6 The average cost per track km is R$ 133,848 per Km or € 46,154 per track Km. A recentresearch paper examined empirical costs of construction and maintenance of high speed raillines based on data supplied by the UIC
12. The results of the research are shown in Table
3-4. Prices have been inflated from 2002 prices to 2009 based on 3.5% p.a. inflation. On thisbasis, maintenance costs developed for TAV are comparable with Belgium, France, andSpain within the context of a feasibility study.
3.3.7 It should be noted that the allocation of operating costs into the headings shown in Table 3-4is by no means a straightforward exercise and depends heavily on the managementaccountancy system used by each railway administration, as noted by the authors of theresearch paper. Other researchers have also commented on the opaqueness and limiteddisclosure of railway operating costs,
13and the difficulty of comparison between railway
administrations, as there are no management accountancy standards, or standardisedmethodologies for the collation of railway maintenance costs. The methodology used hereassumes a fixed cost per km rather than a per train km basis as a large proportion of track,electrification and signalling and telecommunication maintenance costs are fixed.Maintenance costs will obviously vary depending on the level of traffic intensity and thevalues adopted reflect average to heavy usage.
3.3.8 Table 3-4 shows ‘-’ for some categories e.g. telecommunications is shown as ‘-’ for France.However, this does not mean that no costs are incurred for telecommunications but insteadthese costs are probably categorised under signalling because these items are treatedtogether in French railway accounts. As discussed in Volume 5, there are similar problemswhen comparing unit costs estimates to ensure that comparisons are made on a ‘like-for-like’basis.
3.3.9 Despite the fact that the allocation of maintenance costs differs between railwayadministrations, Belgium, Spain and France have average costs in the region €40k to €47kper km, with the estimated value for TAV at €46k per km based on the methodology set outin this report. This gives confidence that at an average cost per km, the rates derived forTAV are consistent with international benchmarks, even if the proportion of costs may vary.
12Campos, de Rus, and Barron (2006) Some stylized facts about high speed rail around the world:
an empirical approach. 4th Annual Conference on Railroad Industry Structure, Competition andInvestment, Universidad Carlos III de madrid, October 19-21 2006;
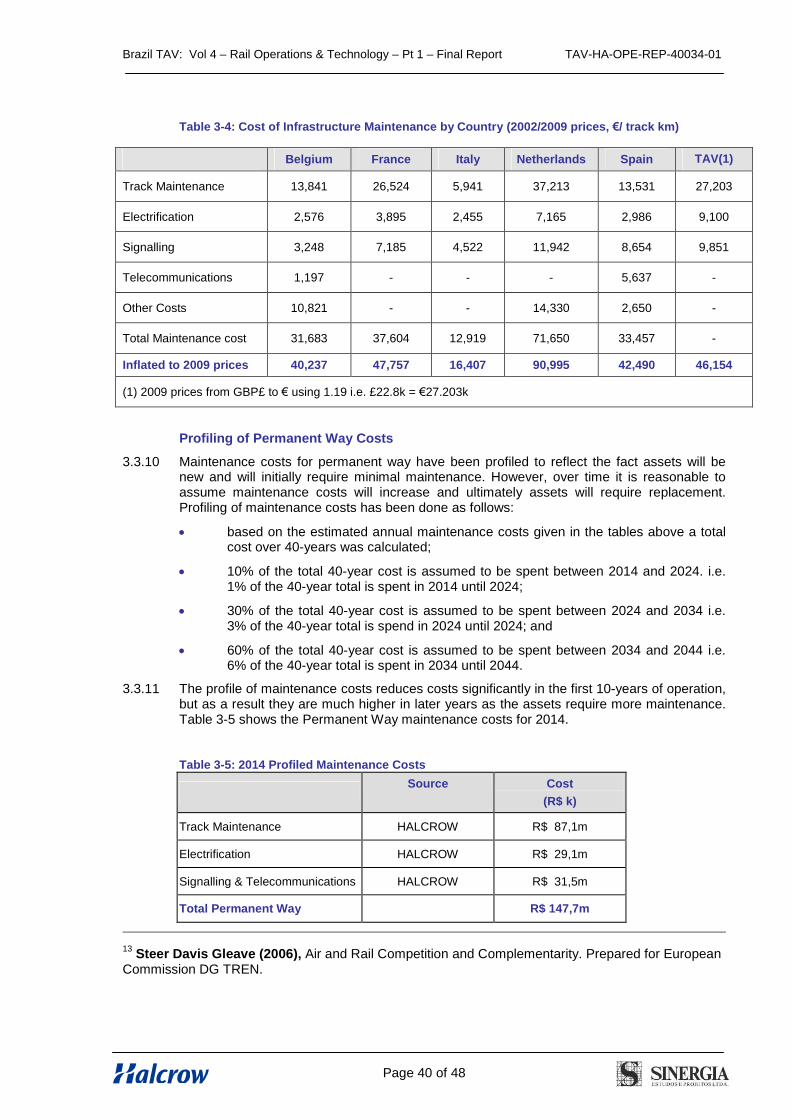
Brazil TAV: Vol 4 – Rail Operations & Technology – Pt 1 – Final Report TAV-HA-OPE-REP-40034-01
Page 40 of 48
Table 3-4: Cost of Infrastructure Maintenance by Country (2002/2009 prices, €/ track km)
Belgium France Italy Netherlands Spain TAV(1)
Track Maintenance 13,841 26,524 5,941 37,213 13,531 27,203
Electrification 2,576 3,895 2,455 7,165 2,986 9,100
Signalling 3,248 7,185 4,522 11,942 8,654 9,851
Telecommunications 1,197 - - - 5,637 -
Other Costs 10,821 - - 14,330 2,650 -
Total Maintenance cost 31,683 37,604 12,919 71,650 33,457 -
Inflated to 2009 prices 40,237 47,757 16,407 90,995 42,490 46,154
(1) 2009 prices from GBP£ to € using 1.19 i.e. £22.8k = €27.203k
Profiling of Permanent Way Costs
3.3.10 Maintenance costs for permanent way have been profiled to reflect the fact assets will benew and will initially require minimal maintenance. However, over time it is reasonable toassume maintenance costs will increase and ultimately assets will require replacement.Profiling of maintenance costs has been done as follows:
based on the estimated annual maintenance costs given in the tables above a totalcost over 40-years was calculated;
10% of the total 40-year cost is assumed to be spent between 2014 and 2024. i.e.1% of the 40-year total is spent in 2014 until 2024;
30% of the total 40-year cost is assumed to be spent between 2024 and 2034 i.e.3% of the 40-year total is spend in 2024 until 2024; and
60% of the total 40-year cost is assumed to be spent between 2034 and 2044 i.e.6% of the 40-year total is spent in 2034 until 2044.
3.3.11 The profile of maintenance costs reduces costs significantly in the first 10-years of operation,but as a result they are much higher in later years as the assets require more maintenance.Table 3-5 shows the Permanent Way maintenance costs for 2014.
Table 3-5: 2014 Profiled Maintenance Costs
Source Cost
(R$ k)
Track Maintenance HALCROW R$ 87,1m
Electrification HALCROW R$ 29,1m
Signalling & Telecommunications HALCROW R$ 31,5m
Total Permanent Way R$ 147,7m
13Steer Davis Gleave (2006), Air and Rail Competition and Complementarity. Prepared for European
Commission DG TREN.
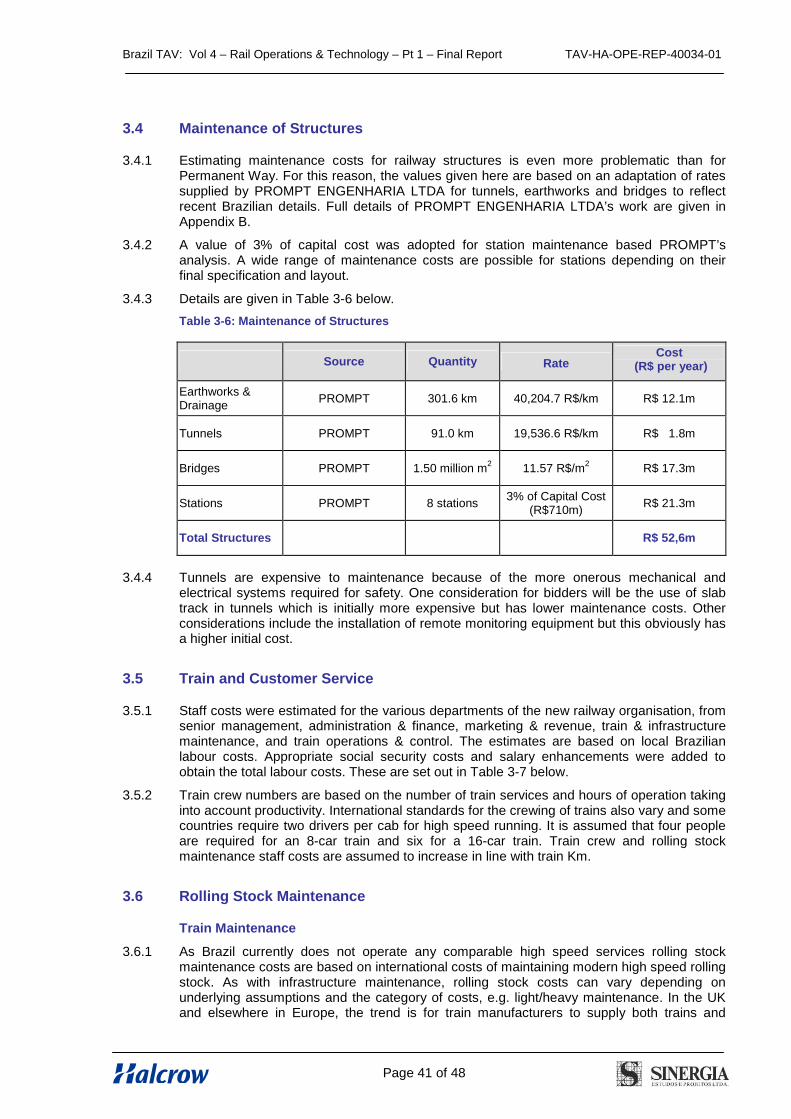
Brazil TAV: Vol 4 – Rail Operations & Technology – Pt 1 – Final Report TAV-HA-OPE-REP-40034-01
Page 41 of 48
3.4 Maintenance of Structures
3.4.1 Estimating maintenance costs for railway structures is even more problematic than forPermanent Way. For this reason, the values given here are based on an adaptation of ratessupplied by PROMPT ENGENHARIA LTDA for tunnels, earthworks and bridges to reflectrecent Brazilian details. Full details of PROMPT ENGENHARIA LTDA’s work are given inAppendix B.
3.4.2 A value of 3% of capital cost was adopted for station maintenance based PROMPT’sanalysis. A wide range of maintenance costs are possible for stations depending on theirfinal specification and layout.
3.4.3 Details are given in Table 3-6 below.
Table 3-6: Maintenance of Structures
Source Quantity RateCost
(R$ per year)
Earthworks &Drainage
PROMPT 301.6 km 40,204.7 R$/km R$ 12.1m
Tunnels PROMPT 91.0 km 19,536.6 R$/km R$ 1.8m
Bridges PROMPT 1.50 million m2
11.57 R$/m2
R$ 17.3m
Stations PROMPT 8 stations3% of Capital Cost
(R$710m)R$ 21.3m
Total Structures R$ 52,6m
3.4.4 Tunnels are expensive to maintenance because of the more onerous mechanical andelectrical systems required for safety. One consideration for bidders will be the use of slabtrack in tunnels which is initially more expensive but has lower maintenance costs. Otherconsiderations include the installation of remote monitoring equipment but this obviously hasa higher initial cost.
3.5 Train and Customer Service
3.5.1 Staff costs were estimated for the various departments of the new railway organisation, fromsenior management, administration & finance, marketing & revenue, train & infrastructuremaintenance, and train operations & control. The estimates are based on local Brazilianlabour costs. Appropriate social security costs and salary enhancements were added toobtain the total labour costs. These are set out in Table 3-7 below.
3.5.2 Train crew numbers are based on the number of train services and hours of operation takinginto account productivity. International standards for the crewing of trains also vary and somecountries require two drivers per cab for high speed running. It is assumed that four peopleare required for an 8-car train and six for a 16-car train. Train crew and rolling stockmaintenance staff costs are assumed to increase in line with train Km.
3.6 Rolling Stock Maintenance
Train Maintenance
3.6.1 As Brazil currently does not operate any comparable high speed services rolling stockmaintenance costs are based on international costs of maintaining modern high speed rollingstock. As with infrastructure maintenance, rolling stock costs can vary depending onunderlying assumptions and the category of costs, e.g. light/heavy maintenance. In the UKand elsewhere in Europe, the trend is for train manufacturers to supply both trains and
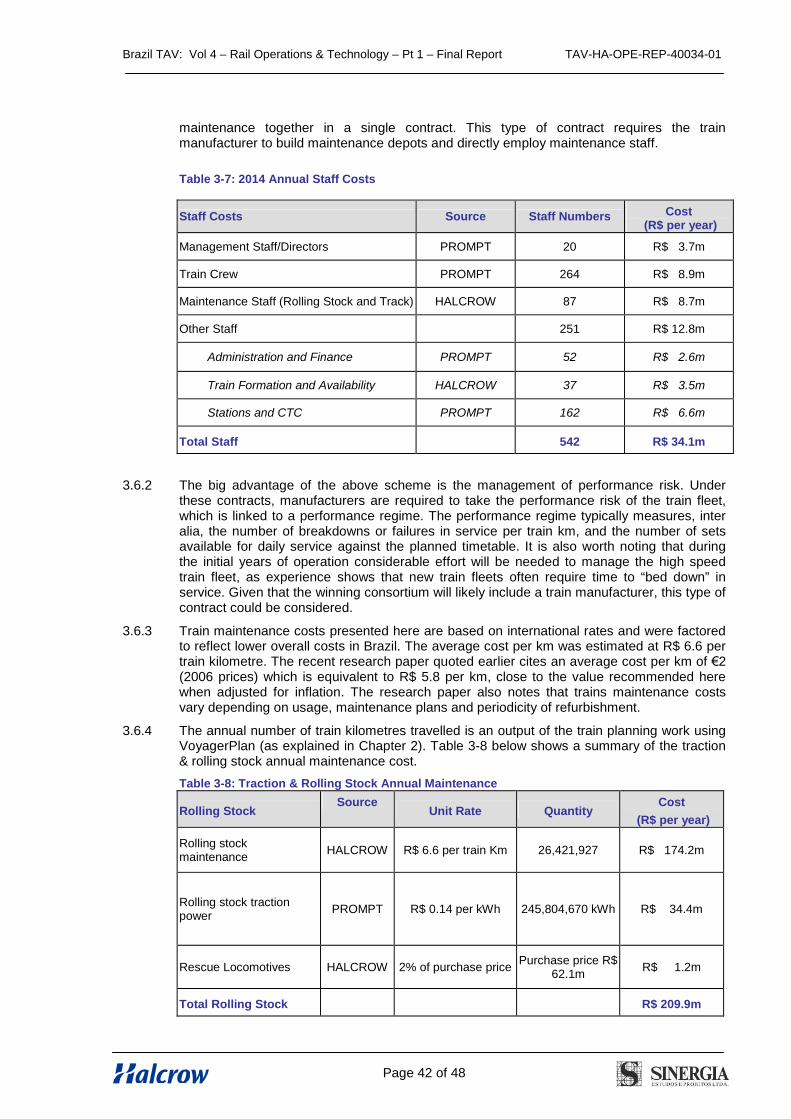
Brazil TAV: Vol 4 – Rail Operations & Technology – Pt 1 – Final Report TAV-HA-OPE-REP-40034-01
Page 42 of 48
maintenance together in a single contract. This type of contract requires the trainmanufacturer to build maintenance depots and directly employ maintenance staff.
Table 3-7: 2014 Annual Staff Costs
Staff Costs Source Staff Numbers Cost(R$ per year)
Management Staff/Directors PROMPT 20 R$ 3.7m
Train Crew PROMPT 264 R$ 8.9m
Maintenance Staff (Rolling Stock and Track) HALCROW 87 R$ 8.7m
Other Staff 251 R$ 12.8m
Administration and Finance PROMPT 52 R$ 2.6m
Train Formation and Availability HALCROW 37 R$ 3.5m
Stations and CTC PROMPT 162 R$ 6.6m
Total Staff 542 R$ 34.1m
3.6.2 The big advantage of the above scheme is the management of performance risk. Underthese contracts, manufacturers are required to take the performance risk of the train fleet,which is linked to a performance regime. The performance regime typically measures, interalia, the number of breakdowns or failures in service per train km, and the number of setsavailable for daily service against the planned timetable. It is also worth noting that duringthe initial years of operation considerable effort will be needed to manage the high speedtrain fleet, as experience shows that new train fleets often require time to “bed down” inservice. Given that the winning consortium will likely include a train manufacturer, this type ofcontract could be considered.
3.6.3 Train maintenance costs presented here are based on international rates and were factoredto reflect lower overall costs in Brazil. The average cost per km was estimated at R$ 6.6 pertrain kilometre. The recent research paper quoted earlier cites an average cost per km of €2(2006 prices) which is equivalent to R$ 5.8 per km, close to the value recommended herewhen adjusted for inflation. The research paper also notes that trains maintenance costsvary depending on usage, maintenance plans and periodicity of refurbishment.
3.6.4 The annual number of train kilometres travelled is an output of the train planning work usingVoyagerPlan (as explained in Chapter 2). Table 3-8 below shows a summary of the traction& rolling stock annual maintenance cost.
Table 3-8: Traction & Rolling Stock Annual Maintenance
Rolling StockSource
Unit Rate QuantityCost
(R$ per year)
Rolling stockmaintenance
HALCROW R$ 6.6 per train Km 26,421,927 R$ 174.2m
Rolling stock tractionpower
PROMPT R$ 0.14 per kWh 245,804,670 kWh R$ 34.4m
Rescue Locomotives HALCROW 2% of purchase pricePurchase price R$
62.1mR$ 1.2m
Total Rolling Stock R$ 209.9m
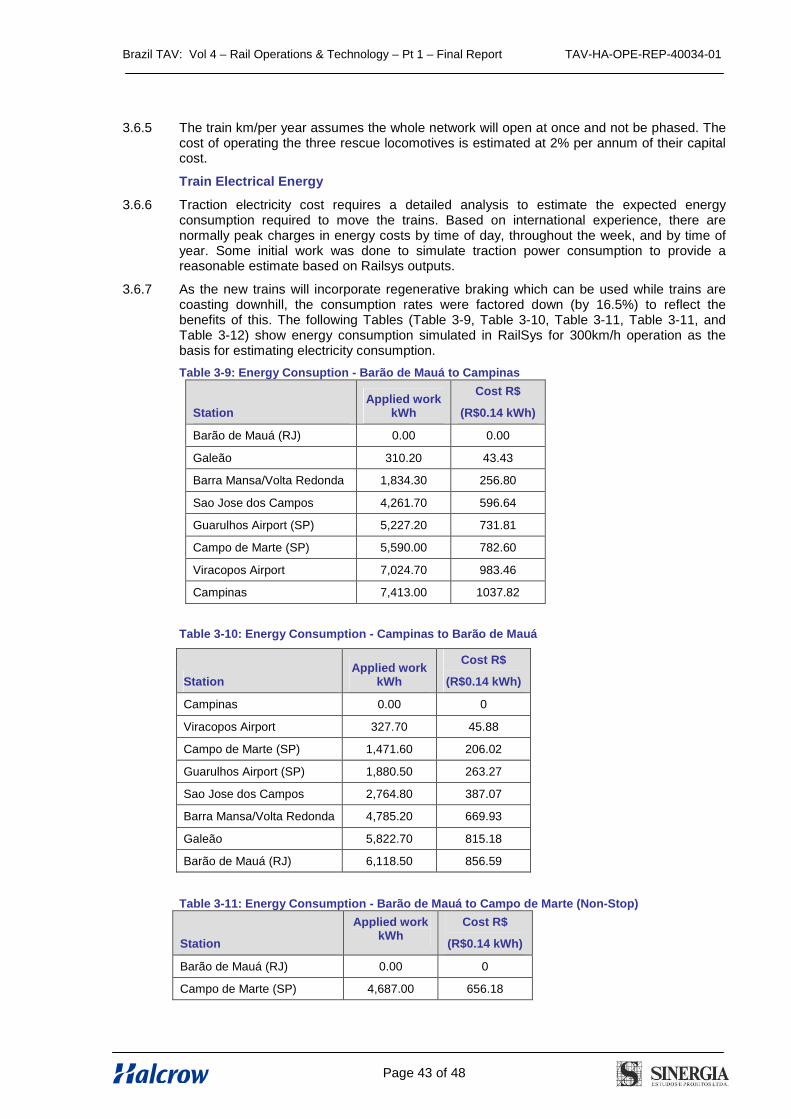
Brazil TAV: Vol 4 – Rail Operations & Technology – Pt 1 – Final Report TAV-HA-OPE-REP-40034-01
Page 43 of 48
3.6.5 The train km/per year assumes the whole network will open at once and not be phased. Thecost of operating the three rescue locomotives is estimated at 2% per annum of their capitalcost.
Train Electrical Energy
3.6.6 Traction electricity cost requires a detailed analysis to estimate the expected energyconsumption required to move the trains. Based on international experience, there arenormally peak charges in energy costs by time of day, throughout the week, and by time ofyear. Some initial work was done to simulate traction power consumption to provide areasonable estimate based on Railsys outputs.
3.6.7 As the new trains will incorporate regenerative braking which can be used while trains arecoasting downhill, the consumption rates were factored down (by 16.5%) to reflect thebenefits of this. The following Tables (Table 3-9, Table 3-10, Table 3-11, Table 3-11, andTable 3-12) show energy consumption simulated in RailSys for 300km/h operation as thebasis for estimating electricity consumption.
Table 3-9: Energy Consuption - Barão de Mauá to Campinas
StationApplied work
kWh
Cost R$
(R$0.14 kWh)
Barão de Mauá (RJ) 0.00 0.00
Galeão 310.20 43.43
Barra Mansa/Volta Redonda 1,834.30 256.80
Sao Jose dos Campos 4,261.70 596.64
Guarulhos Airport (SP) 5,227.20 731.81
Campo de Marte (SP) 5,590.00 782.60
Viracopos Airport 7,024.70 983.46
Campinas 7,413.00 1037.82
Table 3-10: Energy Consumption - Campinas to Barão de Mauá
Table 3-11: Energy Consumption - Barão de Mauá to Campo de Marte (Non-Stop)
Station
Applied workkWh
Cost R$
(R$0.14 kWh)
Barão de Mauá (RJ) 0.00 0
Campo de Marte (SP) 4,687.00 656.18
StationApplied work
kWh
Cost R$
(R$0.14 kWh)
Campinas 0.00 0
Viracopos Airport 327.70 45.88
Campo de Marte (SP) 1,471.60 206.02
Guarulhos Airport (SP) 1,880.50 263.27
Sao Jose dos Campos 2,764.80 387.07
Barra Mansa/Volta Redonda 4,785.20 669.93
Galeão 5,822.70 815.18
Barão de Mauá (RJ) 6,118.50 856.59
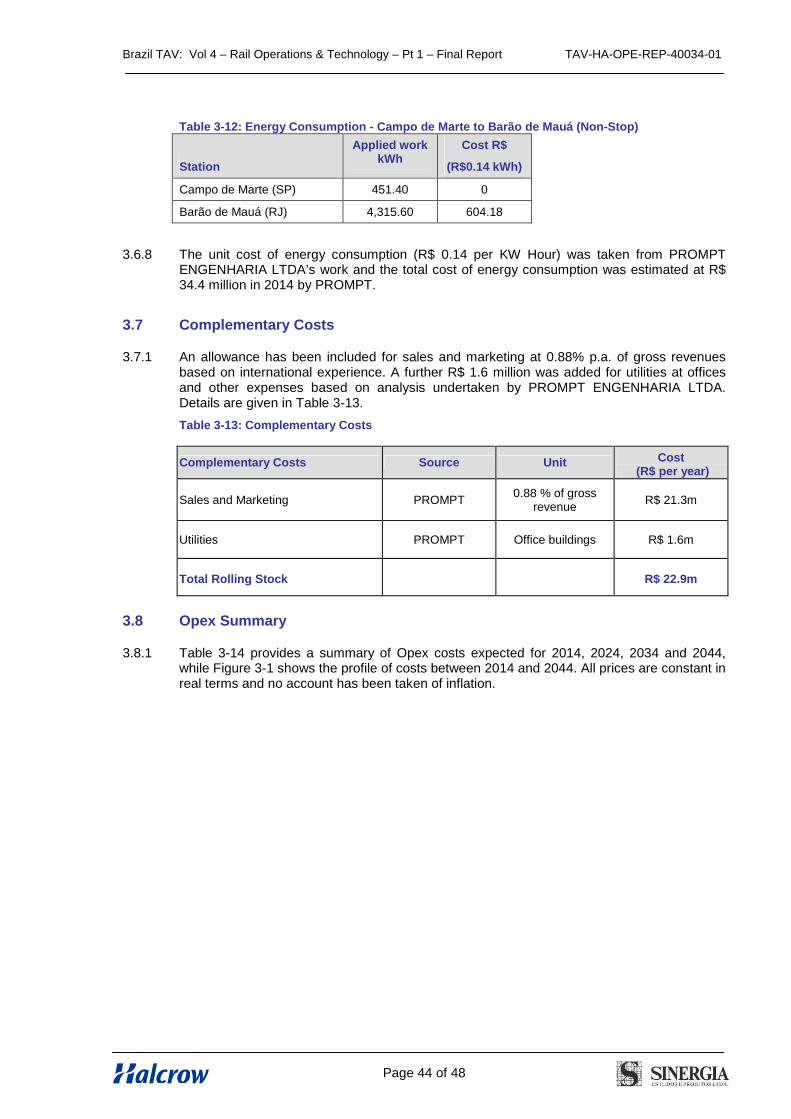
Brazil TAV: Vol 4 – Rail Operations & Technology – Pt 1 – Final Report TAV-HA-OPE-REP-40034-01
Page 44 of 48
Table 3-12: Energy Consumption - Campo de Marte to Barão de Mauá (Non-Stop)
Station
Applied workkWh
Cost R$
(R$0.14 kWh)
Campo de Marte (SP) 451.40 0
Barão de Mauá (RJ) 4,315.60 604.18
3.6.8 The unit cost of energy consumption (R$ 0.14 per KW Hour) was taken from PROMPTENGENHARIA LTDA’s work and the total cost of energy consumption was estimated at R$34.4 million in 2014 by PROMPT.
3.7 Complementary Costs
3.7.1 An allowance has been included for sales and marketing at 0.88% p.a. of gross revenuesbased on international experience. A further R$ 1.6 million was added for utilities at officesand other expenses based on analysis undertaken by PROMPT ENGENHARIA LTDA.Details are given in Table 3-13.
Table 3-13: Complementary Costs
Complementary Costs Source Unit Cost(R$ per year)
Sales and Marketing PROMPT0.88 % of gross
revenueR$ 21.3m
Utilities PROMPT Office buildings R$ 1.6m
Total Rolling Stock R$ 22.9m
3.8 Opex Summary
3.8.1 Table 3-14 provides a summary of Opex costs expected for 2014, 2024, 2034 and 2044,while Figure 3-1 shows the profile of costs between 2014 and 2044. All prices are constant inreal terms and no account has been taken of inflation.
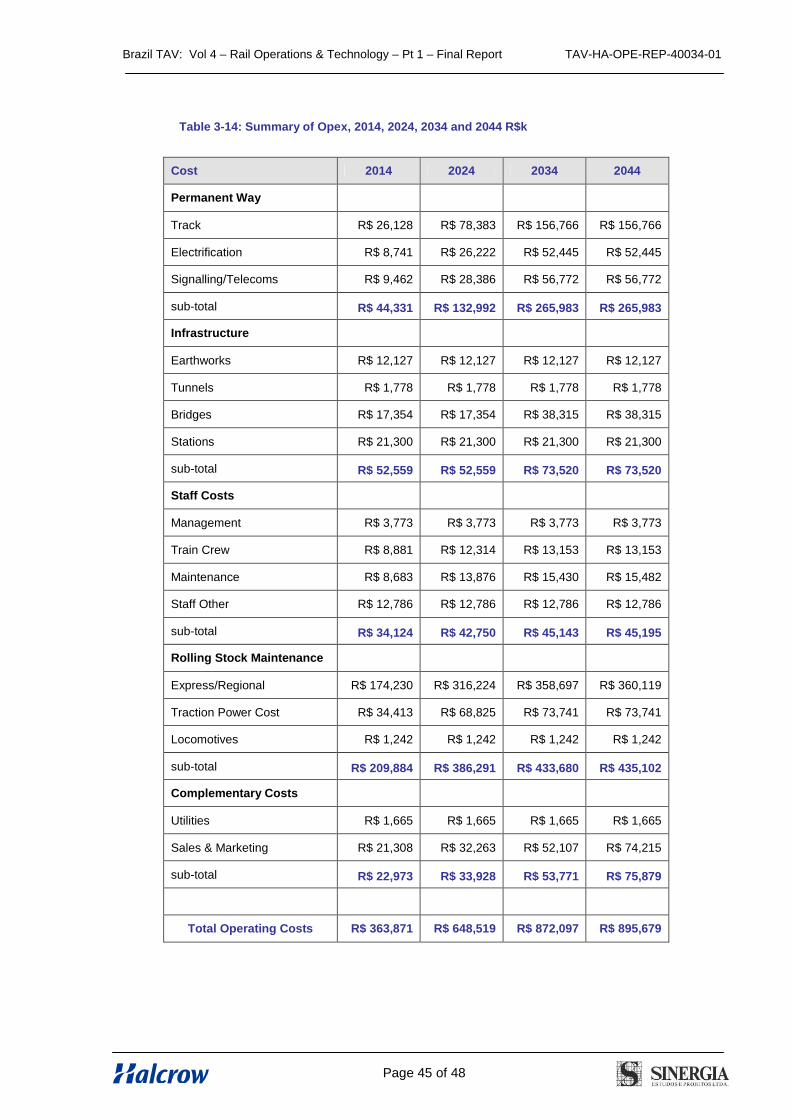
Brazil TAV: Vol 4 – Rail Operations & Technology – Pt 1 – Final Report TAV-HA-OPE-REP-40034-01
Page 45 of 48
Table 3-14: Summary of Opex, 2014, 2024, 2034 and 2044 R$k
Cost 2014 2024 2034 2044
Permanent Way
Track R$ 26,128 R$ 78,383 R$ 156,766 R$ 156,766
Electrification R$ 8,741 R$ 26,222 R$ 52,445 R$ 52,445
Signalling/Telecoms R$ 9,462 R$ 28,386 R$ 56,772 R$ 56,772
sub-total R$ 44,331 R$ 132,992 R$ 265,983 R$ 265,983
Infrastructure
Earthworks R$ 12,127 R$ 12,127 R$ 12,127 R$ 12,127
Tunnels R$ 1,778 R$ 1,778 R$ 1,778 R$ 1,778
Bridges R$ 17,354 R$ 17,354 R$ 38,315 R$ 38,315
Stations R$ 21,300 R$ 21,300 R$ 21,300 R$ 21,300
sub-total R$ 52,559 R$ 52,559 R$ 73,520 R$ 73,520
Staff Costs
Management R$ 3,773 R$ 3,773 R$ 3,773 R$ 3,773
Train Crew R$ 8,881 R$ 12,314 R$ 13,153 R$ 13,153
Maintenance R$ 8,683 R$ 13,876 R$ 15,430 R$ 15,482
Staff Other R$ 12,786 R$ 12,786 R$ 12,786 R$ 12,786
sub-total R$ 34,124 R$ 42,750 R$ 45,143 R$ 45,195
Rolling Stock Maintenance
Express/Regional R$ 174,230 R$ 316,224 R$ 358,697 R$ 360,119
Traction Power Cost R$ 34,413 R$ 68,825 R$ 73,741 R$ 73,741
Locomotives R$ 1,242 R$ 1,242 R$ 1,242 R$ 1,242
sub-total R$ 209,884 R$ 386,291 R$ 433,680 R$ 435,102
Complementary Costs
Utilities R$ 1,665 R$ 1,665 R$ 1,665 R$ 1,665
Sales & Marketing R$ 21,308 R$ 32,263 R$ 52,107 R$ 74,215
sub-total R$ 22,973 R$ 33,928 R$ 53,771 R$ 75,879
Total Operating Costs R$ 363,871 R$ 648,519 R$ 872,097 R$ 895,679
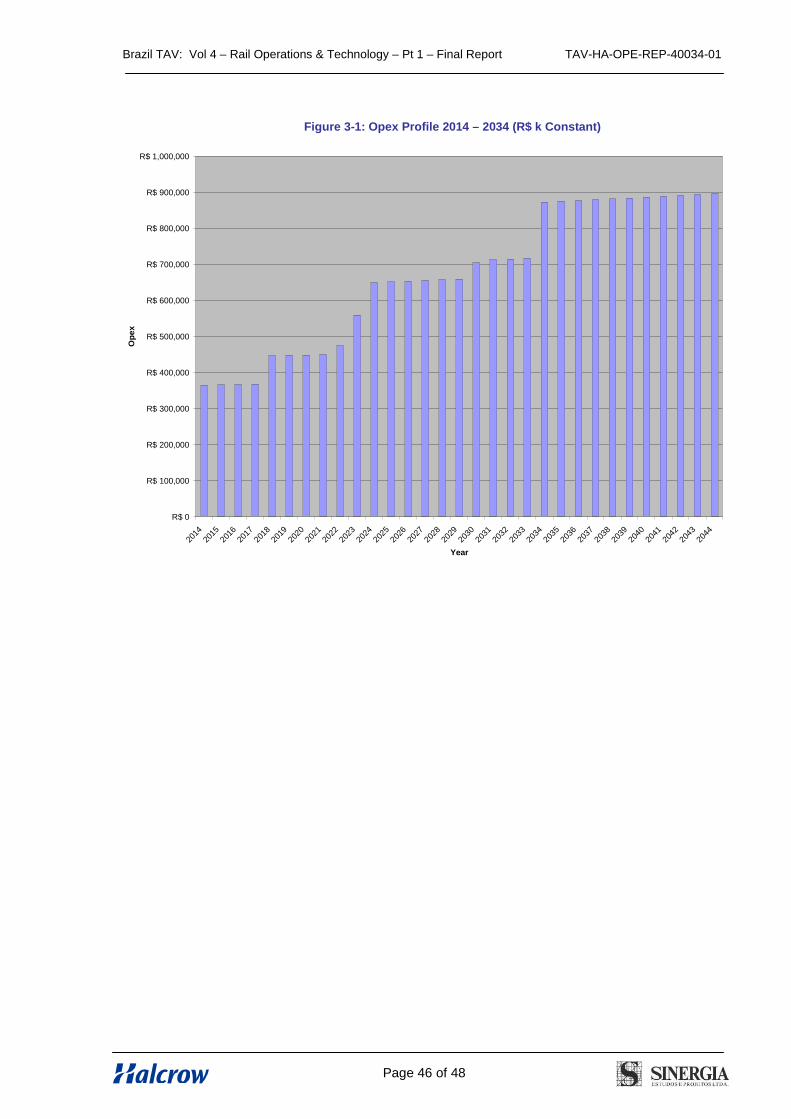
Brazil TAV: Vol 4 – Rail Operations & Technology – Pt 1 – Final Report TAV-HA-OPE-REP-40034-01
Page 46 of 48
Figure 3-1: Opex Profile 2014 – 2034 (R$ k Constant)
R$ 0
R$ 100,000
R$ 200,000
R$ 300,000
R$ 400,000
R$ 500,000
R$ 600,000
R$ 700,000
R$ 800,000
R$ 900,000
R$ 1,000,000
2014
2015
2016
2017
2018
2019
2020
2021
2022
2023
2024
2025
2026
2027
2028
2029
2030
2031
2032
2033
2034
2035
2036
2037
2038
2039
2040
2041
2042
2043
2044
Year
Op
ex

Brazil TAV: Vol 4 – Rail Operations & Technology – Pt 1 – Final Report TAV-HA-OPE-REP-40034-01
Page 47 of 48
Appendix A: Guarulhos Airport Technical Note

Brazil TAV: Vol 4 – Rail Operations & Technology – Pt 1 – Final Report TAV-HA-OPE-REP-40034-01
Page 48 of 48
Appendix B: PROMPT Engenharia OPEX Analysis


![From: Frank Koppelman [fkoppel@comcast.net] … › ... › Email-correspondence-subset-Koppelman.pdfFrom: Sent: To: Subject: Frank, Roelof Van Ark [rvanark@hsr.ca.gov] Wednesday,](https://img.pdfslide.us/doc/110x75/5f0b88d07e708231d430fdbf/from-frank-koppelman-fkoppel-a-a-email-correspondence-subset-koppelmanpdf.jpg)