Embed Size (px)
Citation preview
SYNTHESIS OF TiO2-BASED NANOSTRUCTURED MATERIALS USING A SOL-GEL PROCESS IN SUPERCRITICAL CO2
(Spine Title: TiO2-based Nanomaterials in scCO2)
(Thesis format: Monograph)
by
Rahima A. Lucky
Graduate Program in Engineering Science, Department of Chemical and Biochemical Engineering
A thesis submitted in partial fulfilment of the requirements for the degree of
Doctor of Philosophy
School of Graduate and Postdoctoral Studies The University of Western Ontario
London, Ontario, Canada
© Rahima A. Lucky 2008

ii
THE UNIVERSITY OF WESTERN ONTARIO
SCHOOL OF GRADUATE AND POSTDOCTORAL STUDIES CERTIFICTE OF EXAMINATIONS
Supervisor ______________________________ Prof. Paul A Charpentier Supervisory Committee ______________________________ Prof. Hugo deLasa ______________________________ Prof. Amin Rizkalla
Examiners ______________________________ ______________________________ ______________________________ ______________________________
The thesis by
Rahima A. Lucky
Entitled:
Synthesis of TiO2-based nanostructured materials using a sol-gel process in supercritical CO2
is accepted in partial fulfillment of the
requirements for the degree of
Doctor of Philosophy
Date____________________________ _______________________________ Chair of Thesis Examination Board
iii
ABSTRACT
One-dimensional nanostructures (e.g. nanotubes, nanowires, nanobelts) of titania (TiO2)
are receiving considerable attention due to their unique physical properties, high activity,
strong oxidation capability, chemical stability and numerous potential applications in
solar energy systems. These nanostructured materials bear tremendous promise in the
effective utilization of solar energy based on photovoltaic and water-splitting devices.
However, the available preparation techniques have limitations. In this respect, a sol-gel
process using supercritical carbon dioxide (scCO2) as solvent offers a viable alternative to
obtain these nanostructured materials, due to the unique enabling properties of scCO2.
This research has focused on the synthesis and modification of TiO2
nanomaterials via an acid modified sol-gel process in scCO2. In this regard, the doping
agents used were Fe, Zr, and N. Because of its zero surface tension, scCO2 helps to form
and maintain nanostructures and high surface areas of the synthesized nanomaterials. The
low dielectric constant results in lower solubility with LA-LB interactions helping to
stabilize the hydrolysis products, resulting in new and desirable morphologies. The
synthesis was carried out in a batch reactor, i.e. in a view cell equipped with sapphire
windows, for observation of the phase changes. The synthesis process was also studied
using in situ FTIR spectrometry with the resulting nanomaterials being characterized
using electron microscopy, N2 physisorption, FTIR, XRD, XPS, thermal analysis, TPD
and UV-Vis analysis. A kinetic model for the phase changes involved during heat
treatment of the synthesized nanomaterials was developed, and the performance of the
iv
synthesized nanomaterials was evaluated as a photocatalyst to degrade methylene blue in
aqueous solution under UV light.
The results showed that the type of dopant significantly altered the morphology as
well as the surface properties of the hybrid nanomaterials. For instance, while being
synthesized under similar experimental conditions in scCO2 pure TiO2 formed nanofibers
of 20-50 nm dia, Zr doped TiO2 samples formed sheets with 100-300 nm width and
nanotubes with a diameter of 50–140 nm, depending on the initial concentration of
precursor(s). However, Fe doped samples showed a flake type flat structure while
zirconia modified N doped TiO2 samples showed a sheet type structure. Crystalline
structures were obtained when the prepared materials were calcined at 500 °C. Anatase
TiO2 nanocrystallites with a size range ca. 6-14 nm were obtained depending on the
amount and type of doping. The resulting materials exhibited a mesoporous structure and
a higher surface area compared to pure TiO2 nanomaterials.
This work revealed that the direct sol-gel process in scCO2 is a promising
technique for synthesizing and modifying TiO2 nanomaterials. The formed modified TiO2
nanostructured materials had a higher surface area, smaller crystallite size, and greater
thermal stability, which are all desirable features for catalysts, support materials,
semiconductors, and electrodes in dye-sensitized solar cells (DSSC). The simple
synthesis procedure, which is scalable, used mild reaction conditions with a green
solvent, providing a high yield and high quality nanomaterials, making this route
potentially attractive for commercial employment.
Key Words: nanomaterials, TiO2, ZrO2 doped TiO2, N doped TiO2, Fe doped TiO2, aerogel, modified sol-gel process, green solvent, scCO2, photocatalyst, solar energy. solid state reaction kinetics, activation energy

v
To my parents---------- And my daughter-----

vi
ACKNOWLEDGEMENT
I would like to express my sincere thanks to my supervisor Professor Paul A.
Charpentier, for giving me the opportunity to work on such a fascinating project with all
necessary supports and continuous guidance throughout my study at Western.
Many thanks to Professor Hugo de Lasa and Professor Amin Rizkalla, members
of the Advisory committee, for their important guidance and suggestions.
I would like to express my gratitude to the following people for their help in
material characterization: Fred Pearson of the Brockhouse Institute for Materials
Research, McMaster University, Ron Smith of the Biology Department, Dr. Todd
Simpson and Nency Bell of the Western Nanotech Laboratory, Alexgander aubin, Mary
Jane, Mark beisinger of UWO. Special thanks as well to Joanna and Kathy, the
administrative staff of the Department of Chemical and Biochemical Engineering for
their continuous help.
I would like to gratefully acknowledge the financial support of the Natural
Science and Engineering Research Council of Canada (NSERC), the Materials and
Manufacturing Ontario Emerging Materials program (MMO-EMK), and the Canadian
Foundation for Innovation (CFI).
I am also very grateful to fellow colleagues and friends for their continuous
support, and advices.
Finally, I like to thanks my parents for their endless love and unconditional moral
support. I also like to thank my little princess, Sarah for her sacrifices and love.

vii
TABLE OF CONTENTS Page
ABSTRACT ....................................................................................................................... iii
ACKNOWLEDGEMENT ................................................................................................. vi
LIST OF FIGURES .......................................................................................................... xii
LIST OF TABLES ............................................................................................................ xx
NOMENCLATURE ....................................................................................................... xxii
CHAPTER 1 ....................................................................................................................... 1
1. Background ................................................................................................................. 1
1.1. Energy and the Environment ...................................................................................1
1.2. Solar Energy.............................................................................................................2
1.2.1. Heating .........................................................................................................3
1.2.2 Electricity .....................................................................................................4
1.2.3 Chemical Processes ......................................................................................4
1.3. TiO2 and Solar Energy .............................................................................................5
CHAPTER 2 ....................................................................................................................... 8
2. Introduction ................................................................................................................. 8
2.1. TiO2 Nanostructured Materials ................................................................................9
2.1.1. Photocatalytic Applications .......................................................................10
2.1.2. Photovoltaic Applications ..........................................................................13
2.1.3. Other Potential Applications ......................................................................15
2.2. Modifications of TiO2 Nanomaterials ....................................................................15
2.2.1. Bulk Modification of TiO2 Nanomaterials ................................................17
2.2.2. Electronic Properties and Optical Response of TiO2 .................................19
2.3. Synthesis Methods .................................................................................................24
2.3.1. Conventional Sol-gel Method ....................................................................24
2.3.2. Sol Method .................................................................................................28
2.3.3. Hydrothermal Method ................................................................................28
2.3.4. Solvothermal Method.................................................................................30
2.3.5. Chemical Vapor Deposition (CVD)...........................................................30
2.3.6. Thermal Decomposition and Pulsed Laser Ablation .................................31
2.3.7. Templating .................................................................................................31

viii
2.3.8. N Doped TiO2 Nanomaterials ....................................................................32
2.4. Supercritical Fluids (SCFs) and supercritical CO2 (scCO2) ..................................33
2.5. Properties of supercritical CO2 ..............................................................................37
2.6. TiO2 Based Nanostructured Materials in scCO2 ....................................................42
2.7. Scope of the Research ............................................................................................49
CHAPTER 3 ..................................................................................................................... 51
3. Introduction ............................................................................................................... 51
3.1. Synthesis of TiO2 Based Nanomaterials ................................................................52
3.1.1. Materials ....................................................................................................52
3.1.2. Experimental Set-Up ..................................................................................53
3.1.3. Experimental Procedure .............................................................................54
3.2. Characterization Methods ......................................................................................56
3.2.1. Electron Microscopy ..................................................................................56
3.2.2. Thermal Analysis .......................................................................................59
3.2.3. X-ray Photon Spectroscopy (XPS) ............................................................61
3.2.4. Powder X-Ray Diffraction (XRD) .............................................................63
3.2.5. Raman Spectroscopy ..................................................................................65
3.2.6. N2 Physisorption ........................................................................................66
3.2.7. UV-Vis Spectroscopy ................................................................................71
3.2.8. In-situ ATR-FTIR Analysis .......................................................................73
3.2.9. Temperature Programmed Desorption (TPD) ...........................................74
3.2.10. Evaluation Procedure .................................................................................75
CHAPTER 4 ..................................................................................................................... 77
4. Introduction ............................................................................................................... 77
4.1. Experimental ..........................................................................................................79
4.2. Effects of Pressure .................................................................................................80
4.3. Effects of Temperature ..........................................................................................83
4.4. Effects of Concentration ........................................................................................90
4.5. Effects of Acid to Metal Alkoxide Ratio ...............................................................94
4.6. Effects of Zr compositions .....................................................................................98
4.6.1. Morphology................................................................................................99

ix
4.6.2. Composition .............................................................................................102
4.6.3. Thermal Decomposition Behavior ...........................................................106
4.6.4. Phase Structure and Crystallite Size ........................................................108
4.6.5. Surface Area and Pore Volume ................................................................110
4.7. Mechanism of Binary Nanotube Formation ........................................................113
4.8. Reaction Scheme in scCO2 ..................................................................................115
4.9. Conclusions ..........................................................................................................118
CHAPTER 5 ................................................................................................................... 120
5. Introduction ............................................................................................................. 120
5.1. Experimental ........................................................................................................122
5.2. Morphology..........................................................................................................122
5.3. Composition .........................................................................................................125
5.4. Crystallinity and Phase Structure .........................................................................128
5.5. Surface area and Pore Volume .............................................................................130
5.6. Gelation Time ......................................................................................................134
5.7. Discussion ............................................................................................................136
5.8. Conclusions ..........................................................................................................140
CHAPTER 6 ................................................................................................................... 141
6. Introduction ............................................................................................................. 141
6.1. Solid-State Reaction Kinetics ..............................................................................142
6.1.1. Decomposition .........................................................................................142
6.1.2. Phase Transformation ..............................................................................145
6.2. Experimental ........................................................................................................146
6.2.1. SEM/TEM ................................................................................................146
6.2.2. Decomposition Behavior (TGA/FTIR) ....................................................148
6.2.3. XRD and HRTEM ...................................................................................151
6.2.4. Raman ......................................................................................................156
6.2.5. BET Analysis ...........................................................................................157
6.3. Solid State Reaction Kinetics ...............................................................................160
6.4. Conclusions ..........................................................................................................165
CHAPTER 7 ................................................................................................................... 166
x
7. Introduction ............................................................................................................. 166
7.1. Experimental ........................................................................................................168
7.2. Morphology..........................................................................................................169
7.3. Thermal Analysis .................................................................................................174
7.4. Phase Structure .....................................................................................................177
7.5. Surface Area and Pore Volume ............................................................................181
7.6. Surface Acidity ....................................................................................................183
7.7. Photo Response ....................................................................................................184
7.8. Photocatalytic Performance .................................................................................185
7.9. Conclusions ..........................................................................................................187
CHAPTER 8 ................................................................................................................... 188
8. Introduction ............................................................................................................. 188
8.1. Experimental ........................................................................................................189
8.2. SEM .....................................................................................................................191
8.3. Thermal Analysis .................................................................................................193
8.4. XRD Analysis ......................................................................................................195
8.5. Raman ..................................................................................................................196
8.6. HRTEM Analysis.................................................................................................197
8.7. XPS Analysis .......................................................................................................199
8.8. BET Analysis .......................................................................................................202
8.9. Photocatalytic Performance .................................................................................204
8.10. Conclusions ......................................................................................................206
CHAPTER 9 ................................................................................................................... 207
9. Introduction ............................................................................................................. 207
9.1. Direct Sol-Gel Process in scCO2..........................................................................207
9.2. The Synthesis Parameters of the Direct Sol-Gel Process in CO2 ........................208
9.3. Mechanism of Nanostructure Formation .............................................................209
9.4. Chemistry of the Direct Sol-gel Process in CO2 ..................................................209
9.5. Performance of TiO2-based Nanostructured Materials ........................................210
9.6. Recommendations ................................................................................................210
References ....................................................................................................................... 212
xi
Appendices ...................................................................................................................... 228
Appendix 1. Copyright Permissions of Advanced Materials ...........................................228
Appendix 2. Copyright Permissions of Acta Crystallographica Journals........................228
Appendix 3. Physical Properties of the Raw Materials Used in this dissertation. ...........229
Appendix 4. Powder XRD Analysis Conditions..............................................................229
Appendix 5. Typical EDX spectrum for binary Zr-Ti nanomaterials ..............................230
Appendix 6. Typical DSC curves for binary Zr-Ti nanomaterials at different heating rate.230
Appendix 7. Typical XPS deconvoluted spectra for N doped TiO2 nanomaterials. ........232
Appendix 8. Evaluation of the modified nanomaterials as a photocatalyst. ....................232
Appendix 9. ZrO2/TiO2 Binary Nantubes as Fillers .......................................................237
CURRICULAM VITA ................................................................................................... 240
xii
LIST OF FIGURES
Figure 1.1: Mechanism of semiconductor photocatalysis.15 ................................................5
Figure 2.1:The principle of TiO2 photocatalysis.37 ............................................................11
Figure 2.2: Principle of operation and energy level scheme of the dye-
sensitized nanocrystalline TiO2 solar cell.40 ...................................................14
Figure 2.3: The bonding diagram of a perfect TiO2 crystal.87 ...........................................21
Figure 2.4: Hydrolysis and condensation steps for sol-gel mechanism. ............................25
Figure 2.5: Aerogel synthesis scheme by the conventional sol-gel route. .........................27
Figure 2.6: Schematic of the phase diagram of a typical material.123 ................................34
Figure 2.7: Reduced pressure (Pr) vs. reduced density (ρr) diagrams at various
reduced temperatures (Tr).135 ...........................................................................38
Figure 2.8: Solubility parameters of CO2.136 .....................................................................39
Figure 2.9: Diffusivity of CO2 vs temperature at various pressures.137 .............................40
Figure 2.10: Surface tension of saturation liquid CO2 as a function of
pressure.123 .......................................................................................................41
Figure 2.11: Binding modes of acetic acid with metal: (a) chelating bidentate
and (b) bridging bidentate and (c) monodentate. .............................................47
Figure 2.12: Schematic diagram of the direct sol-gel process in scCO2 for the
synthesis of nanostructured materials. .............................................................48
Figure 3.1: Schematic diagram of experimental set-up; A-CO2 tank, B-
Syringe pump, C- View cell, D- Temperature controller, E-
Pressure indicator. ............................................................................................53
Figure 3.2: Preparation scheme for TiO2 based nanomaterials by sol-gel
process..............................................................................................................55
Figure 3.3: Schematic interactions of a specimen with incident electrons ........................57
Figure 3.4: A schematic DSC curve demonstrating the appearance of phase
transition.157 .....................................................................................................61
Figure 3.5: A typical high resolution XPS spectrum with corresponding
information. ......................................................................................................63
Figure 3.6: Schematic of X-ray reflection on the crystal planes.158 ...................................64
Figure 3.7: BET plot of N2 adsorption on silica gel at 91 K.123 .........................................67
xiii
Figure 3.8: Curves of x/xm vs. p/p0 calculated from the BET equation for
different values of c. I, c=1; II, c=11; III, c=100; IV, c=10000.160 ................68
Figure 3.9: Classification of hysteresis loops as recommended by the IUPAC. ...............70
Figure 3.10: Interaction of light with solid sample. ...........................................................72
Figure 3.11: Schematic of the reactor with the ATR-FTIR (A) computer; (B)
FTIR; (C) temperature and RPM controller with pressure display;
(D) 100 ml autoclave equipped with diamond IR probe; (E) needle
valves; (F) check valves; (G) syringe pump; (H) container for
carboxylic acid; (I) CO2 cylinder.123 ................................................................74
Figure 4.1: SEM images for materials synthesized at (a) 3000 (b) 5000 and (c)
6000 psig pressures. (Bar represents 200 nm). ................................................81
Figure 4.2: N2 adsorption/desorption isotherms of as-prepared ZrO2-TiO2
nanomaterials synthesized at different pressures. ............................................82
Figure 4.3: BJH pore size distribution of as-prepared ZrO2-TiO2 nanomaterials
synthesized at different pressures. ...................................................................83
Figure 4.4: SEM images for materials synthesized at: (a) 40 oC and (b) 80 oC
temperature. (Arrows indicate sheet type structure in materials
synthesized at 40 oC). .......................................................................................84
Figure 4.5: Effects of temperature on the morphology of ZrO2-TiO2
nanomaterials, TEM images of calcined materials (a) & (c)
synthesized at 40 oC, and (b) & (d) synthesized at 80 oC
temperature. (Bar represents 100 nm). ............................................................85
Figure 4.6: N2 adsorption/desorption isotherms of the ZrO2-TiO2 as-prepared
nanomaterials synthesized at different temperatures. ......................................86
Figure 4.7: BJH pore size distribution of the ZrO2-TiO2 as-prepared
nanomaterials synthesized at different temperatures. ......................................87
Figure 4.8: The gelation time as a function of reciprocal of absolute process
temperature. .....................................................................................................89
Figure 4.9: Effects of concentration on the morphology of ZrO2-TiO2
nanomaterials synthesized using (a) C-0.35 mol/L, (b) C-0.7 mol/L
and (c) C-1.4 mol/L. (Bar represents 1µm). ....................................................91

xiv
Figure 4.10: N2 adsorption/desorption isotherms of the ZrO2-TiO2 as-prepared
nanomaterials synthesized using different alkoxide concentrations. ...............92
Figure 4.11: BJH pore size distribution of as-prepared ZrO2-TiO2
nanomaterials synthesized using different precursor concentrations. ..............93
Figure 4.12: Effects of acid to metal alkoxide ratio on the morphology of
ZrO2-TiO2 nanomaterials synthesized using (a) R-3, (b) R-4 and
(c) R-6. (Bar represent 500 nm). .....................................................................94
Figure 4.13: N2 adsorption/desorption isotherms of as-prepared ZrO2-TiO2
nanomaterials synthesized using different acid to metal alkoxide
ratios. ................................................................................................................96
Figure 4.14: BJH pore size distribution of as-prepared ZrO2-TiO2
nanomaterials synthesized using different acid to metal alkoxide
ratios. ................................................................................................................96
Figure 4.15: Zr-Ti binary calcined nanomaterials with different zirconium
compositions (a) undoped TiO2, (b) 4%, (c) 8%, and (d) 10%. (Bar
represents 200 nm. All the samples were examined after platinum
coating. Arrows indicate tubes). ....................................................................100
Figure 4.16. TEM image of 4% Zr-Ti binary TiO2 nanomaterials. (Bar
represents 100 nm). ........................................................................................101
Figure 4.17: TEM: Zr-Ti binary nanomaterials with different zirconium
composition (a) undoped TiO2, (b) 4% Zr doped TiO2. (Bar
represents 100 nm). ........................................................................................101
Figure 4.18: Powder ATR-FTIR spectra of as-prepared ZrO2-TiO2 binary
nanomaterials (a) pure TiO2, (b) 10% ZrO2, and (c) Zr-Ti binary
single crystal. .................................................................................................103
Figure 4.19: A typical Ti, Zr EDX mapping for as-prepared Zr-TiO2 sample.
(Bar represents 20 μm). .................................................................................104
Figure 4.20: XPS spectrum for typical ZrO2 modified TiO2 nanotubes. .........................105
Figure 4.21: Weight loss of Zr-Ti binary metal oxide nanomaterials as a
function of temperature. .................................................................................107
xv
Figure 4.22: XRD patterns for Zr-Ti binary metal oxide nanomaterials with
various % ZrO2 compositions. .......................................................................109
Figure 4.23: N2 adsorption/desorption isotherms of the Zr-Ti binary metal
oxide nanomaterials with different % ZrO2 compositions. ............................111
Figure 4.24: BJH pore size distribution of Zr-Ti binary metal oxide
nanomaterials at different % ZrO2 compositions. ..........................................111
Figure 4.25: Pore volume of as prepared and calcined binary nanomaterials
with various % ZrO2 compositions. ...............................................................112
Figure 4.26: Surface area of as-prepared and calcined Zr-Ti binary metal
oxide nanomaterials as a function of zirconium compositions. .....................113
Figure 4.27: Acid modifided Zr-Ti alkoxide single crystal (a) one unit,(b) cell
along [100] plane, and (c) ZrO2-TiO2 nanotube formed via roll up
of sheet. (Color code for a,b: Pink-Titanium, Green-Zirconium,
Red-oxygen, Gray- Carbon)...........................................................................115
Figure 4.28: In situ FTIR spectra for 1:1 mol ratio TIP and ZPO with acetic
acid at R 5 (acid to metal alkoxide ratio) in scCO2 from 0-1200
minutes. ..........................................................................................................116
Figure 5.1: SEM: ZrO2-TiO2 nanomaterials in different solvents: (a) scCO2,
(b) Hexane, (c) Xylenes, (d) Iso-propanol, and (e) Ethanol. (Bar
represents 200 nm. All the samples were examined after platinum
coating). .........................................................................................................123
Figure 5.2: TEM: ZrO2-TiO2 nanomaterials in different solvents (a) scCO2, (b)
Hexane, (c) Xylenes, (d) Iso-propanol, and (e) Ethanol. (Bar
represents 300 nm. All samples were calcined at 500°C). ............................124
Figure 5.3: Powder ATR-FTIR spectra of as-prepared ZrO2-TiO2
nanomaterials in different solvents: (a) Hexane, (b) scCO2 (c)
Xylenes, and (d) Iso-propanol. .......................................................................126
Figure 5.4: A typical TG/DTG curve for ZrO2-TiO2 nanomaterials synthesized
in hexane. .......................................................................................................127
xvi
Figure 5.5. Powder XRD spectra of the ZrO2-TiO2 nanomaterials calcined at
500 οC synthesized in different solvents (a) scCO2, (b) Hexane, (c)
Xylenes, (d) Iso-propanol, and (e) Ethanol. ...................................................129
Figure 5.6: N2 adsorption/desorption isotherms of as-prepared ZrO2-TiO2
nanomaterials synthesized in different solvents. ...........................................131
Figure 5.7: BJH pore size distribution of calcined ZrO2-TiO2 nanomaterials,
synthesized in different solvents. ...................................................................131
Figure 5.8: Surface area of as-prepared and calcined nanomaterials
synthesized in different solvents as a function of solvent’s
dielectric constant (ε). ....................................................................................133
Figure 5.9: Gelation time of nanomaterials synthesized in different solvents as
a function of solvent’s dielectric constant (ε). ...............................................135
Figure 6.1: SEM: Zr-TiO2 nanotubes calcined at (a) as-prepared, (b) 600, (c)
800 and (d) 1000 oC. (Bar represenst 200 nm. All the samples were
examined after platinum coating.) .................................................................147
Figure 6.2: TEM: ZrO2-TiO2 nanotubes calcined at (a) as-prepared,(b) 500, (c)
900 and (d) 1000 oC. ......................................................................................148
Figure 6.3: Weight loss of nanotubes as a function of temperature.................................149
Figure 6.4: Powder ATR-FTIR spectra of ZrO2-TiO2 nanotubes calcined at
different temperatures. ...................................................................................151
Figure 6.5: Powder XRD spectra of ZrO2-TiO2 nanotubes calcined at different
temperatures. (A-anatase, R-rutile). ...............................................................152
Figure 6.6: HRTEM: ZrO2-TiO2 nanotubes calcined at (a) as-prepared,(b) 500,
and (c) 1000 oC. (Bar represenst 10 nm.) ......................................................156
Figure 6.7: Raman spectra of ZrO2-TiO2 nanotubes calcined at: (a) 500, (b)
600, (c) 700, (d) 800, (e) 900, and (f) 1000 oC. (A-anatase, R-
rutile)..............................................................................................................157
Figure 6.8: N2 adsorption/desorption isotherms of ZrO2-TiO2 nanotubes
calcined at different temperatures. .................................................................158
Figure 6.9: BJH pore size distribution of the ZrO2-TiO2 nanotubes calcined at
different temperatures. ...................................................................................159
xvii
Figure 6.10: Surface area and pore volume of ZrO2-TiO2 nanotubes as a
function of calcination temperature. ..............................................................160
Figure 6.11. Conversion-temperature profiles for different steps of thermal
decomposition durning heat treatment. [■-Experimental data for
step I, ▲- Experimental data for step II, solid line for model
predicated value]. ..........................................................................................162
Figure 6.12. Plot of ln(β/Tp2) vs 1/Tp for anatase and rutile phases. ................................163
Figure 6.13: Ln of anatase and rutile crystallite size in nm as a function of
reciprocal of absolute temperature.(■-Anatase, ●/○rutile). ...........................164
Figure 7.1: SEM: Fe doped TiO2 nanomaterials: (a) S1-0% (b) S2-0.2%, (c)
S3-0.36%, and (d) S4-0.49%. (Fe in at. %. All the samples were
examined after platinum coating). .................................................................169
Figure 7.2: TEM: Fe doped TiO2 nanomaterials: (a) S1-0%, & (b) S4-0.49%,
(c) S1, and (d) S4. (As-prepared (a) & (b), calcined (c)&(d), Bar
represent 100 nm.) .........................................................................................171
Figure 7.3: O, Ti and Fe mapping for Fe doped TiO2 (S4) nanomaterials. .....................174
Figure 7.4: Powder ATR-FTIR spectra of as-prepared (a) TiO2 & (b) Fe doped
TiO2 (S4) nanomaterials. ...............................................................................175
Figure 7.5: (a) TG and (b) DTG curves for Fe doped nanomaterials as a
function of temperature. .................................................................................176
Figure 7.6: Powder XRD spectra of Fe doped TiO2 nanomaterials: (a) S1-
TiO2, (b) S2, (c) S3, (a-c) calcined at 500οC (d-f) S4 calcined at
400- 600 οC, respectively. ..............................................................................178
Figure 7.7: Ln size of anatase crystallite in nm as a function of reciprocal of
absolute temperature. .....................................................................................180
Figure 7.8: HRTEM: (a) S1- TiO2, and (b) S4-Fe doped TiO2 nanomaterials
(calcined at 500oC (a) & (b). (Bar represent 10 nm. Arrows
indicate defects and pore). ............................................................................181
Figure 7.9: (a) N2 adsorption/desorption isotherms, and (b) BJH pore size
distribution of Fe doped TiO2 nanomaterial calcined at 500 oC. ...................182
xviii
Figure 7.10: BET surface area of Fe doped TiO2 nanomaterials calcined at
different temperatures. ...................................................................................183
Figure 7.11: The diffuse reflectance spectra of the Fe doped TiO2
nanomaterials calcined at 500 οC: S1-TiO2, S2-0.2%, S3-0.36%,
and S4-0.49% at. Fe. (a) Kubelka-Munk unit and (b) modified
Kubelka-Munk function, respectively. ..........................................................184
Figure 7.12: The calculated degradation rate of various Fe doped TiO2 by eq.
3.13.................................................................................................................186
Figure 8.1. Effect of 1:1 Triethyleamine/ TIP with Acetic acid at R5,
(A)TIP+HOAc formed yellow colour solution , (B) TIP+HOAc+
TEA formed brown solution, (C) TIP+HOAc+TEA+H2O formed
gel. ..................................................................................................................190
Figure 8.2: SEM: (a) TiO2, (b) TiO2-N1, (c) Zr-TiO2-N1, and (d) Zr-TiO2-N2.
(Bar represents 500 nm. All the samples were examined after
platinum coating). ..........................................................................................192
Figure 8.3: TEM: (a) TiO2, (b) TiO2-N1, (c) Zr-TiO2-N1, and (d) TiO2-N2.
(Bar represents 30 nm). .................................................................................193
Figure 8.4: TG/DTG curves for N-doped nanomaterials synthesized by sol-gel
process as a function of temperature. .............................................................194
Figure 8.5: Powder XRD spectra of the Zr modified N doped TiO2
nanomaterials calcined at 500οC: (a) TiO2, (b) TiO2-N1, (c) TiO2-
N2, (d) Zr-TiO2, (e) Zr-TiO2-N1, and (f) Zr-TiO2-N2. ..................................196
Figure 8.6: Raman spectra around 142 cm-1 for Zr modified N doped TiO2
nanomaterials calcined at 500 οC. ..................................................................197
Figure 8.7: HRTEM for N-doped TiO2 nanomaterials: (a) TiO2, (b) TiO2-N1,
(c) Zr-TiO2-N1, and (d) TiO2-N2. (Bar represent 5 nm. Arrows
indicate defects). ............................................................................................198
Figure 8.8: Typical XPS spectrum for Zr modified N doped TiO2 as-prepared
nanomaterials. ................................................................................................201
Figure 8.9: N2 adsorption/desorption isotherm of the Zr modified N doped
TiO2 calcined nanomaterials. Inset shows the pore size distribution. ............203

xix
Figure 8.10: A typical partially hydrolyzed metal oxo-polymer. ....................................204
Figure 8.11. The variation of the calculated degradation rate for Zr modified N
doped TiO2 nanomaterials. .............................................................................206

xx
LIST OF TABLES
Table 2.1: Critical properties for selected supercritical fluids.126 ......................................36
Table 2.2: Comparison of the properties of Gas, SCF and Liquid.135 ...............................40
Table 2.3. Carboxyl stretching frequencies and structures of carboxylate
complexes. .......................................................................................................48
Table 4.1: Solubility parameters of scCO2 under selected temperatures and
pressures. ..........................................................................................................80
Table 4.2. Synthesis conditions of Zr-TiO2 nanostructures in scCO2 and
characterization results. ....................................................................................81
Table 4.3: Surface area, pore volume and average pore diameter of as-
prepared nanomaterials synthesized at various concentrations. ......................91
Table 4.4: Surface area, pore volume and average pore diameter of as-
prepared nanomaterials synthesized with different acid to metal
alkoxide ratios. .................................................................................................95
Table 4.5: Results of Zr-Ti binary metal oxide nanostructures in scCO2 ..........................99
Table 4.6; Results of XPS analysis for selective Zr-Ti binary metal oxide
nanostructures in scCO2 .................................................................................106
Table 5.1: Physical properties and dielectric constant of the solvents used in
this study. .......................................................................................................121
Table 5.2: Composition and weight loss at different stages of thermal analysis. ............127
Table 5.3: Crystallinity, crystal structure and size of the nanomaterials
calcined at 500οC. ..........................................................................................130
Table 5.4: Surface area, pore volume and average pore diameter of as-
prepared and calcined nanomaterials synthesized in various
solvents. .........................................................................................................132
Table 5.5: Partial charge, δ, mol complexity and coordination number, n of
titanium and zirconium alkoxides.205 .............................................................137
Table 6.1: Avrami-Erofeev models 213 .............................................................................144
Table 6.2: The important rate equations used in kinetic analysis of solid-state
reactions .........................................................................................................145
xxi
Table 6.3: Crystal size and crystal structure at different calcination
temperatures. ..................................................................................................153
Table 6.4: The calculated kinetic parameters for the decomposition of binary
nanotubes during heat treatment. ...................................................................162
Table 6.5: The calculated activation energy for the phase change of binary
nanotubes during heat treatment. ...................................................................164
Table 7.1: Crystallites size and surface area of undoped and doped
nanomaterials calcined at different temperatures. .........................................173
Table 8.1: Surface area, pore volume, pore diameter, and crystallites size for
calcined undoped and doped nanomaterials. .................................................195
Table 8.2: Surface N composition of as-prepared and calcined nanomaterials
with N peak positions.....................................................................................202
Table 8.3: Charge distribution according to the partial charge model. ............................204
xxii
NOMENCLATURE
Abbreviations:
Abs absorbance
ATR-FTIR attenuated total reflection fourier transform infrared spectroscopy
BET brunauer-emmett-teller
CB conduction band
DSC differential scanning calorimetry
DSSC dye sensitized solar cell
1D one dimensional
FTIR fourier transform infrared spectroscopy
HOAc acetic acid
SCF supercritical fluid
scCO2 supercritical CO2
SEM scanning electron microscopy
PV photovoltaic
TCD thermal conductivity detector
TiO2 titania
TEM transmission electron microscopy
TGA thermogravimetric analysis
TIP titanium(IV) iso-propoxide
TPD temperature programmed desorption
UV ultraviolet

xxiii
VB valence band
VOCs volatile organic compounds
XPS x-ray photon spectroscopy
XRD x-ray diffraction
ZPO zirconium(IV) propoxide
Symbols:
IR integrated intensity of rutile
IA integrated intensity of anatase
C concentration
Dpore adsorption average pore diameter
Dcrys crystallite size
Ea activation energy
k reaction rate constant
l path length
Pc critical pressure
Pre reaction pressure
R universal gas constant
R acid to metal alkoxide ratio
Tc critical temperature
Tre reaction temperature
V molar volume
Vpore pore volume per gram

xxiv
XRutile weight fraction of rutile
α absorbtivity
β half-width at half-height of the diffraction peak
∆ symmetric and asymmetric stretching vibration frequency difference
scδ solubility parameter of supercritical fluid
ΔHV enthalpy change during vaporization
θ half the angle of diffraction
λ x-ray wavelength
scRρ reduced density of supercritical fluid
RLρ reduced density of liquid at its normal boiling point
CHAPTER 1
INTRODUCTION
1. Background
1.1. Energy and the Environment
The quality of human life, economic prosperity, and global stability largely
depends on a ready and reliable supply of energy. The global current rate of energy
consumption is approximately 4.1×10²⁰ J/yr, which is equivalent to 13 trillion watts. The
World Bank predicts that the demand for energy will double (to 30 trillion watts) by 2050
with an increase of the worlds population to 9 billion people accompanied by a rapid
technological development and economic growth.1 According to the U.S. Department of
Energy’s International Energy Outlook 2006 report, fossil fuels currently supply about
80% of the worldwide energy demand.2 The reserves of fossil fuels will run out during
this century and renewable energy sources will need to be harnessed to satisfy this
enormous energy demand. Moreover, environmental pollution is rising and threatens
climate change due to the rising levels of greenhouse gases and pollutants produced by
the combustion of fossil fuels, which has also increased public concern. Therefore,
finding and utilizing carbon neutral renewable energy sources to satisfy the world’s
growing energy demand and solve the pollution problem are society’s foremost
challenges for the coming years.3, 4 In this regard, solar energy is considered to be the
most promising and long lasting source in order to meet this growing energy demand
with minimal associated environmental pollution. The annual total energy coming to the
earth from the sun is approximately 3×1024 joules, which is about 104 times more than the
2
worlds current energy demand. Therefore, by utilizing solar energy, it is possible to
satisfy the enormous energy demand as well as to solve the environmental pollution
problem.
1.2. Solar Energy
The energy from the sun arrives on earth as radiation distributed across the
electromagnetic spectrum from infrared to ultraviolet wavelengths. The amount of solar
energy available at the Earth’s surface in the direction of the sun is typically 1000 W/m2.
In the 21st century, solar energy is certainly expected to make increasing contributions to
the world’s energy supply because it has the following advantages compared to
conventional energy:5
1. Solar energy is virtually free after the initial cost has been recovered.
Therefore, payback times can be very short when compared to the cost of
current carbon based energy sources.
2. Solar and other renewable energy systems can be stand-alone; thereby not
requiring connection to a power or natural gas grid.
3. The utilization of solar energy reduces environmental pollution.
There are many ways that solar energy can be used effectively. However, the
applications of solar energy can be grouped into three primary categories: (i) heating or
solar thermal, (ii) electricity production and (iii) chemical processes.

3
1.2.1. Heating
The most widely used applications of solar energy are for water and space
heating. Solar energy can be used to heat homes and commercial buildings and can also
be applied to industrial use in many different ways such as crop drying, outdoor and
indoor pools, preheating boiler feed water etc. In active solar-heating systems, solar
collectors are the key component which gather the sun's energy, transform it into heat,
and then transfer the heat to water, solar fluid, or air. There are several types of solar
collectors such as flat-plate collectors, evacuated-tube collectors and integral collector-
storage systems. Usually, copper pipes are used in the solar collector system. However,
there is a tremendous energy loss due to thermal radiation which can be reduced by using
an optically selective absorber surface. The ideal behavior of an optical selective absorber
surface is a high absorption in the solar spectral region and a low emittance in the thermal
radiation region. Presently, no perfectly optically selective material has yet been found.
Two approaches can be followed to achieve optical selectivity: (i) opposite to a black
absorber a heat mirror is placed, reflecting the thermal infrared radiation, and transmitting
the solar radiation, and (ii) a special coating, which absorbs the solar radiation, but
transmits the infrared radiation.6 TiNxOy has been found a good optical selective coating
on copper subtractes.7
A solar heating system saves energy, reduces utility costs, and produces clean
energy. The efficiency and reliability of solar heating systems have increased
dramatically, making them attractive options in either home or business use.

4
1.2.2 Electricity
Photovoltaic (PV) devices typically consist of a series of thin semiconductor
layers that are designed to convert sunlight to direct-current electricity. As long as the
device is exposed to sunlight, a PV cell produces an electric current proportional to the
amount of light it receives. PV cells can help to reduce the widespread dependence on
dwindling oil reserves and mitigate adverse effects on the environment. Currently,
crystalline silica-based solar cells are the most popular form of PV device, given their
high solar conversion efficiencies, ease of manufacture, resistance to degradation, and the
abundance of silaceous starting materials.8 However, for PV to be a competitive energy
alternative, their cost needs to be reduced to at least 20% of their current market value.9
Hence, there is a need to investigate new highly efficient PV materials. According to the
recent literature reports, TiO2 nanostructured materials offer tremendous opportunities to
enhance the efficiency of capturing solar energy, thereby reducing the overall cost.10 11, 12
1.2.3 Chemical Processes
In chemical processes, solar energy can be used in two ways: i) solar
detoxification technologies for cleaning water and air, and ii) producing fuel such as H2
and CH3OH by photoelectrolysis of water and reducing CO213, respectively, in the
presence of a suitable catalyst such as TiO2 or TiO2 supported Pt, Cu. Figure 1.1 depicts
the basic principle by which solar energy removes organics from polluted water or
produces fuel. When TiO2 (a semiconductor) absorbs ultraviolet radiation from sunlight,
it produces pairs of electrons and holes. The excess energy of this excited electron
promotes the electron to the conduction band thereby creating electron (e-) and hole (h+)

5
pairs. The positive-hole of TiO2 breaks apart the water molecule to form hydrogen gas
and a hydroxyl radical, which rapidly destroys the chemical bonds of the contaminant.
The negative-electron reacts with an oxygen molecule to form a super oxide anion. This
cycle continues as long as light is available.14
Figure 1.1: Mechanism of semiconductor photocatalysis.15
1.3. TiO2 and Solar Energy
TiO2 nanomaterials are one of the potential candidates for solar energy application
due to TiO2’s unique optoelectronic and photochemical properties.16, 17 Especially, as a
photocatalyst to clean air/water and in electrolysis of water to produce hydrogen, TiO2
nanomaterials have been receiving a great deal of attention.14, 16 However, its ability to
generate oxidizing agents using sunlight as the primary energy source is very limited,
because it only absorbs 3% of the solar energy. Consequently, a substantial portion of the
available solar energy is not utilized.3, 18 Moreover, the low surface area and high
electron-hole recombination rate of TiO2 nanomaterials are also considered as negative

6
factors to wide-scale application. Bulk modification by cation and anion doping has been
found very effective to improve the properties of TiO2.4, 19-25
Hence, significant progress in the research and development of nano TiO2 is
required to assure that solar technology can achieve its full potential. Solar electricity
from photovoltaics is currently very costly with a limited production capacity. Solar
thermal systems provide the lowest-cost solar energy but require large areas in the Sun
Belt. Hence, the practical utilization of solar energy is strongly limited due to the
available low efficiency and high cost materials with ≤ 2 % of the available solar energy
currently being used. Therefore, it is highly desirable to enhance the performance of solar
energy systems by designing new materials as well as increasingly understanding the
electronic and molecular basis of capture, conversion, and storage of this clean, abundant,
and economic energy. One of the most important research areas towards this means is to
synthesize new efficient nanostructured materials for solar energy applications with low
cost using a green technology.
This study aimed at developing superior quality TiO2 based nanomaterials
utilizing the green solvent scCO2 for solar energy applications, with the major
contributions of this study being the following:
i. Synthesis of Fe, Zr and N-modified TiO2 nanomaterials using an acid
modified sol-gel technique in scCO2,
ii. Investigation of the effects of doping materials and synthesis technique
on the characteristics of the TiO2 nanomaterials,

7
iii. Optimizing the synthesis conditions towards synthesizing superior
quality of low cost material by a green solvent process for potential
widespread solar energy application.

8
CHAPTER 2
LITERATURE REVIEW
(TiO2 Based Nanostructured Materials in scCO2)
2. Introduction
Recently, considerable effort has been devoted to synthesizing inorganic one-
dimensional (1D) nanostructures (e.g. nanotubes, nanowires, nanobelts) given their
unique physical properties compared to their bulk counterparts.26, 27 The favorable
properties of the 1D nanomaterials make them very attractive in various applications
including catalysis, high efficiency solar cells, coatings, and sensors.10, 28, 29 Amongst the
1D nanostructures reported in the literature, TiO2 nanomaterials have received a great
deal of attention due to their high activity, strong oxidation capability, and chemical
stability.30, 31 TiO2 nanomaterials offer tremendous opportunities to improve the
efficiency of the solar energy derived systems that is expected to help reduce our
dependency on conventional fossil-fuel based energies. Perhaps even more importantly,
TiO2 nanomaterials are very promising as a source of hydrogen energy through effective
utilization of solar energy based on photovoltaic and water-splitting devices. Therefore,
TiO2 nanomaterials can play a crucial role not only in establishing a wide source of
energy supply, but also solving the environmental pollution challenges by minimizing the
dependencies on fossil fuel based energy sources.16
Currently, several different processing techniques have been investigated for the
preparation of TiO2-based nanostructures, such as anodization, template techniques,
hydrothermal processes, and soft chemical processes. However, each of these methods

9
has limitations. For instance, the templating technique requires high calcination
temperatures to remove the template, resulting in a collapse of the tubular structure in the
product.32 Anodizing processes produce nanotubes with relatively large diameters.33 The
multi step hydrothermal process requires a large amount of inorganic solvents, which
may lead to environmental pollution. In this regard, the sol-gel techniques using a green
solvent such as supercritical carbon dioxide (scCO2) is considered as an attractive
alternative to synthesize TiO2-based nanostructured materials with desired characteristics.
In this chapter, the advanced applications, and various modifications and synthesis
procedures for preparing of TiO2 nanostructured materials are reviewed.
2.1. TiO2 Nanostructured Materials
Titanium (Ti) is a transition metal with atomic number 22. It is a light, strong,
lustrous, and corrosion-resistant metal. Titanium dioxide (TiO2) is the most commonly
used compound of titanium. Since its commercial production in the early twentieth
century, TiO2 has been widely used as a pigment in sunscreens, paints, ointments, and
toothpaste. It is also used in cements, gemstones, as an optical opacifier in paper, and a
strengthening agent in graphite composite fishing rods and golf clubs. TiO2 powder is
chemically inert, stable under sunlight, and is very opaque:34 This allows it to impart a
pure and brilliant white color to the brown or gray chemicals that form the majority of
household plastics. However, in 1972, Fujishima and Honda discovered the phenomenon
of photocatalytic splitting of water on a TiO2 electrode under ultraviolet (UV) light.11
Since then, enormous efforts have been devoted to the research of TiO2, which has led to
10
many promising applications such as photocatalysis, photovoltaics, photo-
electrochromics and sensors. Some potential applications of TiO2 are mentioned below.
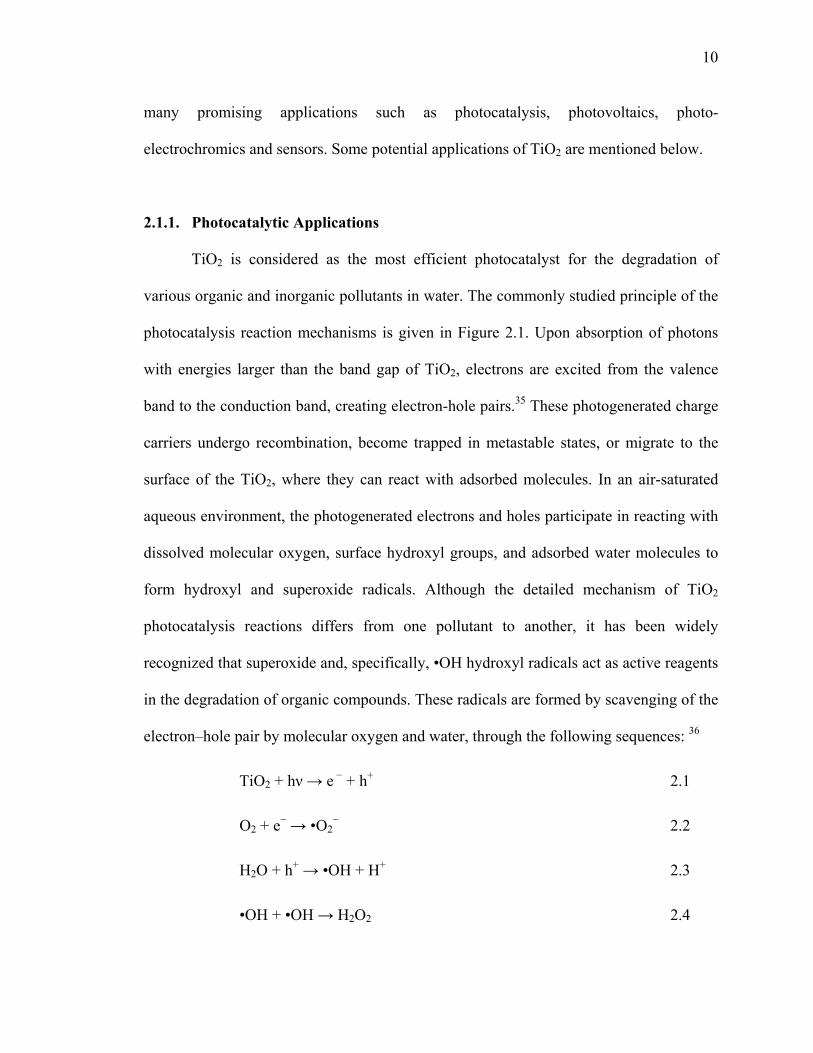
2.1.1. Photocatalytic Applications
TiO2 is considered as the most efficient photocatalyst for the degradation of
various organic and inorganic pollutants in water. The commonly studied principle of the
photocatalysis reaction mechanisms is given in Figure 2.1. Upon absorption of photons
with energies larger than the band gap of TiO2, electrons are excited from the valence
band to the conduction band, creating electron-hole pairs.35 These photogenerated charge
carriers undergo recombination, become trapped in metastable states, or migrate to the
surface of the TiO2, where they can react with adsorbed molecules. In an air-saturated
aqueous environment, the photogenerated electrons and holes participate in reacting with
dissolved molecular oxygen, surface hydroxyl groups, and adsorbed water molecules to
form hydroxyl and superoxide radicals. Although the detailed mechanism of TiO2
photocatalysis reactions differs from one pollutant to another, it has been widely
recognized that superoxide and, specifically, •OH hydroxyl radicals act as active reagents
in the degradation of organic compounds. These radicals are formed by scavenging of the
electron–hole pair by molecular oxygen and water, through the following sequences: 36
TiO2 + hν → e − + h+ 2.1
O2 + e− → •O2− 2.2
H2O + h+ → •OH + H+ 2.3
•OH + •OH → H2O2 2.4

11
H2O2 + •O2−→ •OH + OH− +O2 2.5
Figure 2.1:The principle of TiO2 photocatalysis.37
Following a similar mechanism, the TiO2 photocatalyst can reduce CO2 to
CH3OH or produce H2 in a controlled environment (inert or oxygen free). However, the
photocatalytic activity of a semiconductor widely depends on its: (i) light absorption
properties, (ii) surface reduction and oxidation rates by the electron and hole, and (iii)
electron-hole recombination rates. On the other hand, the following three factors
pertaining to the band structure of semiconductors have the greatest effect on the
photocatalytic reactions: (i) band gap energy, (ii) position of the lowest point in the
conduction band, and (iii) position of the highest point in the valence band. In
photocatalytic reactions, the band gap energy principally determines which light
wavelength is the most effective, and the position of the highest point in the valence band
is the main determinant of the oxidative decomposition power of the photocatalyst.
12
Naturally occuring TiO2 has three polymorphs, i.e. anatase, brookite, and rutile.
Although all three types of polymorphs are expressed using the same chemical formula
(TiO2), their crystal structures are different. Rutile is thermodynamically the most stable
phase, although the anatase phase forms at lower temperatures. Both of these phases
show photocatalytic activity whereas the brookite phase does not. Despite the fact that the
band gap values are 3.0 eV for the rutile and 3.2 eV for the anatase phases, both absorb
only UV rays. Such characteristics of the rutile phase seem more suitable for use as a
photocatalyst because the rutile phase can absorb light of a wider range. However, the
anatase phase exhibits higher photocatalytic activity.37 The most prominent reasons are
attributed to the difference in the energy structure between the two phase types and the
surface area. In both phases, the position of the valence band is deep, and the resulting
positive holes show sufficient oxidative power. However, the conduction band in the
anatase phase is closer to the negative position than in the rutile phase. Therefore, the
reducing power of the anatase phase is stronger than that of the rutile phase. Usually, the
anatase crystal phase forms at lower temperatures, showing higher surface areas
compared to the rutile phase. A larger surface area with a constant surface density of
adsorbents leads to faster surface photocatalytic reaction rates. In this sense, the higher
the specific surface area, the higher the photocatalytic activity that one can expect.
Therefore, the anatase phase exhibits higher overall photocatalytic activity compared to
the rutile phase. However, Li et al. hypothesized that the anatase and rutile mixed phases
showed better photocatalytic activity because any kind of solid–solid interface is a key
structural feature that facilitates the charge separation to hinder recombination. The
interface also acts as an active site to initiate the catalytic activity and enhance

13
photocatalytic efficiency.30, 38 In addition, TiO2 nanomaterials with high crystallinity
show superior photocatalytic activity. High temperature treatment usually improves the
crystallinity of TiO2 nanomaterials, which can induce the aggregation of small
nanoparticles and decrease the surface area.36, 39 Therefore, it is very difficult to predict a
priori the photocatalytic activities from the physical properties of TiO2 nanomaterials.
Optimal conditions are sought by taking into account all these considerations, which may
vary from case to case (a detailed discussion is provided in photocatalytic performance
section of this dissertation).
2.1.2. Photovoltaic Applications
Nanocrystalline TiO2 electrodes in photovoltaic’s are another important
application of TiO2. A schematic presentation of the structure and operating principles of
a dye sensitized solar cell (DSSC) is presented in Figure 2.2. 40 The nanocrystalline TiO2
film, with a monolayer of charge transfer dye adsorbed to its surface, is considered the
main part of the cell. The film is placed in contact with a redox electrolyte or an organic
hole conductor. Upon photoexcitation, the dye provides an electron which is injected into
the conduction band of TiO2. The electron can then be conducted to the outer circuit to
make electric power, while the original state of the dye is restored by electron donation
from the electrolyte. The electrolyte is usually an organic solvent containing a redox
system, such as the iodide/triiodide couple. The regeneration of the sensitizer prevents the
conduction band electron from being captured by the oxidized dye. The iodide is
regenerated in turn by the reduction of triiodide at the counter electrode. Under
illumination, the voltage generated corresponds to the difference between the Fermi level

14
of TiO2 and the redox potential of the electrolyte. Overall, the DSSC generates electric
power from light without suffering any permanent chemical transformations. The
mesoporosity and nanocrystallinity of the TiO2 semiconductor is important because a
large amount of dye can be adsorbed on the high surface area. In addition,: (i) small
particles become almost totally depleted upon immersion in the electrolyte and (ii) the
proximity of the electrolyte to all particles makes electron injection and their transport
relatively easy.16
Figure 2.2: Principle of operation and energy level scheme of the dye-sensitized nanocrystalline TiO2 solar cell.40

15
2.1.3. Other Potential Applications
In addition to the above discussed photocatalysis and photovoltaic applications,
TiO2 nanomaterials can also be used in biomedical applications,41 functionalized hybrid
materials,42and in sensors and nanocomposites.43, 44 The one dimensional TiO2 nanotubes
are promising for reinforcement due to their unique physical properties, i.e. large surface
to volume ratio, low cost and better biocompatibility compared with carbon nanotubes.45
These materials can be used as fillers for many applications such as a radiopacifier in
bone cement, a solid plasticizer of poly (ethylene oxide) for lithium batteries, a dye in a
conjugated polymer for photoelectrochemical photoconductive agents, and as a
photocatalyst in a photodegradable TiO2-polystyrene nanocomposite film.45-48 Moreover,
TiO2 nanocrystalline films have been widely studied as sensors for various gases. For
instance, Varghese et al. observed that TiO2 nanotubes were excellent room-temperature
hydrogen sensors not only with a high sensitivity but also with an ability for self cleaning
after environmental contamination.49 TiO2 nanomaterials also have been widely explored
as electrochromic devices, such as electrochromic windows and displays.
Electrochromism can be defined as the ability of a material to undergo color change upon
oxidation or reduction. Electrochromic devices are able to vary their throughput of visible
light and solar radiation upon electrical charging and discharging using a low voltage. 16
2.2. Modifications of TiO2 Nanomaterials
The performance of titania nanomaterials in the above mentioned applications
strongly relies on their physicochemical characteristics such as crystallinity, crystallite
size, crystal structure, specific surface area, thermal stability and quantum efficiency.17,

16
50 For example, in solar applications a narrower band gap energy is favorable to obtain a
higher photon capture efficiency. Undoped TiO2 offers a wide band gap, which allows
utilizing only a small fraction of the available solar energy (<5%). Therefore, it is highly
desirable to improve the TiO2 nanomaterials in order to increase their optical activity by
shifting the onset of the response from the UV to the visible region. Indeed, a great deal
of research is focusing on modifying the properties of TiO2 in order to achieve these
desirable properties. Generally, the modification of TiO2 nanomaterials can be divided
into two main groups, (i) bulk modification and (ii) surface modification.
Bulk modification
Foreign-element-doping is one of the well-known methods to enhance the
performance of titania nanomaterials.16 Usually, two different approaches: 1) Zr, Al, or
Si are added to increase the thermal stability, and surface area,24, 51-53 or 2) Fe, Cr, V,
Mn, Co C, N, S, are added to shift the absorption edge over a broader range.54-61 In some
cases, simultaneous cation and anion doping of TiO2 also helps in improving the
desirable bulk properties of TiO2. Wang et. al investigated the role of a potential
promoter, ZrO2, in enhancing the activity of TiO2-xNx for the oxidation of gaseous
organic compounds.62 The nitrogen-doped photocatalysts were synthesized by reacting
amorphous metal oxide xerogels via a sol-gel process with an ammonia solution,
followed by calcining the products. They reported that ZrO2 helped to preserve the
surface area and prevent grain growth resulting in higher activity.
Surface modification
Sensitizing TiO2 with colored inorganic or organic compounds can improve its
optical absorption in the visible light region.10, 63 In addition, modification of the TiO2
17
nanomaterials surface with other semiconductors can alter the charge-transfer properties
between TiO2 and the surrounding environment.64-67
In this project, TiO2 nanomaterials were modified following the bulk modification
approach. Hence, the various bulk modification approaches along with associated
properties and the synthesis processes are reviewed.
2.2.1. Bulk Modification of TiO2 Nanomaterials
In the recent technical literature, numerous studies have focused on shifting the
bandgap of TiO2 to the visible spectral region which would potentially allow more
efficient utilization of solar energy and, hence, greatly expand its applications.23, 68 The
transition metal ions such as Fe, Cr, V, Mn and Co can be added as dopants.4, 16, 23, 54, 69-71
This type of doping also increases the photoinduced electron/hole charge recombination
lifetimes by acting as an electron-hole trap site. Among the various metal ions, doping
with Fe (III) has been widely used due to Fe’s unique electronic structure and size that
closely matches that of titanium (IV).72
A separate approach to shift the absorption edge over a broader range55-61 is by
modifying TiO2 with anions such as C, N, S, and F. Asahi et al. showed that the
substitutional doping of N was the most effective among all anions for band gap
narrowing, because N’s p states mixed with O 2p states.19
In addition, the technical literature has shown that the performance of TiO2
nanomaterials also strongly relies on their crystallinity, specific surface area, and thermal
stability with these properties significantly varying with the synthesis method, type and
amount of dopant loading, and the subsequent heat treatment.72-75 Altering the textural

18
properties of TiO2 is another way to enhance the catalytic performance of
nanomaterials.76 It has been suggested that a well ordered mesoporous TiO2 material can
enhance catalytic performance due to the large accessible surface area and uniform pore
structure. Research on mesoporous silica has shown that the structure of silica can be
stabilized by incorporation of metal elements such as Fe (III), La (III) and Al (III) into its
framework. By adapting this approach, Wang et al. synthesized mesoporous Fe doped
titania using surfactant by a hydrothermal process, and found that the synthesized
materials had better ordered mesoporous structure.77 However, Al, Si, or Zr are usually
used to increase thermal stability and surface area but the effect of the dopant strongly
relies on the synthesis process, composition and selected application.51, 78-81 Considering
solar energy applications, Zr has been reported as one of the most suitable dopants to
enhance the thermal stability and activity of TiO2 nanomaterials.24, 53, 82, 83 Research has
demonstrated that TiO2–ZrO2 binary metal oxides exhibit higher activity than either of
the pure counterparts.84 The increase in surface area compared to pure TiO2, the rise in
surface acidity, or the creation of active sites on the surface have been considered as
possible causes of this improvement.82, 85
Surface Properties of Metal doped TiO2 Nanomaterials
As discussed above, a suitable metal dopant can lead to improvement of the
textural properties of TiO2, an increase in the acidity of its surface, acceleration of phase
transfer, and an increase in the degree of separation of any photogenerated charges. These
factors are controlled by changes in the preparation method, loading of a catalyst, and
type of dopant element. Gnatuyak et al. synthesized mesoporous zirconium-containing
19
TiO2 films by a sol–gel process and studied their structural and sorption characteristics,
surface acid functionality, and photocatalytic activity for the gas-phase oxidation of
aliphatic alcohols. They observed that the zirconium content changes the acidity and
specific surface area of the films.86 The increase in photocatalytic activity of TiO2/ZrO2
compared to pure TiO2 is connected with the increase in thermal stability of the porous
structure, the increase in the acidity of the surface, and with the generation of structural
defects due to the incorporation of impurity ions into the TiO2 lattice. In all cases, the
incorporation of Zr into TiO2 leads to a notable increase in surface area, while stabilizing
the anatase phase.
Most of the research has mainly focused on the surface area, crystalline structure
and anatase to rutile phase transformation. In addition to crystal structure, the hybrid
materials structural properties/morphology is also important. This can affect the transport
of reactants and products to or from the catalytic active sites, the light absorbance for the
photo-excitation of the catalyst, and the generation of electron–hole pairs. In the
literature, only a limited number of articles have focused on the possible influence of
structural differences originated by the synthesis procedure and process variables for
preparing TiO2–ZrO2 binary metal oxides. Given the limited studies, the relationship
between the structure and the performance of these photocatalysts synthesized via
different processes has yet to be established.
2.2.2. Electronic Properties and Optical Response of TiO2
The optical response of any material is largely dependent on its underlying
electronic structure. The electronic structure of a nanomaterial is closely related to its
20
chemical composition, arrangement, and physical dimensions. The electronic states of
TiO2 are generally considered to consist of three parts: (1) valence band, (2) lower
conduction band, and (3) upper conduction band (Figure. 2.3).87
(1) Valence band: The VB consists of three parts: σ bonding of the O pσ and
Ti eg states in the lower energy region; the π bonding of the O pπ and Ti eg
states in the middle energy region; and the O pπ states in the higher energy
region.
(2) Lower conduction band: The bottom of the lower conduction band (CB)
consists of the Ti dxy orbital, which contributes to the metal metal
interactions due to the σ bonding of the Ti t2g-Ti t2g states. At the top of the
lower CB, the remaining Ti2g states are antibonding with the O pπ states.
(3) Upper conduction band: The upper CB consists of the σ antibonding
orbitals between the O p σ and Tieg states.
As discussed above in section 2.2.1, the chemical composition of TiO2 applicable
for solar applications can be altered by incorporating a dopant. Specifically, the metal
(Ti) or the nonmetal (O) component can be replaced by the dopant material in order to
alter the optical properties. The following section shows the effects of metal and non-
metal doping on both the electronic properties and the optical response of TiO2
nanomaterials.

21
Figure 2.3: The bonding diagram of a perfect TiO2 crystal.87
Metal-Doped TiO2 Nanomaterials
When a doping agent such as V, Cr, Mn, Fe, or Co is introduced into TiO2, an
electron occupied level forms and the electrons are localized around each dopant. With a
dopant with a higher atomic number, the localized level shifts to a lower energy. The
energy of the localized level due to Co doping is low enough that it lies at the top of the
valence band, while the other metals produce midgap states.87 The states due to the 3d
dopants shift to a lower energy level as the atomic number of the dopant increases. The
electron densities around the dopant are large in the VB and small in the CB compared to
the case of pure TiO2. The metal-O interaction strengthens, and the metal metal
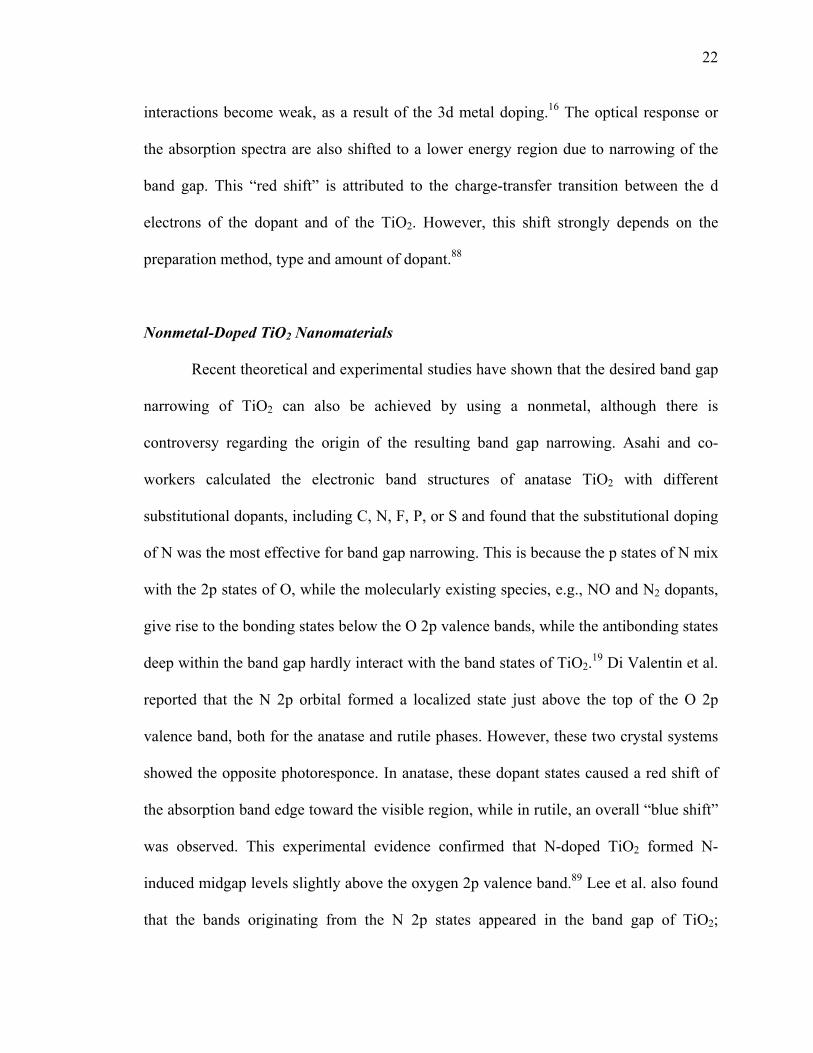
22
interactions become weak, as a result of the 3d metal doping.16 The optical response or
the absorption spectra are also shifted to a lower energy region due to narrowing of the
band gap. This “red shift” is attributed to the charge-transfer transition between the d
electrons of the dopant and of the TiO2. However, this shift strongly depends on the
preparation method, type and amount of dopant.88
Nonmetal-Doped TiO2 Nanomaterials
Recent theoretical and experimental studies have shown that the desired band gap
narrowing of TiO2 can also be achieved by using a nonmetal, although there is
controversy regarding the origin of the resulting band gap narrowing. Asahi and co-
workers calculated the electronic band structures of anatase TiO2 with different
substitutional dopants, including C, N, F, P, or S and found that the substitutional doping
of N was the most effective for band gap narrowing. This is because the p states of N mix
with the 2p states of O, while the molecularly existing species, e.g., NO and N2 dopants,
give rise to the bonding states below the O 2p valence bands, while the antibonding states
deep within the band gap hardly interact with the band states of TiO2.19 Di Valentin et al.
reported that the N 2p orbital formed a localized state just above the top of the O 2p
valence band, both for the anatase and rutile phases. However, these two crystal systems
showed the opposite photoresponce. In anatase, these dopant states caused a red shift of
the absorption band edge toward the visible region, while in rutile, an overall “blue shift”
was observed. This experimental evidence confirmed that N-doped TiO2 formed N-
induced midgap levels slightly above the oxygen 2p valence band.89 Lee et al. also found
that the bands originating from the N 2p states appeared in the band gap of TiO2;
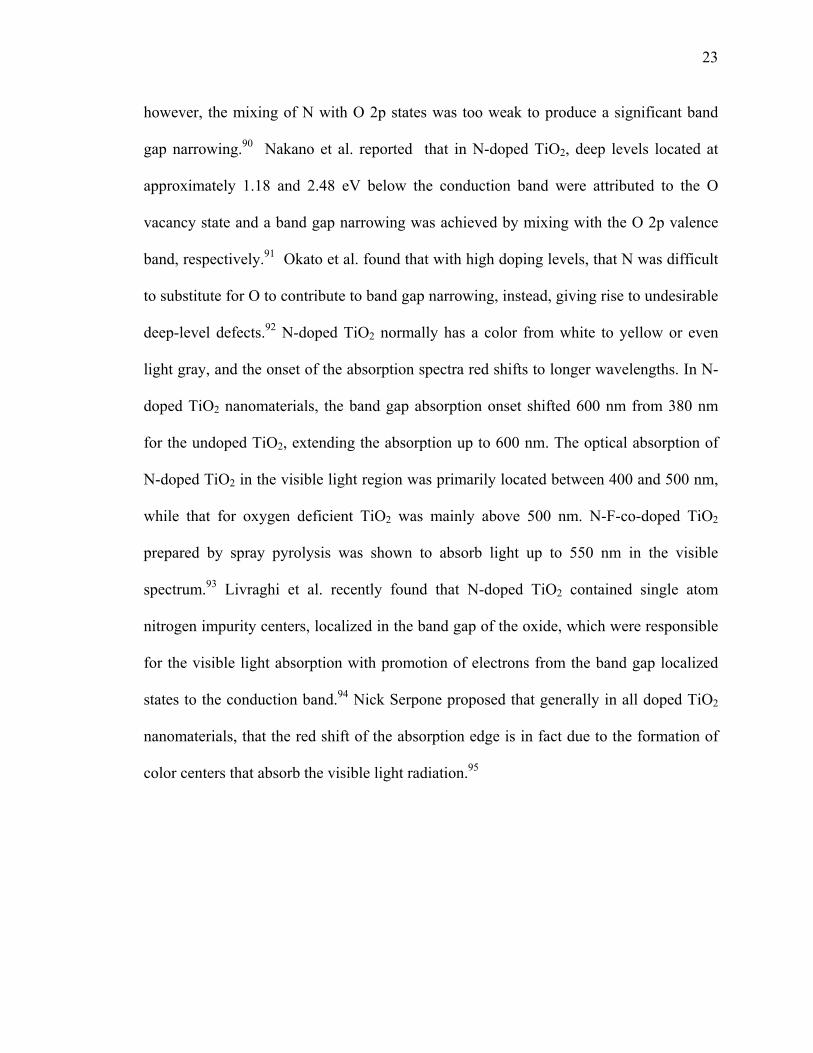
23
however, the mixing of N with O 2p states was too weak to produce a significant band
gap narrowing.90 Nakano et al. reported that in N-doped TiO2, deep levels located at
approximately 1.18 and 2.48 eV below the conduction band were attributed to the O
vacancy state and a band gap narrowing was achieved by mixing with the O 2p valence
band, respectively.91 Okato et al. found that with high doping levels, that N was difficult
to substitute for O to contribute to band gap narrowing, instead, giving rise to undesirable
deep-level defects.92 N-doped TiO2 normally has a color from white to yellow or even
light gray, and the onset of the absorption spectra red shifts to longer wavelengths. In N-
doped TiO2 nanomaterials, the band gap absorption onset shifted 600 nm from 380 nm
for the undoped TiO2, extending the absorption up to 600 nm. The optical absorption of
N-doped TiO2 in the visible light region was primarily located between 400 and 500 nm,
while that for oxygen deficient TiO2 was mainly above 500 nm. N-F-co-doped TiO2
prepared by spray pyrolysis was shown to absorb light up to 550 nm in the visible
spectrum.93 Livraghi et al. recently found that N-doped TiO2 contained single atom
nitrogen impurity centers, localized in the band gap of the oxide, which were responsible
for the visible light absorption with promotion of electrons from the band gap localized
states to the conduction band.94 Nick Serpone proposed that generally in all doped TiO2
nanomaterials, that the red shift of the absorption edge is in fact due to the formation of
color centers that absorb the visible light radiation.95
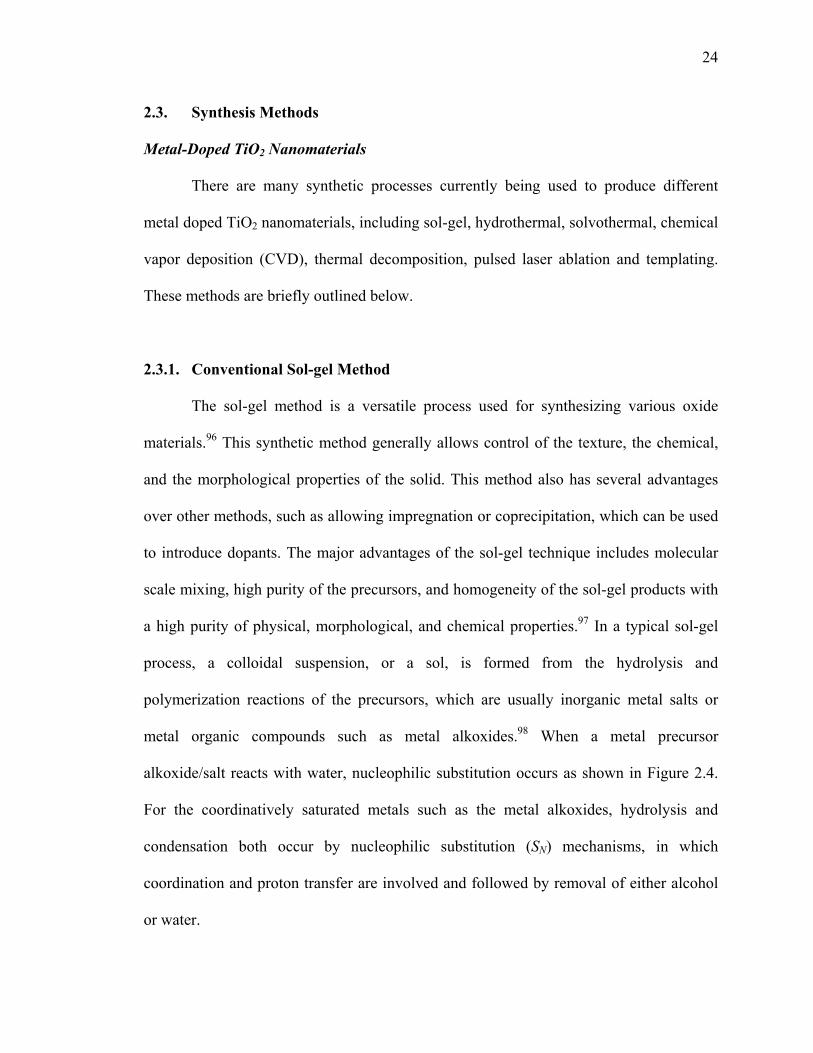
24
2.3. Synthesis Methods
Metal-Doped TiO2 Nanomaterials
There are many synthetic processes currently being used to produce different
metal doped TiO2 nanomaterials, including sol-gel, hydrothermal, solvothermal, chemical
vapor deposition (CVD), thermal decomposition, pulsed laser ablation and templating.
These methods are briefly outlined below.
2.3.1. Conventional Sol-gel Method
The sol-gel method is a versatile process used for synthesizing various oxide
materials.96 This synthetic method generally allows control of the texture, the chemical,
and the morphological properties of the solid. This method also has several advantages
over other methods, such as allowing impregnation or coprecipitation, which can be used
to introduce dopants. The major advantages of the sol-gel technique includes molecular
scale mixing, high purity of the precursors, and homogeneity of the sol-gel products with
a high purity of physical, morphological, and chemical properties.97 In a typical sol-gel
process, a colloidal suspension, or a sol, is formed from the hydrolysis and
polymerization reactions of the precursors, which are usually inorganic metal salts or
metal organic compounds such as metal alkoxides.98 When a metal precursor
alkoxide/salt reacts with water, nucleophilic substitution occurs as shown in Figure 2.4.
For the coordinatively saturated metals such as the metal alkoxides, hydrolysis and
condensation both occur by nucleophilic substitution (SN) mechanisms, in which
coordination and proton transfer are involved and followed by removal of either alcohol
or water.

25
+OM
H
M OH
H
MO M OH
H
HOM O M..... .....
OM M + ROH
Hydrolysis
OM M + H2O
OHM + ROHOH
H
+ M OR
H
HO HO M
R
HO..... .....
OM
H
+ M OR
H
MO M OR
R
HOM O M ..........
Condensation
Condensation
M OR
Figure 2.4: Hydrolysis and condensation steps for sol-gel mechanism.
Complete polymerization and loss of solvent leads to the liquid sol transforming
into a solid gel phase. Thin films can be produced on a piece of substrate by spin-coating
or dip-coating. A wet gel will form when the sol is cast into a mold, and the wet gel is
converted into a dense ceramic upon further drying and heat treatment. A highly porous
and extremely low-density material, called an aerogel, is obtained if the solvent in a wet
gel is removed under supercritical conditions. Figure 2.5 shows the conventional scheme
to produce aerogels. This method involves hydrolysis of the metal alkoxide with water
and a catalyst, i.e. an acid or a base, condensation into macromolecules, forming a
colloidal sol and subsequently three-dimensional network, solvent exchange to remove
water by alcohol, then drying the wet gel using a supercritical fluid to produce the
aerogel.99 Aerogels can be used for advanced applications including electrochemical
devices, thin coatings, composite biomaterials, catalysts, ceramics, and heat and electric
insulation devices due to the aerogels having unique morphological and chemical

26
properties.100 Ceramic fibers can be drawn from the sol when the viscosity is adjusted
into the proper range. Since the precursors react with water quickly and tend to
precipitate, many methods have been used to control the reaction rate in order to obtain
desired nanostructures. For instance, TiO2 nanoparticles with a diameter of ca. 14 nm
were prepared using a sol-gel process of isopropoxide with the aid of ultrasonication.101
However, in binary metal systems, the main difficulty is to control the hydrolysis rate of
the precursors.98 Modifying the precursors with a suitable complexing agent is one way to
alter the hydrolysis rate,102 while generating in-situ water (instead of externally added
water) is another possible way to control the hydrolysis rate.81 In practice, acetic acid is
often used to modify the reactivity of metal alkoxides by replacing the alkoxy groups
bonded to the metal by acetate groups, forming M-OAc complexes and alcohols.
Moreover, acetic acid (HO-Ac) can react with the alcoholic solvent and intermediates,
(produced by modification reaction) to form water via an esterification reaction.102
However, the properties of the sol-gel products depend on the precursors,
processing temperature, catalyst, solvents, and solvent removal process.99 Choi et al.
performed a systematic study of TiO2 nanoparticles doped with 21 metal ions by the sol-
gel method and found that the presence of the metal ion significantly influenced the
photoreactivity, charge carrier recombination rates, and interfacial electron transfer
rates.16 Li et al. developed a La3+-doped TiO2 by a sol-gel process and found that
lanthanum doping could inhibit the phase transformation of TiO2, enhancing the thermal
stability of the TiO2, reducing the crystallite size, and increasing the Ti3+ content on the
surface. 103
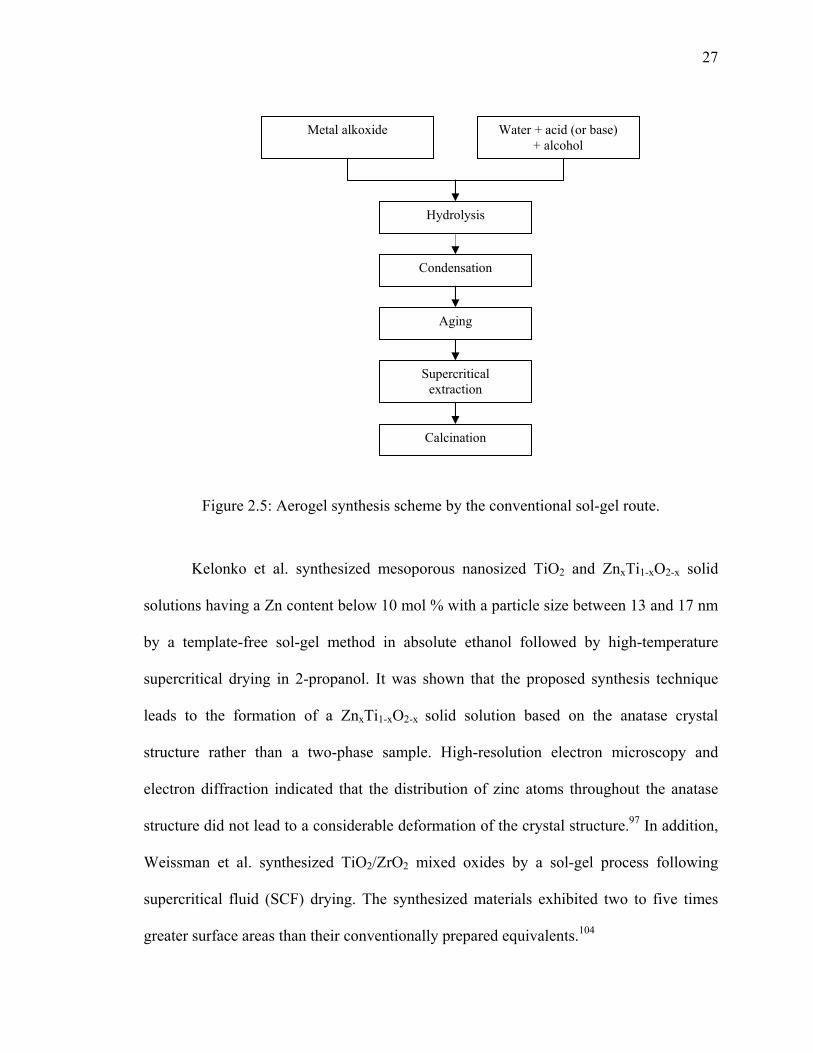
27
Figure 2.5: Aerogel synthesis scheme by the conventional sol-gel route.
Kelonko et al. synthesized mesoporous nanosized TiO2 and ZnxTi1-xO2-x solid
solutions having a Zn content below 10 mol % with a particle size between 13 and 17 nm
by a template-free sol-gel method in absolute ethanol followed by high-temperature
supercritical drying in 2-propanol. It was shown that the proposed synthesis technique
leads to the formation of a ZnxTi1-xO2-x solid solution based on the anatase crystal
structure rather than a two-phase sample. High-resolution electron microscopy and
electron diffraction indicated that the distribution of zinc atoms throughout the anatase
structure did not lead to a considerable deformation of the crystal structure.97 In addition,
Weissman et al. synthesized TiO2/ZrO2 mixed oxides by a sol-gel process following
supercritical fluid (SCF) drying. The synthesized materials exhibited two to five times
greater surface areas than their conventionally prepared equivalents.104
Metal alkoxide Water + acid (or base) + alcohol
Hydrolysis
Condensation
Aging
Supercritical extraction
Calcination
28
2.3.2. Sol Method
The sol process refers to the nonhydrolytic sol-gel process which usually involves
the reaction of titanium halide with a variety of different oxygen donor molecules, such
as:
TiX4 + Ti(OR)4 → 2TiO2 + 4RX 2.6
TiX4 + 2ROR→ TiO2 + 4RX 2.7
The condensation between Ti-X and Ti-OR leads to the formation of Ti-O-Ti
bridges. In this process, a metal alkoxide was rapidly injected into the hot solution of
titanium halide mixed with trioctylphosphine oxide (TOPO) under dry inert gas
protection, with the reactions being completed within 5 min. Following a similar
procedure, Chang et al prepared Zr-doped anatase TiO2 nanorods through the cross-
condensation of Zr/TiCl4 with Zr/ Ti(OPr)4 in anhydrous TOPO at either 320 or 400 °C.
The kinetics of the alkyl halide elimination involving the Ti and Zr species was found to
play a crucial role in determining the morphologies, chemical compositions, and
crystalline phases of the Zr-doped TiO2 nanorods.105
2.3.3. Hydrothermal Method
The hydrothermal method is widely used for the production of small particles in
the ceramics industry. Usually, this process is conducted in steel pressure vessels called
autoclaves under controlled temperature and/or pressure with the reactions occurring in
aqueous solution. The temperature can be elevated above the boiling point of water,
reaching the pressure of vapor saturation. The temperature and the amount of solution
added to the autoclave largely determine the internal pressure produced. The

29
hydrothermal method has been widely used to prepare TiO2 nanotubes after the
pioneering work by Kasuga et al. in 1998.106 Generally, several grams of TiO2 powders
are added to concentrated NaOH solution and held at 20-110 oC for 20 h in an autoclave.
TiO2 nanotubes were obtained after the products were washed with a dilute HCl aqueous
solution and distilled water. When the raw TiO2 material was treated with NaOH aqueous
solution, some of the Ti-O-Ti bonds were broken and new Ti-O-Na and Ti-OH bonds
were formed. New Ti-O-Ti bonds were formed after the Ti-O-Na and Ti-OH bonds
reacted with acid and water. The bond distance from one Ti atom to the next Ti atom on
the surface was found to decrease. This resulted in the folding of the sheets and
connection between the ends of the sheets, resulting in the formation of a tube structure.
In this mechanism, the TiO2 nanotubes were formed in the stage of the acid treatment
following the alkali treatment. However, Du and co-workers found that the nanotubes
were formed during the treatment of TiO2 in NaOH aqueous solution.107 A 3D→2D →1D
formation mechanism of the TiO2 nanotubes was proposed by Wang and co-workers.
They stated that the raw TiO2 was first transformed into lamellar structures which then
bent and rolled to form the nanotubes.108 In all the proposed mechanisms, the two-
dimensional lamellar TiO2 was essential for the formation of the nanotubes. The
hydrothermal method is also currently being used to produce many new hybrid materials
with new morphologies and improved crystallinity. Wang et al. prepared Fe(III)-doped
TiO2 nanoparticles with a hydrothermal method and found that anatase, brookite, and a
trace of hematite coexisted at lower pH (1.8 and 3.6) when the Fe(III) content was as low
as 0.5% and the distribution of iron ions was nonuniform between particles. At a higher
pH (6.0), a uniform solid solution of iron-titanium oxide was formed. 75, 109
30
2.3.4. Solvothermal Method
The solvothermal method is identical to the hydrothermal method except that a
variety of solvents other than water can be used for this process. This method has been
found to be a versatile route for the synthesis of a wide variety of nanoparticles with
narrow size distributions, particularly when organic solvents with high boiling points are
chosen. The solvothermal method normally has better control of the size and shape
distributions and the crystallinity than the hydrothermal method, and has been employed
to synthesize TiO2 nanoparticles and nanorods with/without the aid of surfactants.
2.3.5. Chemical Vapor Deposition (CVD)
This process is often used in the semiconductor industry to produce high-purity,
high-performance thin films. In a typical CVD process, the substrate is exposed to
volatile precursors, which react and/or decompose on the substrate surface to produce the
desired film. Frequently, volatile byproducts that are produced are removed by gas flow
through the reaction chamber. The quality of the deposited materials strongly depends on
the reaction temperature, the reaction rate, and the concentration of the precursors.110, 111
Cao et al. prepared Sn4+-doped TiO2 nanoparticle films by the CVD method and found
that more surface defects were present on the surface due to doping with Sn.112 Gracia et
al. synthesized M (Cr, V, Fe, Co)-doped TiO2 by CVD and found that TiO2 crystallized
into the anatase or rutile structures depending on the type and amount of cations present
in the synthesis process. Moreover, upon annealing, partial segregation of the cations in
the form of M2On was observed.70 The advantages of this method include the uniform

31
coating of the nanoparticles or nanofilm. However, this process has limitations including
the higher temperatures required, and it is difficult to scaleup.113
2.3.6. Thermal Decomposition and Pulsed Laser Ablation
Pure and doped metal nanomatertials can be synthesized via decomposing metal
alkoxides and salts by applying high energy using heat or electricity. However, the
properties of the produced nanomaterials strongly depend on the precursor
concentrations, the flow rate of the precursors and the environment. Kim et al.
synthesized TiO2 nanoparticles with a diameter less than 30 nm via the thermal
decomposition of titanium alkoxide or TiCl4 at 1200 °C.111 Liang et al. produced TiO2
nanoparticles with a diameter ranging from 3 to 8 nm by pulsed laser ablation of a
titanium target immersed in an aqueous solution of surfactant or deionized water.114
Nagaveni et al. prepared W, V, Ce, Zr, Fe, and Cu ion-doped anatase TiO2 nanoparticles
by a solution combustion method and found that the solid solution formation was limited
to a narrow range of concentrations of the dopant ions.115 However, the drawbacks of
these methods are high cost and low yield, and difficulty in controlling the morphology
of the synthesized nanomaterials.96
2.3.7. Templating
The synthesis of nanostructured materials using the template method has become
extremely popular during the last decade.106 In order to construct materials with a similar
morphology of known characterized materials (templates), this method utilizes the
morphological properties with reactive deposition or dissolution. Therefore, it is possible
32
to prepare numerous new materials with a regular and controlled morphology on the
nano- and microscale by simply adjusting the morphology of the template material. A
variety of templates have been studied for synthesizing titania nanomaterials.116 117 This
method has some disadvantages including the complicated synthetic procedures and, in
most cases, templates need to be removed, normally by calcination, leading to an increase
in the cost of the materials106 and the possibility of contamination.
2.3.8. N Doped TiO2 Nanomaterials
Through extensive theoretical and experimental investigations conducted by
Ashai and coworkers, along with other groups, on the effects of different non metal
doping in TiO2, N-doping has been shown to be the most effective technique for band gap
narrowing, resulting in visible light absorption.19, 22 Therefore, only N-doping methods
are reviewed here. The synthesis of N doped TiO2 can be classified into three groups: (i)
sputtering and implantation techniques, i.e. directly treating the target TiO2 film with
high energy N-containing gas flow, (ii) high temperature sintering of TiO2 under a N-
containing atmosphere and (iii) sol–gel method involving the hydrolysis of Ti precursors
in alcohol and water in the presence of N-precursors such as ammonia and organic
amines.18, 118 Amongst these methods, the sol–gel method is the most successful to
synthesize N-doped TiO2 nanomaterials because of its simplicity that provides
controlling the nitrogen doping level and particle size by simple variations in
experimental conditions.18
There is no well known direct correlation between the properties of TiO2 based
nanomaterials and photocatalytic activity, although the synthesis process is considered

33
one of the most important factors controlling the reactivity of the doped TiO2.73, 119
However, most of the methods currently being used suffer scale-up problems, and are not
environmentally friendly. For example, the conventional sol-gel process and template
methods utilize volatile organic compounds (VOCs), and high temperature treatment is
required to remove the template which reduces the surface area of the synthesized
materials;32 hydrothermal or solvothermal methods involve high temperatures in an
autoclave that generates corrosion and safety problems;120 while CVD processes are
difficult to scale-up. Considering all these limitations, alternative processes using a green
solvent such as supercritical carbon dioxide (scCO2) is attractive to synthesize TiO2-based
nanostructured materials.
2.4. Supercritical Fluids (SCFs) and supercritical CO2 (scCO2)
Since the early 1960's, environmental statutes and regulations have proliferated at
an exponential rate. Due to these regulations and increased environmental concerns, the
use of volatile organic compounds (VOCs) are becoming increasingly restricted.121
Consequently, during recent years considerable efforts have been devoted to finding
environmental friendly solvents and processes for industrial application. In this way,
researchers in industry and academia find supercritical fluids (SCFs) as useful alternative
solvents.122 The SCFs exhibit a range of unusual properties that can be exploited for new
reactions and new routes to process materials that have significant benefits for the
specialty chemical and pharmaceutical industries.
A SCF can be defined either as a compressed gas or as an extended liquid.
Thermodynamically, a fluid is in the supercritical domain when both the temperature and

34
pressure are above the critical values, Tc and Pc, respectively. In practice, this definition
is restricted to a fluid close to its critical point. SCFs have liquid-like density and gas-like
viscosity and diffusivity. So SCFs have considerably better solvent strength than what
gases can offer, and better transport properties than what liquids have. Figure 2.6 shows a
typical phase diagram indicating the supercritical region. In the P-T phase diagram of a
pure substance, below the critical point the phase boundary lines divide the diagram into
solid, liquid and gas regions. However, there is no boundary line in the supercritical
region.
Figure 2.6: Schematic of the phase diagram of a typical material.123
Critical properties are very important for fluids with every fluid having its own
critical properties. Table 2.1 shows the Tc, Pc and ρc (the density at the critical point) of
some selected substances that have been used as SCFs for material processing and
chemical reactions.108 For practical purposes, only a few fluids can be used under

35
supercritical conditions because some fluids are corrosive, toxic or have a relatively high
critical temperature (Tc) and pressure (Pc). Generally speaking, low Tc and Pc of a
substance are desirable due to their economic favorability. Moreover, the safety and
environmental issues as well as the solvent power of the substance have to be considered
when one selects a SCF. For instance, ethane is a flammable organic compound, so it
requires special safety precautions. On the other hand, methanol has a high solvent
strength, but it is not commonly used as a SCF due to its high critical temperature.
Ammonia has the ability to dissolve polar compounds; i.e. it can dissolve pump seals, and
it is difficult to pump. In addition to its high polarity, it is highly reactive making it a poor
SCF candidate. The following factors should be considered when selecting a SCF for a
given process.124
i) toxicity and reactivity,
ii) critical temperature and pressure,
iii) flammability,
iv) cost,
v) availability,
vi) environmentally compatible
Considering all these factors, among the candidates for useful SCFs, CO2 is
considered to be the most desirable given its relative low Tc and Pc, low cost, abundance,
and that it is environmentally benign. Usage of scCO2 instead of water or organic
solvents can reduce the water pollution and emission of VOCs. Moreover, it is available
through various industrial sources including the flue gas from power stations, or as a by-
product of existing processes such as ethanol, ammonia and hydrogen production.123 The

36
main problem with supercritical carbon dioxide is its relatively low solvent strength at
typical pressures. This problem can be addressed by using modifiers (co-solvent) or
surfactants.125
Table 2.1: Critical properties for selected supercritical fluids.126 Solvents Tc (°C) Pc (psi) ρc (g/cm3)
Ethylene 9.3 731 0.22
Xenon 16.6 847 1.11
Fluoroform 26.2 705 0.53
Carbon dioxide 31.1 1070 0.47
Ethane 32.2 708 0.20
Nitrous oxide 36.5 1050 0.45
Sulfur hexafluoride 45.6 545 0.73
Difluoromethane 78.4 846 0.43
Propylene 91.8 667 0.23
Propane 96.7 616 0.22
Dimethyl ether 126.9 760 0.26
Ammonia 132.4 1646 0.23
n-Pentane 196.6 489 0.24
Acetone 235.0 680 0.28
Isopropanol 235.1 690 0.27
Methanol 239.5 1173 0.27
Ethanol 240.7 891 0.28
Water 374.2 3208 0.32
Note: Tc Pc and ρc are critical temperature, critical pressure and critical density, respectively.
In the following section, different aspects of supercritical carbon dioxide are
reviewed.

37
2.5. Properties of supercritical CO2
Recently, significant interest has developed to utilize supercritical carbon dioxide
(scCO2) as an attractive replacement for organic solvents in a wide range of chemical
processes. 127-130 This is due to scCO2 being nontoxic, nonflammable, inexpensive,
naturally abundant, and chemically inert.122 With a critical temperature of 31.1 oC and a
critical pressure of 1070 psig, the critical conditions of scCO2 are easily achievable so
that a lower capital cost is required for the autoclave materials, and a lower operation cost
is required due to lower energy consumption. Low viscosity, “zero” surface tension and
high diffusivity of scCO2 are considered highly favorable properties for synthesizing
superior ultrafine and uniform nanomaterials. These properties also help to increase the
reaction rates.131, 132 In addition, its physical properties such as density and solubility can
be “tuned” by adjusting the operating temperature and pressure providing an easily
tunable reaction medium.133, 134 Moreover, when reactions are carried out in scCO2,
reaction products can be easily recovered by simply venting the solvent, hence, no drying
process is required and the porous nanostructure can be maintained without collapsing.
Particularly, supercritical drying extinguishes the liquid surface tension, which causes
collapse of small pores during drying, resulting in shrinkage of the solid; hence the
microstructure and high surface area of the aerogel can be maintained by a supercritical
drying process. As a result, scCO2 has been widely employed for synthesizing aerogels.
Furthermore, scCO2 can be easily recycled after the pressure is diminished for potential
scale-up applications. The following section focuses on the variation of the various
properties of CO2 as a function of temperature and pressure.

38
The Density of CO2
The density of CO2 is very sensitive to operating temperature and pressure,
especially near the critical region. It is very important to understand how the density
changes with pressure and temperature for utilizing scCO2 for an intended application.
Figure 2.7 shows the variation of reduced density as a function of reduced pressure at
various reduced temperatures.135 Here, the reduced density is ρ/ρc= ρr, the reduced
pressure is P/Pc=Pr and the reduced temperature is T/Tc=Tr. The critical point is the
reduced pressure Pr that equals the reduced temperature, Tr=1. At high values of Tr, the
fluid density is reduced where the solvents properties are no longer favorable. It can be
concluded from Figure 2.7 that a smaller change in pressure at Tr=1.0-1.2 results in a
substantial change in density. However, when Tr is increased to 1.5, the same change in
pressure hardly changes the fluid density.
Figure 2.7: Reduced pressure (Pr) vs. reduced density (ρr) diagrams at various reduced temperatures (Tr).135
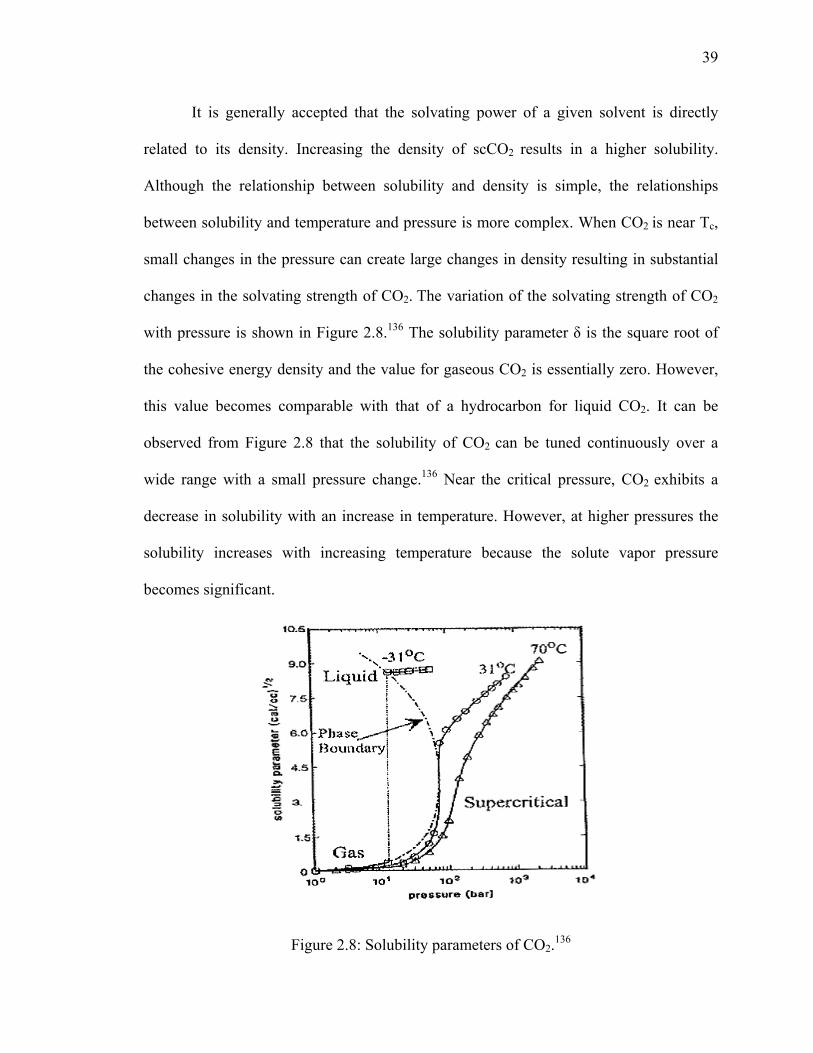
39
It is generally accepted that the solvating power of a given solvent is directly
related to its density. Increasing the density of scCO2 results in a higher solubility.
Although the relationship between solubility and density is simple, the relationships
between solubility and temperature and pressure is more complex. When CO2 is near Tc,
small changes in the pressure can create large changes in density resulting in substantial
changes in the solvating strength of CO2. The variation of the solvating strength of CO2
with pressure is shown in Figure 2.8.136 The solubility parameter δ is the square root of
the cohesive energy density and the value for gaseous CO2 is essentially zero. However,
this value becomes comparable with that of a hydrocarbon for liquid CO2. It can be
observed from Figure 2.8 that the solubility of CO2 can be tuned continuously over a
wide range with a small pressure change.136 Near the critical pressure, CO2 exhibits a
decrease in solubility with an increase in temperature. However, at higher pressures the
solubility increases with increasing temperature because the solute vapor pressure
becomes significant.
Figure 2.8: Solubility parameters of CO2.136

40
The Physical Properties of CO2
The physicochemical properties of SCFs are another attractive and useful feature,
which are intermediate between those of liquids and gases. Table 2.2 compares the
properties of gases, liquids and SCFs. A SCF has a density comparable with a liquid,
which enables it to function as a solvent, and a viscosity similar to a gas, which provides
superior mass and heat transfer compared with a conventional solvent.
Table 2.2: Comparison of the properties of Gas, SCF and Liquid.135
Properties Gas SCF Liquid Density, g/cm3 0.001 0.2-1 0.6-1.6 Diffusivity, cm2/s 0.1 0.001 0.00001 Viscosity, g/(cm·s) 0.0001 0.001 0.01
Figure 2.9: Diffusivity of CO2 vs temperature at various pressures.137

41
The diffusivity of scCO2 varies between 10-4 and 10-3 cm2/s. These values are as
much as 100 times higher than those typically observed in conventional liquids.135 The
diffusivity of CO2 also depends on the temperature and pressure with a typical variation
of diffusivity with temperature and pressure being shown in Figure 2.9.137 When the
pressure is increased, the diffusivity of scCO2 approaches that of liquid. The diffusivity
will increase with an increasing of the temperature.
The physical and chemical behavior of a fluid cannot be understood without
considering surface tension. Surface tension is caused by the molecules of the liquid at
the surface that are subject to an inward force of molecular attraction by various
intermolecular forces. The surface tension of the saturated liquid CO2 as a function of
pressure/temperature is plotted in Figure 2.10. In the saturated liquid region, the surface
tension decreases as the pressure/temperature increases. In the supercritical region,
however, there is no surface tension due to the disappearance of the interface between the
liquid and vapor phases.
Figure 2.10: Surface tension of saturation liquid CO2 as a function of pressure.123
42
2.6. TiO2 Based Nanostructured Materials in scCO2
In the past decade, a direct approach for synthesizing oxide nanomaterials with a
variety of morphologies, such as aerogel nanospheres, monoliths, films, and pillared
structure, have been developed in SCFs. In addition, the technical literature shows that
the direct sol-gel process in scCO2 is a promising technique for synthesizing metal oxide
nanomaterials. However, due to the low solubility of precursors in CO2 and for the sake
of desired nanostructure formation, various surfactants are often used in the sol-gel
process in CO2. The morphology strongly varies with the type of surfactant and the
water/surfactant ratio. For example, Tadros et al. synthesized TiO2 nanoparticles in
scCO2 by hydrolysis and condensation of titanium alkoxides using the anionic fluorinated
surfactant, [F(CF2CF2)zCH2CH2O]xP(O)(ONH4)y (where x = 1 or 2, y = 2 or 1, z = 1 – 7).
The surfactant was able to stabilize the tiny water droplets in scCO2 at 45 °C and 1400
psig, and spherical particles of TiO2 with low anatase crystallinity were formed.138
Using the same anionic fluorinated surfactant, Stallings and Lamb conducted a
more systematic study on the direct sol-gel process of titanium isopropoxide (TIP) in
scCO2. They injected pure TIP into water in scCO2 dispersions using a batch reactor.
Spherical titania particles with a broad particle size distribution (20-800 nm) were
obtained. The surface area of the as-prepared material, 100 ~ 500 m2/g, was attributed to
the internal porosity of the spherical titania particles.139 Hong et al. and Keith Johnson
and his group prepared TiO2 nanospherical particles by the direct sol-gel process of
titanium isopropoxide (TIP) in water-in-CO2 microemulsions using ammonium
carboxylate perfluoropolyether (PFPE-NH4) as the surfactant, with water in CO2 at 25°C
and 4000 psig. The particle size was found to be a function of the molar ratio of water to

43
surfactant, the precursor concentration, and the TIP injection rate. As the surfactant
remained attached to the particles, coalescence of the particles was prevented. The
crystallinity and crystallite size of the nanoparticles was increased with an increase of the
molar ratio of water to surfactant (W0).140
Although the synthesis of TiO2 powders in scCO2 by hydrolysis of titanium (IV)
isopropoxide (TIP) has been reported, this pathway is problematic because CO2 is highly
hydrophobic and water is only slightly soluble in scCO2(≈0.1 wt%). Using fluorinated
anionic surfactants can help form stable water-in-CO2 dispersions to produce TiO2
particles via TIP in H2O/CO2 microemulsions. The synthesis conditions must be strictly
controlled otherwise; amorphous TiO2 particles with a wide size distribution were
formed.141
Only a small amount of work has been published for TiO2 nanomaterials
synthesized without surfactant directly in scCO2. Reverchon et al. prepared amorphous
titanium hydroxide nanoparticles on the pilot scale in scCO2 without the assistance of
surfactant. Two solutions of TIP and water in scCO2 were prepared by flowing scCO2 in
two contactors, containing TIP and water, respectively. Following this, the two
supercritical solutions were injected into the reactor and Ti(OH)4 was produced by
hydrolysis. Ti(OH)4 spherical nanoparticles with mean diameters ranging between 70 and
110 nm were produced, with surface areas larger than 300 m2/g. The formed particles
were separated with the liquid in a downstream separator. The synthesized Ti(OH)4
particles were amorphous and had a narrow particle size distribution.142, 143
There are some other results from the literature using different substances instead
of surfactants to synthesize various forms of TiO2 materials in scCO2. For instance, Yoda

44
et al. synthesized TiO2-pillared clay montmorillonite (MNT) in scCO2 following a two
step scheme. In the first step, the interlayer cations were exchanged with hydrophobic
cations; in the second step, the intercalation of a metal alkoxide dissolved in scCO2 was
undertaken, followed by hydrolysis with adsorbed water present in the interlayer space.
Nano-sized anatase crystal structures were observed in the calcined samples. Sun et al.
also grafted mono and bi layers of TiO2 on mesoporous SiO2 molecular sieve SBA-15 via
a surface sol-gel process in scCO2. The process involved grafting of TIP onto the surface
of the molecular sieve, extraction of extra TIP, followed by hydrolysis of the impregnated
TIP with an excess amount of water and calcination. The XPS results confirmed the
formation of Ti-O-Si and Ti-O-Ti bonds.144
Tatsuda et al. prepared TiO2-coated activated carbon by the penetration of TIP
dissolved in supercritical CO2 into the nano-spaces of activated carbon. The conversion
of TIP to TiO2 through thermal decomposition was confirmed by evolved gas analysis
during heat treatment under N2 flow. Acetone was detected in the evolved gas, which
suggested that some isopropoxide groups in TIP reacted with the carbonyl groups on the
activated carbon surface. This chemical reaction with carbon was expected to be
advantageous for favourable attachment to the carbon surface. The crystallite size of
anatase in the TiO2/carbon composites was 4.1 nm, as estimated from the X-ray
diffraction pattern, which almost corresponded to the graphene crystallite size. These
results confirmed that the anatase crystals were present in the carbon pores and the crystal
growth of TiO2 was influenced by the carbon nano-spaces.145
Sun et al. prepared titania-silica binary oxides using the inorganic precursors,
tetraethyl orthosilicate (TEOS) and titanium isopropoxide (TIP), simultaneously or
45
sequentially impregnated into a polypropylene (PP) matrix using supercritical carbon
dioxide as a swelling agent and carrier. Hydrolysis and condensation reactions of the
precursors were confined to the polymer network, and then the PP matrix was
decomposed at higher temperatures resulting in titania-silica binary oxides. It was
demonstrated that the structure of the oxides depended strongly on the procedure to
impregnate the precursors.146
Jensen et al. followed a very different method called seed enhanced crystallization
(SSEC) to prepared anatase TiO2 at a temperature as low as 100 °C in scCO2. To prevent
the premixing of the reactants before addition of CO2, TIP and water were injected in the
upper third and lower third, respectively, of an autoclave. A seeding material was located
in the middle of the autoclave. After addition of CO2, the reactants were able to mix and
the sol-gel reaction was initiated. A crystallinity as high as ca. 60% was obtained without
downstream calcination. The authors claimed a mechanism that water dispersed into CO2
and reacted with TIP sitting on the surface of the seeding material, and the seeding
material acted as heterogeneous seeds for the nuclei formation and facilitated the
formation of crystalline nuclei.123, 147 Moreover, recently, Jensen et al. studied the
formation of TiO2 particles with reaction time by this method using in situ small-angle X
ray scattering (SAXS) and wide-angle scattering (WAXS), and it was found that the sol-
gel process in scCO2 was faster than in the organic solvent. 147
A modified non-aqueous sol-gel route was first reported by Loy et al. in 1997, in
which the direct synthesis of SiO2 aerogel monolith in CO2 was studied by using formic
acid as the polycondensation agent.148 Because organic acid/anhydrate and titanium
alkoxides are soluble in scCO2, this route is likely to be suitable to prepare TiO2 powders

46
in scCO2, as the reaction can be carried out in a homogeneous phase. Moreover, the
observed reaction rate was lower than that of a hydrolytic route, allowing for more
uniform particle sizes that were attained by using this surface-assisted hydrolysis
technique. Keeping this in mind, Guo et al. prepared TiO2 powders via non-hydrolytic
acylation/deacylation in scCO2 from TIP and acetic anhydride or trifluoroacetic
anhydride. The as-prepared TiO2 nanopowders were amorphous, but readily converted to
anatase by heat treatment at 500 °C for 5 h. The photocatalytic activity of the prepared
TiO2 in scCO2 was higher than that of TiO2 prepared from titanium(IV) isopropoxide and
acetic anhydride, or of commercial T805 TiO2.141 However, the properties of the
synthesized materials strongly depend on the synthesis parameters such as the precursor,
poly condensing agent, temperature and pressure.
Recently, Sui et al. synthesized TiO2 nanofibers having diameters that ranged
from 9 to 100 nm with nanocrystallites via a sol-gel route in scCO2. The nanofibers were
formed by the esterification and condensation of titanium alkoxides using acetic acid as
the polymerization agent in scCO2 from 40 to 70 °C and 2500 to 8000 psia. The
nanofibers exhibited relatively high surface areas up to 400 m2/g and anatase and/or rutile
nanocrystallites were formed after calcination.149 The same group (charpentier lab)
synthesized porous ZrO2 aerogels using a similar procedure. The synthesis involved the
coordination and polycondensation of a zirconium alkoxide using acetic acid in CO2,
followed by scCO2 drying and calcination. Both mesoporous monoliths and nanoparticles
were produced. The as-prepared materials exhibited a high surface area (up to 399 m2/g).
Moreover, they intensively performed an in situ infrared spectroscopy analysis for the
TiO2 and ZrO2 system and found that different M-acetate coordinate complexes were
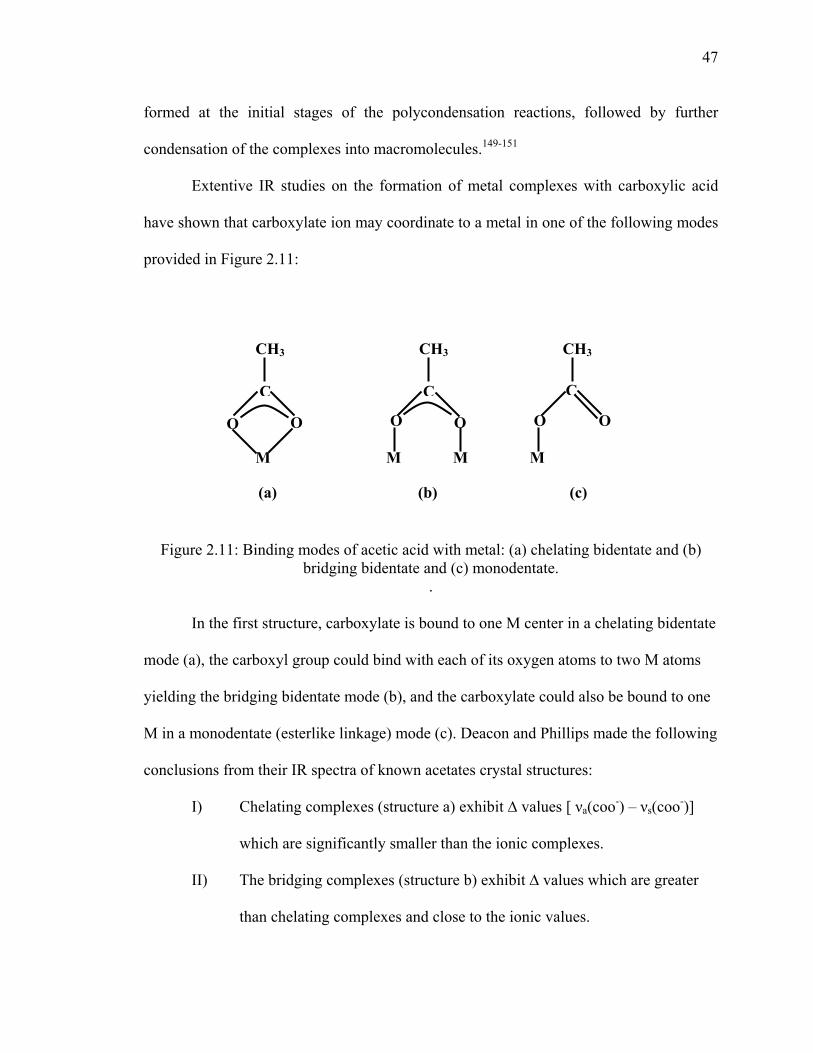
47
formed at the initial stages of the polycondensation reactions, followed by further
condensation of the complexes into macromolecules.149-151
Extentive IR studies on the formation of metal complexes with carboxylic acid
have shown that carboxylate ion may coordinate to a metal in one of the following modes
provided in Figure 2.11:
Figure 2.11: Binding modes of acetic acid with metal: (a) chelating bidentate and (b) bridging bidentate and (c) monodentate.
.
In the first structure, carboxylate is bound to one M center in a chelating bidentate
mode (a), the carboxyl group could bind with each of its oxygen atoms to two M atoms
yielding the bridging bidentate mode (b), and the carboxylate could also be bound to one
M in a monodentate (esterlike linkage) mode (c). Deacon and Phillips made the following
conclusions from their IR spectra of known acetates crystal structures:
I) Chelating complexes (structure a) exhibit ∆ values [ νa(coo-) – νs(coo-)]
which are significantly smaller than the ionic complexes.
II) The bridging complexes (structure b) exhibit ∆ values which are greater
than chelating complexes and close to the ionic values.
C
CH3
O
M
O
C
CH3
O O
M
C
CH3
O O
M M
(a) (c) (b)
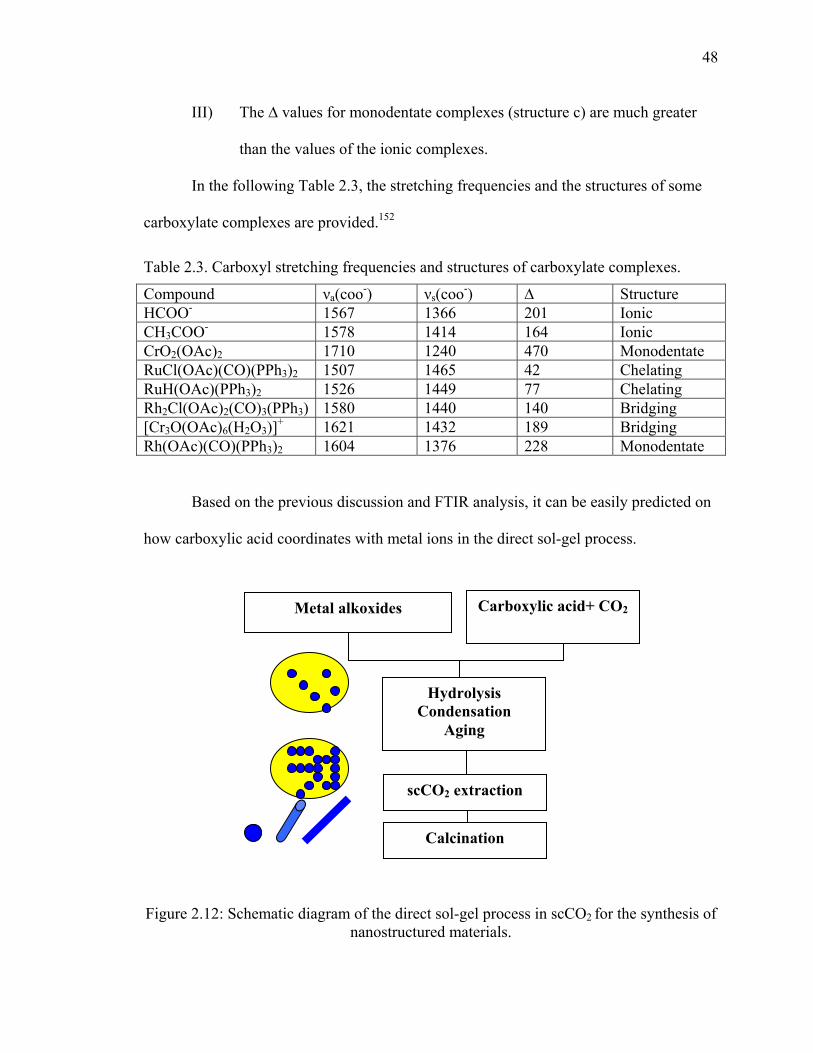
48
III) The ∆ values for monodentate complexes (structure c) are much greater
than the values of the ionic complexes.
In the following Table 2.3, the stretching frequencies and the structures of some
carboxylate complexes are provided.152
Table 2.3. Carboxyl stretching frequencies and structures of carboxylate complexes.
Compound νa(coo-) νs(coo-) ∆ Structure HCOO- 1567 1366 201 Ionic CH3COO- 1578 1414 164 Ionic CrO2(OAc)2 1710 1240 470 Monodentate RuCl(OAc)(CO)(PPh3)2 1507 1465 42 Chelating RuH(OAc)(PPh3)2 1526 1449 77 Chelating Rh2Cl(OAc)2(CO)3(PPh3) 1580 1440 140 Bridging [Cr3O(OAc)6(H2O3)]+ 1621 1432 189 Bridging Rh(OAc)(CO)(PPh3)2 1604 1376 228 Monodentate
Based on the previous discussion and FTIR analysis, it can be easily predicted on
how carboxylic acid coordinates with metal ions in the direct sol-gel process.
Figure 2.12: Schematic diagram of the direct sol-gel process in scCO2 for the synthesis of nanostructured materials.
scCO2 extraction
Calcination
Metal alkoxides Carboxylic acid+ CO2
Hydrolysis Condensation
Aging
49
The schematic diagram of the direct sol-gel process in scCO2 is given in Figure
2.12. This process has significant advantages such as combining the reaction process and
the drying process into one step, maintaining higher surface areas, and being a low
temperature process. However, no one has synthesized anion or cation doped TiO2 based
nanostructures following this simple route.
2.7. Scope of the Research
TiO2 nanomaterials are one of the potential candidates for solar applications due
to their unique optoelectronic and photochemical properties, such as high refractive
index, high dielectric constant, and excellent optical transmittance in the visible and near-
IR region, high activity, strong oxidation capability, and chemical stability. In addition,
being a low cost material, TiO2 is favorable for potential large scale commercial
applications. However, the performance of TiO2 nanomaterials strongly relies on their
crystallinity, crystallite size, crystal structure, specific surface area, thermal stability and
quantum efficiency. Bulk modifications such as cation or anion doping have been found
very effective to improve the properties of TiO2 to enhance their performance. Several
different processing techniques have been used for the preparation of TiO2-based
nanostructures, such as template techniques, hydrothermal processes, and soft chemical
processes. However, each of these methods has limitations. Due to these limitations,
alternative processes using a green solvent such as supercritical carbon dioxide (scCO2) is
attractive to synthesize TiO2-based nanomaterials. The main objective of this project was
to develop a synthesis route to produce superior quality TiO2 based nanomaterials by
introducing Zr, Fe and N as doping materials. Another important aspect of this study was
50
the investigation of the use of scCO2 which is a green solvent, as an alternative to the
conventional toxic organic solvents in nanomaterial synthesis.
The following have been identified as the specific objectives of this project:
I. Synthesis of the following three different types of nanomaterials using an acid
modified sol-gel technique in scCO2:
a. Binary ZrO2-TiO2
b. Zr modified and N doped TiO2
c. Fe doped TiO2
II. Characterization of the synthesized nanomaterials using different physical and
chemical techniques in order to,
a. Study the surface characteristics, morphology, composition and electronic
properties.
b. Investigate the effects of different operating variables and doping agents
(ions) on the properties.
III. Development of a kinetics model for the solid-state reactions involved during heat
treatment of the synthesized nanomaterials and estimation of the kinetic
parameters.
IV. Evaluation of the performance of selective nanomaterials as photocatalysts for the
degradation of methylene blue (a model compound).
51
CHAPTER 3
EXPERIMENTAL METHODS
3. Introduction
In this chapter, the experimental procedures followed in this investigation are
described sequentially, and divided into two main sections; (i) synthesis of TiO2 based
nanomaterials, and (ii) characterization techniques and evaluation procedures used to
analyze the synthesized nanomaterials. The materials used, and the general procedures
followed to synthesize the nanomaterials are described in section 3.1. The nanomaterials
were synthesized in a high-pressure view cell reactor. The high-pressure reactor was
connected with CO2 along with having temperature and pressure controllers. Detailed
information about the experimental set-up used to synthesize the nanomaterials is also
reported in this section. Characterization methods of the synthesized materials include:
Scanning Electron Microscopy (SEM), Transmission Electron Microscopy (TEM), High
Resolution TEM (HRTEM), ThermoGravimetric Analysis (TGA), Differential Thermal
Analysis (DTA), powder ATR-FTIR, Energy Dispersive X-ray (EDX) and X-ray Photon
Spectroscopy (XPS), powder X-ray Diffraction (XRD), Temperature Programmed
Desorption (TPD) and UV-Vis analysis, Differential Scanning Calorimeter (DSC), and
N2 physisorption. In situ attenuate total reflection Fourier transmission infrared
spectroscopy (ATR-FTIR) was also used to study the reaction mechanism. The detailed
information on these characterization methods are described in section 3.2.
52
3.1. Synthesis of TiO2 Based Nanomaterials
In this investigation, Zr modified TiO2 nanotubes, Fe doped TiO2, and Zr
modified N doped TiO2 were synthesized by an acid modified sol-gel process in scCO2
for potential solar related applications. The materials and procedure used for this study
are given in the following sections.
3.1.1. Materials
Zr modified TiO2 was synthesized using a reagent grade 97% titanium(IV)
isopropoxide (TIP), and 70% zirconium(IV) propoxide (ZPO) as TiO2, and ZrO2
precursors, respectively.
In the synthesis of Fe doped TiO2, reagent grade 97% titanium(IV) isopropoxide
(TIP) was used as the TiO2 precursor. Given that Fe(NO3)3·9H2O is a solid material, 1 wt
% solution of Fe(NO3)3·9H2O was prepared by dissolving 1g of Fe(NO3)3·9H2O in 99g
of isopropanol, which was used as the stock solution.
In the case of N doped TiO2 synthesis, 99% triethylamine (TEA) was used as the
nitrogen source. Generally, acetic acid was used as the polycondensation agent and
scCO2 as solvent throughout the study. However, 98.5% hexane, 99% xylenes, 99.5%
isopropanol, and anhydrous ethanol were also used as solvents in the solvent effect study.
All chemicals were purchased from Aldrich Chemical Co and used without further
purification.
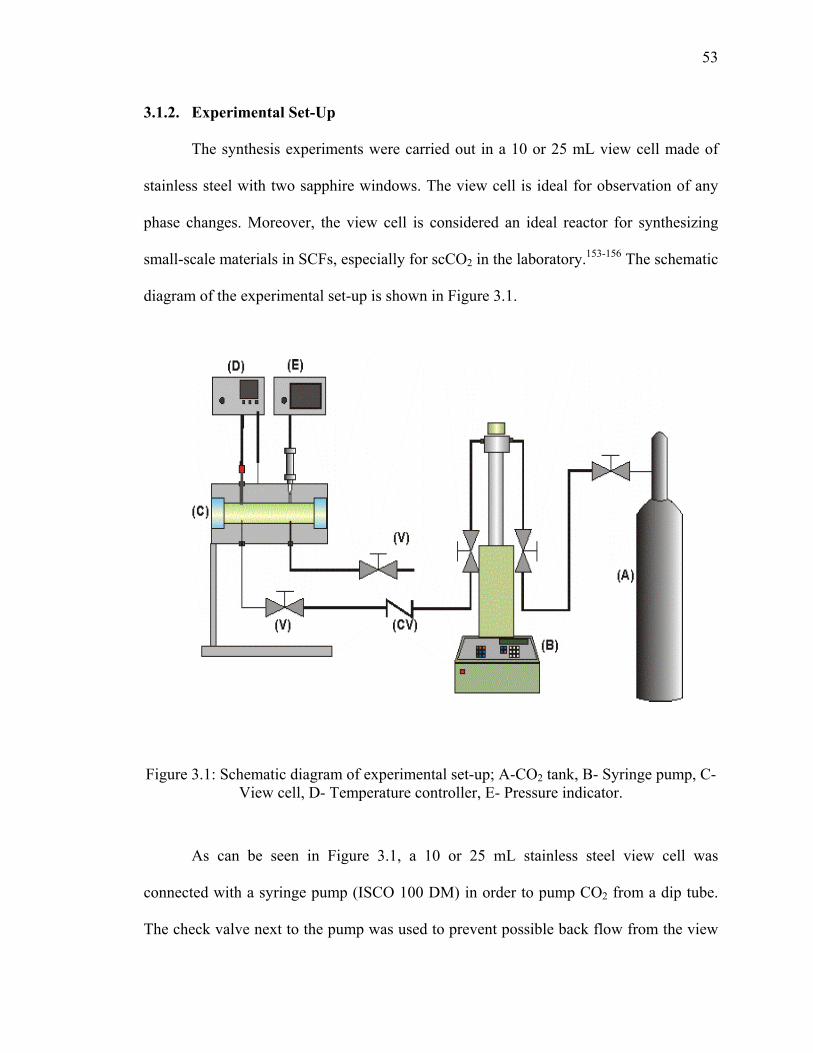
53
3.1.2. Experimental Set-Up
The synthesis experiments were carried out in a 10 or 25 mL view cell made of
stainless steel with two sapphire windows. The view cell is ideal for observation of any
phase changes. Moreover, the view cell is considered an ideal reactor for synthesizing
small-scale materials in SCFs, especially for scCO2 in the laboratory.153-156 The schematic
diagram of the experimental set-up is shown in Figure 3.1.
Figure 3.1: Schematic diagram of experimental set-up; A-CO2 tank, B- Syringe pump, C- View cell, D- Temperature controller, E- Pressure indicator.
As can be seen in Figure 3.1, a 10 or 25 mL stainless steel view cell was
connected with a syringe pump (ISCO 100 DM) in order to pump CO2 from a dip tube.
The check valve next to the pump was used to prevent possible back flow from the view
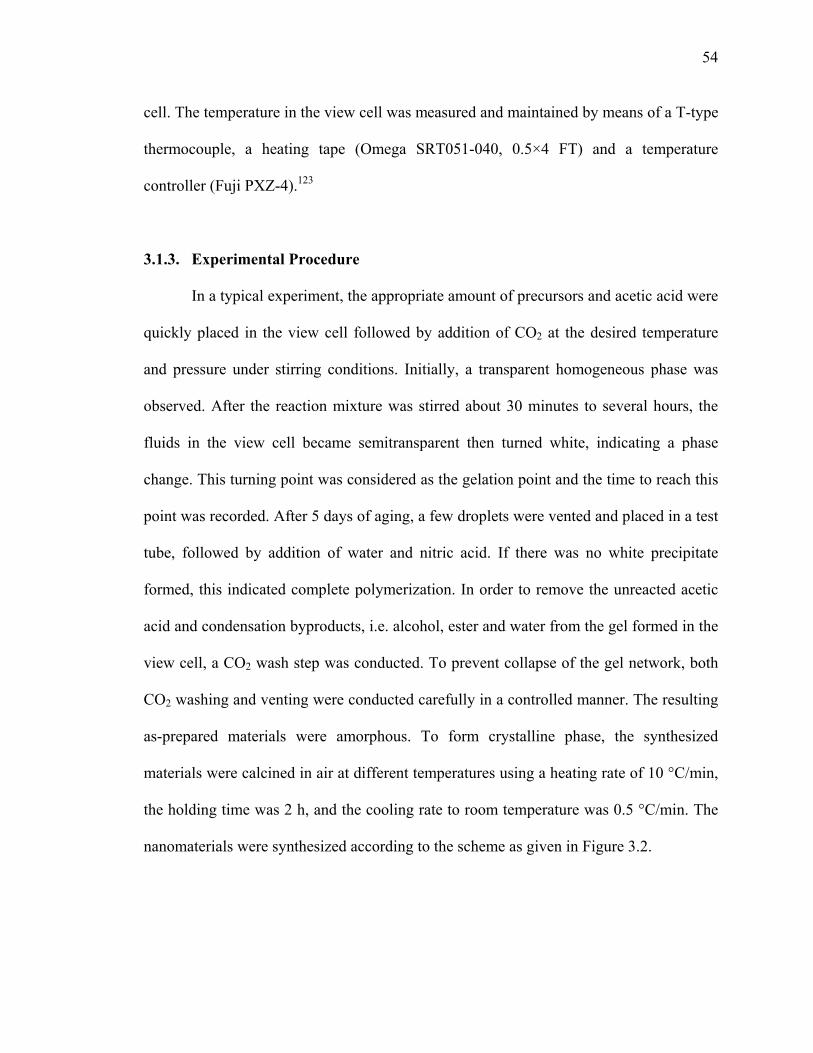
54
cell. The temperature in the view cell was measured and maintained by means of a T-type
thermocouple, a heating tape (Omega SRT051-040, 0.5×4 FT) and a temperature
controller (Fuji PXZ-4).123
3.1.3. Experimental Procedure
In a typical experiment, the appropriate amount of precursors and acetic acid were
quickly placed in the view cell followed by addition of CO2 at the desired temperature
and pressure under stirring conditions. Initially, a transparent homogeneous phase was
observed. After the reaction mixture was stirred about 30 minutes to several hours, the
fluids in the view cell became semitransparent then turned white, indicating a phase
change. This turning point was considered as the gelation point and the time to reach this
point was recorded. After 5 days of aging, a few droplets were vented and placed in a test
tube, followed by addition of water and nitric acid. If there was no white precipitate
formed, this indicated complete polymerization. In order to remove the unreacted acetic
acid and condensation byproducts, i.e. alcohol, ester and water from the gel formed in the
view cell, a CO2 wash step was conducted. To prevent collapse of the gel network, both
CO2 washing and venting were conducted carefully in a controlled manner. The resulting
as-prepared materials were amorphous. To form crystalline phase, the synthesized
materials were calcined in air at different temperatures using a heating rate of 10 °C/min,
the holding time was 2 h, and the cooling rate to room temperature was 0.5 °C/min. The
nanomaterials were synthesized according to the scheme as given in Figure 3.2.
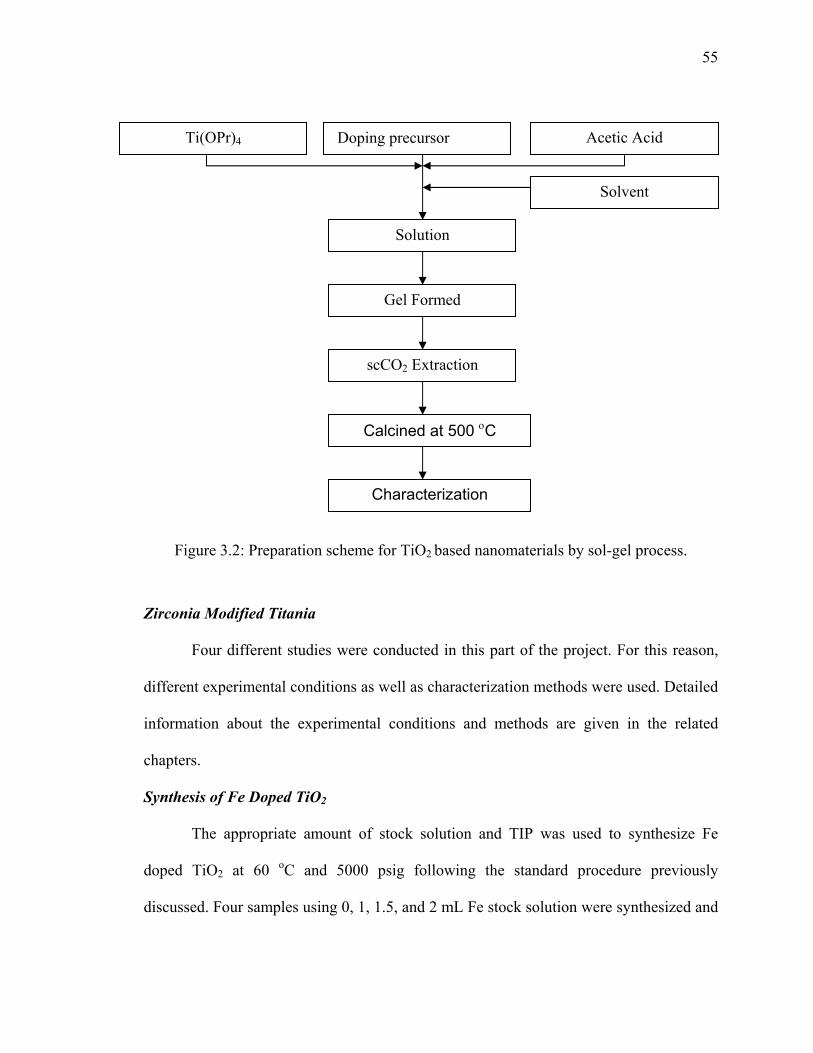
55
Figure 3.2: Preparation scheme for TiO2 based nanomaterials by sol-gel process.
Zirconia Modified Titania
Four different studies were conducted in this part of the project. For this reason,
different experimental conditions as well as characterization methods were used. Detailed
information about the experimental conditions and methods are given in the related
chapters.
Synthesis of Fe Doped TiO2
The appropriate amount of stock solution and TIP was used to synthesize Fe
doped TiO2 at 60 oC and 5000 psig following the standard procedure previously
discussed. Four samples using 0, 1, 1.5, and 2 mL Fe stock solution were synthesized and
Ti(OPr)4
Gel Formed
Solution
Doping precursor
Solvent
Acetic Acid
Characterization
scCO2 Extraction
Calcined at 500 οC
56
named S1, S2, S3 and S4, respectively. The synthesized materials were calcined at 400,
500, and 600 oC to investigate the heat effects.
Nitrogen Doped Titania
The synthesis procedure for preparing N-doped TiO2 was the same as the Zr
modifided TiO2 procedure previously discussed with the appropriate amount of TEA
added as the N precursor to the system. In this study, six samples were prepared and
named as TiO2, TiO2-N1 and TiO2-N2 respectively, based on the amount of triethylamine
used in the preparation step. The amount of TEA was 0.4 and 0.6 molar ratio to metal
precursor for N1 and N2 named samples respectively.
3.2. Characterization Methods
3.2.1. Electron Microscopy
An electron microscope, such as a transmission electron microscope (TEM), or a
scanning electron microscope (SEM), is a microscope that uses a beam of electrons to
illuminate a specimen and create an enlarged image, which provides the surface and
internal information on a nanometer scale. Electron microscopes have much greater
resolving power than light microscopes, and can obtain much higher magnifications. The
electron microscope is extensively used for inspection, quality assurance and failure
analysis applications in industry, in particular, for microelectronic device fabrication.
TEM and SEM have made crucial contributions to science and engineering, and made
them indispensable tools in nanotechnology for analyzing nanostructures.
Transmission Electron Microscopy (TEM): In 1931, Knoll and Ruska built the
first electron microscope prototype. In 1938, Eli Franklin Burton built the first practical

57
electron microscope and in 1939, Siemens produced the first commercial TEM. However,
the TEM was not used for material studies until 40 years ago, when the thin-foil
preparation technique was developed. More improvements of the TEM technique in the
1990s provided 0.1 nm of resolution, which made TEM an indispensable analysis
technique for studying materials in the micron or nano size region.123
Usually the incident electrons interact with a specimen and X-ray, cathode
luminescence and six type of electrons: (1) transmission, (2) back-scattered, (3) reflected,
(4) secondary, (5) Auger and (6) trapped electrons are generated (Figure 3.3). The
transmission and scattered electrons are collected for TEM imaging.123
Figure 3.3: Schematic interactions of a specimen with incident electrons
TEM is the only technique allowing a 3D observation and quantitative
characterization of most kinds of lattice defects. Its high spatial resolution for orientation
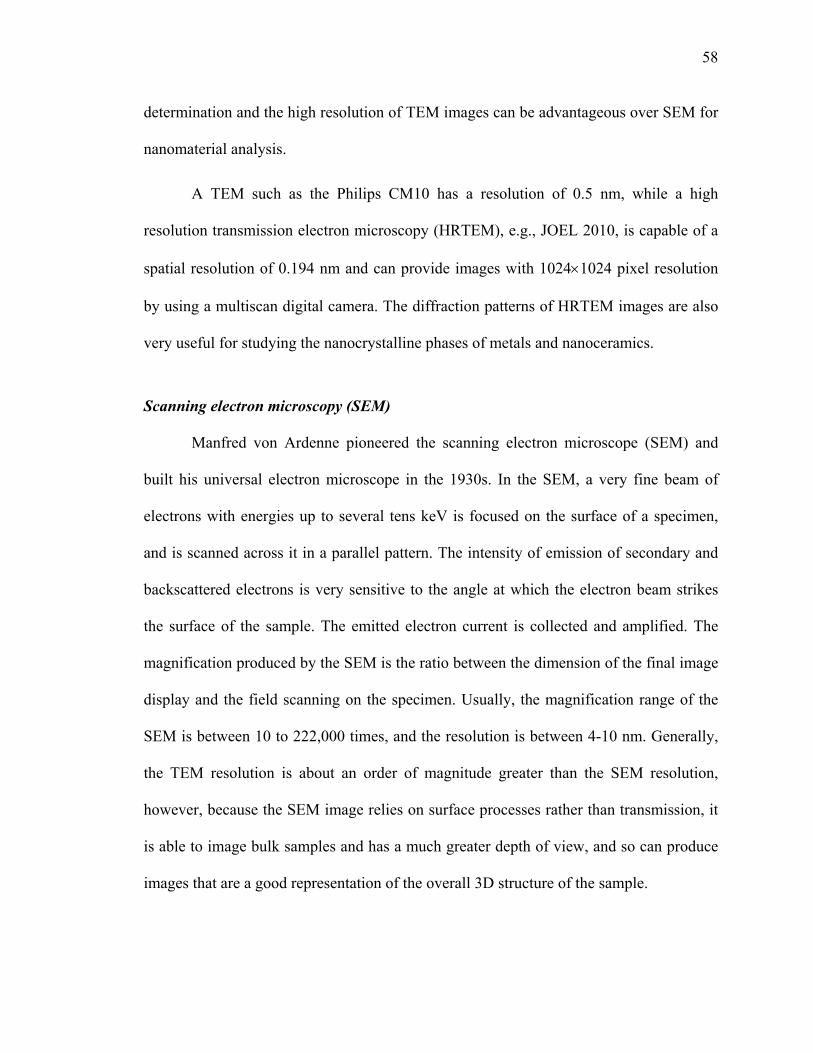
58
determination and the high resolution of TEM images can be advantageous over SEM for
nanomaterial analysis.
A TEM such as the Philips CM10 has a resolution of 0.5 nm, while a high
resolution transmission electron microscopy (HRTEM), e.g., JOEL 2010, is capable of a
spatial resolution of 0.194 nm and can provide images with 1024×1024 pixel resolution
by using a multiscan digital camera. The diffraction patterns of HRTEM images are also
very useful for studying the nanocrystalline phases of metals and nanoceramics.
Scanning electron microscopy (SEM)
Manfred von Ardenne pioneered the scanning electron microscope (SEM) and
built his universal electron microscope in the 1930s. In the SEM, a very fine beam of
electrons with energies up to several tens keV is focused on the surface of a specimen,
and is scanned across it in a parallel pattern. The intensity of emission of secondary and
backscattered electrons is very sensitive to the angle at which the electron beam strikes
the surface of the sample. The emitted electron current is collected and amplified. The
magnification produced by the SEM is the ratio between the dimension of the final image
display and the field scanning on the specimen. Usually, the magnification range of the
SEM is between 10 to 222,000 times, and the resolution is between 4-10 nm. Generally,
the TEM resolution is about an order of magnitude greater than the SEM resolution,
however, because the SEM image relies on surface processes rather than transmission, it
is able to image bulk samples and has a much greater depth of view, and so can produce
images that are a good representation of the overall 3D structure of the sample.
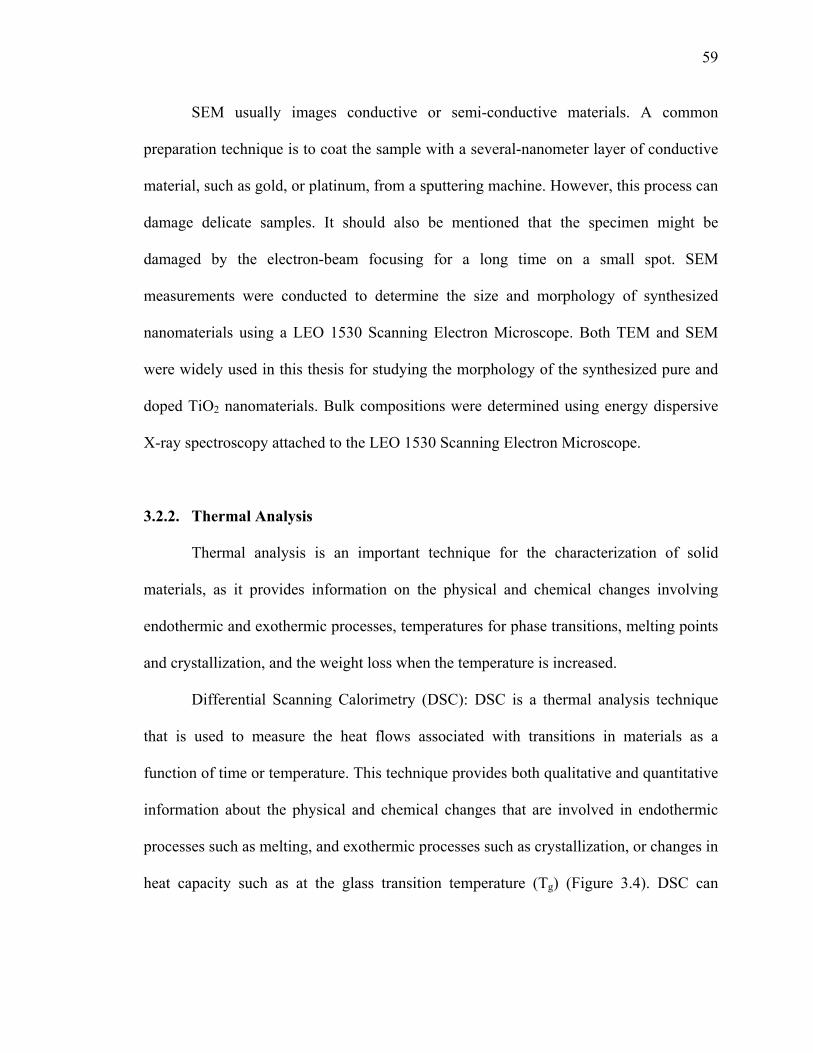
59
SEM usually images conductive or semi-conductive materials. A common
preparation technique is to coat the sample with a several-nanometer layer of conductive
material, such as gold, or platinum, from a sputtering machine. However, this process can
damage delicate samples. It should also be mentioned that the specimen might be
damaged by the electron-beam focusing for a long time on a small spot. SEM
measurements were conducted to determine the size and morphology of synthesized
nanomaterials using a LEO 1530 Scanning Electron Microscope. Both TEM and SEM
were widely used in this thesis for studying the morphology of the synthesized pure and
doped TiO2 nanomaterials. Bulk compositions were determined using energy dispersive
X-ray spectroscopy attached to the LEO 1530 Scanning Electron Microscope.
3.2.2. Thermal Analysis
Thermal analysis is an important technique for the characterization of solid
materials, as it provides information on the physical and chemical changes involving
endothermic and exothermic processes, temperatures for phase transitions, melting points
and crystallization, and the weight loss when the temperature is increased.
Differential Scanning Calorimetry (DSC): DSC is a thermal analysis technique
that is used to measure the heat flows associated with transitions in materials as a
function of time or temperature. This technique provides both qualitative and quantitative
information about the physical and chemical changes that are involved in endothermic
processes such as melting, and exothermic processes such as crystallization, or changes in
heat capacity such as at the glass transition temperature (Tg) (Figure 3.4). DSC can

60
determine the Tg of polymers and the phase transition temperatures of solids. This makes
DSC an indispensable technique for the characterization of polymer and oxide materials.
An alternative technique which shares much in common with DSC is differential
thermal analysis (DTA). In this method, the heat flow to the sample and the reference
remains constant, with the instrument measuring the temperature difference. When the
sample and reference are heated, identical phase changes and other thermal processes
cause a difference in temperature between the sample and reference. Both DSC and DTA
provide similar information; however, DSC is the more widely used technique amongst
these two techniques. As the temperature increases, an amorphous solid becomes less
viscous. At some point the molecules may obtain enough freedom of motion to
spontaneously arrange themselves into a crystalline form. This is known as the
crystallization temperature (Tc). This transition from amorphous solid to crystalline solid
is an exothermic process, and results in a peak in the DSC/DTA signal. As the
temperature increases, the sample eventually reaches its melting point (Tm). The melting
process results in an endothermic peak in the DSC/DTA curve. The ability to determine
the transition temperatures and enthalpies makes DSC/DTA an invaluable tool in
producing phase diagrams for various chemical systems measuring any changes of the
sample weight with increasing temperature.
Thermogravimetric Analysis (TGA): TGA, another important thermal technique,
is widely used for the characterization of solid materials including polymer, organic,
inorganic and composite materials. Especially, TGA can be used to determine the
percentage of inorganic fillers in inorganic/polymer composites.
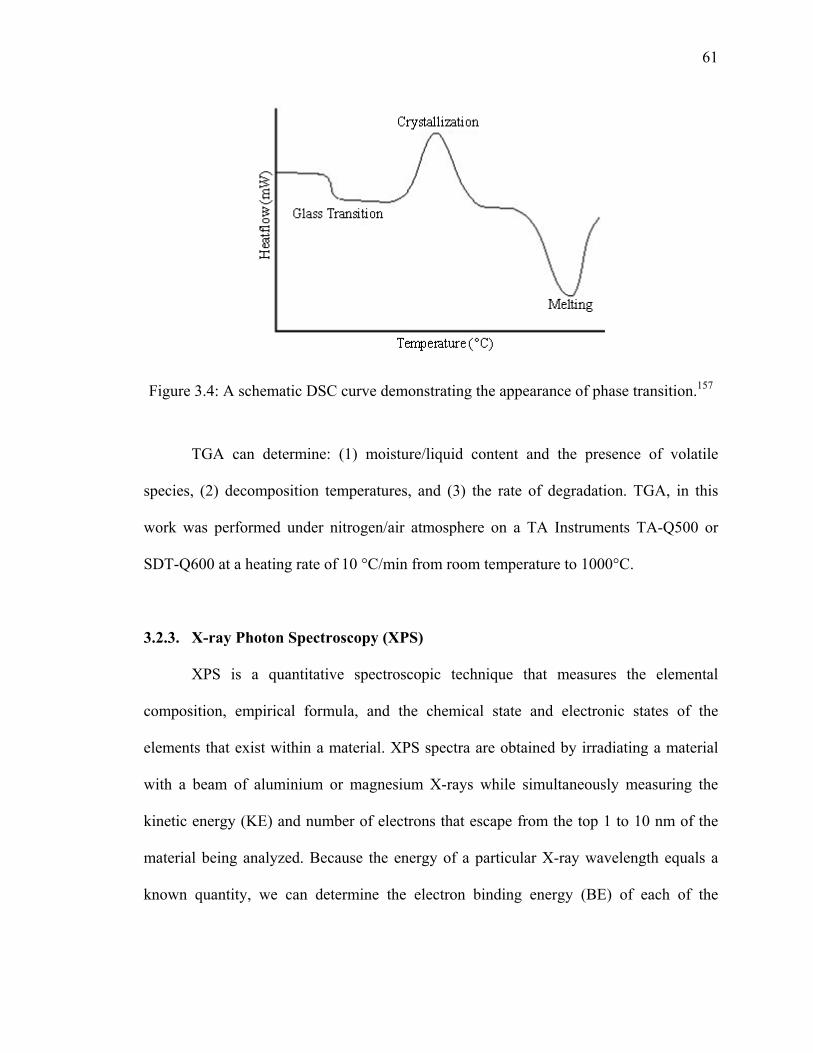
61
Figure 3.4: A schematic DSC curve demonstrating the appearance of phase transition.157
TGA can determine: (1) moisture/liquid content and the presence of volatile
species, (2) decomposition temperatures, and (3) the rate of degradation. TGA, in this
work was performed under nitrogen/air atmosphere on a TA Instruments TA-Q500 or
SDT-Q600 at a heating rate of 10 °C/min from room temperature to 1000°C.
3.2.3. X-ray Photon Spectroscopy (XPS)
XPS is a quantitative spectroscopic technique that measures the elemental
composition, empirical formula, and the chemical state and electronic states of the
elements that exist within a material. XPS spectra are obtained by irradiating a material
with a beam of aluminium or magnesium X-rays while simultaneously measuring the
kinetic energy (KE) and number of electrons that escape from the top 1 to 10 nm of the
material being analyzed. Because the energy of a particular X-ray wavelength equals a
known quantity, we can determine the electron binding energy (BE) of each of the
62
emitted electrons by using an equation that is based on the work of Ernest Rutherford
(1914):
Ebinding = Ephoton - Ekinetic - Φ 3.1
where Ebinding is the energy of the electron emitted from one electron configuration within
the atom, Ephoton is the energy of the X-ray photons being used, Ekinetic is the kinetic
energy of the emitted electron as measured by the instrument, and Φ is the work function
of the spectrometer. It is important to note that XPS detects only those electrons that have
actually escaped into the vacuum of the instrument. The photo-emitted electrons that
have escaped into the vacuum of the instrument are those that originated from within the
top 10 to 12 nm of the material. All of the deeper photo-emitted electrons, which were
generated from the X-rays which penetrated 1–5 micrometers into the material, are either
recaptured or trapped in various excited states within the material. For most applications,
XPS is a non-destructive technique to measure the surface chemistry of any inorganic
compounds, metal alloys, semiconductors, polymers, or catalysts. Figure 3.5 represents a
typical XPS spectrum which gives valuable information on the surface composition. XPS
is a very useful technique especially for multicomponent samples such as the binary
metal oxides, Fe doped TiO2, and N-doped TiO2 synthesized in this study.
The surface composition was determined by XPS using a Kratos Axis Ultra
spectrometer using a monochromatic Al K (alpha) source (15 mA, 14 kV). Survey and
high-resolution spectra were obtained using an analysis area of ~300x700 microns and
pass energies of 160 eV and 20 eV, respectively. Spectra were charge corrected to the
main line of the carbon 1s spectrum (C-C, C-H) set to 285.0 eV.

63
Figure 3.5: A typical high resolution XPS spectrum with corresponding information.
3.2.4. Powder X-Ray Diffraction (XRD)
Powder XRD is one of the primary techniques used to characterize solid-state
materials. It can provide valuable information about the crystalline phase and average
crystallite size. The crystal size measured by this technique is smaller than the
measurement limit of the optical or electronic microscope.158 The structure of a crystal is
analyzed by the X-ray diffraction patterns. The X-ray diffraction of a crystal can be
formulated by means of Bragg’s law (Figure 3.6):
λθ ndSin =2 3.2
where d is the d-spacing, perpendicular distance between pairs of adjacent planes in the
crystal, θ is the incident angle, n is the layer of planes, and λ is the wavelength of the
X-rays.
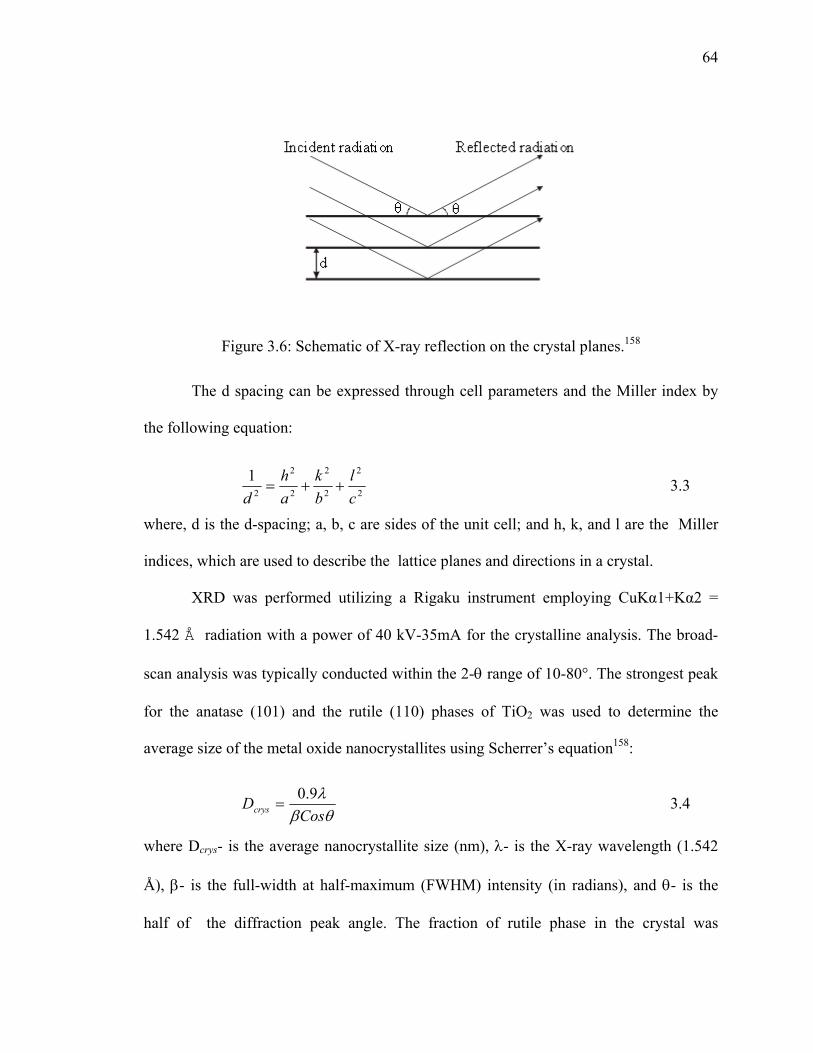
64
Figure 3.6: Schematic of X-ray reflection on the crystal planes.158
The d spacing can be expressed through cell parameters and the Miller index by
the following equation:
2
2
2
2
2
2
2
1cl
bk
ah
d++= 3.3
where, d is the d-spacing; a, b, c are sides of the unit cell; and h, k, and l are the Miller
indices, which are used to describe the lattice planes and directions in a crystal.
XRD was performed utilizing a Rigaku instrument employing CuKα1+Kα2 =
1.542 Å radiation with a power of 40 kV-35mA for the crystalline analysis. The broad-
scan analysis was typically conducted within the 2-θ range of 10-80°. The strongest peak
for the anatase (101) and the rutile (110) phases of TiO2 was used to determine the
average size of the metal oxide nanocrystallites using Scherrer’s equation158:
θβλ
CosDcrys
9.0= 3.4
where Dcrys- is the average nanocrystallite size (nm), λ- is the X-ray wavelength (1.542
Å), β- is the full-width at half-maximum (FWHM) intensity (in radians), and θ- is the
half of the diffraction peak angle. The fraction of rutile phase in the crystal was

65
calculated using the integrated intensities of the anatase (101) (Ia) and rutile (110) (Ir)
peaks by the following formula developed by Spur and Myers.159
)(1
1
r
arutile
IIK
X+
= 3.5
3.2.5. Raman Spectroscopy
Raman spectroscopy is used in condensed matter physics and chemistry to study
vibrational, rotational, and other low-frequency modes in a system. It relies on inelastic
scattering, or Raman scattering of monochromatic light, usually from a laser. The laser
light interacts with phonons or other excitations in the system, resulting in the energy of
the laser photons being shifted up or down. The shift in energy gives information about
the phonon modes in the system. Infrared spectroscopy yields similar, but complementary
information.
For a molecule to exhibit a Raman Effect, a change in polarizability or the amount
of deformation of the electron cloud with respect to the vibrational coordinate, is
required. The amount of the polarizability change will determine the Raman scattering
intensity, whereas the Raman shift is equal to the vibrational level that is involved.
Raman spectroscopy is commonly used in chemistry, since vibrational information is
very specific for the chemical bonds in molecules. In solid state physics, Raman
spectroscopy is used to, amongst other things, characterize materials, measure
temperature, and find the crystallographic orientation of a sample. In this study the
samples were analyzed using a Renishaw Model 2000 Raman spectrometer equipped
with a 633 nm laser. The power at the sample varied between 0.2 and 0.5 mW with the
beam defocused to an area of approximately 5-10 microns in diameter.

66
3.2.6. N2 Physisorption
The textural characterization, such as surface area, pore volume and the pore size
distribution of the as-prepared aerogels and oxides were obtained by N2 physisorption at
77 K using a Micromeritics ASAP 2010. Prior to N2 physisorption, the samples were
degassed at 200 °C under vacuum for 2 hours. From the N2 adsorption isotherms, the
specific surface area was calculated. The mesopore volume (VBJH), the average pore
diameters (Dpore), and the pore size distributions were estimated by the Barret–Joyner–
Halenda (BJH) method applied to the desorption branch of the isotherm. Below is
presented some theoretical information related to the surface area and pore volume
calculations used in this thesis.
BET Surface Area
When a highly dispersed solid is exposed in a closed space to a gas or vapor at
some definite pressure, the solid begins to adsorb the gas. Adsorption on porous materials
proceeds via monolayer adsorption followed by multilayer adsorption and capillary
condensation.160 At a low relative pressure, a monolayer of adsorbent is absorbed on the
surface like non porous materials. The amount of adsorbent is used to calculate the
surface area. Using the Brunauer, Emmett and Teller (BET) theory, one can calculate the
specific surface area of a solid sample from the number of monolayer gas molecules
required to cover the solid surface, and the cross-sectional area of the gas molecule being
adsorbed.
The BET equation is written as:
mm PP
cPP υυυ11
]1)/[(1
00
+⎟⎟⎠
⎞⎜⎜⎝
⎛=
− 3.6
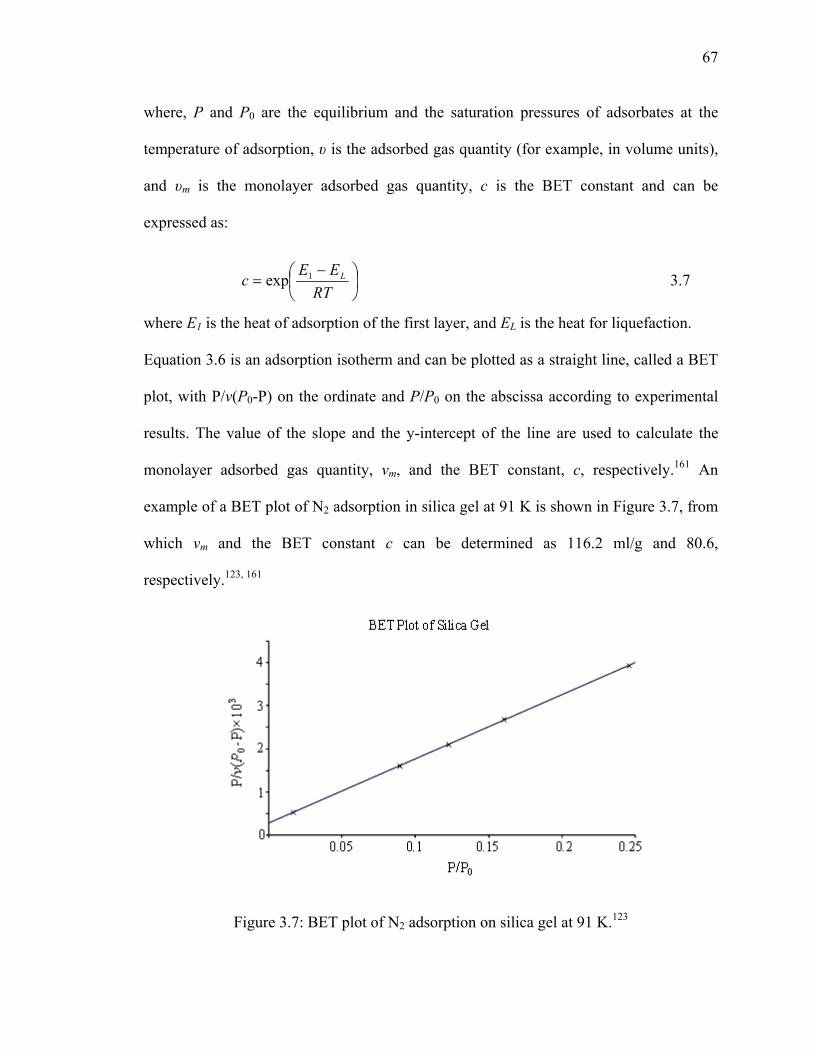
67
where, P and P0 are the equilibrium and the saturation pressures of adsorbates at the
temperature of adsorption, υ is the adsorbed gas quantity (for example, in volume units),
and υm is the monolayer adsorbed gas quantity, c is the BET constant and can be
expressed as:
⎟⎠⎞
⎜⎝⎛ −
=RT
EEc L1exp 3.7
where E1 is the heat of adsorption of the first layer, and EL is the heat for liquefaction.
Equation 3.6 is an adsorption isotherm and can be plotted as a straight line, called a BET
plot, with P/v(P0-P) on the ordinate and P/P0 on the abscissa according to experimental
results. The value of the slope and the y-intercept of the line are used to calculate the
monolayer adsorbed gas quantity, vm, and the BET constant, c, respectively.161 An
example of a BET plot of N2 adsorption in silica gel at 91 K is shown in Figure 3.7, from
which vm and the BET constant c can be determined as 116.2 ml/g and 80.6,
respectively.123, 161
Figure 3.7: BET plot of N2 adsorption on silica gel at 91 K.123
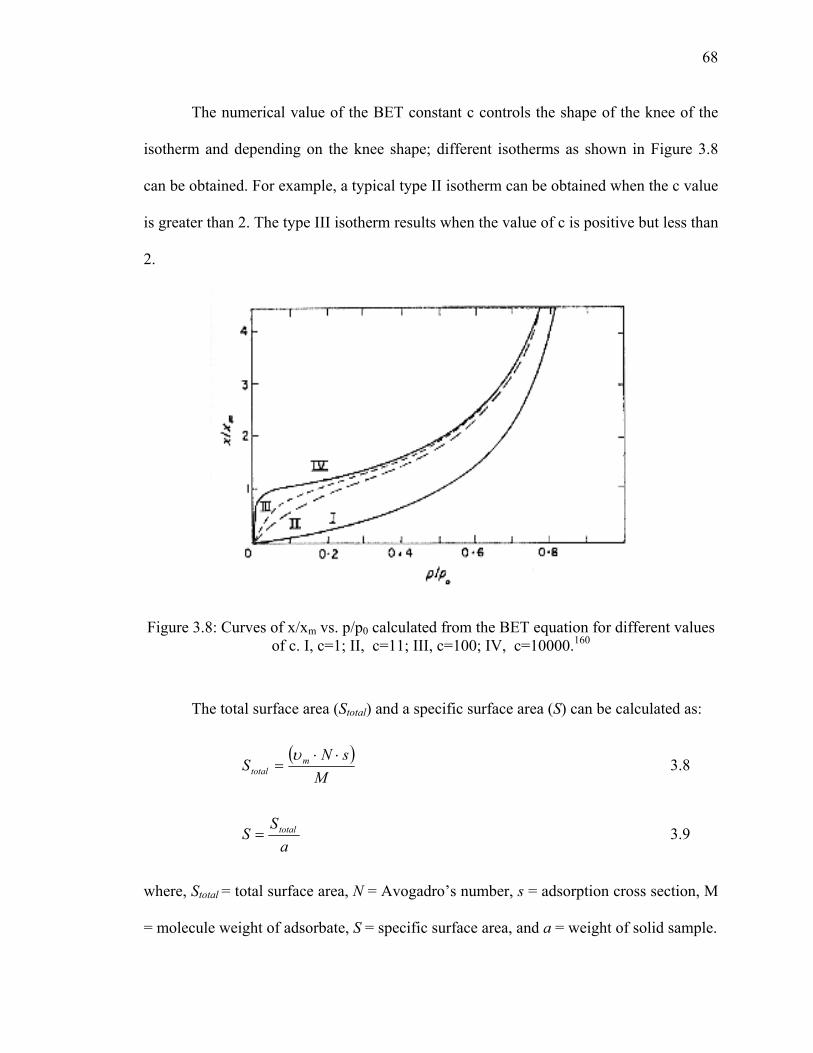
68
The numerical value of the BET constant c controls the shape of the knee of the
isotherm and depending on the knee shape; different isotherms as shown in Figure 3.8
can be obtained. For example, a typical type II isotherm can be obtained when the c value
is greater than 2. The type III isotherm results when the value of c is positive but less than
2.
Figure 3.8: Curves of x/xm vs. p/p0 calculated from the BET equation for different values of c. I, c=1; II, c=11; III, c=100; IV, c=10000.160
The total surface area (Stotal) and a specific surface area (S) can be calculated as:
( )M
sNS m
total⋅⋅
=υ
3.8
aS
S total= 3.9
where, Stotal = total surface area, N = Avogadro’s number, s = adsorption cross section, M
= molecule weight of adsorbate, S = specific surface area, and a = weight of solid sample.
69
BJH Pore-Size Distribution and Pore Volume
According to the IUPAC definitions, microporous, mesoporous and macroporous
materials exhibit pore diameters of less than 2 nm, in the range of 2-50 nm and above 50
nm, respectively.160
During a physisorption process, beyond a monolayer formation, the amount of
adsorbed gas gradually increases as the relative pressure increases, and then at higher
pressures, the amount of gas adsorbed increases steeply due to capillary condensation in
the mesopores. Once these pores are filled, the adsorption isotherm is complete. The
capillary condensation is believed to be proportional to the equilibrium gas pressure and
the size of the pores inside the solid. The Barrett, Joyner and Halenda (BJH)
computational method allows the determination of pore sizes from the equilibrium gas
pressures. The BJH method for calculation of pore size distribution is based on a model
of the adsorbent exhibiting cylindrical pores.162 During desorption, a pore loses its
condensed liquid adsorbates, known as the core of the pore, at a particular relative
pressure related to the core radius by the Kelvin equation (Equation 3.10).
kk rrTV
PP 14.4
303.210316.82log 7
0
−=
××××−
=⎟⎟⎠
⎞⎜⎜⎝
⎛ σ 3.10
where, σ is the surface tension of liquid nitrogen, V is the liquid molar volume of
nitrogen, rk is the radius of capillary in cm, T is the absolute temperature in K, and
8.316×10⁷ is the gas constant in ergs per degree.
After the core is evaporated, a layer of adsorbate remains on the wall of the pore.
The thickness of this layer can be calculated for a particular relative pressure from a

70
thickness equation. Using this approach, the pore size distribution and pore volume of
solid with various pore sizes can be determined.162
Hysteresis Loops
After an adsorption isotherm, the desorption isotherm can be generated by
withdrawing the adsorbed gas by reducing the pressure. However, capillary condensation
and capillary evaporations do not take place at the same pressure, resulting in hysteresis
loops. The resulting hysteresis loops can be mechanistically related to particular pore
shapes. Figure 3.9 shows the classification of hysteresis loops denoted as H1, H2, H3 and
H4 by IUPAC. Type H1 and H2 loops were obtained from agglomerated spherical
particles and corpuscular systems, respectively, while type H3 and H4 were obtained
from slit-shaped pores or plate-like particles.160
Figure 3.9: Classification of hysteresis loops as recommended by the IUPAC.
The relationship between the morphology of the pores and the hysteresis profile
has been previously studied using computational simulations. Although gas adsorption
techniques and the data analysis methods appear to be well established, it is still difficult
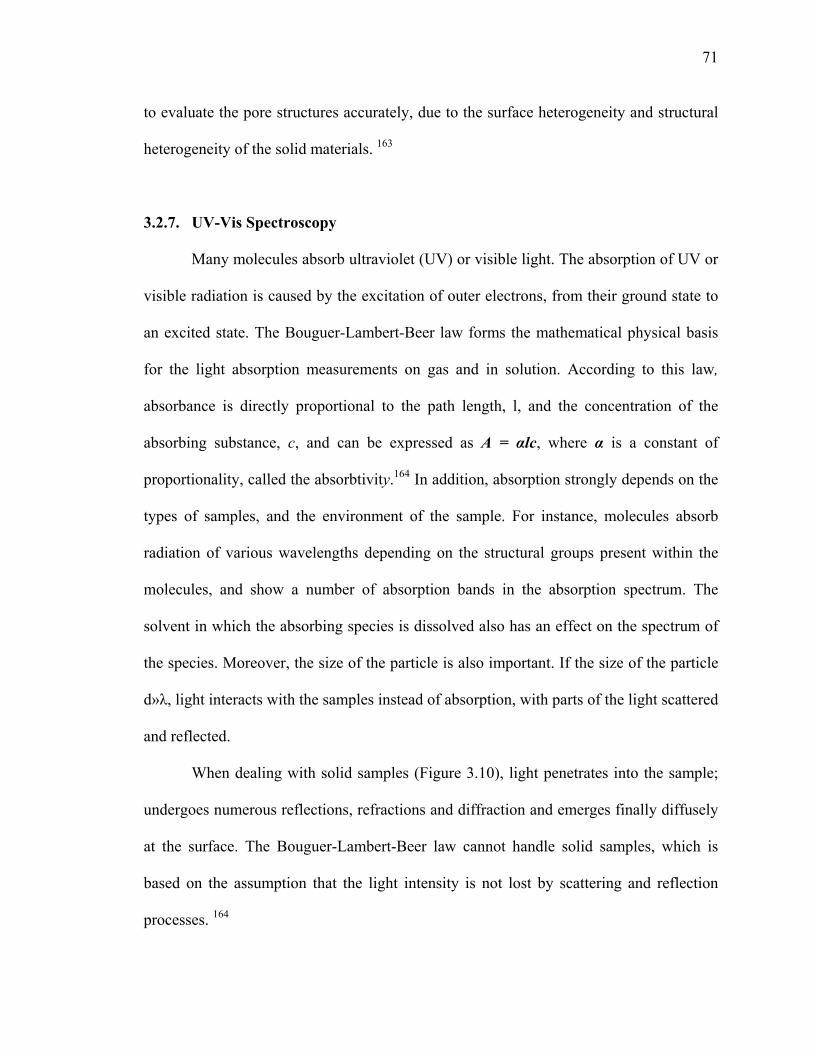
71
to evaluate the pore structures accurately, due to the surface heterogeneity and structural
heterogeneity of the solid materials. 163
3.2.7. UV-Vis Spectroscopy
Many molecules absorb ultraviolet (UV) or visible light. The absorption of UV or
visible radiation is caused by the excitation of outer electrons, from their ground state to
an excited state. The Bouguer-Lambert-Beer law forms the mathematical physical basis
for the light absorption measurements on gas and in solution. According to this law,
absorbance is directly proportional to the path length, l, and the concentration of the
absorbing substance, c, and can be expressed as A = αlc, where α is a constant of
proportionality, called the absorbtivity.164 In addition, absorption strongly depends on the
types of samples, and the environment of the sample. For instance, molecules absorb
radiation of various wavelengths depending on the structural groups present within the
molecules, and show a number of absorption bands in the absorption spectrum. The
solvent in which the absorbing species is dissolved also has an effect on the spectrum of
the species. Moreover, the size of the particle is also important. If the size of the particle
d»λ, light interacts with the samples instead of absorption, with parts of the light scattered
and reflected.
When dealing with solid samples (Figure 3.10), light penetrates into the sample;
undergoes numerous reflections, refractions and diffraction and emerges finally diffusely
at the surface. The Bouguer-Lambert-Beer law cannot handle solid samples, which is
based on the assumption that the light intensity is not lost by scattering and reflection
processes. 164

72
Diffuse reflectance measurements are usually analyzed on the basis of the
Kubelka-Munk equation:
RR
skRF
2)1()(
2−==∞ 3.11
where k and s are absorption and scattering coefficients respectively, and R is the
reflectance at the front face. F(R∞) is termed the Kubelka-Munk function and is
proportional to the concentration of the adsorbate molecules. From the onset of the plot
of Kubelka-Munk function vs wavelength or photoenergy, the band gap energy of a
semiconductor can be easily calculated. However, to measure a diffuse reflectance
spectrum, the diffusely reflected light must be collected with an integrated sphere,
avoiding secularly reflected light, and using a reference standard (BaSO4 or white
standard).
Figure 3.10: Interaction of light with solid sample.
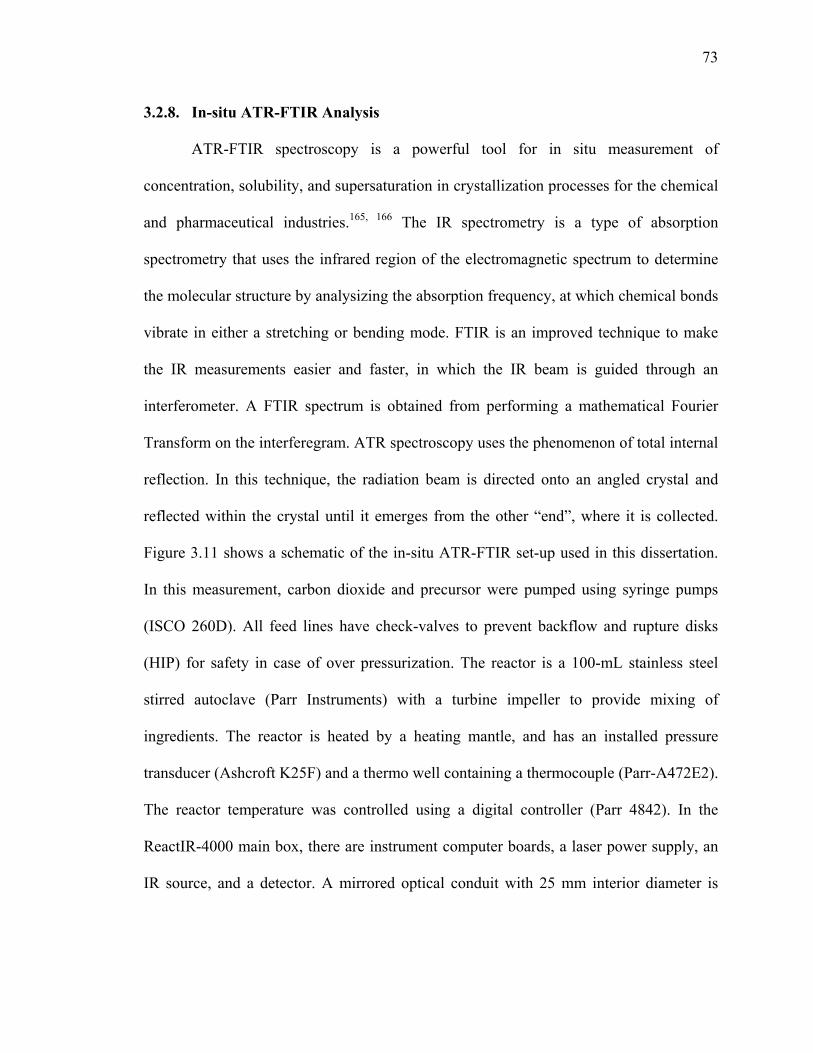
73
3.2.8. In-situ ATR-FTIR Analysis
ATR-FTIR spectroscopy is a powerful tool for in situ measurement of
concentration, solubility, and supersaturation in crystallization processes for the chemical
and pharmaceutical industries.165, 166 The IR spectrometry is a type of absorption
spectrometry that uses the infrared region of the electromagnetic spectrum to determine
the molecular structure by analysizing the absorption frequency, at which chemical bonds
vibrate in either a stretching or bending mode. FTIR is an improved technique to make
the IR measurements easier and faster, in which the IR beam is guided through an
interferometer. A FTIR spectrum is obtained from performing a mathematical Fourier
Transform on the interferegram. ATR spectroscopy uses the phenomenon of total internal
reflection. In this technique, the radiation beam is directed onto an angled crystal and
reflected within the crystal until it emerges from the other “end”, where it is collected.
Figure 3.11 shows a schematic of the in-situ ATR-FTIR set-up used in this dissertation.
In this measurement, carbon dioxide and precursor were pumped using syringe pumps
(ISCO 260D). All feed lines have check-valves to prevent backflow and rupture disks
(HIP) for safety in case of over pressurization. The reactor is a 100-mL stainless steel
stirred autoclave (Parr Instruments) with a turbine impeller to provide mixing of
ingredients. The reactor is heated by a heating mantle, and has an installed pressure
transducer (Ashcroft K25F) and a thermo well containing a thermocouple (Parr-A472E2).
The reactor temperature was controlled using a digital controller (Parr 4842). In the
ReactIR-4000 main box, there are instrument computer boards, a laser power supply, an
IR source, and a detector. A mirrored optical conduit with 25 mm interior diameter is

74
used to transmit the light between the IR source/detector and the diamond probe, which is
located at the bottom of the reactor.
Figure 3.11: Schematic of the reactor with the ATR-FTIR (A) computer; (B) FTIR; (C) temperature and RPM controller with pressure display; (D) 100 ml autoclave equipped
with diamond IR probe; (E) needle valves; (F) check valves; (G) syringe pump; (H) container for carboxylic acid; (I) CO2 cylinder.123
3.2.9. Temperature Programmed Desorption (TPD)
TPD characterizations are most commonly used to determine the number, type
and strength of active sites available on the surface of a solid material from
measurements of the amount of gas desorbed at various temperatures. In this study, this
technique was used to determine surface acidity from desorption of NH3. The sample was
degassed under argon flow. During TPD, the sample was saturated with NH3 at 40 oC
constant temperature by flowing NH3 gas. Physically adsorbed NH3 was removed by
flowing argon gas at a rate of 50 mL/min for one hour. The temperature of the sample

75
was increased from ambient to 750°C at a linear heating rate of 10°C/min under an argon
gas flow. A TCD detector analyzed the gas leaving the sample and chromatograms were
collected for pre-specified heating rates for each sample. After each experiment, the
sample was purged with argon flow at 300 ºC for 1 h.
3.2.10. Evaluation Procedure
Dyes are widely used in industry; therefore the elimination of these compounds is
becoming an increasingly important environmental problem. Methylene blue (MB, 0.05
wt % water solution, Sigma-Aldrich), was chosen as the model organic compound to
evaluate the photoactivity of the prepared TiO2 based nanomaterials. The catalytic
performance was evaluated under UV light irradiation using a 100 W high-pressure
mercury lamp (UVP, USA). The wavelength range and peak wavelength of the UV lamp
were 320–400 nm and 365 nm, respectively. Typically, a mixture of methylene blue
solution (15 µmol/L 100 mL) and 25 mg of catalyst was vigorously stirred for 30 min to
establish an adsorption/ desorption equilibrium. Then the reaction solution was stirred
under light irradiation. The temperature of the photocatalytic reaction was measured by
thermometer and found not to change significantly from room temperature. At given time
intervals, 3 mL aliquots were sampled and centrifuged to remove the particles. The
filtrates were analyzed by measuring the absorption band maximum (665 nm) using a
Cary 50 UV-vis spectrophotometer. The methylene blue concentration was calculated by
using a calibration curve (Appendix 8) according to the absorbance intensity at 665 nm in
the photocatalytic process. The blank reaction was carried out following the same
procedure without adding catalyst. Repeat tests were run to ensure data reliability.
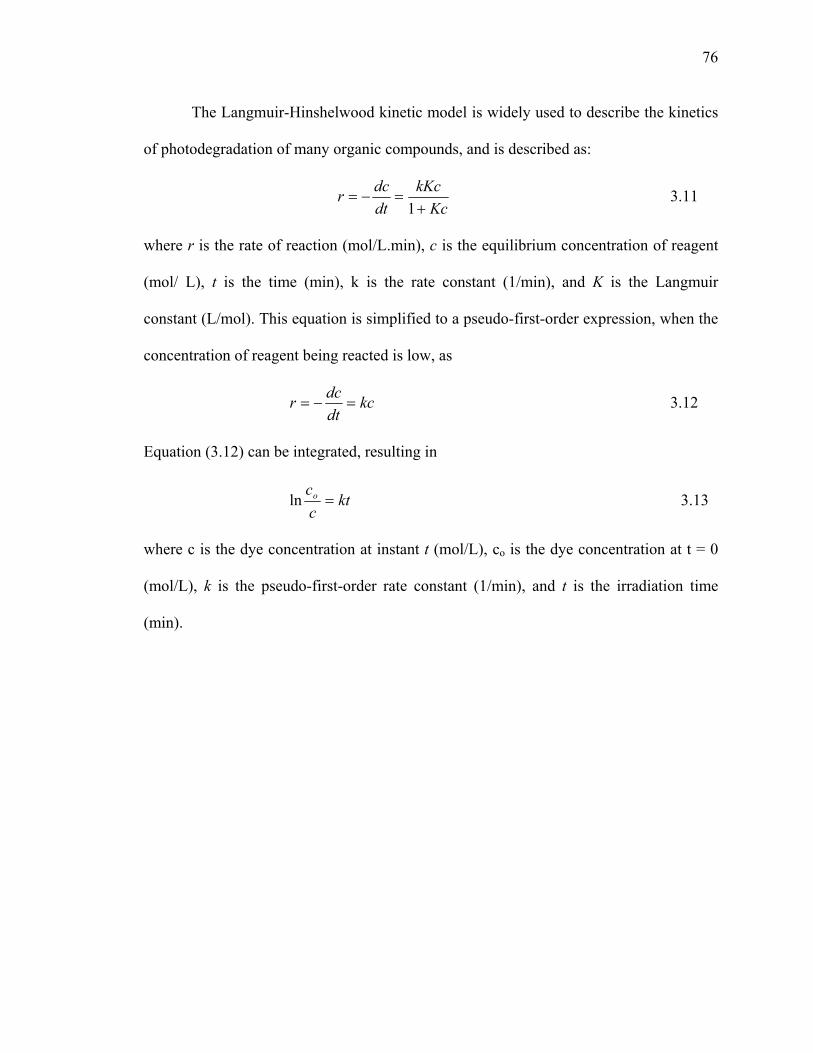
76
The Langmuir-Hinshelwood kinetic model is widely used to describe the kinetics
of photodegradation of many organic compounds, and is described as:
KckKc
dtdcr
+=−=
1 3.11
where r is the rate of reaction (mol/L.min), c is the equilibrium concentration of reagent
(mol/ L), t is the time (min), k is the rate constant (1/min), and K is the Langmuir
constant (L/mol). This equation is simplified to a pseudo-first-order expression, when the
concentration of reagent being reacted is low, as
kcdtdcr =−= 3.12
Equation (3.12) can be integrated, resulting in
ktcco =ln 3.13
where c is the dye concentration at instant t (mol/L), co is the dye concentration at t = 0
(mol/L), k is the pseudo-first-order rate constant (1/min), and t is the irradiation time
(min).
77
CHAPTER 4
EFFECTS OF Zr DOPING IN TiO2 NANOMATERIALS
4. Introduction
Recently, considerable effort has been devoted to synthesizing materials
with one dimensional (1D) nanostructures due to their unique properties and potential
applications in a diversity of areas including catalysis, high efficiency solar cells,
coatings, and sensors.167 Particularly, TiO2 nanotubes are receiving considerable attention
due to titania’s high activity, strong oxidation capability, and chemical stability. As was
previously discussed in chapter 2, various methods have been used to prepare TiO2
nanotubes including anodization,168 template techniques, 169, 170 hydrothermal processes,
171, 172 and soft chemical processes.32 Moreover, as was discussed in the literature review
section (chapter 2), the performance of the titania nanostructures strongly relies on their
crystallinity, crystallite size, crystal structure, specific surface area, thermal stability and
quantum efficiency.17, 50 Small amounts of metal doping, particularly Zr, has been found
very effective to enhance the thermal stability and activity of TiO2 nanomaterials24, 53, 82,
83 and TiO2–ZrO2 binary metal oxides have received considerable attention as catalysts.
However, the performance of these materials significantly varies with the synthesis
process, and the subsequent heat treatment.
Conventionally, the sol-gel process or impregnation or coprecipitation methods
have been widely used for synthesizing various oxide materials. However, with several
advantages over other methods, the sol-gel process has become a standard technique for
synthesizing multioxide materials.96 The major advantages of the sol-gel technique

78
include molecular scale mixing, high purity of the precursors, and homogeneity of the
sol-gel products with a high purity of physical, morphological, and chemical properties.97
However, the properties of the multicomponent sol-gel products depend on the
composition, precursors, and operating variables.99 The conventional sol-gel process
requires an organic solvent. Due to environmental regulations and increased
environmental concerns, the use of volatile organic compounds (VOCs) is becoming
increasingly restricted. Hence, alternative processes using a green solvent such as
supercritical carbon dioxide (scCO2) is attractive to synthesize TiO2 nanostructures.
Moreover, it is well documented that the operating temperature and pressure controls the
physical properties of CO2 such as density and solubility as well as all the chemical
reaction steps.98, 149 Furthermore, the alkoxide concentration and the acid to metal
alkoxide ratio are very important parameters controlling both the nucleation and growth
steps.98 Therefore, it is highly desirable to investigate the effects of the operating
variables in scCO2 on the porous structure of the modified nanomaterials to gain a
fundamental understanding on how the morphologies and porosity of the nanomaterials
are affected, and to find the optimum operating conditions for preparing the desired
nanostructure.
Therefore, in this chapter, both TiO2 and Zr doped TiO2 metal oxides were
synthesized by a direct sol-gel process in scCO2, and the effects of different operating
variables on the binary nanostructure were investigated.
79
4.1. Experimental
ZrO2 modified TiO2 nanostructures were synthesized by a direct sol-gel method in
scCO2 using temperature (40-80°C), pressure (3000-6000psig), concentration (0.35-1.4
mol/L), acid/metal alkoxide ratio (3-7) and Zr composition (0-20%) following the same
procedure described in Chapter 3. In a typical experiment, the appropriate amount of
precursors and acetic acid were quickly placed in the view cell followed by addition of
CO2 under stirring conditions and heating. After 5 days aging, the nanomaterials were
washed with CO2 at a controlled flow rate. The resulting as-prepared materials were
amorphous. To form crystalline phase, the synthesized materials were calcined in air at
500 oC using a heating rate of 10 °C/min, holding time 2 h, and a cooling rate to room
temperature 0.5 °C/min. The synthesized as-prepared and calcined materials were
characterized using several physiochemical techniques, which were described in chapter
3.
Moreover, the initial gelation kinetics were studied in terms of the gelation time,
with the gel point used according to the definition by Loy et al., (i.e. when the entire view
cell was filled with gel and the stir bar was not observed).148 The gel point for every
experiment was determined at least twice. In addition, the solubility parameters of CO2
were calculated for selected temperature and pressure conditions using the density
according to Giddings et al. with the provided values given in Table 4.1, 173
ρρρ
δ 384.025.1 ==RL
scRcSC P 4.1
80
where, cP is the critical pressure in atmospheres, scRρ is the reduced density of CO2,
RLρ = 2.66 is the reduced density of liquid CO2 at its normal boiling point, and ρ is the
density of CO2 in mol/L.
Table 4.1: Solubility parameters of scCO2 under selected temperatures and pressures.
Temperature (°C) 40 60 60 60 80 Pressure (psia) 5000 3000 5000 6000 5000
Density (mol/L) 21.19 18.42 19.54 20.38 17.84 Solubility parameter (cal/cm3)1/2 8.13 7.07 7.5 7.82 6.85
4.2. Effects of Pressure
To investigate the effects of pressure, the nanomaterials were synthesized using
scCO2 pressures from 3000-6000 psig, keeping the other parameters constant, with the
morphology and size of the as-prepared materials characterized by SEM analysis. From
the SEM images given in Fig 4.1, it can be seen that for all pressures, nanotubes with
diameter 50-150 nm were formed. The morphology of the nanotubes did not change
significantly, although at a low pressure (3000 psig) more agglomerated nanotubes were
formed. These results can be explained using the calculated solubility parameter of CO2
provided in Table 4.1, at 3000 psig was 7.07 (cal/cm3)1/2 becoming 7.8 (cal/cm3)1/2 at
6000 psig. Comparing the solubility parameter, it is clear that while keeping the
temperature constant, changing the pressure did not change the density as well as the
solvating power of CO2 significantly.
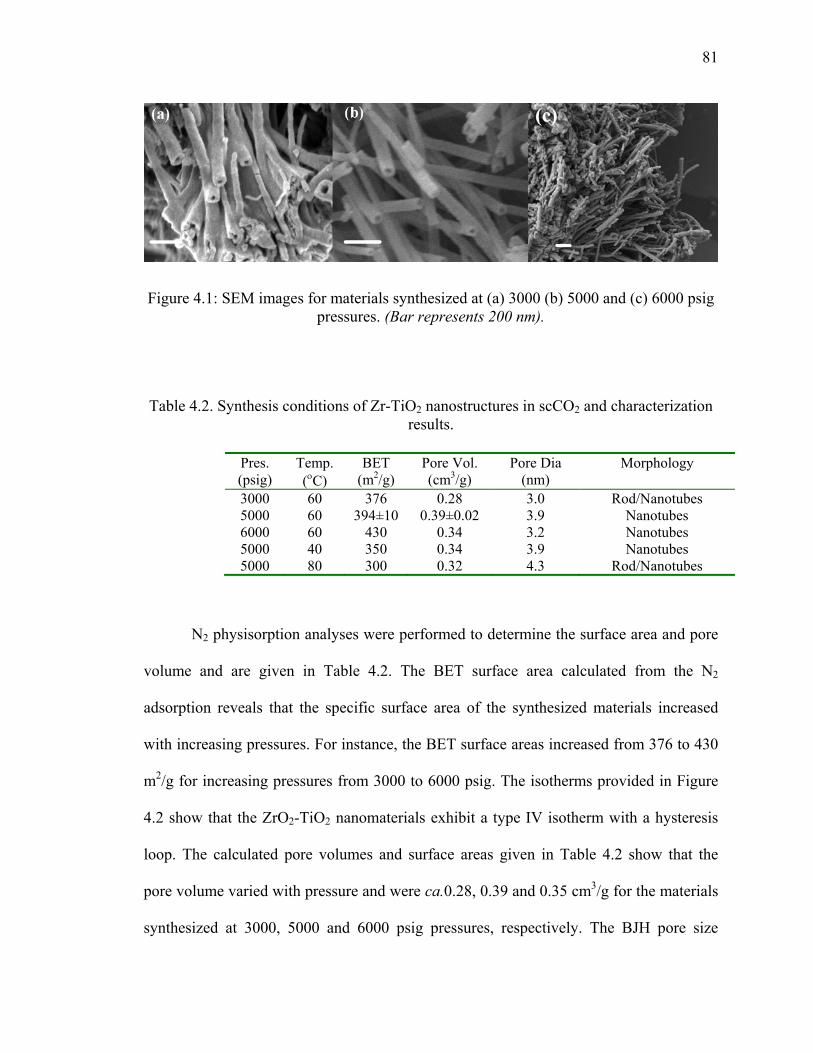
81
Figure 4.1: SEM images for materials synthesized at (a) 3000 (b) 5000 and (c) 6000 psig pressures. (Bar represents 200 nm).
Table 4.2. Synthesis conditions of Zr-TiO2 nanostructures in scCO2 and characterization results.
N2 physisorption analyses were performed to determine the surface area and pore
volume and are given in Table 4.2. The BET surface area calculated from the N2
adsorption reveals that the specific surface area of the synthesized materials increased
with increasing pressures. For instance, the BET surface areas increased from 376 to 430
m2/g for increasing pressures from 3000 to 6000 psig. The isotherms provided in Figure
4.2 show that the ZrO2-TiO2 nanomaterials exhibit a type IV isotherm with a hysteresis
loop. The calculated pore volumes and surface areas given in Table 4.2 show that the
pore volume varied with pressure and were ca.0.28, 0.39 and 0.35 cm3/g for the materials
synthesized at 3000, 5000 and 6000 psig pressures, respectively. The BJH pore size
Pres. (psig)
Temp. (οC)
BET (m2/g)
Pore Vol. (cm3/g)
Pore Dia (nm)
Morphology
3000 60 376 0.28 3.0 Rod/Nanotubes 5000 60 394±10 0.39±0.02 3.9 Nanotubes 6000 60 430 0.34 3.2 Nanotubes 5000 40 350 0.34 3.9 Nanotubes 5000 80 300 0.32 4.3 Rod/Nanotubes
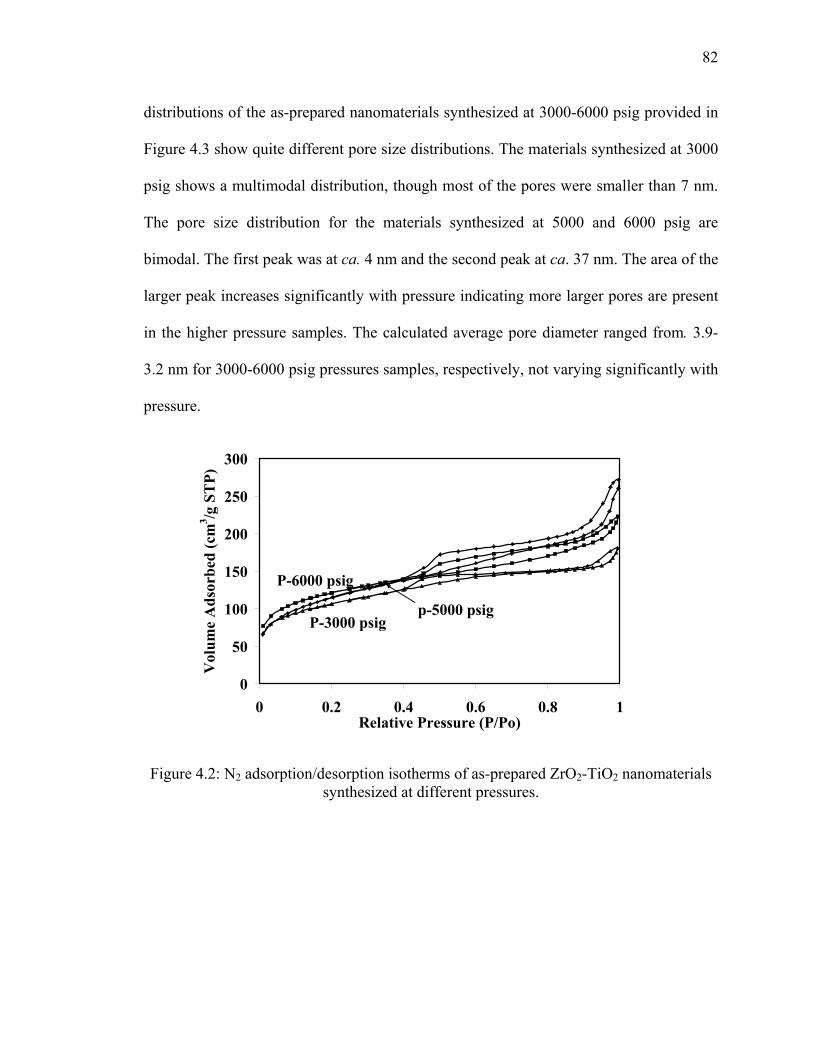
82
distributions of the as-prepared nanomaterials synthesized at 3000-6000 psig provided in
Figure 4.3 show quite different pore size distributions. The materials synthesized at 3000
psig shows a multimodal distribution, though most of the pores were smaller than 7 nm.
The pore size distribution for the materials synthesized at 5000 and 6000 psig are
bimodal. The first peak was at ca. 4 nm and the second peak at ca. 37 nm. The area of the
larger peak increases significantly with pressure indicating more larger pores are present
in the higher pressure samples. The calculated average pore diameter ranged from. 3.9-
3.2 nm for 3000-6000 psig pressures samples, respectively, not varying significantly with
pressure.
0
50
100
150
200
250
300
0 0.2 0.4 0.6 0.8 1Relative Pressure (P/Po)
Vol
ume
Ads
orbe
d (c
m3 /g
ST
P)
P-6000 psig
P-3000 psigp-5000 psig
Figure 4.2: N2 adsorption/desorption isotherms of as-prepared ZrO2-TiO2 nanomaterials synthesized at different pressures.

83
0
0.01
0.02
0.03
0.04
0.05
0.06
0.07
10 100 1000Pore Diameter (Ǻ)
Pore
Vol
ume
(cm
3 /g)
P-3000 psig
P-6000 psig
P-5000 psig
Figure 4.3: BJH pore size distribution of as-prepared ZrO2-TiO2 nanomaterials
synthesized at different pressures.
4.3. Effects of Temperature
To investigate the effects of temperature, the materials were synthesized in a
temperature range of 40-80 °C at 5000 psig keeping the other parameters constant, with
the morphology and size of the as-prepared materials characterized by SEM and TEM
analysis. The SEM micrographs (Figures 4.4a and 4.4b) show that the as-prepared
aerogel powders were composed of 1D nanostructure. At a close look, these figures also
reveal that the 1D nanostructure differs significantly from the nanotubes’ morphology
and dimension described in the previous section. Figure 4.4(a) clearly demonstrates that
the materials synthesized at low temperature were smaller in diameter (10-100 nm),
compared to those synthesized at 80 oC, Figure 4.4(b). Moreover, the SEM images also
reveal that a significant amount of nanosheet type structure is present in the sample, as
shown by the arrow in Figure 4.4(a). It should be mentioned that the examined materials

84
were taken directly from the reaction after CO2 washing without any further purification
steps.
Figure 4.4: SEM images for materials synthesized at: (a) 40 oC and (b) 80 oC temperature. (Arrows indicate sheet type structure in materials synthesized at 40 oC).
It is very difficult to determine from the SEM images whether these
nanostructures were nanotubes or nanorods. Therefore, TEM analysis was performed on
the calcined nanomaterials, as shown in Figure 4.5a and 4.5b. 40 °C the materials are
tubes whereas at 80 °C nanorod/nanotubes were formed. The TEM images also
confirmed that at 40 °C, all sheets cannot convert into nanotubes: hence a large amount of
sheet structure (Figure 4.5c) is formed. The nanomaterals synthesized at higher
temperature 80 °C are all nanorod/tubes (Figure 4.5d) with similar results being observed
at 60 °C.
(a) (b)

85
Figure 4.5: Effects of temperature on the morphology of ZrO2-TiO2 nanomaterials, TEM images of calcined materials (a) & (c) synthesized at 40 oC, and (b) & (d) synthesized at
80 oC temperature. (Bar represents 100 nm).
To measure the surface area and pore volume, N2 physisorption analysis was
performed, with the isotherms provided in Figure 4.6. The results show that all the ZrO2-
TiO2 nanomaterials exhibited a type IV isotherm with a hysteresis loop, indicating the
presence of mesopores.160 Typically, slit-shaped pores or plate-like particles have
provided this type of shape, as previously described in section 3.2.6.160 Although gas
adsorption techniques and the data analysis methods appear to be well established, it is
still difficult to evaluate the pore structures accurately, due to the surface and structural
heterogeneity of the solid materials. 163 At 60 oC, the hysteresis loop is positioned at the
top, giving a higher surface area whereas low (40 oC) and high (80 oC) temperatures have
lower values.
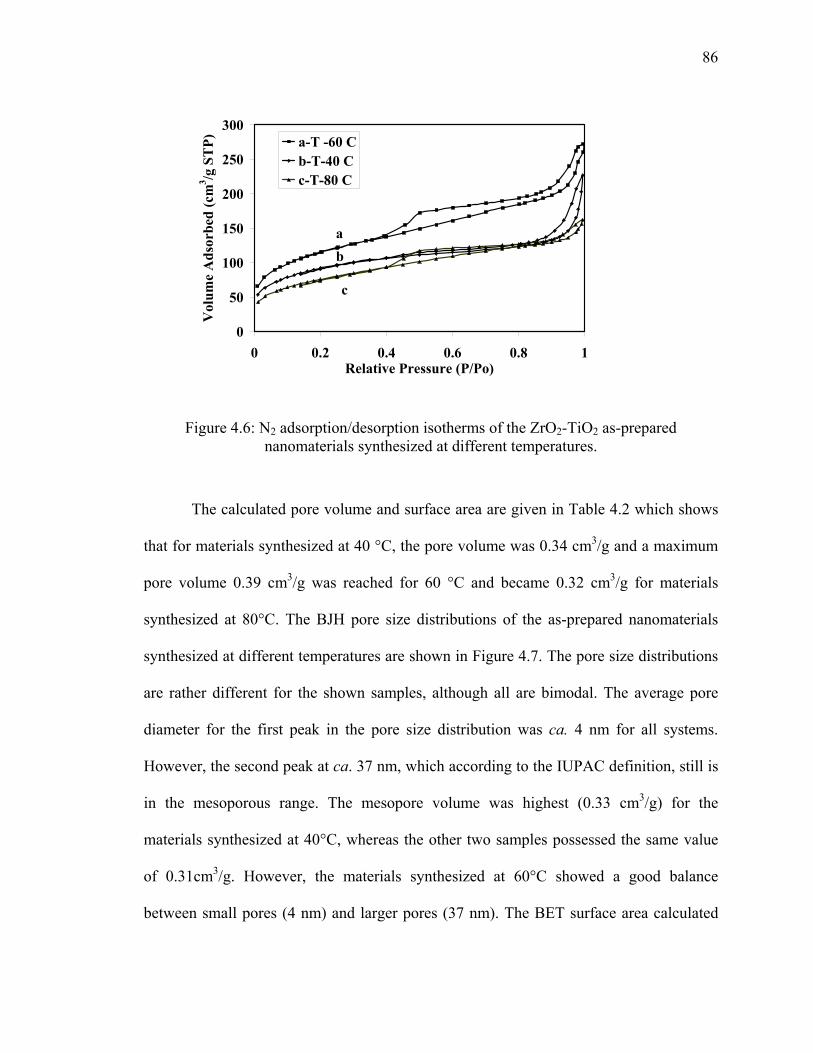
86
0
50
100
150
200
250
300
0 0.2 0.4 0.6 0.8 1Relative Pressure (P/Po)
Vol
ume
Ads
orbe
d (c
m3 /g
ST
P) a-T -60 Cb-T-40 Cc-T-80 C
c
ba
Figure 4.6: N2 adsorption/desorption isotherms of the ZrO2-TiO2 as-prepared nanomaterials synthesized at different temperatures.
The calculated pore volume and surface area are given in Table 4.2 which shows
that for materials synthesized at 40 °C, the pore volume was 0.34 cm3/g and a maximum
pore volume 0.39 cm3/g was reached for 60 °C and became 0.32 cm3/g for materials
synthesized at 80°C. The BJH pore size distributions of the as-prepared nanomaterials
synthesized at different temperatures are shown in Figure 4.7. The pore size distributions
are rather different for the shown samples, although all are bimodal. The average pore
diameter for the first peak in the pore size distribution was ca. 4 nm for all systems.
However, the second peak at ca. 37 nm, which according to the IUPAC definition, still is
in the mesoporous range. The mesopore volume was highest (0.33 cm3/g) for the
materials synthesized at 40°C, whereas the other two samples possessed the same value
of 0.31cm3/g. However, the materials synthesized at 60°C showed a good balance
between small pores (4 nm) and larger pores (37 nm). The BET surface area calculated

87
from the N2 adsorption reveals that the specific surface area of the synthesized materials
varied significantly with the synthesis temperature, such as 350 m2 /g at 40°C which
drops to 300 m2 /g for the 80 °C samples. Previously, it was observed that 10 % ZrO2
modified TiO2 nanotubes possess ca 400 m2/g surface area at 60 °C. The significant
reduction in surface area is attributed to the morphological change.
0
0.01
0.02
0.03
0.04
0.05
10 100 1000Pore Diameter (Ǻ)
Pore
Vol
ume
(cm
3 /g)
c-T-80 Cb-T-40 Ca-T-60 C
a
b
c
Figure 4.7: BJH pore size distribution of the ZrO2-TiO2 as-prepared nanomaterials synthesized at different temperatures.
In order to investigate the temperature effects on the initial gelation rate, the
gelation time was recorded for 40-80 oC keeping the other variables constant. Since the
hydrolysis and condensation reactions of the sol-gel process in scCO2 are thermally
accelerated as the temperature increases, the gelation time was studied as seen in Figure
4.8.99 The gelation time for 40 oC was more than 3 hours, with this value decreasing upon
increasing temperature. When the process temperature increased to 50 oC, the gelation
time was reduced significantly to 70 min. However, a further increase in temperature

88
reduced the gelation time very slowly, becoming ca.30 min for 80 oC. The temperature
dependence of gelation can be represented by an Arrhenius equation:
ARTEtLn gel +=)( 4.2
where A is a constant, R is the universal gas content, and T is temperature. The activation
energy, E, depends on the reaction environment, catalyst and alkoxy group.174 For the
gels obtained in this work, E was calculated to be 44 kJ/mole. It is not possible to
associate this activation energy with any specific reaction step, because this process
includes hydrolysis, condensation, nucleation and growth steps as the products form gel.
In comparison, Birnie et al. calculated an activation energy for titanium isopropoxide
modified with acetic acid in propanol and the value was 67.6 kJ/mole.175 It is well known
that zirconium is more active compared to titanium.176 Hence, upon introducing 10 %
zirconium propoxide into the reaction system, the activation energy for zirconium–
titanium binary system is reduced, likely due to the higher activity of Zr and faster
reaction rates in CO2.
The direct sol-gel technique consists of esterification, hydrolysis and
condensation of titanium and zirconium alkoxides in the presence of acetic acid in scCO2.
The effects of operational variables such as temperature not only change the reaction rate,
but also change the solubility parameter of the system. The solubility is known to have
significant effects on the morphology of the gel products.99 The nucleation and growth
processes are two important parameters controlling the nanomaterials evolution, which
strongly depends on the solubility of the solvent which controls the saturation.158 For
example, large hexagonal prismatic crystals of Ca(OH)2 were formed at high saturation in

89
low temperatures, whereas fine plate like crystals were obtained with low saturation at
high temperatures.158
Figure 4.8: The gelation time as a function of reciprocal of absolute process temperature.
According to Table 4.1, the solubility parameter of CO2 is 8.12 (cal/cm3)1/2 at 40
oC with this value changing significantly with operating temperature, becoming 7.5
(cal/cm3)1/2 and 6.84 at 60 oC and 80 oC, respectively. Temperature shows two opposing
effects: on the one hand it increases the reaction rate, while on the other hand it reduces
the solubility parameter. Both effects have a very significant influence on the final sol-gel
product, likely influencing the morphological change of nanotubes synthesized in scCO2
at different temperatures. Hence, for desired nanostructure evolution, there will be an
optimum temperature which maintains the reaction rate with the required solubility of the
system.

90
4.4. Effects of Concentration
To investigate the effects of alkoxide concentration, the materials were
synthesized using a concentration range 0.35-1.4 mol/L, while keeping the other variables
unchanged. The morphology and size of the as-prepared materials were characterized by
SEM and TEM analysis. The initial gel time and other characteristics are reported in
Table 4.3. The SEM micrographs are given in Figure 4.9 and show that concentration had
a significant influence on the morphology of the synthesized nanomaterials. The SEM
images suggest that the as-prepared aerogel powders are composed of mixed structure for
very low (0.35 mol/L) and very high (1.4 mol/L) concentration. Nanosheets and
nanotubes were only formed in the middle concentration region. For low concentrations,
sheet, rod and cubic structured material with different dimensions were observed.
Nanosheet type structures with 150-375 nm width were observed for 0.7 mol/L
concentration of alkoxides, whereas 50-135 nm dia nanotubes were formed at 1.14 mol/L
concentrated solutions. With a further increase in concentration to 1.4 mol/L, the
morphology changed to a mixed sheet and rod- type structure being formed. This result
can be explained by the effects of concentration on supersaturation. According to Yasue
et al., smaller crystals are formed at a higher initial degree of supersaturation, while
larger crystals are obtained with lower supersaturation.177 Kim et al. also proposed that
the initial concentration was a very important factor to obtain monodispersed titania.178
The growth and nucleation rate is a function of the solute concentration.98 The hydrolysis
and condensation products of the precursors are considered as solute, and this
concentration will increase with the initial precursor’s concentration. It is known that for
solutions having a higher initial concentration, gelation is faster.179 The increase in initial
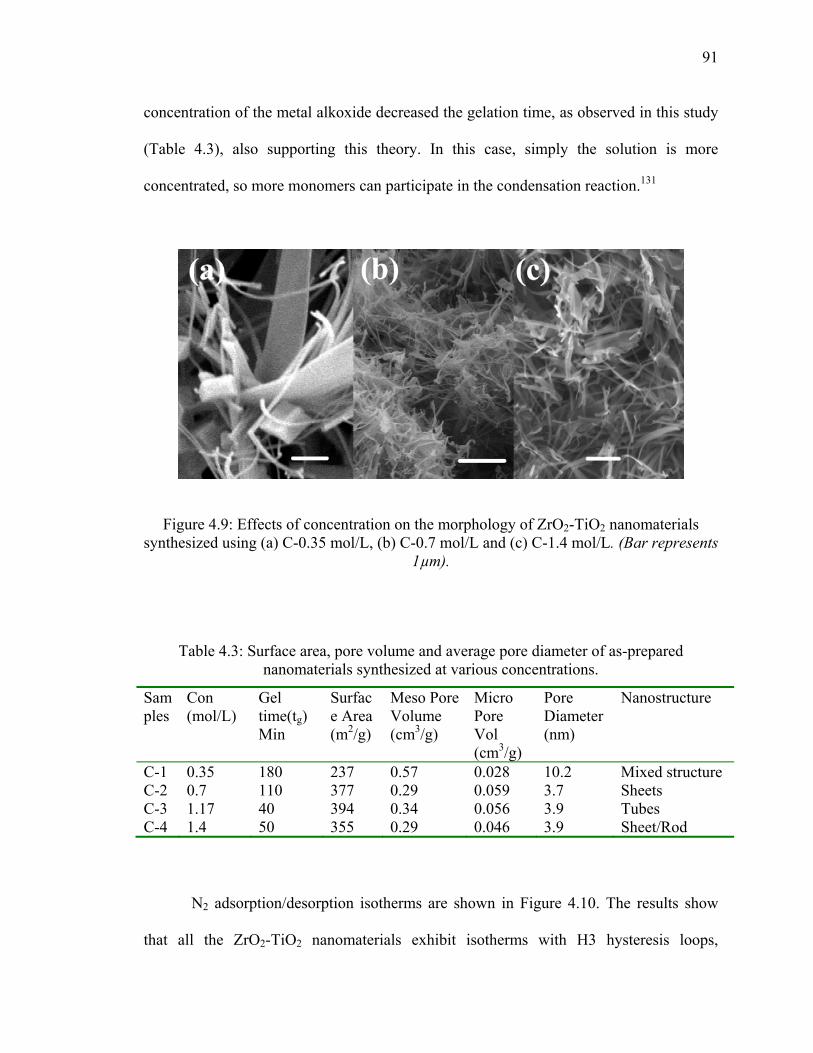
91
concentration of the metal alkoxide decreased the gelation time, as observed in this study
(Table 4.3), also supporting this theory. In this case, simply the solution is more
concentrated, so more monomers can participate in the condensation reaction.131
Figure 4.9: Effects of concentration on the morphology of ZrO2-TiO2 nanomaterials synthesized using (a) C-0.35 mol/L, (b) C-0.7 mol/L and (c) C-1.4 mol/L. (Bar represents
1µm).
Table 4.3: Surface area, pore volume and average pore diameter of as-prepared nanomaterials synthesized at various concentrations.
Samples
Con (mol/L)
Gel time(tg) Min
Surface Area (m2/g)
Meso Pore Volume (cm3/g)
Micro Pore Vol (cm3/g)
Pore Diameter (nm)
Nanostructure
C-1 0.35 180 237 0.57 0.028 10.2 Mixed structure C-2 0.7 110 377 0.29 0.059 3.7 Sheets C-3 1.17 40 394 0.34 0.056 3.9 Tubes C-4 1.4 50 355 0.29 0.046 3.9 Sheet/Rod
N2 adsorption/desorption isotherms are shown in Figure 4.10. The results show
that all the ZrO2-TiO2 nanomaterials exhibit isotherms with H3 hysteresis loops,

92
indicating the presence of mesopores.160 However, the shape of the isotherms are
different from the nanotubes isotherms, as the adsorbtion branches are very flat compared
to the type IV isotherms. The type III isotherms exhibit a plateau in the volume adsorbed
at intermediate pressures whereas the type IV isotherm shows a monotonic increase in
0
50
100
150
200
250
300
350
400
0 0.2 0.4 0.6 0.8 1Relative Pressure (P/Po)
Vol
ume
Ads
orbe
d (c
m3 /g
ST
P) a-C-0.35 mol/Lb-C-0.7 mol/Lc-C-1.4 mol/L
cb
a
Figure 4.10: N2 adsorption/desorption isotherms of the ZrO2-TiO2 as-prepared nanomaterials synthesized using different alkoxide concentrations.
adsorption with increasing relative pressure. The materials with type III isotherms having
hysteresis loops represent mesoporous structure. The micropore volume was calculated
from the t-plot (Table 4.3) showing that all nanomaterials, regardless of concentration,
have micropores. The micropore volume is 0.028 cm3/g for 0.35 mol/L whereas ca. 0.056
cm3/g for materials synthesized using the intermediate concentration. This micropore
volume reduced with a further increasing in concentration. Considering the mesopores,
the low concentration samples possessed the highest i.e. 0.57 cm3/g among all samples.
The mesopore volume reduced with increasing concentration, becoming ca. 0.3 cm3/g for
the rest of the samples.
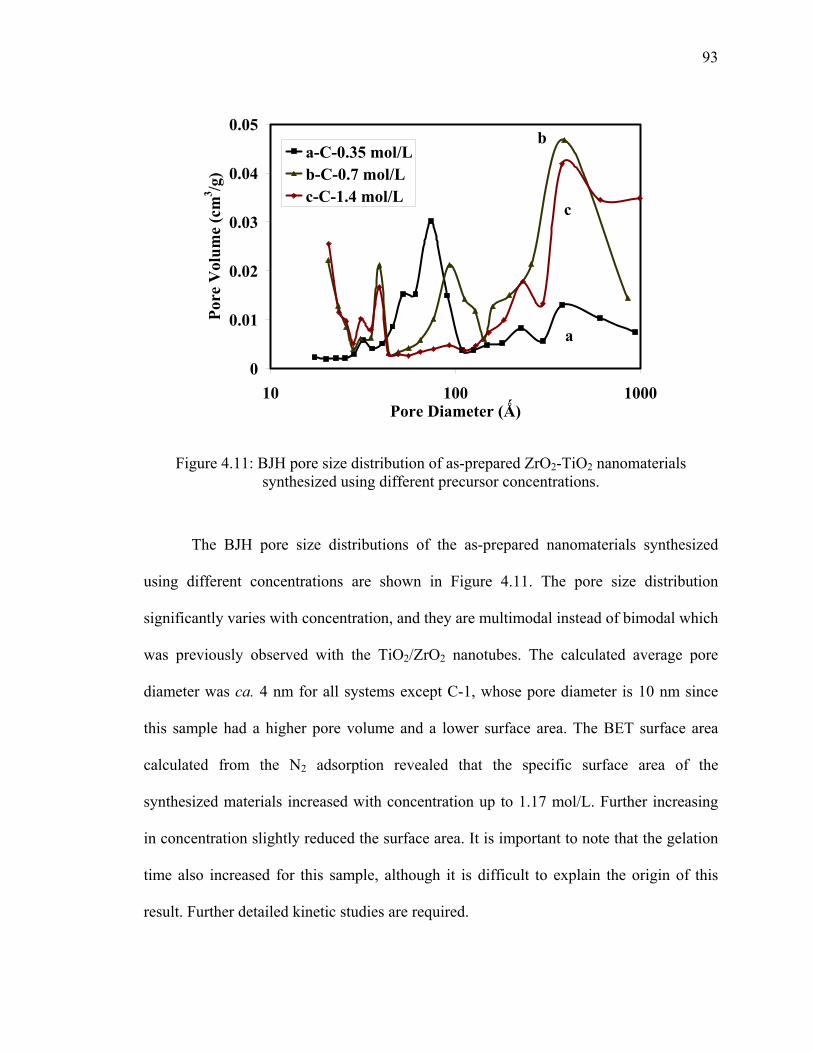
93
0
0.01
0.02
0.03
0.04
0.05
10 100 1000Pore Diameter (Ǻ)
Pore
Vol
ume
(cm
3 /g)
a-C-0.35 mol/Lb-C-0.7 mol/Lc-C-1.4 mol/L
a
b
c
Figure 4.11: BJH pore size distribution of as-prepared ZrO2-TiO2 nanomaterials synthesized using different precursor concentrations.
The BJH pore size distributions of the as-prepared nanomaterials synthesized
using different concentrations are shown in Figure 4.11. The pore size distribution
significantly varies with concentration, and they are multimodal instead of bimodal which
was previously observed with the TiO2/ZrO2 nanotubes. The calculated average pore
diameter was ca. 4 nm for all systems except C-1, whose pore diameter is 10 nm since
this sample had a higher pore volume and a lower surface area. The BET surface area
calculated from the N2 adsorption revealed that the specific surface area of the
synthesized materials increased with concentration up to 1.17 mol/L. Further increasing
in concentration slightly reduced the surface area. It is important to note that the gelation
time also increased for this sample, although it is difficult to explain the origin of this
result. Further detailed kinetic studies are required.
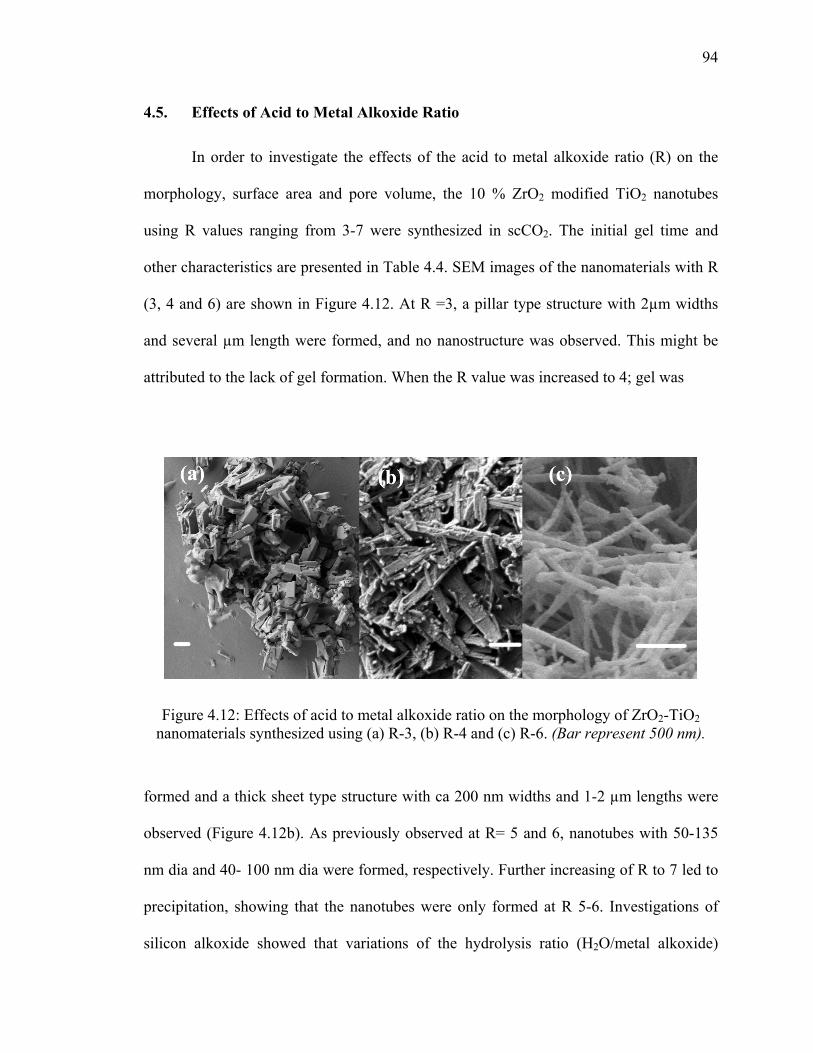
94
4.5. Effects of Acid to Metal Alkoxide Ratio
In order to investigate the effects of the acid to metal alkoxide ratio (R) on the
morphology, surface area and pore volume, the 10 % ZrO2 modified TiO2 nanotubes
using R values ranging from 3-7 were synthesized in scCO2. The initial gel time and
other characteristics are presented in Table 4.4. SEM images of the nanomaterials with R
(3, 4 and 6) are shown in Figure 4.12. At R =3, a pillar type structure with 2µm widths
and several µm length were formed, and no nanostructure was observed. This might be
attributed to the lack of gel formation. When the R value was increased to 4; gel was
Figure 4.12: Effects of acid to metal alkoxide ratio on the morphology of ZrO2-TiO2 nanomaterials synthesized using (a) R-3, (b) R-4 and (c) R-6. (Bar represent 500 nm).
formed and a thick sheet type structure with ca 200 nm widths and 1-2 µm lengths were
observed (Figure 4.12b). As previously observed at R= 5 and 6, nanotubes with 50-135
nm dia and 40- 100 nm dia were formed, respectively. Further increasing of R to 7 led to
precipitation, showing that the nanotubes were only formed at R 5-6. Investigations of
silicon alkoxide showed that variations of the hydrolysis ratio (H2O/metal alkoxide)

95
caused a modification in the structure and in the properties of the polysilicated products,
which strongly supports our observations.99
To examine the surface area and pore volume, N2 physisorption analysis was
performed (Figure 4.13). The isotherm for R4 is type III, whereas type IV was obtained
for R6. The calculated total pore volume (Table 4.4) increased with increasing R value.
However, the micropore calculated from the t-plot indicates that there is no specific
trend. The micropore volume was very low for R4 (0.004 cm3/g) and 0.025 cm3/g for R6.
Table 4.4: Surface area, pore volume and average pore diameter of as-prepared nanomaterials synthesized with different acid to metal alkoxide ratios.
Acid/ Metal alkoxide Ratio
Gelation time(tg) Min
Surface Area (m2/g)
Meso. Pore Volume (cm3/g)
Mic. Pore Volume (cm3/g)
Pore Diameter (nm)
Nanostructure
R-3 No gel n.d n.d. n.d n.d. No structure R-4 80±10 335 0.31 0.014 4.2 Sheet R-5 40±5 394 0.34 0.056 3.8 Tubes R-6 35±5 410 0.37 0.025 3.9 Tubes R-7 precipitate ------ ----- ------- ---------
The BJH pore size distributions of the as-prepared nanomaterials using R4 and R6
are shown in Figure 4.14. The pore size distributions are similar and both are bimodal;
the first peak at ca. 4 nm and the second peak at ca. 37 nm. The average pore diameter
was ca. 4 nm for all systems. The BET surface area calculated from N2 adsorption
showed that the specific surface area of the synthesized materials varied significantly
with metal alkoxide ratio at R4, while the surface areas were similar for R5 and R6. This
observation also supports the morphological effects on surface area.
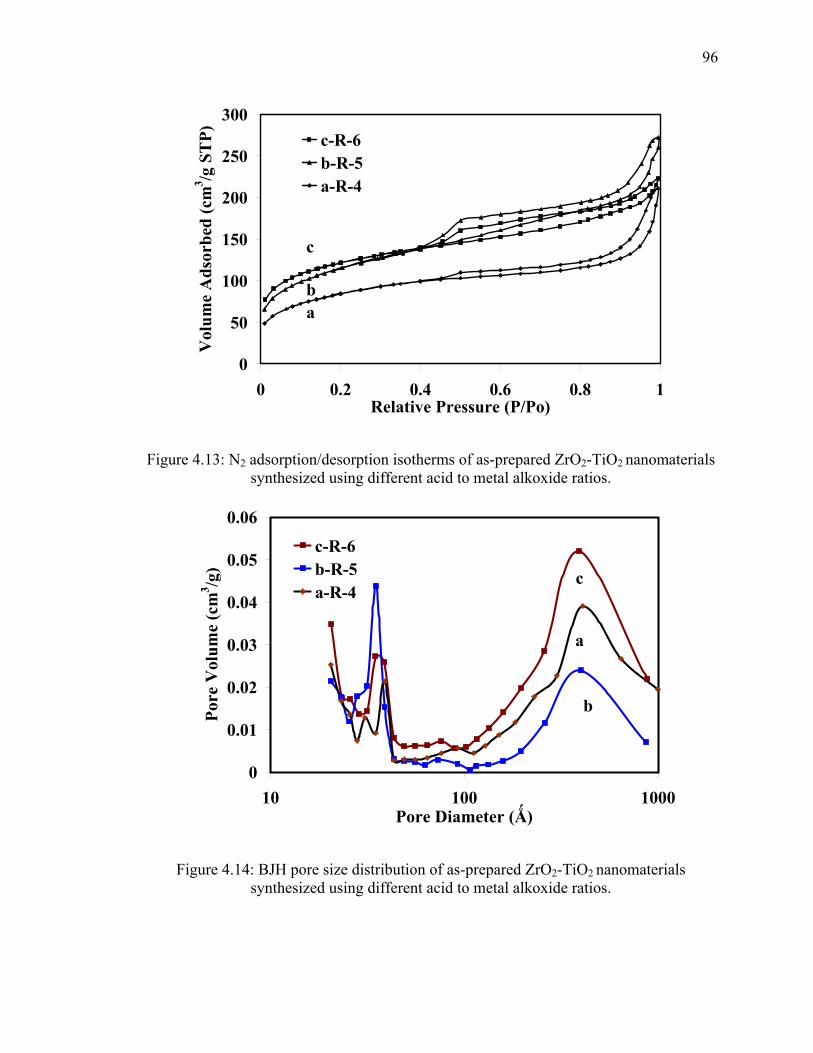
96
0
50
100
150
200
250
300
0 0.2 0.4 0.6 0.8 1Relative Pressure (P/Po)
Vol
ume
Ads
orbe
d (c
m3 /g
ST
P) c-R-6b-R-5a-R-4
ba
c
Figure 4.13: N2 adsorption/desorption isotherms of as-prepared ZrO2-TiO2 nanomaterials synthesized using different acid to metal alkoxide ratios.
0
0.01
0.02
0.03
0.04
0.05
0.06
10 100 1000Pore Diameter (Ǻ)
Pore
Vol
ume
(cm
3 /g)
c-R-6b-R-5a-R-4
b
c
a
Figure 4.14: BJH pore size distribution of as-prepared ZrO2-TiO2 nanomaterials synthesized using different acid to metal alkoxide ratios.
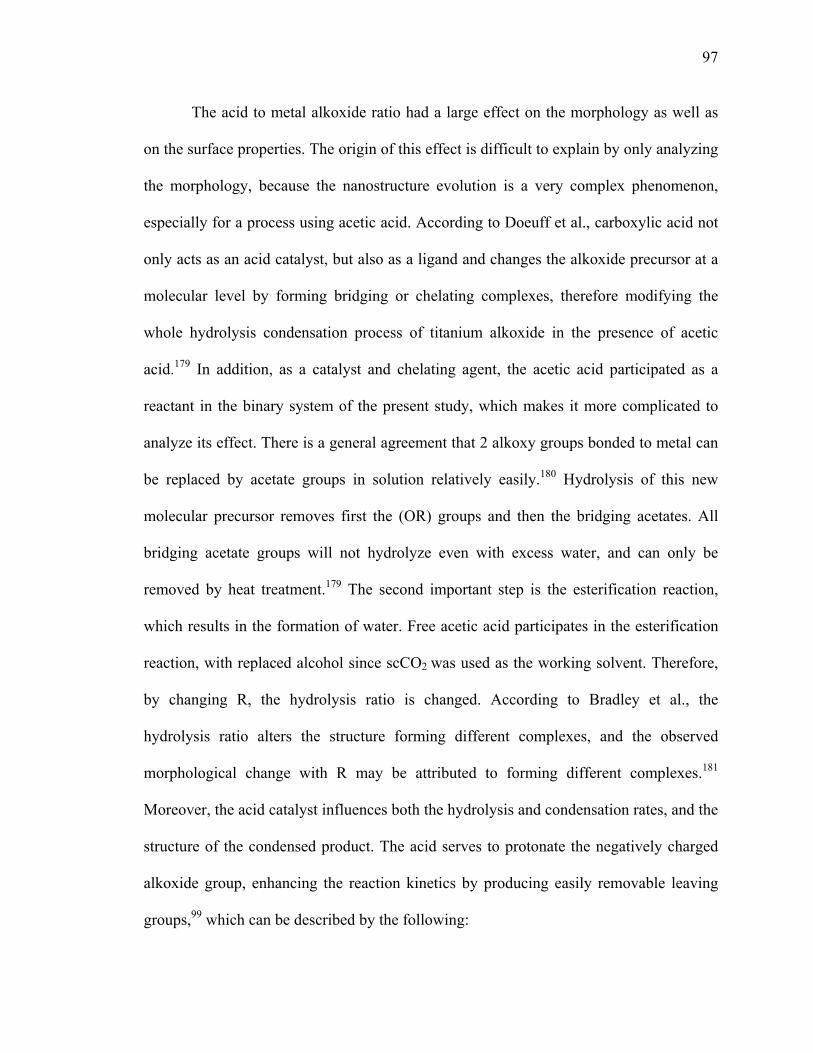
97
The acid to metal alkoxide ratio had a large effect on the morphology as well as
on the surface properties. The origin of this effect is difficult to explain by only analyzing
the morphology, because the nanostructure evolution is a very complex phenomenon,
especially for a process using acetic acid. According to Doeuff et al., carboxylic acid not
only acts as an acid catalyst, but also as a ligand and changes the alkoxide precursor at a
molecular level by forming bridging or chelating complexes, therefore modifying the
whole hydrolysis condensation process of titanium alkoxide in the presence of acetic
acid.179 In addition, as a catalyst and chelating agent, the acetic acid participated as a
reactant in the binary system of the present study, which makes it more complicated to
analyze its effect. There is a general agreement that 2 alkoxy groups bonded to metal can
be replaced by acetate groups in solution relatively easily.180 Hydrolysis of this new
molecular precursor removes first the (OR) groups and then the bridging acetates. All
bridging acetate groups will not hydrolyze even with excess water, and can only be
removed by heat treatment.179 The second important step is the esterification reaction,
which results in the formation of water. Free acetic acid participates in the esterification
reaction, with replaced alcohol since scCO2 was used as the working solvent. Therefore,
by changing R, the hydrolysis ratio is changed. According to Bradley et al., the
hydrolysis ratio alters the structure forming different complexes, and the observed
morphological change with R may be attributed to forming different complexes.181
Moreover, the acid catalyst influences both the hydrolysis and condensation rates, and the
structure of the condensed product. The acid serves to protonate the negatively charged
alkoxide group, enhancing the reaction kinetics by producing easily removable leaving
groups,99 which can be described by the following:
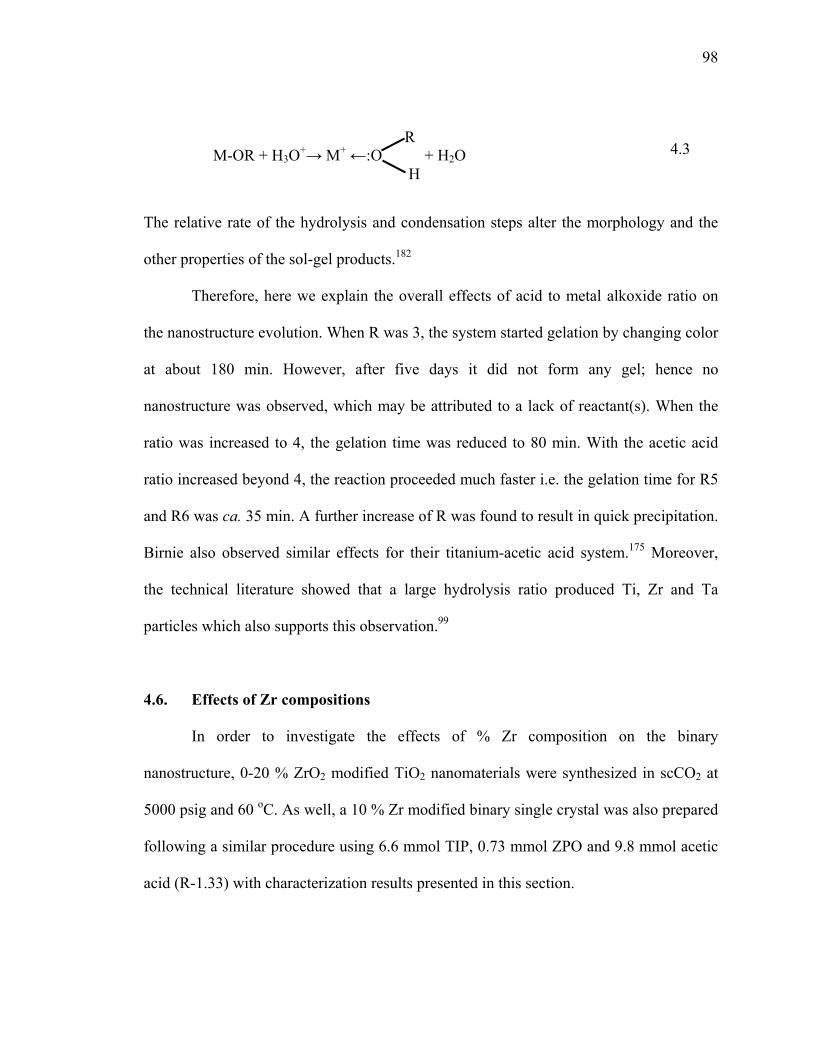
98
4.3
The relative rate of the hydrolysis and condensation steps alter the morphology and the
other properties of the sol-gel products.182
Therefore, here we explain the overall effects of acid to metal alkoxide ratio on
the nanostructure evolution. When R was 3, the system started gelation by changing color
at about 180 min. However, after five days it did not form any gel; hence no
nanostructure was observed, which may be attributed to a lack of reactant(s). When the
ratio was increased to 4, the gelation time was reduced to 80 min. With the acetic acid
ratio increased beyond 4, the reaction proceeded much faster i.e. the gelation time for R5
and R6 was ca. 35 min. A further increase of R was found to result in quick precipitation.
Birnie also observed similar effects for their titanium-acetic acid system.175 Moreover,
the technical literature showed that a large hydrolysis ratio produced Ti, Zr and Ta
particles which also supports this observation.99
4.6. Effects of Zr compositions
In order to investigate the effects of % Zr composition on the binary
nanostructure, 0-20 % ZrO2 modified TiO2 nanomaterials were synthesized in scCO2 at
5000 psig and 60 oC. As well, a 10 % Zr modified binary single crystal was also prepared
following a similar procedure using 6.6 mmol TIP, 0.73 mmol ZPO and 9.8 mmol acetic
acid (R-1.33) with characterization results presented in this section.
R M-OR + H3O+→ M+ ←:O + H2O H

99
Table 4.5: Results of Zr-Ti binary metal oxide nanostructures in scCO2
Sample Number
Nominal Zr mole %
Product Zr mole %a
Crys. (nm)
Latt. para (Å) Cell V (Å)3
Morphology a c
Zr-TiO2-0 0 0 14.0 3.787 9.514 136.51 Fibers Zr-TiO2-4% 0.0425 0.04 13.7 3.787 9.531 136.74 Tubes /sheets Zr-TiO2-6% 0.063 0.0625 12.6 3.787 9.541 136.98 Tubes/sheets Zr-TiO2-8% 0.087 0.084±0.02 12.5 3.788 9.571 137.35 Tubes /sheets Zr-TiO2-10% 0.11 0.1066±0.1 12.2 3.798 9.6 138.47 Tubes/sheet Zr-TiO2-20% 0.25 0.19±0.1 ----- ---- --- ---- Tubes Note-Experimental condition- Pressure-5000 psig, Temperature-60οC, Concentation-0.7 and 1.17 mol/L, Acid to metal Alkoxide Ratio-5. a-Product composition was measured by EDX
4.6.1. Morphology
The effects of Zr composition on the microstructures and morphology of the
ZrO2-TiO2 nanomaterials were characterized by SEM and TEM analysis. Examining the
SEM micrographs in Figure 4.15, it can be seen that the as-prepared aerogel powders
were composed of one dimensional nanostructure, though the morphology of the
individual nanostructure varies with the amount of Zr present in the samples. From
Figure 4.15(a), it can be seen that pure TiO2 formed nanofiberous structures having
diameters 20-50 nm with lengths of up to several microns. These results are consistent
with Sui et al.149 who reported that 10-40 nm TiO2 nanofibers were produced using TIP in
scCO2 following a similar procedure. It is seen from the SEM images that nanotubes with
40-150 nm in dia. were formed from the ZrO2-TiO2 binary samples. The dimensions of
the nanotubes changed significantly with %Zr composition, which might be attributed to
the formation of different Zr-Ti hexamer building blocks. The binary metal hexamer
structure strongly depends on the ratio of the metal alkoxide used for the synthesis
process.183 The SEM images (Figure 4.15c and 4.15d), show that nanotubes with 8% Zr

100
composition were narrower (40-100 nm) compared to the 10% Zr containing tubes, with
the diameter of the nanotubes becoming larger with increasing %Zr composition. The
10% Zr formed nanotubes with a diameter of 50–140 nm and a length of 1-4 μm.
Figure 4.15: Zr-Ti binary calcined nanomaterials with different zirconium compositions (a) undoped TiO2, (b) 4%, (c) 8%, and (d) 10%. (Bar represents 200 nm. All the samples
were examined after platinum coating. Arrows indicate tubes).
In order to obtain more detailed structrual information, TEM analysis was
performed for the low 4 % Zr samples and given in Figure 4.16. The TEM image shows
ca. 100 nm in diameter nanostructures. However, it is difficult to determine whether these
nanostructures are tubes or fibers at low %Zr composition. Therefore, a different
approach was taken to confirm that even at very low Zr composition (4%), that binary
nanostructures were being formed. It was previously discussed that ZrO2-TiO2 nanotubes
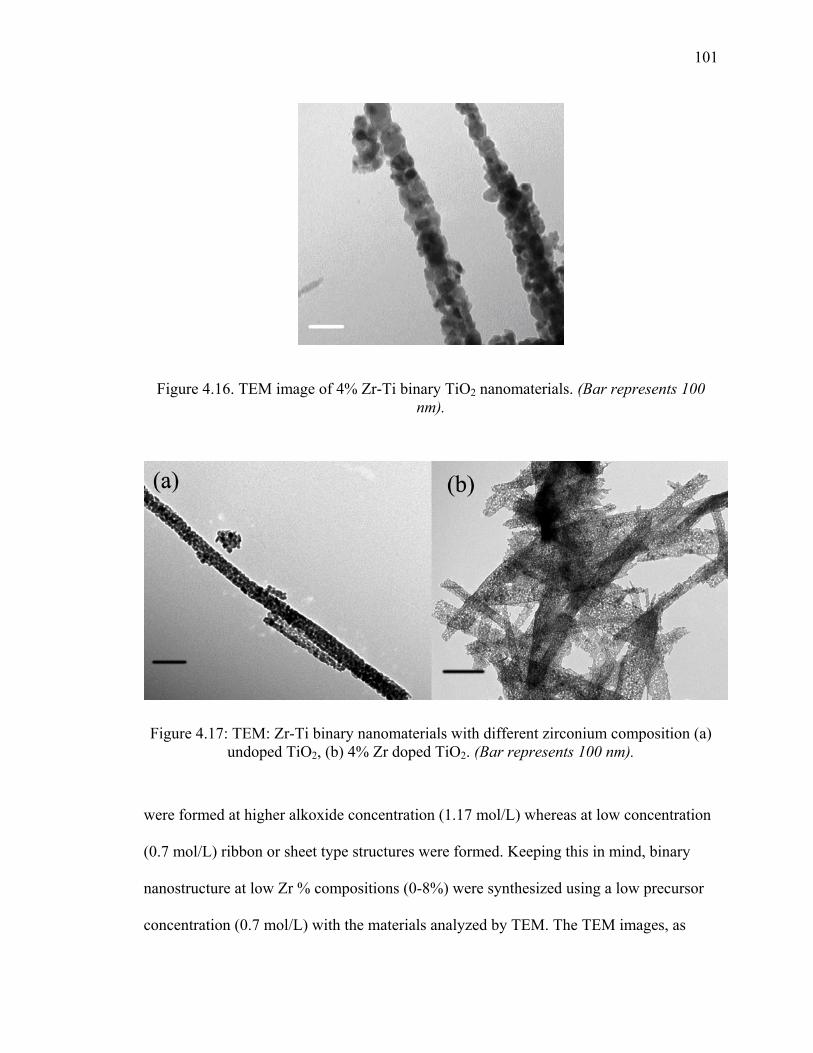
101
Figure 4.16. TEM image of 4% Zr-Ti binary TiO2 nanomaterials. (Bar represents 100 nm).
Figure 4.17: TEM: Zr-Ti binary nanomaterials with different zirconium composition (a) undoped TiO2, (b) 4% Zr doped TiO2. (Bar represents 100 nm).
were formed at higher alkoxide concentration (1.17 mol/L) whereas at low concentration
(0.7 mol/L) ribbon or sheet type structures were formed. Keeping this in mind, binary
nanostructure at low Zr % compositions (0-8%) were synthesized using a low precursor
concentration (0.7 mol/L) with the materials analyzed by TEM. The TEM images, as
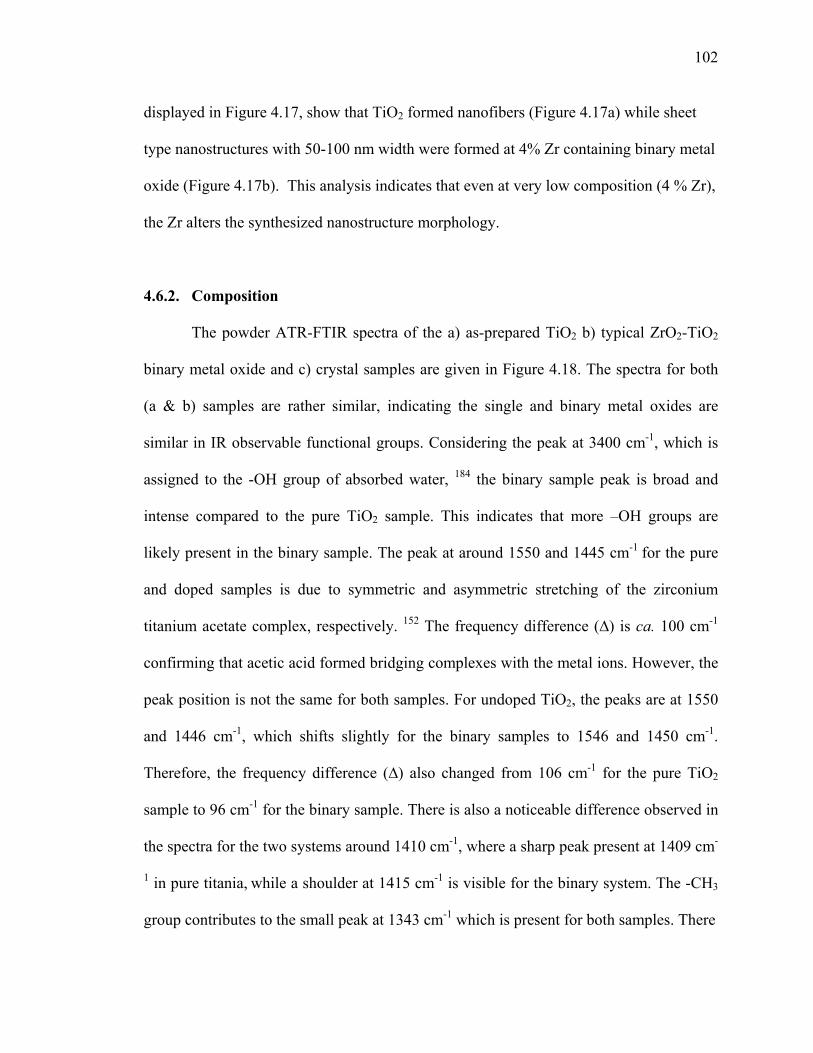
102
displayed in Figure 4.17, show that TiO2 formed nanofibers (Figure 4.17a) while sheet
type nanostructures with 50-100 nm width were formed at 4% Zr containing binary metal
oxide (Figure 4.17b). This analysis indicates that even at very low composition (4 % Zr),
the Zr alters the synthesized nanostructure morphology.
4.6.2. Composition
The powder ATR-FTIR spectra of the a) as-prepared TiO2 b) typical ZrO2-TiO2
binary metal oxide and c) crystal samples are given in Figure 4.18. The spectra for both
(a & b) samples are rather similar, indicating the single and binary metal oxides are
similar in IR observable functional groups. Considering the peak at 3400 cm-1, which is
assigned to the -OH group of absorbed water, 184 the binary sample peak is broad and
intense compared to the pure TiO2 sample. This indicates that more –OH groups are
likely present in the binary sample. The peak at around 1550 and 1445 cm-1 for the pure
and doped samples is due to symmetric and asymmetric stretching of the zirconium
titanium acetate complex, respectively. 152 The frequency difference (∆) is ca. 100 cm-1
confirming that acetic acid formed bridging complexes with the metal ions. However, the
peak position is not the same for both samples. For undoped TiO2, the peaks are at 1550
and 1446 cm-1, which shifts slightly for the binary samples to 1546 and 1450 cm-1.
Therefore, the frequency difference (∆) also changed from 106 cm-1 for the pure TiO2
sample to 96 cm-1 for the binary sample. There is also a noticeable difference observed in
the spectra for the two systems around 1410 cm-1, where a sharp peak present at 1409 cm-
1 in pure titania, while a shoulder at 1415 cm-1 is visible for the binary system. The -CH3
group contributes to the small peak at 1343 cm-1 which is present for both samples. There
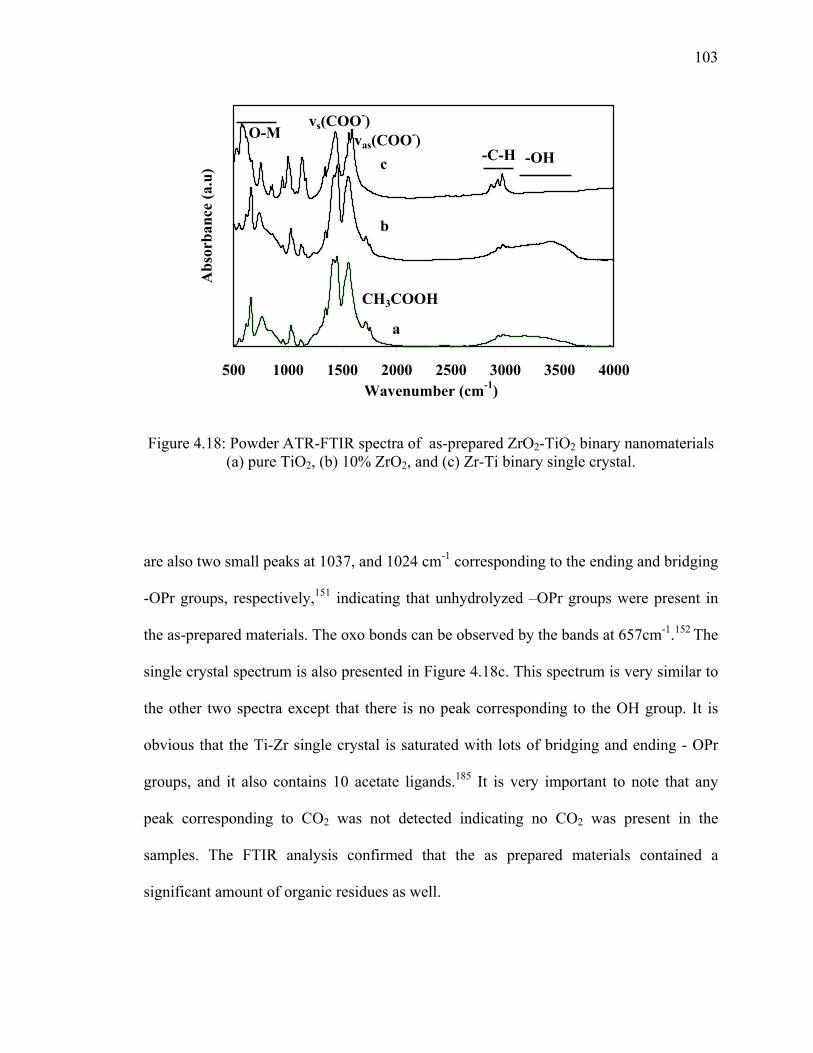
103
500 1000 1500 2000 2500 3000 3500 4000Wavenumber (cm-1)
Abs
orba
nce
(a.u
)
a
b
c -OH-C-Hvas(COO-)
vs(COO-)O-M
CH3COOH
Figure 4.18: Powder ATR-FTIR spectra of as-prepared ZrO2-TiO2 binary nanomaterials (a) pure TiO2, (b) 10% ZrO2, and (c) Zr-Ti binary single crystal.
are also two small peaks at 1037, and 1024 cm-1 corresponding to the ending and bridging
-OPr groups, respectively,151 indicating that unhydrolyzed –OPr groups were present in
the as-prepared materials. The oxo bonds can be observed by the bands at 657cm-1.152 The
single crystal spectrum is also presented in Figure 4.18c. This spectrum is very similar to
the other two spectra except that there is no peak corresponding to the OH group. It is
obvious that the Ti-Zr single crystal is saturated with lots of bridging and ending - OPr
groups, and it also contains 10 acetate ligands.185 It is very important to note that any
peak corresponding to CO2 was not detected indicating no CO2 was present in the
samples. The FTIR analysis confirmed that the as prepared materials contained a
significant amount of organic residues as well.
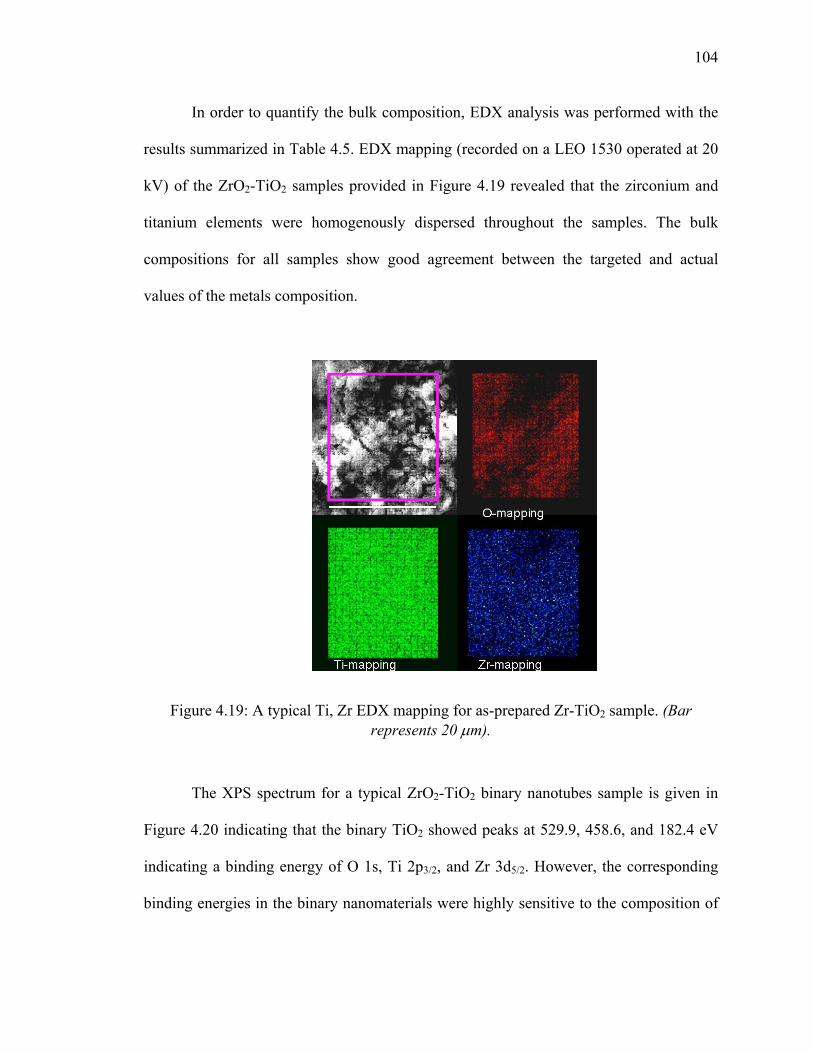
104
In order to quantify the bulk composition, EDX analysis was performed with the
results summarized in Table 4.5. EDX mapping (recorded on a LEO 1530 operated at 20
kV) of the ZrO2-TiO2 samples provided in Figure 4.19 revealed that the zirconium and
titanium elements were homogenously dispersed throughout the samples. The bulk
compositions for all samples show good agreement between the targeted and actual
values of the metals composition.
Figure 4.19: A typical Ti, Zr EDX mapping for as-prepared Zr-TiO2 sample. (Bar represents 20 μm).
The XPS spectrum for a typical ZrO2-TiO2 binary nanotubes sample is given in
Figure 4.20 indicating that the binary TiO2 showed peaks at 529.9, 458.6, and 182.4 eV
indicating a binding energy of O 1s, Ti 2p3/2, and Zr 3d5/2. However, the corresponding
binding energies in the binary nanomaterials were highly sensitive to the composition of
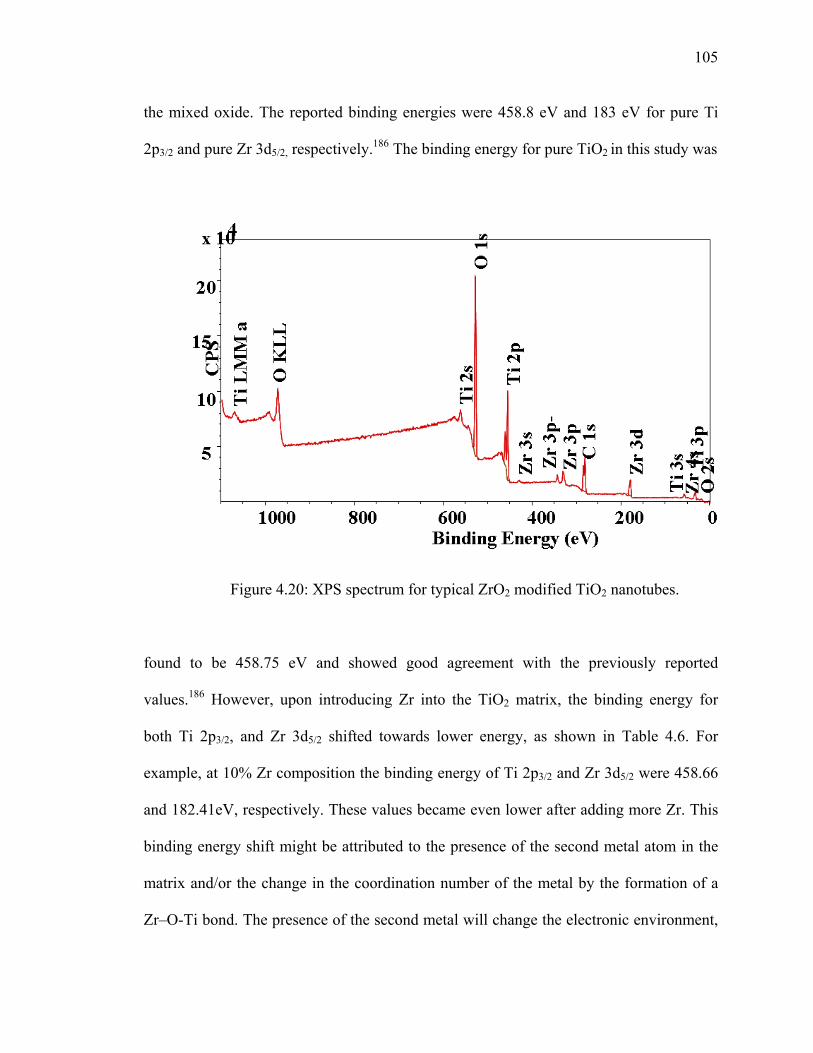
105
the mixed oxide. The reported binding energies were 458.8 eV and 183 eV for pure Ti
2p3/2 and pure Zr 3d5/2, respectively.186 The binding energy for pure TiO2 in this study was
Figure 4.20: XPS spectrum for typical ZrO2 modified TiO2 nanotubes.
found to be 458.75 eV and showed good agreement with the previously reported
values.186 However, upon introducing Zr into the TiO2 matrix, the binding energy for
both Ti 2p3/2, and Zr 3d5/2 shifted towards lower energy, as shown in Table 4.6. For
example, at 10% Zr composition the binding energy of Ti 2p3/2 and Zr 3d5/2 were 458.66
and 182.41eV, respectively. These values became even lower after adding more Zr. This
binding energy shift might be attributed to the presence of the second metal atom in the
matrix and/or the change in the coordination number of the metal by the formation of a
Zr–O-Ti bond. The presence of the second metal will change the electronic environment,

106
as well as the binding energy of the system. Similar results was observed by Reddy et
al.187 This analysis also indicates that the Zr atom was substituting for some Ti atoms in
the TiO2 lattice. The XPS analysis also revealed that the surface carbon content decreased
with increasing amount of Zr % as shown in Table 4.6. Comparison of the EDX and XPS
results reveal that the concentration of zirconia is higher on the surface compared to the
bulk composition. This surface enrichment phenonomenon is normally observed for this
binary system, as reported by Galindo et al.186 This result is attributed to the fact that XPS
considers only a few nm from the top of the surface, and zirconium (IV) propoxide is
more reactive than titanium (IV) isopropoxide.176 The pure TiO2 contained 43.2 at %
whereas 38.5 and 35 at % carbon are present in the binary 10 and 20% Zr containing
samples.
Table 4.6; Results of XPS analysis for selective Zr-Ti binary metal oxide nanostructures in scCO2
Sample Number
% carbon
Surface Zr mole %
T2p B.E. (eV)
Zr3d B. E.(eV)
O1s B.E.(eV) and area
(eV) % area
(eV) % area
Zr-TiO2-0 43.2 0 458.75 ----- 531.7 74.9 530.1 25.1 Zr-TiO2-10% 38.6 0.173 458.66 182.41 531.9 65.1 52.9 34.9 Zr-TiO2-20% 35.1 0.33 458.44 182.21 531.4 58.5 52.7 41.5
4.6.3. Thermal Decomposition Behavior
Thermogravimetric (TG) analysis was carried out to study the thermal
decomposition behavior of the synthesized binary nanostructure and the TG curves for
selective samples are given in Figure 4.21. The curves can be divided into three main
regions 20–120οC, 120–500οC and above 500 οC. The first region is attributed to the
removal of organic residues and physically adsorbed water present in the synthesized
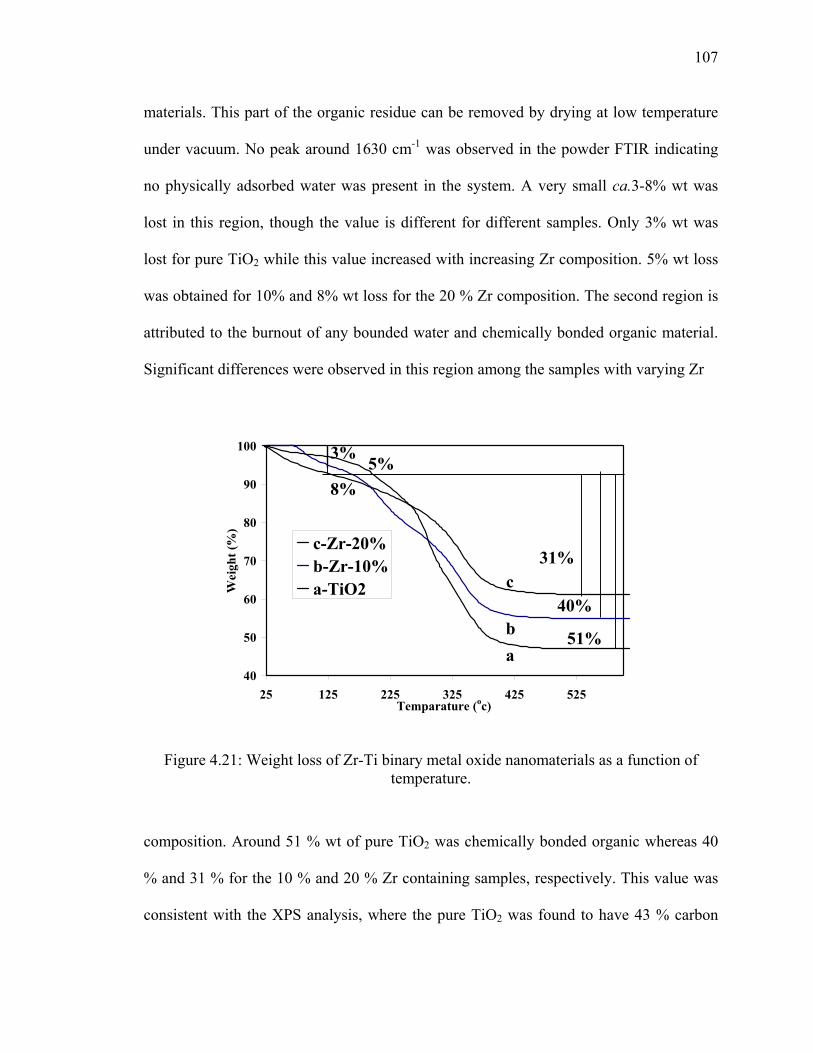
107
materials. This part of the organic residue can be removed by drying at low temperature
under vacuum. No peak around 1630 cm-1 was observed in the powder FTIR indicating
no physically adsorbed water was present in the system. A very small ca.3-8% wt was
lost in this region, though the value is different for different samples. Only 3% wt was
lost for pure TiO2 while this value increased with increasing Zr composition. 5% wt loss
was obtained for 10% and 8% wt loss for the 20 % Zr composition. The second region is
attributed to the burnout of any bounded water and chemically bonded organic material.
Significant differences were observed in this region among the samples with varying Zr
40
50
60
70
80
90
100
25 125 225 325 425 525Temparature (oc)
Wei
ght (
%)
c-Zr-20%b-Zr-10%a-TiO2
ba
c
3% 5%8%
51%
31%
40%
Figure 4.21: Weight loss of Zr-Ti binary metal oxide nanomaterials as a function of temperature.
composition. Around 51 % wt of pure TiO2 was chemically bonded organic whereas 40
% and 31 % for the 10 % and 20 % Zr containing samples, respectively. This value was
consistent with the XPS analysis, where the pure TiO2 was found to have 43 % carbon

108
content. The at.% of carbon content decreased with Zr composition such as 38 % carbon
present in the 10% samples, whereas only 35 % was present in the 20 % Zr composition.
The weight loss over 500οC is extremely small and is attributed to the removal of
bounded water. This TG analysis also demonstrated that higher Zr containing samples
were more condensed compared to pure TiO2, resulting in lower wt lost and a lower heat
induced effect. In other words, it can be said that the higher %Zr containing samples had
lower shrinkage and higher thermal stability.
4.6.4. Phase Structure and Crystallite Size
The effect of the Zr composition on the crystal size and phase structure was
investigated by performing XRD analysis. The XRD patterns for all the samples calcined
at 500 oC (except 20% Zr sample was amorphous) are given in Figure 4.22, indicating
that the ZrO2-TiO2 binary nanomaterials consists of anatase crystal. There is no distinct
zirconia peak, indicating no phase separation and that the Zr is well integrated into the
anatase crystal structure for all investigated compositions. However, pure TiO2 contains a
very small rutile phase (4%) at this temperature. With increasing %Zr composition, the
main (101) anatase peak shifts to lower 2-theta values, resulting in an increase in the d-
spacing. The sizes of the crystallites, phase and lattice parameters were determined from
the XRD peak boarding and are given in Table 4.5. The crystallite sizes decrease with
increasing Zr composition, i.e. for pure TiO2 crystallites were 14 nm whereas 10% Zr
content crystallites were 12.2 nm. The Zr ion can either go into interstitial positions or
substitute for Ti4+ at lattice points. 188 Any substitution or insertion of a Zirconium ion for
a titanium ion in the TiO2 lattice would introduce a distortion, and change the cell

109
parameters. The TiO2 anatase unit crystal is tetragonal, with lattice parameters ‘a’ and ‘c’.
Therefore, the lattice parameters a’ and ‘c’ were calculated using the peak values of the
anatase (101) and (200) reflections via Equations 3.2 and 3.3 and are provided in Table
4.5. According to the calculated data, the lattice parameter (‘a’ and ‘c’) increase with
dopant addition (changed of the value of ‘a’ is insignificant), consequently the cell
volume increases.85 The cell volume of pure TiO2 was 136.57 Ǻ, whereas 10% Zr
containing sample showed 138.47 Ǻ. These results are consistent with previously
reported cell volume for Ti-Zr binary solid solution prepared by Yu et al.189 Moreover,
this result is expected because the effective ionic radii of Ti4+ and Zr4
+ are 0.68 and 0.79
Å, respectively105 and any substitution would increase the cell volume.
10 20 30 40 50 60 70 80
2-Theta (degree)
Inte
nsity
(a.u
)
a-TiO2b-Zr-4%c-Zr-6%d-Zr-8%e-Zr-10%
a
b
c
d
e
A
A AA A
A
R
Figure 4.22: XRD patterns for Zr-Ti binary metal oxide nanomaterials with various % ZrO2 compositions.
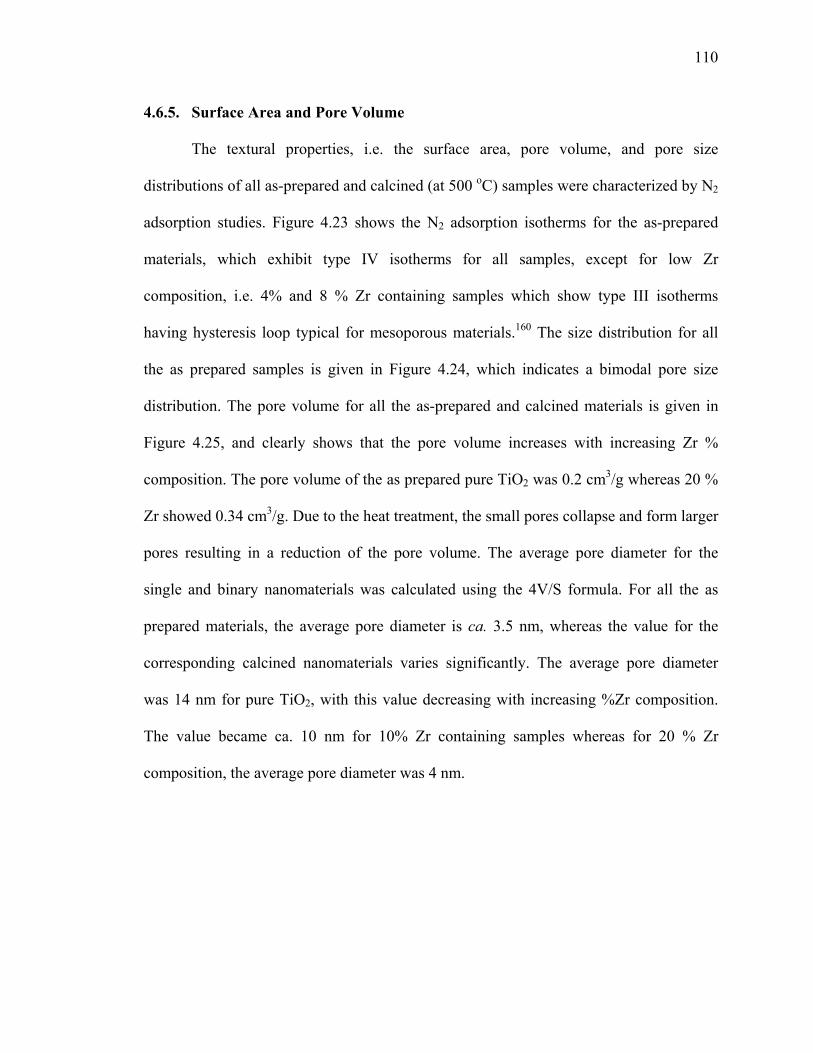
110
4.6.5. Surface Area and Pore Volume
The textural properties, i.e. the surface area, pore volume, and pore size
distributions of all as-prepared and calcined (at 500 oC) samples were characterized by N2
adsorption studies. Figure 4.23 shows the N2 adsorption isotherms for the as-prepared
materials, which exhibit type IV isotherms for all samples, except for low Zr
composition, i.e. 4% and 8 % Zr containing samples which show type III isotherms
having hysteresis loop typical for mesoporous materials.160 The size distribution for all
the as prepared samples is given in Figure 4.24, which indicates a bimodal pore size
distribution. The pore volume for all the as-prepared and calcined materials is given in
Figure 4.25, and clearly shows that the pore volume increases with increasing Zr %
composition. The pore volume of the as prepared pure TiO2 was 0.2 cm3/g whereas 20 %
Zr showed 0.34 cm3/g. Due to the heat treatment, the small pores collapse and form larger
pores resulting in a reduction of the pore volume. The average pore diameter for the
single and binary nanomaterials was calculated using the 4V/S formula. For all the as
prepared materials, the average pore diameter is ca. 3.5 nm, whereas the value for the
corresponding calcined nanomaterials varies significantly. The average pore diameter
was 14 nm for pure TiO2, with this value decreasing with increasing %Zr composition.
The value became ca. 10 nm for 10% Zr containing samples whereas for 20 % Zr
composition, the average pore diameter was 4 nm.
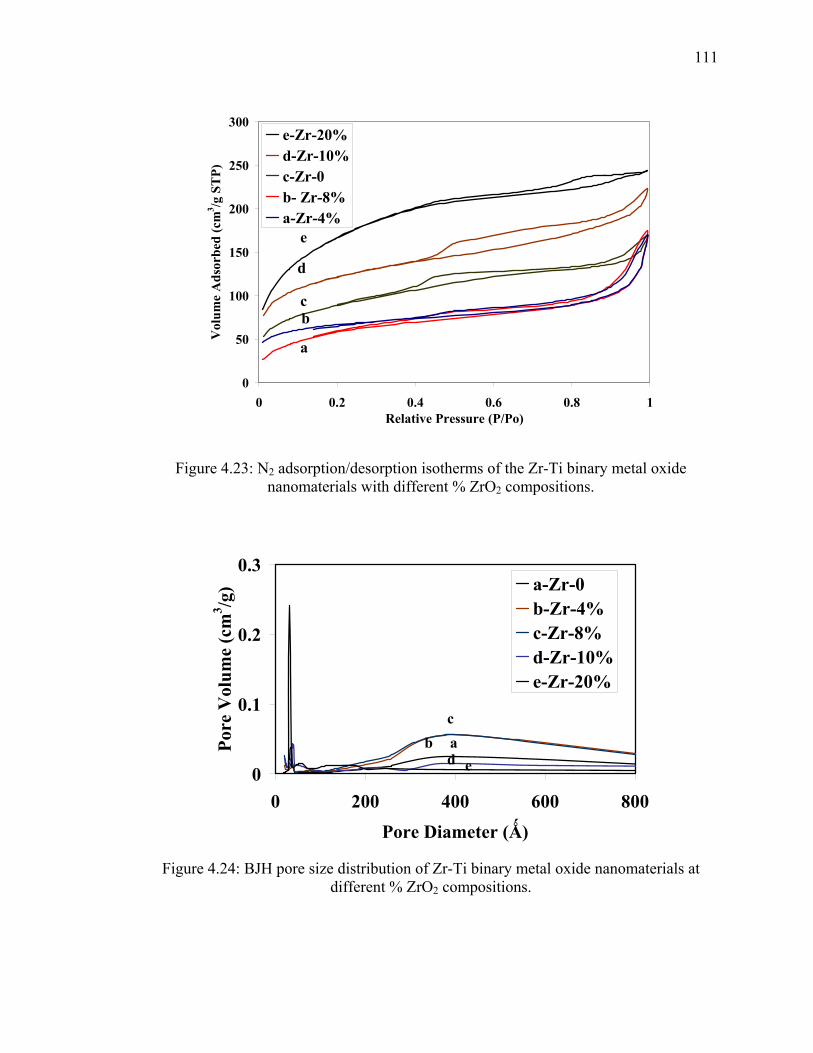
111
0
50
100
150
200
250
300
0 0.2 0.4 0.6 0.8 1Relative Pressure (P/Po)
Vol
ume
Ads
orbe
d (c
m3 /g
ST
P)
e-Zr-20%d-Zr-10%c-Zr-0b- Zr-8%a-Zr-4%
a
bc
d
e
Figure 4.23: N2 adsorption/desorption isotherms of the Zr-Ti binary metal oxide nanomaterials with different % ZrO2 compositions.
0
0.1
0.2
0.3
0 200 400 600 800Pore Diameter (Ǻ)
Pore
Vol
ume
(cm
3 /g) a-Zr-0
b-Zr-4%c-Zr-8%d-Zr-10%e-Zr-20%
ad e
bc
Figure 4.24: BJH pore size distribution of Zr-Ti binary metal oxide nanomaterials at
different % ZrO2 compositions.
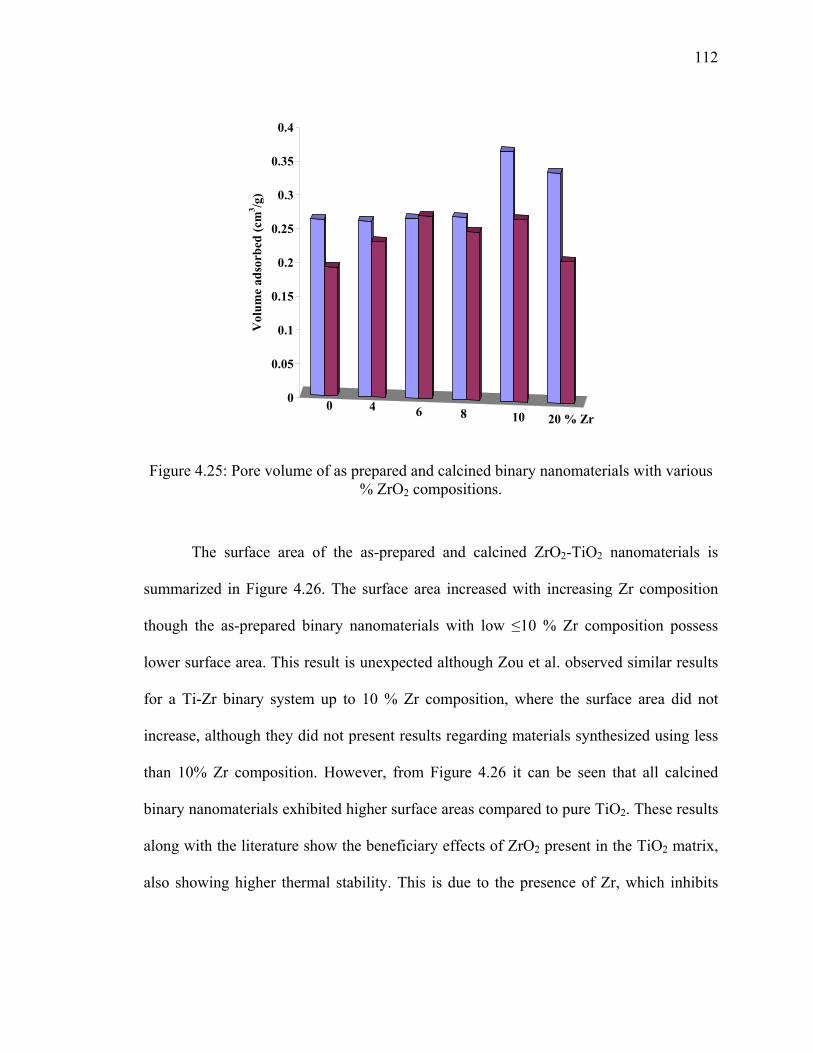
112
0
0.05
0.1
0.15
0.2
0.25
0.3
0.35
0.4
Vol
ume
adso
rbed
(cm
3 /g)
0 4 6 8 10 20 % Zr
Figure 4.25: Pore volume of as prepared and calcined binary nanomaterials with various % ZrO2 compositions.
The surface area of the as-prepared and calcined ZrO2-TiO2 nanomaterials is
summarized in Figure 4.26. The surface area increased with increasing Zr composition
though the as-prepared binary nanomaterials with low ≤10 % Zr composition possess
lower surface area. This result is unexpected although Zou et al. observed similar results
for a Ti-Zr binary system up to 10 % Zr composition, where the surface area did not
increase, although they did not present results regarding materials synthesized using less
than 10% Zr composition. However, from Figure 4.26 it can be seen that all calcined
binary nanomaterials exhibited higher surface areas compared to pure TiO2. These results
along with the literature show the beneficiary effects of ZrO2 present in the TiO2 matrix,
also showing higher thermal stability. This is due to the presence of Zr, which inhibits
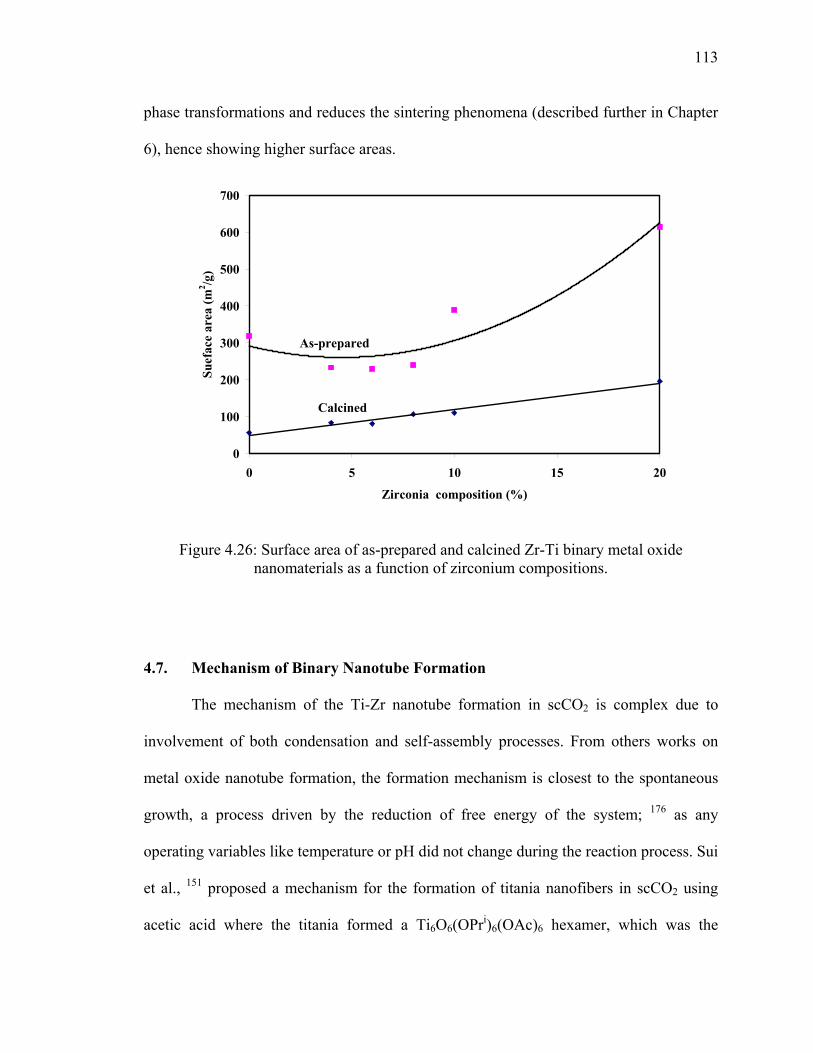
113
phase transformations and reduces the sintering phenomena (described further in Chapter
6), hence showing higher surface areas.
0
100
200
300
400
500
600
700
0 5 10 15 20
Zirconia composition (%)
Suef
ace
area
(m2 /g
)
As-prepared
Calcined
Figure 4.26: Surface area of as-prepared and calcined Zr-Ti binary metal oxide nanomaterials as a function of zirconium compositions.
4.7. Mechanism of Binary Nanotube Formation
The mechanism of the Ti-Zr nanotube formation in scCO2 is complex due to
involvement of both condensation and self-assembly processes. From others works on
metal oxide nanotube formation, the formation mechanism is closest to the spontaneous
growth, a process driven by the reduction of free energy of the system; 176 as any
operating variables like temperature or pH did not change during the reaction process. Sui
et al., 151 proposed a mechanism for the formation of titania nanofibers in scCO2 using
acetic acid where the titania formed a Ti6O6(OPri)6(OAc)6 hexamer, which was the

114
proposed building block for formation of the titania nanofibers. Similarly, single crystals
of acid modified Zr-Ti alkoxide were also synthesized in scCO2, as shown in Figure
4.27a.185 The Zr modified (Zr2Ti4(μ3-O)4(OPr)4(μ-OPr)2(μ -OAc)10) hexamer is quite
different from the previously observed titania hexamer. Figure 4.27b shows a typical unit
cell containing four single units along the [100] plane in which the four end -OPr groups
are situated on top, the other four groups on the bottom, and only two groups are present
along the side. During the polycondensation process, the end -OPr groups will likely
preferentially condense.99 Furthermore, it is easier for cells to connect at the edge instead
of the face.99 Moreover, upon introducing Zr into the system, the Zr with different
coordination number acts as an impurity in the structure, which is one of the required
conditions for preferential condensation in one direction, usually known as anisotropic
growth.176 Hence, it is believed that a long sheet-type structure along the [100] plane was
developed in the synthesis process. Moreover, the 150-375 nm width and several
nanometer long dimensions of the sheet observed by SEM &TEM and given in section
4.4 were very close to that of the formed nanotubes, demonstrating these sheets play a
key role in formation of the tubular structure. One can envision that as the sheet structure
grows, at a certain stage in order to lower the energy of the system, it either rolls-up or
folds along the [010] or [001] plane to form the tubular structure as shown in Figure
4.27(c). This “roll-up” mechanism has been used to explain the tubular structure of
titanates and titania synthesized via the hydrothermal process,106, 188 and Cr doped
alumina nanotubes via homogeneous precipitation upon heat treatment.
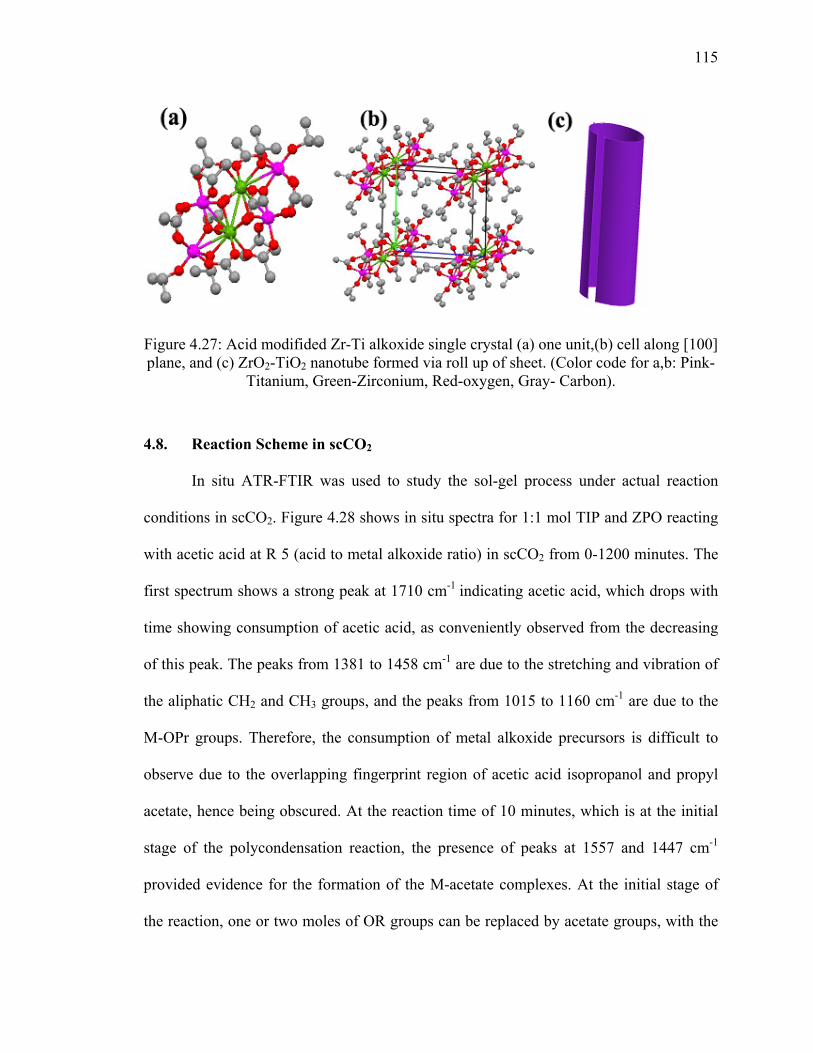
115
Figure 4.27: Acid modifided Zr-Ti alkoxide single crystal (a) one unit,(b) cell along [100] plane, and (c) ZrO2-TiO2 nanotube formed via roll up of sheet. (Color code for a,b: Pink-
Titanium, Green-Zirconium, Red-oxygen, Gray- Carbon).
4.8. Reaction Scheme in scCO2
In situ ATR-FTIR was used to study the sol-gel process under actual reaction
conditions in scCO2. Figure 4.28 shows in situ spectra for 1:1 mol TIP and ZPO reacting
with acetic acid at R 5 (acid to metal alkoxide ratio) in scCO2 from 0-1200 minutes. The
first spectrum shows a strong peak at 1710 cm-1 indicating acetic acid, which drops with
time showing consumption of acetic acid, as conveniently observed from the decreasing
of this peak. The peaks from 1381 to 1458 cm-1 are due to the stretching and vibration of
the aliphatic CH2 and CH3 groups, and the peaks from 1015 to 1160 cm-1 are due to the
M-OPr groups. Therefore, the consumption of metal alkoxide precursors is difficult to
observe due to the overlapping fingerprint region of acetic acid isopropanol and propyl
acetate, hence being obscured. At the reaction time of 10 minutes, which is at the initial
stage of the polycondensation reaction, the presence of peaks at 1557 and 1447 cm-1
provided evidence for the formation of the M-acetate complexes. At the initial stage of
the reaction, one or two moles of OR groups can be replaced by acetate groups, with the
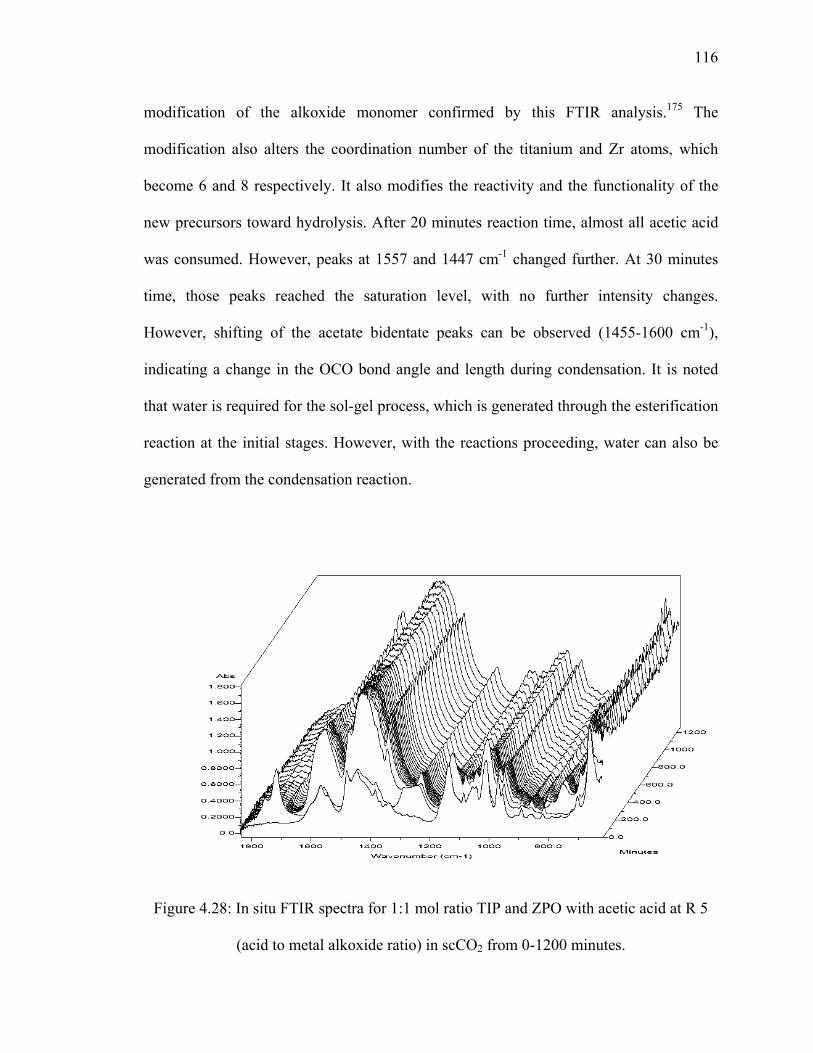
116
modification of the alkoxide monomer confirmed by this FTIR analysis.175 The
modification also alters the coordination number of the titanium and Zr atoms, which
become 6 and 8 respectively. It also modifies the reactivity and the functionality of the
new precursors toward hydrolysis. After 20 minutes reaction time, almost all acetic acid
was consumed. However, peaks at 1557 and 1447 cm-1 changed further. At 30 minutes
time, those peaks reached the saturation level, with no further intensity changes.
However, shifting of the acetate bidentate peaks can be observed (1455-1600 cm-1),
indicating a change in the OCO bond angle and length during condensation. It is noted
that water is required for the sol-gel process, which is generated through the esterification
reaction at the initial stages. However, with the reactions proceeding, water can also be
generated from the condensation reaction.
Figure 4.28: In situ FTIR spectra for 1:1 mol ratio TIP and ZPO with acetic acid at R 5
(acid to metal alkoxide ratio) in scCO2 from 0-1200 minutes.
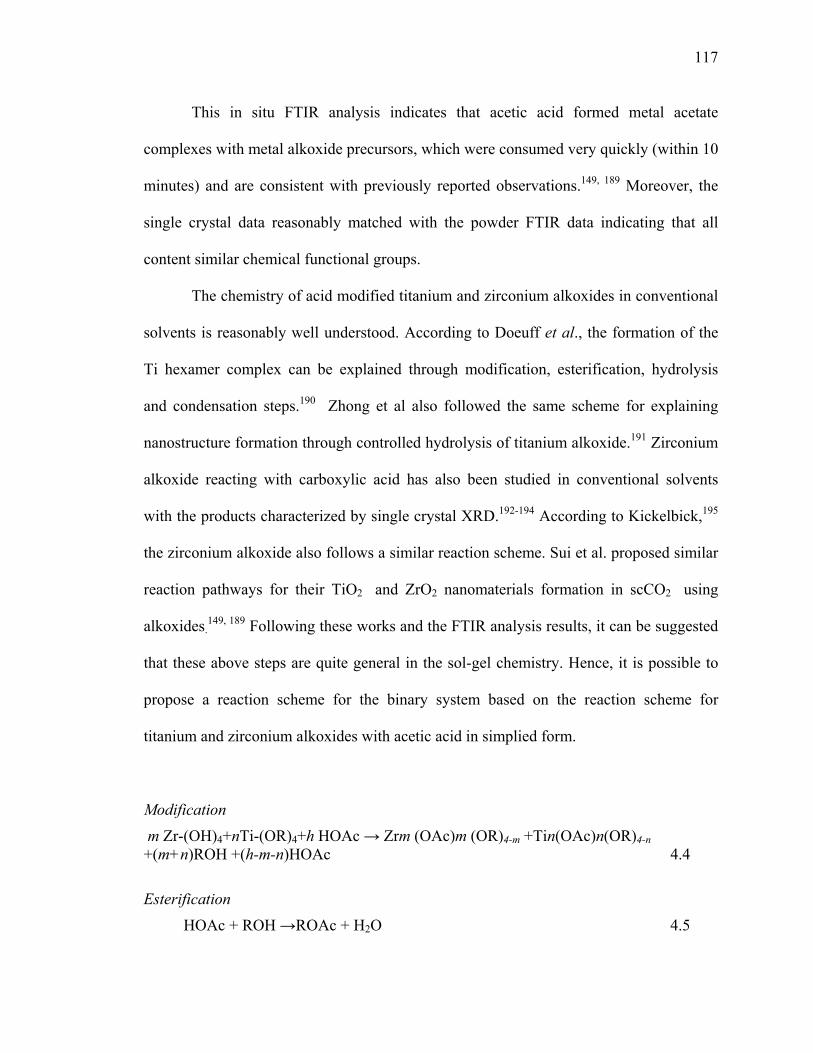
117
This in situ FTIR analysis indicates that acetic acid formed metal acetate
complexes with metal alkoxide precursors, which were consumed very quickly (within 10
minutes) and are consistent with previously reported observations.149, 189 Moreover, the
single crystal data reasonably matched with the powder FTIR data indicating that all
content similar chemical functional groups.
The chemistry of acid modified titanium and zirconium alkoxides in conventional
solvents is reasonably well understood. According to Doeuff et al., the formation of the
Ti hexamer complex can be explained through modification, esterification, hydrolysis
and condensation steps.190 Zhong et al also followed the same scheme for explaining
nanostructure formation through controlled hydrolysis of titanium alkoxide.191 Zirconium
alkoxide reacting with carboxylic acid has also been studied in conventional solvents
with the products characterized by single crystal XRD.192-194 According to Kickelbick,195
the zirconium alkoxide also follows a similar reaction scheme. Sui et al. proposed similar
reaction pathways for their TiO2 and ZrO2 nanomaterials formation in scCO2 using
alkoxides.149, 189 Following these works and the FTIR analysis results, it can be suggested
that these above steps are quite general in the sol-gel chemistry. Hence, it is possible to
propose a reaction scheme for the binary system based on the reaction scheme for
titanium and zirconium alkoxides with acetic acid in simplied form.
Modification
m Zr-(OH)4+nTi-(OR)4+h HOAc → Zrm (OAc)m (OR)4-m +Tin(OAc)n(OR)4-n +(m+n)ROH +(h-m-n)HOAc 4.4
Esterification
HOAc + ROH →ROAc + H2O 4.5

118
Hydrolysis
Zrm(OAc)m (OR)4-m + x H2O → Zrm(OAc)m(OR)4-m-x (OH)x + x ROH 4.6
Tin(OAc)n (OR)4-n + y H2O → Tin(OAc)n(OR)4-n-y (OH)y + y ROH 4. 7
Oxolation
Zrm(OAc)m(OR)4-m-x (OH)x → Zrm Ox (OAc)m(OR)4-m-x’ + x ROH 4.8
Tin(OAc)n (OR)4-n-y (OH)y → Tin Oy (OAc)y(OR)4-n-y’ + y ROH 4.9
Condensation
ZrmOx (OAc)m(OR)4-m-x’ + TinOy (OAc)n(OR)4-n-y → macromolecules
Ti-O-Ti, Ti-O-Zr, Zr-O-Zr 4.10
It should be mentioned that although the binary system likely follows the same
reaction schemes, the relative rate of the reaction steps will be different, requiring careful
further study.
4.9. Conclusions
The systematic investigation on the operating variables of ZrO2-TiO2 binary
nanotubes revealed that the most important process variables were temperature,
concentration acid/metal alkoxide ratio and composition. The morphology could be
tailored by changing the operating variables. Moreover, nanotubes were only formed at
concentration 1.17 mol/L using R 5-6 and 60 oC. The initial gelation kinetics for this
system were studied and revealed that temperature, concentration of the starting
materials, and the acid to metal (Zr and Ti) alkoxide ratio were the main factors which
alter the gelation kinetics, as well as the basic properties of the synthesized
nanomaterials. The activation energy for this 10% ZrO2 modified system was 44 kJ/mol,
calculated from an Arrhenius plot. Moreover, powder XRD analysis indicated that the

119
crystal size decreased with increasing zirconia content. BET analysis showed that higher
than 10% Zr containing as-prepared and calcined binary metal oxide nanomaterials
possessed higher surface areas compared to pure TiO2. These results demonstrated that
the presence of a small amount of ZrO2 in TiO2 matrix inhibited the grain growth,
stabilized the anatase phase, and increased the thermal stability, resulting in larger surface
area, pore volume and small crystallites materials. The in-situ FTIR study revealed that
binary system also follows the similar reaction scheme as the single component TiO2 or
ZrO2 systems.
120
CHAPTER 5
EFFECTS OF SOLVENT ON ZrO2-TiO2 BINARY
NANOSTRUCTURE FORMATION
5. Introduction
The sol–gel process is becoming a standard synthesis route to produce low cost,
high quality, homogeneous oxide materials with desired nanostructure.96, 196 However, the
properties of the sol-gel products depend on the precursors, processing temperature,
catalyst, solvents, and solvent removal process.99 Among these experimental parameters,
the precursors, catalyst and solvent have prominent influences on the reaction pathways
of the synthesis process. Usually, the sol–gel process involves the hydrolysis of a metal
precursor in an appropriate solvent with or without the use of a catalyst to form
hydroxide, and subsequent polycondensation to provide the gel.196 The hydrolysis
reaction is catalyzed by acid, and the condensation reaction is catalyzed by base. At the
end of the polycondensation reaction, the excess solvent can be removed by evaporation
in an oven at atmospheric pressure or by employing supercritical drying.
The solvents used in the sol-gel process play an important role in the hydrolysis
and condensation steps, as well as facilitating the porosity of the synthesized materials.197,
198 The removal of working/residual solvent also has a prominent impact on the final
materials.199 The conventional heating/evaporation process may form xerogel resulting in
low surface areas due to collapsing the pore structure of the material. On the other hand,
recent studies suggest that mesoporous high surface areas of the final product can be
obtained by supercritical (scCO2) drying.150 The scCO2 drying technique also provides

121
desirable morphological characteristics of the synthesized materials.200 Therefore, the
solvent elimination route might affect not only the surface features, but also the bulk and
the morphological characteristics of the synthesized materials.200
Therefore, the purpose of this study was to investigate the influence of the
solvents used for synthesis by studying common sol-gel solvents of varying dielectric
constants, along with scCO2, on the morphology, crystal structure, crystal size, surface
area, pore volume and pore size distribution of Zr modified titania nanomaterials
synthesized by a sol-gel process. The solvents, hexane, xylenes, isopropyl alcohol and
ethanol (dielectric constant and physical properties given in Table 5.1) along with scCO2
were used. In all cases, excess solvents and reaction by-products were removed by scCO2
drying to separate the beneficiary effect of scCO2 drying from the synthesis steps.
Table 5.1: Physical properties and dielectric constant of the solvents used in this study.
*- The solubility parameters of CO2 were obtained from Allada’s method, while the other
solvents were calculated using: V
RTHV −Δ=δ
where, V is the molar volume of the liquid in cm3/mol, VHΔ is the enthalpy change during vaporization in cal/mol, R is the gas law constant in cal/(mol·K), and T is the absolute temperature in K.
Solvent Dielectric Constant
(ε)
Surface Tension
(mN./m)20
1
Viscosity (mPa.s)201
Solubility parameters, (cal/cm3)1/2 *
CO2 1.6 0.00 0.070 6.65 Hexane 1.6 17.9 0.532 7.26 Xylenes 2.4 29.5 0.121 8.81
Iso-propanol 18.3 21.2 0.310 11.54 Ethanol 24.3 21.9 0.035 12.73
122
5.1. Experimental
In a typical experiment, 3 mL titanium (IV) isopropoxide, 0.48 mL zirconium
(IV) propoxide, 3.16 mL acetic acid and CO2/3mL solvent were quickly placed in a 10
mL view cell at 60°C under stirring. Initially a transparent homogeneous phase was
observed. However, the entire view cell was filled with gel and the stir bar was not
observed within 30 min to several hours depending on the solvent used. This time was
considered as the gel point,148 which for every experiment was determined twice.
5.2. Morphology
ZrO2 modified TiO2 nanomaterials were synthesized via an acid modified sol-gel
process in various organic solvents and scCO2. The morphology and particle size of the
as-prepared and calcined ZrO2-TiO2 nanotubes were assessed by SEM and TEM analysis.
Figure 5.1 and Figure 5.2 show the SEM and TEM micrographs of the samples prepared
using the examined solvents for this study. When materials were synthesized in scCO2,
nanotubes having diameters of 55-140 nm and several µm in length were produced, as
previously discussed and shown in Fig. 5.1(a). Samples with various morphologies were
obtained when hexane, xylenes, or alcohol were used as the working solvent. As
observed in these micrographs, the as-prepared powders were composed of one
dimensional structure, although their size and morphologies were rather different
depending upon the solvent used in their preparation step. Nanorods and/or tubes with
diameter ranging from 40-250 nm were seen when the samples were prepared in xylenes,
and ethanol. When hexane was used as the solvent, the rod/tube diameters were formed
between 40-120 nm. However, in all cases the lengths of the nanorods/nanotubes were
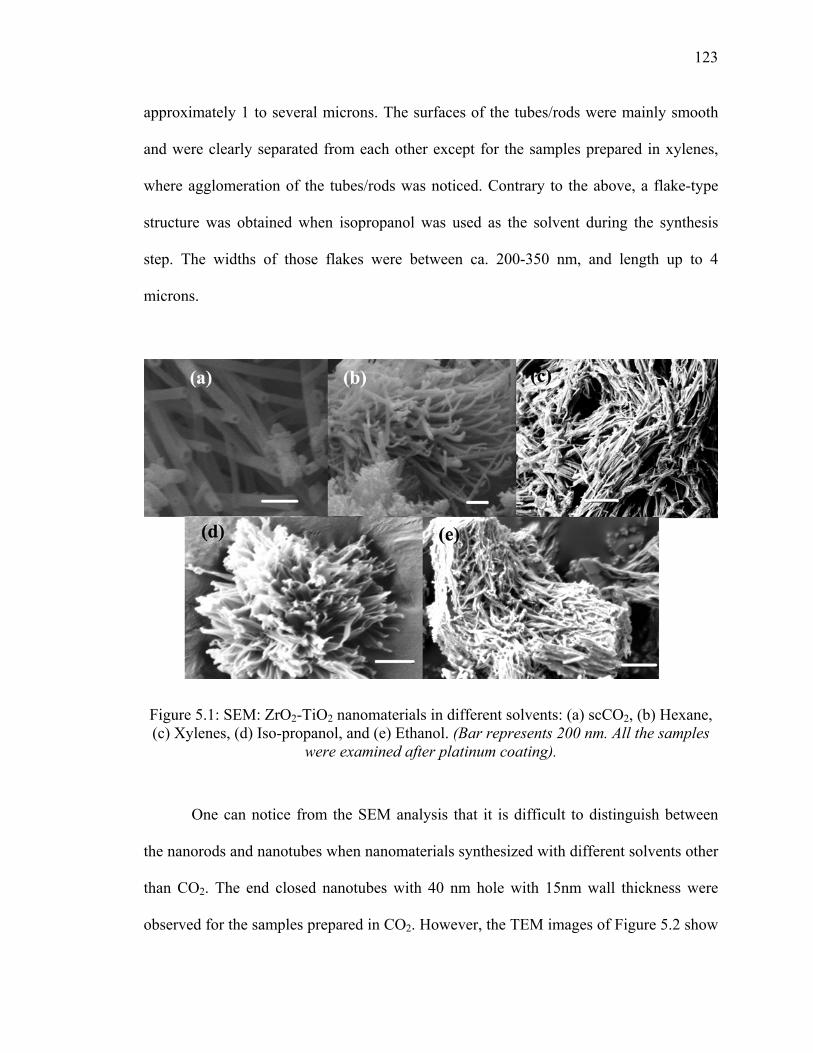
123
approximately 1 to several microns. The surfaces of the tubes/rods were mainly smooth
and were clearly separated from each other except for the samples prepared in xylenes,
where agglomeration of the tubes/rods was noticed. Contrary to the above, a flake-type
structure was obtained when isopropanol was used as the solvent during the synthesis
step. The widths of those flakes were between ca. 200-350 nm, and length up to 4
microns.
Figure 5.1: SEM: ZrO2-TiO2 nanomaterials in different solvents: (a) scCO2, (b) Hexane, (c) Xylenes, (d) Iso-propanol, and (e) Ethanol. (Bar represents 200 nm. All the samples
were examined after platinum coating).
One can notice from the SEM analysis that it is difficult to distinguish between
the nanorods and nanotubes when nanomaterials synthesized with different solvents other
than CO2. The end closed nanotubes with 40 nm hole with 15nm wall thickness were
observed for the samples prepared in CO2. However, the TEM images of Figure 5.2 show

124
very narrow internal holes (ca. 10 nm) along the length, with thickness ca. 40 nm in the
case of the larger diameter structures synthesized under hexane. However, the materials
with small diameters were solid indicating a rod-type structure. The flakes type structure
presented in the TEM images for calcined materials synthesized in iso-propanol support
the SEM analysis. However, due to the thick wall of the materials synthesized using
ethanol, it is very difficult to distinguish even by TEM whether the nanostructures are
rods or tubes. Therefore, from this observation it appears that materials with larger
diameters form thick wall tubes, while the smaller diameter materials are rods.
Figure 5.2: TEM: ZrO2-TiO2 nanomaterials in different solvents (a) scCO2, (b) Hexane, (c) Xylenes, (d) Iso-propanol, and (e) Ethanol. (Bar represents 300 nm. All samples were
calcined at 500°C).
When the calcined samples were analyzed by TEM, the materials synthesized in
scCO2, hexane, xylenes and isopropanol were composed of connected crystallites, while
125
the material synthesized in ethanol was mainly solid. This analysis illustrates that the
solvent used for nanotubular synthesis has a significant effect on the morphology and the
dimensions of the products.
5.3. Composition
In order to obtain more information about the presence and intensity of the
different functional groups, the prepared ZrO2-TiO2 samples were further characterized
using ATR-FTIR analysis. The powder IR spectra of the as-prepared materials
synthesized in the various solvents are shown in Figure 5.3. As can be seen in this figure,
all the samples had similar spectra although their peak heights were different depending
on the solvent used for preparation. The broad peak at 3300 cm-1 was assigned to the -OH
group of absorbed water152 while the peaks at 1548 and 1452 cm-1 are due to symmetric
and asymmetric stretching of zirconium titanium acetate complexes, respectively. The
delta value (ca. 100 cm-1) between these symmetric and asymmetric stretching peaks
confirmed that the acetic acid group formed bridging complexes with the metal atoms.152
The small peak at 1343 cm-1 indicates the presence of the -CH3 group,151 while the two
small peaks appearing at 1037 and 1024 cm-1 are attributed to the ending and bridging -
OPr groups, respectively. The presence of unhydrolyzed –OPr groups in the as-prepared
materials has also been reported in nanomaterials prepared under similar conditions.120,
198 All spectra contain a small peak at 1710 cm-1, due to residual acetic acid, and bands
below 657cm-1, representing oxo bonds. It is important to emphasize that no solvent
peaks were detected from the preparation of the various samples, indicating complete
removal of the solvent through scCO2 drying.
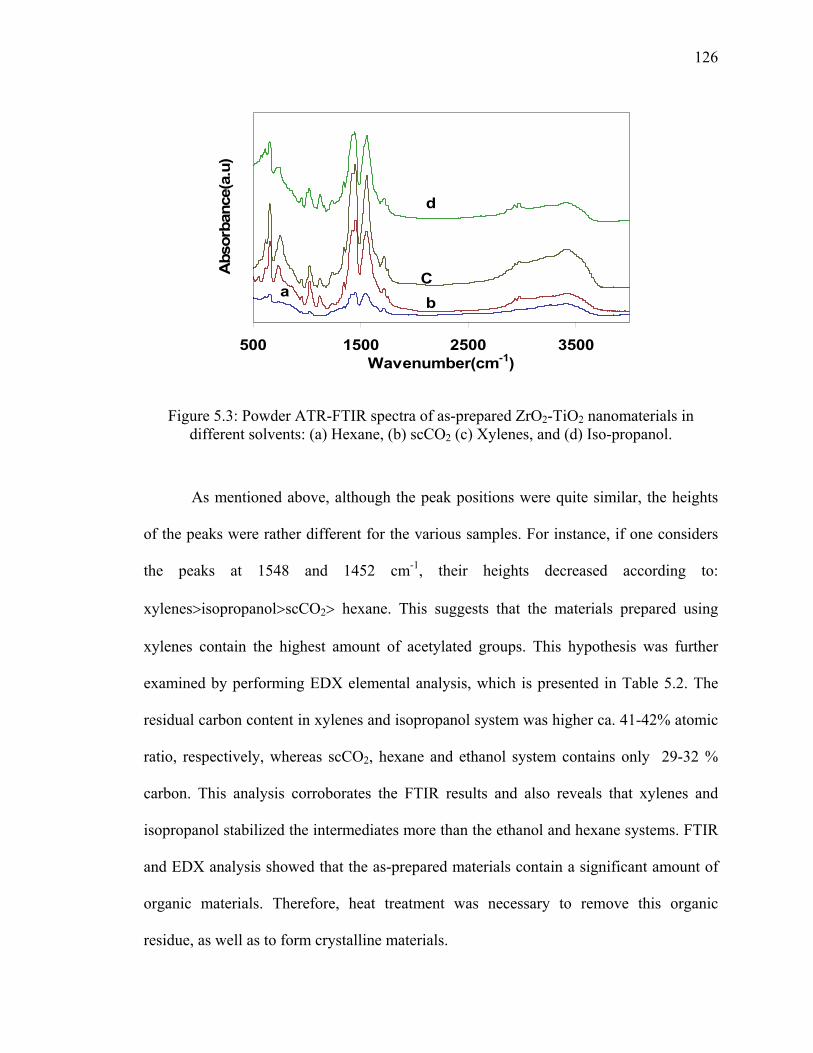
126
500 1500 2500 3500Wavenumber(cm-1)
Abs
orba
nce(
a.u)
ab
C
d
Figure 5.3: Powder ATR-FTIR spectra of as-prepared ZrO2-TiO2 nanomaterials in different solvents: (a) Hexane, (b) scCO2 (c) Xylenes, and (d) Iso-propanol.
As mentioned above, although the peak positions were quite similar, the heights
of the peaks were rather different for the various samples. For instance, if one considers
the peaks at 1548 and 1452 cm-1, their heights decreased according to:
xylenes>isopropanol>scCO2> hexane. This suggests that the materials prepared using
xylenes contain the highest amount of acetylated groups. This hypothesis was further
examined by performing EDX elemental analysis, which is presented in Table 5.2. The
residual carbon content in xylenes and isopropanol system was higher ca. 41-42% atomic
ratio, respectively, whereas scCO2, hexane and ethanol system contains only 29-32 %
carbon. This analysis corroborates the FTIR results and also reveals that xylenes and
isopropanol stabilized the intermediates more than the ethanol and hexane systems. FTIR
and EDX analysis showed that the as-prepared materials contain a significant amount of
organic materials. Therefore, heat treatment was necessary to remove this organic
residue, as well as to form crystalline materials.

127
The thermal decomposition behavior of the synthesized materials was carried out
by employing TG–DTG analysis, with typical TG-DTG curves being given in Figure 5.4.
It is interesting to note that all the samples showed four steps, although the peak positions
varied depending on the solvent used in their preparation. In all cases, the sample
decomposition contains the four following steps: (I) 25–120 ºC, (II) 120–260 ºC, (III)
260-500 ºC and (IV) above 500 ºC.
0
20
40
60
80
100
30 130 230 330 430 530
Temperature (oC)
Wei
ght (
%)
-0.05
0
0.05
0.1
0.15
0.2
0.25
Der
iv.W
eigh
t (%
/oC
)
Stage1 Stage2 Stage3Stage4
Figure 5.4: A typical TG/DTG curve for ZrO2-TiO2 nanomaterials synthesized in hexane.
Table 5.2: Composition and weight loss at different stages of thermal analysis. Solvent Composition
C: O: Ti:Zra Stage 1
25-120οC Stage 2
120-260οC Stage 3
260-500οC Total wt
loss T p1(οC) Wt.(%) T p2(οC) Wt.(%) T p3(οC) Wt.(%)
CO2 31:55:13:2 40 6.02 200 20.68 343 18.97 45.72 Hexane 32:54:12:2 75 6.31 198 19.29 333 22.02 47.92 Xylenes 41:50:8:1 86 5.61 191 38.04 425 13.54 59.01
Iso-propanol 42:54:7:1 95 4.55 236 42.95 319 8.88 57.59 Ethanol 29:61:9:1 53 10.07 196 14.11 336 22.5 49.34
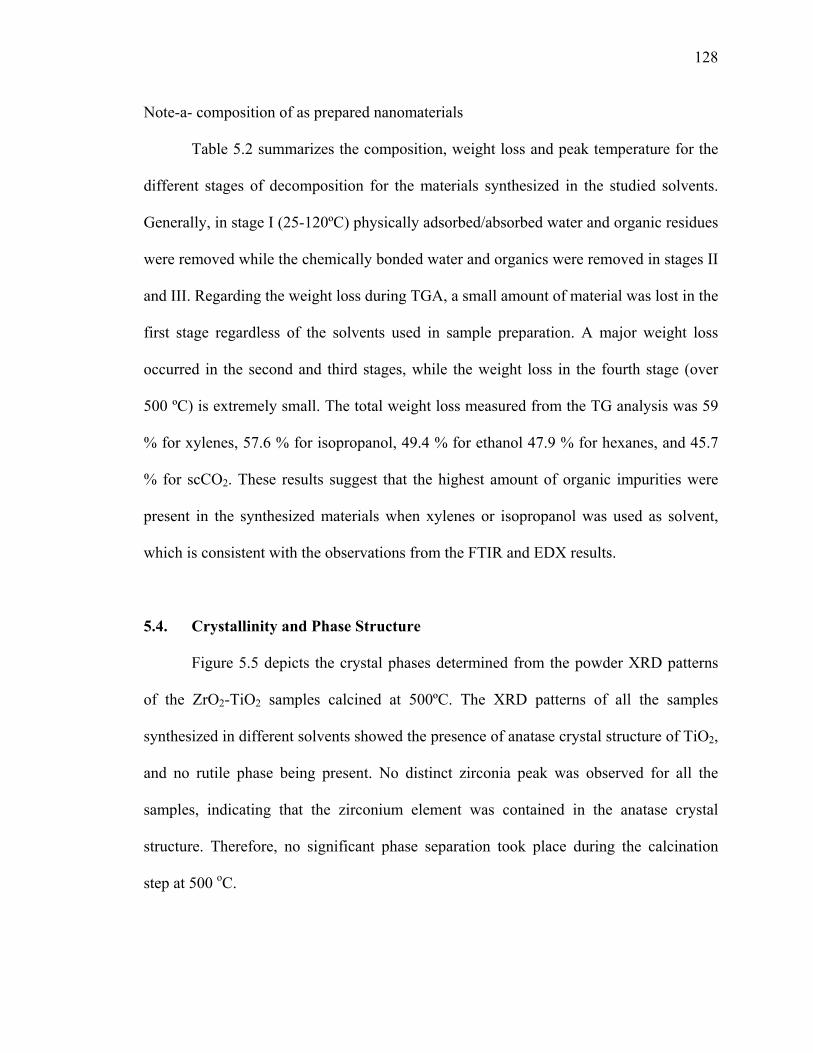
128
Note-a- composition of as prepared nanomaterials
Table 5.2 summarizes the composition, weight loss and peak temperature for the
different stages of decomposition for the materials synthesized in the studied solvents.
Generally, in stage I (25-120ºC) physically adsorbed/absorbed water and organic residues
were removed while the chemically bonded water and organics were removed in stages II
and III. Regarding the weight loss during TGA, a small amount of material was lost in the
first stage regardless of the solvents used in sample preparation. A major weight loss
occurred in the second and third stages, while the weight loss in the fourth stage (over
500 ºC) is extremely small. The total weight loss measured from the TG analysis was 59
% for xylenes, 57.6 % for isopropanol, 49.4 % for ethanol 47.9 % for hexanes, and 45.7
% for scCO2. These results suggest that the highest amount of organic impurities were
present in the synthesized materials when xylenes or isopropanol was used as solvent,
which is consistent with the observations from the FTIR and EDX results.
5.4. Crystallinity and Phase Structure
Figure 5.5 depicts the crystal phases determined from the powder XRD patterns
of the ZrO2-TiO2 samples calcined at 500ºC. The XRD patterns of all the samples
synthesized in different solvents showed the presence of anatase crystal structure of TiO2,
and no rutile phase being present. No distinct zirconia peak was observed for all the
samples, indicating that the zirconium element was contained in the anatase crystal
structure. Therefore, no significant phase separation took place during the calcination
step at 500 oC.
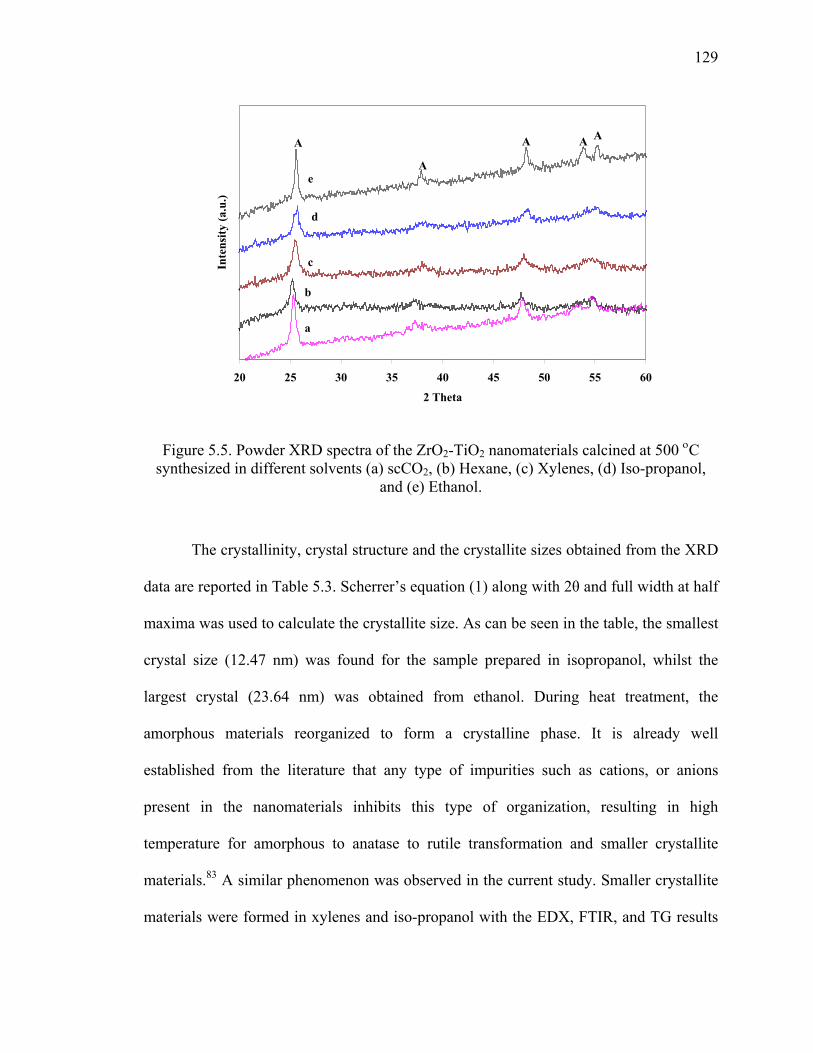
129
20 25 30 35 40 45 50 55 60
2 Theta
Inte
nsity
(a.u
.)
a
b
c
d
A
A
A A A
e
Figure 5.5. Powder XRD spectra of the ZrO2-TiO2 nanomaterials calcined at 500 οC synthesized in different solvents (a) scCO2, (b) Hexane, (c) Xylenes, (d) Iso-propanol,
and (e) Ethanol.
The crystallinity, crystal structure and the crystallite sizes obtained from the XRD
data are reported in Table 5.3. Scherrer’s equation (1) along with 2θ and full width at half
maxima was used to calculate the crystallite size. As can be seen in the table, the smallest
crystal size (12.47 nm) was found for the sample prepared in isopropanol, whilst the
largest crystal (23.64 nm) was obtained from ethanol. During heat treatment, the
amorphous materials reorganized to form a crystalline phase. It is already well
established from the literature that any type of impurities such as cations, or anions
present in the nanomaterials inhibits this type of organization, resulting in high
temperature for amorphous to anatase to rutile transformation and smaller crystallite
materials.83 A similar phenomenon was observed in the current study. Smaller crystallite
materials were formed in xylenes and iso-propanol with the EDX, FTIR, and TG results

130
suggesting that a larger amount of organic residues were present in the samples.
However, when considering crystallinity, the materials synthesized in hexane and xylenes
were poorly crystalline containing only ca. 37% whereas ca. 50% crystalline materials
were obtained using isopropanol or ethanol. Therefore, the XRD results also reveal that
the solvent type has a rather significant influence on crystallinity and crystal size.
Table 5.3: Crystallinity, crystal structure and size of the nanomaterials calcined at 500οC.
Solvent Crystallinity(%)a Crystal structure Crystal size(nm)b
CO2 38.9 A 13.71±1 Hexane 36.4 A 13.95 Xylenes 37.3 A 12.79 Iso-propanol 48.9 A 12.47 Ethanol 50.2 A 23.64
a-based on anatase (101)peak area b-using Scherrer’s equation with the anatase (101) peak
5.5. Surface area and Pore Volume
The surface area and pore volume of the as-prepared and calcined materials were
determined by nitrogen adsorption isotherm analysis. From the isotherms (Figure 5.6) it
can be seen that the type IV isotherms exhibit H3 hysteresis loops typical for mesoporous
materials.160 The lower limit of the relative pressure for the hysteresis loop is a
characteristic of a given adsorbate at a given temperature.198 It can be seen from Figure
5.6 that the lower pressure limit of the hysteresis loop is at P/P0 = 0.4, irrespective of the
solvent used in the synthesis. However, for calcined materials this limit was shifted
towards the right to a value of 0.5 for ethanol, and 0.6 for the other solvents, indicating
that the pore sizes become larger after calcination (at 500 ºC). Figure 5.7 shows the pore-
size distribution of the calcined materials synthesized from the various solvents. For low
dielectric solvents such as hexanes and xylenes, a narrow pore-size distribution is
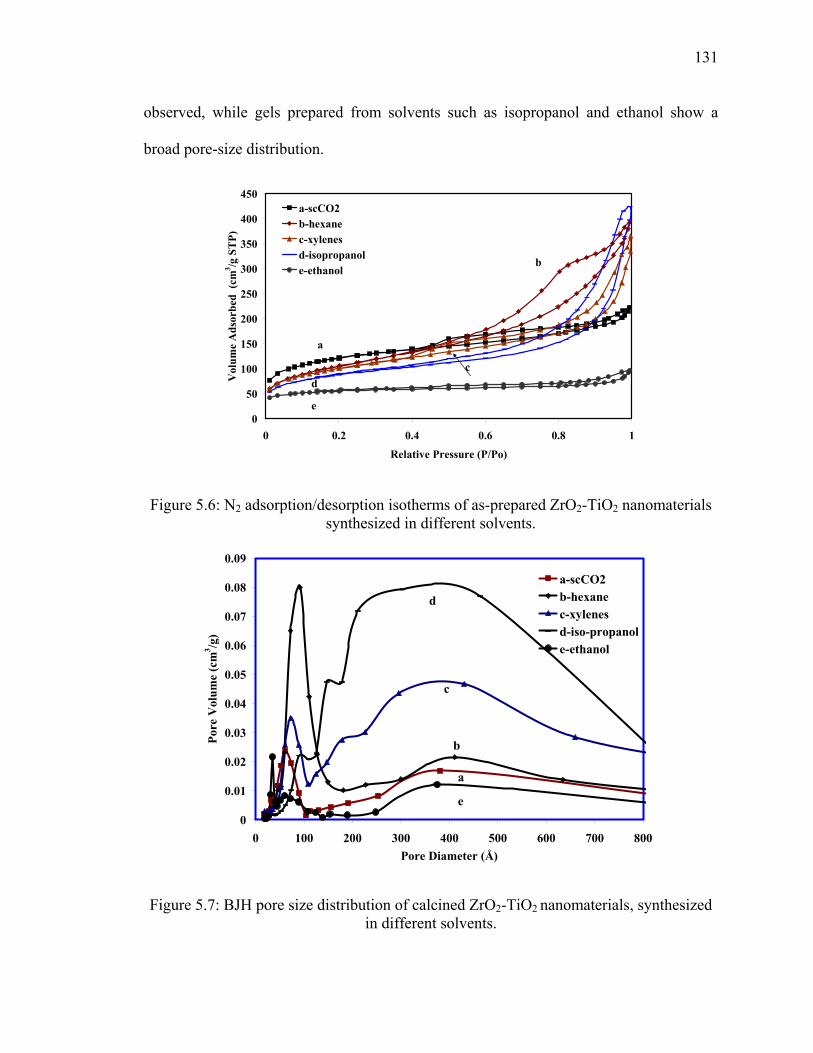
131
observed, while gels prepared from solvents such as isopropanol and ethanol show a
broad pore-size distribution.
0
50
100
150
200
250
300
350
400
450
0 0.2 0.4 0.6 0.8 1
Relative Pressure (P/Po)
Vol
ume
Ads
orbe
d (c
m3 /g
ST
P)
a-scCO2b-hexanec-xylenesd-isopropanole-ethanol
a
e
d
b
c
Figure 5.6: N2 adsorption/desorption isotherms of as-prepared ZrO2-TiO2 nanomaterials synthesized in different solvents.
0
0.01
0.02
0.03
0.04
0.05
0.06
0.07
0.08
0.09
0 100 200 300 400 500 600 700 800Pore Diameter (Å)
Pore
Vol
ume
(cm
3 /g)
a-scCO2b-hexanec-xylenesd-iso-propanole-ethanol
a
b
c
d
e
Figure 5.7: BJH pore size distribution of calcined ZrO2-TiO2 nanomaterials, synthesized in different solvents.
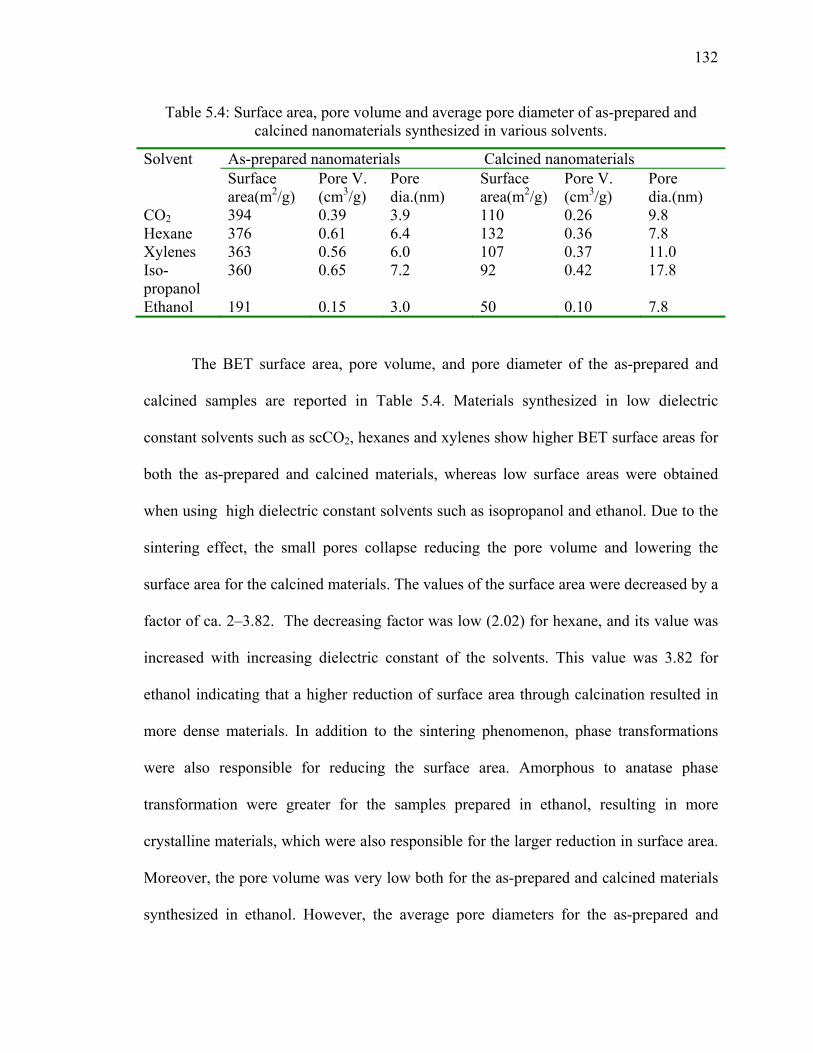
132
Table 5.4: Surface area, pore volume and average pore diameter of as-prepared and calcined nanomaterials synthesized in various solvents.
Solvent As-prepared nanomaterials Calcined nanomaterials Surface area(m2/g)
Pore V. (cm3/g)
Pore dia.(nm)
Surface area(m2/g)
Pore V. (cm3/g)
Pore dia.(nm)
CO2 394 0.39 3.9 110 0.26 9.8 Hexane 376 0.61 6.4 132 0.36 7.8 Xylenes 363 0.56 6.0 107 0.37 11.0 Iso-propanol
360 0.65 7.2 92 0.42 17.8
Ethanol 191 0.15 3.0 50 0.10 7.8
The BET surface area, pore volume, and pore diameter of the as-prepared and
calcined samples are reported in Table 5.4. Materials synthesized in low dielectric
constant solvents such as scCO2, hexanes and xylenes show higher BET surface areas for
both the as-prepared and calcined materials, whereas low surface areas were obtained
when using high dielectric constant solvents such as isopropanol and ethanol. Due to the
sintering effect, the small pores collapse reducing the pore volume and lowering the
surface area for the calcined materials. The values of the surface area were decreased by a
factor of ca. 2–3.82. The decreasing factor was low (2.02) for hexane, and its value was
increased with increasing dielectric constant of the solvents. This value was 3.82 for
ethanol indicating that a higher reduction of surface area through calcination resulted in
more dense materials. In addition to the sintering phenomenon, phase transformations
were also responsible for reducing the surface area. Amorphous to anatase phase
transformation were greater for the samples prepared in ethanol, resulting in more
crystalline materials, which were also responsible for the larger reduction in surface area.
Moreover, the pore volume was very low both for the as-prepared and calcined materials
synthesized in ethanol. However, the average pore diameters for the as-prepared and
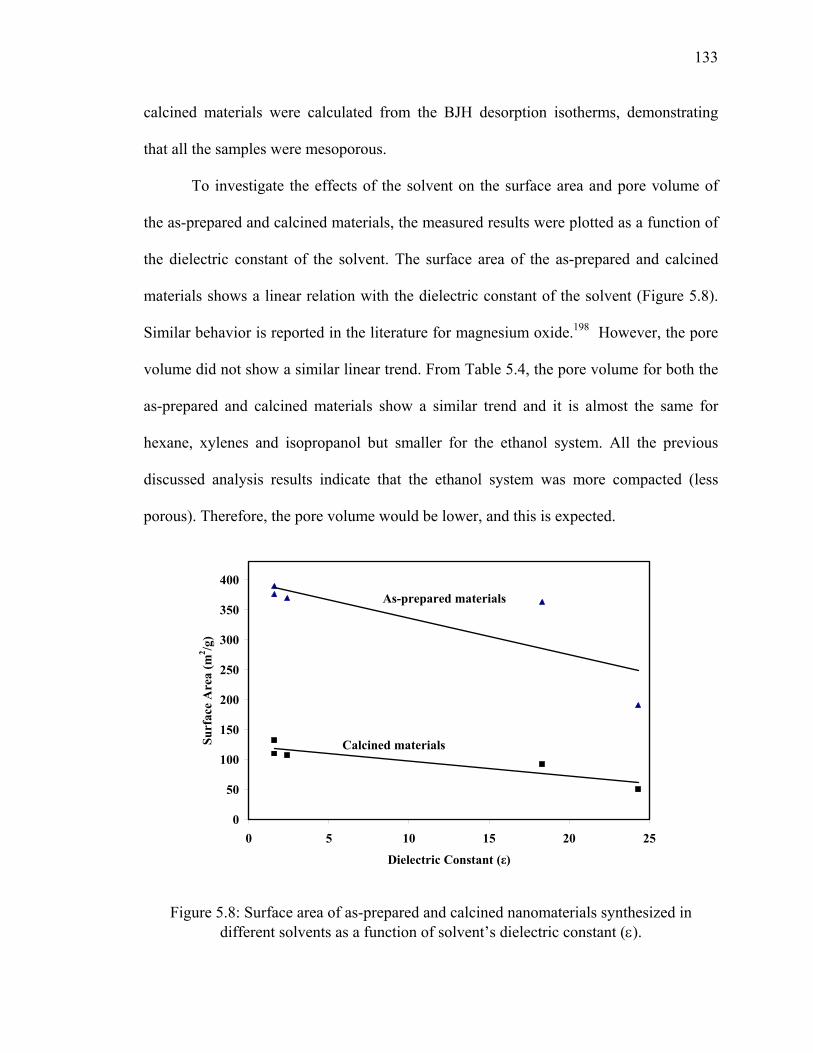
133
calcined materials were calculated from the BJH desorption isotherms, demonstrating
that all the samples were mesoporous.
To investigate the effects of the solvent on the surface area and pore volume of
the as-prepared and calcined materials, the measured results were plotted as a function of
the dielectric constant of the solvent. The surface area of the as-prepared and calcined
materials shows a linear relation with the dielectric constant of the solvent (Figure 5.8).
Similar behavior is reported in the literature for magnesium oxide.198 However, the pore
volume did not show a similar linear trend. From Table 5.4, the pore volume for both the
as-prepared and calcined materials show a similar trend and it is almost the same for
hexane, xylenes and isopropanol but smaller for the ethanol system. All the previous
discussed analysis results indicate that the ethanol system was more compacted (less
porous). Therefore, the pore volume would be lower, and this is expected.
0
50
100
150
200
250
300
350
400
0 5 10 15 20 25
Dielectric Constant (ε)
Surf
ace
Are
a (m
2 /g)
Calcined materials
As-prepared materials
Figure 5.8: Surface area of as-prepared and calcined nanomaterials synthesized in different solvents as a function of solvent’s dielectric constant (ε).

134
5.6. Gelation Time
In the sol-gel process, initially the precursors form a sol, a colloidal suspension of
solid particles with several nm in a liquid. When sols attract one another, they form a
network and reach macroscopic dimensions which extends throughout the solution,
forming a gel. Hence, a gel is a substance that contains a continuous solid skeleton
enclosing a continuous liquid phase.99 The gelation time or gel point (tg) is the time or the
degree of reaction required to complete the gel network. However, the properties of a gel
continue to change long after tg because at the tg, a substantial fraction of sols remains
free to diffuse and react. This period is known as the aging time and may result in
structural reorganization, including coarsening of the pores or stiffening of the network
through formation of additional cross links. The working solvent has an important role in
hydrolysis, and gel formation as well as the properties of the sol-gel product.99 In this
study, though gel was formed for all investigated working solvents, the gel times differed
significantly depending on the used solvent. The gel time for nonpolar solvents e.g.
scCO2, hexane, and xylenes was shorter ca. 30-60 min whereas in polar solvents i.e. 2-
propanol, ethanol, the gel time was longer ca. 120-250 min. In the published literature,
the solvent had similar effects on gelation time for different precursors, solvent and
catalyst systems. For example, Gash et al. synthesized chromia aerogel using chromim
nitrate solution in different solvents. They observed that the gel time was 14h, 3.1h and
2.6 h for methanol, ethanol and isopropanol, respectively.202 Recently, Gao et al.
synthesized zinc oxide following a similar procedure, and observed the gel time for the
synthesis in methanol was 8–10 h whereas that for 2-propanol was 2–3 h.203 They all
explained the origin of this effect as the difference in solubility and stability of the metal
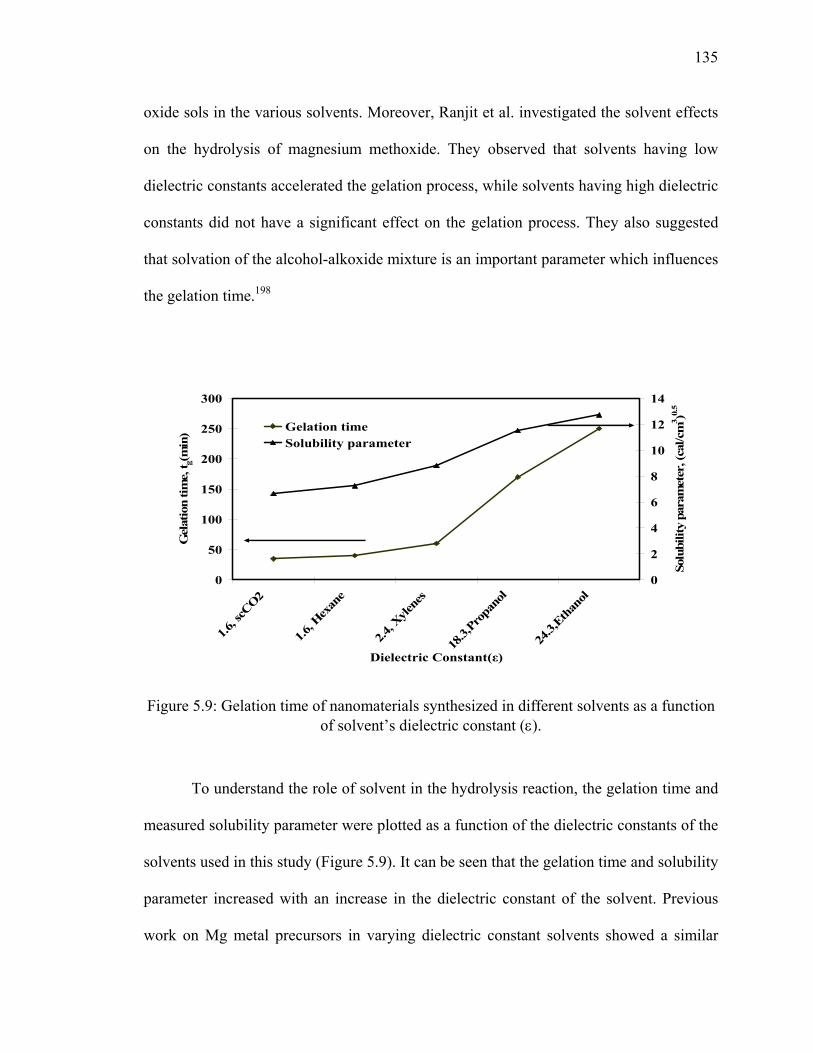
135
oxide sols in the various solvents. Moreover, Ranjit et al. investigated the solvent effects
on the hydrolysis of magnesium methoxide. They observed that solvents having low
dielectric constants accelerated the gelation process, while solvents having high dielectric
constants did not have a significant effect on the gelation process. They also suggested
that solvation of the alcohol-alkoxide mixture is an important parameter which influences
the gelation time.198
0
50
100
150
200
250
300
1.6, s
cCO2
1.6, H
exan
e
2.4, X
ylene
s
18.3,
Propa
nol
24.3,
Ethan
ol
Dielectric Constant(ε)
Gel
atio
n tim
e, t g
(min
)
0
2
4
6
8
10
12
14
Solu
bilit
y pa
ram
eter
, (ca
l/cm
3 )0.5
Gelation timeSolubility parameter
Figure 5.9: Gelation time of nanomaterials synthesized in different solvents as a function of solvent’s dielectric constant (ε).
To understand the role of solvent in the hydrolysis reaction, the gelation time and
measured solubility parameter were plotted as a function of the dielectric constants of the
solvents used in this study (Figure 5.9). It can be seen that the gelation time and solubility
parameter increased with an increase in the dielectric constant of the solvent. Previous
work on Mg metal precursors in varying dielectric constant solvents showed a similar
136
trend.204 Therefore, it can be said that solvents with different dielectric constants have
different solubilities of the alcohol-alkoxide mixture, which is the most important
parameter controlling the gelation time, although the detailed mechanism is not well
understood.
5.7. Discussion
The physical and chemical properties of a solvent have rather significant
influences on the morphology, surface area and pore volume of the product. Typically,
nanostructure evolution in the modified sol-gel process follows the following steps: (i)
modification, (ii) hydrolysis, (iii) condensation, (iv) nucleation, and (v) growth. The rate
of reaction of the different steps strongly depends on the reactivity of the metal atoms
present in the precursor, the working solvent(s), and the pH of the system. Hence, the
properties of the sol-gel product varies significantly with changing the above mentioned
synthesis variables.
The metals reactivity largely depends on the extent of the charge transfer and the
ability to increase the coordination number.176 The charge transfer is influenced by the
charge difference between the metal atom and the surrounding solvent, while the
coordination expansion depends on the difference between the coordination number and
the oxidation state of the metal. The unsaturated coordination number of a metal atom
can be fulfilled by addition of an alkoxy ligand, or forming a complex with acetic acid or
an alcoholic solvent. From the partial charge (δ) of a metal atom in the precursor, and the
unsaturated coordination number, it is possible to estimate how a precursor is going to
behave in a given synthesis process. The charge distribution of titanium and zirconium
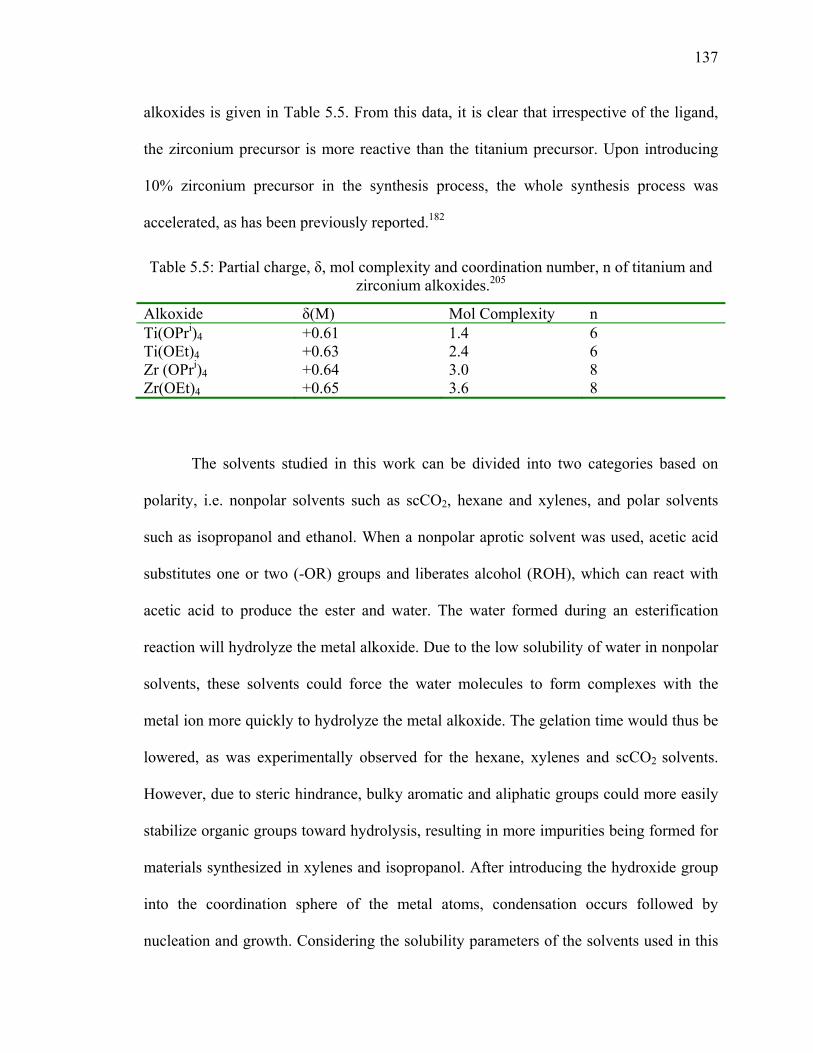
137
alkoxides is given in Table 5.5. From this data, it is clear that irrespective of the ligand,
the zirconium precursor is more reactive than the titanium precursor. Upon introducing
10% zirconium precursor in the synthesis process, the whole synthesis process was
accelerated, as has been previously reported.182
Table 5.5: Partial charge, δ, mol complexity and coordination number, n of titanium and zirconium alkoxides.205
Alkoxide δ(M) Mol Complexity n Ti(OPri)4 +0.61 1.4 6 Ti(OEt)4 +0.63 2.4 6 Zr (OPri)4 +0.64 3.0 8 Zr(OEt)4 +0.65 3.6 8
The solvents studied in this work can be divided into two categories based on
polarity, i.e. nonpolar solvents such as scCO2, hexane and xylenes, and polar solvents
such as isopropanol and ethanol. When a nonpolar aprotic solvent was used, acetic acid
substitutes one or two (-OR) groups and liberates alcohol (ROH), which can react with
acetic acid to produce the ester and water. The water formed during an esterification
reaction will hydrolyze the metal alkoxide. Due to the low solubility of water in nonpolar
solvents, these solvents could force the water molecules to form complexes with the
metal ion more quickly to hydrolyze the metal alkoxide. The gelation time would thus be
lowered, as was experimentally observed for the hexane, xylenes and scCO2 solvents.
However, due to steric hindrance, bulky aromatic and aliphatic groups could more easily
stabilize organic groups toward hydrolysis, resulting in more impurities being formed for
materials synthesized in xylenes and isopropanol. After introducing the hydroxide group
into the coordination sphere of the metal atoms, condensation occurs followed by
nucleation and growth. Considering the solubility parameters of the solvents used in this
138
study (see Table 5.1), high supersaturation values due to the low solubility of the
hydrolyzed product in nonpolar solvents (6.65-8.81 (cal/cm3)1/2) could promote
nucleation. In addition, low solubility would inhibit dissolution, reprecipitation,
repolymerization, and the formation of larger crystallites as well as densification of the
gel network. The observed morphology, high surface area, porosity and smaller
crystallites are consistent with this mechanism. Huang et al also observed similar effects
for N-F-codoped TiO2 synthesized by a sol-gel- solvothermal method.55 When polar
solvents such as ethanol and isopropanol (11.54-12.73 (cal/cm3)1/2) were used in the
synthesis process, the alkoxides were solvated to give M(OR)x:ROH and acetic acid was
also found to react with solvent. Because of solvate formation, intermediates would be
more stable toward hydrolysis, and hence the gelation times would be longer when polar
solvents were used. Moreover, when ethanol instead of isopropanol was used, along with
all the above mentioned reaction steps, alcohol interchange would be involved. The rate
of hydrolysis and the properties of the product also depend on the OR group present in
the precursor, as substitution can change the molecular complexity. Moreover,
monomeric Ti(OPri) formed oligomer upon replacing OPr groups by OEt groups. All
these factors help to stabilize the hydrolysis product resulting in higher gelation times.
Furthermore, the solubility of the hydrolysis products in polar solvents is higher, which
would reduce supersaturation and promote dissolution, depolymerization,
repolymerization, and help to form denser larger materials. However, the surface area
and pore volume for the materials synthesized in isopropanol was higher than the linear
values, which are consistent with the lower gelation time of the isopropanol system.
These results can be attributed to the monomeric nature of the titania precursor.205

139
From the above results and discussion, it can be concluded that the polarity or
dielectric constant of a solvent is one of the main properties that controls the surface area,
and pore volume of the nanooxide materials. However, nanotubes were produced in
scCO2, whereas only very thick wall tubes or rods were obtained in hexane, although the
two solvents are chemically similar with a polarity of 1.6. Therefore, along with polarity,
a solvents’ physical properties, and chemical structure are very important towards the
desired end-product. Moreover, the synthesis conditions also have a prominent effect on
the materials formation. For instance, some materials cannot be synthesized except under
high pressure. According to Goodenough et al. high pressure helps by lowering the free
energy resulting in easy formation of a new phase.206 The synthesis process involved
pressure similar to hydrothermal and solvothermal techniques which are popular titanate
nanotube synthesis processes, following the pioneering work of Kasuga et al.106
Moreover, during synthesis, the formed metal-acetate group which has electron lone pairs
can attract the partial positive carbon atom of CO2 molecules. This is known as Lewis
acid and Lewis base interaction and helps to stabilize the colloidal particles in scCO2.207
Hence, the building blocks in scCO2 most likely are different from those of conventional
organic solvents, which help to form a sheet type structure, and at a suitable synthesis
condition, the sheet rolls up and forms tubes185 as described previously in section 4.7.
Therefore, the nanotubes formation in scCO2 can be attributed to its synthesis condition
and different hexamer formation. It can be concluded that scCO2 strongly influences the
synthesis process resulting in superior quality materials.

140
5.8. Conclusions
The morphology and surface area of metal oxides synthesized by a sol-gel process
is significantly altered by the solvent used. The polarity or dielectric constant of a solvent
is one of the main properties to control the surface area, and pore volume. When low
dielectric constant solvents such as scCO2, hexane, or xylenes are employed, the faster
the hydrolysis reaction the lower the gelation time, and the higher the surface area of the
nanomaterials. The presence of such solvents helps in the formation of porous structures
and high surface area materials. However, when solvents having high dielectric constants
such as alcohols are used, the gelation time is slower due to the possible formation of
alkoxide-solvent complexes, which help stabilize hydrolysis. The partial charge model
and solubility help to explain this observation. This study demonstrates that with the
appropriate choice of solvents, high surface area porous inorganic oxides can be obtained.

141
CHAPTER 6
EFFECTS OF HEAT TREATMENT ON Zr MODIFIED TiO2
NANOTUBES
6. Introduction
As discussed in Chapter 4, Zr modified TiO2 (Zr-TiO2) nanotubes were
synthesized in scCO2, and our preliminary results indicated that the as-prepared
nanotubes gave a high surface area, up to 430 m2/g. According to several studies, a small
amount of transition metal doping has been found very effective to improve the thermal
stability and activity of TiO2, particularly by using zirconia.24, 53, 82, 83 In addition to the
synthesis conditions, the calcination conditions are very important to the crystal
structures of the metal oxide nanomaterials obtained, and subsequently, their potential
end use applications. Spijksma et al.208 synthesized titania-zirconia microporous
composite membranes using a 1:1 molar ratio by using the sol-gel process. The
crystallization temperature for these materials was 750°C; however after calcining at
800°C, an orthorhombic ZrTi2O6 structure was formed, commonly known as srilankite.
Whereas, Zou et al. 209 synthesized binary oxides by hydrolysis of titanium and zirconium
nitrate solutions at various ratios. After calcining at 800°C, the binary oxides showed the
presence of the ZrTiO4 crystal phase, and very low surface areas. Kitiyanan et al.53
synthesized 5 mol% zinconia modified TiO2 using a sol-gel process. They showed that
this small amount of Zr stabilized the anatase phase up to 800°C, but that the anatase
phase completely transformed into the rutile phase at 1000°C. However, the materials
calcined at these very high temperatures showed very low surface areas.
142
As the nanotubular structure of the bimetallic TiO2/ZrO2 nanotubes prepared by
scCO2 have many potential interesting applications, however, their structure and crystal
morphology changes with calcination temperature have not been investigated. Hence, this
study focused on the thermal behavior of the synthesized Zr-TiO2 nanotubes prepared by
an acetic acid modified sol-gel process in scCO2. The synthesized materials were
calcined at different temperatures and the effects of calcination temperature on the
morphology, phase structure, mean crystallite size, specific surface area, and pore volume
were investigated using a variety of physicochemical characterization techniques.
6.1. Solid-State Reaction Kinetics
Solid-state reaction and phase transformations through heat treatment are an
important means for adjusting the microstructure, and thus tuning the properties of
desired materials. To exploit this tool, a great deal of effort has been made on the
modeling of solid state reaction kinetics. The required models should not be in particular
of atomistic nature, but pertain to larger, mesoscopic and even macroscopic scales. This
study can provide valuable information about the reaction mechanism/ kinetics
parameters useful for modifying the course of the interested reaction. In the following, a
model related to decomposition and phase transformation that is often invoked is briefly
discussed.
6.1.1. Decomposition
In general, the decomposition reactions can be described by the following
equation.
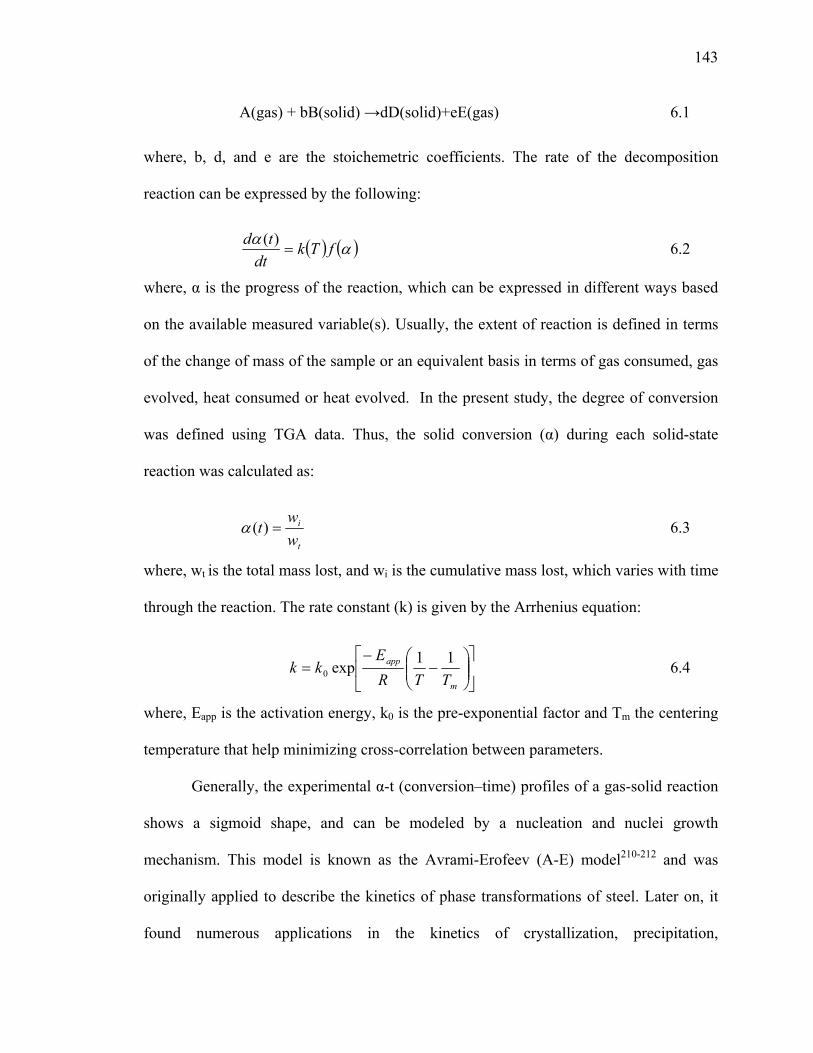
143
A(gas) + bB(solid) →dD(solid)+eE(gas) 6.1
where, b, d, and e are the stoichemetric coefficients. The rate of the decomposition
reaction can be expressed by the following:
( ) ( )αα fTkdt
td=
)( 6.2
where, α is the progress of the reaction, which can be expressed in different ways based
on the available measured variable(s). Usually, the extent of reaction is defined in terms
of the change of mass of the sample or an equivalent basis in terms of gas consumed, gas
evolved, heat consumed or heat evolved. In the present study, the degree of conversion
was defined using TGA data. Thus, the solid conversion (α) during each solid-state
reaction was calculated as:
t
i
ww
t =)(α 6.3
where, wt is the total mass lost, and wi is the cumulative mass lost, which varies with time
through the reaction. The rate constant (k) is given by the Arrhenius equation:
⎥⎦
⎤⎢⎣
⎡⎟⎟⎠
⎞⎜⎜⎝
⎛−
−=
m
app
TTRE
kk 11exp0 6.4
where, Eapp is the activation energy, k0 is the pre-exponential factor and Tm the centering
temperature that help minimizing cross-correlation between parameters.
Generally, the experimental α-t (conversion–time) profiles of a gas-solid reaction
shows a sigmoid shape, and can be modeled by a nucleation and nuclei growth
mechanism. This model is known as the Avrami-Erofeev (A-E) model210-212 and was
originally applied to describe the kinetics of phase transformations of steel. Later on, it
found numerous applications in the kinetics of crystallization, precipitation,
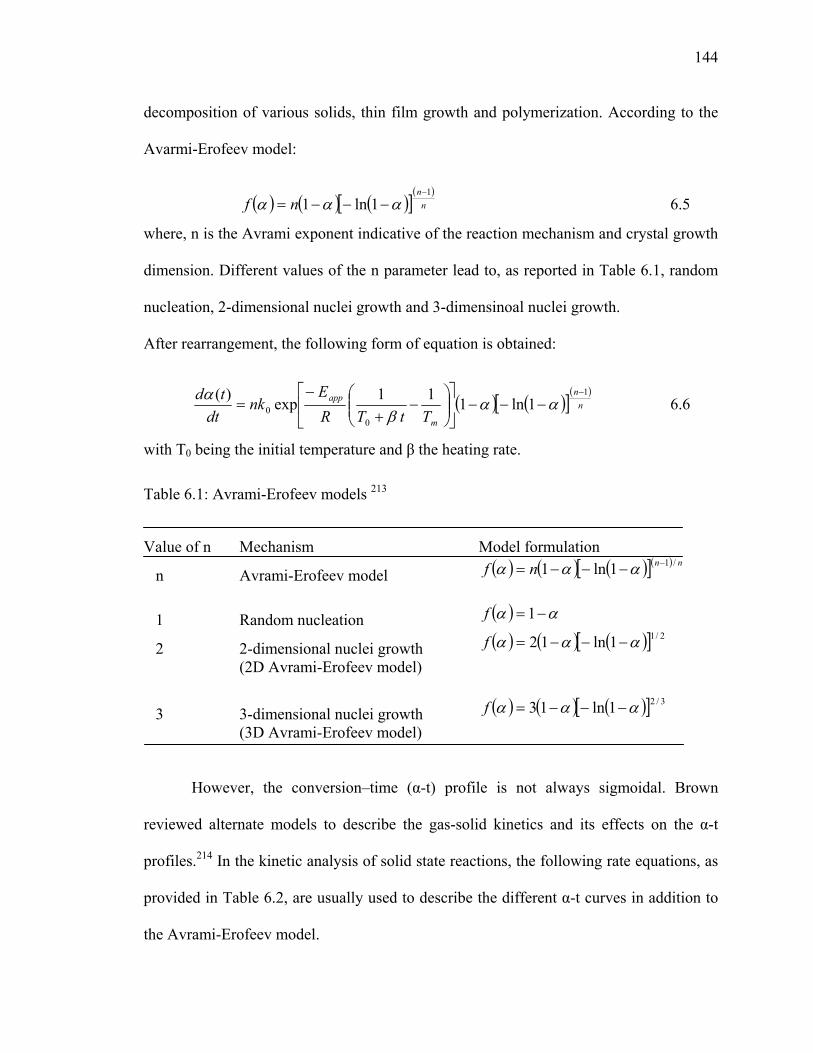
144
decomposition of various solids, thin film growth and polymerization. According to the
Avarmi-Erofeev model:
( ) ( ) ( )[ ]( )
nn
nf1
1ln1−
−−−= ααα 6.5
where, n is the Avrami exponent indicative of the reaction mechanism and crystal growth
dimension. Different values of the n parameter lead to, as reported in Table 6.1, random
nucleation, 2-dimensional nuclei growth and 3-dimensinoal nuclei growth.
After rearrangement, the following form of equation is obtained:
( ) ( )[ ]( )
nn
m
app
TtTRE
nkdt
td 1
00 1ln111exp)( −
−−−⎥⎦
⎤⎢⎣
⎡⎟⎟⎠
⎞⎜⎜⎝
⎛−
+
−= αα
βα 6.6
with T0 being the initial temperature and β the heating rate.
Table 6.1: Avrami-Erofeev models 213
Value of n Mechanism Model formulation
n Avrami-Erofeev model ( ) ( ) ( )[ ]( ) nnnf /11ln1 −−−−= ααα 1 Random nucleation ( ) αα −= 1f
2 2-dimensional nuclei growth ( ) ( ) ( )[ ] 2/11ln12 ααα −−−=f (2D Avrami-Erofeev model)
3 3-dimensional nuclei growth ( ) ( ) ( )[ ] 3/21ln13 ααα −−−=f (3D Avrami-Erofeev model)
However, the conversion–time (α-t) profile is not always sigmoidal. Brown
reviewed alternate models to describe the gas-solid kinetics and its effects on the α-t
profiles.214 In the kinetic analysis of solid state reactions, the following rate equations, as
provided in Table 6.2, are usually used to describe the different α-t curves in addition to
the Avrami-Erofeev model.

145
Table 6.2: The important rate equations used in kinetic analysis of solid-state reactions
α-time curves f (α) Acceleratory α-t curves Power law n(α)(n-1)/n
Exponential α F nth order (1-α)n
These models were evaluated in this chapter by using MATLAB (ODE 45 and
LSQCURVEFIT) least square fitting of the kinetic parameters. The evaluation of reaction
rate parameters was conducted using the TGA data points taken once every 10 oC interval
and the samples were heated from room temperature to 500 °C at a 10 °C/min heating
rate in flowing air using 20 mL/min flowrate.
6.1.2. Phase Transformation
Non-isothermal crystallization techniques are widely used for determining
crystallization parameters, as they typically produce well-defined crystallization peaks
that are usually easier to observe on the temperature–time or heat flow-temperature
profiles. Therefore, the activation energy for crystallization of 10% ZrO2-TiO2 nanotubes
was studied using the peak temperature at different heating rates from DSC curves by
Kissinger’s equations:215
constRTET pp +−= /)/ln( 2β 6.7
where, Tp is the peak temperature in Kelvin.
However, the activation energy (kJ/mol) of isothermal phase transformations can
also be calculated from the slope of a plot of Ln rutile weight fraction versus the

146
reciprocal of annealing temperature from XRD spectra according to Burns et al.216 This
relationship is given as:
1ln( )( / )
ra
XE RT
∂= − ⋅
∂ 6.8
where T is the temperature in Kelvin, R is the universal gas constant (8.314 J/mol·K), and
Xr is the weight fraction of the rutile phase as determined using Eq. (6.8).
6.2. Experimental
10% ZrO2-TiO2 nanotubes were synthesized following the procedure previously
described in chapter 3, with the synthesized materials calcined at different temperatures.
The effects of calcination temperature on the morphology, phase structure, mean
crystallite size, specific surface area, and pore volume were investigated using a variety
of physicochemical characterization techniques and given in the following section.
6.2.1. SEM/TEM
The effects of calcination temperature on the morphology of the ZrO2-TiO2
nanotubes size and shape was characterized by SEM and TEM analysis. In the SEM
analysis for the as prepared materials, it can be seen in Figure 6.1(a) that the aerogel
powders were composed of a one dimensional structure, with the nanotubes having a
diameter of 50–140 nm and a length of several μm’s. Throughout the course of heat
treatment, phase changes (amorphous to anatase to rutile) and sintering phenomena of the
nanotubes was revealed by the SEM and TEM investigation. The SEM image in Fig.
6.1(b) shows that the material calcined at 500°C has a similar structure, although very
small holes are visible on the walls of the nanotubes. The morphology of the calcined
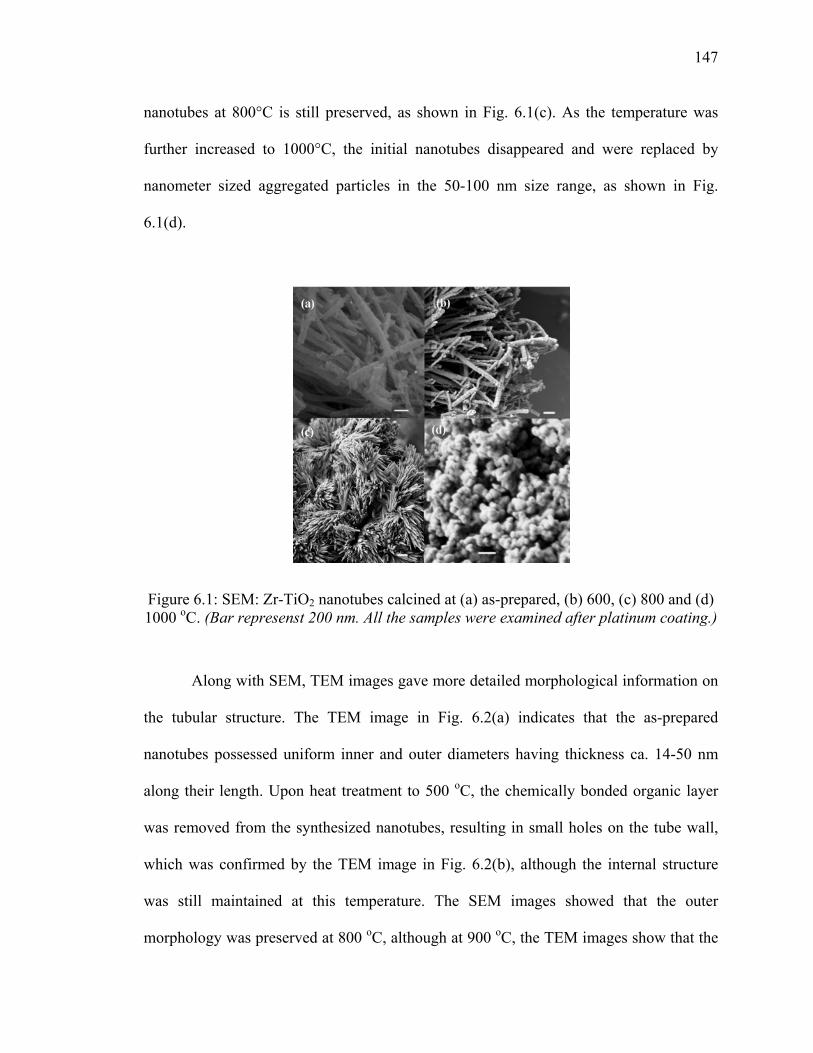
147
nanotubes at 800°C is still preserved, as shown in Fig. 6.1(c). As the temperature was
further increased to 1000°C, the initial nanotubes disappeared and were replaced by
nanometer sized aggregated particles in the 50-100 nm size range, as shown in Fig.
6.1(d).
Figure 6.1: SEM: Zr-TiO2 nanotubes calcined at (a) as-prepared, (b) 600, (c) 800 and (d) 1000 oC. (Bar represenst 200 nm. All the samples were examined after platinum coating.)
Along with SEM, TEM images gave more detailed morphological information on
the tubular structure. The TEM image in Fig. 6.2(a) indicates that the as-prepared
nanotubes possessed uniform inner and outer diameters having thickness ca. 14-50 nm
along their length. Upon heat treatment to 500 oC, the chemically bonded organic layer
was removed from the synthesized nanotubes, resulting in small holes on the tube wall,
which was confirmed by the TEM image in Fig. 6.2(b), although the internal structure
was still maintained at this temperature. The SEM images showed that the outer
morphology was preserved at 800 oC, although at 900 oC, the TEM images show that the

148
inner hole has almost vanished with this additional heat energy (Fig. 6.2(c)). The TEM
images along with SEM images reveal that the nanotubes were deformed and the
crystallites were fused together when the calcination temperature was increased to
1000°C (Fig. 6.2(d)).
Figure 6.2: TEM: ZrO2-TiO2 nanotubes calcined at (a) as-prepared,(b) 500, (c) 900 and (d) 1000 oC.
6.2.2. Decomposition Behavior (TGA/FTIR)
TG–DTG analysis was carried out to study the thermal decomposition behavior of
the synthesized ZrO2-TiO2 nanotubes. Figure 6.3 shows three main peaks in the TG-DTG
analysis, which are in the ranges of 20–120οC, 120–250 οC and 250-500 οC. The first
stage with peak maxima at 37 οC gave only 6% wt. loss, which we attribute to the
removal of residual solvent present in the synthesized materials. The second peak with its
maximum at 200 οC is attributed to the removal of bounded water and chemically bonded
organic material, with ca.19 % wt. lost at this stage. The third peak, with its maximum at
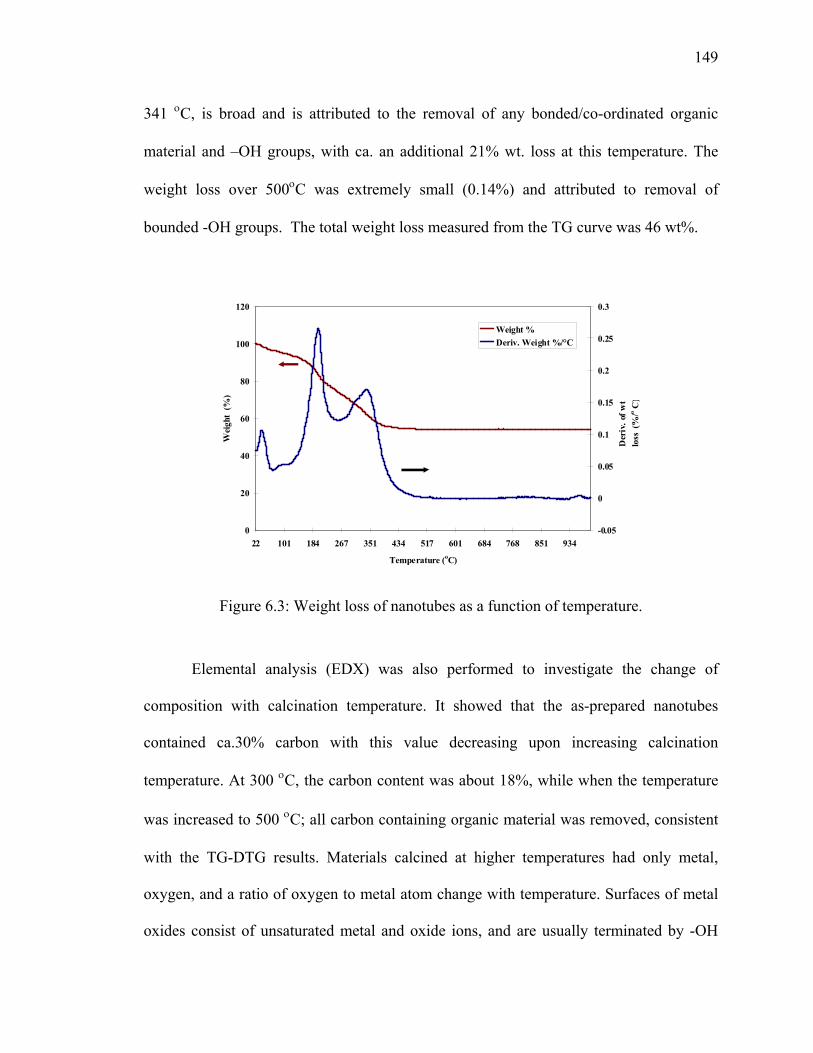
149
341 οC, is broad and is attributed to the removal of any bonded/co-ordinated organic
material and –OH groups, with ca. an additional 21% wt. loss at this temperature. The
weight loss over 500οC was extremely small (0.14%) and attributed to removal of
bounded -OH groups. The total weight loss measured from the TG curve was 46 wt%.
0
20
40
60
80
100
120
22 101 184 267 351 434 517 601 684 768 851 934
Temperature (oC)
Wei
ght
(%)
-0.05
0
0.05
0.1
0.15
0.2
0.25
0.3
Der
iv. o
f wt
loss
(%/o
C)
Weight %Deriv. Weight %/°C
Figure 6.3: Weight loss of nanotubes as a function of temperature.
Elemental analysis (EDX) was also performed to investigate the change of
composition with calcination temperature. It showed that the as-prepared nanotubes
contained ca.30% carbon with this value decreasing upon increasing calcination
temperature. At 300 οC, the carbon content was about 18%, while when the temperature
was increased to 500 οC; all carbon containing organic material was removed, consistent
with the TG-DTG results. Materials calcined at higher temperatures had only metal,
oxygen, and a ratio of oxygen to metal atom change with temperature. Surfaces of metal
oxides consist of unsaturated metal and oxide ions, and are usually terminated by -OH

150
groups. The -OH groups are formed by dissociative adsorption of H2O molecules to
reduce the coordinative unsaturation of the surface sites. It is very difficult to analyze the
amount of oxygen bonded with metal atoms only by the EDX method, as the amount of
H present in the materials cannot be determined by EDX due to the low atomic weight of
H.
Infrared spectroscopy is an excellent method to study the behavior and properties
of metal oxides.209 The powder ATR-FTIR spectra of the ZrO2-TiO2 nanotubes calcined
at different temperatures in air are given in Figure 6.4. The spectra (Fig.6.4(a)) for the as-
prepared nanotubes shows a broad peak at 3400 cm-1, assigned to the -OH group of
absorbed water.184 The peaks at 1548 and 1452 cm-1 are due to symmetric and
asymmetric stretching of the zirconium titanium acetate complex, respectively.152 This
metal acetate complex confirms that the acetic acid formed bridging complexes with the
metal ions, helping to stabilize the structures during their synthesis and self-assembly into
nanotubular structures in scCO2. The -CH3 group contributes the small peak at 1343 cm-1,
while the two small peaks at 1037 and 1024 cm-1 correspond to the ending and bridging -
OPr groups, respectively,151 indicating that unhydrolyzed –OPr groups were present in
the as-prepared materials.98 The oxo bonds can be observed by the bands present below
657cm-1.152 Calcination at 400°C significantly diminishes the intensity of the C-H
stretching at 2800-3000 cm-1 and the zirconium titanium acetate complex band is
observed at 1548 and 1452 cm-1, as shown in Fig.6.4(b). This indicates that the
calcination at 400oC removes any organic material present in the as-prepared nanotubes.
No trace of IR bands from the organic groups was detected upon further heat treatment
(Fig. 6.4(c)) and the broad peak at 3400 cm-1 significantly decreased. The nanotubes
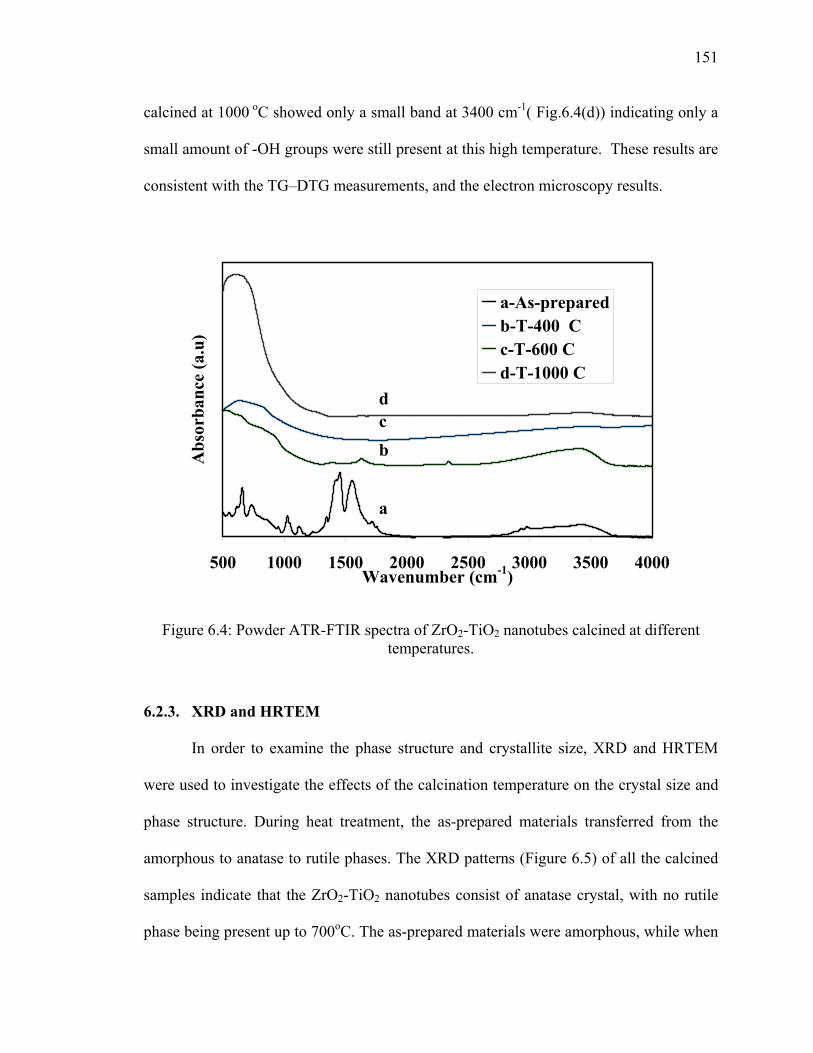
151
calcined at 1000 οC showed only a small band at 3400 cm-1( Fig.6.4(d)) indicating only a
small amount of -OH groups were still present at this high temperature. These results are
consistent with the TG–DTG measurements, and the electron microscopy results.
500 1000 1500 2000 2500 3000 3500 4000Wavenumber (cm-1)
Abs
orba
nce
(a.u
)
a-As-preparedb-T-400 Cc-T-600 Cd-T-1000 C
a
bcd
Figure 6.4: Powder ATR-FTIR spectra of ZrO2-TiO2 nanotubes calcined at different temperatures.
6.2.3. XRD and HRTEM
In order to examine the phase structure and crystallite size, XRD and HRTEM
were used to investigate the effects of the calcination temperature on the crystal size and
phase structure. During heat treatment, the as-prepared materials transferred from the
amorphous to anatase to rutile phases. The XRD patterns (Figure 6.5) of all the calcined
samples indicate that the ZrO2-TiO2 nanotubes consist of anatase crystal, with no rutile
phase being present up to 700oC. The as-prepared materials were amorphous, while when

152
increasing the calcination temperature up to 400 oC, the material reorganized itself, and
the anatase particles began to grow, resulting in crystalline material. There was no
distinct Zr peak indicating no phase separation, and the Zr was integrated within the
anatase crystal structure for this composition. Previous experiments showed that
increasing concentrations of Zr alkoxide were incorporated homogeneously into the
10 20 30 40 50 60 70 802-theta/ Degree
T=400T=500T=600T=700T=800T=900T=1000
A
AA
R
ZrTiO4
R
R
R
R
R
RRR
A
RR
10 20 30 40 50 60 70 802-theta/ Degree
T=400T=500T=600T=700T=800T=900T=1000
A
AA
R
ZrTiO4
R
R
R
R
R
RRR
A
RR
Figure 6.5: Powder XRD spectra of ZrO2-TiO2 nanotubes calcined at different temperatures. (A-anatase, R-rutile).
nanotubular structure.120 As well, we previously prepared a crystal of Zr2Ti4(μ3-
O)4(OPr)4(μ-OPr)2(μ -OAc)10) using lower concentrations of acetic acid, 185 showing that
the Zr is part of the crystal hexamer structure. By increasing the calcination temperature
from 400 to 800oC, the peak intensities increased as well as the width of the peaks
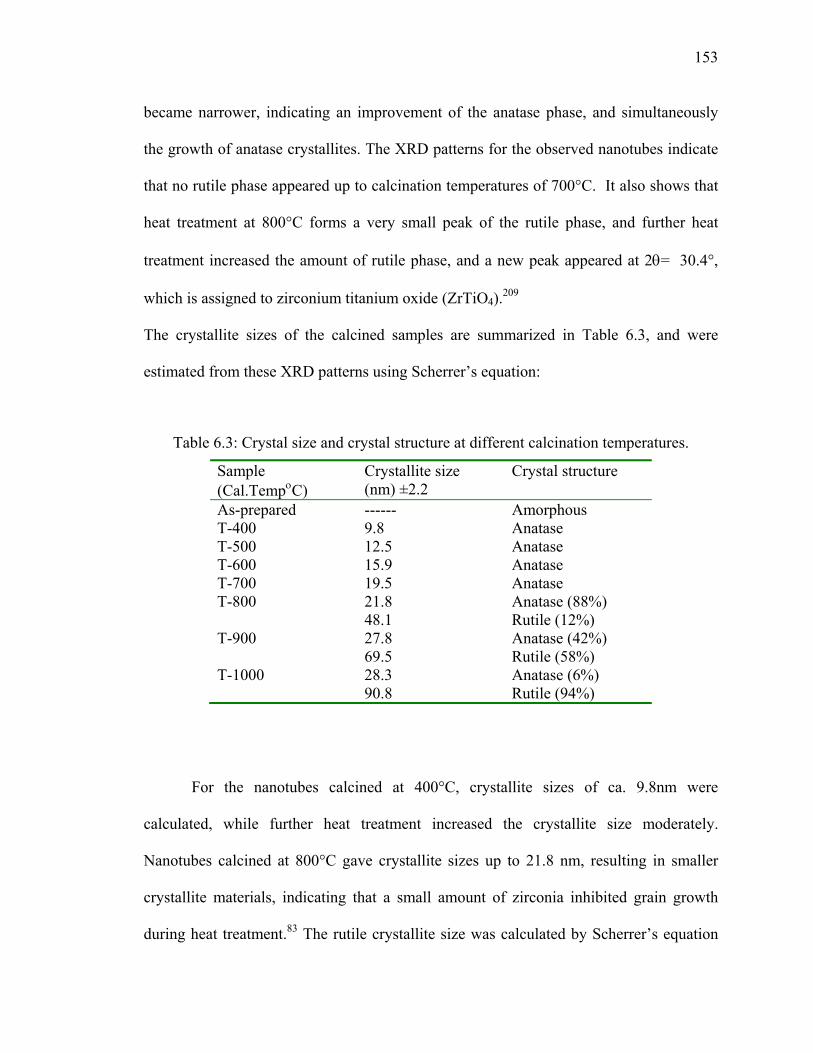
153
became narrower, indicating an improvement of the anatase phase, and simultaneously
the growth of anatase crystallites. The XRD patterns for the observed nanotubes indicate
that no rutile phase appeared up to calcination temperatures of 700°C. It also shows that
heat treatment at 800°C forms a very small peak of the rutile phase, and further heat
treatment increased the amount of rutile phase, and a new peak appeared at 2θ= 30.4°,
which is assigned to zirconium titanium oxide (ZrTiO4).209
The crystallite sizes of the calcined samples are summarized in Table 6.3, and were
estimated from these XRD patterns using Scherrer’s equation:
Table 6.3: Crystal size and crystal structure at different calcination temperatures.
Sample (Cal.TempοC)
Crystallite size (nm) ±2.2
Crystal structure
As-prepared ------ Amorphous T-400 9.8 Anatase T-500 12.5 Anatase T-600 15.9 Anatase T-700 19.5 Anatase T-800 21.8
48.1 Anatase (88%) Rutile (12%)
T-900 27.8 69.5
Anatase (42%) Rutile (58%)
T-1000 28.3 90.8
Anatase (6%) Rutile (94%)
For the nanotubes calcined at 400°C, crystallite sizes of ca. 9.8nm were
calculated, while further heat treatment increased the crystallite size moderately.
Nanotubes calcined at 800°C gave crystallite sizes up to 21.8 nm, resulting in smaller
crystallite materials, indicating that a small amount of zirconia inhibited grain growth
during heat treatment.83 The rutile crystallite size was calculated by Scherrer’s equation

154
using rutile (110). The obtained crystallite size was >90 nm at 1000 °C calcination
temperature, smaller than the value reported in the literature for rutile crystallites,184
likely due to the constrained geometry of the nanotubular structure. The TEM images of
the 1000°C calcined nanotubes previously showed that the crystallites were fused
together forming larger crystallites. It is known that rutile and anatase share two and four
polyhedra edges, respectively, although both are tetragonal.217 Due to changes in the
crystal structure, the nanotubes morphology deformed at higher calcination temperatures.
The phase compositions of the calcined samples are also reported in Table 6.3, and were
calculated using the integrated intensities of anatase (101) and rutile (110) peaks by the
equation developed by Spurr and Myers:159
)(1
1
r
arutile
IIK
X+
= 6.9
where Ia and Ir are the integrated peak intensities of the anatase and rutile phases,
respectively, and the empirical constant K was taken as 0.79. From Table 6.3 it can be
seen that the material calcined at 800°C contained only 12 % rutile. Further heat
treatment caused a dramatic increase in both the composition and size of the rutile
particles, where at 900°C, 58% of the material was converted into rutile, which increased
to ca 94% at 1000°C.
Rutile is the most stable crystalline phase of TiO2, and the phase transformation
(anatase to rutile) depends on both the size and dopant present in the system.83 Sui et al.
reported that anatase-type TiO2 nanostructures transformed into rutile phase (56 %) after
calcination at 600°C149, whereas only 12 % of the nanomaterial was converted into rutile
at 800°C in the present study. Hence, consistent with the literature for non nanotubular

155
structures,53 the anatase phase of the bimetallic nanotubes can be stabilized by modifying
titania with a small amount of ZrO2. However, the mechanism by which the zirconia
stabilizes the TiO2 anatase phase at higher temperatures is unclear.
As shown in the XRD data, no distinct zirconium peak was observed, indicating
that zirconia was well-integrated into the anatase structure. This suggests that particle
agglomeration was not favored, and the particles grew by the Oswald ripening process
during heat treatment.83 Due to the presence of Zirconia, the Oswald ripening process
was restricted, reducing the crystal growth rate and increasing the phase transformation
temperature. Once individual crystallites reach a threshold size, a spontaneous phase
change can occur. The rapid growth of rutile particles formed during heat treatment
suggests that the growth mechanism consists of particle agglomeration or grain
coalescence by grain boundary diffusion.218 There may be a threshold size limit for this
transformation, below which no transformation occurs, which was >27 nm for this study,
similar to that reported for SiO2 and ZrO2 doping in a titania matrix.83, 218 For this reason,
no rutile phase appeared up to 700°C. When calcined at 800°C, the crystallites size
became > 27 nm, and the anatase phase started transforming rapidly into rutile phase.
In addition to the XRD data, detailed information on the structural
transformations and crystal growth can be obtained using HRTEM. The HRTEM
micrographs of the as-prepared nanotubes were amorphous (Fig.6.6 (a)) with no ordered
structure. The lattice image of nanotubes calcined at 500 oC is given in Fig.6.6 (b),
showing a grain size of ca.12 nm width with d-spacing 0.35 nm, very close to the lattice
spacing of the (101) planes of the anatase phase. However, all grains were not the same in
terms of size and shape. Some were long with significant lattice mismatch and grain
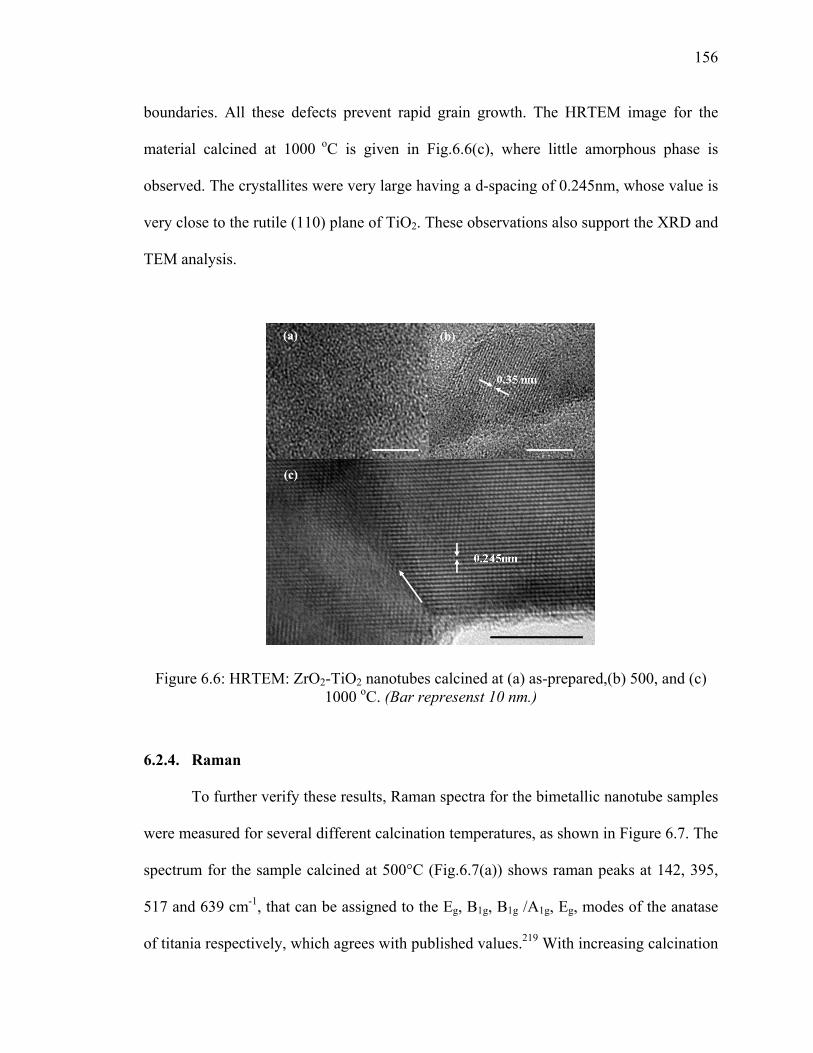
156
boundaries. All these defects prevent rapid grain growth. The HRTEM image for the
material calcined at 1000 oC is given in Fig.6.6(c), where little amorphous phase is
observed. The crystallites were very large having a d-spacing of 0.245nm, whose value is
very close to the rutile (110) plane of TiO2. These observations also support the XRD and
TEM analysis.
Figure 6.6: HRTEM: ZrO2-TiO2 nanotubes calcined at (a) as-prepared,(b) 500, and (c) 1000 oC. (Bar represenst 10 nm.)
6.2.4. Raman
To further verify these results, Raman spectra for the bimetallic nanotube samples
were measured for several different calcination temperatures, as shown in Figure 6.7. The
spectrum for the sample calcined at 500°C (Fig.6.7(a)) shows raman peaks at 142, 395,
517 and 639 cm-1, that can be assigned to the Eg, B1g, B1g /A1g, Eg, modes of the anatase
of titania respectively, which agrees with published values.219 With increasing calcination
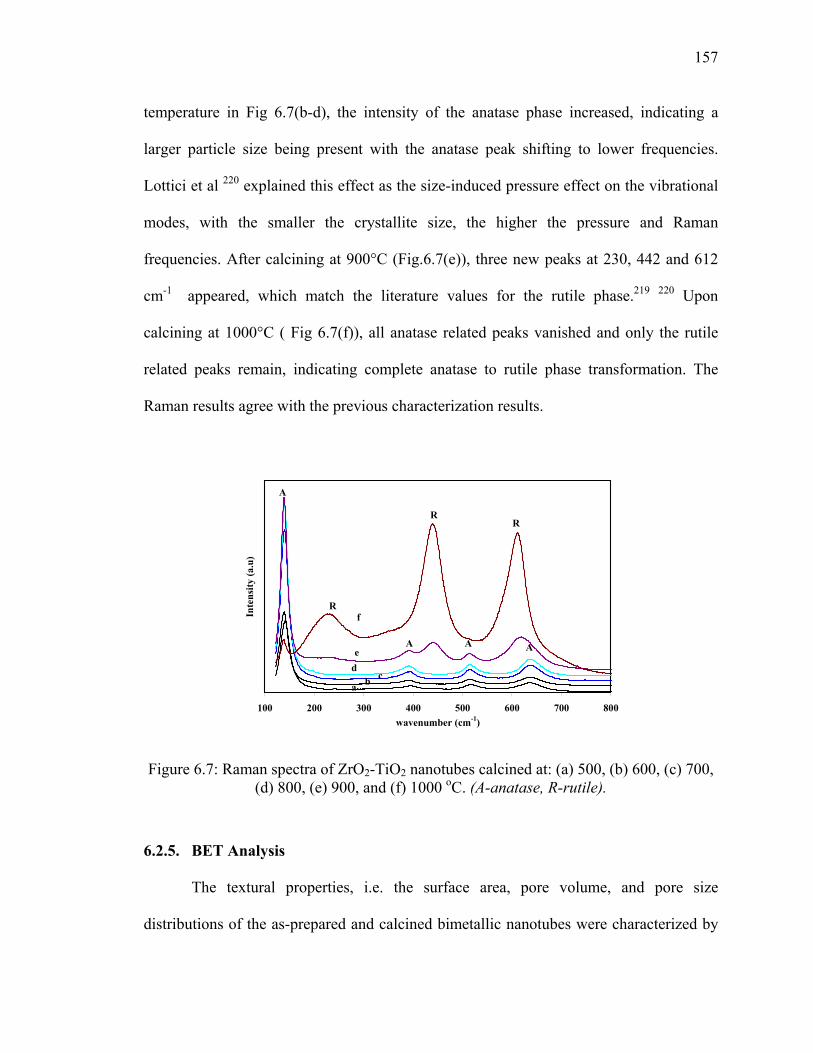
157
temperature in Fig 6.7(b-d), the intensity of the anatase phase increased, indicating a
larger particle size being present with the anatase peak shifting to lower frequencies.
Lottici et al 220 explained this effect as the size-induced pressure effect on the vibrational
modes, with the smaller the crystallite size, the higher the pressure and Raman
frequencies. After calcining at 900°C (Fig.6.7(e)), three new peaks at 230, 442 and 612
cm-1 appeared, which match the literature values for the rutile phase.219 220 Upon
calcining at 1000°C ( Fig 6.7(f)), all anatase related peaks vanished and only the rutile
related peaks remain, indicating complete anatase to rutile phase transformation. The
Raman results agree with the previous characterization results.
100 200 300 400 500 600 700 800wavenumber (cm-1)
Inte
nsity
(a.u
)
f
ed
a b c
A
A AA
R
RR
Figure 6.7: Raman spectra of ZrO2-TiO2 nanotubes calcined at: (a) 500, (b) 600, (c) 700, (d) 800, (e) 900, and (f) 1000 oC. (A-anatase, R-rutile).
6.2.5. BET Analysis
The textural properties, i.e. the surface area, pore volume, and pore size
distributions of the as-prepared and calcined bimetallic nanotubes were characterized by

158
nitrogen adsorption studies. Figure 6.8 shows the nitrogen adsorption isotherms for both
the as-prepared and calcined materials, which exhibit H3 hysteresis loops (to 800 οC),
typical for mesoporous materials. The isotherm for the bimetallic metal oxide nanotubes
calcined at 1000 οC changes to a type I isotherm, typical for a microporous material.160
The lower limit of the relative pressure for the hysteresis loop is characteristic of a given
adsorbate at a given temperature.198 It can be seen from Fig. 6.8 for both the as prepared
nanotubes, and for those calcined at 300 and 400 °C that the lower pressure limit of the
hysteresis loop is at P/P0 = 0.4. Calcinations at higher temperatures increase this value,
e.g. at 600 οC, P/P0 increases to ca. 0.55, while after 800 οC this value increases to 0.6,
indicating that the pores are becoming larger as the materials are calcined at higher
temperature.
0
50
100
150
200
250
0 0.2 0.4 0.6 0.8 1Relative Pressure (P/Po)
Vol
ume
Ads
orbe
d (c
m3 /g
ST
P)
As-preparedT300T400T600T800T1000
Figure 6.8: N2 adsorption/desorption isotherms of ZrO2-TiO2 nanotubes calcined at different temperatures.

159
To evaluate the pore size distribution, the as-prepared and calcined materials were
plotted as shown in Figure 6.9. The average pore diameter for the as-prepared nanotubes
is ca. 3 nm, whereas upon calcination, the pore size became gradually larger and the pore
size distribution shifted forming larger pores in expense of the smaller ones. At 600 οC
the pore size is ca. 9 nm while when the nanomaterials were calcined at 800 οC, the pore
size became more than double ca.19 nm. Calcining the materials at 1000 οC collapsed the
small pores, resulting in only larger pores.
0
0.01
0.02
0.03
0.04
0.05
0 100 200 300 400 500 600 700Pore Diameter (Ǻ)
Pore
Vol
ume
(cm
3 /g)
As-preparedT300T600T800T1000
Figure 6.9: BJH pore size distribution of the ZrO2-TiO2 nanotubes calcined at different temperatures.
The surface properties of the ZrO2-TiO2 nanotubes calcined at different
temperatures are summarized in Figure 6.10. The as-prepared ZrO2-TiO2 nanotubes
having a surface area of 430 m2/g, gradually decrease through calcination. Due to the
sintering phenomena, the small pores collapse, reducing the pore volume and surface
area. The transformations into anatase and rutile crystalline phases will also help to

160
reduce the surface area. Interestingly, literature values show that pure TiO2 has almost
zero surface area at this high temperature. 39, 221 Hence, the presence of 10 % zirconia
increased the thermal stability, and reduced grain growth rates during the course of heat
treatment resulting in moderate (23 m2/g) surface areas at very high temperature.
0
100
200
300
400
0 300 400 600 800 1000 Temperature (oC)
Surf
ace
Are
a (m
2 /g)
0
0.1
0.2
0.3
0.4
Pore
Vol
ume
(cm
3 /g)Surface area
Pore Volume
Figure 6.10: Surface area and pore volume of ZrO2-TiO2 nanotubes as a function of calcination temperature.
6.3. Solid State Reaction Kinetics
Kinetic analysis for the thermal decomposition of the as-prepared binary
nanotubes was performed according to the models described previously in the
introduction section using the TG data. The experimental α-t profiles were examined by
fitting the rate equations mentioned previously. For model selection, the calculated value
of R2 was taken as the criterion, and the model with the largest R2 values selected. The
results of the kinetic investigation are shown in Fig. 6.11 and the kinetic parameters are
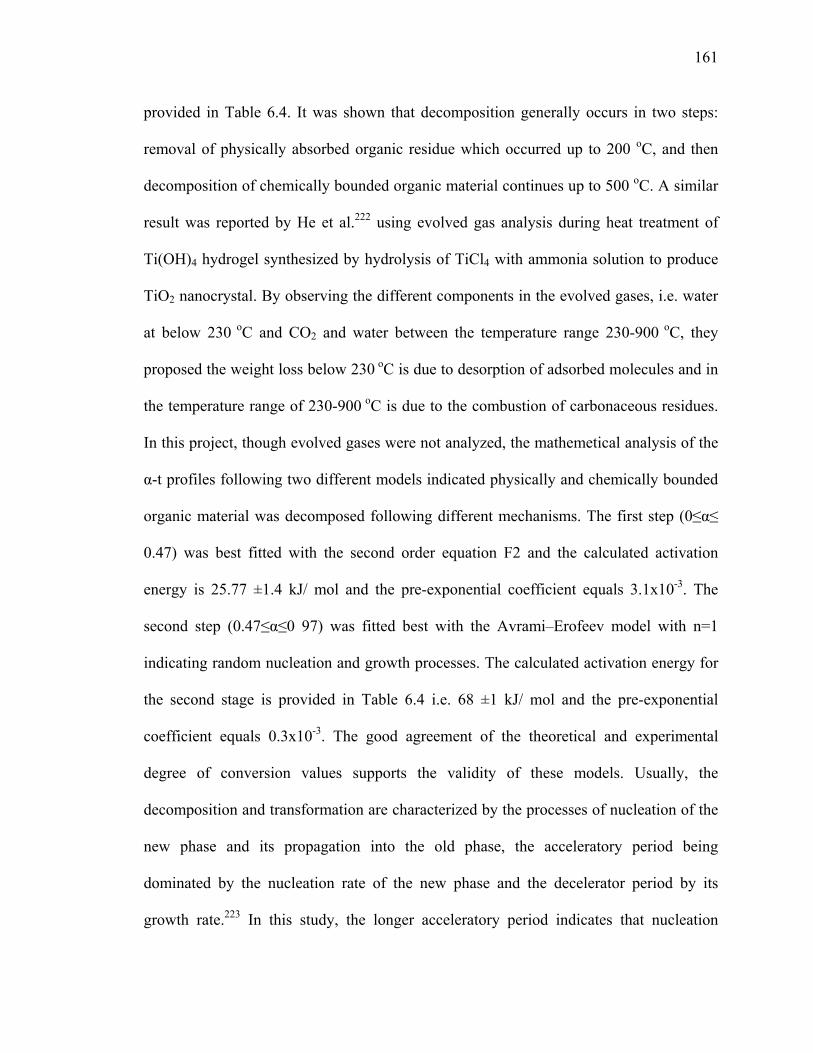
161
provided in Table 6.4. It was shown that decomposition generally occurs in two steps:
removal of physically absorbed organic residue which occurred up to 200 oC, and then
decomposition of chemically bounded organic material continues up to 500 oC. A similar
result was reported by He et al.222 using evolved gas analysis during heat treatment of
Ti(OH)4 hydrogel synthesized by hydrolysis of TiCl4 with ammonia solution to produce
TiO2 nanocrystal. By observing the different components in the evolved gases, i.e. water
at below 230 oC and CO2 and water between the temperature range 230-900 oC, they
proposed the weight loss below 230 oC is due to desorption of adsorbed molecules and in
the temperature range of 230-900 oC is due to the combustion of carbonaceous residues.
In this project, though evolved gases were not analyzed, the mathemetical analysis of the
α-t profiles following two different models indicated physically and chemically bounded
organic material was decomposed following different mechanisms. The first step (0≤α≤
0.47) was best fitted with the second order equation F2 and the calculated activation
energy is 25.77 ±1.4 kJ/ mol and the pre-exponential coefficient equals 3.1x10⁻³. The
second step (0.47≤α≤0 97) was fitted best with the Avrami–Erofeev model with n=1
indicating random nucleation and growth processes. The calculated activation energy for
the second stage is provided in Table 6.4 i.e. 68 ±1 kJ/ mol and the pre-exponential
coefficient equals 0.3x10⁻³. The good agreement of the theoretical and experimental
degree of conversion values supports the validity of these models. Usually, the
decomposition and transformation are characterized by the processes of nucleation of the
new phase and its propagation into the old phase, the acceleratory period being
dominated by the nucleation rate of the new phase and the decelerator period by its
growth rate.223 In this study, the longer acceleratory period indicates that nucleation
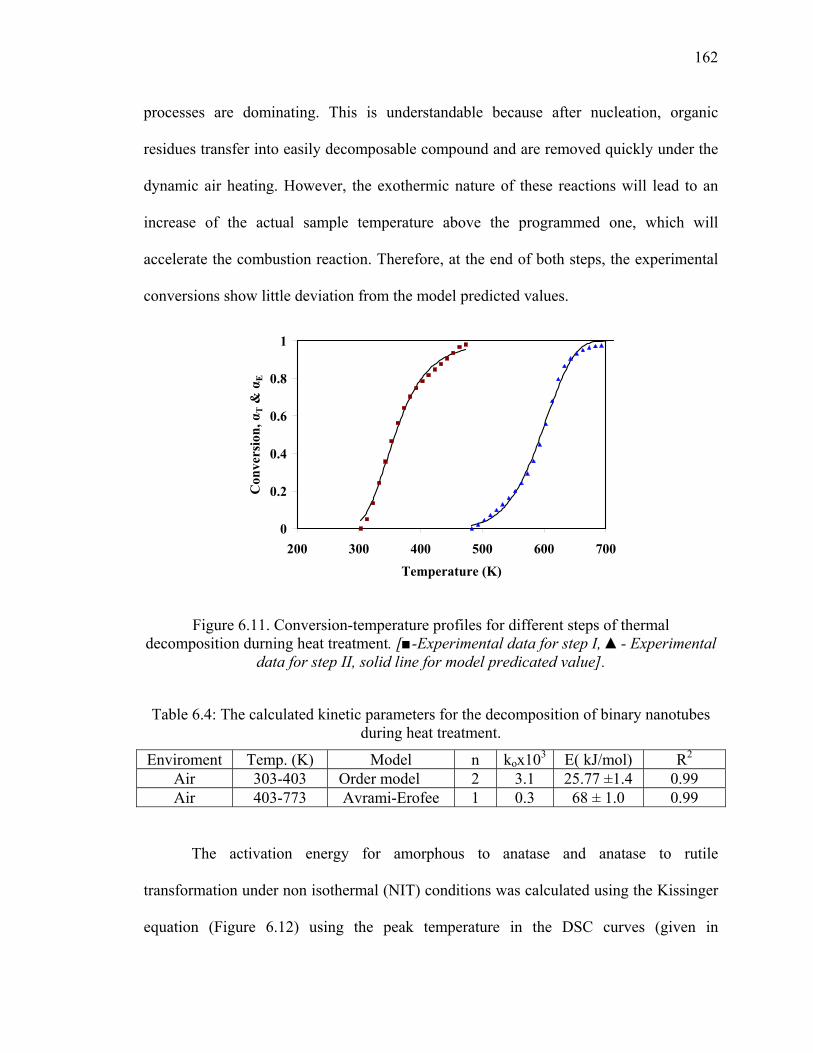
162
processes are dominating. This is understandable because after nucleation, organic
residues transfer into easily decomposable compound and are removed quickly under the
dynamic air heating. However, the exothermic nature of these reactions will lead to an
increase of the actual sample temperature above the programmed one, which will
accelerate the combustion reaction. Therefore, at the end of both steps, the experimental
conversions show little deviation from the model predicted values.
0
0.2
0.4
0.6
0.8
1
200 300 400 500 600 700Temperature (K)
Con
vers
ion,
αT &
αE
Figure 6.11. Conversion-temperature profiles for different steps of thermal decomposition durning heat treatment. [■-Experimental data for step I, ▲- Experimental
data for step II, solid line for model predicated value].
Table 6.4: The calculated kinetic parameters for the decomposition of binary nanotubes during heat treatment.
Enviroment Temp. (K) Model n kox103 E( kJ/mol) R2
Air 303-403 Order model 2 3.1 25.77 ±1.4 0.99 Air 403-773 Avrami-Erofee 1 0.3 68 ± 1.0 0.99
The activation energy for amorphous to anatase and anatase to rutile
transformation under non isothermal (NIT) conditions was calculated using the Kissinger
equation (Figure 6.12) using the peak temperature in the DSC curves (given in
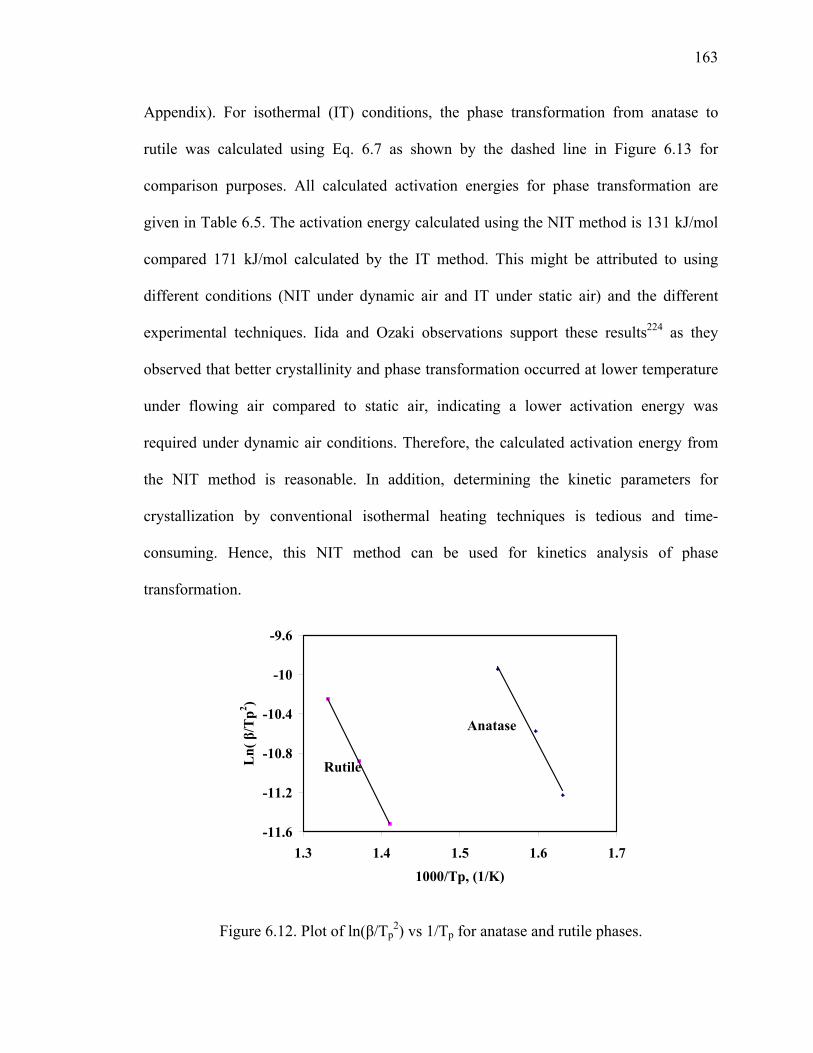
163
Appendix). For isothermal (IT) conditions, the phase transformation from anatase to
rutile was calculated using Eq. 6.7 as shown by the dashed line in Figure 6.13 for
comparison purposes. All calculated activation energies for phase transformation are
given in Table 6.5. The activation energy calculated using the NIT method is 131 kJ/mol
compared 171 kJ/mol calculated by the IT method. This might be attributed to using
different conditions (NIT under dynamic air and IT under static air) and the different
experimental techniques. Iida and Ozaki observations support these results224 as they
observed that better crystallinity and phase transformation occurred at lower temperature
under flowing air compared to static air, indicating a lower activation energy was
required under dynamic air conditions. Therefore, the calculated activation energy from
the NIT method is reasonable. In addition, determining the kinetic parameters for
crystallization by conventional isothermal heating techniques is tedious and time-
consuming. Hence, this NIT method can be used for kinetics analysis of phase
transformation.
-11.6
-11.2
-10.8
-10.4
-10
-9.6
1.3 1.4 1.5 1.6 1.71000/Tp, (1/K)
Ln(
β/T
p2 )
Anatase
Rutile
Figure 6.12. Plot of ln(β/Tp2) vs 1/Tp for anatase and rutile phases.

164
Table 6.5: The calculated activation energy for the phase change of binary nanotubes during heat treatment.
Phase change Method E( kJ/mol) R2 Amorhous to anatase NIT 123 0.98
Anatase to rutile NIT 131 0.99 Anatase to rutile IT 171 0.93
Figure 6.13 shows the plot of the logarithm of the average crystallite size versus
the reciprocal of the calcination temperature (solid lines). A linear relationship is
observed and the activation energy for crystal growth of the ZrO2-TiO2 nanotubes was
calculated as 12.8 kJ/mol and 36.4 kJ/mol for anatase and rutile phases, respectively.
These values are higher than those reported for nanocrystalline pure titania,216, 225 which
is a beneficial effect of Zr doping. In explanation, during the heat treatment, there are two
competitive processes: grain growth and A→R phase transformation in the
nanocrystalline materials. Both processes are easier for small grain- sized materials
because the activation energy for growth and phase transformation is lower.226
R 2 = 0 .9 8 6
R 2 = 0 .9 9 8
R 2 = 0 .9 4 0
2
2 .5
3
3 .5
4
4 .5
5
0 .7 0 .9 1. 1 1.3 1.5
10 0 0 / Te mp e rat ure , K
Figure 6.13: Ln of anatase and rutile crystallite size in nm as a function of reciprocal of absolute temperature.(■-Anatase, ●/○rutile).
165
6.4. Conclusions
The thermal behavior of the ZrO2-TiO2 nanotubes synthesized by an acid
modified sol–gel process in scCO2 has been investigated in detail using SEM, TEM, TG,
EDX, FTIR, XRD, HRTEM, Raman and BET analysis. The SEM and TEM analysis
confirmed that the morphology of the nanotube structure was preserved at up to 800 οC,
whereas further heat treatment deformed the tubes. FTIR and EDX analysis showed that
different organic residues were removed depending on the calcination temperature. Along
with HRTEM and Raman, XRD results showed anatase nanocrystallites were formed
after calcining at 400οC, while no rutile phase appeared until calcining at 700οC, with
further heat treatment resulting in a rutile phase transformation and ZrTiO4 being formed.
The activation energy for anatase and rutile crystal growth was calculated and the values
were 12.8 and 36.4 kJ/mol, respectively. The activation energy for phase transformation
was determined to be 171 kJ/mol, higher than that of the pure TiO2 nanomaterials. The
as-prepared nanotubes had a 430 m2/g specific surface area (SSA), whereas after
calcining at 1000οC, the SSA was reduced to 23 m2/g. Hence, the ZrO2 present in the
TiO2 matrix increased thermal stability, reducing grain growth resulting in smaller
crystallites, hence preserving the morphology and surface area at high temperatures.
166
CHAPTER 7
Fe DOPED TiO2 NANOMATERIALS
7. Introduction
Recently, the sol–gel process is becoming an alternate synthesis route to produce
high quality, homogeneous materials with desired nanostructure at low cost.96, 196 The
sol–gel process involves hydrolysis of a metal precursor to form hydroxide and
subsequent polycondensation to form a gel, in an appropriate solvent with/without the
presence of a catalyst.196 At the end of the polycondensation reaction, the excess solvent
can be removed by evaporation in an oven at atmospheric pressure (xerogels) or by
employing supercritical drying (aerogels). Drying of the gel with supercritical carbon
dioxide (scCO2), forms aerogels, which possess catalytically favourable textural
properties resulting in high accessible internal surface areas and consequently the
availability of active centers compared to the corresponding xerogels.203 Therefore,
combining the sol–gel technique with supercritical drying is a promising technique to
synthesize materials with novel structural and chemical properties that are not easily
achieved by other synthesis methods.76 Moreover, the strong environmental regulations
for reducing VOCs, scCO2 is becoming an attractive alternative for organic solvents in a
wide range of chemical processes due to its nontoxic, nonflammable, inexpensive,
naturally abundant, and chemically inert characteristics. 120, 122, 227 Low viscosity, zero
surface tension and high diffusivity of scCO2 are considered most favorable properties for
synthesizing superior ultrafine and uniform nanomaterials. Furthermore, these properties
help to increase the reaction rates,131, 132 and when the reactions are carried out in scCO2,
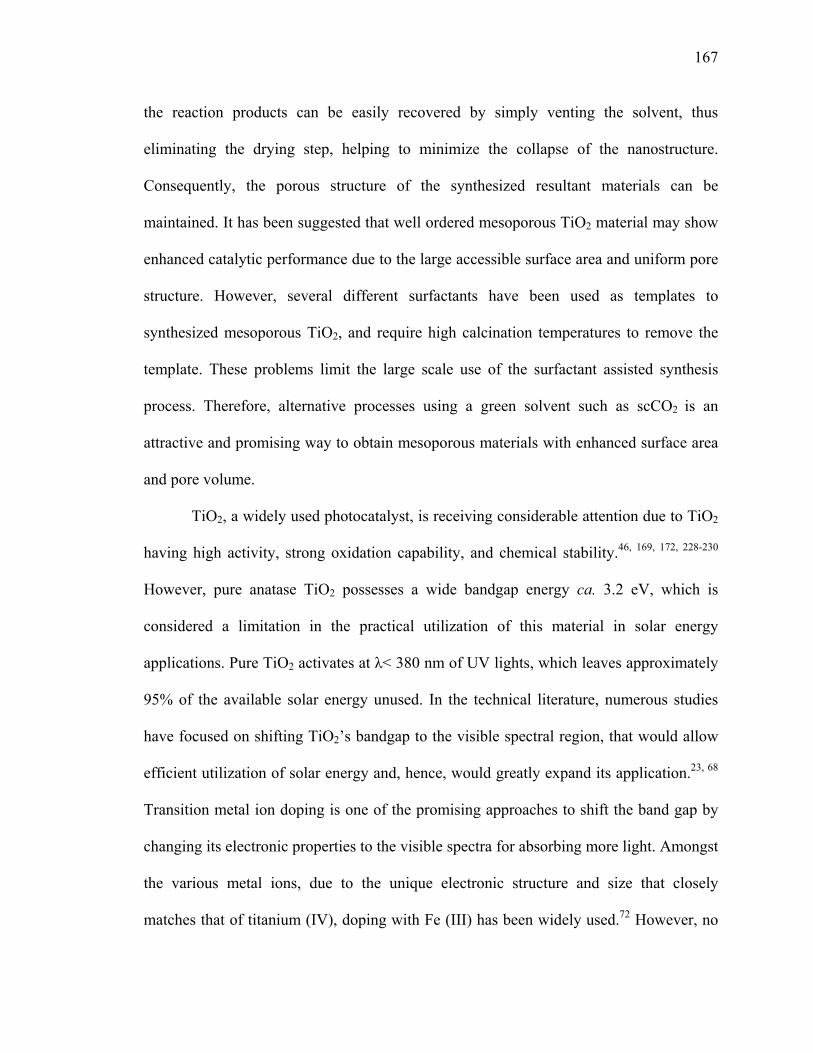
167
the reaction products can be easily recovered by simply venting the solvent, thus
eliminating the drying step, helping to minimize the collapse of the nanostructure.
Consequently, the porous structure of the synthesized resultant materials can be
maintained. It has been suggested that well ordered mesoporous TiO2 material may show
enhanced catalytic performance due to the large accessible surface area and uniform pore
structure. However, several different surfactants have been used as templates to
synthesized mesoporous TiO2, and require high calcination temperatures to remove the
template. These problems limit the large scale use of the surfactant assisted synthesis
process. Therefore, alternative processes using a green solvent such as scCO2 is an
attractive and promising way to obtain mesoporous materials with enhanced surface area
and pore volume.
TiO2, a widely used photocatalyst, is receiving considerable attention due to TiO2
having high activity, strong oxidation capability, and chemical stability.46, 169, 172, 228-230
However, pure anatase TiO2 possesses a wide bandgap energy ca. 3.2 eV, which is
considered a limitation in the practical utilization of this material in solar energy
applications. Pure TiO2 activates at λ< 380 nm of UV lights, which leaves approximately
95% of the available solar energy unused. In the technical literature, numerous studies
have focused on shifting TiO2’s bandgap to the visible spectral region, that would allow
efficient utilization of solar energy and, hence, would greatly expand its application.23, 68
Transition metal ion doping is one of the promising approaches to shift the band gap by
changing its electronic properties to the visible spectra for absorbing more light. Amongst
the various metal ions, due to the unique electronic structure and size that closely
matches that of titanium (IV), doping with Fe (III) has been widely used.72 However, no
168
direct correlation between light absorption and photocatalytic activity could be found,
and the synthesis process is considered one of the most important factors controlling the
reactivity of the Fe-doped TiO2.73, 119 In addition, the literature has shown that the
performance of titania nanomaterials also strongly relies on their crystallinity, specific
surface area, thermal stability and quantum efficiency.17, 50 These properties significantly
vary with the synthesis method, type and amount of Fe loading and the subsequent heat
treatment.72-75 Therefore, it is critically important to investigate the effects of Fe doping
of TiO2 which would show superior performance by not only enhancing surface
properties but also changing the band gap energy.
This chapter mainly focuses on the effects of Fe doping of TiO2 nanomaterials by
a direct sol-gel process in scCO2 on the morphology, crystal structure, crystal size,
surface area, pore volume, pore size distribution and photo response of the doped
nanomaterials.
7.1. Experimental
Fe doped TiO2 nanomaterials were synthesized at 60 oC and 5000 psig following
the standard procedure previously discussed in chapter 3 using the appropriate amount of
1 wt% Fe(NO3)3 stock solution and TIP. In a typical experiment, 7.4 mmol TIP, 35 mmol
acetic acid and the appropriate amount of stock solution were quickly placed in a 10 mL
view cell at 60°C under stirring. CO2 was added to make the synthesis pressure 5000
psig. After 5 days aging, nanomaterial samples were washed by CO2. In this category
four different samples were synthesized using 0, 1, 1.5, and 2 mL iron stock solution. The
starting values of Fe at % in the materials were 0.0, 0.2, 0.36, and 0.49 and named S1, S2,
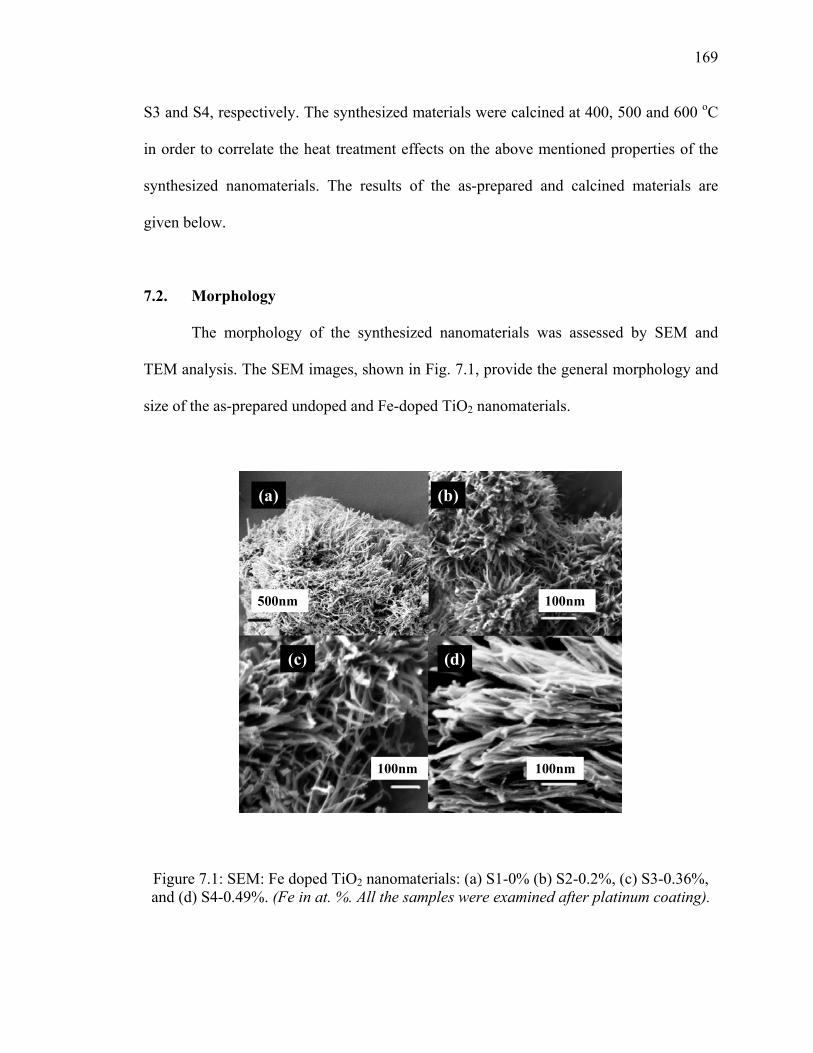
169
S3 and S4, respectively. The synthesized materials were calcined at 400, 500 and 600 oC
in order to correlate the heat treatment effects on the above mentioned properties of the
synthesized nanomaterials. The results of the as-prepared and calcined materials are
given below.
7.2. Morphology
The morphology of the synthesized nanomaterials was assessed by SEM and
TEM analysis. The SEM images, shown in Fig. 7.1, provide the general morphology and
size of the as-prepared undoped and Fe-doped TiO2 nanomaterials.
Figure 7.1: SEM: Fe doped TiO2 nanomaterials: (a) S1-0% (b) S2-0.2%, (c) S3-0.36%, and (d) S4-0.49%. (Fe in at. %. All the samples were examined after platinum coating).
(a)
(c)
(b)
(d)
100nm
100nm
500nm
100nm

170
From Figure 7.1a, it can be seen that pure TiO2 nanofibers were formed having
20-50 nm diameters, with lengths up to several microns. Under similar conditions, the Fe
doped samples were composed of mainly flake type structures as shown in Figure 7.1b-d.
The widths of the flakes become larger with an increased amount of Fe, with dimensions
ranging from 20-300 nm. In order to further confirm these results, TEM analysis was
conducted for the as-prepared and calcined nanomaterials. The TEM images of the as-
prepared pure TiO2 S1 samples are 50 nm fibers, whereas Fe doped TiO2 S4 sample are
300 nm sheets (Figure 7.2a and 7.2b). This TEM analysis clearly demonstrates the
morphological difference between the unmodified and modified TiO2 materials. In
addition, when calcined at 500 oC, the unmodified TiO2 (S1) showed larger ca.14 nm
crystallites (Figure 7.2c) while the Fe doped TiO2 nanomaterials were porous consisting
of smaller ca.12 nm crystallites (Figure 7.2d). This analysis shows that the introduction
of Fe solution significantly altered the morphology and the properties of the synthesized
nanomaterials.
It is believed that the Fe ions impregnate into the TiO2 matrix, which is mainly
responsible for the morphological modification of the doped samples. This hypothesis
will be examined further below.
Typically, nanostructure evolution in the modified sol-gel process goes through
the following steps: (i) modification, (ii) hydrolysis, (iii) condensation, (iv) nucleation,
and (v) growth.176 After modification, titanium isopropoxide (TIP) undergoes hydrolysis
in acidic solution by the following reaction:
(C3H7O)3Ti(OC3H7) +H3O+→(C3H7O)3Ti(OH) +C3H7OH+H+ 7.1

171
Figure 7.2: TEM: Fe doped TiO2 nanomaterials: (a) S1-0%, & (b) S4-0.49%, (c) S1, and (d) S4. (As-prepared (a) & (b), calcined (c)&(d), Bar represent 100 nm.)
In addition, usually Fe(NO3)3 dissociates to produce Fe(OH) in the presence of
water according to the following reaction: 231
Fe(NO3)3+3H2O→ Fe(OH)3+3HNO3 7.2
According to the sol-gel principle, the hydrolysis products (Ti-OH and Fe-OH)
condense producing metal-oxygen bonds, resulting in the evolution of nanostructure. The
reaction rates of the different steps strongly depends on the reactivity of the metal atoms
present in the precursors, the working solvents, and the pH of the system. Therefore, the
properties of the sol-gel products vary significantly with the above mentioned synthesis
variables. The introduction of 1% iron stock solution in isopropanol with pH≈ 0.75, not
only changed the pH of the system (pH≈ 2.3) but also increased the solvating ability of
the synthesis solvent. The solvating ability of the mixed solvent can be determined using
the following equation. 232, 233

172
∑=−
iiiδφδ 7.3
where, −
δ is the solubility parameter of the mixed solvent, and iφ and iδ are the volume
fraction and the solubility parameter of solvent i, respectively. The solubility parameters
of CO2 were obtained from Allada’s method234 with the other solvents being calculated
using the following equation235:
VRTHV −Δ
=δ 7.4
where, V is the molar volume of the liquid (cm3/mol), VHΔ is the enthalpy change
during vaporization (cal/mol), R is the gas law constant in cal/(mol·K), and T is the
temperature in K.
For the unmodified TiO2 system, considering CO2 and acetic acid, the solubility
parameter was 7.45 (cal/cm3)1/2 while for the highest iron containing system (S4) the
corresponding value was 8.6 (cal/cm3)1/2. Usually, low solubility promotes
supersaturation and inhibits dissolution, reprecipitation, repolymerization, resulting in
smaller mateials.99 The observed morphologies were consistent with this hypothesis.
Huang et al. also observed similar effects for N-F-codoped TiO2 synthesized by the sol-
gel-solvothermal method.55 However, flakes or a sheet type morphology could not result
from the change of the solubility. In order to examine this hypothesis further, TiO2 was
synthesized under the same experimental conditions, i.e. adding the same amount of
isopropanol with nitric acid to maintain the pH. It was observed that the morphology of
the nanofibers did not change. However, the diameter of the nanofibers became larger, up
to 100 nm. Bavykin et al. showed that a sheet-type structure was usually formed using
trititanate acid.106 Yu et al synthesized iron phosphate nanotubes by the solvothermal
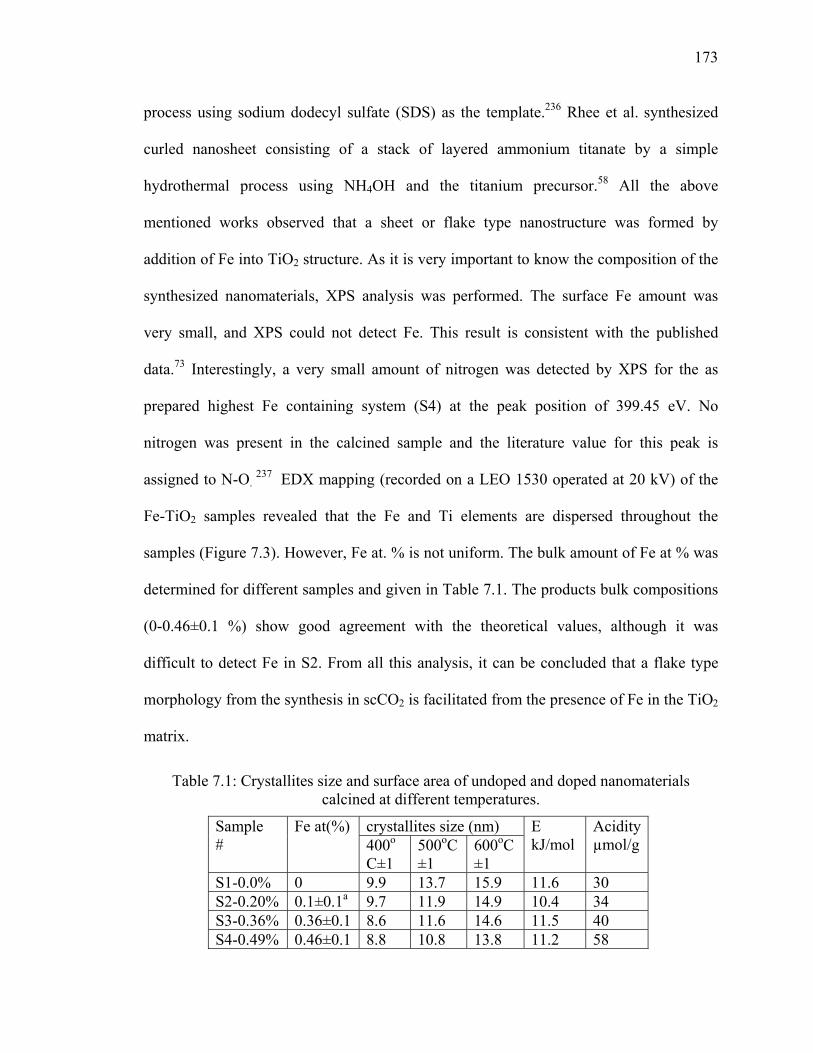
173
process using sodium dodecyl sulfate (SDS) as the template.236 Rhee et al. synthesized
curled nanosheet consisting of a stack of layered ammonium titanate by a simple
hydrothermal process using NH4OH and the titanium precursor.58 All the above
mentioned works observed that a sheet or flake type nanostructure was formed by
addition of Fe into TiO2 structure. As it is very important to know the composition of the
synthesized nanomaterials, XPS analysis was performed. The surface Fe amount was
very small, and XPS could not detect Fe. This result is consistent with the published
data.73 Interestingly, a very small amount of nitrogen was detected by XPS for the as
prepared highest Fe containing system (S4) at the peak position of 399.45 eV. No
nitrogen was present in the calcined sample and the literature value for this peak is
assigned to N-O. 237
EDX mapping (recorded on a LEO 1530 operated at 20 kV) of the
Fe-TiO2 samples revealed that the Fe and Ti elements are dispersed throughout the
samples (Figure 7.3). However, Fe at. % is not uniform. The bulk amount of Fe at % was
determined for different samples and given in Table 7.1. The products bulk compositions
(0-0.46±0.1 %) show good agreement with the theoretical values, although it was
difficult to detect Fe in S2. From all this analysis, it can be concluded that a flake type
morphology from the synthesis in scCO2 is facilitated from the presence of Fe in the TiO2
matrix.
Table 7.1: Crystallites size and surface area of undoped and doped nanomaterials calcined at different temperatures.
Sample #
Fe at(%) crystallites size (nm) E kJ/mol
Acidity µmol/g 400o
C±1 500oC ±1
600oC ±1
S1-0.0% 0 9.9 13.7 15.9 11.6 30 S2-0.20% 0.1±0.1a 9.7 11.9 14.9 10.4 34 S3-0.36% 0.36±0.1 8.6 11.6 14.6 11.5 40 S4-0.49% 0.46±0.1 8.8 10.8 13.8 11.2 58
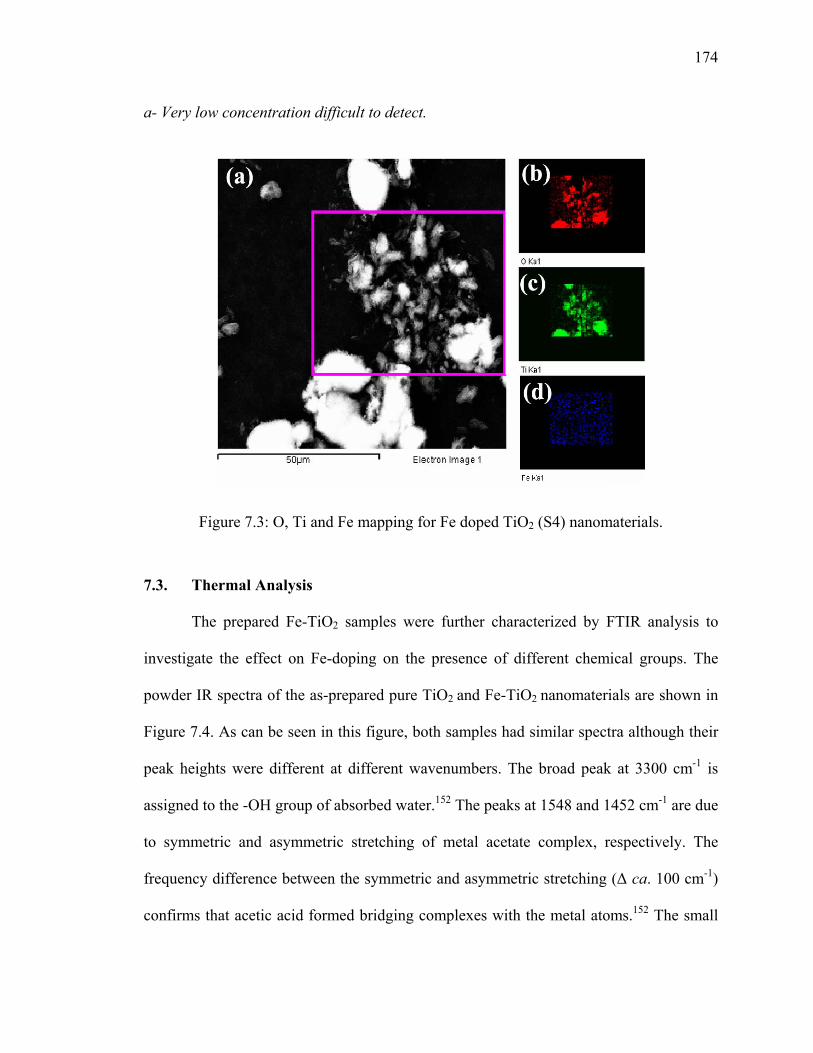
174
a- Very low concentration difficult to detect.
Figure 7.3: O, Ti and Fe mapping for Fe doped TiO2 (S4) nanomaterials.
7.3. Thermal Analysis
The prepared Fe-TiO2 samples were further characterized by FTIR analysis to
investigate the effect on Fe-doping on the presence of different chemical groups. The
powder IR spectra of the as-prepared pure TiO2 and Fe-TiO2 nanomaterials are shown in
Figure 7.4. As can be seen in this figure, both samples had similar spectra although their
peak heights were different at different wavenumbers. The broad peak at 3300 cm-1 is
assigned to the -OH group of absorbed water.152 The peaks at 1548 and 1452 cm-1 are due
to symmetric and asymmetric stretching of metal acetate complex, respectively. The
frequency difference between the symmetric and asymmetric stretching (Δ ca. 100 cm-1)
confirms that acetic acid formed bridging complexes with the metal atoms.152 The small

175
peaks at 1343 cm-1 indicates the presence of the -CH3 group.151 There were two more
small peaks appearing at 1037 and 1024 cm-1, which correspond to the ending and
bridging -OPr groups, respectively. This observation suggests the presence of
unhydrolyzed –OPr groups in the as prepared materials. Sui et al. also reported the
presence of -OPr groups in nanomaterials prepared under similar conditions.120, 198 All
spectra contain a small peak at 1710 cm-1 confirming the residue of unreacted acetic acid.
Finally, the bands below 657 cm-1 represent the existence of oxo bonds.238 It is important
to emphasize that no peak was detected for the CO2, indicating no CO2 incorporation into
the TiO2 nanomaterials. This powder IR analysis confirms that pure and modified TiO2
were rather similar in chemical composition.
0
0.4
0.8
1.2
500 1000 1500 2000 2500 3000 3500 4000
wavenumber (cm-1)
Abs
orba
nce
(a.u
)
Vs(COO-)Vas(COO-)
a
b
M-O
OHCH3COOH-OPr
-CH
Figure 7.4: Powder ATR-FTIR spectra of as-prepared (a) TiO2 & (b) Fe doped TiO2 (S4) nanomaterials.
As mentioned above, although the peak positions were similar, the heights of the
peaks were quite different. For instance, if one considers the peaks around 1548 and 1452
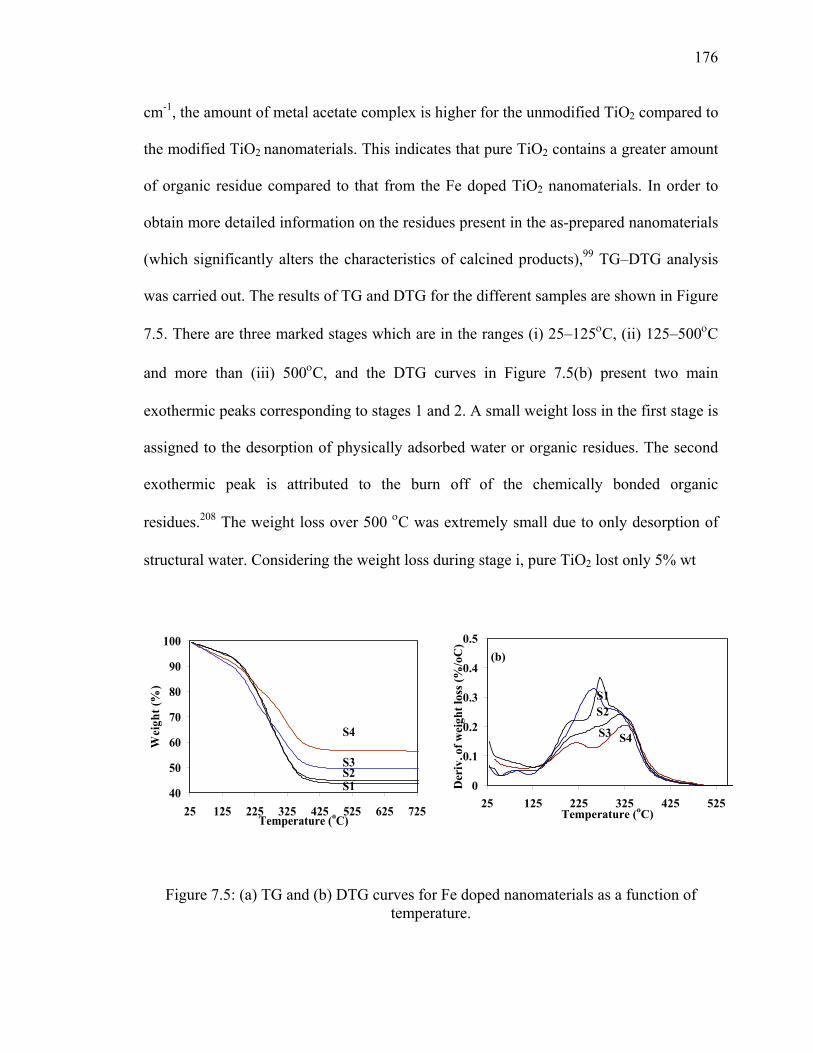
176
cm-1, the amount of metal acetate complex is higher for the unmodified TiO2 compared to
the modified TiO2 nanomaterials. This indicates that pure TiO2 contains a greater amount
of organic residue compared to that from the Fe doped TiO2 nanomaterials. In order to
obtain more detailed information on the residues present in the as-prepared nanomaterials
(which significantly alters the characteristics of calcined products),99 TG–DTG analysis
was carried out. The results of TG and DTG for the different samples are shown in Figure
7.5. There are three marked stages which are in the ranges (i) 25–125οC, (ii) 125–500οC
and more than (iii) 500οC, and the DTG curves in Figure 7.5(b) present two main
exothermic peaks corresponding to stages 1 and 2. A small weight loss in the first stage is
assigned to the desorption of physically adsorbed water or organic residues. The second
exothermic peak is attributed to the burn off of the chemically bonded organic
residues.208 The weight loss over 500 οC was extremely small due to only desorption of
structural water. Considering the weight loss during stage i, pure TiO2 lost only 5% wt
40
50
60
70
80
90
100
25 125 225 325 425 525 625 725Temperature (oC)
Wei
ght (
%)
S1S2S3
S4
0
0.1
0.2
0.3
0.4
0.5
25 125 225 325 425 525Temperature (oC)
Der
iv. o
f wei
ght l
oss (
%/o
C)
S1S2
S3 S4
(b)
Figure 7.5: (a) TG and (b) DTG curves for Fe doped nanomaterials as a function of temperature.
177
whereas 9% wt of the modified samples was lost during this stage. Chemically bonded
57% wt of the unmodified TiO2 nanomaterials was lost during the second stage, whereas
only 44% wt lost for the modified nanomaterials during this stage. Comparing this
analysis with the FTIR data reveals that Fe doped TiO2 nanomaterials contain lower
amounts of chemically bonded organic residue, and show higher thermal stability. This
may be due to the synthesis conditions instead of only the presence of Fe in the TiO2
matrix. In chapter 6, it was previously shown that in the presence of higher dielectic
constant solvents, that more condensed materials were formed, supporting this
observation.
7.4. Phase Structure
In order to examine the Fe doping effects on the phase structure and crystallite
size, XRD and HRTEM analysis were performed. During heat treatment, the as-prepared
materials transform from the amorphous to anatase phases. The as-prepared materials
were amorphous, whereas increasing the calcination temperature up to 400 oC, led to the
material reorganizing itself, with anatase crystallites beginning to grow, resulting in
crystalline material. The XRD patterns (Figure 7.6) of all the calcined samples indicate
that the Fe-TiO2 consists of anatase crystal, with no rutile phase being present. Although
all the modified samples consist of anatase crystal, the relative intensity of the peak at ca.
25.17o decreased significantly in doped TiO2 with respect to undoped TiO2 nanocrystal.
There was no distinct Fe peak indicating no phase separation, and demonstrating that the
Fe was well integrated into the anatase crystal structure for this composition and
calcination temperature. By increasing the calcination temperature from 400 to 600oC,

178
the peak intensities increased as well as the width of the peaks became narrower,
indicating an improvement of the anatase phase, and simultaneous growth of anatase
crystallites (Figure 7.4(d-f)).
20 30 40 50 60 70
2-theta (degree)
Inte
nsity
(a.u
)
a
b
c
d
ef
Figure 7.6: Powder XRD spectra of Fe doped TiO2 nanomaterials: (a) S1-TiO2, (b) S2, (c) S3, (a-c) calcined at 500οC (d-f) S4 calcined at 400- 600 οC, respectively.
The crystallite sizes of the calcined samples were estimated from these XRD
patterns using Scherrer’s equation and are provided in Table 7.1. For the unmodified
TiO2, the crystallite size was ca. 9.9 nm calcined at 400 °C, with increasing calcination
temperature causing the crystallites to become larger. The sizes were ca. 14 nm and 16
nm at 500 °C and 600 °C respectively. Due to heat treatment, the crystallites also became
larger for the doped samples, although the growth rates were lower resulting in smaller
crystallite materials at the corresponding calcination temperatures. For example, at 600°C

179
the doped samples had 14.9, 14.6 and 13.8 nm crystallites for samples S2, S3, and S4
respectively. This analysis along with the literature confirms that a small amount of Fe
inhibited the grain growth during heat treatment at moderate calcination temperatures
(400-600oC).
In order to quantify the behaviour of the crystal growth, the activation energy
required for grain growth of pure and iron doped TiO2 was estimated using the Arrhenius
equation225:
dlnk/dT = E/RT2 7.5
where k is the specific reaction rate constant, E is the activation energy, T is the absolute
temperature and R is the universal gas constant. It is well established that the value of k is
directly related to the grain size. Thus, modification and integration of Equation (7.5)
becomes:
ln D =(-E/RT) + A 7.6
where D is the grain size and A is the intercept. The plots of lnD versus the reciprocal of
absolute temperature 1/T for different samples are linear, as shown in Figure 7.7.
The activation energy for all samples was calculated from the slope of the best fit
lines and given in Table 7.1, where the activation energy for anatase crystallites of pure
TiO2 was measured at 11.6 kJ/mol. The activation energy for Fe modified TiO2
nanomaterials ranged from 10.4-11.5 kJ/mol, and did not show any trend with an
increasing amount of iron. However, the values are rather similar to the pure TiO2
nanomaterial.

180
R2 = 0.9869
R2 = 0.989
R2 = 0.9848
R2 = 0.9999
1.8
2.2
2.6
3
1.1 1.2 1.3 1.4 1.51000/ Temperature, (1/K)
Ln
(D,n
m)
S1
S2
S3
S4
Figure 7.7: Ln size of anatase crystallite in nm as a function of reciprocal of absolute
temperature.
In addition to the XRD data, detailed information on the crystal structure, size and
defects can be obtained using HRTEM. The HRTEM micrographs of the lattice image of
pure titania calcined at 500 oC are given in Figure 7.8(a), showing a grain size of ca.14
nm width with d-spacing 0.35 nm, very close to the lattice spacing of the (101) planes of
the anatase phase. The lattice image of doped TiO2 calcined at 500 oC (Figure 7.8b)
shows that these materials are also composed of smaller grain anatase phase. However,
all grains were not the same in terms of size and shape. Some were long with significant
lattice mismatch and grain boundaries. The HRTEM image also reveals that doped
materials are predominately mesoporous.

181
Figure 7.8: HRTEM: (a) S1- TiO2, and (b) S4-Fe doped TiO2 nanomaterials (calcined at 500oC (a) & (b). (Bar represent 10 nm. Arrows indicate defects and pore).
7.5. Surface Area and Pore Volume
The textural properties, i.e. the surface area, pore volume, and pore size
distributions of all samples calcined at 400, 500 and 600oC were characterized by
nitrogen adsorption studies. Figure 7.9a shows the nitrogen adsorption isotherms for the
as-prepared materials, which exhibit H3 hysteresis loops for all samples, typical of
mesoporous materials.160 The pore size distributions of the calcined materials are given in
Figure 7.9b. The average pore diameter for the pure TiO2 and materials containing a
small amount of Fe i.e. 0.36 at% was ca.11 nm, whereas samples S4 were 20 nm. Upon
calcination, the pore size became gradually larger and the pore size distribution shifted to
the right, forming larger pores at the expense of smaller ones. At 600 οC the pore size was
ca. 15 nm for all samples except S4, which increased to ca. 24 nm. Therefore, Fe doping
was favorable for organizing a more ordered mesostructure and maintaining the pore
structure at high temperature.

182
0
100
200
300
400
500
0 0.2 0.4 0.6 0.8 1
Vol
ume
Ads
orbe
d (c
m3 /g
ST
P)
Relative Pressure (P/Po)
S1
S2
S3
S4
0
0.02
0.04
0.06
0.08
0.1
0.12
0 200 400 600 800Pore Diameter (Ǻ)
Pore
Vol
ume
(cm
3 /g)
S1S2
S3
S4
Figure 7.9: (a) N2 adsorption/desorption isotherms, and (b) BJH pore size distribution of Fe doped TiO2 nanomaterial calcined at 500 oC.
The surface properties of the Fe-TiO2 nanomaterials calcined at different
temperatures are summarized in Figure 7.10. The 400oC calcined TiO2 nanomaterials
have a surface area of 69 m2/g, and gradually decreased through calcination; becoming 43
m2/g at 600oC. Due to the sintering phenomena, the small pores collapse, reducing the
pore volume and surface area. The transformation into anatase crystalline phase is
another factor for the reduction in surface area. However, the presence of a small amount
of iron inhibits these transformations, resulting in the doped nanomaterials showing
higher surface areas compared to the undoped sample. From Figure 7.10, it is very clear
that due to heat treatment, the surface area of the doped materials also decreases but the
reduction rate was slower. Consequently, the highest iron containing TiO2 nanomaterials
(S4) calcined at 600 oC possess 66.7 m2/g SSA compared to 43 m2/g for pure TiO2.
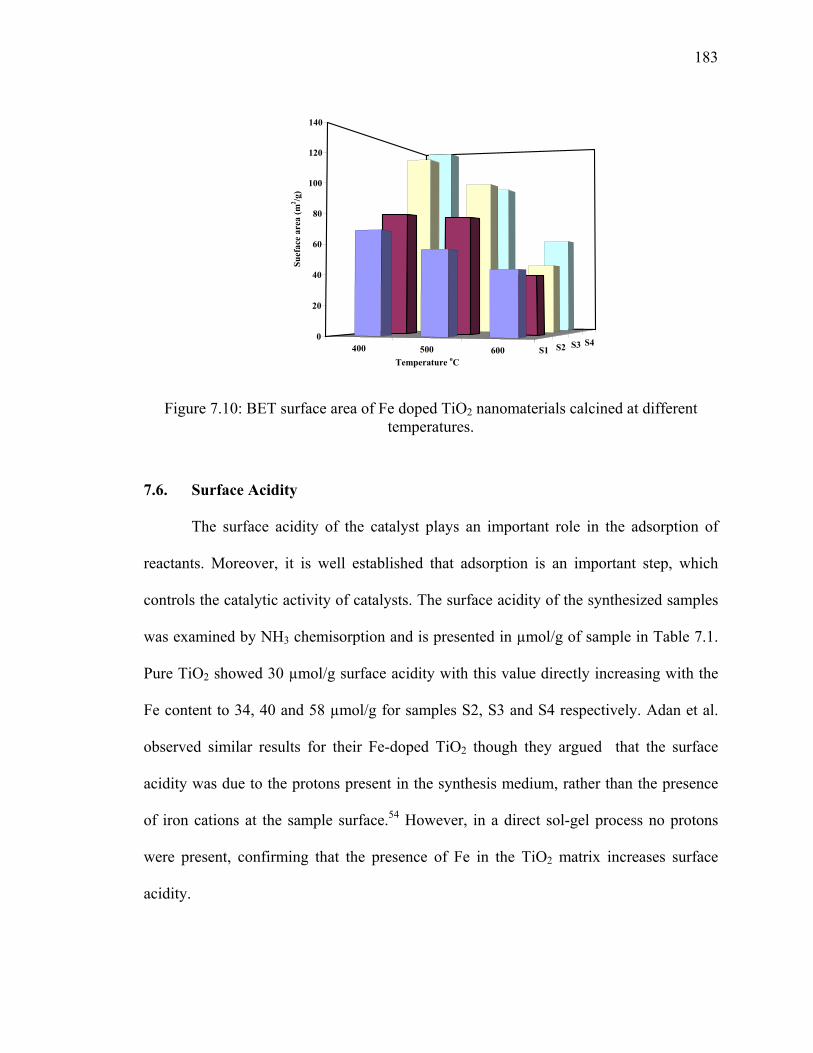
183
400 500 600 S1 S2 S3 S40
20
40
60
80
100
120
140
Suef
ace
area
(m2 /g
)
Temperature oC
Figure 7.10: BET surface area of Fe doped TiO2 nanomaterials calcined at different temperatures.
7.6. Surface Acidity
The surface acidity of the catalyst plays an important role in the adsorption of
reactants. Moreover, it is well established that adsorption is an important step, which
controls the catalytic activity of catalysts. The surface acidity of the synthesized samples
was examined by NH3 chemisorption and is presented in µmol/g of sample in Table 7.1.
Pure TiO2 showed 30 µmol/g surface acidity with this value directly increasing with the
Fe content to 34, 40 and 58 µmol/g for samples S2, S3 and S4 respectively. Adan et al.
observed similar results for their Fe-doped TiO2 though they argued that the surface
acidity was due to the protons present in the synthesis medium, rather than the presence
of iron cations at the sample surface.54 However, in a direct sol-gel process no protons
were present, confirming that the presence of Fe in the TiO2 matrix increases surface
acidity.
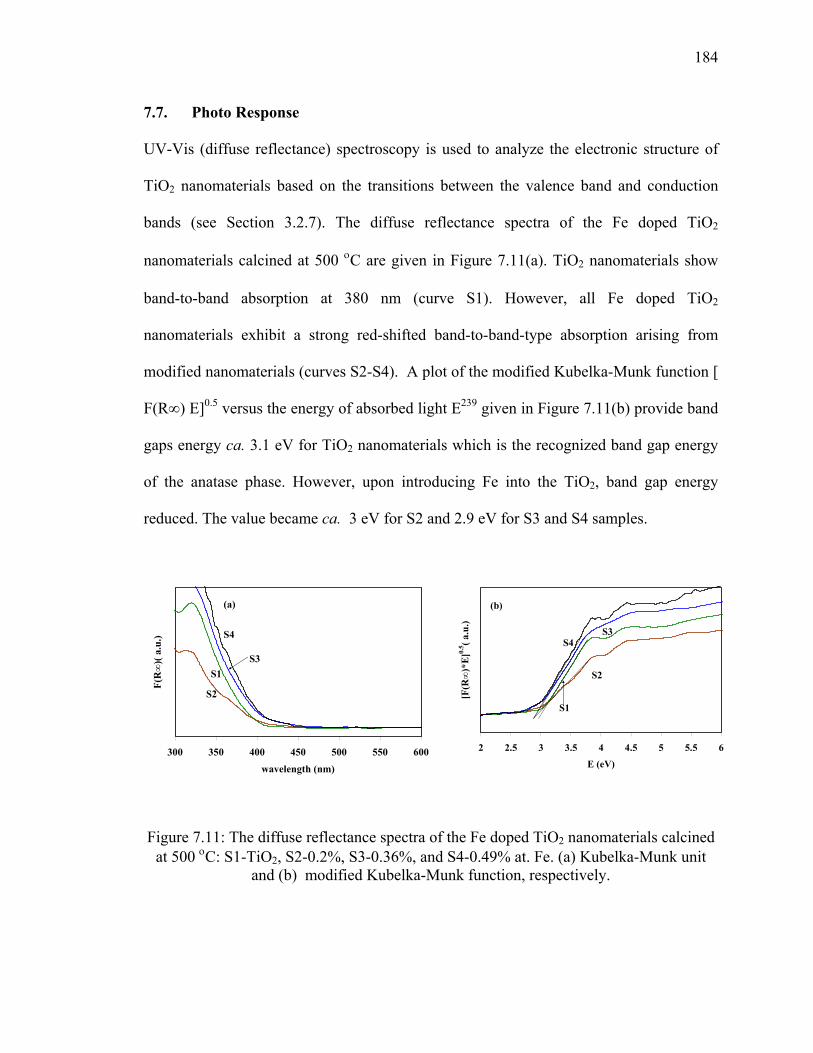
184
7.7. Photo Response
UV-Vis (diffuse reflectance) spectroscopy is used to analyze the electronic structure of
TiO2 nanomaterials based on the transitions between the valence band and conduction
bands (see Section 3.2.7). The diffuse reflectance spectra of the Fe doped TiO2
nanomaterials calcined at 500 οC are given in Figure 7.11(a). TiO2 nanomaterials show
band-to-band absorption at 380 nm (curve S1). However, all Fe doped TiO2
nanomaterials exhibit a strong red-shifted band-to-band-type absorption arising from
modified nanomaterials (curves S2-S4). A plot of the modified Kubelka-Munk function [
F(R∞) E]0.5 versus the energy of absorbed light E239 given in Figure 7.11(b) provide band
gaps energy ca. 3.1 eV for TiO2 nanomaterials which is the recognized band gap energy
of the anatase phase. However, upon introducing Fe into the TiO2, band gap energy
reduced. The value became ca. 3 eV for S2 and 2.9 eV for S3 and S4 samples.
300 350 400 450 500 550 600wavelength (nm)
F(R∞
)( a
.u.)
S1
S2
S3
S4
(a)
2 2.5 3 3.5 4 4.5 5 5.5 6
E (eV)
[F(R∞
)*E
]0.5 ( a
.u.)
S1
S2
S3S4
(b)
Figure 7.11: The diffuse reflectance spectra of the Fe doped TiO2 nanomaterials calcined at 500 οC: S1-TiO2, S2-0.2%, S3-0.36%, and S4-0.49% at. Fe. (a) Kubelka-Munk unit
and (b) modified Kubelka-Munk function, respectively.

185
7.8. Photocatalytic Performance
Photodegradation experiments for all Fe doped samples were performed
according to the method described in chapter 3. In addition, a control photodegradation
experiment was also performed without catalyst, resulting in a negligible decrease in
concentration (below 2%) during the 1-h irradiation period. When the experiment was
carried out with catalyst but in the absence of light irradiation, no change in methylene
blue concentration was observed. Hence, the decrease of concentration is attributed to the
photocatalytic process.
The degradation rate for the different Fe doped TiO2 photocatalysts was
calculated according to eq. 3.13 and is given in Figure 7.12. The degradation rate for pure
TiO2 was 0.086 min-1, with this value was changed with Fe doping. The highest rate was
0.114 min-1 determined for S2 (0.2% Fe ) sample with surface area 79 m2/g, 11.9 nm
crystallites and 34 μmol/g surface acidity. However, the degradation rates decreased with
a further increasing amount of Fe doping. These values were 0.048 and 0.034 min-1 for
S3 (0.36 % Fe, surface area 106 m2/g, 11.6 nm crystallites and 40 μmol/g surface acidity)
and S4 (0.49 at % Fe, surface area 106 m2/g, 10.8 nm crystallites and 58 μmol/g surface
acidity ) samples, respectively.
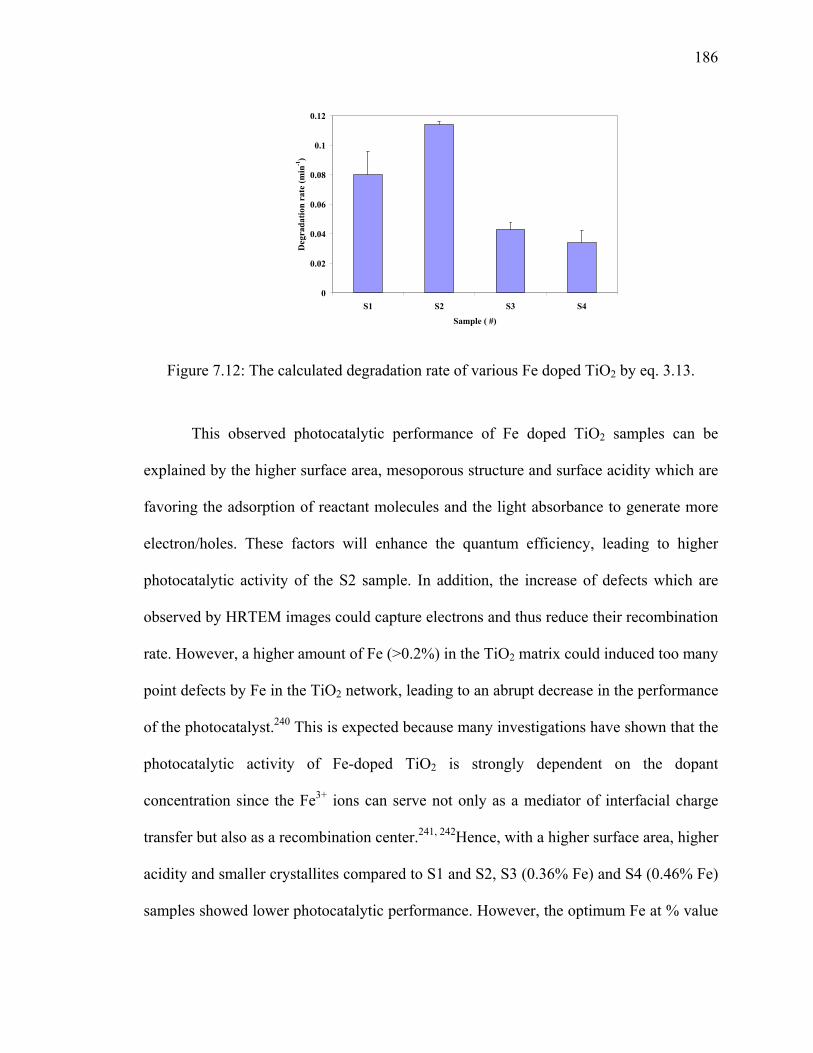
186
0
0.02
0.04
0.06
0.08
0.1
0.12
S1 S2 S3 S4
Sample ( #)
Deg
rada
tion
rate
(min
-1)
Figure 7.12: The calculated degradation rate of various Fe doped TiO2 by eq. 3.13.
This observed photocatalytic performance of Fe doped TiO2 samples can be
explained by the higher surface area, mesoporous structure and surface acidity which are
favoring the adsorption of reactant molecules and the light absorbance to generate more
electron/holes. These factors will enhance the quantum efficiency, leading to higher
photocatalytic activity of the S2 sample. In addition, the increase of defects which are
observed by HRTEM images could capture electrons and thus reduce their recombination
rate. However, a higher amount of Fe (>0.2%) in the TiO2 matrix could induced too many
point defects by Fe in the TiO2 network, leading to an abrupt decrease in the performance
of the photocatalyst.240 This is expected because many investigations have shown that the
photocatalytic activity of Fe-doped TiO2 is strongly dependent on the dopant
concentration since the Fe3+ ions can serve not only as a mediator of interfacial charge
transfer but also as a recombination center.241, 242Hence, with a higher surface area, higher
acidity and smaller crystallites compared to S1 and S2, S3 (0.36% Fe) and S4 (0.46% Fe)
samples showed lower photocatalytic performance. However, the optimum Fe at % value

187
depends on the synthesis method, type of precursor and type of intended application. In
our case, doping lower than 0.2 at % showed the optimum performance.
7.9. Conclusions
Successful synthesis of Fe doped TiO2 nanomaterials by the simple sol-gel
process in scCO2 demonstrated that this is a promising technique for synthesizing cation
doped TiO2 nanostructures. Fe doping alters the morphology of the product. Moreover,
Fe doping was favorable for organizing a more mesoporous structure and maintaining the
pore structure at higher temperatures. It suggests that proper Fe doping to the framework
may become an effective way to improve the properties of mesoporous TiO2 materials. A
small amount of Fe doping samples showed better performance; hence, these materials
can be used as a photocatalyst for the degradatrion of organic compounds to prevent
environmental pollution.
188
CHAPTER 8
Zr MODIFIED N DOPED TiO2 NANOSTRUCTURED MATERIALS
8. Introduction
TiO2 nanomaterial is a potential candidate for solar applications due to it’s unique
optoelectronic and photochemical properties and being a low cost material, favorable for
potential large scale commercial applications. However, pure anatase TiO2 activates at λ<
380 nm of UV light, which leaves approximately 95% of the available solar energy
unused, which is considered a limitation in the practical utilization of solar energy. In the
technical literature, numerous studies have focused on shifting TiO2’s band gap to the
visible spectral region, that would allow efficient utilization of solar energy and, hence,
greatly expand its application. Bulk modification by N-doping is one of the well-known
methods to enhance the performance of TiO2 nanomaterials by shifting absorption to the
visible range.16, 19, 20, 22 However, along with the light absorption, the performance of
TiO2 nanomaterials strongly relies on their crystallinity, crystallite size, crystal structure,
specific surface area, and thermal stability. It was previously discussed in chapter 4 that
Zr doping increased the surface area, thermal stability and reduced the crystal size of
TiO2 nanomaterials. Moreover, Wang et. al investigated the role of the potential promoter
ZrO2 in enhancing activity of TiO2-xNx for the oxidation of gaseous organic compounds.62
The nitrogen-doped photocatalysts were synthesized by reacting amorphous metal oxide
xerogels via a sol-gel process with an ammonia solution, followed by calcining the
products. They reported that ZrO2 helped to preserve the surface area and prevent grain
189
growth resulting in higher activity. Therefore, simultaneous Zr and N doping would help
to enhance the performance of TiO2 nanomaterials.
Conventionally, large scale multicomponent metal oxides with molecular level
homogeneity can be synthesized via a sol-gel process at low cost.96 Moreover, the sol-gel
process is the most promising method for synthesizing N-doped TiO2 as discussed in
section 2.3.8. However, the conventional sol-gel process requires organic solvents and
due to environmental regulations and increased environmental concern, the use of volatile
organic compounds (VOCs) is becoming increasingly restricted. Consequently, alternate
environmentally friendly solvents and/or processes are a better choice for synthesizing N-
doped TiO2 nanomaterials. Moreover, with low viscosity, “zero” surface tension and high
diffusivity, scCO2 is considered as a favorable solvent for synthesizing superior
nanomaterials. Therefore, this chapter focuses on the effects of simultaneous N and Zr
doping on the morphology, crystal structure, crystal size, surface area, pore volume and
pore size distribution, and the band gap energy of the nanomaterials synthesized by a
direct sol-gel process in scCO2.
8.1. Experimental
Zr modified N doped TiO2 nanomaterials were synthesized at 60 oC and 5000 psig
following the standard procedure previously discussed in chapter 3 using the appropriate
amount of TIP, ZPO and TEA. In a typical experiment, 6.6 mmol TIP, 0.4 mmol ZPO, 35
mmol acetic acid and the appropriate amount of TEA were quickly placed in a 10 mL
view cell at 60°C under stirring. CO2 was added to make the synthesis pressure 5000

190
psig. Initially, a transparent homogeneous phase pale yellow to brown depending on
TEA/TIP ratio was observed. After the reaction mixture was stirred about 30 minutes to
Figure 8.1. Effect of 1:1 Triethyleamine/ TIP with Acetic acid at R5, (A)TIP+HOAc formed yellow colour solution , (B) TIP+HOAc+ TEA formed brown solution, (C)
TIP+HOAc+TEA+H2O formed gel.
several hours, the fluids in the view cell became semitransparent then turned white,
indicating a phase change and gel formed. However, gel never formed when using
TEA/Ti ratios higher than 0.8 shows this Figure 8.1 where (A) TIP+HOAc formed a
yellow colored solution. This solution turns into gel within 30 minutes. However, after
introducing 1:1 ratio TEA into the system, it formed a brown solution and never formed
gel (B). Water was added to break the stability to form gel(C). This observation is
consistent with the recent patent filed by Yasutaka et al. for synthesizing stable titanium
alkoxide (iso-propoxide) by TEA using a 0.5 to 2 TEA/Ti ratio.243 After 5 days of aging,
a few droplets were vented and placed in a test tube, followed by addition of water. When
a higher amount of TEA was used, white precipitate formed indicating incomplete
polymerization. However, to maintain consistency, after 5 days of aging, the
A B C
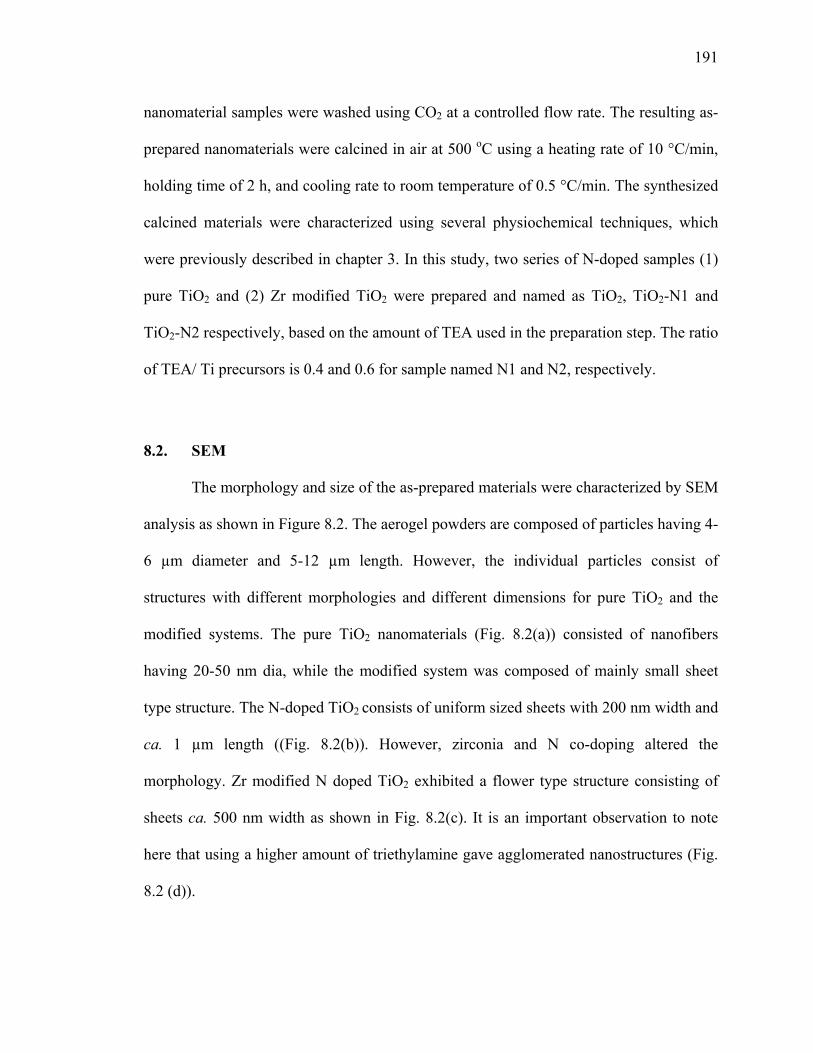
191
nanomaterial samples were washed using CO2 at a controlled flow rate. The resulting as-
prepared nanomaterials were calcined in air at 500 oC using a heating rate of 10 °C/min,
holding time of 2 h, and cooling rate to room temperature of 0.5 °C/min. The synthesized
calcined materials were characterized using several physiochemical techniques, which
were previously described in chapter 3. In this study, two series of N-doped samples (1)
pure TiO2 and (2) Zr modified TiO2 were prepared and named as TiO2, TiO2-N1 and
TiO2-N2 respectively, based on the amount of TEA used in the preparation step. The ratio
of TEA/ Ti precursors is 0.4 and 0.6 for sample named N1 and N2, respectively.
8.2. SEM
The morphology and size of the as-prepared materials were characterized by SEM
analysis as shown in Figure 8.2. The aerogel powders are composed of particles having 4-
6 µm diameter and 5-12 µm length. However, the individual particles consist of
structures with different morphologies and different dimensions for pure TiO2 and the
modified systems. The pure TiO2 nanomaterials (Fig. 8.2(a)) consisted of nanofibers
having 20-50 nm dia, while the modified system was composed of mainly small sheet
type structure. The N-doped TiO2 consists of uniform sized sheets with 200 nm width and
ca. 1 µm length ((Fig. 8.2(b)). However, zirconia and N co-doping altered the
morphology. Zr modified N doped TiO2 exhibited a flower type structure consisting of
sheets ca. 500 nm width as shown in Fig. 8.2(c). It is an important observation to note
here that using a higher amount of triethylamine gave agglomerated nanostructures (Fig.
8.2 (d)).

192
Figure 8.2: SEM: (a) TiO2, (b) TiO2-N1, (c) Zr-TiO2-N1, and (d) Zr-TiO2-N2. (Bar represents 500 nm. All the samples were examined after platinum coating).
TEM analysis was performed to obtain more detailed information about the
calcined materials, such as crystal size and porosity with the images given in Figure 8.3.
It can be seen that calcined pure TiO2 are fibers with 30 nm diameters whereas all N-
doped samples are sheets with 100-300 nm width. The TEM images also confirmed that
the doping agent had a significant effect on the crystal size and porosity of the calcined
nanomaterials. The measured crystal size for all systems was ca. 10-15 nm though the
shapes of the crystallites are different. Pure TiO2 formed nice cubic crystals whereas in
the modified system, poor crystallinity was observed. It is known that the Zr and N
present in the samples retards the reorganization for forming ordered crystal structures,
resulting in poor crystallinity for the modified systems. The TEM images also reveal that
the N-doped materials were more porous. Moreover, along with the SEM results, the
TEM images also confirm that the materials were very solid (less porous) when a higher
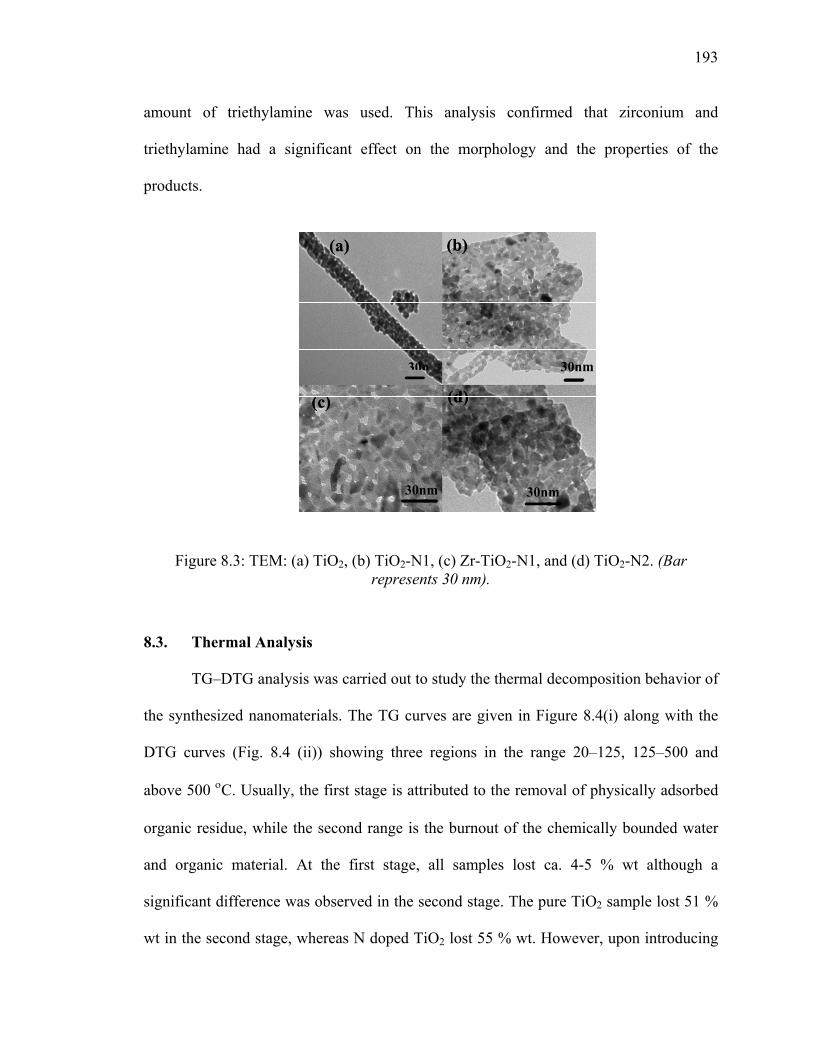
193
amount of triethylamine was used. This analysis confirmed that zirconium and
triethylamine had a significant effect on the morphology and the properties of the
products.
Figure 8.3: TEM: (a) TiO2, (b) TiO2-N1, (c) Zr-TiO2-N1, and (d) TiO2-N2. (Bar represents 30 nm).
8.3. Thermal Analysis
TG–DTG analysis was carried out to study the thermal decomposition behavior of
the synthesized nanomaterials. The TG curves are given in Figure 8.4(i) along with the
DTG curves (Fig. 8.4 (ii)) showing three regions in the range 20–125, 125–500 and
above 500 οC. Usually, the first stage is attributed to the removal of physically adsorbed
organic residue, while the second range is the burnout of the chemically bounded water
and organic material. At the first stage, all samples lost ca. 4-5 % wt although a
significant difference was observed in the second stage. The pure TiO2 sample lost 51 %
wt in the second stage, whereas N doped TiO2 lost 55 % wt. However, upon introducing
30n 30nm
30nm 30nm
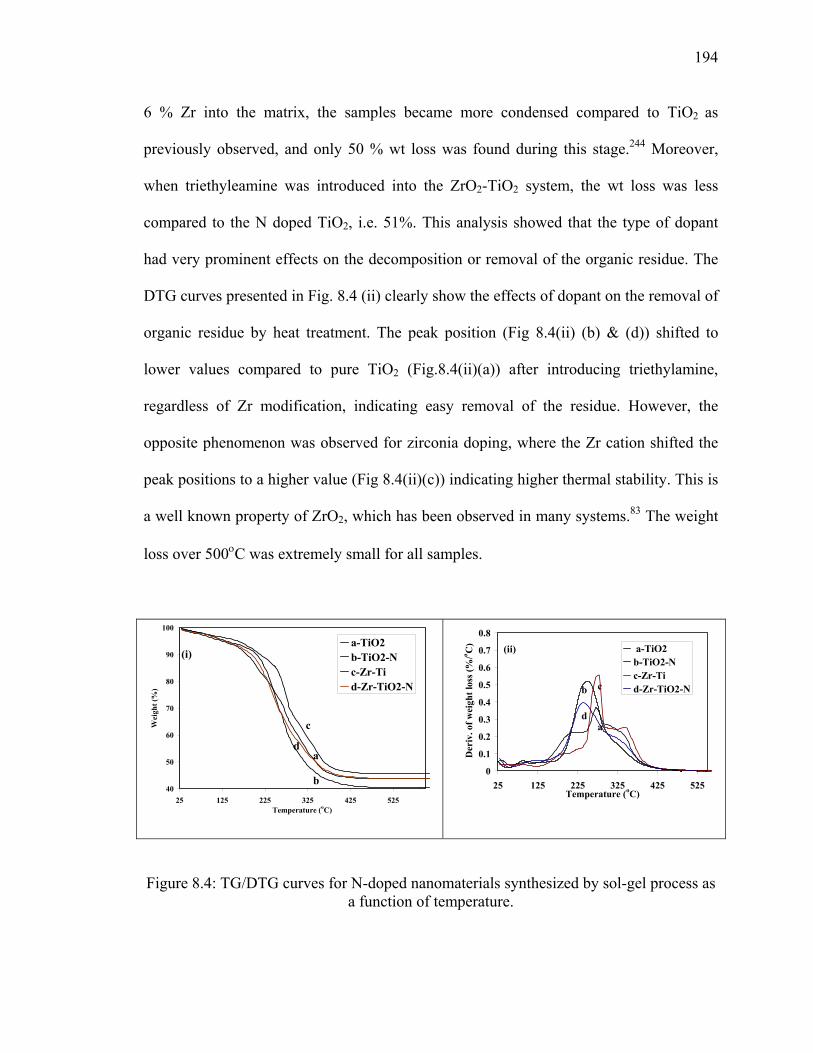
194
6 % Zr into the matrix, the samples became more condensed compared to TiO2 as
previously observed, and only 50 % wt loss was found during this stage.244 Moreover,
when triethyleamine was introduced into the ZrO2-TiO2 system, the wt loss was less
compared to the N doped TiO2, i.e. 51%. This analysis showed that the type of dopant
had very prominent effects on the decomposition or removal of the organic residue. The
DTG curves presented in Fig. 8.4 (ii) clearly show the effects of dopant on the removal of
organic residue by heat treatment. The peak position (Fig 8.4(ii) (b) & (d)) shifted to
lower values compared to pure TiO2 (Fig.8.4(ii)(a)) after introducing triethylamine,
regardless of Zr modification, indicating easy removal of the residue. However, the
opposite phenomenon was observed for zirconia doping, where the Zr cation shifted the
peak positions to a higher value (Fig 8.4(ii)(c)) indicating higher thermal stability. This is
a well known property of ZrO2, which has been observed in many systems.83 The weight
loss over 500οC was extremely small for all samples.
40
50
60
70
80
90
100
25 125 225 325 425 525Temperature (oC)
Wei
ght (
%)
a-TiO2b-TiO2-Nc-Zr-Tid-Zr-TiO2-N
d
b
c
a
(i)
0
0.1
0.2
0.3
0.4
0.5
0.6
0.7
0.8
25 125 225 325 425 525Temperature (oC)
Der
iv. o
f wei
ght l
oss (
%/o C
) a-TiO2b-TiO2-Nc-Zr-Tid-Zr-TiO2-N
a
b c
d
(ii)
Figure 8.4: TG/DTG curves for N-doped nanomaterials synthesized by sol-gel process as a function of temperature.

195
Table 8.1: Surface area, pore volume, pore diameter, and crystallites size for calcined undoped and doped nanomaterials.
Sample Surface area(m2/g)
Pore V. (cm3/g)
Pore dia.(nm)
Crystal size(nm)±1nm
Crystal structure
TiO2 56 0.26 18.90 13.75 A TiO2-N1 78 0.31 13.65 12.86 A TiO2-N2 65 0.19 11.96 8.72 A Zr-TiO2 81 0.27 13.67 12.31 A Zr-TiO2-N1 94 0.25 10.26 11.13 A Zr-TiO2-N2 72 0.33 18.39 6.17 A
8.4. XRD Analysis
The crystal structure and crystallite size of the nanomaterials calcined at 500 oC
were examined by XRD, with the spectra given in Figure 8.5. This figure shows that all
modified calcined nanomaterials consist of anatase crystal, although the peak intensity as
well as the FWHM strongly depends on the type and amount of dopant. The pure TiO2
showed a very small rutile phase (4% wt) at this temperature, whereas no distinct ZrO2 or
TiN peak is evident, indicating no phase separation, and the dopant was contained in the
anatase crystal structure for this composition. However, the crystallite size decreased
with the amount of doping introduced into the system. All the crystallite sizes were
calculated using Scherer’s equation and are given in Table 8.1. It can be seen that the
crystal size for pure TiO2 calcined at 500°C was ca. 13.75 nm, whereas nitrogen doped
TiO2 had 12.86 nm crystallites. A higher amount of triethylamine further reduced the
crystallite sizes. The Zr modified nanomaterials had smaller crystallites compared to the
unmodified samples, regardless of the amount of triethylamine used. Moreover,
triethylamine reduced the crystallinity of the modified samples compared to unmodified

196
samples. It was previously mentioned that the dopant prevents rearrangement of atoms to
form crystal, hence lowering crystallinity and giving smaller size crystallites for the
doped samples.
20 25 30 35 40 45 50 55 602- Theta (Degrees)
a
bcde
fA
AA A AR
Figure 8.5: Powder XRD spectra of the Zr modified N doped TiO2 nanomaterials calcined at 500οC: (a) TiO2, (b) TiO2-N1, (c) TiO2-N2, (d) Zr-TiO2, (e) Zr-TiO2-N1, and
(f) Zr-TiO2-N2.
8.5. Raman
To further verify these results, Raman analysis was performed on all the N doped
samples. The spectra for the samples calcined at 500°C show Raman peaks at 142, 395,
517 and 639 cm-1 that can be assigned to the Eg, B1g, B1g /A1g, Eg, modes of the anatase of
titania respectively, which agrees with published values.219 However, the most intense
anatase peak at ≈142 cm-1 showed significant differences amongst the different samples
(Fig. 8.6). The Raman peaks usually display smaller linewidths (FWHM) for larger
crystallites due to an increase in the correlation length of the vibrations, with increasing
intensity indicating greater concentrations of anatase phase.220 The FWHM of the
anatase peak were ca. 11 cm-1 for both the Ti and Zr-Ti systems modified with a lower
amount of triethylamine. However, this value increased to ca. 15 cm-1 for samples

197
prepared using a higher amount of triethyleamine. More importantly, the Raman peak
intensity reduced to half compared to the previous system, indicating low crystallinity.
Moreover, the peaks shifted to higher frequencies, also confirming smaller crystallite
sizes were formed.245
120 125 130 135 140 145 150 155 160Raman shift (cm-1)
Inte
nsity
(a.u
)
Zr-Ti-N1Ti-N1Zr-Ti-N2Ti-N2
Figure 8.6: Raman spectra around 142 cm-1 for Zr modified N doped TiO2 nanomaterials calcined at 500 οC.
8.6. HRTEM Analysis
To explore the crystal structure in more detail, HRTEM analysis for both the pure
TiO2 and the modified samples calcined at 500 oC were performed. The HRTEM
micrographs for the pure TiO2 in Fig.8.7 (a) demonstrate long grains having the anstase
crystal phase with a d-spacing 0.35 nm. This d-spacing value is assigned to the lattice
spacing of the (101) planes of the anatase phase. Upon introducing dopant into the TiO2
matrix, the crystallites became smaller as was previously observed from the XRD

198
analysis. However, the HRTEM analysis further reveals that the N doped systems
(Fig.8.7 (b-d)) have many defects (grain boundary, lattice mismatch, screw dislocation),
which may be due to the presence of alkylamine in the synthesis process. Alkylamines
can be selectively adsorbed on certain crystal facets of metal oxides, or form amine
complexes with metal alkoxides, thus leading to orientated growth or aggregation of the
metal oxide particles.27, 246
Figure 8.7: HRTEM for N-doped TiO2 nanomaterials: (a) TiO2, (b) TiO2-N1, (c) Zr-TiO2-N1, and (d) TiO2-N2. (Bar represent 5 nm. Arrows indicate defects).
(b)
Screw dislocation
Grain boundary

199
8.7. XPS Analysis
Figure 8.8 shows a typical XPS spectrum for the Zr modified N doped TiO2
nanomaterials synthesized by the sol–gel process in scCO2. XPS peaks show that the Zr-
TiO2-N powder contains Ti, Zr, O, N, and C elements. The presence of carbon is ascribed
to the residual carbon from the precursor solution, and any adventitious hydrocarbon
from the XPS instrument itself. This XPS data reveals that the Zr and N elements are
incorporated into the TiO2 crystal lattice, or were adsorbed onto the surface of the
crystals. For further analysis of the chemical structure of the investigated TiO2 samples,
five areas of the XPS spectrum: for the Ti 2p around 460 eV, the Zr 3d around 183 eV,
the N 1s around 400 eV, the O 1s around 530 eV and the C 1s around 286 eV region were
examined. When scanning the Ti 2p and Zr 3d XPS regions, significant differences are
observed at the binding energies between the pure TiO2 and the modified system.
According to Gilindo et al., TiO2 Ti 2p3/2 and ZrO2 Zr 3d5/2 showed peaks at the binding
energies 458.8 eV and 183 eV, respectively. 186 Previously in chapter 4, it was discussed
that introducing a second metal ion into the lattice shifts the binding energy. This XPS
analysis revealed that regardless of Zr modification, the binding energy for Ti 2p3/2
shifted to lower values compared to pure TiO2. The small shift of binding energy of the
Ti 2p3/2 peak is attributed to the change of the valence state of Ti4+. Considering the
binding energy of zirconia Zr 3d5/2, which shows a lower value compared to pure
zirconia, i.e. 182.70±0.02. The O 1s XPS spectra also shows significant changes upon N
incorporation, with the peak shifted to a lower binding energy than the pure oxygen peak
in TiO2. The binding energy for O in TiO2 is 530 eV, whereas is 529.92 eV for N doped
TiO2. The most interesting changes occur around the C 1s peak, and the resolved C peak

200
(given in appendix 7) shows that three different types of carbon containing groups are
present around 288, 286, and 284 eV, representing the O-C=O, C-N and C-C & C-H
groups, respectively. However, only two instead of three carbon groups such as O-C=O
and C-C & C-H were present in the pure TiO2 system. This additional carbon peak
indicates that the amine group is directly absorbed onto the surface of the materials,
forming metal complexes. It is well known that with two nonbonding electron, nitrogen
acts as a Lewis base and forms complexes with electrophilic metal ions.99
The analysis of the binding energy of N 1s for the N-doped materials showed that
two types of N are present in the as-prepared nanomaterials. An intense peak centered at
401.8 and a small peak centered at 401.8 and 399.9 eV, assigned for chemisorbed and
interstitial N, respectively.247-249 However, the binding energies are greater than the
typical binding energy of 397.2 eV in TiN.250 This higher energy shift can be attributed to
the 1s electron binding energy of the N atom in the environment of O-Ti-N. When
nitrogen substitutes for the oxygen in the initial O-Ti-O structure, the electron density
around N is reduced, compared to that in a TiN crystal, because of the O atom bonded to
the Ti atom. 247 After heat treatment, there is only one peak which is centered at 400 eV.
Recently, most of the studies regarding the N doped TiO2 systems have performed XPS
analysis to investigate the chemical state of N. Chen and Burda found that the signal at
401.3 eV in the synthesized nanoparticles is attributed to O–Ti–N, based on the redox
chemistry involved.247 In another study, Yang et al. reported a binding energy of 400.1
eV which was assigned to hyponitrite at the surface.248 Thus, the nitrogen state in the
doped TiO2 may vary from case to case. However, very recently Huo et al. reported a
peak at 399.6 eV, ascribed to the N species incorporation into the titania matrix.246

201
Keeping all this in mind, it can be concluded that all N species during calcination were
incorporated into the TiO2 matrix, and the resultant nanomaterials were described as Zr
and N codoped TiO2.
Figure 8.8: Typical XPS spectrum for Zr modified N doped TiO2 as-prepared nanomaterials.
The calculated surface N to metal ratio of synthesized nanomaterials provided in
Table 8.2. shows that surface N to (Ti +Zr) at. ratio depends on the system and heat
treatment. When 0.4 at. ratio triethylamine was used, both as-prepared systems possessed
the value ca. 0.16; after heat treatment, this value became ca. 0.012. However, when a
higher amount of TEA was used, the surface N concentration was 0.08± 0.03 for TiO2
nanomaterials. This anomalous behavior might be attributed to the isoelectric point of Ti
(3.9-8 most of the case ca.5.5).251 Due to the low isoelectric surface positive charge of
pure TiO2, when using higher amounts of TEA,251 the TEA absorption is decreased as

202
shown in Table 8.2. Hence, the % of chemisorbed N (peak position 401 eV) was reduced
with an increasing amount of TEA. Moreover, the experimental evidence provided in
Figure 8.1 supports this hypothesis.
Table 8.2: Surface N composition of as-prepared and calcined nanomaterials with N peak positions.
Sample As-prepared Calcined N/(Ti+Zr) at.
N 1s Pos.
Peak area
N 1s Pos.
Peak Area
N/(Ti+Zr) at.
N 1s Pos.
Peak area
TiO2-N1 0.16±.01 401.8 97 399.9 7 0.014 398.8 100 TiO2-N2 0.08±.03 401.9 73 400.0 27 0.004 398.3 100 Zr-TiO2-N1 0.16 401.8 88 399.7 12 0.012 398.8 100
8.8. BET Analysis
The surface area and pore volume of the calcined materials were characterized by
nitrogen adsorption studies, which were summarized in Table 8.1. Figure 8.8 shows a
typical nitrogen adsorption isotherm for calcined TiO2, which exhibits an H3 hysteresis
loop, typical for mesoporous materials.160 The pore volume for all samples did not follow
any clear trend. For example, pure TiO2 possessed a 0.26 cm3/g pore volume while lower
amounts of triethylamine increased the pore volume to 0.31 cm3/g. However, doubling
the amount of triethyamine decreased the pore volume significantly. Interestingly, the
zirconia modified samples showed the opposite trend. A small amount of nitrogen
precursor (0.4 N/Ti) reduced the pore volume to 0.25 cm3/g whereas a higher amount (0.6
N/Ti) increased the pore volume to 0.33 cm3/g. The average pore diameter was ca. 10 nm
except for the pure TiO2 and Zr-TiO2-N2 samples, which showed average pore diameters
ca. 18 nm. The typical pore size distribution is inset in Fig 8.9 which shows that most
pores are bigger than 20 nm, whereas a small number of ca. 4 nm dia pores are present in
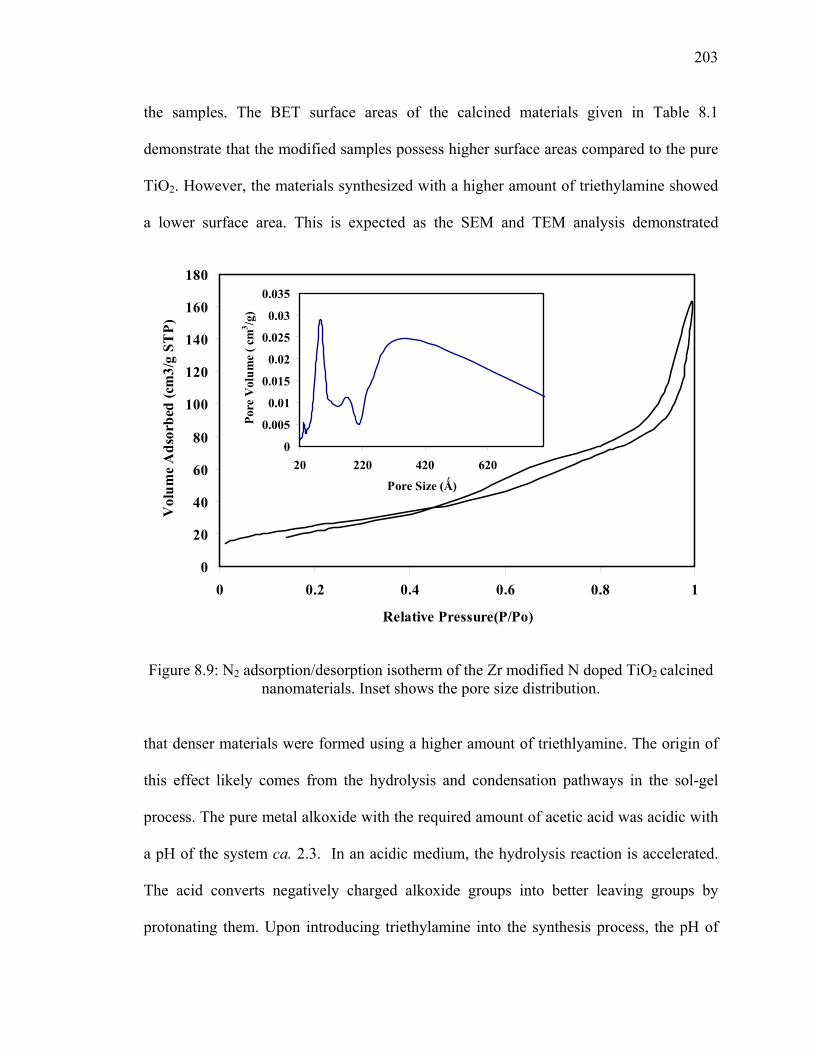
203
the samples. The BET surface areas of the calcined materials given in Table 8.1
demonstrate that the modified samples possess higher surface areas compared to the pure
TiO2. However, the materials synthesized with a higher amount of triethylamine showed
a lower surface area. This is expected as the SEM and TEM analysis demonstrated
Figure 8.9: N2 adsorption/desorption isotherm of the Zr modified N doped TiO2 calcined nanomaterials. Inset shows the pore size distribution.
that denser materials were formed using a higher amount of triethlyamine. The origin of
this effect likely comes from the hydrolysis and condensation pathways in the sol-gel
process. The pure metal alkoxide with the required amount of acetic acid was acidic with
a pH of the system ca. 2.3. In an acidic medium, the hydrolysis reaction is accelerated.
The acid converts negatively charged alkoxide groups into better leaving groups by
protonating them. Upon introducing triethylamine into the synthesis process, the pH of
0
20
40
60
80
100
120
140
160
180
0 0.2 0.4 0.6 0.8 1
Relative Pressure(P/Po)
Vol
ume
Ads
orbe
d (c
m3/
g ST
P)
0
0.005
0.01
0.015
0.02
0.025
0.03
0.035
20 220 420 620
Pore Size (Ǻ)
Por
e V
olum
e ( c
m3 /g
)

204
the solution increases. Hence, the hydrolysis rate is decelerated and the condensation
kinetics is accelerated upon increasing the pH of the solution. According to Livage et al.
the sites A-D in a partially hydrolyzed metal oxo- polymer (Figure 8.10) have different
charge distributions. Based on the values of δ(M) calculated from the partial charge
model for sites A-D for a typical partially hydrolyzed polymer (where M= Ti, Zr given in
Table 8.2), the reactivity towards nucleophilic attack should decreases as C» B≈A> D.
The condensation is then directed towards the middle, instead of the ends of the chain.
Moreover, triethylamine with a lone pair of electrons acts as a basic catalyst. Hence, in
higher pH or higher amounts of triethylamine, more compact materials are produced.
Figure 8.10: A typical partially hydrolyzed metal oxo-polymer.
Table 8.3: Charge distribution according to the partial charge model.
Site δ(Ti) δ(Zr) A +0.68 +0.71 B +0.69 +0.72 C +0.75 +0.77 D +0.67 +0.69
8.9. Photocatalytic Performance
Photodegradation experiments for Zr modified N doped TiO2 samples were
performed according to the method described in chapter 3. In addition, photodegradation
experiments were also performed without catalyst, resulting in a negligible decrease in
concentration (below 2%) during the 1-h irradiation period. Complete decolorization was
OR OR O OR HO—M—O-- ••• --O—M—O-- •••--O—M—O-- •••--O—M—OR OR OR OR OR (A) (B) (C) (D)
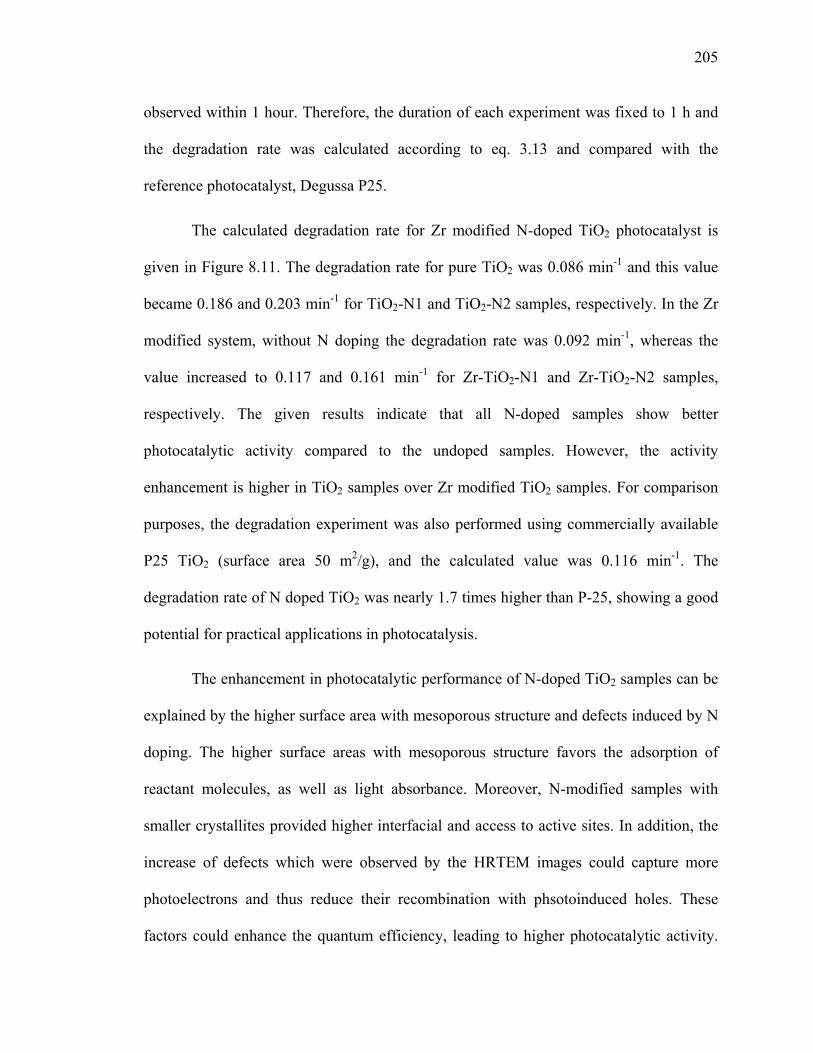
205
observed within 1 hour. Therefore, the duration of each experiment was fixed to 1 h and
the degradation rate was calculated according to eq. 3.13 and compared with the
reference photocatalyst, Degussa P25.
The calculated degradation rate for Zr modified N-doped TiO2 photocatalyst is
given in Figure 8.11. The degradation rate for pure TiO2 was 0.086 min-1 and this value
became 0.186 and 0.203 min-1 for TiO2-N1 and TiO2-N2 samples, respectively. In the Zr
modified system, without N doping the degradation rate was 0.092 min-1, whereas the
value increased to 0.117 and 0.161 min-1 for Zr-TiO2-N1 and Zr-TiO2-N2 samples,
respectively. The given results indicate that all N-doped samples show better
photocatalytic activity compared to the undoped samples. However, the activity
enhancement is higher in TiO2 samples over Zr modified TiO2 samples. For comparison
purposes, the degradation experiment was also performed using commercially available
P25 TiO2 (surface area 50 m2/g), and the calculated value was 0.116 min-1. The
degradation rate of N doped TiO2 was nearly 1.7 times higher than P-25, showing a good
potential for practical applications in photocatalysis.
The enhancement in photocatalytic performance of N-doped TiO2 samples can be
explained by the higher surface area with mesoporous structure and defects induced by N
doping. The higher surface areas with mesoporous structure favors the adsorption of
reactant molecules, as well as light absorbance. Moreover, N-modified samples with
smaller crystallites provided higher interfacial and access to active sites. In addition, the
increase of defects which were observed by the HRTEM images could capture more
photoelectrons and thus reduce their recombination with phsotoinduced holes. These
factors could enhance the quantum efficiency, leading to higher photocatalytic activity.
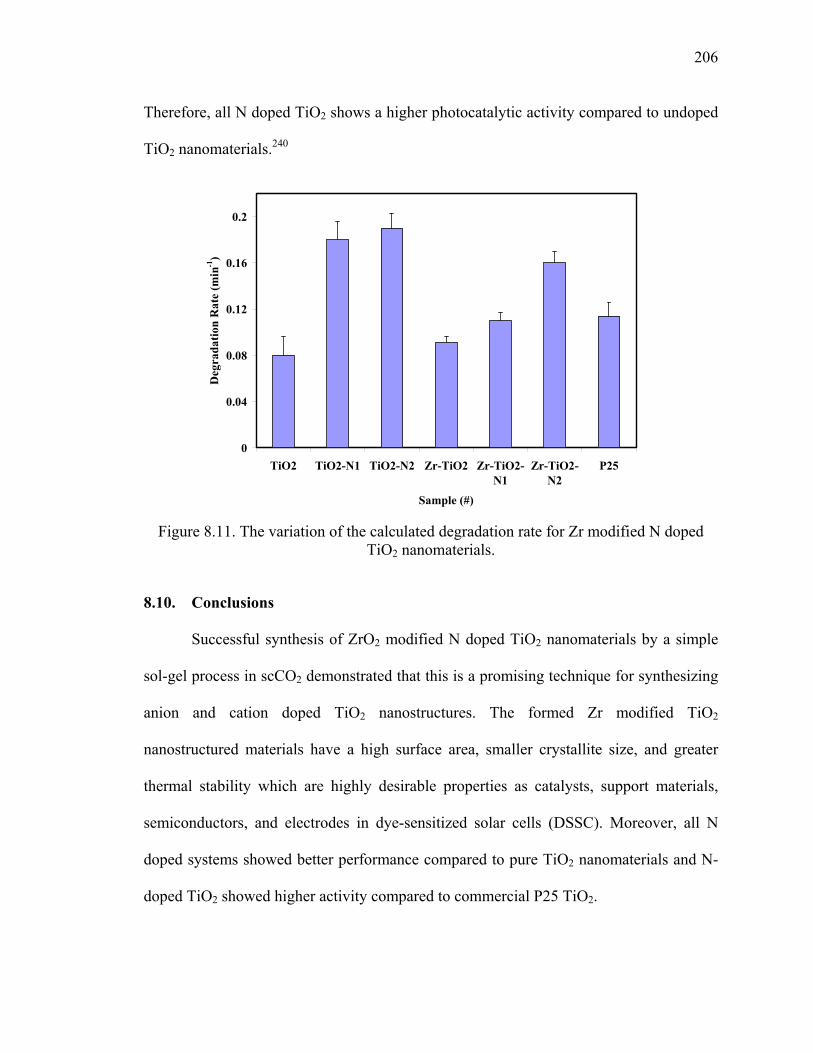
206
Therefore, all N doped TiO2 shows a higher photocatalytic activity compared to undoped
TiO2 nanomaterials.240
0
0.04
0.08
0.12
0.16
0.2
TiO2 TiO2-N1 TiO2-N2 Zr-TiO2 Zr-TiO2-N1
Zr-TiO2-N2
P25
Sample (#)
Deg
rada
tion
Rat
e (m
in-1
)
Figure 8.11. The variation of the calculated degradation rate for Zr modified N doped
TiO2 nanomaterials.
8.10. Conclusions
Successful synthesis of ZrO2 modified N doped TiO2 nanomaterials by a simple
sol-gel process in scCO2 demonstrated that this is a promising technique for synthesizing
anion and cation doped TiO2 nanostructures. The formed Zr modified TiO2
nanostructured materials have a high surface area, smaller crystallite size, and greater
thermal stability which are highly desirable properties as catalysts, support materials,
semiconductors, and electrodes in dye-sensitized solar cells (DSSC). Moreover, all N
doped systems showed better performance compared to pure TiO2 nanomaterials and N-
doped TiO2 showed higher activity compared to commercial P25 TiO2.

207
CHAPTER 9
CONCLUSIONS AND RECOMMENDATIONS
9. Introduction
This dissertation presents a simple synthesis route to produce TiO2-based
nanostructured materials by doping with Fe, Zr and N in scCO2. In order to synthesize the
nanomaterials, the direct sol-gel process in CO2 was carried out in either a 10 or 25 ml
view cell. The starting materials were mixed in the view cell and CO2 was added using a
syringe pump. The system was maintained at a constant temperature and pressure until
the nanomaterials were formed. After 5 days aging, the formed gel was washed
continuously using scCO2 at a controlled flow rate of 0.5 mL/min, followed by controlled
venting. In order to crystallize the amorphous nanomaterials, the synthesized as-prepared
materials were calcined at 500 °C. The nanomaterials were characterized by using
electron microscopy, FTIR, thermal analysis, XRD, N2 physisorption, UV-Vis, and TPD.
Finally the materials were evaluated as a photocatalyst for degradation of methylene blue.
The main conclusions of the present study are given in the following sections.
9.1. Direct Sol-Gel Process in scCO2
The successful synthesis of TiO2-based nanostructures by doping with Fe, Zr and
N by following the direct sol-gel procedure in CO2 shows that it is a promising technique
for synthesizing multicomponent oxide nanostructured materials. This process has several
advantages over conventional sol-gel processes including: (1) producing well-defined
nanostructure, e.g nanosheets, nanotubes, and nanorods, (2) very good dispersion, e.g.
208
10% ZrO2-TiO2 nanotubes theoretical composition was matched with the experimental
composition ±0.01%. (2) high conversions, e.g. about 98 % conversion.; (3) high yield,
ca. 6 g of ZrO2-TiO2 binary nanotubes were synthesized in a 25 mL view cell; (4) high
surface areas; (5) simple operating procedure, e.g. one-pot synthesis; (6) mild operating
conditions, e.g. 60 oC and 5000 psig; and (7) environmental benignness.
CO2 was found to be a superior solvent for the sol-gel process. A low dielectric
constant as well as low solubility accelerated the gelation process, reduced the desolution
repolymerization resulting in high surface areas, and smaller crystallite materials. In
addition, scCO2 exhibits a low interfacial tension which allows CO2 to penetrate into the
gel network helping to form the well-defined nanostructures. Moreover, pressure had
beneficiary effects to produce new materials. Furthermore, extraction and drying in
scCO2 produced ultrafine aerogel having high surface areas.
9.2. The Synthesis Parameters of the Direct Sol-Gel Process in CO2
The temperature, pressure, concentrations of the reactants, acid to metal alkoxide
ratio, doping amount and type of dopant, are very important parameters which
significantly alter the morphology, and surface area of the synthesized nanostructure
aerogels. For binary nanotubes, very low and high temperatures produced nanorods
instead of tubes. Different acid ratios also had significant effects on the morphologies as
well as the surface areas, with higher concentrations of starting materials resulting in the
formation of nanotubes, whereas low concentrations resulted in the formation of sheets.
Regardless of the type of doping, an increasing amount of doping increased the surface
209
area. Surprisingly, a small amount of N-doping increased the surface area whereas a large
amount of triethylamine did not increase the surface area significantly.
9.3. Mechanism of Nanostructure Formation
The mechanism of the TiO2–based nanostructure especially Ti-Zr nanotube
formation in scCO2 can be explained as a spontaneous growth process. The nanostructure
formation is mainly attributed to hexamer formation. Zr introduced into the hexamer
structure was quite different from the pure TiO2 hexamer, and the Zr with different
coordination number acts as an impurity in the structure. Due to the presence of Zr or
other impurities in the hexamer (or chemisorbed), this helps the preferential condensation
in one direction. Hence, it is believed that a long sheet-type structure along the [100]
plane was developed in the synthesis process. One can envision that as the sheet structure
grows, at a certain stage in order to lower the energy of the system, it either rolls-up or
folds along the [010] or [001] plane to form the tubular structure.
9.4. Chemistry of the Direct Sol-gel Process in CO2
Although the chemistry of the direct sol-gel process for binary TiO2 and ZrO2
system or 1% Fe(NO)3 stock solution or triethyleamine introduced system in CO2 are
quite different and might vary the relative reaction rates, the reactions can be summarized
as substitution, esterification, hydrolysis and condensation steps. The first step involves a
substitution reaction with acetic acid, which resulted in alcohol. In the second step, the
alcohol reacts with acetic acid and generates water through an esterification reaction.

210
Then, the generated water leads to hydrolysis and then subsequent condensation. The
reactions can be summarized as:
Substitution:
≡M-OR + HOAc ⇌ ≡MOAc + ROH 10.1
Esterification :
HOAc + ROH ⇌ ROAc + H2O 9.2
Hydrolysis:
H2O + ≡M-OR ⇌ ≡M-OH + ROH 9.3
Condensation:
≡M-OH + ≡M-OR ⇌ ≡M-O-M≡ + ROH 9.4
≡M-OH + ≡M-OH ⇌ ≡M-O-M≡ + H2O 9.5
where, M = Ti or Zr or Fe
9.5. Performance of TiO2-based Nanostructured Materials
Photocatalycic activity of the synthesized pure and modified nanomaterials was
evaluated by photodegradation of methylene blue under UV irradiation. All the nitrogen
doped systems showed better performance compared to pure TiO2 nanomaterials.
However increasing Fe doping decreased the photodegradation rate. 0.1 % Fe doped TiO2
and N-doped TiO2 showed higher activity compared to commercial P25 TiO2.
9.6. Recommendations
Recommendations for future work include:

211
1. The successful synthesis of the TiO2-based nanostructure materials via sol-gel process
in scCO2 is encouraging to extend this method for synthesizing other oxide
nanostructures, such as N doped ZnO, Al doped TiO2, and others.
2. Detailed kinetics study including the effects of temperature, acid to metal alkoxide
ratio, and concentration on the sol-gel process for binary ZrO2-TiO2 in CO2 using the in
situ ATR-FTIR and Raman techniques will be very helpful to get detailed information
about the nanostructure formation.
3. Evaluate these materials as an electrode in solar cells and optimize the synthesis
parameters for this application.
4. Modify the surface of TiO2 by different sensitizing agents such as dye, CdS, CdSe and
evaluate as an electrode for solar cell application.
5. Study the direct sol-gel method in CO2 using a high temperature autoclave to mimic
the solvothermal process to produce advanced materials.

212
References
1. Bent, R. D.; Orr, L.; Baker, R.; Indiana University. Institute for Advanced Study., Energy : science, policy, and the pursuit of sustainability. Island Press: Washington, DC ; London, 2002; p xviii, 257 p. 2. Mao, S. S.; Chen, X., Selected nanotechnologies for renewable energy applications. International Journal of Energy Research 2007, 31, (6-7), 619 - 636. 3. Mor, G. K.; Varghese, O. K.; Paulose, M.; Shankar, K.; Grimes, C. A., A review on highly ordered, vertically oriented TiO2 nanotube arrays: Fabrication, material properties, and solar energy applications. Solar Energy Materials & Solar Cells 2006, 90 2011–2075. 4. Kitano, M.; Matsuoka, M.; Ueshima, M.; Anpo, M., Recent developments in titanium oxide-based photocatalysts. Applied Catalysis A: General 2007 325 1–14. 5. http://www.canren.gc.ca/. 6. Oelhafen, P.; Schuler, A., Nanostructured materials for solar energy conversion. Solar Energy 2005, 79, (2), 110-121. 7. Lazarov, M.; Raths, P.; Metzger, H.; Spirkl, W., Optical constants and film density of TiNxOy solar selective absorbers. Journal of Applied Physics 1995, 77, (5), 2133. 8. Nalwa, H. S., Nanostructured materials and nanotechnology. Concise ed.; Academic Press: San Diego, Calif. London, 2002; p xxiii, 834 p. 9. Goetzberger, A.; Hoffman, U. V., Photovoltaic Energy Generation Springer 2005, Germany. 10. Gratzel, M., Photoelectrochemical cells. Nature 2001, 414, (6861), 338. 11. Fujishima, A.; Honda, K., Electrochemical Photolysis of Water at a Semiconductor Electrode. Nature 1972, 238, (5358), 37-38. 12. Grätzel, M., Photovoltaic and photoelectrochemical conversion of solar energy. Philosophical Transactions of the Royal Society A: Mathematical, Physical and Engineering Sciences 2007, 365, (1853), 993-1005. 13. Wu, J. C. S.; Lin, H.-M.; Lai, C.-L., Photo reduction of CO2 to methanol using optical-fiber photoreactor. Applied Catalysis A: General 2005, 296, (2), 194-200. 14. Matsuoka, M.; Kitano, M.; Takeuchi, M.; Tsujimaru, K.; Anpo, M.; Thomas, J. M., Photocatalysis for new energy production Recent advances in photocatalytic water splitting reactions for hydrogen production. Catalysis Today 2007 122 51–61. 15. http://www.titanpe.com/. 16. Chen, X.; Mao, S. S., Titanium Dioxide Nanomaterials: Synthesis, Properties, Modifications, and Applications. Chem. Rev. 2007, 107, (7), 2891-2959. 17. Ohtani, B.; Ogawa, Y.; Nishimoto, S. i., Photocatalytic Activity of Amorphous-Anatase Mixture of Titanium(IV) Oxide Particles Suspended in Aqueous Solutions. J. Phys. Chem. B 1997, 101, (19), 3746-3752. 18. Qiu, X.; Burda, C., Chemically synthesized nitrogen-doped metal oxide nanoparticles. Chemical Physics 2007, 339, (1-3), 1-10. 19. Asahi, R.; Morikawa, T.; Ohwaki, T.; Aoki, K.; Taga, Y., Visible-Light Photocatalysis in Nitrogen-Doped Titanium Oxides. Science 2001, 293, (5528), 269.

213
20. Asahi, R.; Morikawa, T., Nitrogen complex species and its chemical nature in TiO2 for visible-light sensitized photocatalysis. Chemical Physics 2007, 339, (1-3), 57-63. 21. Baiju, K. V.; Shukla, S.; Sandhya, K. S.; James, J.; Warrier, K. G. K., Photocatalytic Activity of Sol-Gel-Derived Nanocrystalline Titania. J. Phys. Chem. C 2007, 111, (21), 7612-7622. 22. Burda, C.; Lou, Y.; Chen, X.; Samia, A. C. S.; Stout, J.; Gole, J. L., Enhanced Nitrogen Doping in TiO<sub>2</sub> Nanoparticles. Nano Lett. 2003, 3, (8), 1049-1051. 23. Chen, C.; Li, X.; Ma, W.; Zhao, J.; Hidaka, H.; Serpone, N., Effect of Transition Metal Ions on the TiO2-Assisted Photodegradation of Dyes under Visible Irradiation: A Probe for the Interfacial Electron Transfer Process and Reaction Mechanism. J. Phys. Chem. B 2002, 106, (2), 318-324. 24. Durr, M.; Rosselli, S.; Yasuda, A.; Nelles, G., Band-Gap Engineering of Metal Oxides for Dye-Sensitized Solar Cells. J. Phys. Chem. B 2006, 110, (51), 26507-26507. 25. Janus, M.; Morawski, A. W., New method of improving photocatalytic activity of commercial Degussa P25 for azo dyes decomposition. Applied Catalysis B: Environmental 2007, 75 118–123. 26. Iijima, S., Helical microtubules of graphitic carbon. Nature 1991, 354, (6348), 56-58. 27. Zhong, Z.; Lin, M.; Ng, V.; Ng, G. X. B.; Foo, Y.; Gedanken, A., A Versatile Wet-Chemical Method for Synthesis of One-Dimensional Ferric and Other Transition Metal Oxides. Chem. Mater. 2006, 18, (25), 6031-6036. 28. Cao, S.; Yeung, K. L.; Yue, P.-L., An investigation of trichloroethylene photocatalytic oxidation on mesoporous titania-silica aerogel catalysts. Applied Catalysis B: Environmental 2007, 76 64–72. 29. Richter, C.; Wu, Z.; Panaitescu, E.; Willey, R. J.; Menon, L., Ultrahigh-Aspect-Ratio Titania Nanotubes. Adv. Mater. 2007, 19, 946–948. 30. Li, G.; Ciston, S.; Saponjic, Z. V.; Chena, L.; Dimitrijevic, N. M.; Rajh, T.; Graya, K. A., Synthesizing mixed-phase TiO2 nanocomposites using a hydrothermal method for photo-oxidation and photoreduction applications. Journal of Catalysis 2008, 253, 105–110. 31. Sahel, K.; Perol, N.; Chermette, H.; Bordes, C.; Derriche, Z.; Guillard, C., Photocatalytic decolorization of Remazol Black 5 (RB5) and Procion Red MX-5B—Isotherm of adsorption, kinetic of decolorization and mineralization. Applied Catalysis B: Environmental 2007 77 100–109. 32. Wei, M.; Zhou, H.; Konishi, Y.; Ichihara, M.; Sugiha, H.; Arakawa, H., Synthesis of Tubular Titanate via a Self-Assembly and Self-Removal Process. Inorg. Chem. 2006, 45, (14), 5684-5690. 33. Zhu, B.; Sui, Z.; Wang, S.; Chen, X.; Zhang, S.; Wu, S.; Huang, W., Alternative approaches to fabrication of gold-modified TiO2 nanotubes. Materials Research Bulletin 2006, 41, 1097-1104. 34. Zhang, S.; Chen, Z.; Li, Y.; Wang, Q.; Wan, L.; You, Y., Preparation of TiO2 fibers by two-step synthesis method and their photocatalytic activity. Materials Chemistry and Physics 2008, 107 1–5.

214
35. Dodda, A.; McKinleya, A.; Tsuzuki, T.; Saunders, M., Optical and photocatalytic properties of nanocrystalline TiO2 synthesised by solid-state chemical reaction. Journal of Physics and Chemistry of Solids 2007 68 2341–2348. 36. Cristante, V. M.; Prado, A. G. S.; Jorge, S. M. A.; Valente, J. P. S.; Florentino, A. O.; Padilha, P. M., Synthesis and characterization of TiO2 chemically modified by Pd(II) 2-aminothiazole complex for the photocatalytic degradation of phenol. Journal of Photochemistry & Photobiology, A: Chemistry 2008, 195, (1), 23-29. 37. Herrmann, J. M., Heterogeneous photocatalysis: state of the art and present applications. Topics in Catalysis 2005, 34, (1–4), 49-65. 38. Li, G.; Gray, K. A., The solid–solid interface: Explaining the high and unique photocatalytic reactivity of TiO2-based nanocomposite materials Chemical Physics 2007 339, 173–187. 39. Yu, J.; Yu, H.; Chenga, B.; Trapalis, C., Effects of calcination temperature on the microstructures and photocatalytic activity of titanate nanotubes. Journal of Molecular Catalysis A: Chemical 2006, 249, 135-142. 40. Grätzel, M., Conversion of sunlight to electric power by nanocrystalline dye-sensitized solar cells. Journal of Photochemistry and Photobiology A: Chemistry 2004, 164, (1-3), 3-14. 41. Martin, C. R.; Kohli, P., The emerging field of nanotube biotechnology. Nat Rev Drug Discovery 2003, 2, (1), 29-37. 42. Wan, Y.; Ma, J.; Zhou, W.; Zhu, Y.; Song, X.; Li, H., Preparation of titania-zirconia composite aerogel material by sol-gel combined with supercritical fluid drying. Applied Catalysis A: General 2004, 277, 55-59. 43. Pena, J.; Vallet-Regi, M.; San Roman, J., TiO2-polymer composites for biomedical applications. J Biomed Mater Res 1997, 35, (1), 129-134. 44. Gangopadhyay, R.; De, A., Conducting Polymer Nanocomposites: A Brief Overview Chem Mater 2000, 12, (3), 608-622. 45. Khaled, S. M.; Sui, R.; Charpentier, P. A.; Rizkalla, A. S., Synthesis of TiO2-PMMA Nanocomposite: Using Methacrylic Acid as a Coupling Agent. Langmuir 2007, 23, (7), 3988-3995. 46. Ramires, P. A.; Giuffrida, A.; Milella, E., Three-dimensional reconstruction of confocal laser microscopy images to study the behaviour of osteoblastic cells grown on biomaterials. Biomaterials 2002, 23, (2), 397-406. 47. Zan, L.; Tian, L.; Liu, Z.; Peng, Z., A new polystyrene–TiO2 nanocomposite film and its photocatalytic degradation. Applied Catalysis A: General 2004, 264, (2), 237-242. 48. Yuvaraj, H.; Park, E. J.; Gal, Y.-S.; Lima, K. T., Synthesis and characterization of polypyrrole–TiO2 nanocomposites in supercritical CO2. Colloids and Surfaces A: Physicochem. Eng. Aspects 2008, (313–314), 300–303. 49. Varghese, O. K.; K., M. G.; Grimes, C. A.; Paulose, M.; Mukherjee, N., A titania nanotube-array room-temperature sensor for selective detection of hydrogen at low concentrations. Journal of Nanoscience and Nanotechnology 2004, 4, (7 ), 733 50. Pal, M.; GarciaSerrano, J.; Santiago, P.; Pal, U., Size-Controlled Synthesis of Spherical TiO2 Nanoparticles: Morphology, Crystallization, and Phase Transition. J. Phys. Chem. C 2007, 111, (1), 96-102.

215
51. Sivakumar, S.; Sibu, C. P.; Mukundan, P.; Pillai, P. K.; Warrier, K. G. K., Nanoporous titania–alumina mixed oxides—an alkoxide free sol–gel synthesis. Materials Letters 2004, 58, (21), 2664-2669. 52. Aust, U.; Benfer, S.; Dietze, M.; Rost, A.; Tomandl, G., Development of microporous ceramic membranes in the system TiO2/ZrO2. Journal of Membrane Science 2006, 281, (1-2), 463-471. 53. Kitiyanan, A.; Sakulkhaemaruethai, S.; Suzuki, Y.; Yoshikawa, S., Structural and photovoltaic properties of binary TiO2-ZrO2 oxides system prepared by sol-gel method. Composites Science and Technology 2006, 66, (10), 1259-1265. 54. Adan, C.; Bahamonde, A.; Fernandez-Garcia, M.; Martinez-Arias, A., Structure and activity of nanosized iron-doped anatase TiO2 catalysts for phenol photocatalytic degradation. Applied Catalysis B, Environmental 2007, 72, (1-2), 11-17. 55. Huang, D.-G.; Liao, S.-J.; Liu, J.-M.; Danga, Z.; Petrik, L., Preparation of visible-light responsive N–F-codoped TiO2 photocatalyst by a sol–gel-solvothermal method. Journal of Photochemistry and Photobiology A: Chemistry 2006, 184, 282-288. 56. Li, Q.; Xie, R.; Li, Y. W.; Mintz, E. A.; Shang, J. K., Enhanced Visible-Light-Induced Photocatalytic Disinfection of E. coli by Carbon-Sensitized Nitrogen-Doped Titanium Oxide. Environ. Sci. Technol. 2007. 57. Huanga, D.-G.; Liao, S.-J.; Liu, J.-M.; Danga, Z.; Petrik, L., Preparation of visible-light responsive N–F-codoped TiO2 photocatalyst by a sol–gel-solvothermal method Journal of Photochemistry and Photobiology A: Chemistry 2006, 184, 282-288. 58. Rhee, C. H.; Lee, J. S., Synthesis of nitrogen-doped titanium oxide nanostructures via a surfactant-free hydrothermal route J. Mater. Res 2005, 20, (11), 3011-3020. 59. Zhang, Q.; Gao, L., One-step preparation of size-defined aggregates of TiO2 nanocrystals with tuning of their phase and composition. Journal of the European Ceramic Society 2006, 26, (9), 1535-1545. 60. Yin, S.; Komatsu, M.; Zhang, Q.; Saito, F.; Sato, T., Synthesis of visible-light responsive nitrogen/carbon doped titania photocatalyst by mechanochemical doping J Mater Sci 2007, 42, 2399–2404. 61. Wu, J. M.; Qi, B., Low-Temperature Growth of a Nitrogen-Doped Titania Nanoflower Film and Its Ability To Assist Photodegradation of Rhodamine B in Water. J. Phys. Chem. C 2007, 111, (2), 666-673. 62. Wang, X.; Yu, J. C.; Chen, Y.; Wu, L.; Fu, X., ZrO2-Modified Mesoporous Nanocrystalline TiO2-xNx as Efficient Visible Light Photocatalysts. Environ. Sci. Technol. 2006, 40, (7), 2369-2374. 63. Tachikawa, T.; Fujitsuka, M.; Majima, T., Mechanistic Insight into the TiO2 Photocatalytic Reactions: Design of New Photocatalysts. J. Phys. Chem. C 2007, 111, (14), 5259-5275. 64. Lin, S.-C.; Lee, Y.-L.; Chang, C.-H.; Shen, Y.-J.; Yang, Y.-M., Quantum-dot-sensitized solar cells: Assembly of CdS-quantum-dots coupling techniques of self-assembled monolayer and chemical bath deposition. APPLIED PHYSICS LETTERS 2007, 90, 143517.
216
65. Jia, H.; Xu, H.; Hu, Y.; Tang, Y.; Zhang, L., TiO2@CdS core–shell nanorods films: Fabrication and dramatically enhanced photoelectrochemical properties. Electrochemistry Communications 2007, 9, 354–360. 66. Blackburn, J. L.; Selmarten, D. C.; Nozik, A. J., Electron Transfer Dynamics in Quantum Dot/Titanium Dioxide Composites Formed by in Situ Chemical Bath Deposition. J. Phys. Chem. B 2003, 107, (51), 14154-14157. 67. Robel, I.; Kuno, M.; Kamat, P. V., Size-Dependent Electron Injection from Excited CdSe Quantum Dots into TiO2 Nanoparticles. J. Am. Chem. Soc. 2007, 129, (14), 4136-4137. 68. Kumbhar, A.; Chumanov, G., Synthesis of Iron(III)-Doped Titania Nanoparticles and its Application for Photodegradation of Sulforhodamine-B Pollutant. Journal of Nanoparticle Research 2005, 7, (4-5), 489 - 498. 69. Cong, Y.; Zhang, J.; Chen, F.; Anpo, M.; He, D., Preparation, Photocatalytic Activity, and Mechanism of Nano-TiO2 Co-Doped with Nitrogen and Iron (III). J. Phys. Chem. C 2007, 111, (28), 10618-10623. 70. Gracia, F.; Holgado, J. P.; Caballero, A.; Gonzalez-Elipe, A. R., Structural, Optical, and Photoelectrochemical Properties of Mn+-TiO2 Model Thin Film Photocatalysts. J. Phys. Chem. B 2004, 108, (45), 17466-17476. 71. Han, W. Q.; Wen, W.; Yi, D.; Liu, Z.; Maye, M. M.; Lewis, L.; Hanson, J.; Gang, O., Fe-Doped Trititanate Nanotubes: Formation, Optical and Magnetic Properties, and Catalytic Applications. J. Phys. Chem. C 2007. 72. Ranjit, K. T.; Viswanathan, B., Synthesis, characterization and photocatalytic properties of iron-doped TiO2 catalysts. Journal of Photochemistry and Photobiology A: Chemistry 1997, 108, (1), 79-84. 73. Navio, J. A.; Colon, G.; Macias, M.; Real, C.; Litter, M. I., Iron-doped titania semiconductor powders prepared by a sol-gel method. Part I: synthesis and characterization. Applied Catalysis A: General 1999, 177, 111-120. 74. Yu, J.; Zhou, M.; Yu, H.; Zhang, Q.; Yu, Y., Enhanced photoinduced super-hydrophilicity of the sol–gel-derived TiO2 thin films by Fe-doping. Materials Chemistry & Physics 2006, 95, (2-3), 193-196. 75. Wang, C.-y.; Bo¨ttcher, C.; Bahnemannc, D. W.; Dohrmanna, J. r. K., A comparative study of nanometer sized Fe(III)-doped TiO2 photocatalysts: synthesis, characterization and activity. J. Mater. Chem. 2003, 13, 2322–2329. 76. Aguado-Serrano, J.; Rojas-Cervantes, M. L., Titania aerogels. Microporous and Mesoporous Materials 2006, 88, (1-3), 205-213. 77. Wang, C. T.; Ro, S. H., Nanocluster iron oxide-silica aerogel catalysts for methanol partial oxidation. Applied Catalysis A, General 2005, 285, (1-2), 196-204. 78. Kemp, T. J.; McIntyre, R. A., Transition metal-doped titanium(IV) dioxide: Characterisation and influence on photodegradation of poly(vinyl chloride). Polymer Degradation and Stability 2006, 91, (1), 165-194. 79. Sohn, J. R.; Lee, S. H.; , Effect of TiO2-ZrO2 composition on catalytic activity of supported NiSO4 for ethylene dimerization. Applied Catalysis A, General 2007, 321, (1), 27-34. 80. Nair, M. P.; Rao, K. V. C.; Nair, C. G. R., Investigation of the mixed oxide materials--TiO2---SiO2, TiO2---SiO2---Al2O3, TiO2---SiO2---In2O3 and TiO2---SiO2--
217
-RuO2--In regard to the photoelectrolysis of water. International Journal of Hydrogen Energy 1991, 16, (7), 449-459. 81. Choi, H.; Stathatos, E.; Dionysiou, D. D., Sol–gel preparation of mesoporous photocatalytic TiO2 films and TiO2/Al2O3 composite membranes for environmental applications Applied Catalysis B: Environmental 2006, 63, 60-67. 82. HernA¡ndez-Alonso, M. D.; Tejedor-Tejedor, I.; Coronado, J. M.; Soria, J.; Anderson, M. A., Sol-gel preparation of TiO2-ZrO2 thin films supported on glass rings: Influence of phase composition on photocatalytic activity. Thin Solid Films 2006, 502, (1-2), 125-131. 83. Reidy, D. J.; Holmes, J. D.; Morris, M. A., Preparation of a highly thermally stable titania anatase phase by addition of mixed zirconia and silica dopants. Ceramics International 2006, 32, (3), 235-239. 84. Fu, X.; Clark, L. A.; Yang, Q.; Anderson, M. A., Enhanced Photocatalytic Performance of Titania-Based Binary Metal Oxides: TiO2/SiO2 and TiO2/ZrO2. Environ. Sci. Technol. 1996, 30, (2), 647-653. 85. Neppolian, B.; Wang, Q.; Yamashita, H.; Choi, H., Synthesis and characterization of ZrO2-TiO2 binary oxide semiconductor nanoparticles: Application and interparticle electron transfer process. Applied Catalysis A: General 2007, 333, (2), 264-271. 86. Gnatyuk, Y. I.; Yatskiv, V. I.; Smirnova, N. P.; Granchak, V. M.; Eremenko, A. M., Photocatalytic properties of mesoporous TiO2/ZrO2 films in gas-phase oxidation of alcohols. Theoretical and Experimental Chemistry 2005, 41, (6), 371-376. 87. Umebayashi, T.; Yamaki, T.; Itoh, H.; Asai, K., Analysis of electronic structures of 3d transition metal doped TiO2 based on band calculations. J. Phys. Chem. Solids 2002, 63, 1909. 88. Anpo, M.; Kishiguchi, S.; Ichihashi, Y.; Takeuchi, M.; Yamashita, H.; Ikeue, K.; Morin, B.; Davidson, A.; Che, M., The design and development of second-generation titanium oxide photocatalysts able to operate under visible light irradiation by applying a metal ion-implantation method. Research on Chemical Intermediates 2001, 27, (4/5), 459-467. 89. DiValentin, C.; Pacchioni, G.; Selloni, A.; Livraghi, S.; Giamello, E., Characterization of Paramagnetic Species in N-Doped TiO2 Powders by EPR Spectroscopy and DFT Calculations. J. Phys. Chem. B 2005, 109, (23), 11414-11419. 90. Jung-Yup, L.; Park, J.; Jun-Hyung, C., Electronic properties of N- and C-doped TiO2. Applied Physics Letters 2005, 87, (1), N.PAG. 91. Nakano, Y.; Morikawa, T.; Ohwaki, T.; Taga, Y., Electrical characterization of band gap states in C-doped TiO<sub>2</sub> films. Applied Physics Letters 2005, 87, (5), N.PAG. 92. Okato, T.; Sakano, T.; Obara, M., Suppression of photocatalytic efficiency in highly N-doped anatase films. Physical Review B (Condensed Matter and Materials Physics) 2005, 72, (11), 115124-6. 93. Li, D.; Haneda, H.; Hishita, S.; Ohashi, N., Visible-Light-Driven N-F-Codoped TiO2 Photocatalysts. 2. Optical Characterization, Photocatalysis, and Potential Application to Air Purification. Chem. Mater. 2005, 17, (10), 2596-2602.

218
94. Livraghi, S.; Paganini, M. C.; Giamello, E.; Selloni, A.; Valentin, C. D.; Pacchioni, G., Origin of Photoactivity of Nitrogen-Doped Titanium Dioxide under Visible Light. J. Am. Chem. Soc. 2006, 128, (49), 15666-15671. 95. Serpone, N., Is the Band Gap of Pristine TiO2 Narrowed by Anion- and Cation-Doping of Titanium Dioxide in Second-Generation Photocatalysts? J. Phys. Chem. B 2006, 110, (48), 24287-24293. 96. Fernandez-Garcia, M.; Martinez-Arias, A.; Hanson, J. C.; Rodriguez, J. A., Nanostructured Oxides in Chemistry: Characterization and Properties. Chem. Rev. 2004, 104, (9), 4063-4104. 97. Kolen'ko, Y. V.; Kovnir, K. A.; Gavrilov, A. I.; Garshev, A. V.; Meskin, P. E.; Churagulov, B. R.; Bouchard, M.; Colbeau-Justin, C.; Lebedev, O. I.; VanTendeloo, G.; Yoshimura, M., Structural, Textural, and Electronic Properties of a Nanosized Mesoporous ZnxTi1-xO2-x Solid Solution Prepared by a Supercritical Drying Route. J. Phys. Chem. B 2005, 109, (43), 20303-20309. 98. Pierre, A. C., Introduction to sol-gel processing. Kluwer Academic Publishers: Boston, 1998; p x, 394 p. 99. Brinker, C. J.; Scherer, G. W., Sol-Gel Science: The physics and Chemistry of Sol-Gel Processing Academic press: New York, 1990. 100. Gesser, H. D.; Goswami, P. C., Aerogels and related porous materials. Chem Rev 1989, 89, (4), 765-788. 101. Oh, C. W.; Seong, G.-D. L.; Park, S.; Ju, C.-S.; Hong, S.-S., Synthesis of nanosized TiO2 particles via ultrasonic irradiation and their photocatalytic activity. Reaction Kinetics and Catalysis Letters 2005, 85, (2), 261. 102. Legrand-Buscema, C.; C. Malibert, S. B., Elaboration and characterization of thin films of TiO2 prepared by sol–gel process. Thin Solid Films 2002, 418, 79-84. 103. Li, F. B.; Li, X. Z.; Hou, M. F., Photocatalytic degradation of 2-mercaptobenzothiazole in aqueous La3+–TiO2 suspension for odor control. Applied Catalysis B: Environmental 2004, 48, (3), 185-194. 104. Weissman, J. G.; Ko, E. I.; Kaytal, S., Titania-zirconia mixed oxide aerogels as supports for hydrotreating catalysts. Applied Catalysis A: General 1993 94, 45-59. 105. Chang, S. m.; Doong, R. a., Characterization of Zr-Doped TiO2 Nanocrystals Prepared by a Nonhydrolytic Sol-Gel Method at High Temperatures. J. Phys. Chem. B 2006, 110, (42), 20808-20814. 106. Bavykin, D. V.; Friedrich, J. M.; Walsh, F. C., Protonated Titanates and TiO2 Nanostructured Materials: Synthesis, Properties, and Applications. Advanced Materials 2006, 18, (21), 2807-2824. 107. Du, G. H.; Chen, Q.; Che, R. C.; Yuan, Z. Y.; Peng, L. M., Preparation and structure analysis of titanium oxide nanotubes. Applied Physics Letters 2001, 79, (22), 3702-3704. 108. Wang, Y. Q.; Hu, G. Q.; Duan, X. F.; Sun, H. L.; Xue, Q. K., Microstructure and formation mechanism of titanium dioxide nanotubes. Chemical Physics Letters 2002, 365, (5-6), 427-431 109. Wang, Y.; Cheng, H.; Hao, Y.; Ma, J.; Li, W.; Cai, S., Photoelectrochemical properties of metal-ion-doped TiO2 nanocrystalline electrodes. Thin Solid Films 1999, 349, (1-2), 120-125
219
110. Kim, C. S.; Okuyama, K.; Nakaso, K.; Shimada, M., Direct measurement of nucleation and growth modes in titania nanoparticles generation by a CVD method. J Chem Eng Jpn 2004, 37, (11), 1379. 111. Kim, C.; Nakaso, K.; Xia, B.; Okuyama, K.; Shimada, M., A New Observation on the Phase Transformation of TiO 2 Nanoparticles Produced by a CVD Method. Aerosol Science & Technology 2005, 39, (2), 104-112. 112. Cao, Y.; Yang, W.; Zhang, W.; Liub, G.; Yue, P., Improved photocatalytic activity of Sn4þ doped TiO2 nanoparticulate films prepared by plasma-enhanced chemical vapor deposition. N e w . J . C h e m 2 0 0 4, 2 8 2 1 8 – 2 2 2. 113. Sudarshan, T. S. In Coated powders - new horizons and applications, Advances in Surface Treatment: Research & Applications (ASTRA), Proceedings of the International Conference, Hyderabad, India, 2003; Hyderabad, India, 2003; pp 412-422. 114. Liang, C.; Shimizu, Y.; Sasaki, T.; Koshizaki, N., Synthesis, characterization, and phase stability of ultrafine TiO2 nanoparticles by pulsed laser ablation in liquid media. J Mater Res 2004, 19, (5), 1551-1557. 115. Nagaveni, K.; Hegde, M. S.; Madras, G., Structure and Photocatalytic Activity of Ti1-x MxO2 ; (M = W, V, Ce, Zr, Fe, and Cu) Synthesized by Solution Combustion Method. J. Phys. Chem. B 2004, 108, (52), 20204-20212. 116. Jinsoo, K.; Jae Won, L.; Tai Gyu, L.; Suk Woo, N.; Jonghee, H., Nanostructured titania membranes with improved thermal stability. Journal of Materials Science 2005, 40, (7), 1797-1799. 117. Iwasaki, M.; Davis, S. A.; Mann, S., Spongelike Macroporous TiO2 Monoliths Prepared from Starch Gel Template. J Sol-Gel Sci Techn 2004, 32, 99-105. 118. Kisch, H.; Sakthivel, S.; Janczarek, M.; Mitoraj, D., A Low-Band Gap, Nitrogen-Modified Titania Visible-Light Photocatalyst. J. Phys. Chem. C 2007, 111, (30), 11445-11449. 119. Maeda, M.; Yamada, T., Photocatalytic activity of metal-doped titanium oxide films prepared by sol-gel process. Journal of Physics: Conference Series 2007, 61, 755–759. 120. Lucky, R. A.; Charpentier, P. A., A one-step approach to the synthesis of ZrO2 modified TiO2 nanotubes in supercritical carbon dioxide. Advanced Materials. 2008, 20, (9), 1755-1759. 121. Rayner, C. M., The Potential of Carbon Dioxide in Synthetic Organic Chemistry. Organic Process Research & Development 2007, 11, ( ), 121-132. 122. Clark, J. H.; Tavener, S. J., Alternative Solvents: Shades of Green. Org. Process Res. Dev. 2007, 11, (1), 149-155. 123. Sui, R., Synthesis and Characterization of Oxide Nanostructures Via a Sol-Gel Route in Supercritical CO2. PhD thesis 2007. 124. Jia, M., Particle formation in supercritical canbon dioxide by the RESS process. M.E.Sc . thesis 2003. 125. Dobbs, J. M.; Wong, J. M.; Lahiere, R. J.; Johnston, K. P., Modification of Supercritical Fluid Phase Behavior Using Polar Cosolvents. Ind. Eng. Chem. Res. 1987, 26, 56-65.

220
126. Salmas, C. E.; Androutsopoulos, G. P., Rigid Sphere Molecular Model Enables an Assessment of the Pore Curvature Effect upon Realistic Evaluations of Surface Areas of Mesoporous and Microporous Materials. Langmuir 2005, 21, (24), 11146-11160. 127. Woods, H. M.; Silva, M. M. C. G.; Nouvel, C.; Shakesheff, K. M.; Howdle, S. M., Material Processing in Supercritical Carbon Dioxide: Surfactants, Polymers and Biomaterials. J Mater Chem 2004, 14, 1663-1678. 128. O'Neil, A.; Watkins, J. J., Reactive Deposition of Conformal Metal Oxide Films from Supercritical Carbon Dioxide. Chem. Mater. 2007, 19, (23), 5460-5466. 129. King, J. W.; Williams, L. L., Utilization of critical fluids in processing semiconductors and their related materials. Curr Opin Solid ST M 2003, 7, (4-5), 413-424. 130. Charpentier, P. A.; DeSimone, J. M.; Roberts, G. W., Continuous polymerizations in supercritical carbon dioxide. ACS Symposium Series 2002, 819, 113-135. 131. Smirnova, I.; Arlt, W., Synthesis of Silica Aerogels: Influence of the Supercritical CO2 on the Sol-Gel Process. Journal of Sol-Gel Science and Technology 2003, 28, (2), 175-184. 132. Lee, M.-H.; Lin, H.-Y.; Thomas, J. L., A Novel Supercritical CO2 Synthesis of Amorphous Hydrous Zirconia Nanoparticles, and Their Calcination to Zirconia. Journal of the American Ceramic Society 2006, 89, (12), 3624-3630. 133. McHugh, M. A.; Krukonis, V. J., Supercritical fluid extraction : principles and practice. Butterworths: Boston ; Toronto, 1986; p ix, 507. 134. Darr, J. A.; Poliakoff, M., New Directions in Inorganic and Metal-Organic Coordination Chemistry in Supercritical Fluids. Chem Rev 1999, 99, (2), 495-541. 135. Dixon, D. J.; Johnston, K. P., Supercritical Fluids. Encyclopedia of Chemical Technology 1997, 4th, (23), 452-478. 136. Johnston, K. P., Supercritical Fluid Science and Technology. American Chemical society, washington, Dc 1989. 137. Taylor, L. T., Supercritical fluid extraction. Wiley: New York, 1996; p xiv, 181 p. 138. Tadros, M. E. A., Carol L. J.; Russick, Edward M.; Youngman, Michael P., Synthesis of titanium dioxide particle in supercritical CO2. J Supercrit Fluids 1996, 9, (3), 172-176. 139. Stallings, W. E.; Lamb, H. H., Synthesis of Nanostructured Titania Powders via Hydrolysis of Titanium Isopropoxide in Supercritical Carbon Dioxide. Langmuir 2003, 19, (7), 2989-2994. 140. Hong, S.-S.; Lee, M. S.; Lee, G.-D.; Lim, K. T.; Ha, B.-J., Synthesis of titanium dioxides in water-in-carbon dioxide microemulsion and their photocatalytic activity. Mater Lett 2003, 57, (19), 2975. 141. Guo, G.; Whitesell, J. K.; Fox, M. A., Synthesis of TiO2 Photocatalysts in Supercritical CO2 via a Non-hydrolytic Route. J. Phys. Chem. B 2005, 109, (40), 18781-18785. 142. Reverchon, E.; Caputo, G.; Correra, S.; Cesti, P., Synthesis of titanium hydroxide nanoparticles in supercritical carbon dioxide on the pilot scale. J. Supercrit. Fluids 2003, 26, 253. 143. Reverchon, E.; Adami, R., Nanomaterials and supercritical fluids. The Journal of Supercritical Fluids 2006, 37 (1), 1-22.
221
144. Sun, D.; Liu, Z.; He, J.; Han, B.; Zhang, J.; Huang, Y., Surface sol-gel modification of mesoporous silica molecular sieve SBA-15 with TiO2 in supercritical CO2. Microporous and Mesoporous Materials 2005, 80, 165. 145. Tatsuda, N.; Itahara, H.; Setoyama, N.; Fukushima, Y., Preparation of titanium dioxide/activated carbon composites using supercritical carbon dioxide. Carbon 2005, 43, ( 11 ), 2358-2365 146. Sun, D.; Huang, Y.; Han, B.; Yang, G., Ti-Si Mixed Oxides Prepared by Polymer in Situ Sol-Gel Chemistry with the Aid of CO2. Langmuir 2006, 22, (10), 4793-4798. 147. Jensen, H.; Bremholm, M.; Nielsen, R. e. P.; Joensen, K.; Pedersen, J.; Birkedal, H.; Chen, Y.-S.; Almer, J.; Søgaard, E.; Iversen, S.; Iversen, B., In Situ High-Energy Synchrotron Radiation Study of Sol–Gel Nanoparticle Formation in Supercritical Fluids. Angewandte Chemie International Edition 2007, 46, (7), 1113 - 1116. 148. Loy, D. A.; Russick, E. M.; Yamanaka, S. A.; Baugher, B. M.; Shea, K. J., Direct Formation of Aerogels by Sol-Gel Polymerizations of Alkoxysilanes in Supercritical Carbon Dioxide. Chem. Mater. 1997, 9, (11), 2264-2268. 149. Sui, R.; Rizkalla, A. S.; Charpentier, P. A., Formation of Titania Nanofibers: A Direct Sol-Gel Route in Supercritical CO2. Langmuir 2005, 21, (14), 6150-6153. 150. Sui, R.; Rizkalla, A. S.; Charpentier, P. A., Synthesis and Formation of Silica Aerogel Particles By a Novel Sol-Gel Route in Supercritical Carbon Dioxide. J. Phys. Chem. B 2004, 108, (32), 11886-11892. 151. Sui, R.; Rizkalla, A. S.; Charpentier, P. A., FTIR Study on the Formation of TiO2 Nanostructures in Supercritical CO2. J. Phys. Chem. B 2006, 110, (33), 16212-16218. 152. Nakamoto, K., Infrared and Raman spectra of inorganic and coordination compounds. 4th ed.; Wiley: New York ; Toronto, 1986; p xi, 484 p. 153. Venter, M. J.; Willems, P.; Kareth, S.; Weidner, E.; Kuipers, N. J. M.; de Haan, A. B., Phase equilibria and physical properties of CO2-saturated cocoa butter mixtures at elevated pressures. The Journal of Supercritical Fluids 2007, 41, (2), 195-203. 154. vanSchilt, M. A.; Wering, R. M.; vanMeerendonk, W. J.; Kemmere, M. F.; Keurentjes, J. T. F.; Kleiner, M.; Sadowski, G.; deLoos, T. W., High-Pressure Phase Behavior of the System PCHC-CHO-CO2 for the Development of a Solvent-Free Alternative toward Polycarbonate Production. Ind. Eng. Chem. Res. 2005, 44, (9), 3363-3366. 155. Schneider, M. S.; Grunwaldt, J. D.; Bürgi, T.; Baiker, A., High pressure view-cell for simultaneous in situ infrared spectroscopy and phase behavior monitoring of multiphase chemical reactions. Review of Scientific Instruments 2003, 74, (9), 4121. 156. Lazzaroni, M. J.; Bush, D.; Jones, R.; Hallett, J. P.; Liotta, C. L.; Eckert, C. A., High-pressure phase equilibria of some carbon dioxide-organic-water systems. Fluid Phase Equilibria 2004, 224, (1), 143-154. 157. http://en.wikipedia.org/wiki/Differential_scanning_calorimetry. 158. Arai, Y.; Akers, R. J.; Treasure, C. R. G., Chemistry of powder production. 1st English language ed.; Chapman & Hall: London, 1996; p ix, 281 p. 159. Spurr, R. A.; Myers, H., Quantitative Analysis of Anatase-Rutile Mixtures with an X-Ray Diffractometer. Anal. Chem. 1957, 29, (5), 760-762. 160. Gregg, S. J.; Sing, K. S. W., Adsorption, surface area, and porosity. 2nd ed.; Academic Press: London ; Toronto, 1982; p xi, 303 p.

222
161. Brunauer, S.; Emmett, P. H.; Teller, E., Adsorption of Gases in Multimolecular Layers. J Am Chem Soc 1938, 60, (2), 309-319. 162. Barrett, E. P.; Joyner, L. G.; Halenda, P. P., The Determination of Pore Volume and Area Distributions in Porous Substances. I. Computations from Nitrogen Isotherms. J Am Chem Soc 1951, 73, (1), 373-380. 163. Lukens, W. W.; Schmidt-Winkel, P.; Zhao, D.; Feng, J.; Stucky, G. D., Evaluating Pore Sizes in Mesoporous Materials: A Simplified Standard Adsorption Method and a Simplified Broekhoff-de Boer Method. Langmuir 1999, 15, (16), 5403-5409. 164. Perkampus, H.-H., UV-VIS spectroscopy and its applications. Springer-Verlag: Berlin ; New York, 1992; p ix, 244 p. 165. Feng, L.; Berglund, K. A., ATR FTIR for determination optimal cooling curves for batch crystallization of succinic acid. J. of Crystal Growth 2002, 2, (5), 449-452. 166. Lewiner, F.; F`evotte, G.; Klein, J. P.; Puel, F., Improving Batch Cooling Seeded Crystallization of an Organic Weed-Killer Using On-Line ATR FTIR Measurement of Supersaturation. J. of Crystal Growth 2001, 226, 348-362. 167. Cheng, B.; Qu, S.; Zhou, H.; Wang, Z., Al2O3:Cr+ Nanotubes Synthesized via Homogenization Precipitation Followed by Heat Treatment. J. Phys. Chem. B 2006, 110, (32), 15749-15754. 168. Cai, Q.; Yang, L.; Yu, Y., Investigations on the self-organized growth of TiO2 nanotube arrays by anodic oxidization. Thin Solid Films 2006, 515, 1802-1806. 169. Sander, M. S.; Côté, M. J.; Gu, W.; Kile, B. M.; Tripp, C. P., Template-Assisted Fabrication of Dense, Aligned Arrays of Titania Nanotubes with Well-Controlled Dimensions on Substrates. Advanced Materials 2004, 16, 2052-2057. 170. Qiu, J.; Jin, Z.; Liu, Z.; Liu, X.; Liu, G.; Wu, W.; Zhang, X.; Gao, X., Fabrication of TiO2 nanotube film by well-aligned ZnO nanorod array film and sol-gel process. Thin Solid Films 2007, 515, 2897-2902. 171. Weng, L. Q.; Song, S. H.; Hodgson, S.; Baker, A.; Yu, J., Synthesis and characterisation of nanotubular titanates and titania. Journal of the European Ceramic Society 2006, 26, 1405-1409. 172. Zhang, H.; Li, G. R.; An, L. P.; Yan, T. Y.; Gao, X. P.; Zhu, H. Y., Electrochemical Lithium Storage of Titanate and Titania Nanotubes and Nanorods. J. Phys. Chem. C 2007, 111, (16), 6143-6148. 173. Giddings, J. C.; Myers, M. N.; McLaren, L.; Keller, R. A., High pressure gas chromatography of nonvolatile species. Compressed gas is used to cause migration of intractable solutes. Science 1968, 162, 67-73. 174. Silva, R. F.; Vasconcelos, W. L., Influence of Processing Variables on the Pore Structure of Silica Gels Obtained with Tetraethylorthosilicate. Materials Research 1999, 2 (3), 197-200. 175. Birnie, I., Dunbar P., Esterification kinetics in titanium isopropoxide-acetic acid solutions. Journal of Materials Science 2000, 35, (2), 367-374. 176. Cao, G., Nanostructures & nanomaterials : synthesis, properties & applications. Imperial College Press: London, 2004; p xiv, 433 p. 177. Yasue, T.; Tsuchida, Y.; Arai, Y., Crystal shape and precepitation conditions of Ca(OH)2. Gypsum Lime 1984, 189, 17.
223
178. Kim, K. D.; Kim, H. T., Comparison of the effect of reaction parameters on particle size in the formation of SiO2, TiO2, and ZrO2 nanoparticles. Materials Letters 2003, 57 3211 –3216. 179. Doeuff, S.; Henry, M.; Sanchez, C.; Livage, J., Hydrolysis of titanium alkoxides: Modification of the molecular precursor by acetic acid. Journal of Non-Crystalline Solids 1987, 89, (1-2), 206-216. 180. Birnie III, D. P.; Bendzko, N. J., 1H and 13C NMR observation of the reaction of acetic acid with titanium isopropoxide. Materials Chemistry and Physics 1999, 59, (1), 26-35. 181. Bradley, D. C.; Gaze, R.; Wardlaw, W., J. Chem. Soc., 1957, 469. 182. Sanchez, C.; Livage, J.; Henry, M.; Babonneau, F., Chemical Modification of alkoxide precursors. Journal of Non-Crystalline Solids 1988, 100, 65-76. 183. Jupa, M.; Kickelbick, G.; Schubert, U., Methacrylate-Substituted Titanium-Yttrium Mixed-Metal Oxo Clusters. European Journal of Inorganic Chemistry 2004, 1835 - 1839, 9. 184. Zhu, J.; Zhang, J.; Chen, F.; Iino, K.; Anpo, M., High activity TiO2 Photocatalysts Prepared by a Modified Sol–gel Method: Characterization and their Photocatalytic Activity for the Degradation of XRG and X-GL. Topics in Catalysis 2005, 35, (3-4), 261-268. 185. Lucky, R. A.; Sui, R.; Charpentier, P. A.; Jennings, M. C., Decakis(µ2-acetato-κ2 O:O')bis(µ2-isopropoxy- κ2 O:O) tetraisopropoxytetra- µ3-oxo-tetratitaniumdizirconium. Acta Cryst., E 2007, 63, m2429–m2430. 186. Galindo, I. R.; Viveros, T.; Chadwick, D., Synthesis and Characterization of Titania-Based Ternary and Binary Mixed Oxides Prepared by the Sol-Gel Method and Their Activity in 2-Propanol Dehydration. Ind. Eng. Chem. Res. 2007, 46, (4), 1138-1147. 187. Reddy, B. M.; Chowdhury, B.; Smirniotis, P. G., An XPS study of the dispersion of MoO3 on TiO2–ZrO2, TiO2–SiO2, TiO2–Al2O3, SiO2–ZrO2, and SiO2–TiO2–ZrO2 mixed oxides. Applied Catalysis A: General 2001, 211, (1), 19-30. 188. Chen, Q.; Zhou, W.; Du, G. H.; Peng, L.-M., Trititanate Nanotubes Made via a Single Alkali Treatment. Advanced Materials 2002, 14, (17), 1208-1211. 189. Sui, R.; Rizkalla, A. S.; Charpentier, P. A., Direct Synthesis of Zirconia Aerogel Nanoarchitecture in Supercritical CO2. Langmuir 2006, 22, (9), 4390-4396. 190. Doeuff, S.; Dromzee, Y.; Taulelle, F.; Sanchez, C., Synthesis and Solid- and Liquid-State Characterization of a Hexameric Cluster of Titanium( IV): Ti6()2 ( p3-o)2 ( p2-OC4H9)2( OC4H9)6(O COCH3)8. Inorg. Chem. 1989, 28, 4439-4445. 191. Zhong, Z.; Ang, T. P.; Luo, J.; Gan, H. C.; Gedanken, A., Synthesis of One-Dimensional and Porous TiO2 Nanostructures by Controlled Hydrolysis of Titanium Alkoxide via Coupling with an Esterification Reaction. Chem. Mater. 2005, 17, (26), 6814-6818. 192. Kickelbick, G.; Feth, M. P.; Bertagnolli, H.; Puchberger, M.; Holzinger, D.; Gross, S., Formation of organically surface-modified metal oxo clusters from carboxylic acids and metal alkoxides: a mechanistic study J. Chem. Soc., Dalton Trans. 2002, 3892-3898.

224
193. Kickelbick, G.; Schubert, U., Oxozirconium methacrylate clusters. Zr6(OH)4O4(OMc)12 and Zr4O2(OMc)12 (OMc = methacrylate). Chem Ber/Recl 1997, 130, (4), 473-477. 194. Kickelbick, G.; Wiede, P.; Schubert, U., Variations in capping the Zr6O4(OH)4 cluster core: X-ray structure analyses of [Zr6(OH)4O4(OOC-CH=CH2)10]2(μ-OOC-CH=CH2)4 and Zr6(OH)4O4(OOCR)12(PrOH) (R = Ph, CMe = CH2). Inorganica Chimica Acta 1999, 284, (1), 1-7. 195. Kickelbick, G.; Feth, M. P.; Bertagnolli, H.; Puchberger, M.; Holzinger, D.; Gross, S., Formation of organically surface-modified metal oxo clusters from carboxylic acids and metal alkoxides: a mechanistic study. J. Chem. Soc., Dalton Trans. 2002, 3892-3898. 196. Mackenzie, J. D.; Bescher, E. P., Chemical Routes in the Synthesis of Nanomaterials Using the Sol–Gel Process. Acc. Chem. Res. 2007, 40, (9), 810-818. 197. Kayan, A., Solvent Effect on Complexation of Titanium Tetraethoxide with Allylacetoacetate. Journal of Inorganic and Organometallic Polymers and Materials 2005, 158, (3), 361-365. 198. Ranjit, K. T.; Klabunde, K. J., Solvent Effects in the Hydrolysis of Magnesium Methoxide, and the Production of Nanocrystalline Magnesium Hydroxide. An Aid in Understanding the Formation of Porous Inorganic Materials. Chem. Mater. 2005, 17, (1), 65-73. 199. Boiadjieva, T.; Cappelletti, G.; Ardizzone, S.; Rondinini, S.; Vertova, A., Nanocrystalline titanium oxide by sol–gel method. The role of the solvent removal step. Phys. Chem. Chem. Phys. 2003, 5, 1689-1694. 200. Melada, S.; Signoretto, M.; Ardizzone, S. A.; Bianchi, C. L., Physico-chemical features and catalytic activity of sulfated zirconia prepared by sol–gel method.The role of the solvent evaporation step. Catalysis Letters 2001, 75, (3-4), 199-204. 201. Kauffman, G. W.; Jurs, P. C., Prediction of Surface Tension, Viscosity, and Thermal Conductivity for Common Organic Solvents Using Quantitative Structure-Property Relationships. J. Chem. Inf. Model. 2001, 41, (2), 408-418. 202. Gash, A. E.; Tillotson, T. M.; Satcher Jr., J. H.; Hrubesh, L. W.; Simpson, R. L., New sol–gel synthetic route to transition and main-group metal oxide aerogels using inorganic salt precursors. Journal of Non-Crystalline Solids 2001, 285, (1-3), 22-28. 203. Gao, Y. P.; Sisk, C. N.; Hope-Weeks, L. J., A Sol-Gel Route To Synthesize Monolithic Zinc Oxide Aerogels. Chem. Mater. 2007. 204. Ranjit, K. T.; Martyanov, I.; Demydov, D.; Uma, S.; Rodrigues, S.; Klabunde, K. J., A review of the chemical manipulation of nanomaterials using solvents: Gelation dependent structures. Journal of Sol-Gel Science and Technology 2006, 40, (2-3), 335-339. 205. Bradley, D. C.; Mehrotra, R. C.; Gaur, D. P., Metal alkoxides. Academic Press: London ; New York, 1978; p viii, 411 p. 206. Rao, C. N. R.; Raveau, B., Transition metal oxides : structure, properties, and synthesis of ceramic oxides. 2nd ed.; Wiley-VCH: New York, 1998; p xi, 373 p. 207. Kazarian, S. G.; Vincent, M. F.; Bright, F. V.; Liotta, C. L.; Eckert, C. A., Specific Intermolecular Interaction of Carbon Dioxide with Polymers. J Am Chem Soc 1996, 118, (7), 1729-1736.
225
208. Spijksma, G. I.; Huiskes, C.; Benes, N. E.; Kruidhof, H.; Blank, D. H. A.; Kessler, V. G.; Bouwmeester, H. J. M., Microporous Zirconia–Titania Composite Membranes Derived from Diethanolamine-Modified Precursors. Advanced Materials 2006, 18, 2165–2168. 209. Zou, H.; Lin, Y. S., Structural and surface chemical properties of sol-gel derived TiO2-ZrO2 oxides. Applied Catalysis A: General 2004, 265, (1), 35-42. 210. Avrami, M., Granulation, Phase Change, and Microstructure Kinetics of Phase Change. III. The Journal of Chemical Physics 1941, 9, (2), 177-184. 211. Avrami, M., Kinetics of Phase Change. II Transformation-Time Relations for Random Distribution of Nuclei. The Journal of Chemical Physics 1940, 8, (2), 212-224. 212. Avrami, M., Kinetics of Phase Change. I General Theory. The Journal of Chemical Physics 1939, 7, (12), 1103-1112. 213. Hossain, M. M.; de Lasa, H. I., Reactivity and stability of Co-Ni/Al2O3 oxygen carrier in multicycle CLC. J AIChE Journal 2007, 53, (7), 1817 - 1829. 214. Brown, M. E., Introduction to thermal analysis : techniques and applications. 2nd ed.; Kluwer Academic Publishers: Dordrecht ; Boston, 2001; p xi, 264 p. 215. Kissinger, H. E., J .Res. Natl. Bur: Stand. (US) 1956, 57, 217. 216. Burns, A.; Hayes, G.; Li, W.; Hirvonen, J.; Demaree, J. D.; Shah, S. I., Neodymium ion dopant effects on the phase transformation in sol-gel derived titania nanostructures. Materials Science and Engineering B 2004, 111, (2-3), 150-155. 217. Hu, Y.; Tsai, H. L.; Huang, C. L., Phase transformation of precipitated TiO2 nanoparticles. Materials Science and Engineering A 2003, 344, (1-2), 209-214. 218. Zhang, H.; Banfield, J. F., Phase transformation of nanocrystalline anatase-to-rutile via combined interface and surface nucleation. Journal of Materials Research Bulletin 2000, 15, 437-448. 219. Zhang, Y.-H.; Chan, C. K.; Porter, J. F.; Guo, W., Micro-Raman spectroscopic characterization of nanosized TiO2 powders prepared by vapor hydrolysis. Journal of Materials Research Bulletin 1998, 13, (9), 2602-2609. 220. Lottici, P. P.; D. Bersani; M. Braghini; Montenero, A., Raman scattering characterization of gel-derived titania glass. Journal of Materials Science 1993, 28, 177-183. 221. Sahni, S.; Reddy, S. B.; Murty, B. S., Influence of process parameters on the synthesis of nano-titania by sol–gel route. Materials Science & Engineering A 2007, 758-762. 222. He, D.; Lin, F., Preparation and photocatalytic activity of anatase TiO2 nanocrystallites with high thermal stability. Materials Letters 2007, 61, ( 16), 3385-3387. 223. Shannon, R. D.; Pask, J. A., Kinetics of the Anatase-Rutile Transformation. Journal of American ceramic society 1965, 48, (8), 391-398. 224. Iida, Y.; Ozaki, S., Growth and Phase Transformation of Titanium Oxide During Calcination. J. Am. Ceram. Soc. 1961, 44 (3), 120-127. 225. Jang, J. S.; Kim, H. G.; Ji, S. M.; Bae, S. W.; Jung, J. H.; Shon, B. H.; Lee, J. S., Formation of crystalline TiO2−xNx and its photocatalytic activity. Journal of Solid State Chemistry 2006, 179, (4), 1067-1075. 226. Ding, X.-z.; Liu, X.-h., Correlation between anatase-to-rutile transformation and grain growth in nanocrystalline titania powders. Journal of Materials Research 1998, 13, (9), 2556-2559.
226
227. Johnston, K. P.; Shah, P. S., Making Nanoscale Materials with Supercritical Fluids. Science 2004, 303, (5657), 482-483. 228. Zhu, K.; Neale, N. R.; Miedaner, A.; Frank, A. J., Enhanced Charge-Collection Efficiencies and Light Scattering in Dye-Sensitized Solar Cells Using Oriented TiO2 Nanotubes Arrays. Nano Lett. 2007, 7, (1), 69-74. 229. Chi, B.; Victorio, E. S.; Jin, T., Synthesis of Eu-doped photoluminescent titania nanotubes via a two-step hydrothermal treatment. nanotechonology 2006, 17, 2234-2241. 230. Kocher, M.; Daubler, T. K.; Harth, E.; Scherf, U.; Gugel, A.; Neher, D., Photoconductivity of an inorganic/organic composite containing dye-sensitized nanocrystalline titanium dioxide. Applied Physics Letters 1998, 72, (6), 650-652. 231. Dong, W.; Wu, S.; Chen, D.; Jiang, X.; Zhu, C., Preparation of α-Fe2O3 Nanoparticles by Sol-Gel Process with Inorganic Iron Salt. Chemistry Letters 2000, 496-497. 232. Gordon, L. J.; Scott, R. L., Enhanced Solubility in Solvent Mixtures. I. The System Phenanthrene-Cyclohexane-Methylene Iodide. J Am Chem Soc 1952, 74, (16), 4138-4140. 233. Barton, A. F. M., CRC handbook of solubility parameters and other cohesion parameters. CRC Press: Boca Raton, Fla., 1983; p 594 p. 234. Allada, S. R., Solubility Parameters of Supercritical Fluids. Ind. Eng. Chem. Process Des. Dev. 1984, 23, 344-348. 235. Fried, J. R., Polymer science and technology. 2nd ed.; Prentice Hall Professional Technical Reference: Upper Saddle River, NJ, 2003; p xvii, 582 p. 236. Yu, D.; Qian, J.; Xue, N.; Zhang, D.; Wang, C.; Guo, X.; Ding, W.; Chen, Y., Mesoporous Nanotubes of Iron Phosphate: Synthesis, Characterization, and Catalytic Property. Langmuir 2007, 23, (2), 382-386. 237. Milosev.I; H.H, S.; B, N., Oxidation of Ternary TiZrN Hard Coatings Studied by XPS. Surface and Interface analysis 1998, 26, 242-248. 238. Jitianu, A.; Raileanu, M.; Crisan, M.; Predoi, D.; Jitianu, M.; Stanciu, L.; Zaharescu, M., Fe3O4–SiO2 nanocomposites obtained via alkoxide and colloidal route. Journal of Sol-Gel Science and Technology 2006, 40, (2-3), 317 - 323. 239. Kisch, H.; Sakthivel, S.; Janczarek, M.; Mitoraj, D., A low-band gap, Nitrogen-modified Titania Visible-Light Photocatalyst. J. phys. Chem. C 2007, 111, 11445-11449. 240. Zhu, J.; Ren, J.; Huo, Y.; Bian, Z.; Li, H., Nanocrystalline Fe/TiO2 Visible Photocatalyst with a Mesoporous Structure Prepared via a Nonhydrolytic Sol-Gel Route. J. Phys. Chem. C 2007, 111, (51), 18965-18969. 241. Zhang, Z.; Wang, C. C.; Zakaria, R.; Ying, J. Y., Role of Particle Size in Nanocrystalline TiO2-Based Photocatalysts. J. Phys. Chem. B 1998, 102, (52), 10871-10878. 242. Zhoua, M.; Yu, J.; Chenga, B., Effects of Fe-doping on the photocatalytic activity of mesoporous TiO2 powders prepared by an ultrasonic method. Journal of Hazardous Materials 2006, B137 1838–1847. 243. YASUTAKA, T.; YUTAKA, O., Manufacture of storage stable and uniform aqueous solutions containing titanium. Jpn. Kokai Tokkyo Koho 2001, 6. 244. Lucky, R. A.; Charpentier, P. A., Synthesis of Zr-Ti Binary metal oxide nanostructure via acid modified sol-gel route in scCO2.
227
245. Lucky, R. A.; Charpentier, P. A., Thermal Behavior of ZrO2 modified TiO2 Nanotubes Synthesized in scCO2. submitted. 246. Huo, Y.; Bian, Z.; Zhang, X.; Jin, Y.; Zhu, J.; Li, H., Highly Active TiO2-xNx Visible Photocatalyst Prepared by N-Doping in Et3N/EtOH Fluid under Supercritical Conditions. J. Phys. Chem. C 2008. 247. Chen, X.; Burda, C., Photoelectron Spectroscopic Investigation of Nitrogen-Doped Titania Nanoparticles. J. Phys. Chem. B 2004, 108 15446-15449. 248. Yang, J.; Bai, H.; Tan, X.; Lian, J., IR and XPS investigation of visible-light photocatalysis-Nitrogen-carbon-doped TiO2 film. Applied Surface Science 2006, 253, 1988-1994. 249. Diwald, O.; Thompson, T. L.; Goralski, E. G.; Walck, S. D.; Yates, J. T., The Effect of Nitrogen Ion Implantation on the Photoactivity of TiO2 Rutile Single Crystals. J. Phys. Chem. B 2004, 108, (1), 52-57. 250. Saha, N. C.; Tompkins, H. G., Titanium nitride oxidation chemistry: An x-ray photoelectron spectroscopy study. Journal of Applied Physics 1992, 72, (7), 3072. 251. Brunelle, J. P., Preparation of Catalysts by Metallic Complex Adsorption on Mineral Oxides'. Pure and Applied Chemistry 1978, 50, 1211-1229.
228
Appendices
Appendix 1. Copyright Permissions of Advanced Materials
We hereby grant permission for the requested use expected that due credit is
given to the original source. For material published before 2006 additionally: Please note
that the author's permission is also required.If material appears within our work with
credit to another source, authorisation from that source must be obtained. Credit must
include the following components: - Books: Author(s)/ Editor(s) Name(s): Title of the
Book. Page(s) Publication year. Copyright Wiley-VCH Verlag GmbH & Co. KGaA.
Reproduced with permission.- Journals: Author(s) Name(s): Title of the Article. Name of
the Journal.Publication year. Volume. Page(s). Copyright Wiley-VCH Verlag GmbH &
Co.KGaA. Reproduced with permission.
Appendix 2. Copyright Permissions of Acta Crystallographica Journals
If you wish to include material from your own article in a publication, prior
permission is not required, subject to the following conditions:
• Reproduction is intended in a primary journal, secondary journal, CD-ROM, book
or thesis.
• The original article in which the material appeared is cited.
• IUCr's copyright permission is indicated next to the Figure/Table in print. In
electronic form, this acknowledgement must be visible at the same time as the
Figure/Table, and must be hyperlinked to Crystallography Journals Online
(http://journals.iucr.org/).
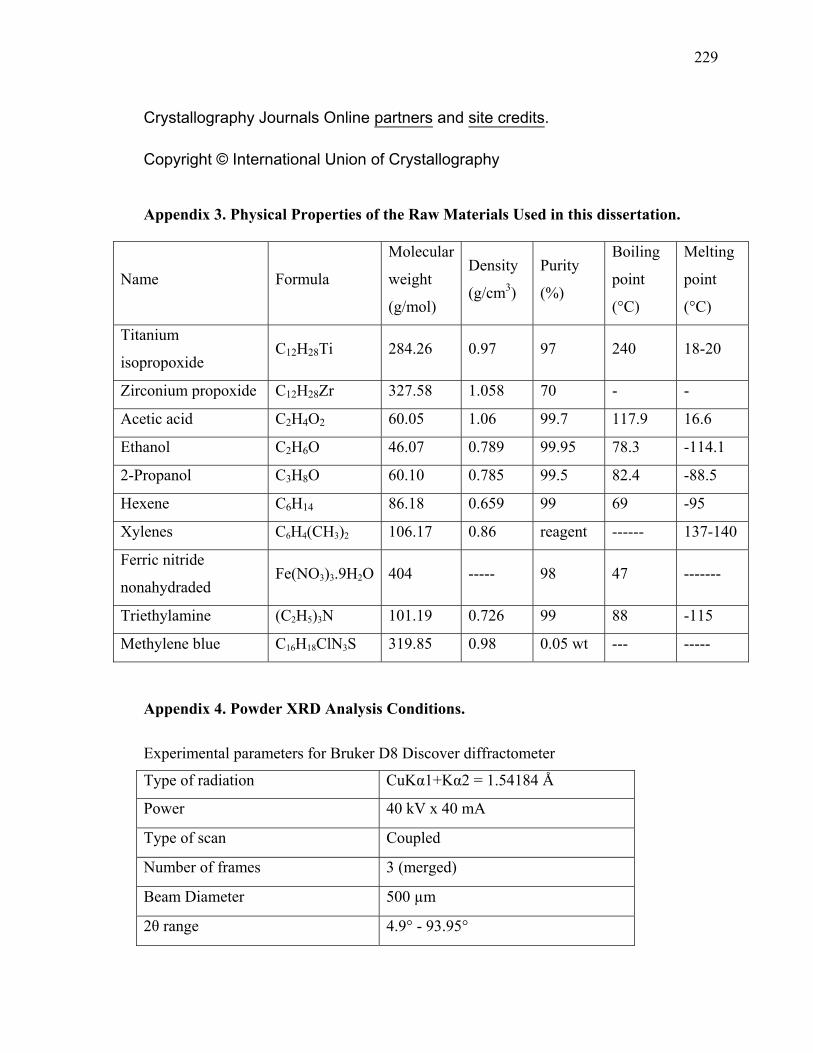
229
Crystallography Journals Online partners and site credits.
Copyright © International Union of Crystallography
Appendix 3. Physical Properties of the Raw Materials Used in this dissertation.
Name Formula
Molecular
weight
(g/mol)
Density
(g/cm3)
Purity
(%)
Boiling
point
(°C)
Melting
point
(°C)
Titanium
isopropoxide C12H28Ti 284.26 0.97 97 240 18-20
Zirconium propoxide C12H28Zr 327.58 1.058 70 - -
Acetic acid C2H4O2 60.05 1.06 99.7 117.9 16.6
Ethanol C2H6O 46.07 0.789 99.95 78.3 -114.1
2-Propanol C3H8O 60.10 0.785 99.5 82.4 -88.5
Hexene C6H14 86.18 0.659 99 69 -95
Xylenes C6H4(CH3)2 106.17 0.86 reagent ------ 137-140
Ferric nitride
nonahydraded Fe(NO3)3.9H2O 404 ----- 98 47 -------
Triethylamine (C2H5)3N 101.19 0.726 99 88 -115
Methylene blue C16H18ClN3S 319.85 0.98 0.05 wt --- -----
Appendix 4. Powder XRD Analysis Conditions.
Experimental parameters for Bruker D8 Discover diffractometer
Type of radiation CuKα1+Kα2 = 1.54184 Å
Power 40 kV x 40 mA
Type of scan Coupled
Number of frames 3 (merged)
Beam Diameter 500 µm
2θ range 4.9° - 93.95°

230
Experimental parameters for Rigaku (Rigaku - Geigerflex CN2029) diffractometer
Type of radiation CuKα1+Kα2 = 1.54184 Å
Power 40 kV x 35 mA
Type of scan Coupled
Step Size 0.05
Step Time 2sec
2θ range 2.0° - 115.0°
Appendix 5. Typical EDX spectrum for binary Zr-Ti nanomaterials
Figure A.1. A typical EDX spectrum for 20% Zr composition samples.
Appendix 6. Typical DSC curves for binary Zr-Ti nanomaterials at different heating
rate.
DSC curves for binary Zr-Ti nanomaterials at different heating rates provided in
Figure A.2 show two exothermic peaks representing phase transformations. Accoding to
the technical literature, the first and second peaks represent amorphous to anatase and
anatase to rutile transformations, respectively. Although the phase transformation

231
temperature strongly depends on the synthesis method, the amount of impurities present
and the heat treatment method, most of the reported values ranged ca. 300-450 oC for
anatase and 450-800 oC for the rutile transformation. The positions of the phase
transformation in this dissertation are within these ranges.
100 200 300 400 500 600Temperature (oC)
Hea
t Flo
w (W
/g)
a
b
c
Figure A.2: DSC curves for 10% ZrO2-TiO2 in air using heating rate (a) 5 oC/min, (b) 10 oC/min, and (c) 20 oC/min.
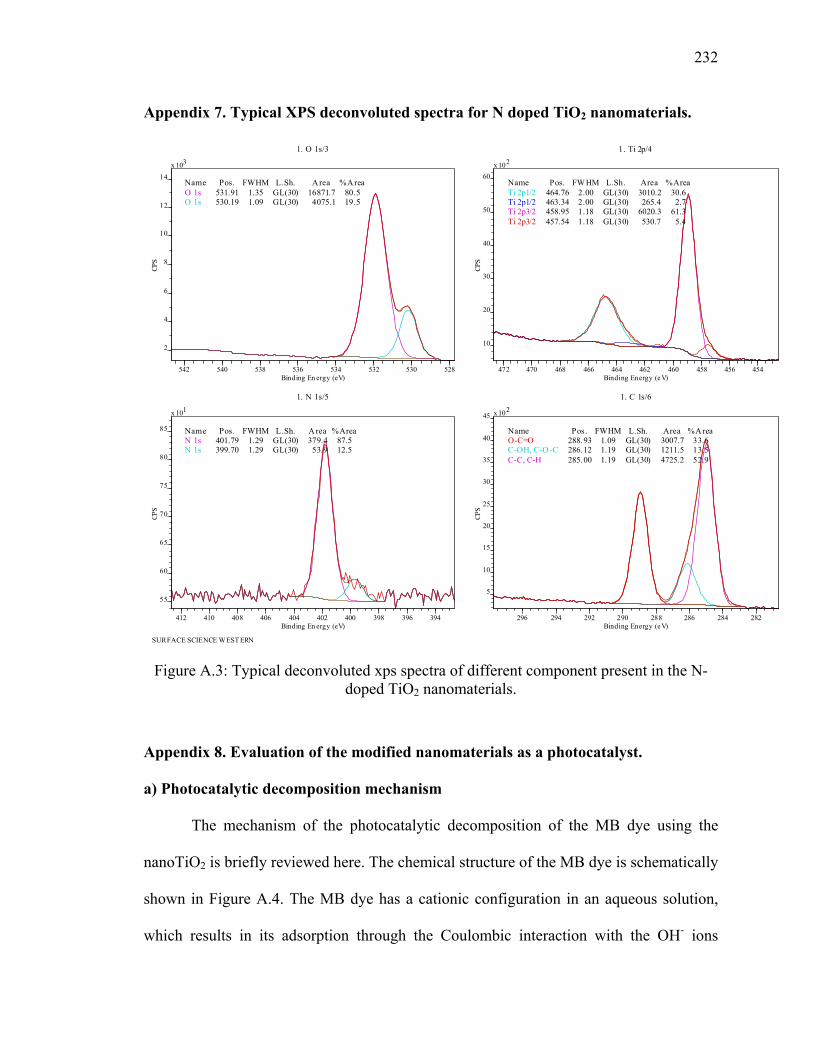
232
Appendix 7. Typical XPS deconvoluted spectra for N doped TiO2 nanomaterials.
Figure A.3: Typical deconvoluted xps spectra of different component present in the N-
doped TiO2 nanomaterials.
Appendix 8. Evaluation of the modified nanomaterials as a photocatalyst.
a) Photocatalytic decomposition mechanism
The mechanism of the photocatalytic decomposition of the MB dye using the
nanoTiO2 is briefly reviewed here. The chemical structure of the MB dye is schematically
shown in Figure A.4. The MB dye has a cationic configuration in an aqueous solution,
which results in its adsorption through the Coulombic interaction with the OH- ions
SURFACE SCIENCE WEST ERN
1. O 1s/3
NameO 1sO 1s
Pos.531.91530.19
FWHM1.351.09
L.Sh.GL(30)GL(30)
A rea16871.74075.1
%A rea80.519.5
x 103
2
4
6
8
10
12
14
CPS
542 540 538 536 534 532 530 528Binding En ergy (eV)
1. Ti 2p/4
NameTi 2p1/2Ti 2p1/2Ti 2p3/2Ti 2p3/2
Pos.464.76463.34458.95457.54
FWHM2.002.001.181.18
L.Sh.GL(30)GL(30)GL(30)GL(30)
Area3010.2265.4
6020.3530.7
%Area30.6
2.761.3
5.4
x 102
10
20
30
40
50
60
CPS
472 470 468 466 464 462 460 458 456 454Binding Energy (e V)
1. N 1s/5
NameN 1sN 1s
Pos.401.79399.70
FWHM1.291.29
L.Sh.GL(30)GL(30)
A rea379.453.9
%Area87.512.5
x 101
55
60
65
70
75
80
85
CPS
412 410 408 406 404 402 400 398 396 394Binding En ergy (eV)
1. C 1s/6
NameO-C=OC-OH, C-O -CC-C, C-H
Pos .288.93286.12285.00
FWHM1.091.191.19
L.Sh.GL(30)GL(30)GL(30)
Area3007.71211.54725.2
%A rea33.613.552.9
x 102
5
10
15
20
25
30
35
40
45
CPS
296 294 292 290 288 286 284 282Binding Energy (e V)

233
present on the surface of TiO2 nanocrystallites. As described schematically in section
2.11 in Figure 2.1, when the MB dye and TiO2 catalyst suspension is irradiated with the
UV radiation, the e-/h+ pair is created within the TiO2 nanocrystallites due to ejection of
an electron from the valence band into the conduction band, leaving behind a hole in the
valence band (charge-carrier generation). The generated holes may react with the surface-
adsorbed OH- ions forming the ·OH radicals. The ·OH radicals may also be formed by the
reaction of dissolved oxygen (O2) with the generated electrons and the protons forming
the hydrogen peroxide (H2O2) as an intermediate product, which subsequently gets
decomposed to the OH radical by releasing the OH ion into the aqueous solution. The
overall reaction may be summarized as the interfacial charge transfer radicals thus
formed are mainly responsible for the degradation of the MB dye through its successive
attacks via formation of several intermediate products.
Figure A.4: Chemical structure of methylene blue.21
The overall reaction, which results in the decomposition of the MB dye into
carbon dioxide (CO2), nitrate (NO3-) ions, sulfate (SO4
-) ions, protons, and water. The
efficacy of the above mechanism in decomposing the MB dye depends on the
effectiveness of the photocatalytic process in transferring the photoinduced e-/h+ pair
from the particle volume to the particle surface, and subsequently to the surface-adsorbed

234
species. The generated e-/h+ pair, hence, must migrate to the particle surface as a
separate entity; however, if the TiO2 nanocrystallite size is relatively larger, which
increases the travel distance for the e-/h+ pair, then they may recombine within the
particle volume before reaching the particle surface (volume charge-carrier
recombination).
b) Photodegradation Kinetics
When a semiconductor catalyst is illuminated with photons whose energy is equal
to or greater than the band-gap energy, the semiconductor absorbs these photons,
resulting in creation of electron-hole pairs, which dissociate into free electrons in the
conduction band and holes in the valence band. Simultaneously, in the presence of a fluid
phase (gas or liquid), spontaneous adsorption occurs and according to the redox potential
of each adsorbate, an electron transfer proceeds towards acceptor molecules, whereas a
positive hole is transferred to a donor molecule.
Each ion formed subsequently reacts to form the intermediates and final products.
As a consequence of reactions, the photonic excitation of the catalyst appears as the
initial step of the activation of the whole catalytic system. The photon energy is adapted
to the absorption by the catalyst, not to that of the reactants. The activation of the process
goes through the excitation of the solid but not through that of the reactants. Hence, there
is no photochemical process in the adsorbed phase but only a true heterogeneous
photocatalytic regime as demonstrated further. As for classical heterogeneous catalysis,
the overall process can be decomposed into five independent steps:
I. Transfer of the reactants in the fluid phase to the surface.
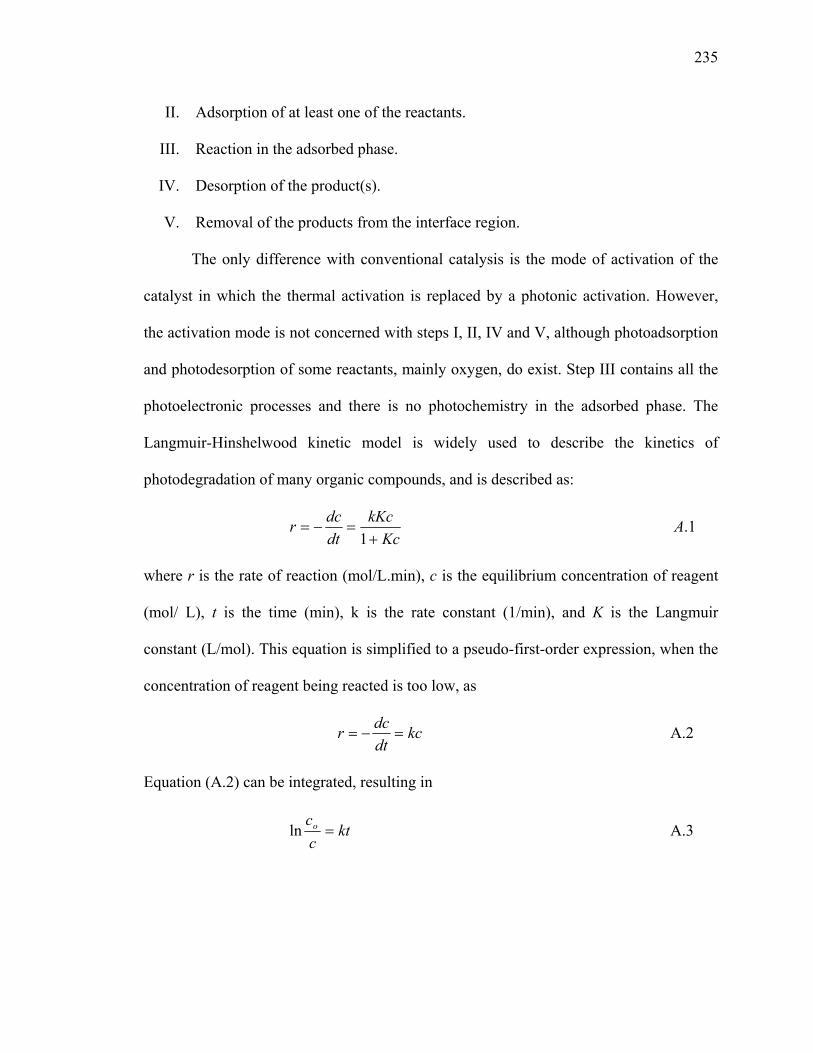
235
II. Adsorption of at least one of the reactants.
III. Reaction in the adsorbed phase.
IV. Desorption of the product(s).
V. Removal of the products from the interface region.
The only difference with conventional catalysis is the mode of activation of the
catalyst in which the thermal activation is replaced by a photonic activation. However,
the activation mode is not concerned with steps I, II, IV and V, although photoadsorption
and photodesorption of some reactants, mainly oxygen, do exist. Step III contains all the
photoelectronic processes and there is no photochemistry in the adsorbed phase. The
Langmuir-Hinshelwood kinetic model is widely used to describe the kinetics of
photodegradation of many organic compounds, and is described as:
KckKc
dtdcr
+=−=
1 A.1
where r is the rate of reaction (mol/L.min), c is the equilibrium concentration of reagent
(mol/ L), t is the time (min), k is the rate constant (1/min), and K is the Langmuir
constant (L/mol). This equation is simplified to a pseudo-first-order expression, when the
concentration of reagent being reacted is too low, as
kcdtdcr =−= A.2
Equation (A.2) can be integrated, resulting in
ktcco =ln A.3
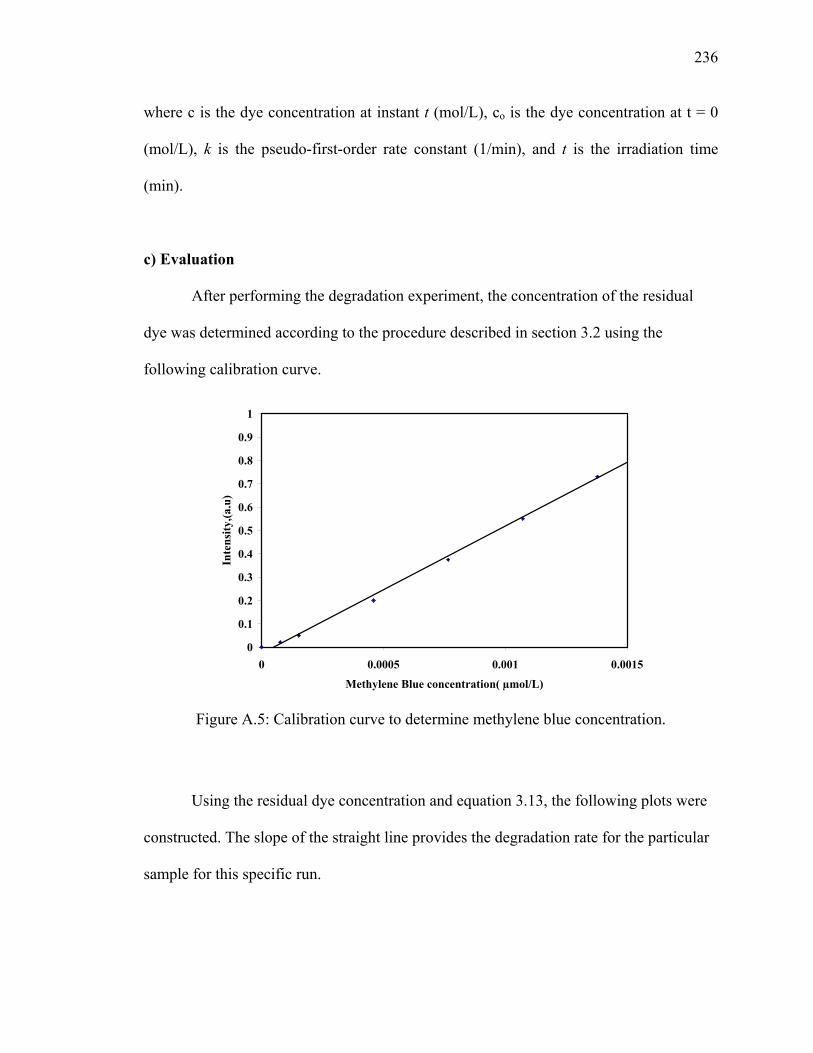
236
where c is the dye concentration at instant t (mol/L), co is the dye concentration at t = 0
(mol/L), k is the pseudo-first-order rate constant (1/min), and t is the irradiation time
(min).
c) Evaluation
After performing the degradation experiment, the concentration of the residual
dye was determined according to the procedure described in section 3.2 using the
following calibration curve.
0
0.1
0.2
0.3
0.4
0.5
0.6
0.7
0.8
0.9
1
0 0.0005 0.001 0.0015
Methylene Blue concentration( µmol/L)
Inte
nsity
,(a.u
)
Figure A.5: Calibration curve to determine methylene blue concentration.
Using the residual dye concentration and equation 3.13, the following plots were
constructed. The slope of the straight line provides the degradation rate for the particular
sample for this specific run.
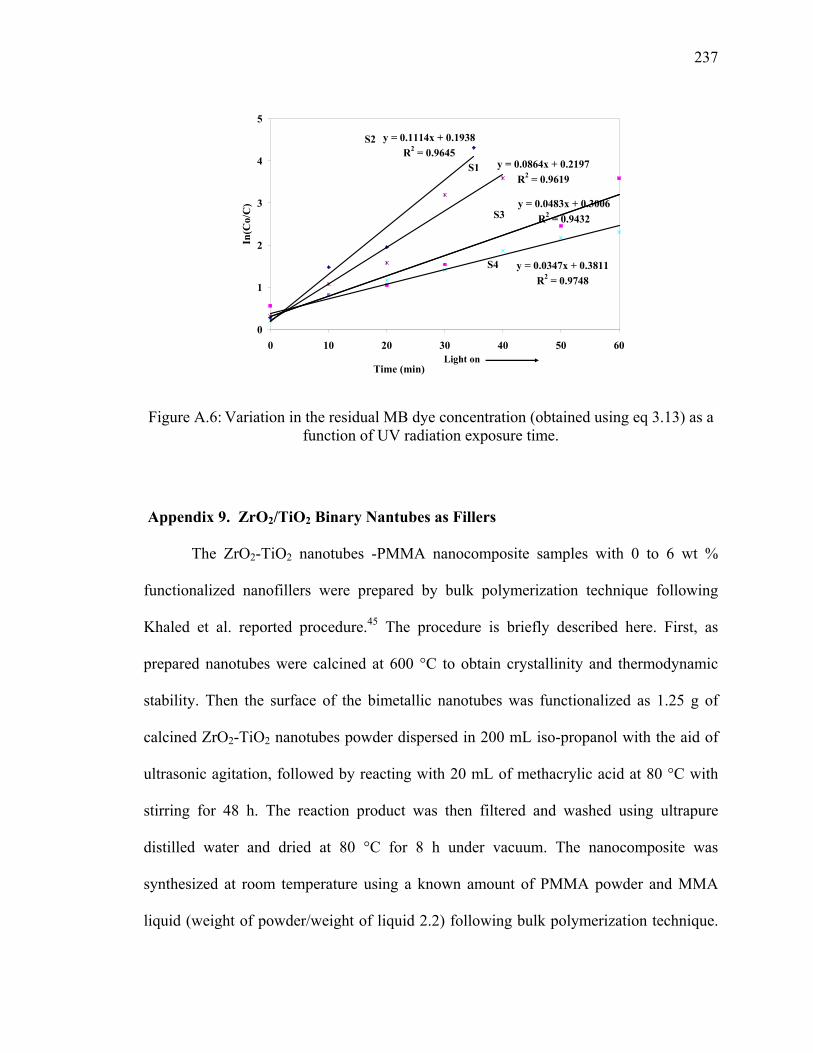
237
y = 0.0483x + 0.3006R2 = 0.9432
y = 0.0347x + 0.3811R2 = 0.9748
y = 0.0864x + 0.2197R2 = 0.9619
y = 0.1114x + 0.1938R2 = 0.9645
0
1
2
3
4
5
0 10 20 30 40 50 60
Time (min)
In(C
o/C
)
Light on
S2
S1
S3
S4
Figure A.6: Variation in the residual MB dye concentration (obtained using eq 3.13) as a function of UV radiation exposure time.
Appendix 9. ZrO2/TiO2 Binary Nantubes as Fillers
The ZrO2-TiO2 nanotubes -PMMA nanocomposite samples with 0 to 6 wt %
functionalized nanofillers were prepared by bulk polymerization technique following
Khaled et al. reported procedure.45 The procedure is briefly described here. First, as
prepared nanotubes were calcined at 600 °C to obtain crystallinity and thermodynamic
stability. Then the surface of the bimetallic nanotubes was functionalized as 1.25 g of
calcined ZrO2-TiO2 nanotubes powder dispersed in 200 mL iso-propanol with the aid of
ultrasonic agitation, followed by reacting with 20 mL of methacrylic acid at 80 °C with
stirring for 48 h. The reaction product was then filtered and washed using ultrapure
distilled water and dried at 80 °C for 8 h under vacuum. The nanocomposite was
synthesized at room temperature using a known amount of PMMA powder and MMA
liquid (weight of powder/weight of liquid 2.2) following bulk polymerization technique.

238
The powder portion contained 99.2 wt % PMMA beads (57.7 nm) and 0.8 wt % BPO.
The liquid portion contained MMA (95.9 wt %), a dimethacrylate cross-linker (4 wt %),
and an activator (0.1 wt %) for room-temperature initiator decomposition. After that, the
dynamic Young’s moduli and shear moduli for each specimen was evaluated by means of
an ultrasonic technique using a pulse/function generator (811A 20MHzHewlett-Packard),
a storage oscilloscope (60 MHz V-665 Hitachi), and lithium niobate piezoelectric crystals
at 20-MHz resonant frequency for transmitting and receiving the ultrasonic signals.
5.6
5.8
6
6.2
6.4
6.6
6.8
7
1 2 3 4 5 6 7Nanotubes Content (wt%)
Dyn
amic
You
ng's
Mod
ulus
(GPa
) (a)
2
2.2
2.4
2.6
2.8
1 2 3 4 5 6 7
Nanotubes Content (wt%)
Dyn
amic
She
ar M
odul
us (G
Pa)
(b)
Figure A.7: Mechanical properties of (a) dynamic Young’s modulus and (b) dynamic Shear modulus versus weight percentage of the ZrO2-TiO2 Nanotubes.
The dynamic Young’s and Shear moduli for the prepared nanocomposite with
various wt% nanofillers is provided in Figure A.7. It can be seen that both moduli
increase with nanofiller’s wt%. The dynamic Young’s modulus ranged from 5.97 to 6.57
GPa and shear modulus varies from 2.24 to 2.47 GPa with changing the wt% of
nanofillers from 2 to 6%. The mechanical properties of the nanocomposites strongly
depend on the ability to transfer the external load between the reinforcing nanofiller

239
phase and the matrix. It is already reported that functionalization resulting the chemical
bonding between the nanofiller and the PMMA matrix produced significantly higher
values of elastic moduli. In addition, high interfacial surface area has positive effects on
increasing the mechanical properties by enhancing adhesion between the nanofiller and
polymer matrix. Hence, in this study functionalized binary nanotubes with high surface
area (80 m2/g) show high elastic moduli, which is promising for potential bone cement
application. In addition, it is anticipated that ZrO2-TiO2 binary nanotubes will provide
better radioopacity compared to TiO2 nanomaterials. As ZrO2 is better radioopacifier and
is used in commercial bone cement. Future investigations will focus further developing
this area.
240
CURRICULAM VITA
Name: Place of Birth Post-Secondary Education and Degrees: Related Work Experience:
Rahima Akter Lucky Farid pur, Bangladesh Bangladesh University of Engineering and Technology (BUET) Dhaka, Bangladesh 1991-1996 B.Sc. in Chemical Engineering Bangladesh University of Engineering and Technology (BUET) Dhaka, Bangladesh 1997-1999 M.Sc. in Chemical Engineering The University of Western Ontario London, Ontario, Canada 2004-2008 Ph.D. in Chemical Engineering Dec. 1996 to Dec. 1999 Lecturer Jan. 2000 to Oct. 2001 Assistant Professor Department of Chemical Engineering Bangladesh University of Engineering and Technology (BUET) Teaching Assistant The University of Western Ontario 2004-2008
List of Publications: PUBLICATIONS: Lucky, R. A.; Charpentier, P. A., A one-step approach to the synthesis of ZrO2 modified TiO2 nanotubes in supercritical carbon dioxide. Advanced Materials. 2008, 20(9), 1755-1759. Lucky, R. A.; Sui, R.; Charpentier, P. A.; Jennings, M. C., Decakis(µ2-acetato-κ2 O:O')bis(µ2-isopropoxy- κ2 O:O) tetraisopropoxytetra- µ3-oxo-tetratitaniumdizirconium Acta Cryst., E 2007, 63, m2429–m2430.

241
Lucky, R. A.; Charpentier, P. A., Thermal Behavior of ZrO2 modified TiO2 Nanotubes Synthesized in scCO2. ( In preparation) Lucky, R. A.; Charpentier, P. A., Effects of solvent in one-pot synthesis of ZrO2-TiO2 nanomaterials via acid modified sol-gel process. (In preparation) Lucky, R. A.; Charpentier, P. A., Synthesis of Zr-Ti Binary metal oxide nanostructure via acid modified sol-gel route in scCO2. (In preparation) Lucky, R. A.; Charpentier, P. A., Zr Modified N doped TiO2 nanostructured materials by a surfactant free Sol-Gel process in supercritical CO2 for solar energy applications. (In preparation) Lucky, R. A.; Charpentier, P. A., Effects of the Process Variables on the10% ZrO2 modified TiO2 nanotubes synthesis in supercritical CO2. (In preparation) CONFERENCE PROCEEDINGS: Lucky, R. A.; Paul A. Charpentier, N-doped TiO2 Nanostructure via Sol-gel Route in Supercritical CO2. 20th Canadian Symposium on Catalysis, Kingston, Canada. 2008 Lucky, R. A.; Paul A. Charpentier, Synthesis and Characterization of Fe doped TiO2 nanomaterials in scCO2. ACSAICHE Joint spring meeting, New Orleans, LA, 2008 Lucky, R. A.; Paul A. Charpentier, ZrO2 modified N-doped TiO2 nanomaterials from scCO2. AICHE annual meeting, salt lake city, Utha, 2007 Lucky, R. A.; Charpentier, P. A., Ti-Zr binary metal oxide nanomaterials in scCO2.- Nanoforum, Waterloo, Canada, 2007