Embed Size (px)
Citation preview
Radionuclide Geochemical Modelingfor the Clive DU PA
28 May 2011
Prepared by
Neptune and Company, Inc.
Radionuclide Geochemical Modeling for the Clive DU PA 28 May 2011
This page is intentionally blank, aside from this statement.
Geochemical Modeling ii
Radionuclide Geochemical Modeling for the Clive DU PA 28 May 2011
CONTENTS FIGURES.......................................................................................................................................v
TABLES.......................................................................................................................................vi
1.0 Summary of Solubility, Partitioning (Kd), and Diffusion Parameters...................................1
2.0 Geochemical Conditions...........................................................................................................22.1 Hydrostratigraphic Units..................................................................................................42.2 Shallow Unconfined Aquifer...........................................................................................5
3.0 Method for Estimating Distributions for Solubility and Partitioning Parameters....................7
4.0 Solid/Water Partition Coefficients (Kd)...................................................................................94.1 Partitioning by Element.................................................................................................11
4.1.1 Actinium............................................................................................................114.1.2 Americium.........................................................................................................114.1.3 Cesium...............................................................................................................114.1.4 Iodine.................................................................................................................124.1.5 Lead....................................................................................................................124.1.6 Neptunium..........................................................................................................134.1.7 Plutonium...........................................................................................................134.1.8 Protactinium.......................................................................................................144.1.9 Radium...............................................................................................................144.1.10 Strontium.........................................................................................................144.1.11 Technetium......................................................................................................154.1.12 Thorium............................................................................................................154.1.13 Uranium...........................................................................................................15
5.0 Element and Species Solubility ..............................................................................................165.1 Solubility by element.....................................................................................................19
5.1.1 Actinium............................................................................................................195.1.2 Americium.........................................................................................................195.1.3 Cesium...............................................................................................................195.1.4 Iodine.................................................................................................................195.1.5 Lead....................................................................................................................195.1.6 Neptunium..........................................................................................................195.1.7 Plutonium...........................................................................................................205.1.8 Protactinium.......................................................................................................205.1.9 Radium...............................................................................................................205.1.10 Radon...............................................................................................................205.1.11 Strontium.........................................................................................................215.1.12 Technetium......................................................................................................215.1.13 Thorium............................................................................................................215.1.14 Uranium ..........................................................................................................21
5.1.14.1 Uranium Forms and Geochemical Model Parameters......................21
Geochemical Modeling iii
Radionuclide Geochemical Modeling for the Clive DU PA 28 May 2011
5.1.14.2 Uranium Solubilities based on Schoepite.........................................245.1.14.3 Uranium Solubilities based on U3O8...............................................26
6.0 Ionic and Molecular Diffusion Coefficients...........................................................................26
7.0 References...............................................................................................................................29
Geochemical Modeling iv
Radionuclide Geochemical Modeling for the Clive DU PA 28 May 2011
FIGURES
Figure 1: Example of probability distribution function for log-uniform distribution. Value for Kd of Ac in silt with a range of values from 15.7 to 1,910 mL/g. ...............................................8
Figure 2: Distribution of Kd values for I in sand. Values less than 0 are set equal to zero............9
Geochemical Modeling v
Radionuclide Geochemical Modeling for the Clive DU PA 28 May 2011
TABLES
Table 1: Distribution Parameters for Partitioning Coefficients (Kd) for materials (mL/g). Unless noted otherwise, distributions are described by the log uniform distribution. .......................1
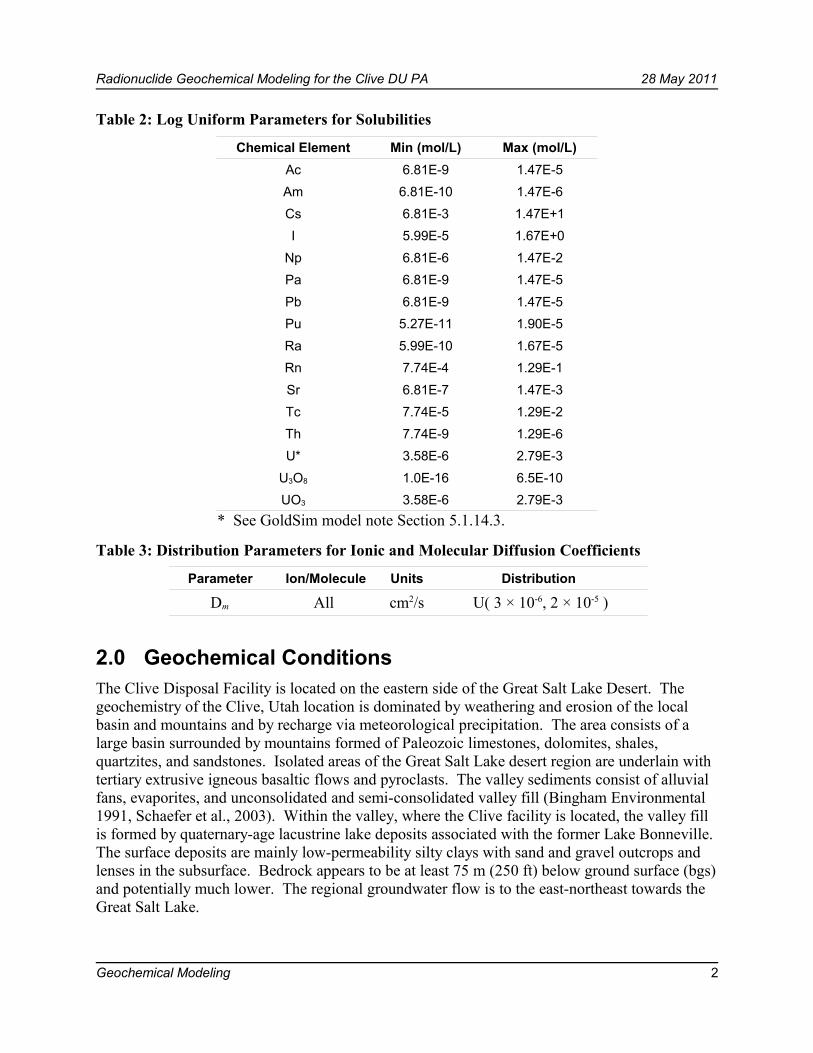
Table 2: Log Uniform Parameters for Solubilities...........................................................................2
Table 3: Distribution Parameters for Ionic and Molecular Diffusion Coefficients.........................2
Table 4: Soil and Mineralogy within the Four Hydrostratigraphic Units........................................5
Table 5: Geochemical parameter ranges from Groundwater Wells at Clive, Utah..........................6
Table 6: Ion Concentrations from GW Wells Surrounding the Waste Cell ...................................6
Table 7: Model Results for High TDS System analogous to the Upper Aquifer. Uranium solubility limit based on Schoepite*.....................................................................................24
Table 8: Total uranium, low TDS (ionic strength 0.127 M). Uranium solubility limit based on schoepite...............................................................................................................................25
Table 9: Major dissolved uranium species included in geochemical models. ..............................25
Table 10: Total Uranium, low TDS (ionic strength 0.127 M). Uranium solubility limit based on the mineral U3O8*................................................................................................................26
Table 11. Diffusion coefficients for selected cations and anions...................................................28
Geochemical Modeling vi
Radionuclide Geochemical Modeling for the Clive DU PA 28 May 2011
1.0 Summary of Solubility, Partitioning (Kd), and Diffusion Parameters
This section is a brief summary of parameters and distributions used for modeling geochemical processes for the Clive Depleted Uranium Performance Assessment Model. For distributions, the following notation is used:
• N( μ, σ, [min, max] ) represents a normal distribution with mean μ and standard deviation σ, and optional truncation at the specified minimum and maximum, and
• LN( GM, GSD, [min, max] ) represents a log-normal distribution with geometric mean.
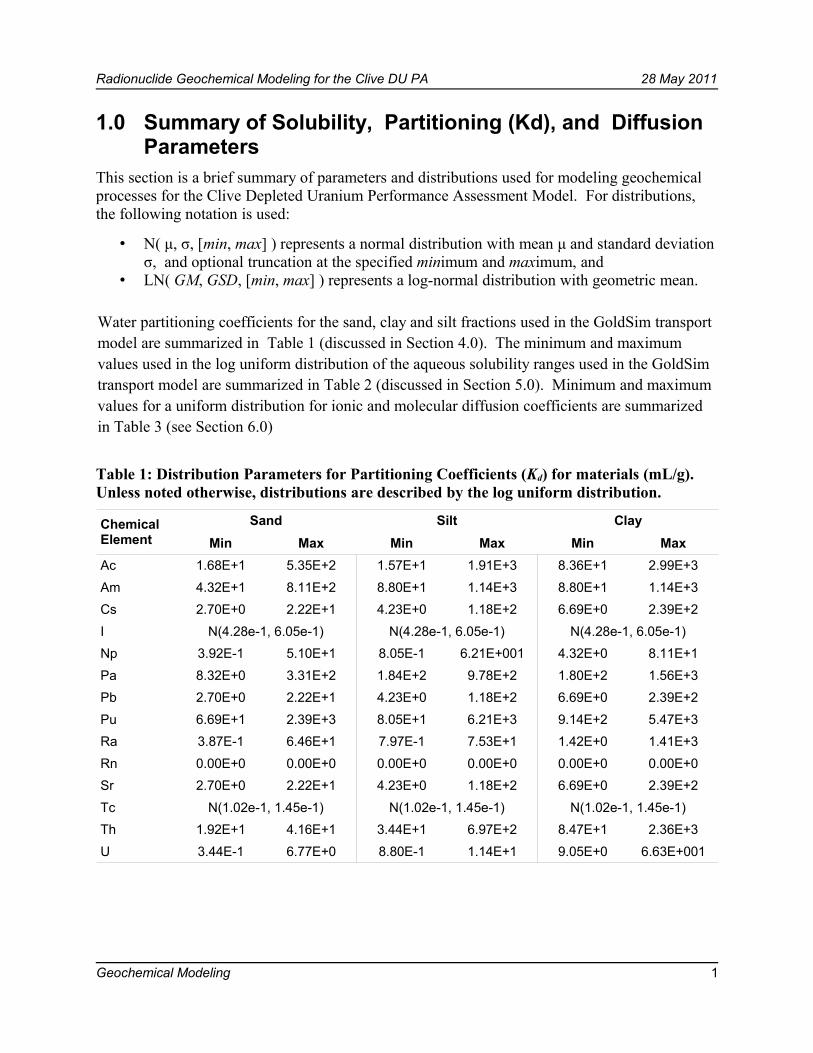
Water partitioning coefficients for the sand, clay and silt fractions used in the GoldSim transport model are summarized in Table 1 (discussed in Section 4.0). The minimum and maximum values used in the log uniform distribution of the aqueous solubility ranges used in the GoldSim transport model are summarized in Table 2 (discussed in Section 5.0). Minimum and maximum values for a uniform distribution for ionic and molecular diffusion coefficients are summarized in Table 3 (see Section 6.0)
Table 1: Distribution Parameters for Partitioning Coefficients (Kd) for materials (mL/g). Unless noted otherwise, distributions are described by the log uniform distribution.
Chemical Element
Sand Silt ClayMin Max Min Max Min Max
Ac 1.68E+1 5.35E+2 1.57E+1 1.91E+3 8.36E+1 2.99E+3Am 4.32E+1 8.11E+2 8.80E+1 1.14E+3 8.80E+1 1.14E+3Cs 2.70E+0 2.22E+1 4.23E+0 1.18E+2 6.69E+0 2.39E+2I N(4.28e-1, 6.05e-1) N(4.28e-1, 6.05e-1) N(4.28e-1, 6.05e-1)Np 3.92E-1 5.10E+1 8.05E-1 6.21E+001 4.32E+0 8.11E+1Pa 8.32E+0 3.31E+2 1.84E+2 9.78E+2 1.80E+2 1.56E+3Pb 2.70E+0 2.22E+1 4.23E+0 1.18E+2 6.69E+0 2.39E+2Pu 6.69E+1 2.39E+3 8.05E+1 6.21E+3 9.14E+2 5.47E+3Ra 3.87E-1 6.46E+1 7.97E-1 7.53E+1 1.42E+0 1.41E+3Rn 0.00E+0 0.00E+0 0.00E+0 0.00E+0 0.00E+0 0.00E+0Sr 2.70E+0 2.22E+1 4.23E+0 1.18E+2 6.69E+0 2.39E+2Tc N(1.02e-1, 1.45e-1) N(1.02e-1, 1.45e-1) N(1.02e-1, 1.45e-1)Th 1.92E+1 4.16E+1 3.44E+1 6.97E+2 8.47E+1 2.36E+3U 3.44E-1 6.77E+0 8.80E-1 1.14E+1 9.05E+0 6.63E+001
Geochemical Modeling 1
Radionuclide Geochemical Modeling for the Clive DU PA 28 May 2011
Table 2: Log Uniform Parameters for Solubilities
Chemical Element Min (mol/L) Max (mol/L)Ac 6.81E-9 1.47E-5Am 6.81E-10 1.47E-6Cs 6.81E-3 1.47E+1I 5.99E-5 1.67E+0
Np 6.81E-6 1.47E-2Pa 6.81E-9 1.47E-5Pb 6.81E-9 1.47E-5Pu 5.27E-11 1.90E-5Ra 5.99E-10 1.67E-5Rn 7.74E-4 1.29E-1Sr 6.81E-7 1.47E-3Tc 7.74E-5 1.29E-2Th 7.74E-9 1.29E-6U* 3.58E-6 2.79E-3
U3O8 1.0E-16 6.5E-10UO3 3.58E-6 2.79E-3
* See GoldSim model note Section 5.1.14.3.
Table 3: Distribution Parameters for Ionic and Molecular Diffusion Coefficients
Parameter Ion/Molecule Units Distribution
Dm All cm2/s U( 3 × 10⁻⁶, 2 × 10⁻⁵ )
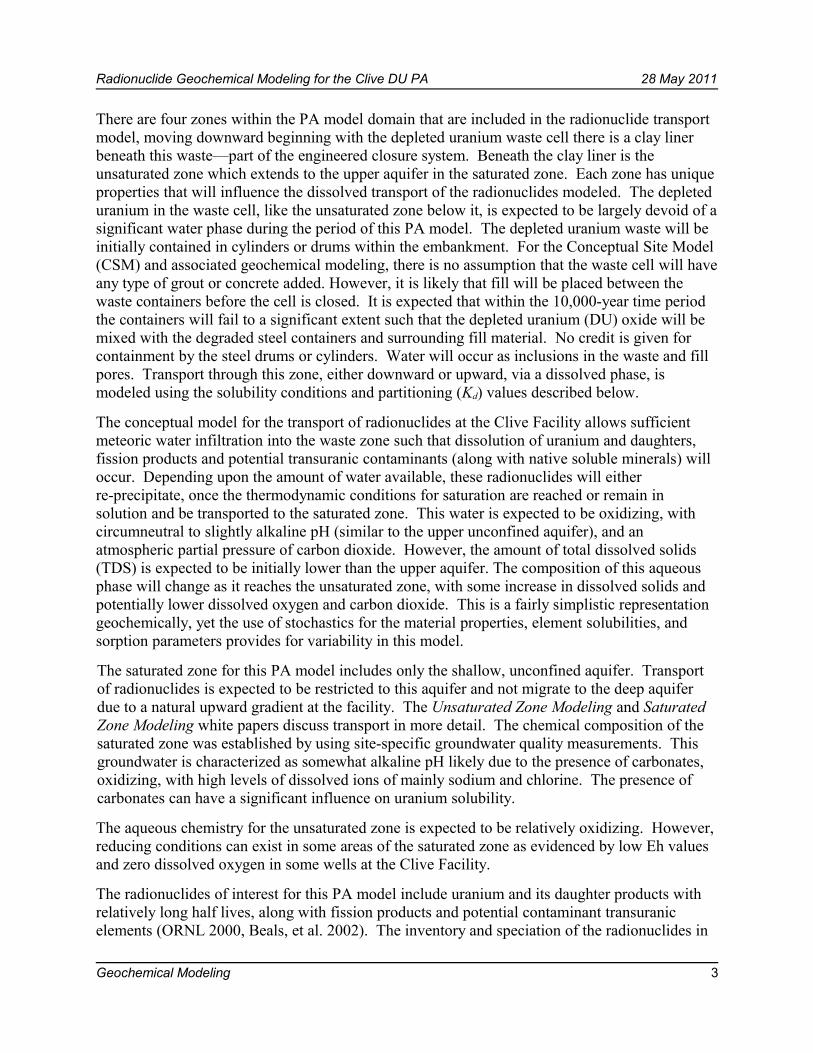
2.0 Geochemical ConditionsThe Clive Disposal Facility is located on the eastern side of the Great Salt Lake Desert. The geochemistry of the Clive, Utah location is dominated by weathering and erosion of the local basin and mountains and by recharge via meteorological precipitation. The area consists of a large basin surrounded by mountains formed of Paleozoic limestones, dolomites, shales, quartzites, and sandstones. Isolated areas of the Great Salt Lake desert region are underlain with tertiary extrusive igneous basaltic flows and pyroclasts. The valley sediments consist of alluvial fans, evaporites, and unconsolidated and semi-consolidated valley fill (Bingham Environmental 1991, Schaefer et al., 2003). Within the valley, where the Clive facility is located, the valley fill is formed by quaternary-age lacustrine lake deposits associated with the former Lake Bonneville. The surface deposits are mainly low-permeability silty clays with sand and gravel outcrops and lenses in the subsurface. Bedrock appears to be at least 75 m (250 ft) below ground surface (bgs) and potentially much lower. The regional groundwater flow is to the east-northeast towards the Great Salt Lake.
Geochemical Modeling 2
Radionuclide Geochemical Modeling for the Clive DU PA 28 May 2011
There are four zones within the PA model domain that are included in the radionuclide transport model, moving downward beginning with the depleted uranium waste cell there is a clay liner beneath this waste—part of the engineered closure system. Beneath the clay liner is the unsaturated zone which extends to the upper aquifer in the saturated zone. Each zone has unique properties that will influence the dissolved transport of the radionuclides modeled. The depleted uranium in the waste cell, like the unsaturated zone below it, is expected to be largely devoid of a significant water phase during the period of this PA model. The depleted uranium waste will be initially contained in cylinders or drums within the embankment. For the Conceptual Site Model (CSM) and associated geochemical modeling, there is no assumption that the waste cell will have any type of grout or concrete added. However, it is likely that fill will be placed between the waste containers before the cell is closed. It is expected that within the 10,000-year time period the containers will fail to a significant extent such that the depleted uranium (DU) oxide will be mixed with the degraded steel containers and surrounding fill material. No credit is given for containment by the steel drums or cylinders. Water will occur as inclusions in the waste and fill pores. Transport through this zone, either downward or upward, via a dissolved phase, is modeled using the solubility conditions and partitioning (Kd) values described below.
The conceptual model for the transport of radionuclides at the Clive Facility allows sufficient meteoric water infiltration into the waste zone such that dissolution of uranium and daughters, fission products and potential transuranic contaminants (along with native soluble minerals) will occur. Depending upon the amount of water available, these radionuclides will either re-precipitate, once the thermodynamic conditions for saturation are reached or remain in solution and be transported to the saturated zone. This water is expected to be oxidizing, with circumneutral to slightly alkaline pH (similar to the upper unconfined aquifer), and an atmospheric partial pressure of carbon dioxide. However, the amount of total dissolved solids (TDS) is expected to be initially lower than the upper aquifer. The composition of this aqueous phase will change as it reaches the unsaturated zone, with some increase in dissolved solids and potentially lower dissolved oxygen and carbon dioxide. This is a fairly simplistic representation geochemically, yet the use of stochastics for the material properties, element solubilities, and sorption parameters provides for variability in this model.
The saturated zone for this PA model includes only the shallow, unconfined aquifer. Transport of radionuclides is expected to be restricted to this aquifer and not migrate to the deep aquifer due to a natural upward gradient at the facility. The Unsaturated Zone Modeling and Saturated Zone Modeling white papers discuss transport in more detail. The chemical composition of the saturated zone was established by using site-specific groundwater quality measurements. This groundwater is characterized as somewhat alkaline pH likely due to the presence of carbonates, oxidizing, with high levels of dissolved ions of mainly sodium and chlorine. The presence of carbonates can have a significant influence on uranium solubility.
The aqueous chemistry for the unsaturated zone is expected to be relatively oxidizing. However, reducing conditions can exist in some areas of the saturated zone as evidenced by low Eh values and zero dissolved oxygen in some wells at the Clive Facility.
The radionuclides of interest for this PA model include uranium and its daughter products with relatively long half lives, along with fission products and potential contaminant transuranic elements (ORNL 2000, Beals, et al. 2002). The inventory and speciation of the radionuclides in
Geochemical Modeling 3
Radionuclide Geochemical Modeling for the Clive DU PA 28 May 2011
the waste layer will determine the source term. The total inventory and uranium oxide waste forms are described in a separate white paper (Waste Inventory).
The three major types of chemical reactions that affect water composition include dissolution and precipitation, ion-exchange and sorption, occurring as gas-phase and aqueous reactions. Precipitation and dissolution are the major reactions between the solid and aqueous phases. When the dissolved concentration of a radionuclide exceeds the solubility limit for any possible mineral form, the solid phase will theoretically precipitate and control the maximum concentration. Precipitation and dissolution are governed by thermodynamic and kinetic considerations that include water temperature, redox conditions, concentration (activity) of dissolved constituents, pH, and partial pressure of gases including carbon dioxide. The rate of dissolution (kinetics) is not considered in the PA model. Due to the ratio of dissolution rate to the time frame of interest for contaminant transport (10,000 years), it is assumed that any dissolution is instantaneous within this time frame. Ionic strength is also a critical parameter, especially in waters with high dissolved solids, as activity is influenced by this parameter. The thermodynamic activity of a dissolved species is the product of its actual concentration and activity coefficient. For dilute systems, the activity is close to unity but will deviate substantially at high ionic concentrations. Under equilibrium conditions, the composition of the aqueous phase within each zone will react with the surrounding solid phases to establish the chemistry that will define the radionuclide solubilities discussed in Section 5.0. Sorption at the solid-solution interface is also important in transport modeling and is discussed in Section 4.0.
By definition, isotopes behave identically from a chemical standpoint. As such, both solubility and sorption parameters are treated as equal for each isotope of a single element. For example, uranium-234, -235 and -238, is isotopes, are given equal solubility and sorption constraints, competing for sorption sites and for aqueous solubility.
2.1 Hydrostratigraphic UnitsSediments at the Clive site are divided into four hydrostratigraphic units within the unsaturated and saturated zones (Table 4 ) . Unit 4 is the uppermost unit, with Unit 1 beginning approximately 12 to 14 m (40 to 45 feet) bgs (Envirocare 2004).
The Unit 4 soils have cation exchange capacity (CEC) values in the range of 10 to 20 meq/100 g (USDA, 2009). These values were used qualitatively in the derivation of sorption parameters described below.
The waste zone will contain two forms of depleted uranium oxide: UO3 produced from the Savannah River Site (SRS) and other DOE facilities, and what is predominantly U3O8 from the gaseous diffusion plants (GDPs). In both cases the waste will be initially stored in steel cylinders and drums that are assumed to be backfilled with Unit 3 soils.
Geochemical Modeling 4
Radionuclide Geochemical Modeling for the Clive DU PA 28 May 2011
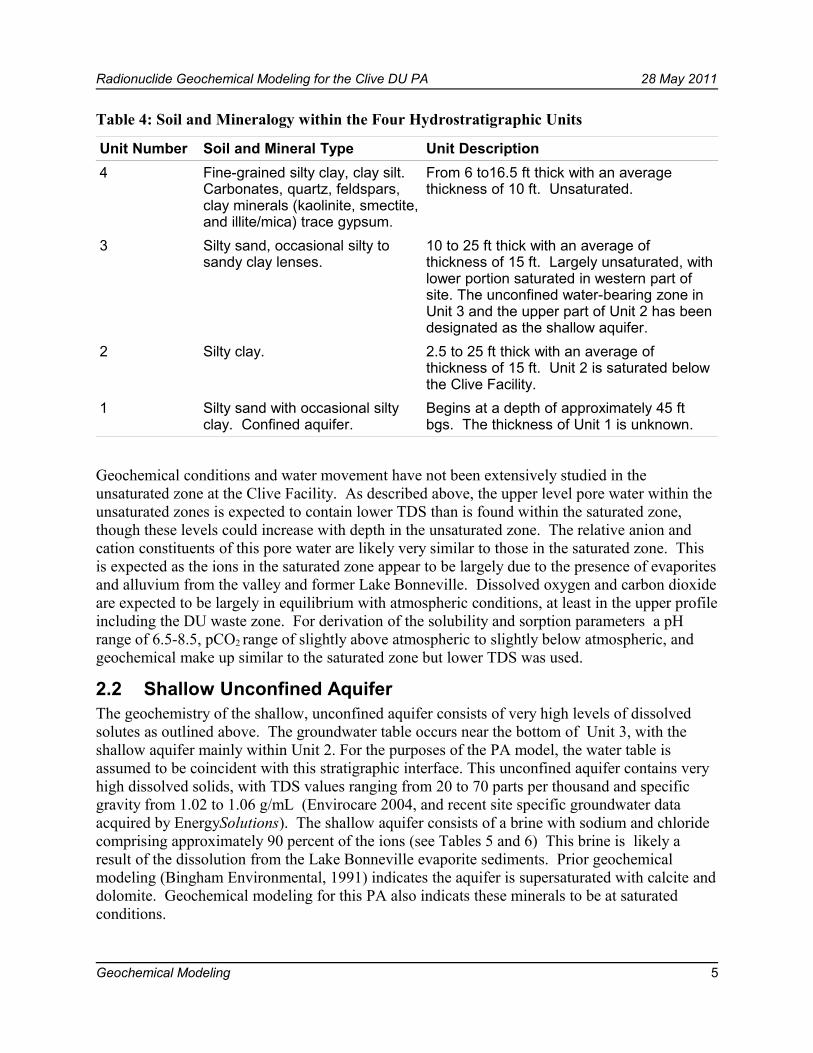
Table 4: Soil and Mineralogy within the Four Hydrostratigraphic Units
Unit Number Soil and Mineral Type Unit Description4 Fine-grained silty clay, clay silt.
Carbonates, quartz, feldspars, clay minerals (kaolinite, smectite, and illite/mica) trace gypsum.
From 6 to16.5 ft thick with an average thickness of 10 ft. Unsaturated.
3 Silty sand, occasional silty to sandy clay lenses.
10 to 25 ft thick with an average of thickness of 15 ft. Largely unsaturated, with lower portion saturated in western part of site. The unconfined water-bearing zone in Unit 3 and the upper part of Unit 2 has been designated as the shallow aquifer.
2 Silty clay. 2.5 to 25 ft thick with an average of thickness of 15 ft. Unit 2 is saturated below the Clive Facility.
1 Silty sand with occasional silty clay. Confined aquifer.
Begins at a depth of approximately 45 ft bgs. The thickness of Unit 1 is unknown.
Geochemical conditions and water movement have not been extensively studied in the unsaturated zone at the Clive Facility. As described above, the upper level pore water within the unsaturated zones is expected to contain lower TDS than is found within the saturated zone, though these levels could increase with depth in the unsaturated zone. The relative anion and cation constituents of this pore water are likely very similar to those in the saturated zone. This is expected as the ions in the saturated zone appear to be largely due to the presence of evaporites and alluvium from the valley and former Lake Bonneville. Dissolved oxygen and carbon dioxide are expected to be largely in equilibrium with atmospheric conditions, at least in the upper profile including the DU waste zone. For derivation of the solubility and sorption parameters a pH range of 6.5-8.5, pCO2 range of slightly above atmospheric to slightly below atmospheric, and geochemical make up similar to the saturated zone but lower TDS was used.
2.2 Shallow Unconfined AquiferThe geochemistry of the shallow, unconfined aquifer consists of very high levels of dissolved solutes as outlined above. The groundwater table occurs near the bottom of Unit 3, with the shallow aquifer mainly within Unit 2. For the purposes of the PA model, the water table is assumed to be coincident with this stratigraphic interface. This unconfined aquifer contains very high dissolved solids, with TDS values ranging from 20 to 70 parts per thousand and specific gravity from 1.02 to 1.06 g/mL (Envirocare 2004, and recent site specific groundwater data acquired by EnergySolutions). The shallow aquifer consists of a brine with sodium and chloride comprising approximately 90 percent of the ions (see Tables 5 and 6) This brine is likely a result of the dissolution from the Lake Bonneville evaporite sediments. Prior geochemical modeling (Bingham Environmental, 1991) indicates the aquifer is supersaturated with calcite and dolomite. Geochemical modeling for this PA also indicats these minerals to be at saturated conditions.
Geochemical Modeling 5
Radionuclide Geochemical Modeling for the Clive DU PA 28 May 2011
The deep confined aquifer, in Unit 1, also has high values of TDS of up to 20 parts per thousand, but the average is well below the average of the shallow aquifer. The higher salinity of the shallow aquifer is thought to be due to concentration of salts through evapotranspiration (ET) and/or localized dissolution of evaporite deposits in the unsaturated zone.
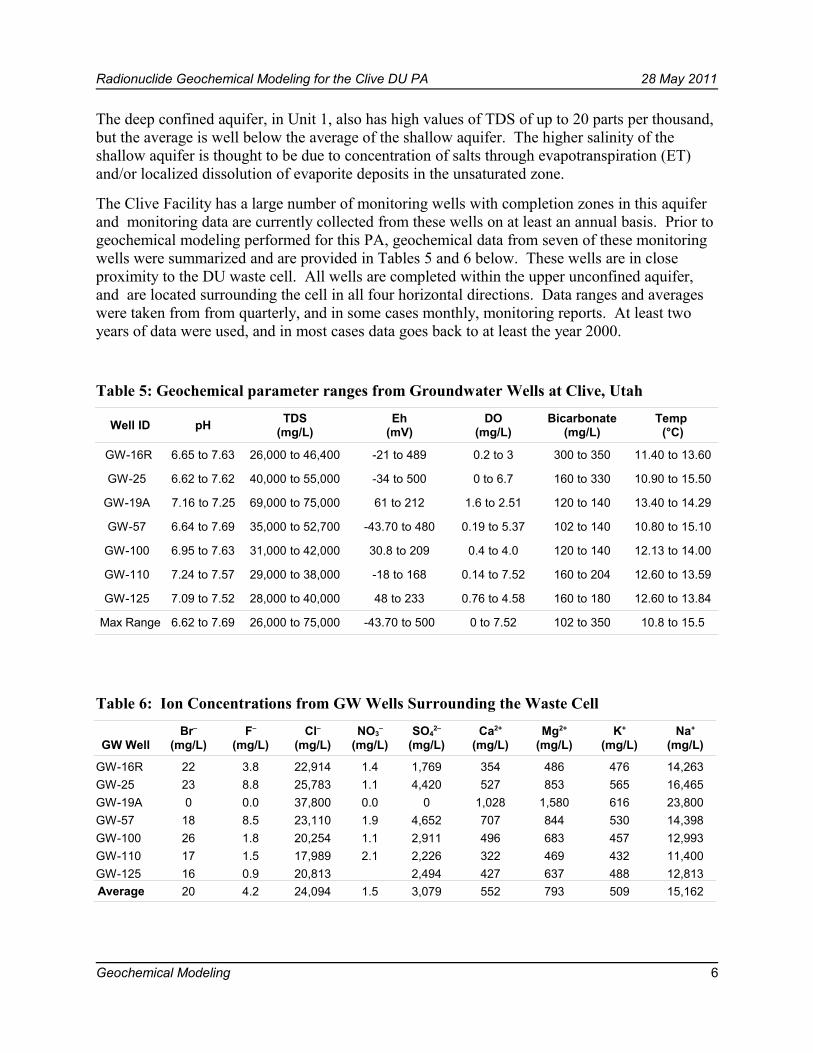
The Clive Facility has a large number of monitoring wells with completion zones in this aquifer and monitoring data are currently collected from these wells on at least an annual basis. Prior to geochemical modeling performed for this PA, geochemical data from seven of these monitoring wells were summarized and are provided in Tables 5 and 6 below. These wells are in close proximity to the DU waste cell. All wells are completed within the upper unconfined aquifer, and are located surrounding the cell in all four horizontal directions. Data ranges and averages were taken from from quarterly, and in some cases monthly, monitoring reports. At least two years of data were used, and in most cases data goes back to at least the year 2000.
Table 5: Geochemical parameter ranges from Groundwater Wells at Clive, Utah
Well ID pH TDS(mg/L)
Eh(mV)
DO(mg/L)
Bicarbonate (mg/L)
Temp (°C)
GW-16R 6.65 to 7.63 26,000 to 46,400 -21 to 489 0.2 to 3 300 to 350 11.40 to 13.60
GW-25 6.62 to 7.62 40,000 to 55,000 -34 to 500 0 to 6.7 160 to 330 10.90 to 15.50
GW-19A 7.16 to 7.25 69,000 to 75,000 61 to 212 1.6 to 2.51 120 to 140 13.40 to 14.29
GW-57 6.64 to 7.69 35,000 to 52,700 -43.70 to 480 0.19 to 5.37 102 to 140 10.80 to 15.10
GW-100 6.95 to 7.63 31,000 to 42,000 30.8 to 209 0.4 to 4.0 120 to 140 12.13 to 14.00
GW-110 7.24 to 7.57 29,000 to 38,000 -18 to 168 0.14 to 7.52 160 to 204 12.60 to 13.59
GW-125 7.09 to 7.52 28,000 to 40,000 48 to 233 0.76 to 4.58 160 to 180 12.60 to 13.84
Max Range 6.62 to 7.69 26,000 to 75,000 -43.70 to 500 0 to 7.52 102 to 350 10.8 to 15.5
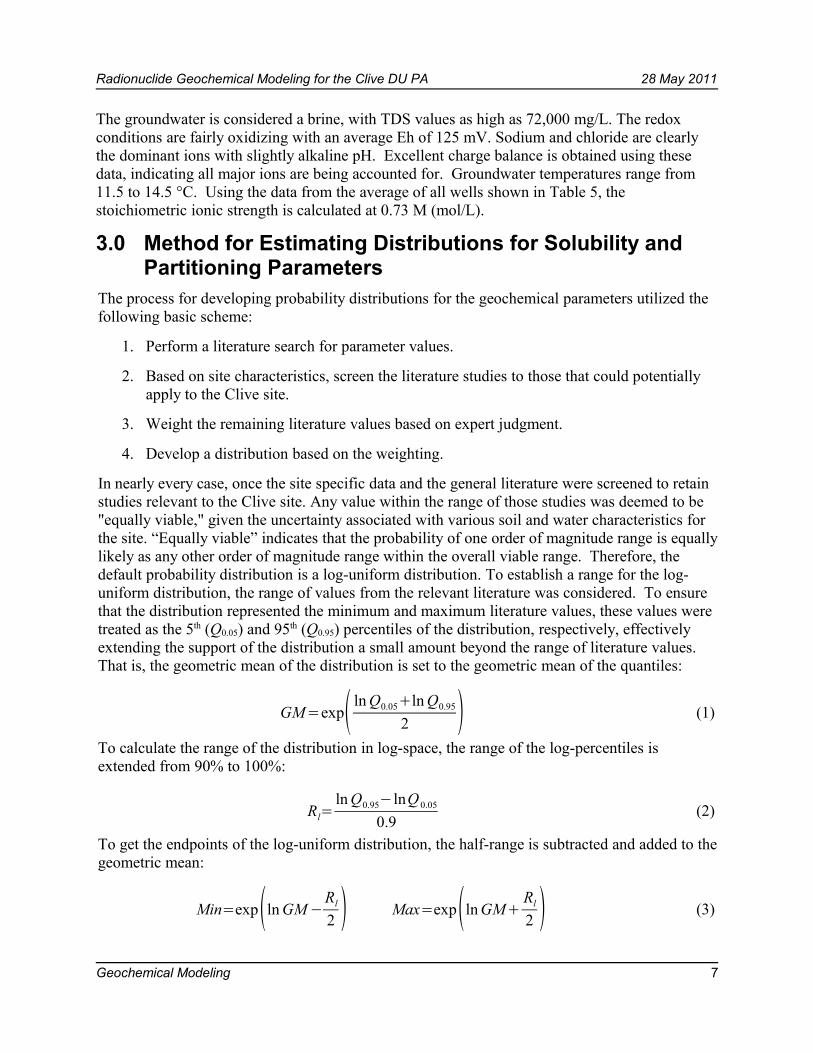
Table 6: Ion Concentrations from GW Wells Surrounding the Waste Cell
GW WellBr–
(mg/L)F–
(mg/L)Cl–
(mg/L)NO3
–
(mg/L)SO4
2–
(mg/L)Ca2+
(mg/L)Mg2+
(mg/L)K+
(mg/L)Na+
(mg/L)
GW-16R 22 3.8 22,914 1.4 1,769 354 486 476 14,263GW-25 23 8.8 25,783 1.1 4,420 527 853 565 16,465GW-19A 0 0.0 37,800 0.0 0 1,028 1,580 616 23,800GW-57 18 8.5 23,110 1.9 4,652 707 844 530 14,398GW-100 26 1.8 20,254 1.1 2,911 496 683 457 12,993GW-110 17 1.5 17,989 2.1 2,226 322 469 432 11,400GW-125 16 0.9 20,813 2,494 427 637 488 12,813Average 20 4.2 24,094 1.5 3,079 552 793 509 15,162
Geochemical Modeling 6
Radionuclide Geochemical Modeling for the Clive DU PA 28 May 2011
The groundwater is considered a brine, with TDS values as high as 72,000 mg/L. The redox conditions are fairly oxidizing with an average Eh of 125 mV. Sodium and chloride are clearly the dominant ions with slightly alkaline pH. Excellent charge balance is obtained using these data, indicating all major ions are being accounted for. Groundwater temperatures range from 11.5 to 14.5 °C. Using the data from the average of all wells shown in Table 5, the stoichiometric ionic strength is calculated at 0.73 M (mol/L).
3.0 Method for Estimating Distributions for Solubility and Partitioning Parameters
The process for developing probability distributions for the geochemical parameters utilized the following basic scheme:
1. Perform a literature search for parameter values.
2. Based on site characteristics, screen the literature studies to those that could potentially apply to the Clive site.
3. Weight the remaining literature values based on expert judgment.
4. Develop a distribution based on the weighting.
In nearly every case, once the site specific data and the general literature were screened to retain studies relevant to the Clive site. Any value within the range of those studies was deemed to be "equally viable," given the uncertainty associated with various soil and water characteristics for the site. “Equally viable” indicates that the probability of one order of magnitude range is equally likely as any other order of magnitude range within the overall viable range. Therefore, the default probability distribution is a log-uniform distribution. To establish a range for the log-uniform distribution, the range of values from the relevant literature was considered. To ensure that the distribution represented the minimum and maximum literature values, these values were treated as the 5th (Q0.05) and 95th (Q0.95) percentiles of the distribution, respectively, effectively extending the support of the distribution a small amount beyond the range of literature values. That is, the geometric mean of the distribution is set to the geometric mean of the quantiles:
GM=exp( ln Q0.05+ln Q0.95
2 ) (1)
To calculate the range of the distribution in log-space, the range of the log-percentiles is extended from 90% to 100%:
Rl=ln Q0.95− lnQ 0.05
0.9(2)
To get the endpoints of the log-uniform distribution, the half-range is subtracted and added to the geometric mean:
Min=exp(ln GM −Rl
2 ) Max=exp(ln GM+Rl
2 ) (3)
Geochemical Modeling 7
Radionuclide Geochemical Modeling for the Clive DU PA 28 May 2011
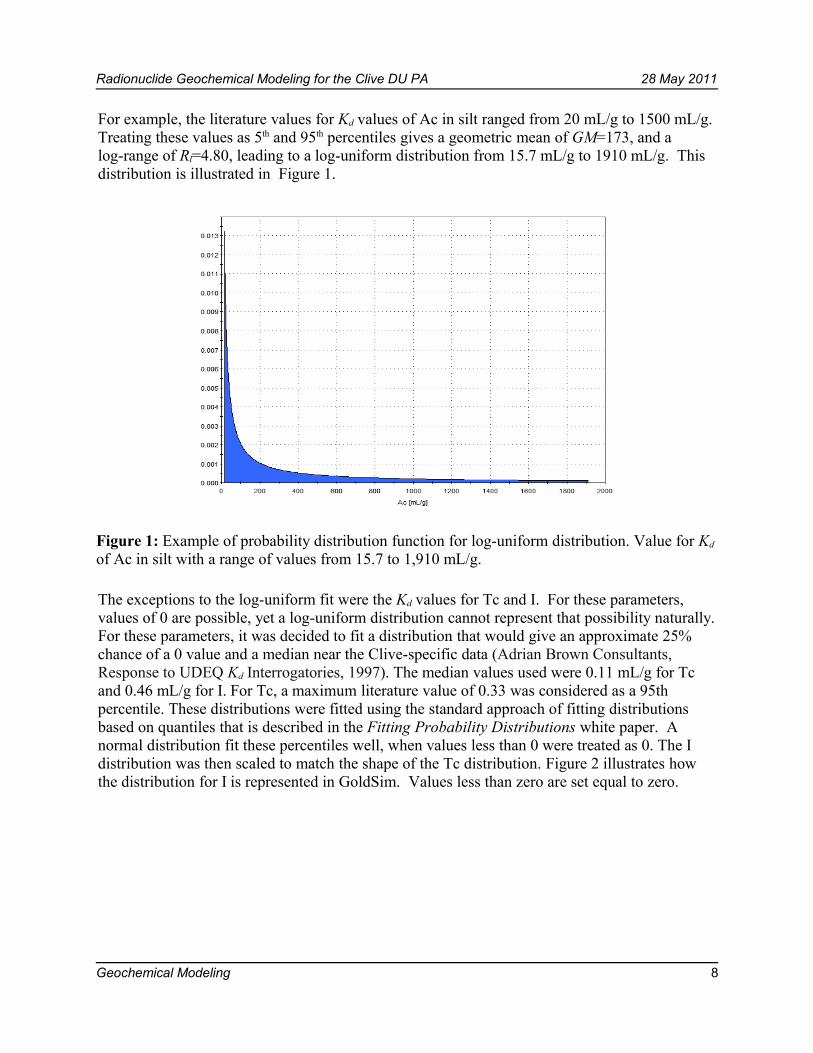
For example, the literature values for Kd values of Ac in silt ranged from 20 mL/g to 1500 mL/g. Treating these values as 5th and 95th percentiles gives a geometric mean of GM=173, and a log-range of Rl=4.80, leading to a log-uniform distribution from 15.7 mL/g to 1910 mL/g. This distribution is illustrated in Figure 1.
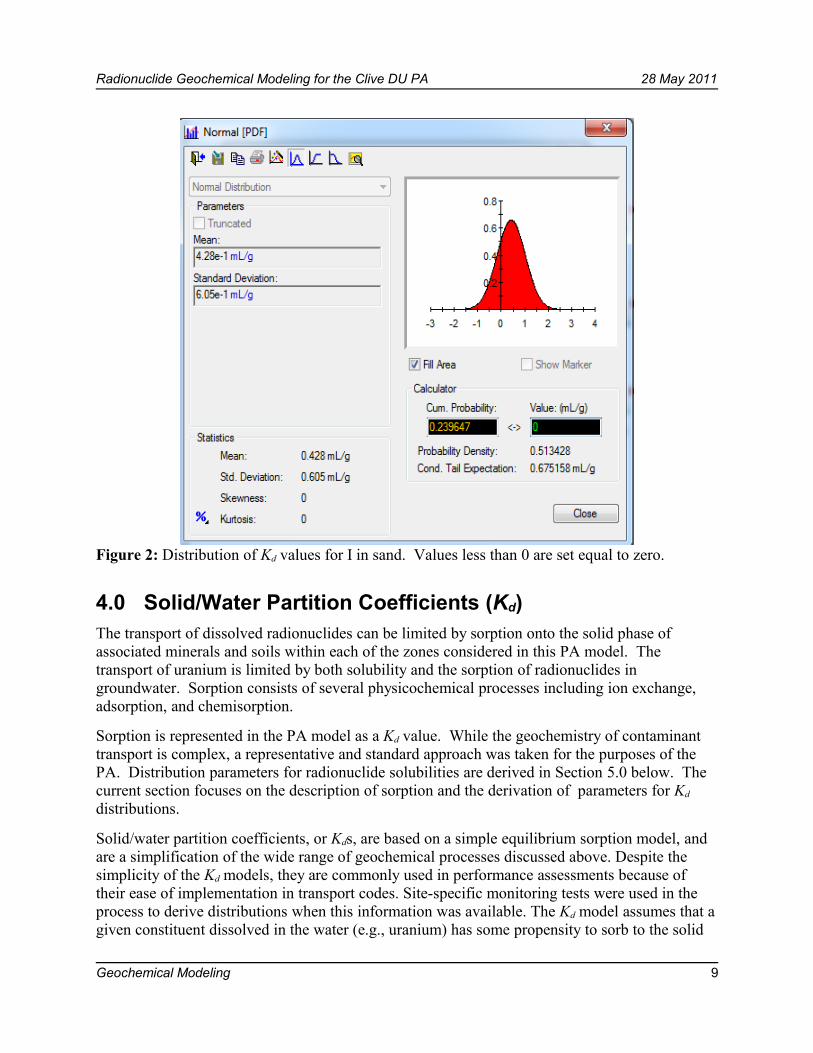
The exceptions to the log-uniform fit were the Kd values for Tc and I. For these parameters, values of 0 are possible, yet a log-uniform distribution cannot represent that possibility naturally. For these parameters, it was decided to fit a distribution that would give an approximate 25% chance of a 0 value and a median near the Clive-specific data (Adrian Brown Consultants, Response to UDEQ Kd Interrogatories, 1997). The median values used were 0.11 mL/g for Tc and 0.46 mL/g for I. For Tc, a maximum literature value of 0.33 was considered as a 95th percentile. These distributions were fitted using the standard approach of fitting distributions based on quantiles that is described in the Fitting Probability Distributions white paper. A normal distribution fit these percentiles well, when values less than 0 were treated as 0. The I distribution was then scaled to match the shape of the Tc distribution. Figure 2 illustrates how the distribution for I is represented in GoldSim. Values less than zero are set equal to zero.
Geochemical Modeling 8
Figure 1: Example of probability distribution function for log-uniform distribution. Value for Kd
of Ac in silt with a range of values from 15.7 to 1,910 mL/g.
Radionuclide Geochemical Modeling for the Clive DU PA 28 May 2011
4.0 Solid/Water Partition Coefficients (Kd)The transport of dissolved radionuclides can be limited by sorption onto the solid phase of associated minerals and soils within each of the zones considered in this PA model. The transport of uranium is limited by both solubility and the sorption of radionuclides in groundwater. Sorption consists of several physicochemical processes including ion exchange, adsorption, and chemisorption.
Sorption is represented in the PA model as a Kd value. While the geochemistry of contaminant transport is complex, a representative and standard approach was taken for the purposes of the PA. Distribution parameters for radionuclide solubilities are derived in Section 5.0 below. The current section focuses on the description of sorption and the derivation of parameters for Kd
distributions.
Solid/water partition coefficients, or Kds, are based on a simple equilibrium sorption model, and are a simplification of the wide range of geochemical processes discussed above. Despite the simplicity of the Kd models, they are commonly used in performance assessments because of their ease of implementation in transport codes. Site-specific monitoring tests were used in the process to derive distributions when this information was available. The Kd model assumes that a given constituent dissolved in the water (e.g., uranium) has some propensity to sorb to the solid
Geochemical Modeling 9
Figure 2: Distribution of Kd values for I in sand. Values less than 0 are set equal to zero.
Radionuclide Geochemical Modeling for the Clive DU PA 28 May 2011
phase of a porous medium, while maintaining an aqueous phase. The definition of the solid/water distribution coefficient, with units of mL/g is:
K d=mass of constituent sorbed on a unit mass of solid g / g mass of constituent within a unit volume of water g /mL
. (4)
The sorption is assumed to be instantaneously reversible and independent of concentration. That is, no dynamics are accounted for, and the ratio is always simply linear—a constituent’s concentration in water is always the same ratio with respect to its sorbed concentration onto the solid, and sorption is instantaneous. This is the commonly used linear isotherm assumption.
Applying the Kd model outside of the range of concentrations used to obtain the values can lead to over- or under-estimation of sorption. To account for ranges of geochemical conditions and the potential deviation from the assumptions underlying the linear sorption model which may result in variation in Kd values, this PA model includes parameter distributions (stochastics) for the sorption values. Nominal Kd values were selected using both site-specific monitoring tests (when available) and the general scientific literature. Data were taken from literature that most closely matched the geochemical conditions at the site, including TDS range, pH and alkaline conditions, temperature, and soil properties (CEC, clay types) to the extent possible. Kd values have been chosen for five individual materials: silt, sand, clay, UO3 waste and U3O8 waste. In all natrual zones the silt, sand, and clay are mixed to some extent. After including the uranium oxide material amounts into the GoldSim model, it became apparent that they form such a small fraction of the profile relative to the other materials that sorption processes within the waste could be neglected, so these materials are assigned values for Unit 3, represented using the Kds for sand. It is also recognized that essentially no information on sorption to uranium oxides (as the waste inventory) is available in the published literature.
The process for selecting Kd values for the elements entailed an extensive literature search to identify sorption values used in other transport models, and in particular from locations that have similar solid phase properties and geochemical conditions. The sorption values used by Whetstone Associates (2009), Bingham Environmental (1995, 1996), Scism (2006), Sheppard and Thibault (1990), the Yucca Mountain Site Characterization Project (LANL 1997), DOE (2003), and Envirocare (2000) were evaluated. In addition, the EPA three volume series Understanding Variation In Partition Coefficient, Kd, Values (EPA, 1999b, 1999c, 2004) was referenced extensively in this process. The reader is advised to consult that EPA series as it was used for the derivation of many Kd values and much of that information is not repeated here.
Work by Serne (2007) was also reviewed during this investigation. Serne focused on surface agricultural soils and Columbia River bank near-surface sediment associated with the Hanford site. Serne specifically states that the values are not to be used in water-borne scenarios except when the modeling is used to estimate accumulation of contaminants by future surface soils from irrigation practices, and that they are not appropriate for unsaturated zone transport to the groundwater. Nevertheless, the results are important from a semi-quantitative perspective. Of note is that the Hanford soils are slightly acidic, with organic content of 0.5 to 1.5% organic carbon somewhat different from the Clive location. Serne (2007) also reviews a number of studies that are also somewhat applicable to the Clive facility and the range of Kd values provided are useful as a first comparison. As such, a number of values compiled by Serne are provided
Geochemical Modeling 10
Radionuclide Geochemical Modeling for the Clive DU PA 28 May 2011
below. Serne also refers to work by Last et al. (2004) and Krupka et al. (2004) for systems that include migration to groundwater, as envisioned in this PA model. Values described by these authors are discussed below for individual species.
4.1 Partitioning by ElementThis section provides a description of the derivation of the partition coefficient for each element used in the transport model. Data were derived first from site-specific monitoring studies where this information was available. Second, the data was taken from literature searches, with values chosen from locations with similar geochemistry and soil/mineral conditions as the Clive facility as described in Section 3.0 above.
4.1.1 ActiniumMinimal Kd information was found for this element. Values from Sheppard and Thibault (1990) are as follows: 450 mL/g (sand), 1,500 mL/g (loam, here used to represent silt), 2,400 mL/g (clay), 5,400 mL/g (organic). In order to derive values for this PA for each of the three materials (sand, silt, and clay) a range similar to those from Sheppard and Thibault (1990) was incorporated with adjustments made for each of the three materials.
4.1.2 AmericiumAmericium will likely occur predominantly as carbonate complex cation Am (III) in the pH range at the Clive facility, though some speciation as an anion is also possible. This rare earth element will have a large sorption coefficient. The largest source of Kd values for this element was found in Serne (2007) with discussion on a number of studies by other researchers. In the Hanford system, americium adsorbs fairly strongly to soils and sediments. Serne chose a best value of 500 mL/g with a recommended range of 60 mL/g to 5,000 mL/g for the non-groundwater scenarios. This range is consistent with studies by others using a matrix within a groundwater system, with the exception of those done on <1 mm size particles by Tanaka and Muraoka found in Serne. Krupka et al. (2004) chose a best value of 300 mL/g. Sanchez (in EPA 2004) found no apparent effect of salinity on Kd values and no additional information was obtained during this research. For the transport model a range from 43 mL/g to 1,140 mL/g was chosen as shown in Table 1.
4.1.3 CesiumCesium sorption is strong in most soils (EPA 1999c). Sorption commonly occurs as the Cs+
cation via cation exchange. In calcareous soils with mica minerals, cesium was essentially completely absorbed above pH 4.0. However, high salt solution does decrease sorption. At Idaho National Laboratory (INL) (Hull, 2008), a release of cesium in 1972 has been found to be essentially immobile. This effect is thought to largely be a function of cation exchange with clays in the exchange on both the planar and frayed edge sites of clays. The binding on the frayed edge is considered stronger, resulting in a high Kd.
Serne (2007) chose a recommended value of 2,000 mL/g for the low ionic strength, circum-neutral waters in the near surface sediments at Hanford. This was consistent with the value from Krupka et al. (2004). Serne (2007) recommended a range of 200 to 5,000 mL/g for the non water-borne (e.g., unsaturated, agriculture zone) scenarios at that location and a log normal probability distribution to describe the variation.
Geochemical Modeling 11
Radionuclide Geochemical Modeling for the Clive DU PA 28 May 2011
Because cesium sorbs by an ion exchange process, sorption can be depressed by high TDS of the groundwater. Vandergraaf et al. (1993) has performed sorption experiments with Cs examining the relationship between Cs concentrations and TDS and were able to fit a quadratic equation to the data. For this PA model, cesium Kd values were selected largely from the look up tables in EPA (1999c), but were adjusted lower due to the high TDS in the saturated zone. Also note that the CEC values of 10-20 meq/100 g at the Clive facility are indicative of some but not a significant presence of clay minerals within the saturated zone. These CEC values apply to the materials within the saturated zone. The liner especially, and some native materials within the unsaturated zone do contain clay minerals.
4.1.4 IodineIodine is expected to largely exist as the anion, I– or IO3
–, though volatile organic forms are also possible. Because of the negative charge, sorption will likely not be strong, due to the typical negative charge of the soils at the Clive site under neutral to alkaline conditions. This is especially true in the saturated zone where high concentrations of chloride ions will compete for any available sites to sorb. Sorption appears to increase with increasing organic matter for iodine (EPA 2004), which may be largely due to microbial processes. Studies of iodine sorption under oxic conditions on Hanford Site sediments (Kaplan 1998b from EPA 2004) indicated very low Kd values. Serne (2007) recommended a value of 3 mL/g with a range of 0 to 15 mL/g. Last et al. (2004) recommended a range of 0 to 2 mL/g. The very low concentrations of organic compounds found in the sediments at the Clive facility would support the use of of a low range for the Kd. This range is largely derived from Summary of Results, Radionuclide Kd Tests (Bingham Environmental, Inc. August 3, 1995) where a value of 0.7 mL/g was derived for the Clive facility using samples from Unit 3 samples. The grain size distributions from these Unit 3 samples indicated the material was largely sand. Clive site groundwater was used for the sorption studies. This Kd value was then changed in Adrian Brown Consultants (1997), with a recommended value of 0.46 mL/g.
4.1.5 LeadLead speciation is largely anticipated to be in the form of dissolved PbCO3 at least in the saturated zone. Lead may be largely in the hydroxide ion form in waters of lower carbonate concentration, though this is not anticipated to any significant extent. As PbCO3 is expected to be the dominant form above pH 7, sorption will not be especially significant. Lead has such low solubility, especially in presence of phosphate and chloride, that solubility often can control movement. Table 1 in Appendix D of the Bingham Environmental (1991) shows an EPA Arid Site value of 220 mL/g for lead, with an applicable range of 1 to 10,000 mL/g. Serne (2007) recommended a value of 400 mL/g for the non-groundwater scenarios at Hanford, within the range of Sheppard and Thibault (1990). Based on the Pauling ionic radii of Sr2+ and Pb2+ (1.12 and 1.19 Å, respectively), the sorption of lead is expected to be similar to strontium and also to be somewhat suppressed by high ionic strength solutions. For this model, the lead Kd values were chosen in a range from 2 to 200 mL/g with lower values for the sand material. This range was based upon the expected similarity with strontium and cesium.
Geochemical Modeling 12
Radionuclide Geochemical Modeling for the Clive DU PA 28 May 2011
4.1.6 NeptuniumNeptunium will most probably exist in the Np(V) form with some as Np(IV), principally as an uncharged hydroxide, where reducing conditions exist. In the Np(V) form as NpO2
+, this species can sorb to iron oxides and clays but not to a significant extent to common minerals. Np(V) has a pH dependence, with negligible sorption at values less than pH 5. This ion can also form carbonate complexes above pH 8.5 or under high carbonate concentration conditions (Serne, 2007).
The transient, mildly reducing conditions that can exist at Clive and the presence of carbonates may lead to the formation of Np(VI) carbonate complexes above pH 7. However, there are a limited number of Kd studies for this element. Heberling et al. (2008) studied Np(V) adsorption to calcite at four pH values at constant ionic strength. The Kd was found to vary with both pH and concentration with a value range of 0.0090 ± 0.004 mL/g to 0.0610 ± 0.002 mL/g. Wooyong et al. (2009) measured Kd values from sediment collected at the Hanford site and found a range of 0.6 to 4.8 mL/g. The EPA (2004) suggests a minimum Kd of 0.2 mL/g. Serne (2007) chose a range of 2 to 50 mL/g for the non-groundwater scenario at Hanford with a best value of 25 mL/g. This range is approximately two times higher than the range recommended by Last et al. (2004) and Krupka et al. (2004) for groundwater systems.
Vandergraaf et al. (1993) reported values ranging from 0.5 to 68 mL/g. In the presence of Fe(II), reduction of Np(V) has been observed (Cui and Eriksen 1996, Nakata et al. 2002). Kumata et al. (1993) observed retention of Np in columns of crushed granite from solutions with low Eh values finding a relationship between retention and flow rate that suggested that the kinetics of the redox process were relatively slow. Values from Sheppard and Thibault (1990) are as follows: sand: 5 mL/g, loam (silt): 25 mL/g, clay: 55 mL/g, and organic: 1200 mL/g. For the Clive facility, a similar range is recommended, though this range is reduced for the sand matrix.
4.1.7 PlutoniumPlutonium can be found in a number of valence states under the conditions at Clive. The most likely states are as Pu(V) and Pu(VI) both as cations and complexed with hydroxide and carbonate. Plutonium sorption is known to occur on many common minerals, clays, and oxides. Some studies indicate the sorption is non-reversible. It is noted that experiments by Linsalata and Cohen (1980) did not find a reduction in Kd with high ionic strength (salinity increased to 24%). Serne (2007) chose a range of 200 to 5,000 mL/g and a best value of 600 mL/g for the Hanford non-groundwater scenario. Last et al. (2004) and Krupka et al. (2004) recommended values of 600 mL/g and 150 mL/g, respectively, with a high range value of 2000 mL/g. Data by Glover et al. (1976) found in the EPA (EPA 1999c) series may be of particular relevance to the Clive location. These data, along with Kd values collected on basalt sediments were used to develop the EPA look up table. For the Clive location, Kd values corresponding to lower clay content especially within the saturated zone, and medium to highly soluble carbonate throughout are most applicable. These Kd values range from 80 mL/g to 520 mL/g. These values appear to be slightly low compared to other studies. For the Clive facility, a slightly higher range was chosen, with the upper limit increased because of the clay matrix.
Geochemical Modeling 13
Radionuclide Geochemical Modeling for the Clive DU PA 28 May 2011
4.1.8 ProtactiniumLittle information was identified that provided sorption values for this element. Serne (2007) discusses the use of neptunium as an analog for protactinium. In sea water environments, where particles of very high surface area are encountered, Kd values of greater than 10,000 mL/g have been measured. Serne recommended a most probable Kd value of 400 mL/g for protactinium, similar the values used for bismuth and polonium. Serne's recommended range is 150 to 10,000 mL/g. Again, this is for a non-groundwater scenario, different from that at the Clive facility. Sheppard and Thibault (1990) categorize Kd values by sand, clay, loam, and organic with values ranging from 550 to 2,700, sand-clay respectively. These values from Sheppard and Thibault (1990) formed the basis for the distribution used for this PA model. These values were reduced to account for the high TDS in the saturated zone.
4.1.9 RadiumBased on the compilation by Serne (2007), radium is a fairly strongly sorbing species in low ionic solutions at circumneutral pH. Radium will co-precipitate with calcium sulfate in high ionic strength waters and may also do so in barite. Sheppard and Thibault (1990) recommended the following values: sand: 500 mL/g, loam (silt): 36,000 mL/g clay: 9,100 mL/g and organic: 2,400 mL/g. Serne recommended a best value of 200 mL/g and a range of 5 mL/g to 500 mL/g. This range was lower than Sheppard and Thibault (1990) based on studies that indicated cation exchange is a dominant sequestration mechanism and the low CEC of the Hanford soils. Krupka et al. (2004) recommended a Kd of 14 mL/g with a range of 5 mL/g to 200 mL/g. A range based on all of the above data was chosen for each material class.
4.1.10 StrontiumStrontium has little tendency to form complexes with inorganic ligands (EPA 1999c). Reversible cation exchange is expected to be the most important mechanism impacting sorption in the pH conditions at the Clive facility. This behavior is similar to that of cesium though sorption is generally not as strong. A point worth noting in this context is that natural Sr in the groundwater will dilute any radioactive Sr isotopically. The high sulfate concentration in the groundwater at Clive (4,420 mg/L average for GW-25) may lead to precipitation of SrSO4 or co-precipitation with CaSO4.
A study at the INL (Hull, 2008) indicated strontium sorption was dependent upon other cations, primarily Ca2+, Mg2+
, and Na+ with Kd decreasing with increasing concentrations of these ions. The Kd value decreased from 85 mL/g to 4.7 mL/g. This effect was considered a cation exchange phenomenon, where the divalent strontium cation competes with calcium. This effect is similar to that observed by Patterson and Spoel (1981, as referenced in Hull) at the Chalk River Nuclear Laboratories. The EPA look up table (EPA 1999) was developed using pH and CEC values. Using this table, along with the known applicable parameter ranges for Clive of relatively low abundance of clay minerals within the saturated zone but somewhat higher within the unsaturated zone, a CEC of 10 to 20 meq/100 g, and pH range of 6.6 to 8.5, the listed Kd values are within a range from 15 mL/g to approximately 200 mL/g. Note, a higher clay content will act to increase these values. However, under very high TDS conditions as in the saturated zone, lower sorption is expected and is reflected in the ranges chosen for this transport model.
Geochemical Modeling 14
Radionuclide Geochemical Modeling for the Clive DU PA 28 May 2011
4.1.11 TechnetiumIn oxic conditions technetium will exist as the TcO4
– metal oxyanion, which is essentially non-adsorptive (EPA 2004). EPA did not develop a lookup table for technetium but cite data indicating Kd ranges from slightly negative to generally less than 1 mL/g. Under chemically reducing conditions, either in the bulk groundwater or locally on the surface of Fe(II) containing minerals (biotite, magnetite), or in the presence of microbes, reduction of Tc(VII) to Tc(IV) can occur and the reduced form of Tc will either sorb strongly or will precipitate (Vandergraaf et al. 1984, Cui and Eriksen 1996). This process will fix technetium to geological material. However, if redox conditions change, there is the possibility that Tc could be resolubilized and transported through the geosphere as an anion without retardation. Sheppard and Thibault (1990) indicate very low Kd values for this species ranging from 0.1 to 1. This low propensity for the TcO4
– ion to sorb, has been noted by many researchers. Wooyong et al. (2009) measured Kd values from sediment collected at the Hanford site and found a range of 0.08 to 0.4 mL/g. For this model, the technetium sorption distributions were chosen based on the information above and the derivation that is provided in Adrian Brown Associates (1997). These data are derived from sorption on to Unit 3 sand and site-specific groundwater under oxidizing conditions.
4.1.12 ThoriumThe solubility of thorium is low (circa 10-9 molar), which has made sorption measurements difficult. This element occurs only in the +4 oxidation state in natural waters. Thorium can form many different species including carbonate complexes. The Canadian high level waste program uses a Kd value of 800 mL/g. Values for thorium were chosen largely based upon the information in the EPA literature (1999b, 1999c, 2004) though the values were reduced to some extent to account for the high TDS based upon recommendations from Vandergraaf (personal communication 2010).
4.1.13 UraniumThe Kd for uranium is important in this PA due to the large mass of this element in the inventory relative to any other radionuclide. The transport of uranium is expected to be mainly a factor of the solubility within the waste zone (near source), and potentially within the saturated zone with time. However, retardation of the uranium via sorption will be important in the clay liner beneath the waste zone and within both the unsaturated and saturated zones.
Uranium (VI) sorption can be controlled by cation exchange and adsorption processes, especially in low ionic strength systems (EPA 1999c). As the ionic strength increases, other cations will displace the uranyl (UO2)2+ ion. Uranium sorption on iron oxide minerals and smectite clays is extensive except in the presence of carbonate where this is reduced (EPA 1999c). Aqueous pH values also influence uranium sorption, affecting the speciation as described above as well as influencing the number of exchange sites on variably charged surfaces. Dissolved carbonate concentrations and pH appear to be the most important factors influencing adsorption of U(VI). However, under the slightly alkaline and carbonate dominated conditions expected in the saturated zone, uranium will likely occur in several forms including a uranyl-carbonate or oxy-carbonate anion or a non-charged uranyl hydoxide. The speciation results from the solubility modeling are described in Section 5.0.
Geochemical Modeling 15
Radionuclide Geochemical Modeling for the Clive DU PA 28 May 2011
In the range of pH 7 to 9, there were 4 to 5 orders of magnitude variation in Kd values noted in the data collected by the EPA (1999b, 1999c, 2004). For the pH range of 7 to 8, which is most likely at the Clive site, the EPA listed a minimum Kd of 0.4 mL/g and a maximum of 630,000 mL/g. The minimum value was based on values calculated for quartz with the maximum value based on data calculated for ferrihydrite and kaolinite. These very high Kd
values are considered potentially biased by one order of magnitude. Values from Sheppard and Thibault (1990) are as follows: sand: 35 mL/g, loam (slit): 15 mL/g clay: 1,600 mL/g and organic: 410 mL/g.
Last et al. (2004) and Krupka et al. (2004) recommend ranges for uranium of 0.2 mL/g to 4 mL/g and 0.1 mL/g to 80 mL/g respectively. Wooyong et al. (2009) measured Kd values from sediment collected at the Hanford site and found a range of 0.2 mL/g to 1.5 mL/g. In most cases these authors found that higher Kd values were associated with the less-than-2-mm particle size fraction as one would expect based purely on surface area. However in some of their sediments this relationship was reversed. They attributed this to highly reactive surfaces on gravel at their location.
Site-specific sorption data for uranium are also available from the Adrian Brown and Associates (1997) report, performed by Barringer Laboratories. Two data points at a single uranium concentration (at day 7 and 16) were obtained with tests performed at two higher concentrations resulting in the precipitation of the uranium. The average Kd value in this study was 6.0 mL/g.
The Kd values chosen for this PA were based on both the site-specific data and literature information. The U(VI) species in the aqueous environment will not have particularly strong sorption tendencies. The uranyl ion is mobile in the high ionic-strength solutions and this mobility is also found with waters containing high carbonates. This indicates uranium sorption is more likely to be found at the lower ranges of those cited by the EPA and Sheppard and Thibault (1990).
5.0 Element and Species Solubility Modeling transport of radionuclides of interest at the Clive Disposal Facility area requires an understanding of the expected concentration of these species in the dissolved phase starting in the DU oxide waste zone. Once dissolved from the waste, the radionuclides have the potential for transport vertically down into the unsaturated zone below and then into the shallow aquifer. Diffusion both upward and downward in the aqueous phase is also possible. At first, leaching is likely to be solubility-limited with respect to uranium, and the leachate will migrate away from the source with uranium concentration at the solubility limit. The other radionuclides are unlikely to be at a solubility limit but establishing boundaries is necessary for the modeling. The concentrations of radionuclides limited by sorption will be less in the dissolved phase farther from the source.
The importance of solubilities of the individual species in this PA model varies. Uranium is expected to be solubility limited at the source, but most other elements in the inventory likely will not be so limited. Therefore, the majority of effort for solubility distribution development was focused on uranium. Solubilities for the other species were drawn from literature reviews of studies conducted at locations with similar water chemistry.
Geochemical Modeling 16
Radionuclide Geochemical Modeling for the Clive DU PA 28 May 2011
At the Clive site, four major physical zones or systems are encountered and can influence the aqueous movement of radionuclides. These zones include the waste cell, the clay liner beneath the waste zone, the unsaturated zone, and the saturated zone (shallow aquifer). As described in the Unsaturated Zone Modeling and Saturated Zone Modeling white papers, the waste zone and unsaturated zone are considered very similar in terms of the expected geochemistry of the aqueous phase. Due to the small ratio of DU waste to native materials they are also relatively similar in mineral composition and both are modeled using physical and chemical properties of Unit 3 (represented chemically as a sand). The clay liner will mainly influence retardation via sorption, in addition to decreasing water infiltration. The important saturated zone geochemical conditions, including aqueous and solid state chemistry, are those that influence the precipitation and dissolution of the species of interest in this PA. Differences between the saturated and unsaturated zones are mainly associated with ionic strength and redox conditions with pH expected to be fairly similar in both saturated and unsaturated zones. The interstitial water in the waste and unsaturated zones is considered to be highly oxidizing, more so than the aquifer, and with neutral to slightly alkaline pH. However, the differences in ionic strength and oxidizing conditions between the unsaturated zone and saturated zone did not have a significant effect on the calculated solubilities. Data from the saturated zone (Tables 5 and 6) indicate it is susceptible to localized, transient, anoxic conditions with zero to slightly negative Eh values. These areas will have a large influence on uranium solubilities since U(IV) is much less soluble (circa 10-8 M) than U(VI). Other species of interest to this PA model will also have reduced solubilities in anoxic regions.
Microbial influences on the transport of the radionuclides are not expected to be important. Little or no organic materials (cellulosics, plastic) are expected in the waste. Therefore, no microbial influence is included in this model, nor are organic materials such as humic and fulvic acids expected to be present in any significant amounts. However, radiolytic effects could cause transient changes in redox conditions or generate carboxylic acids as described below.
Anoxic corrosion of the steels and iron-based alloys used to construct the DU cylinders and drums can affect the release of actinides. Corrosion would be expected to reduce the oxidation state of some actinides. The most significant effect would be to decrease the mobility of uranium, technetium, and plutonium. Uranium transport is again strongly influenced by redox conditions. However, it is highly uncertain whether anoxic corrosion would take place since this would require consumption of oxygen. A more conservative approach was taken, where largely oxidizing conditions are assumed to remain to some extent within the unsaturated zone.
The potential for colloidal transport of actinides at the Clive facility is not incorporated into the PA model. Actinide intrinsic colloids are formed by condensation of hydrolyzed actinide ions and consist of actinide cations linked by anions. The Pu(IV) instrinsic colloid is a well studied example (Johnson and Toth 1978). However, plutonium, and Pu (IV) in particular, is apparently unique in its propensity to form an intrinsic colloid. Due to the expected very low mass of plutonium from the DU, this colloidal process has not been included in the source term. There are approaches for including colloidal transport into an effective retardation factor (Contardi et al. 2001). However this approach requires colloid concentration data which are not available. While colloid transport is unlikely for the uranium isotopes, there is greater potential for colloid transport for americium and plutonium species. Geckeit et al. (2008) have developed a scenario
Geochemical Modeling 17
Radionuclide Geochemical Modeling for the Clive DU PA 28 May 2011
for colloid transport of trivalent actinides. Their modeling supports the theory that colloidal actinide transport is driven by radionuclide-colloid interaction, agglomeration, filtration, and sorption of colloids to mineral surfaces in the bulk phase. Polyvalent actinides appear to be the most prone to colloid transport but the relevance of colloid transport in general is controversial. Retention of colloids is favored at high ionic strength, low pH and in impermeable rock. The high ionic strength conditions in the saturated zone at Clive are counter to conditions considered favorable for colloid transport.
In many cases the solubility of radionuclide species used in the transport model was based to some extent on the data provided in the proposed Yucca Mountain Project (LANL 1997) and the Nevada National Security Site (NNSS, formerly the Nevada Test Site) (Sandia 2001) modeling. These data provide a starting basis for the central tendency value used in the solubility distributions for several of the radionuclide species. The Yucca Mountain, NNSS, and the Clive, Utah locations have many common geochemical conditions such that the solubility for the minor constituents (those other than uranium) can be modeled similarly. There are noted differences between the three sites but these references provide a good basis for selecting solubility since much of the chemistry is similar with respect to redox, carbonate chemistry, low organic matter content, and pH.
The Yucca Mountain unsaturated zone water is characterized as oxidizing (Eh estimated at 400 to 600 mV) and the partial pressure of carbon dioxide will be variable with depth resulting in a pH of 7 to 8. The saturated zone water at Yucca Mountain is characterized as having a pH also in the range of 7 to 8 and oxidizing to reducing conditions depending upon whether the waters have access to atmospheric oxygen or to reducing agents (Kerrisk, 1987). With the exception of the very high ionic strength of the shallow aquifer, this is similar to the conditions at the Clive site. The waste zone at the Clive facility will likely have redox conditions very similar to those in the unsaturated zone at Yucca Mountain. The high ionic strength brine found in the shallow aquifer at Clive can increase the solubilities of some actinides (DOE 2009) and this influence was incorporated into the decision making for solubility selection and modeling. However, the three locations do also have very different mineralogy and soil properties that can influence the ion-exchange and sorption constraints in this model.
At the NNSS, data from Frenchman Flat (Sandia 2001) indicate that elemental composition of minerals and total oxide concentrations of the sediments remain fairly constant with depth. The alluvium has a composition of approximately 65% SiO2 and 13% Al2O3. Very little clay is present. Some accumulation of calcium carbonate, in certain horizons are found as coatings on clasts and with pendants of pebbles and sand beneath, indicating repeated periods of surface stability in the Quaternary. Water does not move downward under current climate conditions in the unsaturated zone and this is expected to continue within the next 10,000 years. The unsaturated zone moisture content is low, roughly 5 to 10% to 40 meters with a pH range of 7 to 9 and a high Eh. The alluvium is dominated by quartz, feldspar, cristobalite, with calcite, gypsum, and minor amounts of clays and zeolites.
Geochemical Modeling 18
Radionuclide Geochemical Modeling for the Clive DU PA 28 May 2011
5.1 Solubility by element5.1.1 ActiniumThe only stable oxidation form of actinium is the +3 ion (Morss et al., 1977). Actinium forms hydrolysis complexes with the Ac(OH)3 species and the solubility is reported at 0.74 mg/L (2.6 x 10⁻⁶ M).
At Yucca Mountain the actinium solubility used in the Total System Performance Assessment (TSPA) model ranges from 10-10 M to 10-6 M (LANL 1997). For this PA model, a similar range was used, though the lower end was raised by a factor of 100.
5.1.2 AmericiumAmericium exists in the +3 oxidation state in natural waters and forms carbonate complexes at pH values above 7 (EPA 2004, Serne 2007). The americium solids that would likely control the solubility include Am (OH)3, AmOHCO3, and Am2(CO3)3. At Yucca Mountain the americium solubility used in the TSPA model ranged from 10-10 M to 10-6 M (LANL 1997). A similar range is used in this PA model.
5.1.3 CesiumCesium exists in the +1 oxidation state (EPA 1999c) with little tendency to form aqueous complexes. The dominant form at the site would be as the Cs+ ion. Cesium has a high solubility, with little tendency to precipitate, therefore a conservatively high solubility was used for this PA model, with a fairly narrow range.
5.1.4 IodineIodine can form a number of oxidation states, but within the Eh and pH conditions expected at the Clive facility, iodine is expected to exist in the -1 oxidation form. This is consistent with the modeling provided by EPA (1999c). In addition to dissolving and sorbing reactions, iodine can also volatilize to the gas phase either as I2 (molecular iodine) or hydrogen iodide and organic (e.g. methyl) iodides. Iodine is not likely to form minerals due to the very low concentrations that would be encountered. Nevertheless, solubility could be controlled via iodine minerals. The distribution used for iodine in this PA model reflects the high solubility.
5.1.5 LeadUnder the environmental conditions at the site lead will exist in the +2 oxidation state (EPA 1999c). However, lead has very low solubility with values of 10-8 M in natural waters, with the dissolved species PbCO3 the dominant form above pH 7. Lead species include hydrolysis and carbonate complexes, with the later more prevalent above pH 7. Lead carbonate (e.g cerussite, hydrocerussite), sulfate (anglesite) and phosphates (chlorophyromorphite) minerals control lead solubility under oxidizing conditions (EPA 1999c). At Yucca Mountain the lead solubility used in the TSPA model ranged from 10-8 M to 10-5 M, with an expected value of 10-6.5 M. (LANL 1997). This same general range is used in all three zones for this PA model.
5.1.6 NeptuniumNeptunium can exist in several oxidation states, but only +4 and +5 are reasonable for the Clive site. Np(V) is relatively mobile due to the high solubilities of associated minerals and low
Geochemical Modeling 19
Radionuclide Geochemical Modeling for the Clive DU PA 28 May 2011
sorption. Np (V) is expected to be present as NpO2 + (EPA 2004). Np (IV) however, forms solids of low solubility though these are restricted to reducing conditions. Neptunium can form carbonate complexes but this is generally limited to pH conditions above 8. In carbonate rich systems with high sodium and potassium, as found at the Clive facility, several sodium (e.g. 2NaNpO2CO3•7H2O) and potassium based mineral forms of Np can control the solubility. Due to the high solubilities of these minerals Np can be found at levels in the 10-4 M or greater concentration. At Yucca Mountain the neptunium solubility used in the TSPA model ranged from 10-8 M to 10-2 M, with an expected value of 10-4 M (LANL 1997).
5.1.7 PlutoniumPlutonium can exist in four different oxidation states: +3, +4, +5, and +6 with Pu(IV), Pu(V), and Pu(VI) expected under oxidizing conditions, such as those found at the site (EPA 1999c). Plutonium forms strong hydroxy-carbonate complexes with the tetravalent complex [Pu(OH)2(CO3)2
2-] a likely dominant form at the Clive site. Pu(VI) can also form complexes with chloride ion under oxidizing conditions in high ionic strength solutions (Clark and Tait, 1996). Dissolved plutonium in the natural environmental is typically very low, in the 10-15 M range (EPA 1999c), though higher levels are possible where a solid phase is present. At Yucca Mountain the plutonium solubility used in the TSPA model ranged from 10-10 M to 10-6 M, with an expected value of 10-8 M. (LANL 1997). A similar range is used for this PA model.
5.1.8 ProtactiniumProtactinium can exist in two oxidation states in natural waters, +4 and +5. Both forms have a propensity to form hydrolysis complexes (Morss, et al. 1977). Protactinium will also form complexes with halides (F–, Cl–, Br–, I–) and sulfate. Very little information is available on the protactinium species in circumneutral pH range. At Yucca Mountain the protactinium solubility used in the TSPA model ranged from 10-10 M to 10-5 M (LANL 1997). A similar range is used for this model.
5.1.9 RadiumRadium only exists in the +2 oxidation state in nature and is generally found uncomplexed as Ra2+ (EPA 2004). Radium has similar chemical behavior as barium and forms a co-precipitate as a sulfate [(Ba,Ra) SO4]. This co-precipitate would likely control the solubility at the Clive site if radium reaches levels for saturation. At Yucca Mountain, the radium solubility used in the TSPA model ranged from 10-9 M to 10-5 M, with an expected value of 10-7 M. (LANL 1997). For this PA, a similar range was used with a central tendency value higher by a factor of 10.
5.1.10 RadonRadon, in the form of 222Rn, is the longest-lived of all radon isotopes with a half life of 3.8 days and is considered the most environmentally important isotope. Radon exists as an essentially inert gas and does not precipitate or sorb to any significant extent, but will partition between aqueous and gas phases, according to its Henry’s Law constant, as discussed in the Unsaturated Zone Modeling white paper. In the unsaturated zone radon will mainly exist in the gas phase, but is soluble and within all zones the solubility is temperature sensitive. A fairly narrow solubility range based on values from Langmuir (1997) was used in this PA model since temperature is likely the largest factor impacting this species solubility.
Geochemical Modeling 20
Radionuclide Geochemical Modeling for the Clive DU PA 28 May 2011
5.1.11 StrontiumStrontium is expected to exist in the Sr2+ form in the aqueous environments at the Clive site. Strontium has minimal tendency to form inorganic complexes (EPA 1999c), has a similar ionic radius to that of calcium, and forms similar minerals including celestite (SrSO4) and strontianite (SrCO3). In alkaline conditions with sufficient concentration, strontianite, or co-precipitation with calcite and anhydrite, is expected to control the Sr2+ concentration. At Yucca Mountain the strontium solubility used in the TSPA model ranged from 10-6 M to 10-3 M. (LANL 1997). A similar range was used for this PA model.
5.1.12 TechnetiumTechnetium can exist in multiple oxidation states, but +7 is dominant under oxidizing conditions (EPA 2004, Langmuir 1997, Wildung et al. 2004). In oxidizing conditions the species is the oxyanion TcO4
– which is highly soluble and is not known to form complexes. Under slightly reducing conditions technetium exists an an uncharged hydroxide. Under stronger reducing conditions technetium can form a very insoluble form. For this PA model, a solubility centered around 10 -3 M was used.
5.1.13 ThoriumThorium is expected to exist in the 4+ form at the Clive site. Thorium forms hydroxyl complexes as well as carbonate and inorganic anion complexes. Thorium has very low solubility (EPA 1999c). Hydrous thorium oxide can be used to develop a maximum solubility. At Yucca Mountain the thorium solubility used in the TSPA model ranged from 10-10 M to 10-7 M. (LANL 1997). This value is consistent with values in EPA (1999c), which described a range of 10-8.5 M to 10-9 M for a pH range of 5 to 9. The solubility of hydrous thorium oxide increases 2 to 3 orders of magnitude with increasing ionic strength (EPA 1999c). This behavior is significant for the shallow aquifer zone of this model resulting in a solubility range that was chosen near the upper end of that used in the Yucca Mountain repository study.
5.1.14 Uranium 5.1.14.1 Uranium Forms and Geochemical Model Parameters
The DU waste proposed for disposal at the Clive facility is in two main uranium oxide forms: UO3 and U3O8. Uranium trioxide, UO3, is the waste form received from SRS. The uranium oxides expected to be produced at the deconversion plants in Portsmouth, OH, and Paducah KY (the GDP DU) are anticipated to be predominantly U3O8, with small amounts of UO2. The U.S. DOE has characterized U3O8 as insoluble (ANL 2010, DOE 2001). The exact solid phase that will control uranium solubility for the Clive Facility is not known and would require extensive laboratory testing to determine. Based upon the results outlined by the several research groups described above, schoepite likely is the major contributor, and this solid was selected to develop the solubility distribution in this PA for the UO3 form. This is a conservative assumption in that schoepite is more soluble than uranyl carbonate and much more soluble than U3O8. The solubility of U3O8 is also incorporated into the GoldSim model.
Due to the importance of uranium solubility to this PA, the input distribution was derived from geochemical modeling. The model Visual MINTEQ (Gustafsson 2011) was utilized. This geochemical code is based on the EPA MINTEQA2 program, and was used with its default
Geochemical Modeling 21
Radionuclide Geochemical Modeling for the Clive DU PA 28 May 2011
database. MINTEQ allows for a large number of uranium mineral forms to be examined. The following were considered the most important for this PA: schoepite, U3O8 (crystalline), U4O9
(crystalline), UO2 (amorphous), B_UO2(OH)2, rutherfordine, and uraninite.
Under oxidizing subsurface conditions U(VI) as the UO22+ uranyl complex, is the predominant
oxidation state and is not easily reduced geochemically. Experiments by Reed et al. (1996) indicate the uranyl complex can persist for over two years, even under high ionic strength anoxic conditions. However, with strongly reducing conditions the U(IV) species can form. Based on the pH and redox conditions at Clive, aqueous uranium is expected to be predominantly in the +6 form [U(VI)] in all three zones (Langmuir 1997, EPA 1999c). However, some of the groundwater measurements do indicate areas of negative Eh (reducing conditions) where uranium could exist in either the U(V) or U(IV) form if bioreduction or reduced iron exists. Under low carbonate levels uranium exists as a polynuclear hydrolysis species. However, the carbonate chemistry associated with the groundwater and the atmospheric CO2 partial pressure will promote the formation of carbonate complexes with uranium. These complexes can increase the overall uranium solubility. The carbonate complex UO2(CO3)3
4– is accepted as a major complex at high carbonate concentrations (Clark et al., 1995, Langmuir 1997). The solid, uranyl carbonate, UO2CO3, can also potentially limit the uranium solubility (DOE 2009). Studies where this was the dominant species indicates that solubilities decreases with increasing ionic strength. Divalent metal uranium carbonate complexation [e.g., Ca2UO2(CO3)3(aq)] is also possible (Bernhard, et al. 2001, Wan et al. 2008).
The scenario within the waste and unsaturated zones is expected to be somewhat analogous to the experimental system described by Wronkiewics et al. (1992) and also modeled by De Windt et al. (2003). In the work by Wronkiewics et al. the Unsaturated Test Method was used to study the dissolution and precipitation of UO2 at 90 degrees Celsius. Note that UO2 is uncommon in the Clive inventory, but may make up a small amount of the GDP DU. The UO2 was freshly prepared containing natural uranium isotope abundances and leached with water from well J-13 near Yucca Mountain, Nevada that had been equilibrated with local tuff. During the course of the test, this leachate was periodically injected into the top of the system, water samples were collected, and the UO2 was visually inspected. They found an initially low concentration of uranium in the outflow followed by a slug of uranium that leveled off over the circa 238-week (4.5-yr) period. Formic and oxalic acids were detected in the leachate but not found in the starting material. This was attributed this to a potential radiolytic effect. Of particular importance was the change in uranium oxide phases with time. A number of secondary uranium oxides were formed as the uranium first dissolved, then later precipitated as a different oxide. Schoepite (UO3•xH2O), dehydrated schoepite (UO3), uranophane and a number of other uranium hydroxide minerals including uranium alkali silicates were formed. In all cases these indicated uranium was present only in the U(VI) redox state. The solubility limit, based upon the steady-state uranium release after two years of leaching, was attributed to precipitation of uranyl silicates on the surface, limiting additional dissolution. De Windt et al. (2003) modeled UO2
oxidative dissolution in a saturated zone under oxidizing conditions. They found that uranium mobility was controlled by schoepite, the dominant mineral formed. The total uranium concentration decreased for the first 100 years from a maximum of approximately 400 µM to a constant 10-5 M after consumption of all of the UO2. This mineral paragenesis is similar to that observed for oxidized zones in natural uraninite. Modeling by Langmuir (1997) indicates that
Geochemical Modeling 22
Radionuclide Geochemical Modeling for the Clive DU PA 28 May 2011
uranium solubility based on schoepite ranges from 10-6 M to 10-4 M, depending upon pCO2 levels. This is consistent with the values in the Wronkiewics et al. (1992) study and modeled by De Windt (2003). Though analogous to what can happen at the Clive facility, it is critical to realize Wronkiewics et al. and De Windt started with a very soluble form of uranium, UO2, as compared with the much more stable UO3 and especially U3O8 DU waste at Clive. U3O8 is considered one of the most thermodynamically and kinetically stable forms of uranium. Also of note above was the potential for dissolution to be reduced by the formation of less soluble uranyl silicates on the surface of the starting material.
At the Clive Facility, should formic and oxalic acid be formed radiolytically, they also could increase the overall uranium solubility (Langmuir, 1997). However, the generation of these acids is not expected to be significant nor should it have a significant effect on pH. This is especially true for any water that leaches from the waste zone into the shallow aquifer due to the buffering capacity of this aquifer. As such, this effect would be transitory at best.
To derive uranium solubility distributions and speciation, the geochemical modeling program was run in individual batches, where for a given run the parameters pH, temperature (13°C), pe (Eh), and water density were fixed. Multiple runs were performed by adjusting a single parameter. The effect of temperature on solubility, with a range of approximately 10°C to 25°C, is insignificant relative to the uncertainty of measurements and modeling. A single temperature value of 13°C was used in the geochemical modeling. To account for the thermodynamic activity in this high TDS saturated zone system, the Bronsted-Guggenheim-Scatchard specific ion interaction theory (SIT) (Nordstrom and Munoz, 1994) model is utilized. The SIT model is applicable to high ionic strength solutions up to approximately 4 molal. When lower TDS parameters were utilized the Davies equation was employed. Most of the thermodynamic parameters used in Visual MINTEQ for the uranium species are derived from the Nuclear Energy Agency database (2003) available in the Visual MINTEQ program.
The level of ions other than uranium used in the geochemical modeling was set for two different conditions. The first condition was set based on the ions found as the average of the data from well GW-25 at the Clive facility. The groundwater chemistry of this well and several others is shown in Tables 5 and 6, representing the conditions in the very high TDS shallow aquifer. Modeling indicated that pH and bicarbonate/pCO2 had the largest influence on total uranium concentrations within the Eh range of 800 to -200 mV. When the redox conditions were reduced to -500 mV, U3O8 precipitated at very low uranium concentrations. These low redox conditions are not anticipated at Clive except under transient conditions. A second set of geochemical modeling runs was performed under much lower TDS conditions. In this set lower sodium and chlorine levels were chosen to more closely represent the water phase in the unsaturated zones, at least in the upper waste prior to significant salt dissolution. The mineral form of uranium anticipated from the two main sites SRS (as schoepite, a form of UO3,) and the GDPs (as U3O8) were included as infinite solids in separate geochemical models. Basing solubility limits solely on a solid phase is not without uncertainty (OECD 1997, Chapter IV). So, solubility distributions are incorporated into the PA to account for this uncertainty. The pH, Eh, and carbonate conditions were varied and the resulting total uranium concentration was calculated. Uranium solubility limits were based on the concentration at which each mineral reached saturation. Differences between the high ionic strength modeling runs and those with lower
Geochemical Modeling 23
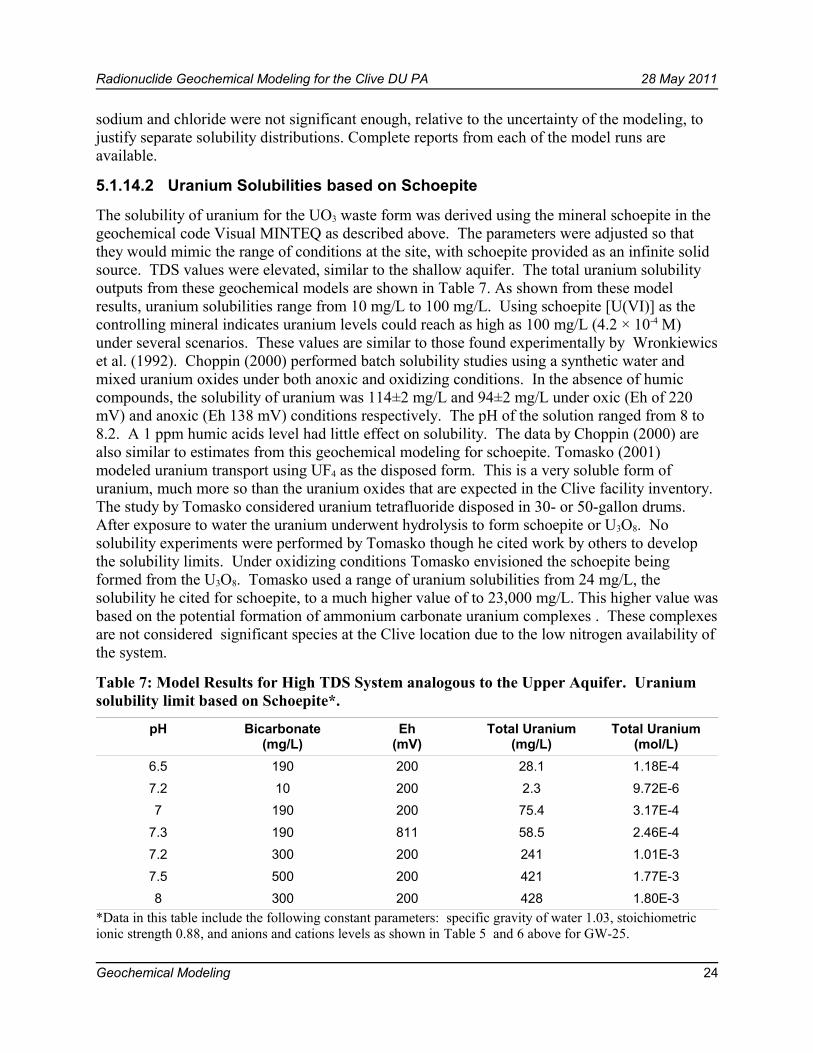
Radionuclide Geochemical Modeling for the Clive DU PA 28 May 2011
sodium and chloride were not significant enough, relative to the uncertainty of the modeling, to justify separate solubility distributions. Complete reports from each of the model runs are available.
5.1.14.2 Uranium Solubilities based on Schoepite
The solubility of uranium for the UO3 waste form was derived using the mineral schoepite in the geochemical code Visual MINTEQ as described above. The parameters were adjusted so that they would mimic the range of conditions at the site, with schoepite provided as an infinite solid source. TDS values were elevated, similar to the shallow aquifer. The total uranium solubility outputs from these geochemical models are shown in Table 7. As shown from these model results, uranium solubilities range from 10 mg/L to 100 mg/L. Using schoepite [U(VI)] as the controlling mineral indicates uranium levels could reach as high as 100 mg/L (4.2 × 10⁻⁴ M) under several scenarios. These values are similar to those found experimentally by Wronkiewics et al. (1992). Choppin (2000) performed batch solubility studies using a synthetic water and mixed uranium oxides under both anoxic and oxidizing conditions. In the absence of humic compounds, the solubility of uranium was 114±2 mg/L and 94±2 mg/L under oxic (Eh of 220 mV) and anoxic (Eh 138 mV) conditions respectively. The pH of the solution ranged from 8 to 8.2. A 1 ppm humic acids level had little effect on solubility. The data by Choppin (2000) are also similar to estimates from this geochemical modeling for schoepite. Tomasko (2001) modeled uranium transport using UF4 as the disposed form. This is a very soluble form of uranium, much more so than the uranium oxides that are expected in the Clive facility inventory. The study by Tomasko considered uranium tetrafluoride disposed in 30- or 50-gallon drums. After exposure to water the uranium underwent hydrolysis to form schoepite or U3O8. No solubility experiments were performed by Tomasko though he cited work by others to develop the solubility limits. Under oxidizing conditions Tomasko envisioned the schoepite being formed from the U3O8. Tomasko used a range of uranium solubilities from 24 mg/L, the solubility he cited for schoepite, to a much higher value of to 23,000 mg/L. This higher value was based on the potential formation of ammonium carbonate uranium complexes . These complexes are not considered significant species at the Clive location due to the low nitrogen availability of the system.
Table 7: Model Results for High TDS System analogous to the Upper Aquifer. Uranium solubility limit based on Schoepite*.
pH Bicarbonate (mg/L)
Eh(mV)
Total Uranium (mg/L)
Total Uranium (mol/L)
6.5 190 200 28.1 1.18E-47.2 10 200 2.3 9.72E-67 190 200 75.4 3.17E-4
7.3 190 811 58.5 2.46E-47.2 300 200 241 1.01E-37.5 500 200 421 1.77E-38 300 200 428 1.80E-3
*Data in this table include the following constant parameters: specific gravity of water 1.03, stoichiometric ionic strength 0.88, and anions and cations levels as shown in Table 5 and 6 above for GW-25.
Geochemical Modeling 24
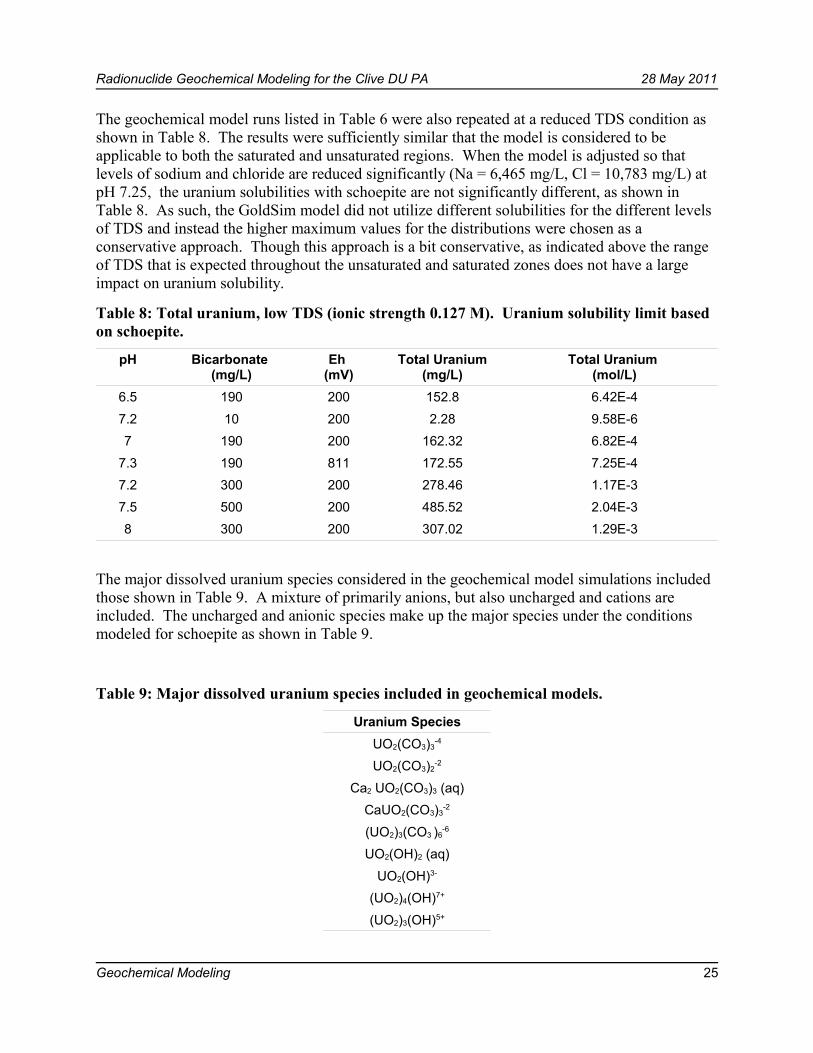
Radionuclide Geochemical Modeling for the Clive DU PA 28 May 2011
The geochemical model runs listed in Table 6 were also repeated at a reduced TDS condition as shown in Table 8. The results were sufficiently similar that the model is considered to be applicable to both the saturated and unsaturated regions. When the model is adjusted so that levels of sodium and chloride are reduced significantly (Na = 6,465 mg/L, Cl = 10,783 mg/L) at pH 7.25, the uranium solubilities with schoepite are not significantly different, as shown in Table 8. As such, the GoldSim model did not utilize different solubilities for the different levels of TDS and instead the higher maximum values for the distributions were chosen as a conservative approach. Though this approach is a bit conservative, as indicated above the range of TDS that is expected throughout the unsaturated and saturated zones does not have a large impact on uranium solubility.
Table 8: Total uranium, low TDS (ionic strength 0.127 M). Uranium solubility limit based on schoepite.
pH Bicarbonate (mg/L)
Eh (mV)
Total Uranium (mg/L)
Total Uranium (mol/L)
6.5 190 200 152.8 6.42E-47.2 10 200 2.28 9.58E-67 190 200 162.32 6.82E-4
7.3 190 811 172.55 7.25E-47.2 300 200 278.46 1.17E-37.5 500 200 485.52 2.04E-38 300 200 307.02 1.29E-3
The major dissolved uranium species considered in the geochemical model simulations included those shown in Table 9. A mixture of primarily anions, but also uncharged and cations are included. The uncharged and anionic species make up the major species under the conditions modeled for schoepite as shown in Table 9.
Table 9: Major dissolved uranium species included in geochemical models.
Uranium SpeciesUO2(CO3)3
-4
UO2(CO3)2-2
Ca2 UO2(CO3)3 (aq)CaUO2(CO3)3
-2
(UO2)3(CO3 )6-6
UO2(OH)2 (aq)UO2(OH)3-
(UO2)4(OH)7+
(UO2)3(OH)5+
Geochemical Modeling 25
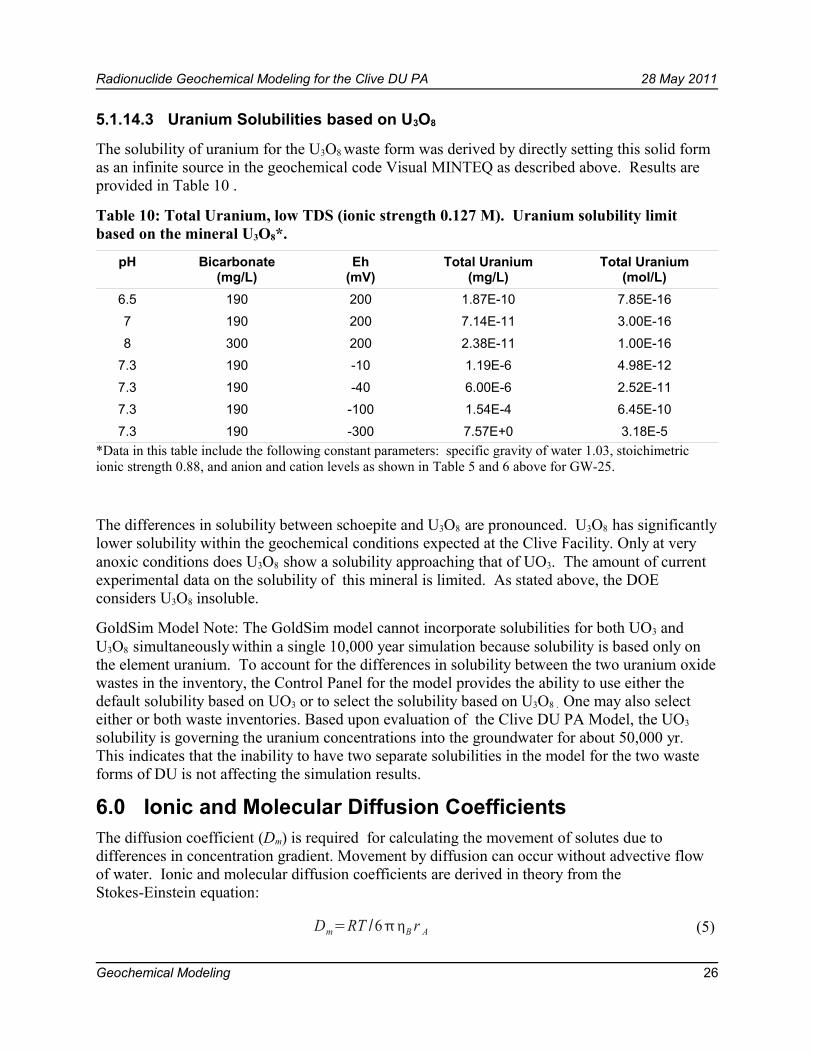
Radionuclide Geochemical Modeling for the Clive DU PA 28 May 2011
5.1.14.3 Uranium Solubilities based on U3O8
The solubility of uranium for the U3O8 waste form was derived by directly setting this solid form as an infinite source in the geochemical code Visual MINTEQ as described above. Results are provided in Table 10 .
Table 10: Total Uranium, low TDS (ionic strength 0.127 M). Uranium solubility limit based on the mineral U3O8*.
pH Bicarbonate(mg/L)
Eh(mV)
Total Uranium(mg/L)
Total Uranium(mol/L)
6.5 190 200 1.87E-10 7.85E-167 190 200 7.14E-11 3.00E-168 300 200 2.38E-11 1.00E-16
7.3 190 -10 1.19E-6 4.98E-127.3 190 -40 6.00E-6 2.52E-117.3 190 -100 1.54E-4 6.45E-107.3 190 -300 7.57E+0 3.18E-5
*Data in this table include the following constant parameters: specific gravity of water 1.03, stoichimetric ionic strength 0.88, and anion and cation levels as shown in Table 5 and 6 above for GW-25.
The differences in solubility between schoepite and U3O8 are pronounced. U3O8 has significantly lower solubility within the geochemical conditions expected at the Clive Facility. Only at very anoxic conditions does U3O8 show a solubility approaching that of UO3. The amount of current experimental data on the solubility of this mineral is limited. As stated above, the DOE considers U3O8 insoluble.
GoldSim Model Note: The GoldSim model cannot incorporate solubilities for both UO3 and U3O8 simultaneously within a single 10,000 year simulation because solubility is based only on the element uranium. To account for the differences in solubility between the two uranium oxide wastes in the inventory, the Control Panel for the model provides the ability to use either the default solubility based on UO3 or to select the solubility based on U3O8 . One may also select either or both waste inventories. Based upon evaluation of the Clive DU PA Model, the UO3
solubility is governing the uranium concentrations into the groundwater for about 50,000 yr. This indicates that the inability to have two separate solubilities in the model for the two waste forms of DU is not affecting the simulation results.
6.0 Ionic and Molecular Diffusion CoefficientsThe diffusion coefficient (Dm) is required for calculating the movement of solutes due to differences in concentration gradient. Movement by diffusion can occur without advective flow of water. Ionic and molecular diffusion coefficients are derived in theory from the Stokes-Einstein equation:
Dm=RT /6B r A (5)
Geochemical Modeling 26
Radionuclide Geochemical Modeling for the Clive DU PA 28 May 2011
where
R = universal gas constant,T = temperature,ηB = absolute viscosity of the solvent (water), and rA = radius of the assumed spherical solute.
A variety of empirical equations have been derived based on the Stokes-Einstein equation for different scenarios. For a dilute solution of a single salt the diffusion coefficient can be derived from the Nernst-Haskell equation (Reid et al., 1987). This equation includes the valence of the cation and anions as well as ionic conductances. Specific ionic conductances are required for each cation and anion species. When two or more chemical species are present at different concentrations, interdiffusion (counterdiffusion) must be included to satisfy electroneutrality (Lerman 1979). For a geochemical system as large as that found in radioactive waste disposal facilities this quickly becomes too complex to model, even if ionic conductivities are available for each species. An additional difficulty in deriving ion-specific diffusion coefficients lies in the large number of potential ions. The number of radioactive waste elements typically modeled may be 30 to 40, and for each element in this list one can expect multiple forms. For example, U has 4 redox states, and many soluble species for each of these. Assuming oxic conditions U will be primarily found as UO2(CO3)3
4–, UO2(CO3)22–, and UO2CO3, but there are at least 8 additional forms of
U(+6) that may be found. Thus the potential number of ions that would need to be included in the model would easily be in the hundreds. Obtaining the parameters for each species that would be required to model the ionic diffusion would be difficult. Given these issues with developing ion-specific values of Dm , the approach used in modeling diffusion in the PA model is to use a range of Dm values. This range can be derived from Table 3.1 in Lerman (1979). For conditions near 25°C, the range of Dm for the elements of interest is 4 × 10⁻⁶ to 2 × 10⁻⁵ cm2/s. For cooler temperatures, which would be expected in the deeper subsurface, the values are somewhat lower. The values for 25°C are reproduced in Table 11.
Geochemical Modeling 27
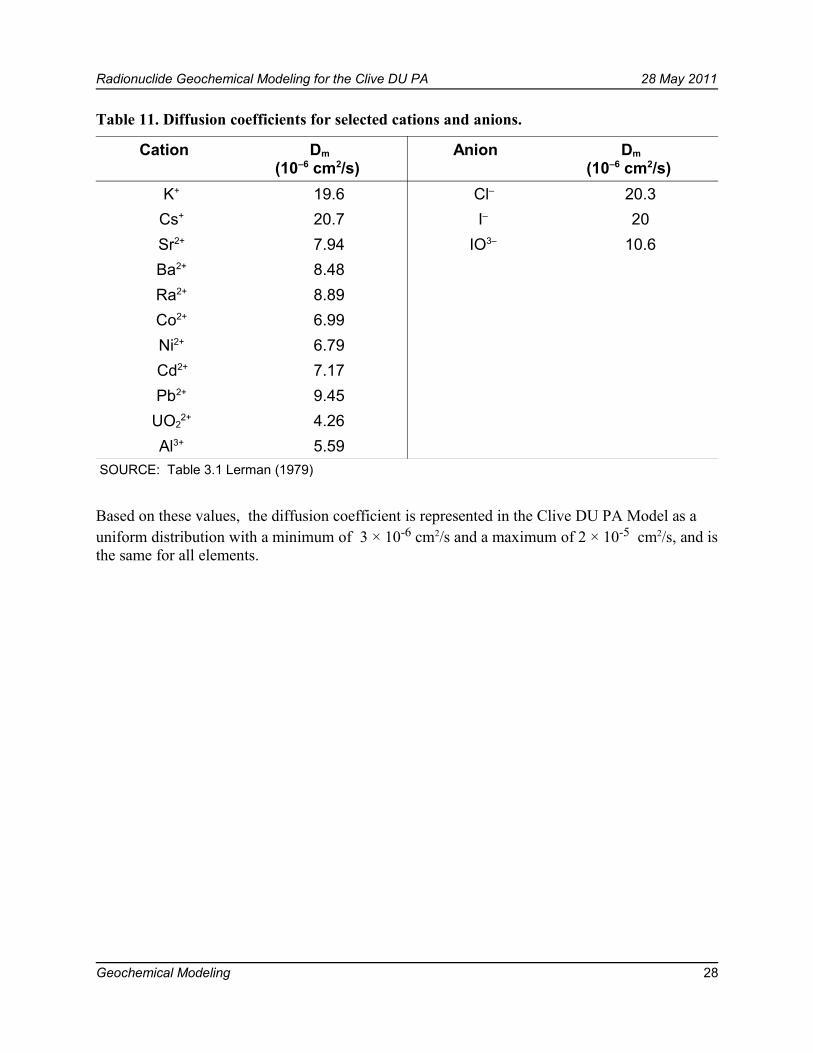
Radionuclide Geochemical Modeling for the Clive DU PA 28 May 2011
Table 11. Diffusion coefficients for selected cations and anions.
Cation Dm
(10–6 cm2/s) Anion Dm
(10–6 cm2/s) K+ 19.6 Cl– 20.3Cs+ 20.7 I– 20Sr2+ 7.94 IO3– 10.6Ba2+ 8.48Ra2+ 8.89Co2+ 6.99Ni2+ 6.79Cd2+ 7.17Pb2+ 9.45
UO22+ 4.26
Al3+ 5.59SOURCE: Table 3.1 Lerman (1979)
Based on these values, the diffusion coefficient is represented in the Clive DU PA Model as a uniform distribution with a minimum of 3 × 10⁻⁶ cm2/s and a maximum of 2 × 10⁻⁵ cm2/s, and is the same for all elements.
Geochemical Modeling 28
Radionuclide Geochemical Modeling for the Clive DU PA 28 May 2011
7.0 ReferencesAdrian Brown Consultants, Response to UDEQ Kd Interrogatories, Dated April 22, 1997 Report
3101B.970422.
ANL Characteristics of Uranium. Web site accessed 2010. http://web.ead.anl.gov/uranium/guide/ucompound/propertiesu/octaoxide.cfm
Beals, D. M., S. P. LaMont, J. R. Cadieux, C. R. Shick, and G. Hall. Determination of Trace Radionuclides in SRS Depleted Uranium (DU). November 19, 2002. WSRC-TR-2002-00536 Westinghouse Savannah River Company, SRS, Aiken, SC 29808.
Bernhard G, G Geipel, T Riech, V Brendler, S Amayri, and H Nitsche. 2001. Uranyl (VI) Carbonate Complex Formation: Validation of the Ca2UO2(CO3)3 (aq) Species. Radiochimica Acta 89:511-518.
Bingham Environmental, 1991. Hydrogeologic Report Envirocare Waste Disposal FacilitySouth Clive, Utah. Final version October 9, 1991.
Bingham Environmental, Project Memorandum. Summary of Results, Radionuclide Kd Tests, Envirocare Disposal Landfills, Clive, Utah. August 3, 1995.
Bingham Environmental, Project Memorandum. Summary of Results, Radionuclide Kd Tests, Envirocare Disposal Landfills, Clive, Utah. January 25, 1996.
Choppin, Gregory R. Idaho National Engineering and Environmental Laboratory Publication. INEEL/EXT-01-00762 Rev. 0. November 2000. Actinide Solubility Experiments in INEEL Perched Simulant Solution.
Clark, D. L. and Tait, C. D. 1996. Monthly Reports Under SNL Contract AP2274, Sandia WIPP Central File A:WBS 1.1.10.1.1. These data are qualified under LANL QAPjP CST-OSD-QAP1-001/0. WPO 31106.
Clark, D. L., D. E. Hobart, and M. P. Neu. Actinide Carbonate Complexes and Their Importance in Actinide Environmental Chemistry. Chemical Reviews, Vol 95: 25. 1995
Contardi, J. S., D. R. Turner, and T. M Ahn. Modeling Colloid Transport for Performance Assessment. Journal of Contaminant Hydrology 47, 323-333, 2001.
Cui, D. and Eriksen, T. 1996. Reduction of Tc(VII) and Np(V) in solution by ferrous iron. SKP TR 96-03.
De Windt L., Burnol A., Montaranl P., van der Lee J. 2003. Intercomparison of reactive transport models applied to UO2 oxidative dissolution and uranium migration. Journal of Contaminant Hydrology 61, 303-312, 2003.
DOE 2001. http://web.ead.anl.gov/uranium/pdf/UraniumCharacteristicsFS.pdf
DOE. 2003. Publication 45185. Evaluation of Surface Complexation Models for Radionuclide Transport at the Nevada Test Site: Data Availability and Parameter Evaluation. D. Decker and C. Papelis. May, 2003.
Geochemical Modeling 29
Radionuclide Geochemical Modeling for the Clive DU PA 28 May 2011
DOE. 2009. Waste Isolation Pilot Plant (WIPP), SOTERM-2009. Title 40 CFR Part 191 Subparts B and C Compliance Recertification Application for the Waste Isolation Pilot Plant. Appendix SOTERM-2009 Actinide Chemistry Source Term.
Envirocare of Utah. Revised Hydrogeological Report for the Envirocare Waste Disposal Facility, Clive, Utah. Version 2.0, 2004.
Envirocare of Utah. Metals Distribution Coefficient Values Relevant to the EnvirocareSite. Memorandum and Report to the US Nuclear Regulatory Commission. 2000.
EPA. 1999b. Understanding Variation in Partition Coefficient, Kd, Values. Volume I. 402-R-99-004A. US Environmental Protection Agency, Washington, DC.
EPA. 1999c. Understanding Variation in Partition Coefficient, Kd, Values. Volume II (1999). 402-R-99-004C. US Environmental Protection Agency, Washington, DC.
EPA. 2004. Understanding Variation in Partition Coefficient, Kd, Values. Volume III. 402-R-04-002C. US Environmental Protection Agency, Washington, DC.
Geckeit, H. and T. Rabung. Actinide Geochemistry: From the Molecular Level to the Real System. Journal of Contaminant Hydrology 102, 187-195, 2008.
Glover, P. A., F. J. Miner and W. O. Polzer. 1976. “Plutonium and Americium Behavior in the Soil/Water Environment. I. Sorption of Plutonium and Americium by Soils.” In Proceedings of Actinide-Sediment Reactions Working Meeting, Seattle, Washington, pp. 225-254, BNWL-2117, Battelle Pacific Northwest Laboratories, Richland, Washington.
Gustafsson, J.P., 2011. Visual MINTEQ ver 3.0. Based on the USEPA MINTEQA2 software, (http://www2.lwr.kth.se/English/OurSoftware/vminteq/)
Heberling, F., B. Brendebach, and D. Bosbach. Neptunium(V) Adsorption to Calcite. Journal of Contaminant Hydrology 102, 246-252, 2008.
Hull, L. C, and A. L. Schaefer. 2008. Accelerated transport of 90Sr following a release of a high ionic strength solution in vadose zone sediments. Journal of Contaminant Hydrology 97, 135-157.
Johnson, G.L., and L.M. Toth. 1978. Plutonium(IV) and Thorium(IV) Hydrous Polymer Chemistry. ORNL/TM-6365. Oak Ridge, TN: Oak Ridge National Laboratory, Chemistry Division.
Kerrisk, Jerry F. Ground-Water Chemistry at Yucca Mountain, Nevada and Vicinity. LA-10929-MS February 1987
Krupka KM, RJ Serne, and DI Kaplan. 2004. Geochemical Data Package for the 2005 Hanford Integrated Disposal Facility Performance Assessment. PNNL-13037, Rev 2, Pacific Northwest National Laboratory, Richland, Washington.
Kumata, M., Vandergraaf, T.T. And Jujnke, D. G. 1993. The migration behavior of neptunium under deep geological conditions. Migration '93 Abstracts, p 73.
Geochemical Modeling 30
Radionuclide Geochemical Modeling for the Clive DU PA 28 May 2011
LANL (Los Alamos National Laboratory), LA-13262-MS. 1997. Summary and Synthesis Report on Radionuclide Retardation for the Yucca Mountain Site Characterization Project.
Last GV, EJ Freeman, KJ Cantrell, MJ Fayer, GW Gee, WE Nichols, BN Bjornstad, and DG Horton. 2004. Vadose Zone Hydrogeology Data Package for the 2004 Composite Analysis. PNNL-14702 Rev. 0, Pacific Northwest National Laboratory, Richland, Washington.
Lerman, A. 1979. Geochemical Processes in Water and Sediment Environments. Wiley-Interscience. QES71.L45
Langmuir, D. Aqueous Environmental Chemistry. Prentice Hall 1997.
Linsalata, P. and N. Cohen. Determination of the Distribution Coefficient of Plutonium in WATER-Secimetn Systems. Health Physics 39:1040-1041. 1980.
Morss, Lester, Norman M Edelstein, Jean Fuger, and Joseph Katz. The Chemistry of the Actinide and Transactinide Elements. Third Edition, Volume 1. 1977 Springer.
Nakata, K., Nagasaki, S., Tanaka, S., Sakamoto, Y., Tanaka, T. and Ogawa, H. 2002. Sorption and reduction of neptunium (V) on surface or iorn oxides. Radiochim. Acta 90 pp 665-669.
Nordstrom, D. K, and J. L. Munoz. 1994. Geochemical thermodynamics. 2nd edition. Cambridge, MA; Blackwell Scientific Publications, Inc.
OECD Publication 1997. Modelling in Aquatic Chemistry. Chapter IV, Raulf Grauer. Scientific Editors Ingmar Grenthe and Ignasi Puigdomenech
ORNL (Oak Ridge National Laboratory). 2000. J. R. Hightower, et al. Strategy for Characterizing Transuranics and Technetium Contamination in Depleted UF6 Cylinders. ORNL/TM-2000-242 Chemical Technology Division, ORNL. 2000.
Patterson, R.J., Spoel, T., 1981. Laboratory measurements of strontium distribution coefficeint Kd -Sr for sediments from a shallow sand aquifer. Water Resources Research 17 (3), 513-520.
Reed, D.T., D. R. Wygmans, and M. K. Richman. Actinide Stability/Solubility in Simulated WIPP Brines. Argonne National Laboratory, Actinide Speciation and Chemistry Group, Chemical Technology Group. Interim Report 1996.
Reid, R.C., Prausnitz, J.M., and Poling B.E., 1987. The Properties of Gases and Liquids, 4th Edition. McGraw-Hill, Inc. TP242.R4.
Sandia (Sandia National Laboratories) 2001. Compliance Assessment Document for the Transuranic Wastes in the Greater Confinement Disposal Boreholes at the Nevada Test Sites. Volume 2: Performance Assessment. Version 2.0.
Geochemical Modeling 31
Radionuclide Geochemical Modeling for the Clive DU PA 28 May 2011
Schaefer, Donald H., S. A. Thiros, and M. R. Rosen. Ground-Water Quality in the Carbonate-Rock Aquifer of the Great Basin, Nevada and Utah, 2003. U.S. Geological Survey, National Water-Quality Assessment Program. Scientific Investigations Report 2005-5232.
Scism, Cynthia D. 2006. The Sorption/Desorption Behavior of Uranium in Transport Studies using Yucca Mountain Alluvium. Los Alamos National Laboratory LA-14271-T. 2006.
Serne, R. Jeff. 2007. Kd Values for Agricultural and Surface Soils for Use in Hanford Site Farm, Residential, and River Shore Scenarios. Technical Report for Ground-Water Protection Project. PNNL-16531. August 2007.
Sheppard, Marsha., D. H. Thibault. 1990. Default Soil Solid/Liquid Partition Coefficients, KdS, for Four Major Soil Types: A Compendium. Health Physics Vol 59, No 4, pp 471-482. October 1990.
Tomasko, D., 2001, Groundwater Calculations for Depleted Uranium Disposed of as Uranium Tetrafluoride (UF4). ANL/EAD/TM-111, Argonne National Laboratory, Argonne, Ill.
USDA. Nat Resources Conservation Service, Tooele Area Soil Survey Utah, Version 5, Sept 2, 2009.
Vandergraaf, T. T., Ticknor, K.V., and George, I. M. 1984. Reactions between Technetium in Solution and Iron-Containing Minerals Under Oxic and Anoxic Conditions. ACS Symposium Series, 246, pp.25-43, Atomic Energy of Canada Limited Report, AECL-7957.
Vandergraaf, T. T., Ticknor, K.V., and Melnyk, T. W. 1993. The selection of a sorption data base for the geosphere model in the Canadian Nuclear Fuel Waste Management Program. Journal of Contaminant Hydrology, 13, 327-345.
Wan, J., T.K. Tokunaga, Y. Kim, Z. Wang, A. Lanzirotti, E. Saiz, and R.J. Serne, Effect of saline waste solution infiltration rates on uranium retention and spatial distribution in Hanford sediments, Environ. Sci. Technol., 42, 1973-1978, 2008.
Whetstone Associates. Technical Memorandum to Energy Solutions from Whetstone Associates, Oct 30, 2009.
Wildung, R. E., Li S. W., Murray, C. J., Krupka, K. M., Xie, Y., Hess, H. J., and Rogen, E.E. Technetium reduction in sediments of a shallow aquifer exhibiting dissimilatory iron reduction potential. FEMS Microbiology Ecology. 49, 151-162, 2004.
Wooyong Um, R. Jeffrey Serne, G. V. Last, R. E. Clayton, and E. T. Glossbrenner. The Effect of Gravel Size Fractions on the Distribution Coefficients of Selected Radionuclides. Journal of Contaminant Hydrology 107, 82-90, 2009.
Wronkiewicz, David J , Bates, J. K., Gerding, T. J., Veleckis, E., and Tani B. S. Journal of Nuclear Materials 190. 107-127. 1992.
Geochemical Modeling 32