Embed Size (px)
Citation preview
F
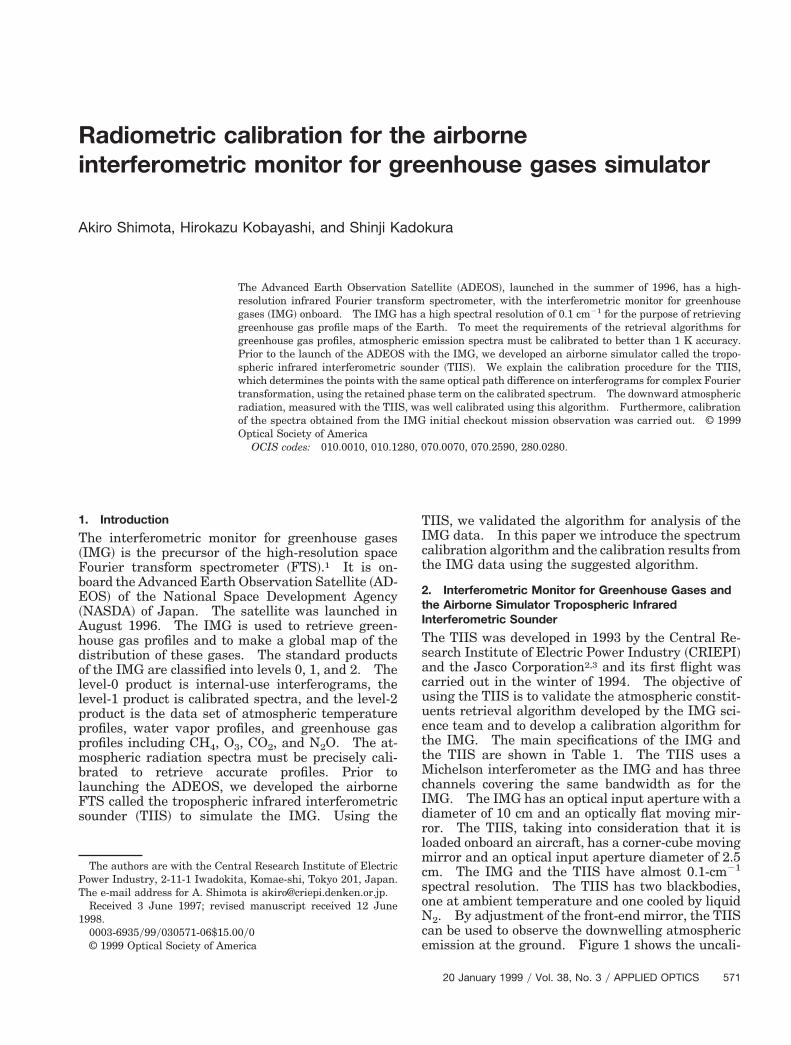
Radiometric calibration for the airborneinterferometric monitor for greenhouse gases simulator
Akiro Shimota, Hirokazu Kobayashi, and Shinji Kadokura
The Advanced Earth Observation Satellite ~ADEOS!, launched in the summer of 1996, has a high-resolution infrared Fourier transform spectrometer, with the interferometric monitor for greenhousegases ~IMG! onboard. The IMG has a high spectral resolution of 0.1 cm21 for the purpose of retrievinggreenhouse gas profile maps of the Earth. To meet the requirements of the retrieval algorithms forgreenhouse gas profiles, atmospheric emission spectra must be calibrated to better than 1 K accuracy.Prior to the launch of the ADEOS with the IMG, we developed an airborne simulator called the tropo-spheric infrared interferometric sounder ~TIIS!. We explain the calibration procedure for the TIIS,which determines the points with the same optical path difference on interferograms for complex Fouriertransformation, using the retained phase term on the calibrated spectrum. The downward atmosphericradiation, measured with the TIIS, was well calibrated using this algorithm. Furthermore, calibrationof the spectra obtained from the IMG initial checkout mission observation was carried out. © 1999Optical Society of America
OCIS codes: 010.0010, 010.1280, 070.0070, 070.2590, 280.0280.
a
1. Introduction
The interferometric monitor for greenhouse gases~IMG! is the precursor of the high-resolution space
ourier transform spectrometer ~FTS!.1 It is on-board the Advanced Earth Observation Satellite ~AD-EOS! of the National Space Development Agency~NASDA! of Japan. The satellite was launched inAugust 1996. The IMG is used to retrieve green-house gas profiles and to make a global map of thedistribution of these gases. The standard productsof the IMG are classified into levels 0, 1, and 2. Thelevel-0 product is internal-use interferograms, thelevel-1 product is calibrated spectra, and the level-2product is the data set of atmospheric temperatureprofiles, water vapor profiles, and greenhouse gasprofiles including CH4, O3, CO2, and N2O. The at-mospheric radiation spectra must be precisely cali-brated to retrieve accurate profiles. Prior tolaunching the ADEOS, we developed the airborneFTS called the tropospheric infrared interferometricsounder ~TIIS! to simulate the IMG. Using the
The authors are with the Central Research Institute of ElectricPower Industry, 2-11-1 Iwadokita, Komae-shi, Tokyo 201, Japan.The e-mail address for A. Shimota is [email protected].
Received 3 June 1997; revised manuscript received 12 June1998.
0003-6935y99y030571-06$15.00y0© 1999 Optical Society of America
TIIS, we validated the algorithm for analysis of theIMG data. In this paper we introduce the spectrumcalibration algorithm and the calibration results fromthe IMG data using the suggested algorithm.
2. Interferometric Monitor for Greenhouse Gases andthe Airborne Simulator Tropospheric InfraredInterferometric Sounder
The TIIS was developed in 1993 by the Central Re-search Institute of Electric Power Industry ~CRIEPI!nd the Jasco Corporation2,3 and its first flight was
carried out in the winter of 1994. The objective ofusing the TIIS is to validate the atmospheric constit-uents retrieval algorithm developed by the IMG sci-ence team and to develop a calibration algorithm forthe IMG. The main specifications of the IMG andthe TIIS are shown in Table 1. The TIIS uses aMichelson interferometer as the IMG and has threechannels covering the same bandwidth as for theIMG. The IMG has an optical input aperture with adiameter of 10 cm and an optically flat moving mir-ror. The TIIS, taking into consideration that it isloaded onboard an aircraft, has a corner-cube movingmirror and an optical input aperture diameter of 2.5cm. The IMG and the TIIS have almost 0.1-cm21
spectral resolution. The TIIS has two blackbodies,one at ambient temperature and one cooled by liquidN2. By adjustment of the front-end mirror, the TIIScan be used to observe the downwelling atmosphericemission at the ground. Figure 1 shows the uncali-
20 January 1999 y Vol. 38, No. 3 y APPLIED OPTICS 571
eEt
wt
Ctwgfspsucd
ptsl1
Table 1. Characteristics of the IMG and the TIIS
5
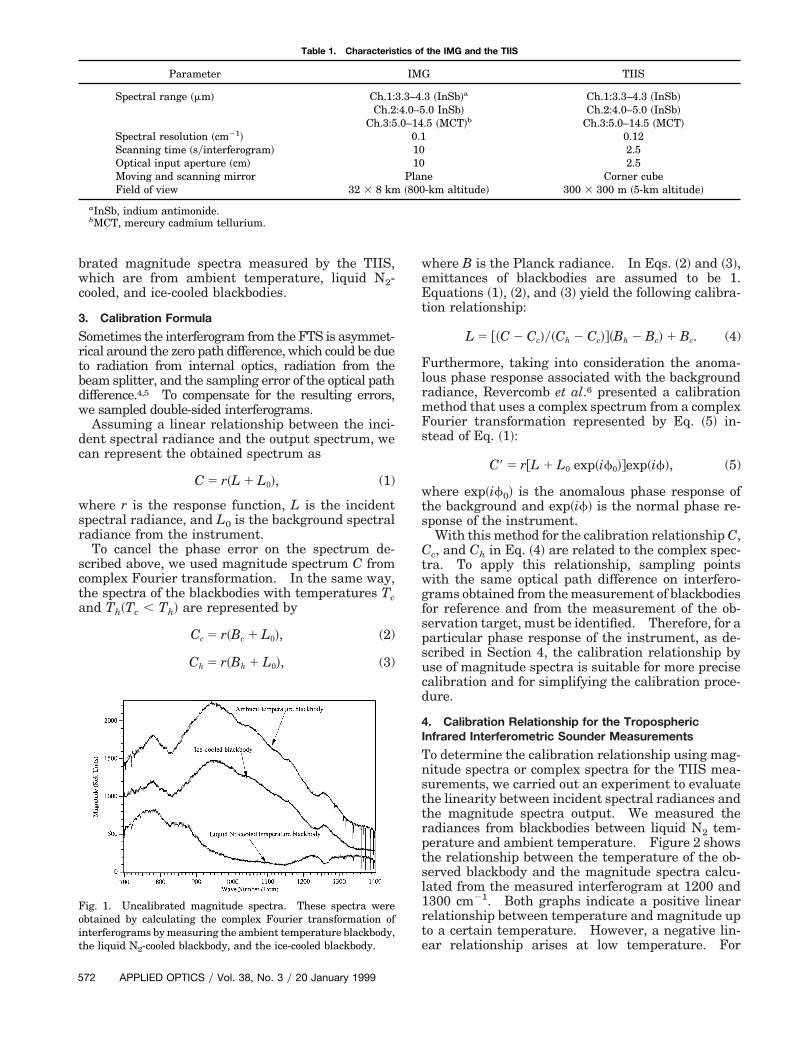
brated magnitude spectra measured by the TIIS,which are from ambient temperature, liquid N2-cooled, and ice-cooled blackbodies.
3. Calibration Formula
Sometimes the interferogram from the FTS is asymmet-rical around the zero path difference, which could be dueto radiation from internal optics, radiation from thebeam splitter, and the sampling error of the optical pathdifference.4,5 To compensate for the resulting errors,we sampled double-sided interferograms.
Assuming a linear relationship between the inci-dent spectral radiance and the output spectrum, wecan represent the obtained spectrum as
C 5 r~L 1 L0!, (1)
where r is the response function, L is the incidentspectral radiance, and L0 is the background spectralradiance from the instrument.
To cancel the phase error on the spectrum de-scribed above, we used magnitude spectrum C fromcomplex Fourier transformation. In the same way,the spectra of the blackbodies with temperatures Tcand Th~Tc , Th! are represented by
Cc 5 r~Bc 1 L0!, (2)
Ch 5 r~Bh 1 L0!, (3)
Fig. 1. Uncalibrated magnitude spectra. These spectra wereobtained by calculating the complex Fourier transformation ofinterferograms by measuring the ambient temperature blackbody,the liquid N2-cooled blackbody, and the ice-cooled blackbody.
Parameter
Spectral range ~mm! Ch.1:Ch.2
Ch.3:5Spectral resolution ~cm21!Scanning time ~syinterferogram!Optical input aperture ~cm!Moving and scanning mirrorField of view 32 3 8 km
aInSb, indium antimonide.bMCT, mercury cadmium tellurium.
72 APPLIED OPTICS y Vol. 38, No. 3 y 20 January 1999
where B is the Planck radiance. In Eqs. ~2! and ~3!,mittances of blackbodies are assumed to be 1.quations ~1!, ~2!, and ~3! yield the following calibra-
ion relationship:
L 5 @~C 2 Cc!y~Ch 2 Cc!#~Bh 2 Bc! 1 Bc. (4)
Furthermore, taking into consideration the anoma-lous phase response associated with the backgroundradiance, Revercomb et al.6 presented a calibrationmethod that uses a complex spectrum from a complexFourier transformation represented by Eq. ~5! in-stead of Eq. ~1!:
C9 5 r@L 1 L0 exp~if0!#exp~if!, (5)
here exp~if0! is the anomalous phase response ofhe background and exp~if! is the normal phase re-
sponse of the instrument.With this method for the calibration relationship C,
c, and Ch in Eq. ~4! are related to the complex spec-ra. To apply this relationship, sampling pointsith the same optical path difference on interfero-rams obtained from the measurement of blackbodiesor reference and from the measurement of the ob-ervation target, must be identified. Therefore, for aarticular phase response of the instrument, as de-cribed in Section 4, the calibration relationship byse of magnitude spectra is suitable for more precisealibration and for simplifying the calibration proce-ure.
4. Calibration Relationship for the TroposphericInfrared Interferometric Sounder Measurements
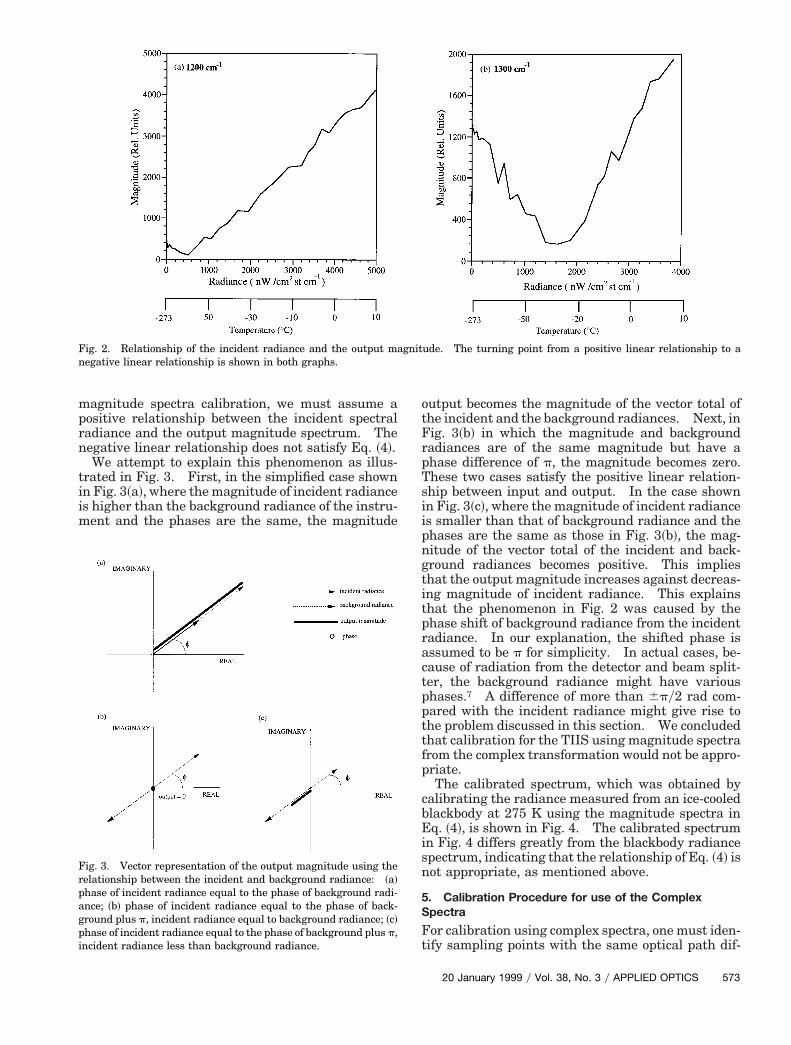
To determine the calibration relationship using mag-nitude spectra or complex spectra for the TIIS mea-surements, we carried out an experiment to evaluatethe linearity between incident spectral radiances andthe magnitude spectra output. We measured theradiances from blackbodies between liquid N2 tem-
erature and ambient temperature. Figure 2 showshe relationship between the temperature of the ob-erved blackbody and the magnitude spectra calcu-ated from the measured interferogram at 1200 and300 cm21. Both graphs indicate a positive linear
relationship between temperature and magnitude upto a certain temperature. However, a negative lin-ear relationship arises at low temperature. For
G TIIS
3 ~InSb!a
.0 InSb!.5 ~MCT!b
Ch.1:3.3–4.3 ~InSb!Ch.2:4.0–5.0 ~InSb!
Ch.3:5.0–14.5 ~MCT!0.122.52.5
e Corner cube-km altitude! 300 3 300 m ~5-km altitude!
IM
3.3–4.:4.0–5.0–14
0.11010
Plan~800
rp
is
magnitude spectra calibration, we must assume apositive relationship between the incident spectralradiance and the output magnitude spectrum. Thenegative linear relationship does not satisfy Eq. ~4!.
We attempt to explain this phenomenon as illus-trated in Fig. 3. First, in the simplified case shownin Fig. 3~a!, where the magnitude of incident radianceis higher than the background radiance of the instru-ment and the phases are the same, the magnitude
Fig. 2. Relationship of the incident radiance and the output manegative linear relationship is shown in both graphs.
Fig. 3. Vector representation of the output magnitude using therelationship between the incident and background radiance: ~a!phase of incident radiance equal to the phase of background radi-ance; ~b! phase of incident radiance equal to the phase of back-ground plus p, incident radiance equal to background radiance; ~c!phase of incident radiance equal to the phase of background plus p,incident radiance less than background radiance.
output becomes the magnitude of the vector total ofthe incident and the background radiances. Next, inFig. 3~b! in which the magnitude and backgroundadiances are of the same magnitude but have ahase difference of p, the magnitude becomes zero.
These two cases satisfy the positive linear relation-ship between input and output. In the case shownin Fig. 3~c!, where the magnitude of incident radianceis smaller than that of background radiance and thephases are the same as those in Fig. 3~b!, the mag-nitude of the vector total of the incident and back-ground radiances becomes positive. This impliesthat the output magnitude increases against decreas-ing magnitude of incident radiance. This explainsthat the phenomenon in Fig. 2 was caused by thephase shift of background radiance from the incidentradiance. In our explanation, the shifted phase isassumed to be p for simplicity. In actual cases, be-cause of radiation from the detector and beam split-ter, the background radiance might have variousphases.7 A difference of more than 6py2 rad com-pared with the incident radiance might give rise tothe problem discussed in this section. We concludedthat calibration for the TIIS using magnitude spectrafrom the complex transformation would not be appro-priate.
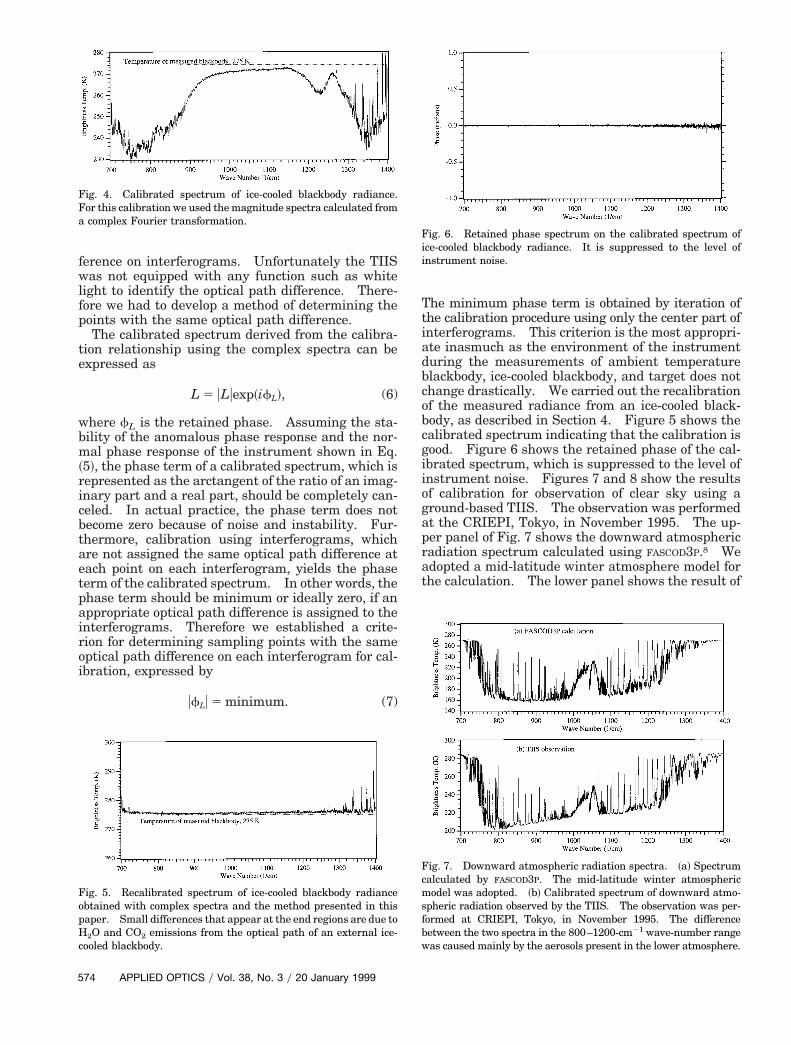
The calibrated spectrum, which was obtained bycalibrating the radiance measured from an ice-cooledblackbody at 275 K using the magnitude spectra inEq. ~4!, is shown in Fig. 4. The calibrated spectrumn Fig. 4 differs greatly from the blackbody radiancepectrum, indicating that the relationship of Eq. ~4! is
not appropriate, as mentioned above.
5. Calibration Procedure for use of the ComplexSpectra
For calibration using complex spectra, one must iden-tify sampling points with the same optical path dif-
ude. The turning point from a positive linear relationship to a
gnit20 January 1999 y Vol. 38, No. 3 y APPLIED OPTICS 573
5
ference on interferograms. Unfortunately the TIISwas not equipped with any function such as whitelight to identify the optical path difference. There-fore we had to develop a method of determining thepoints with the same optical path difference.
The calibrated spectrum derived from the calibra-tion relationship using the complex spectra can beexpressed as
L 5 uLuexp~ifL!, (6)
where fL is the retained phase. Assuming the sta-bility of the anomalous phase response and the nor-mal phase response of the instrument shown in Eq.~5!, the phase term of a calibrated spectrum, which isrepresented as the arctangent of the ratio of an imag-inary part and a real part, should be completely can-celed. In actual practice, the phase term does notbecome zero because of noise and instability. Fur-thermore, calibration using interferograms, whichare not assigned the same optical path difference ateach point on each interferogram, yields the phaseterm of the calibrated spectrum. In other words, thephase term should be minimum or ideally zero, if anappropriate optical path difference is assigned to theinterferograms. Therefore we established a crite-rion for determining sampling points with the sameoptical path difference on each interferogram for cal-ibration, expressed by
ufLu 5 minimum. (7)
Fig. 4. Calibrated spectrum of ice-cooled blackbody radiance.For this calibration we used the magnitude spectra calculated froma complex Fourier transformation.
Fig. 5. Recalibrated spectrum of ice-cooled blackbody radianceobtained with complex spectra and the method presented in thispaper. Small differences that appear at the end regions are due toH2O and CO2 emissions from the optical path of an external ice-cooled blackbody.
74 APPLIED OPTICS y Vol. 38, No. 3 y 20 January 1999
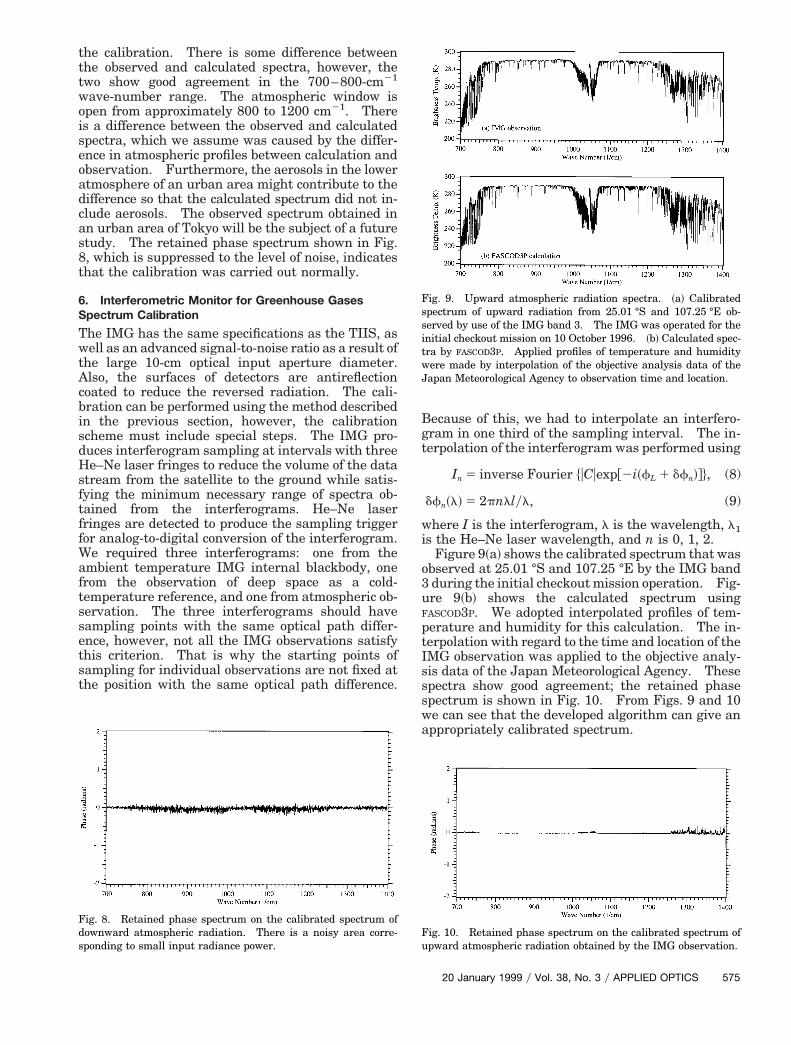
The minimum phase term is obtained by iteration ofthe calibration procedure using only the center part ofinterferograms. This criterion is the most appropri-ate inasmuch as the environment of the instrumentduring the measurements of ambient temperatureblackbody, ice-cooled blackbody, and target does notchange drastically. We carried out the recalibrationof the measured radiance from an ice-cooled black-body, as described in Section 4. Figure 5 shows thecalibrated spectrum indicating that the calibration isgood. Figure 6 shows the retained phase of the cal-ibrated spectrum, which is suppressed to the level ofinstrument noise. Figures 7 and 8 show the resultsof calibration for observation of clear sky using aground-based TIIS. The observation was performedat the CRIEPI, Tokyo, in November 1995. The up-per panel of Fig. 7 shows the downward atmosphericradiation spectrum calculated using FASCOD3P.8 Weadopted a mid-latitude winter atmosphere model forthe calculation. The lower panel shows the result of
Fig. 6. Retained phase spectrum on the calibrated spectrum ofice-cooled blackbody radiance. It is suppressed to the level ofinstrument noise.
Fig. 7. Downward atmospheric radiation spectra. ~a! Spectrumcalculated by FASCOD3P. The mid-latitude winter atmosphericmodel was adopted. ~b! Calibrated spectrum of downward atmo-spheric radiation observed by the TIIS. The observation was per-formed at CRIEPI, Tokyo, in November 1995. The differencebetween the two spectra in the 800–1200-cm21 wave-number rangewas caused mainly by the aerosols present in the lower atmosphere.
o3u
ssi
the calibration. There is some difference betweenthe observed and calculated spectra, however, thetwo show good agreement in the 700–800-cm21
wave-number range. The atmospheric window isopen from approximately 800 to 1200 cm21. Thereis a difference between the observed and calculatedspectra, which we assume was caused by the differ-ence in atmospheric profiles between calculation andobservation. Furthermore, the aerosols in the loweratmosphere of an urban area might contribute to thedifference so that the calculated spectrum did not in-clude aerosols. The observed spectrum obtained inan urban area of Tokyo will be the subject of a futurestudy. The retained phase spectrum shown in Fig.8, which is suppressed to the level of noise, indicatesthat the calibration was carried out normally.
6. Interferometric Monitor for Greenhouse GasesSpectrum Calibration
The IMG has the same specifications as the TIIS, aswell as an advanced signal-to-noise ratio as a result ofthe large 10-cm optical input aperture diameter.Also, the surfaces of detectors are antireflectioncoated to reduce the reversed radiation. The cali-bration can be performed using the method describedin the previous section, however, the calibrationscheme must include special steps. The IMG pro-duces interferogram sampling at intervals with threeHe–Ne laser fringes to reduce the volume of the datastream from the satellite to the ground while satis-fying the minimum necessary range of spectra ob-tained from the interferograms. He–Ne laserfringes are detected to produce the sampling triggerfor analog-to-digital conversion of the interferogram.We required three interferograms: one from theambient temperature IMG internal blackbody, onefrom the observation of deep space as a cold-temperature reference, and one from atmospheric ob-servation. The three interferograms should havesampling points with the same optical path differ-ence, however, not all the IMG observations satisfythis criterion. That is why the starting points ofsampling for individual observations are not fixed atthe position with the same optical path difference.
Fig. 8. Retained phase spectrum on the calibrated spectrum ofdownward atmospheric radiation. There is a noisy area corre-sponding to small input radiance power.
Because of this, we had to interpolate an interfero-gram in one third of the sampling interval. The in-terpolation of the interferogram was performed using
In 5 inverse Fourier $uCuexp@2i~fL 1 dfn!#%, (8)
dfn~l! 5 2pnllyl, (9)
where I is the interferogram, l is the wavelength, l1is the He–Ne laser wavelength, and n is 0, 1, 2.
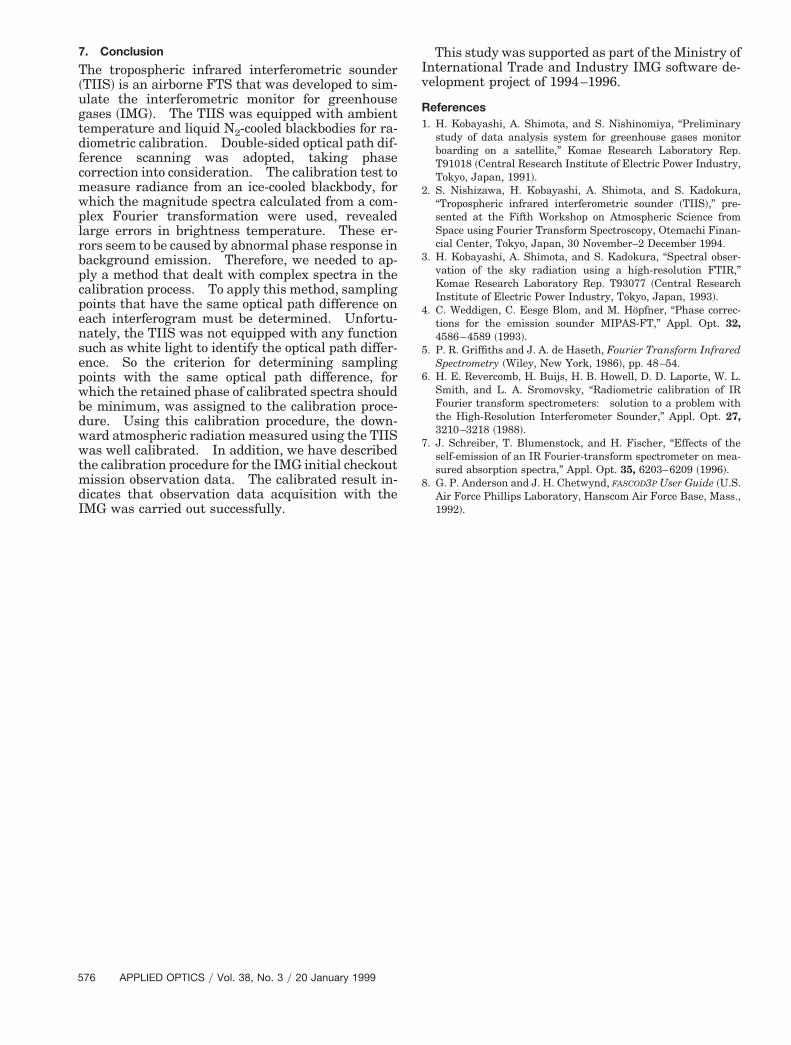
Figure 9~a! shows the calibrated spectrum that wasbserved at 25.01 °S and 107.25 °E by the IMG bandduring the initial checkout mission operation. Fig-re 9~b! shows the calculated spectrum using
FASCOD3P. We adopted interpolated profiles of tem-perature and humidity for this calculation. The in-terpolation with regard to the time and location of theIMG observation was applied to the objective analy-sis data of the Japan Meteorological Agency. Thesespectra show good agreement; the retained phasespectrum is shown in Fig. 10. From Figs. 9 and 10we can see that the developed algorithm can give anappropriately calibrated spectrum.
Fig. 9. Upward atmospheric radiation spectra. ~a! Calibratedpectrum of upward radiation from 25.01 °S and 107.25 °E ob-erved by use of the IMG band 3. The IMG was operated for thenitial checkout mission on 10 October 1996. ~b! Calculated spec-
tra by FASCOD3P. Applied profiles of temperature and humiditywere made by interpolation of the objective analysis data of theJapan Meteorological Agency to observation time and location.
Fig. 10. Retained phase spectrum on the calibrated spectrum ofupward atmospheric radiation obtained by the IMG observation.
20 January 1999 y Vol. 38, No. 3 y APPLIED OPTICS 575
tdfcmwplrbpcpensepwbdwwtmdI
5
7. Conclusion
The tropospheric infrared interferometric sounder~TIIS! is an airborne FTS that was developed to sim-ulate the interferometric monitor for greenhousegases ~IMG!. The TIIS was equipped with ambientemperature and liquid N2-cooled blackbodies for ra-iometric calibration. Double-sided optical path dif-erence scanning was adopted, taking phaseorrection into consideration. The calibration test toeasure radiance from an ice-cooled blackbody, forhich the magnitude spectra calculated from a com-lex Fourier transformation were used, revealedarge errors in brightness temperature. These er-ors seem to be caused by abnormal phase response inackground emission. Therefore, we needed to ap-ly a method that dealt with complex spectra in thealibration process. To apply this method, samplingoints that have the same optical path difference onach interferogram must be determined. Unfortu-ately, the TIIS was not equipped with any functionuch as white light to identify the optical path differ-nce. So the criterion for determining samplingoints with the same optical path difference, forhich the retained phase of calibrated spectra shoulde minimum, was assigned to the calibration proce-ure. Using this calibration procedure, the down-ard atmospheric radiation measured using the TIISas well calibrated. In addition, we have described
he calibration procedure for the IMG initial checkoutission observation data. The calibrated result in-
icates that observation data acquisition with theMG was carried out successfully.
76 APPLIED OPTICS y Vol. 38, No. 3 y 20 January 1999
This study was supported as part of the Ministry ofInternational Trade and Industry IMG software de-velopment project of 1994–1996.
References1. H. Kobayashi, A. Shimota, and S. Nishinomiya, “Preliminary
study of data analysis system for greenhouse gases monitorboarding on a satellite,” Komae Research Laboratory Rep.T91018 ~Central Research Institute of Electric Power Industry,Tokyo, Japan, 1991!.
2. S. Nishizawa, H. Kobayashi, A. Shimota, and S. Kadokura,“Tropospheric infrared interferometric sounder ~TIIS!,” pre-sented at the Fifth Workshop on Atmospheric Science fromSpace using Fourier Transform Spectroscopy, Otemachi Finan-cial Center, Tokyo, Japan, 30 November–2 December 1994.
3. H. Kobayashi, A. Shimota, and S. Kadokura, “Spectral obser-vation of the sky radiation using a high-resolution FTIR,”Komae Research Laboratory Rep. T93077 ~Central ResearchInstitute of Electric Power Industry, Tokyo, Japan, 1993!.
4. C. Weddigen, C. Eesge Blom, and M. Hopfner, “Phase correc-tions for the emission sounder MIPAS-FT,” Appl. Opt. 32,4586–4589 ~1993!.
5. P. R. Griffiths and J. A. de Haseth, Fourier Transform InfraredSpectrometry ~Wiley, New York, 1986!, pp. 48–54.
6. H. E. Revercomb, H. Buijs, H. B. Howell, D. D. Laporte, W. L.Smith, and L. A. Sromovsky, “Radiometric calibration of IRFourier transform spectrometers: solution to a problem withthe High-Resolution Interferometer Sounder,” Appl. Opt. 27,3210–3218 ~1988!.
7. J. Schreiber, T. Blumenstock, and H. Fischer, “Effects of theself-emission of an IR Fourier-transform spectrometer on mea-sured absorption spectra,” Appl. Opt. 35, 6203–6209 ~1996!.
8. G. P. Anderson and J. H. Chetwynd, FASCOD3P User Guide ~U.S.Air Force Phillips Laboratory, Hanscom Air Force Base, Mass.,1992!.