Embed Size (px)
Citation preview
Radiolysis of Water on ZrO2 NanoparticlesOlivia Roth,† Bjoern Dahlgren,† and Jay A. LaVerne*,†,‡
†Radiation Laboratory and ‡Department of Physics, University of Notre Dame, Notre Dame, Indiana 46556, United States
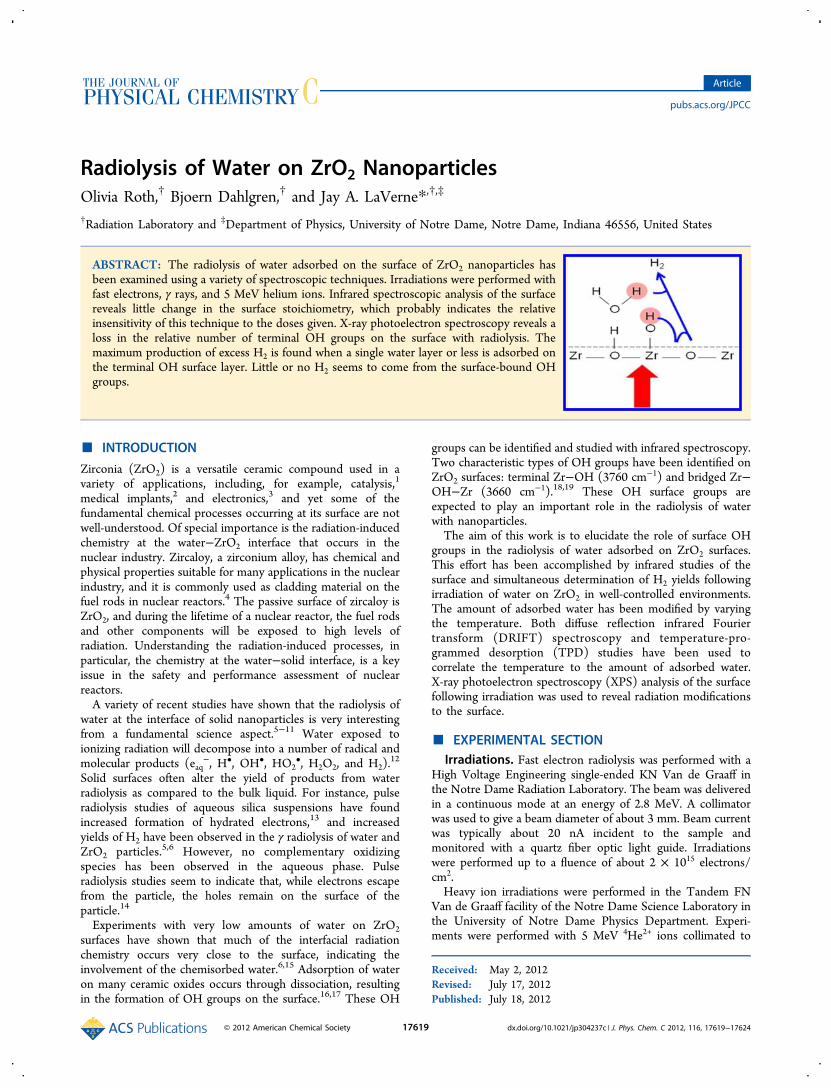
ABSTRACT: The radiolysis of water adsorbed on the surface of ZrO2 nanoparticles hasbeen examined using a variety of spectroscopic techniques. Irradiations were performed withfast electrons, γ rays, and 5 MeV helium ions. Infrared spectroscopic analysis of the surfacereveals little change in the surface stoichiometry, which probably indicates the relativeinsensitivity of this technique to the doses given. X-ray photoelectron spectroscopy reveals aloss in the relative number of terminal OH groups on the surface with radiolysis. Themaximum production of excess H2 is found when a single water layer or less is adsorbed onthe terminal OH surface layer. Little or no H2 seems to come from the surface-bound OHgroups.
■ INTRODUCTION
Zirconia (ZrO2) is a versatile ceramic compound used in avariety of applications, including, for example, catalysis,1
medical implants,2 and electronics,3 and yet some of thefundamental chemical processes occurring at its surface are notwell-understood. Of special importance is the radiation-inducedchemistry at the water−ZrO2 interface that occurs in thenuclear industry. Zircaloy, a zirconium alloy, has chemical andphysical properties suitable for many applications in the nuclearindustry, and it is commonly used as cladding material on thefuel rods in nuclear reactors.4 The passive surface of zircaloy isZrO2, and during the lifetime of a nuclear reactor, the fuel rodsand other components will be exposed to high levels ofradiation. Understanding the radiation-induced processes, inparticular, the chemistry at the water−solid interface, is a keyissue in the safety and performance assessment of nuclearreactors.A variety of recent studies have shown that the radiolysis of
water at the interface of solid nanoparticles is very interestingfrom a fundamental science aspect.5−11 Water exposed toionizing radiation will decompose into a number of radical andmolecular products (eaq
−, H•, OH•, HO2•, H2O2, and H2).
12
Solid surfaces often alter the yield of products from waterradiolysis as compared to the bulk liquid. For instance, pulseradiolysis studies of aqueous silica suspensions have foundincreased formation of hydrated electrons,13 and increasedyields of H2 have been observed in the γ radiolysis of water andZrO2 particles.5,6 However, no complementary oxidizingspecies has been observed in the aqueous phase. Pulseradiolysis studies seem to indicate that, while electrons escapefrom the particle, the holes remain on the surface of theparticle.14
Experiments with very low amounts of water on ZrO2surfaces have shown that much of the interfacial radiationchemistry occurs very close to the surface, indicating theinvolvement of the chemisorbed water.6,15 Adsorption of wateron many ceramic oxides occurs through dissociation, resultingin the formation of OH groups on the surface.16,17 These OH
groups can be identified and studied with infrared spectroscopy.Two characteristic types of OH groups have been identified onZrO2 surfaces: terminal Zr−OH (3760 cm−1) and bridged Zr−OH−Zr (3660 cm−1).18,19 These OH surface groups areexpected to play an important role in the radiolysis of waterwith nanoparticles.The aim of this work is to elucidate the role of surface OH
groups in the radiolysis of water adsorbed on ZrO2 surfaces.This effort has been accomplished by infrared studies of thesurface and simultaneous determination of H2 yields followingirradiation of water on ZrO2 in well-controlled environments.The amount of adsorbed water has been modified by varyingthe temperature. Both diffuse reflection infrared Fouriertransform (DRIFT) spectroscopy and temperature-pro-grammed desorption (TPD) studies have been used tocorrelate the temperature to the amount of adsorbed water.X-ray photoelectron spectroscopy (XPS) analysis of the surfacefollowing irradiation was used to reveal radiation modificationsto the surface.
■ EXPERIMENTAL SECTIONIrradiations. Fast electron radiolysis was performed with a
High Voltage Engineering single-ended KN Van de Graaff inthe Notre Dame Radiation Laboratory. The beam was deliveredin a continuous mode at an energy of 2.8 MeV. A collimatorwas used to give a beam diameter of about 3 mm. Beam currentwas typically about 20 nA incident to the sample andmonitored with a quartz fiber optic light guide. Irradiationswere performed up to a fluence of about 2 × 10¹⁵ electrons/cm2.Heavy ion irradiations were performed in the Tandem FN
Van de Graaff facility of the Notre Dame Science Laboratory inthe University of Notre Dame Physics Department. Experi-ments were performed with 5 MeV 4He2+ ions collimated to
Received: May 2, 2012Revised: July 17, 2012Published: July 18, 2012
Article
pubs.acs.org/JPCC
© 2012 American Chemical Society 17619 dx.doi.org/10.1021/jp304237c | J. Phys. Chem. C 2012, 116, 17619−17624
about 3 mm in diameter. This energy was incident to thesample with energy loss to windows determined using standardstopping power compilations.20 Ion beam currents weretypically 10 nA charge, and fluencies up to 5 × 10¹⁴ ions/cm2 were used.The irradiation cell used for both the fast electron and the
He ion irradiations was a modified high-temperature reactionchamber manufactured by Harrick Scientific Products. Thischamber allows a powder sample of about 100 mg to be placedin a cup and be completely sealed with a dome containing threewindows. The sample could be heated to at least 500 °C, andwater cooling maintained the outside of the chamber atambient. The dome contained two KBr windows (2 mm × 15mm) for infrared probing. A third window in the dome was athin microscope cover glass 15 mm in diameter and 170 μmthick (39.9 mg/cm2) for beam entrance. An inlet and outletport connected the reaction chamber to a gas chromatographand allowed purging of the dome through the sample.Materials. Chemicals were used as received without further
purification. Argon used for purging was of ultrahigh purity.The ZrO2 (99.9%) powder was obtained from Alfa Aesar. Thespecific particle surface was 3.1 m2/g as determined with aQuantachrome Autosorb 1 surface area analyzer using the BET(Brunauer−Emmett−Teller) method. This area corresponds toa perfect sphere of about 350 nm. The ZrO2 was baked at 500°C for 48 h prior to the experiment to remove any hydrocarboncontaminants. Baking was not found to alter the particle surfacearea.Analysis. The sample was placed in the reaction chamber,
sealed, brought to the appropriate temperature, and flushedprior to irradiation with fast electrons or He ions. Afterirradiation, the entire reaction chamber was immediatelytransferred to a Bruker Vertex 70 diffuse reflection infraredFourier transform (DRIFT) spectrometer for analysis. Apraying mantus diffuse reflection accessory by Harrick ScientificProducts was used to couple the high-temperature reactionchamber with the spectrometer. The DRIFT spectrometer isequipped with a DTGS detector and is controlled by the OPUSsoftware.The sample chamber was flushed with argon after each
irradiation, and the outlet gas was analyzed for H2 using gaschromatography. Ultra-high-purity argon was used as the carriergas with a flow rate of about 50 mL/min. The argon passedthrough a constant flow regulator, an injection septum, and afour-way valve and into a 3 m 5× molecular sieve column of aSRI 8610C gas chromatograph with a thermal conductivitydetector. The four-way valve was used to connect thechromatograph to the reaction chamber. Calibration of thegas chromatograph was performed by injecting pure H2 with agastight microliter syringe. The error in gas measurement isestimated to be about 5%.Temperature-programmed desorption (TPD) studies were
performed with the same reaction chamber as used in theradiolysis. The dome was removed, and the reaction chamberbody was coupled to a high-vacuum chamber containing aPfeiffer Prisma residual gas analyzer. The base pressure in thissystem was 10−7 Torr. Samples were prebaked at 400 °C for 48h to remove any contaminants. Water desorption wasmonitored at mass 18 while the temperature was ramped atrates of 2−10 °C/min with a Watlow 989 temperaturecontroller. The temperature of the desorption peak maximumwas used to determine the water energy of adsorption using theRedhead method with a frequency of 1013 s−1.21 Runs were
performed with empty sample cells and subtracted from thosewith added powder to eliminate contributions from thebackground.X-ray photoelectron spectroscopy (XPS) studies were
performed using a Kratos XSAM 800 with an Al Kα X-raysource (1486.6 eV) and a 90° takeoff angle. Powdered sampleswere pressed into double-sided conductive carbon tapeattached to the sample stubs. All peaks were fitted withGauss-Lorentz peaks using the Kratos Vision 2 software toobtain peak area information. A linear baseline was used in thefitting processes. Energy determination was relative to the C 1speak at 285 eV.
■ RESULTS AND DISCUSSIONWater on ZrO2. A comparison of the infrared spectra of
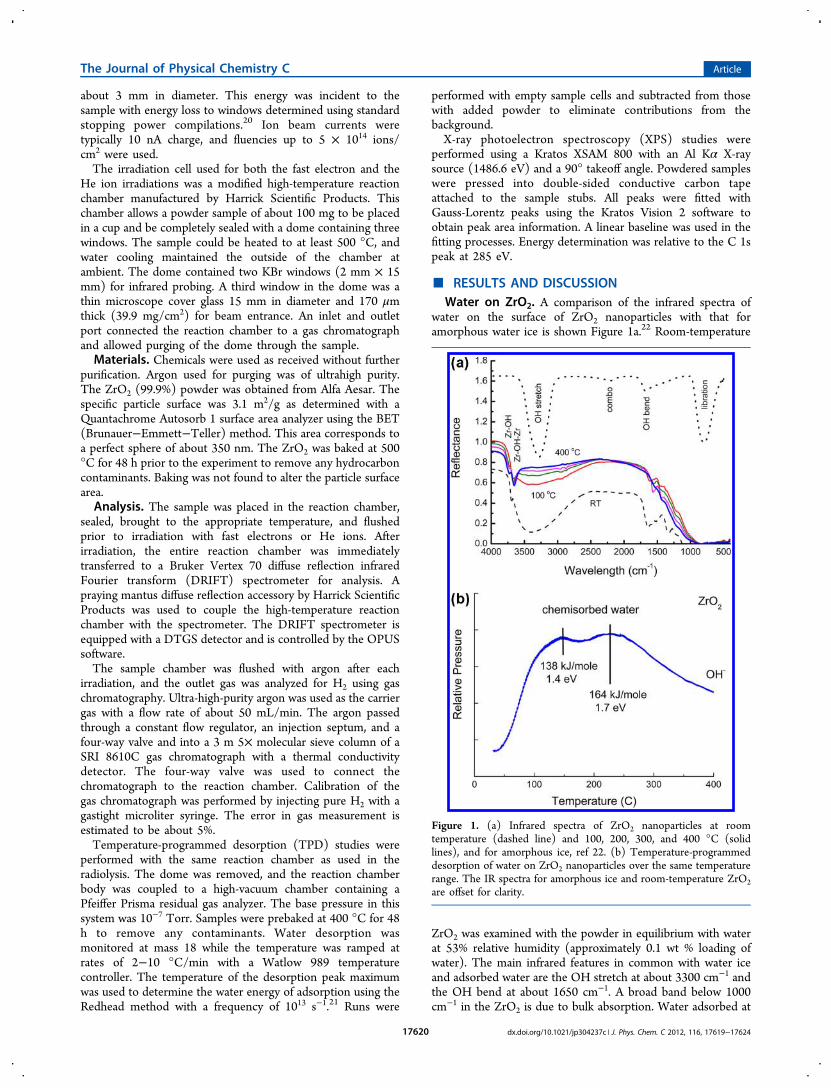
water on the surface of ZrO2 nanoparticles with that foramorphous water ice is shown Figure 1a.22 Room-temperature
ZrO2 was examined with the powder in equilibrium with waterat 53% relative humidity (approximately 0.1 wt % loading ofwater). The main infrared features in common with water iceand adsorbed water are the OH stretch at about 3300 cm−1 andthe OH bend at about 1650 cm−1. A broad band below 1000cm−1 in the ZrO2 is due to bulk absorption. Water adsorbed at
Figure 1. (a) Infrared spectra of ZrO2 nanoparticles at roomtemperature (dashed line) and 100, 200, 300, and 400 °C (solidlines), and for amorphous ice, ref 22. (b) Temperature-programmeddesorption of water on ZrO2 nanoparticles over the same temperaturerange. The IR spectra for amorphous ice and room-temperature ZrO2are offset for clarity.
The Journal of Physical Chemistry C Article
dx.doi.org/10.1021/jp304237c | J. Phys. Chem. C 2012, 116, 17619−1762417620
room temperature shows a broad OH stretch due to therelatively large amount of chemisorbed water. This band foradsorbed water is shifted to slightly higher energies than foramorphous ice. A relative humidity of 53% represents about 1.4layers of adsorbed water.6 Heating the sample results in the lossof water layers and a corresponding decrease in the peak due tothe OH stretch. At 400 °C, most of the chemisorbed water isgone and the prominent peaks are due to the OH groups:terminal Zr−OH (3760 cm−1) and bridged Zr−OH−Zr (3660cm−1).18,19 Smaller peaks at 2350 and 2900 cm−1 are due to theabsorption by components in air. The sample is enclosed inargon, but the beam passes through air in the spectrometercompartment.Adsorbed water is always in equilibrium with the surrounding
water vapor, and the temperature at which the waterpreferentially desorbs can be used to estimate the energy ofadsorption. This energy gives a measure of the binding ororganization of the water on the surface. Nanoparticle surfacesmay have a variety of exposed crystalline sites and defect sitesthat will affect the adsorption of the water layers, and the resultsmay be very different than those found with single crystallinefaces commonly examined using material science techniques.An examination of the TPD obtained for the nanoparticles usedin this work reveals two broad chemisorbed water bands withpeaks at about 147 and 225 °C (Figure 1b). This loss of watercorresponds to the decrease in the infrared absorption peak at3300 cm−1. Within the temperature range of 100−400 °C,several water layers exist on top of the OH groups bound to theZrO2 surface. The peak maximum at about 147 °C correspondsto an adsorption energy of about 138 kJ/mol (1.4 eV) whendetermined by the Redhead method.21 The peak at 225 °C hasa much higher energy of 164 kJ/mol (1.7 eV). Weakly boundphysisorbed water is assumed to have an adsorption energy ofless than 0.35 eV.23 Such a low energy would correspond to atemperature of about −163 °C in Figure 1b, which is clearlybelow the range used in this work. Adsorption energies of over1 eV observed in this work suggest that the chemisorbed wateris very strongly bound and must be an integral part of thesurface through strong network bonding with the terminal OHgroups. The IR spectra clearly show the OH groups at 400 °C,so they must be released at even higher temperatures.The reported TPD of water on ZrO2 using a high-vacuum
chamber shows a sharp peak at about −30 °C due to the loss ofphysisorbed water, followed by a broader peak at 120 °C due tothe loss of the first layer of chemisorbed water.5 Thechemsorption peak at about 120 °C corresponds well withthe lowest-temperature peak observed in this work. However,that work did not observe anything else at higher energies. Bothstudies observe two peaks in the TPD, but the temperature shiftis over 100 °C, which is far too large to be due to experimentalartifacts. Variation in the temperature ramp up to a rate of 10°C/min still gave two peaks, although the highest-temperaturepeak was obscured when flash desorption became prevalent.The presence of a second TPD peak at higher energies issometimes attributed to the trapping of water in pores or otherconfined geometries on the nanoparticle surface.23 However,the nanoparticles used here are not expected to be porous, andthe second peak at higher energies probably corresponds towater very strongly bound to the surface, possibly throughhydrogen bonding with the OH groups on the surface.Particle surface characteristics can be further characterized
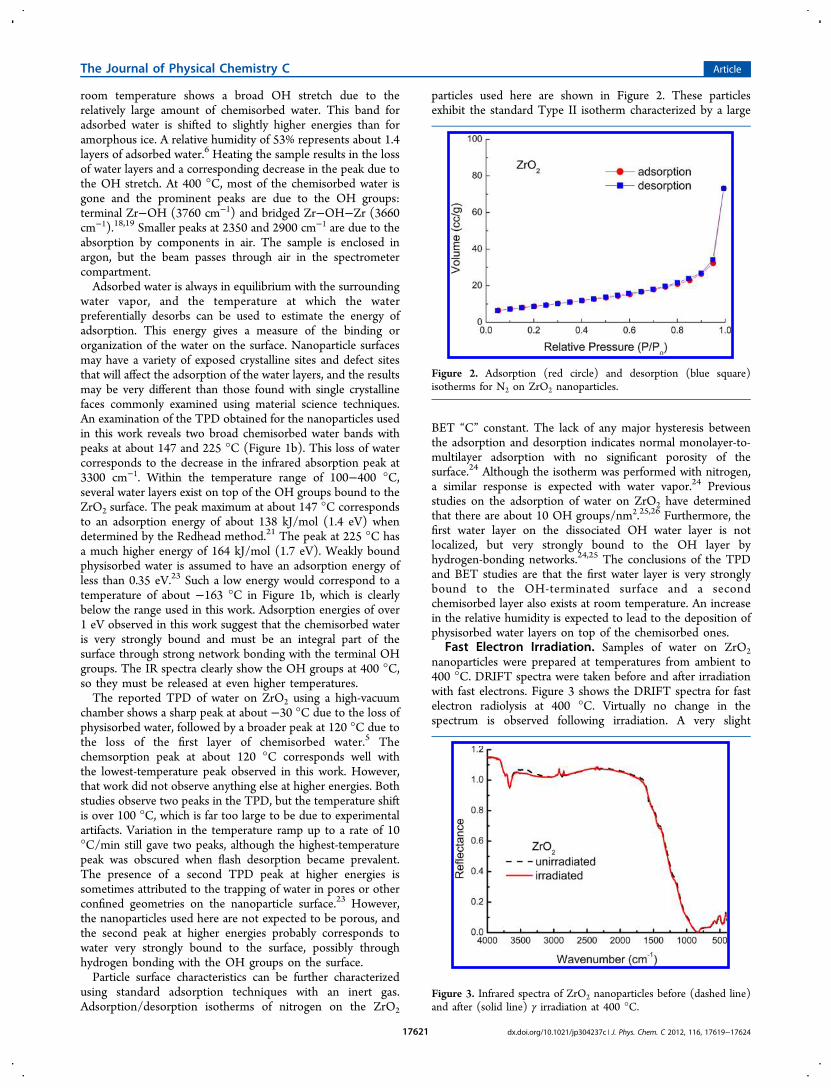
using standard adsorption techniques with an inert gas.Adsorption/desorption isotherms of nitrogen on the ZrO2
particles used here are shown in Figure 2. These particlesexhibit the standard Type II isotherm characterized by a large
BET “C” constant. The lack of any major hysteresis betweenthe adsorption and desorption indicates normal monolayer-to-multilayer adsorption with no significant porosity of thesurface.24 Although the isotherm was performed with nitrogen,a similar response is expected with water vapor.24 Previousstudies on the adsorption of water on ZrO2 have determinedthat there are about 10 OH groups/nm2.25,26 Furthermore, thefirst water layer on the dissociated OH water layer is notlocalized, but very strongly bound to the OH layer byhydrogen-bonding networks.24,25 The conclusions of the TPDand BET studies are that the first water layer is very stronglybound to the OH-terminated surface and a secondchemisorbed layer also exists at room temperature. An increasein the relative humidity is expected to lead to the deposition ofphysisorbed water layers on top of the chemisorbed ones.
Fast Electron Irradiation. Samples of water on ZrO2nanoparticles were prepared at temperatures from ambient to400 °C. DRIFT spectra were taken before and after irradiationwith fast electrons. Figure 3 shows the DRIFT spectra for fastelectron radiolysis at 400 °C. Virtually no change in thespectrum is observed following irradiation. A very slight
Figure 2. Adsorption (red circle) and desorption (blue square)isotherms for N2 on ZrO2 nanoparticles.
Figure 3. Infrared spectra of ZrO2 nanoparticles before (dashed line)and after (solid line) γ irradiation at 400 °C.
The Journal of Physical Chemistry C Article
dx.doi.org/10.1021/jp304237c | J. Phys. Chem. C 2012, 116, 17619−1762417621
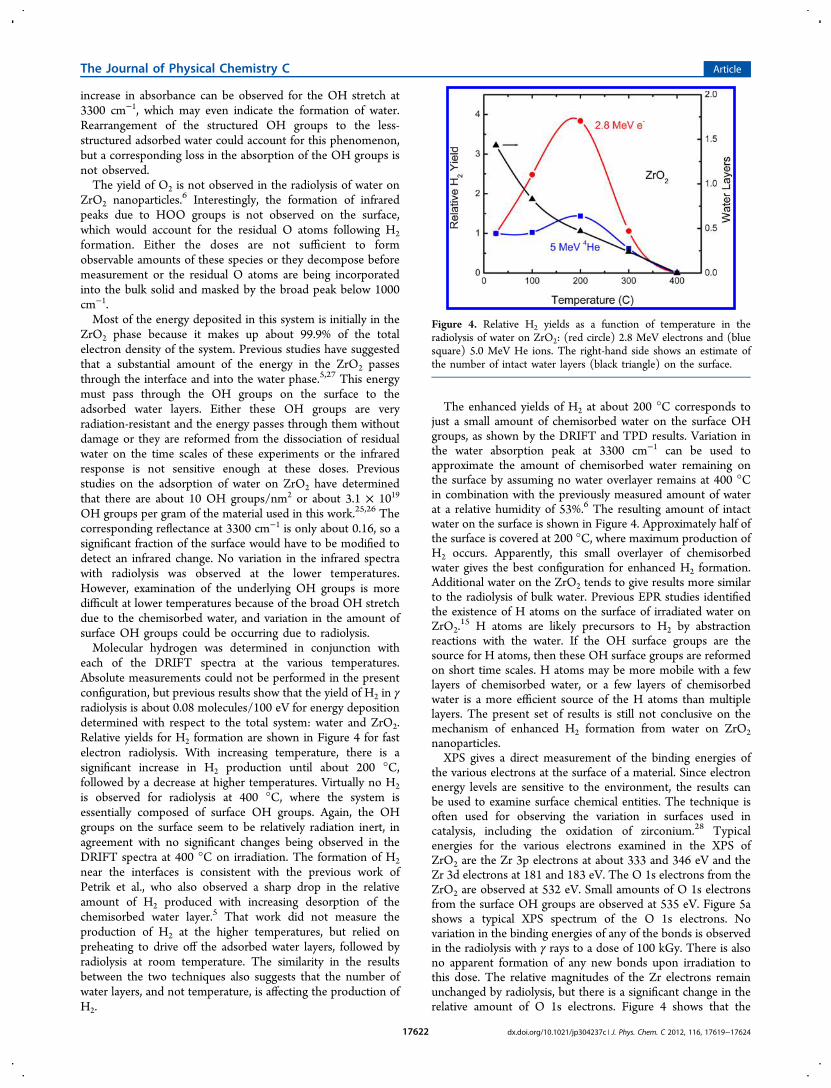
increase in absorbance can be observed for the OH stretch at3300 cm−1, which may even indicate the formation of water.Rearrangement of the structured OH groups to the less-structured adsorbed water could account for this phenomenon,but a corresponding loss in the absorption of the OH groups isnot observed.The yield of O2 is not observed in the radiolysis of water on
ZrO2 nanoparticles.6 Interestingly, the formation of infraredpeaks due to HOO groups is not observed on the surface,which would account for the residual O atoms following H2formation. Either the doses are not sufficient to formobservable amounts of these species or they decompose beforemeasurement or the residual O atoms are being incorporatedinto the bulk solid and masked by the broad peak below 1000cm−1.Most of the energy deposited in this system is initially in the
ZrO2 phase because it makes up about 99.9% of the totalelectron density of the system. Previous studies have suggestedthat a substantial amount of the energy in the ZrO2 passesthrough the interface and into the water phase.5,27 This energymust pass through the OH groups on the surface to theadsorbed water layers. Either these OH groups are veryradiation-resistant and the energy passes through them withoutdamage or they are reformed from the dissociation of residualwater on the time scales of these experiments or the infraredresponse is not sensitive enough at these doses. Previousstudies on the adsorption of water on ZrO2 have determinedthat there are about 10 OH groups/nm2 or about 3.1 × 10¹⁹
OH groups per gram of the material used in this work.25,26 Thecorresponding reflectance at 3300 cm−1 is only about 0.16, so asignificant fraction of the surface would have to be modified todetect an infrared change. No variation in the infrared spectrawith radiolysis was observed at the lower temperatures.However, examination of the underlying OH groups is moredifficult at lower temperatures because of the broad OH stretchdue to the chemisorbed water, and variation in the amount ofsurface OH groups could be occurring due to radiolysis.Molecular hydrogen was determined in conjunction with
each of the DRIFT spectra at the various temperatures.Absolute measurements could not be performed in the presentconfiguration, but previous results show that the yield of H2 in γradiolysis is about 0.08 molecules/100 eV for energy depositiondetermined with respect to the total system: water and ZrO2.Relative yields for H2 formation are shown in Figure 4 for fastelectron radiolysis. With increasing temperature, there is asignificant increase in H2 production until about 200 °C,followed by a decrease at higher temperatures. Virtually no H2is observed for radiolysis at 400 °C, where the system isessentially composed of surface OH groups. Again, the OHgroups on the surface seem to be relatively radiation inert, inagreement with no significant changes being observed in theDRIFT spectra at 400 °C on irradiation. The formation of H2near the interfaces is consistent with the previous work ofPetrik et al., who also observed a sharp drop in the relativeamount of H2 produced with increasing desorption of thechemisorbed water layer.5 That work did not measure theproduction of H2 at the higher temperatures, but relied onpreheating to drive off the adsorbed water layers, followed byradiolysis at room temperature. The similarity in the resultsbetween the two techniques also suggests that the number ofwater layers, and not temperature, is affecting the production ofH2.
The enhanced yields of H2 at about 200 °C corresponds tojust a small amount of chemisorbed water on the surface OHgroups, as shown by the DRIFT and TPD results. Variation inthe water absorption peak at 3300 cm−1 can be used toapproximate the amount of chemisorbed water remaining onthe surface by assuming no water overlayer remains at 400 °Cin combination with the previously measured amount of waterat a relative humidity of 53%.6 The resulting amount of intactwater on the surface is shown in Figure 4. Approximately half ofthe surface is covered at 200 °C, where maximum production ofH2 occurs. Apparently, this small overlayer of chemisorbedwater gives the best configuration for enhanced H2 formation.Additional water on the ZrO2 tends to give results more similarto the radiolysis of bulk water. Previous EPR studies identifiedthe existence of H atoms on the surface of irradiated water onZrO2.
15 H atoms are likely precursors to H2 by abstractionreactions with the water. If the OH surface groups are thesource for H atoms, then these OH surface groups are reformedon short time scales. H atoms may be more mobile with a fewlayers of chemisorbed water, or a few layers of chemisorbedwater is a more efficient source of the H atoms than multiplelayers. The present set of results is still not conclusive on themechanism of enhanced H2 formation from water on ZrO2nanoparticles.XPS gives a direct measurement of the binding energies of
the various electrons at the surface of a material. Since electronenergy levels are sensitive to the environment, the results canbe used to examine surface chemical entities. The technique isoften used for observing the variation in surfaces used incatalysis, including the oxidation of zirconium.28 Typicalenergies for the various electrons examined in the XPS ofZrO2 are the Zr 3p electrons at about 333 and 346 eV and theZr 3d electrons at 181 and 183 eV. The O 1s electrons from theZrO2 are observed at 532 eV. Small amounts of O 1s electronsfrom the surface OH groups are observed at 535 eV. Figure 5ashows a typical XPS spectrum of the O 1s electrons. Novariation in the binding energies of any of the bonds is observedin the radiolysis with γ rays to a dose of 100 kGy. There is alsono apparent formation of any new bonds upon irradiation tothis dose. The relative magnitudes of the Zr electrons remainunchanged by radiolysis, but there is a significant change in therelative amount of O 1s electrons. Figure 4 shows that the
Figure 4. Relative H2 yields as a function of temperature in theradiolysis of water on ZrO2: (red circle) 2.8 MeV electrons and (bluesquare) 5.0 MeV He ions. The right-hand side shows an estimate ofthe number of intact water layers (black triangle) on the surface.
The Journal of Physical Chemistry C Article
dx.doi.org/10.1021/jp304237c | J. Phys. Chem. C 2012, 116, 17619−1762417622
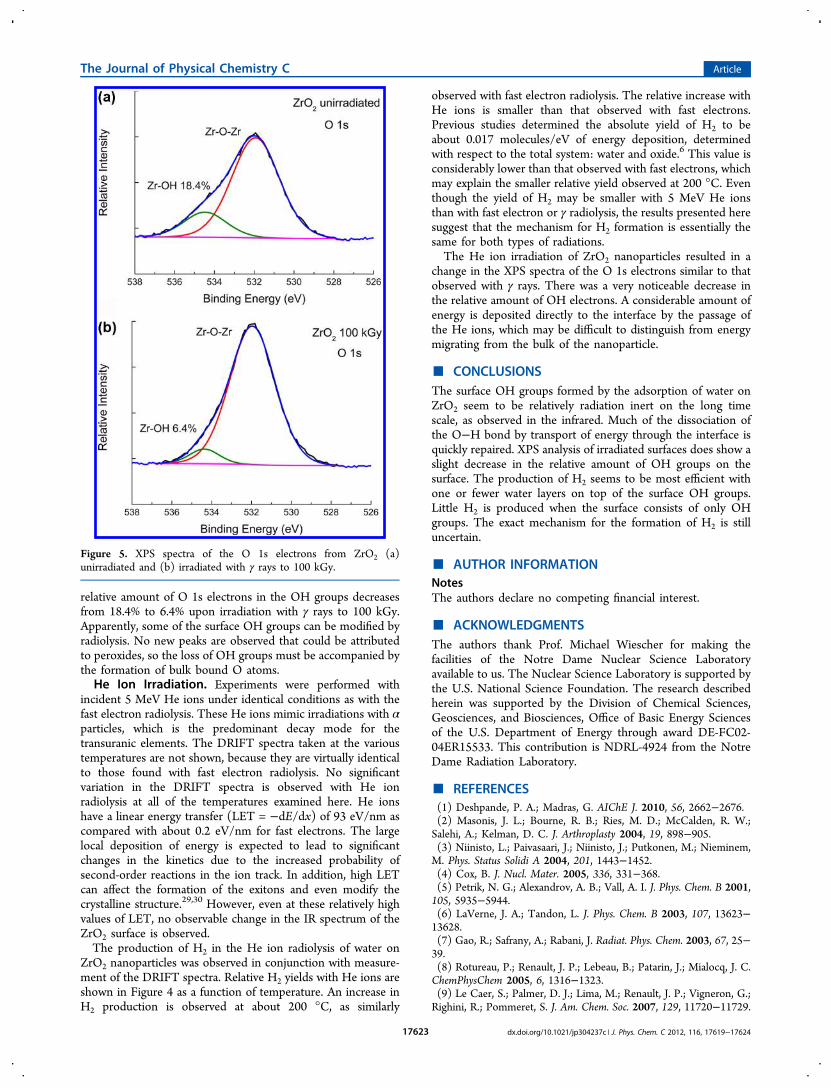
relative amount of O 1s electrons in the OH groups decreasesfrom 18.4% to 6.4% upon irradiation with γ rays to 100 kGy.Apparently, some of the surface OH groups can be modified byradiolysis. No new peaks are observed that could be attributedto peroxides, so the loss of OH groups must be accompanied bythe formation of bulk bound O atoms.He Ion Irradiation. Experiments were performed with
incident 5 MeV He ions under identical conditions as with thefast electron radiolysis. These He ions mimic irradiations with αparticles, which is the predominant decay mode for thetransuranic elements. The DRIFT spectra taken at the varioustemperatures are not shown, because they are virtually identicalto those found with fast electron radiolysis. No significantvariation in the DRIFT spectra is observed with He ionradiolysis at all of the temperatures examined here. He ionshave a linear energy transfer (LET = −dE/dx) of 93 eV/nm ascompared with about 0.2 eV/nm for fast electrons. The largelocal deposition of energy is expected to lead to significantchanges in the kinetics due to the increased probability ofsecond-order reactions in the ion track. In addition, high LETcan affect the formation of the exitons and even modify thecrystalline structure.29,30 However, even at these relatively highvalues of LET, no observable change in the IR spectrum of theZrO2 surface is observed.The production of H2 in the He ion radiolysis of water on
ZrO2 nanoparticles was observed in conjunction with measure-ment of the DRIFT spectra. Relative H2 yields with He ions areshown in Figure 4 as a function of temperature. An increase inH2 production is observed at about 200 °C, as similarly
observed with fast electron radiolysis. The relative increase withHe ions is smaller than that observed with fast electrons.Previous studies determined the absolute yield of H2 to beabout 0.017 molecules/eV of energy deposition, determinedwith respect to the total system: water and oxide.6 This value isconsiderably lower than that observed with fast electrons, whichmay explain the smaller relative yield observed at 200 °C. Eventhough the yield of H2 may be smaller with 5 MeV He ionsthan with fast electron or γ radiolysis, the results presented heresuggest that the mechanism for H2 formation is essentially thesame for both types of radiations.The He ion irradiation of ZrO2 nanoparticles resulted in a
change in the XPS spectra of the O 1s electrons similar to thatobserved with γ rays. There was a very noticeable decrease inthe relative amount of OH electrons. A considerable amount ofenergy is deposited directly to the interface by the passage ofthe He ions, which may be difficult to distinguish from energymigrating from the bulk of the nanoparticle.
■ CONCLUSIONSThe surface OH groups formed by the adsorption of water onZrO2 seem to be relatively radiation inert on the long timescale, as observed in the infrared. Much of the dissociation ofthe O−H bond by transport of energy through the interface isquickly repaired. XPS analysis of irradiated surfaces does show aslight decrease in the relative amount of OH groups on thesurface. The production of H2 seems to be most efficient withone or fewer water layers on top of the surface OH groups.Little H2 is produced when the surface consists of only OHgroups. The exact mechanism for the formation of H2 is stilluncertain.
■ AUTHOR INFORMATIONNotesThe authors declare no competing financial interest.
■ ACKNOWLEDGMENTSThe authors thank Prof. Michael Wiescher for making thefacilities of the Notre Dame Nuclear Science Laboratoryavailable to us. The Nuclear Science Laboratory is supported bythe U.S. National Science Foundation. The research describedherein was supported by the Division of Chemical Sciences,Geosciences, and Biosciences, Office of Basic Energy Sciencesof the U.S. Department of Energy through award DE-FC02-04ER15533. This contribution is NDRL-4924 from the NotreDame Radiation Laboratory.
■ REFERENCES(1) Deshpande, P. A.; Madras, G. AIChE J. 2010, 56, 2662−2676.(2) Masonis, J. L.; Bourne, R. B.; Ries, M. D.; McCalden, R. W.;Salehi, A.; Kelman, D. C. J. Arthroplasty 2004, 19, 898−905.(3) Niinisto, L.; Paivasaari, J.; Niinisto, J.; Putkonen, M.; Nieminem,M. Phys. Status Solidi A 2004, 201, 1443−1452.(4) Cox, B. J. Nucl. Mater. 2005, 336, 331−368.(5) Petrik, N. G.; Alexandrov, A. B.; Vall, A. I. J. Phys. Chem. B 2001,105, 5935−5944.(6) LaVerne, J. A.; Tandon, L. J. Phys. Chem. B 2003, 107, 13623−13628.(7) Gao, R.; Safrany, A.; Rabani, J. Radiat. Phys. Chem. 2003, 67, 25−39.(8) Rotureau, P.; Renault, J. P.; Lebeau, B.; Patarin, J.; Mialocq, J. C.ChemPhysChem 2005, 6, 1316−1323.(9) Le Caer, S.; Palmer, D. J.; Lima, M.; Renault, J. P.; Vigneron, G.;Righini, R.; Pommeret, S. J. Am. Chem. Soc. 2007, 129, 11720−11729.
Figure 5. XPS spectra of the O 1s electrons from ZrO2 (a)unirradiated and (b) irradiated with γ rays to 100 kGy.
The Journal of Physical Chemistry C Article
dx.doi.org/10.1021/jp304237c | J. Phys. Chem. C 2012, 116, 17619−1762417623
(10) Le Caer, S.; Renault, J. P.; Mialocq, J. C. Chem. Phys. Lett. 2007,450, 91−95.(11) Cecal, A.; Macovei, A.; Tamba, G.; Hauta, O.; Popa, K.; Ganju,D.; Rusu, I. Rev. Roum. Chim. 2008, 53, 203−206.(12) Buxton, G. V. The Radiation Chemistry of Liquid Water:Principles and Applications. In Charged Particle and Photon Interactionswith Matter; Mozumder, A., Hatano, Y., Eds.; Marcel Dekker: NewYork, 2004; pp 331−363.(13) Schatz, T.; Cook, A. R.; Meisel, D. J. Phys. Chem. B 1999, 103,10209−10213.(14) Dimitrijevic, N. M.; Henglein, A.; Meisel, D. J. Phys. Chem. B1999, 103, 7073−7076.(15) Carrasco-Flores, E. A.; La Verne, J. A. J. Chem. Phys. 2007, 127,234703.(16) Boehm, H. P. Discuss. Faraday Soc. 1971, 53, 264−289.(17) Henderson, M. A. Surf. Sci. Rep. 2002, 46, 1−308.(18) Lavalley, J.-C.; Bensitel, M.; Gallas, J. P.; Lamotte, J.; Busca, G.;Lorenzelli, V. J. Mol. Struct. 1988, 175, 453−458.(19) Merle-Mejean, T.; Barberis, P.; Othmane, S. B.; Nardou, F.;Quintard, P. E. J. Eur. Ceram. Soc. 1998, 18, 1579−1586.(20) Ziegler, J. F.; Biersack, J. P.; Littmark, U. The Stopping and Rangeof Ions in Solids; Pergamon: New York, 1985.(21) Redhead, P. A. Vacuum 1962, 12, 203−211.(22) Hudgins, D. M.; Sandford, S. A.; Allamandola, L. J.; Tielens, A.G. G. M. Astrophys. J., Suppl. Ser. 1993, 86, 713−870.(23) Dyar, M. D.; Hibbitts, C. A.; Orlando, T. M. Icarus 2010, 208,425−437.(24) Holmes, H. F.; Fuller, E. J. J.; Beh, R. A. J. Colloid Interface Sci.1974, 47, 365−371.(25) Hall, P. G.; Langran-Goldsmith, H. J. Phys. Chem. 1992, 96,867−870.(26) Vissers, D. R. J. Phys. Chem. 1968, 72, 32363244.(27) LaVerne, J. A.; Tandon, L. J. Phys. Chem. B 2002, 106, 380−386.(28) Tapping, R. L. J. Nucl. Mater. 1982, 107, 151−158.(29) Schuster, B.; Lang, M.; Klein, R.; Trautmann, C.; Neumann, R.;Benyagoub, A. Nucl. Instrum. Methods. Phys. Res., Sect. B 2009, 267,964−968.(30) Itoh, N.; Duffy, D. M.; Khakshouri, S.; Stoneham, A. M. J. Phys.:Condens. Matter 2009, 21, 474205.
The Journal of Physical Chemistry C Article
dx.doi.org/10.1021/jp304237c | J. Phys. Chem. C 2012, 116, 17619−1762417624