Embed Size (px)
Citation preview
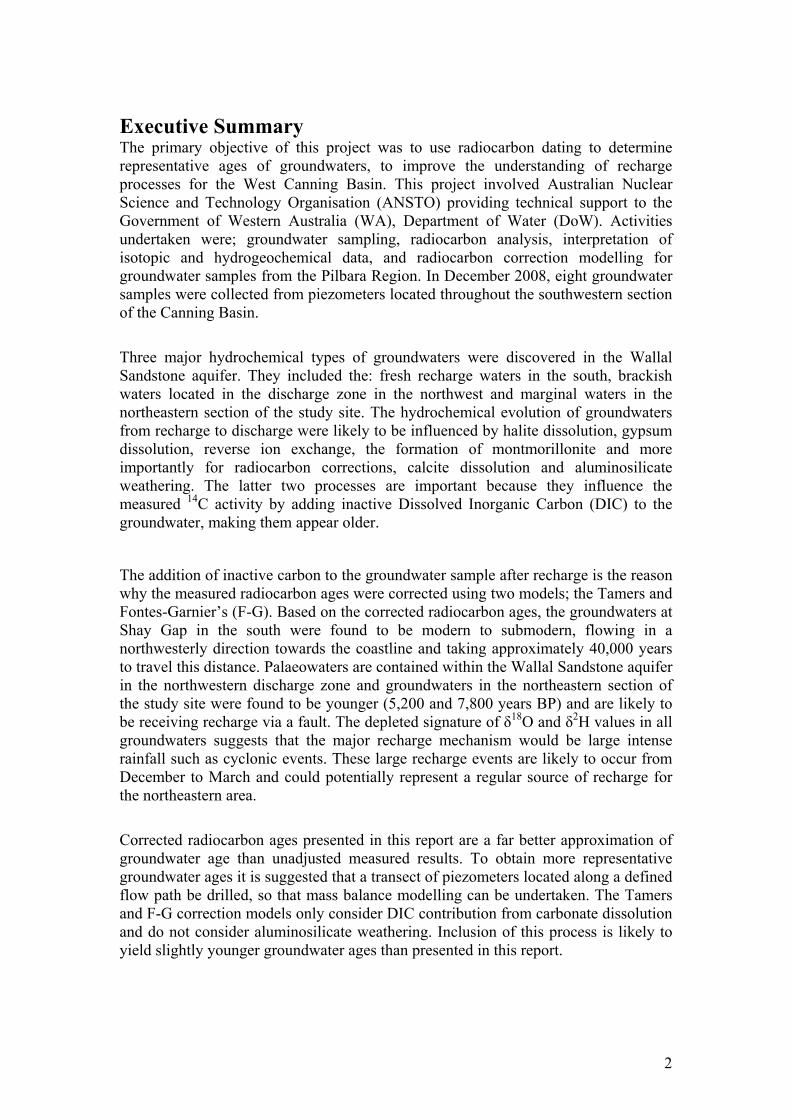
ANSTO-C-1038
Radiocarbon age dating groundwaters of the West Canning Basin, Western Australia.
A report prepared for the Government of Western Australia (WA), Department of Water (DoW)
by Dr Karina Meredith ANSTO Institute for Environmental Research
March 2009
2
Executive Summary The primary objective of this project was to use radiocarbon dating to determine representative ages of groundwaters, to improve the understanding of recharge processes for the West Canning Basin. This project involved Australian Nuclear Science and Technology Organisation (ANSTO) providing technical support to the Government of Western Australia (WA), Department of Water (DoW). Activities undertaken were; groundwater sampling, radiocarbon analysis, interpretation of isotopic and hydrogeochemical data, and radiocarbon correction modelling for groundwater samples from the Pilbara Region. In December 2008, eight groundwater samples were collected from piezometers located throughout the southwestern section of the Canning Basin.
Three major hydrochemical types of groundwaters were discovered in the Wallal Sandstone aquifer. They included the: fresh recharge waters in the south, brackish waters located in the discharge zone in the northwest and marginal waters in the northeastern section of the study site. The hydrochemical evolution of groundwaters from recharge to discharge were likely to be influenced by halite dissolution, gypsum dissolution, reverse ion exchange, the formation of montmorillonite and more importantly for radiocarbon corrections, calcite dissolution and aluminosilicate weathering. The latter two processes are important because they influence the measured 14C activity by adding inactive Dissolved Inorganic Carbon (DIC) to the groundwater, making them appear older.
The addition of inactive carbon to the groundwater sample after recharge is the reason why the measured radiocarbon ages were corrected using two models; the Tamers and Fontes-Garnier’s (F-G). Based on the corrected radiocarbon ages, the groundwaters at Shay Gap in the south were found to be modern to submodern, flowing in a northwesterly direction towards the coastline and taking approximately 40,000 years to travel this distance. Palaeowaters are contained within the Wallal Sandstone aquifer in the northwestern discharge zone and groundwaters in the northeastern section of the study site were found to be younger (5,200 and 7,800 years BP) and are likely to be receiving recharge via a fault. The depleted signature of δ18O and δ2H values in all groundwaters suggests that the major recharge mechanism would be large intense rainfall such as cyclonic events. These large recharge events are likely to occur from December to March and could potentially represent a regular source of recharge for the northeastern area.
Corrected radiocarbon ages presented in this report are a far better approximation of groundwater age than unadjusted measured results. To obtain more representative groundwater ages it is suggested that a transect of piezometers located along a defined flow path be drilled, so that mass balance modelling can be undertaken. The Tamers and F-G correction models only consider DIC contribution from carbonate dissolution and do not consider aluminosilicate weathering. Inclusion of this process is likely to yield slightly younger groundwater ages than presented in this report.
3
Table of Contents
1 INTRODUCTION 5 1.1 Project background 5 1.2 Objective 5 1.3 Scope of works 5 1.4 Limitations of the Assessment 6
2 LITERATURE REVIEW 6 2.1 Previous Works 6 2.2 Study site 7 2.3 Geology and Hydrogeology 8 2.4 Radiocarbon age dating groundwaters 10
3 METHODOLOGY 10 3.1 Groundwater sampling 10 3.2 Groundwater analysis 11 3.3 Hydrogeochemical modelling 12
4 RESULTS 12 4.1 Hydrochemistry 12 4.2 Environmental isotopes 14
5 DISCUSSION 15 5.1 Inferred geochemistry and associated hydrochemical reactions for the Wallal Sandstone 15 5.2 Hydrogeochemical evolution of groundwaters 16 5.3 Carbon chemistry 17 5.4 Corrected radiocarbon ages 19 5.5 δ18O and δ2H values 20 5.6 Groundwater flow implications 21
6 CONCLUSIONS 22
7 RECOMMENDATIONS 23
8 ACKNOWLEDGEMENTS 23
9 REFERENCES 24 APPENDIX 1 26 APPENDIX 2 36 APPENDIX 3 41
4
List of Figures Figure 1 Location map of the study area and the piezometers that were sampled for
hydrochemistry and radiocarbon in December 2008 (original source (Leech, 1979), modified by (Haig, 2008) and modified by author)....................................7
Figure 2 Cross sections of the study area (original source was Leech (1979) and modified by Haig (2008)). .....................................................................................9
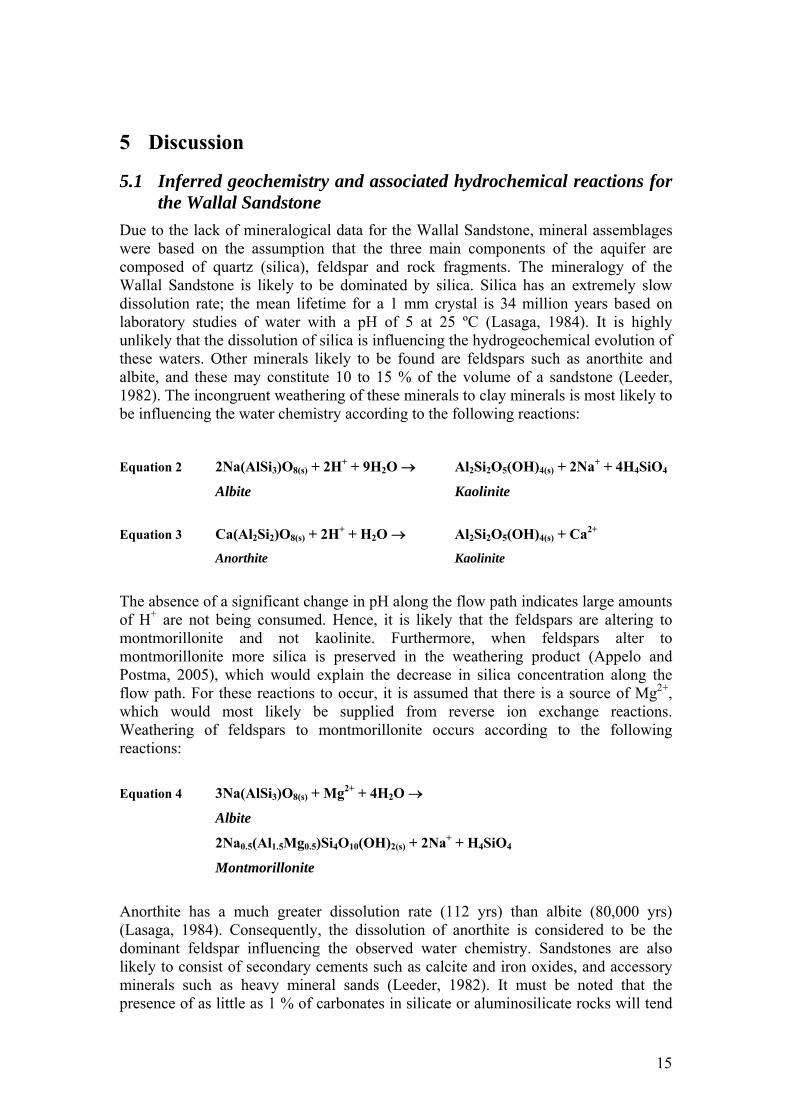
Figure 3 Piper diagram of groundwaters from the study site.......................................13 Figure 4 (a) Ca2+/Mg2+ vs. Ca2+/SO4
2- and (b) Na-/Cl- molar ratios vs. Cl-/Br- molar ratios for groundwaters. .......................................................................................17
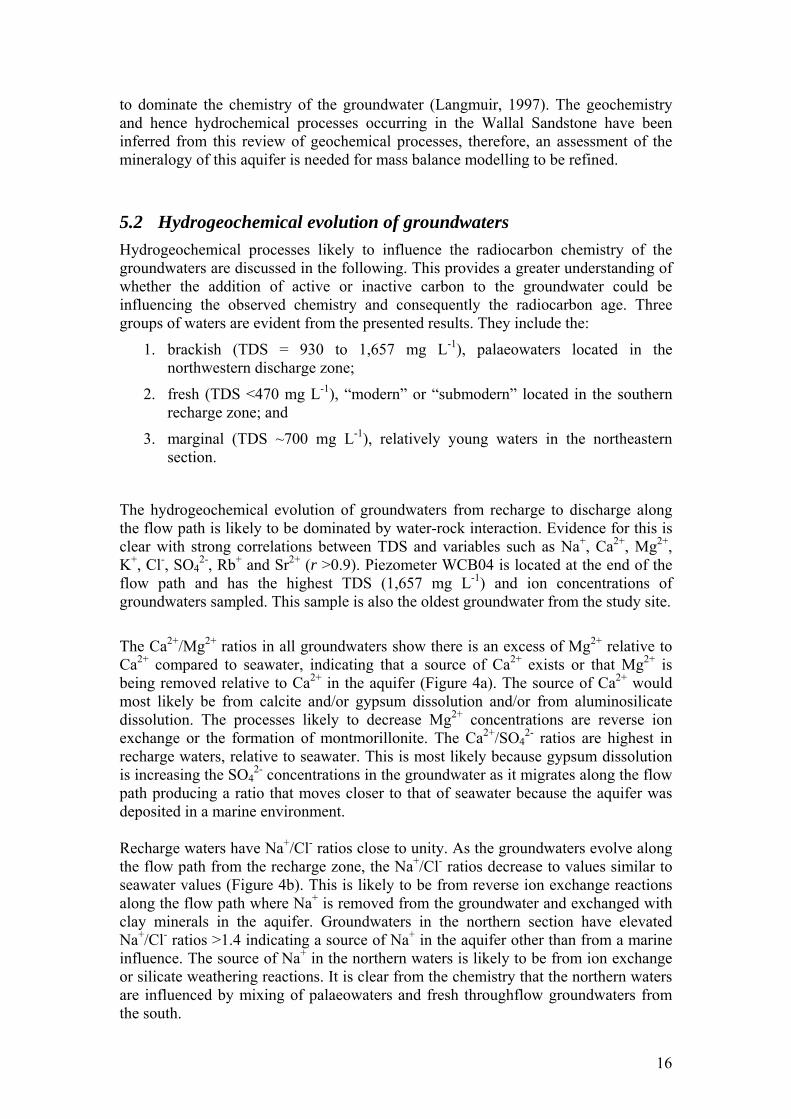
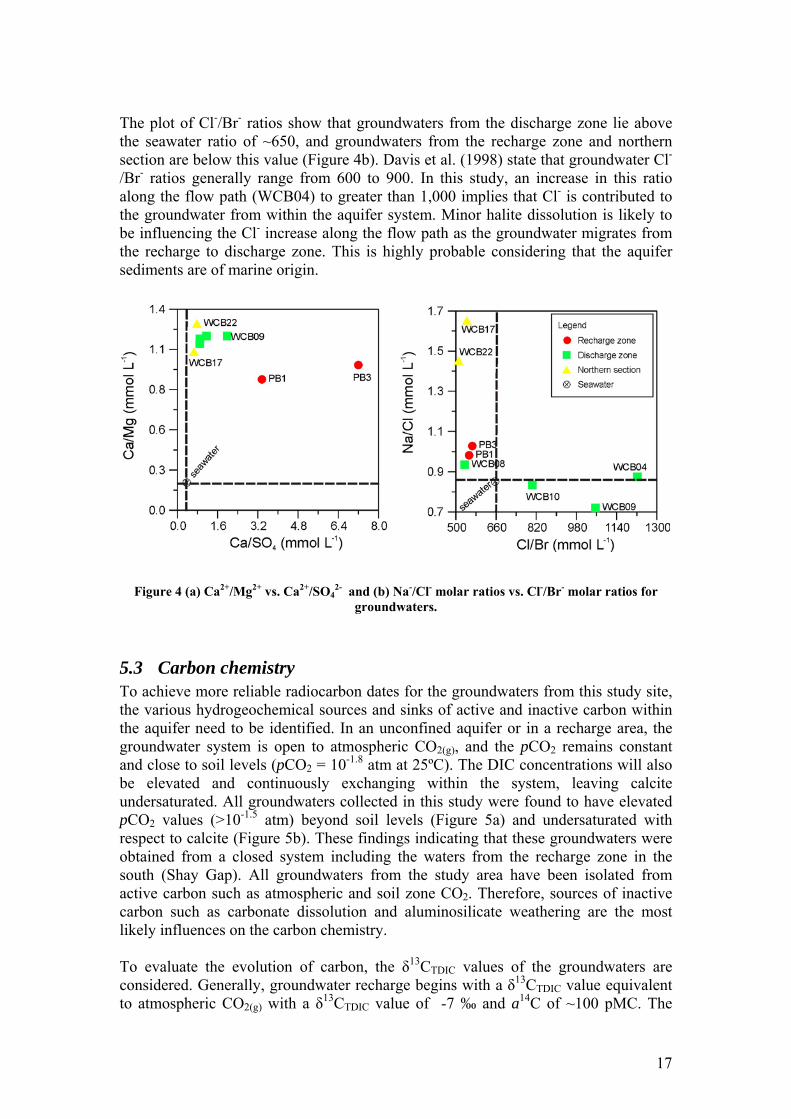
Figure 5 A Bivariate plots of (a) logpCO2 (atm) vs. DIC and (b) calcite SI vs. DIC. .18 Figure 6 Bivariate plots of (a) δ13CTDIC vs. DIC and (b) δ13CTDIC vs. measured 14C
activity..................................................................................................................18 Figure 7 A bivariate plot of δ2H vs. δ18O results plotted against the GMWL (δ2H ‰ =
8.13δ18O + 10.8; (Rozanski et al., 1993). ............................................................21 Figure 8 Corrected radiocarbon ages and inferred flow paths based on corrected
radiocarbon ages for the groundwaters sampled (M = modern and SM = submodern). .........................................................................................................22
5
1 Introduction This report has been prepared by Karina Meredith, a hydrogeochemist from Australian Nuclear Science and Technology Organisation’s (ANSTO) Institute for Environmental Research, for the Government of Western Australia (WA), Department of Water (DoW). The purpose of this project was to provide assistance and technical support with groundwater sampling, radiocarbon analysis, interpretation of isotopic and hydrogeochemical data, and radiocarbon correction modelling for groundwater samples. These tasks were completed so that a representative age for groundwaters in the West Canning Basin in the Pilbara Region could be made. This work forms part of the Pilbara Water Smart Australia Project.
1.1 Project background Investigation of groundwater resources in the West Canning Basin began in the late 1970s where an estimated 50 GL yr-1 yield of groundwater was discovered in the area (Leech, 1979). This water resource is the prime target for the expansion of the Port Hedland Water Supply Scheme (Haig, 2008). The target aquifer, the Wallal Sandstone, was found to have a large storage and superior water quality (acceptable for domestic purposes) compared with the overlying aquifers of the region. Groundwater storage in this aquifer was found to be larger than any other known aquifer within the Pilbara and West Kimberly Regions of WA. The West Canning Basin Groundwater Model, an extended work programme suggested by Haig (2008), will be used by the DoW to provide a means of assessing impacts from abstraction and climate variations on groundwater levels, discharges and ecological water requirements, and will also help determine water allocations for the region.
1.2 Objective The primary objective of this project was to use radiocarbon dating to determine representative ages of groundwaters in the West Canning Basin. This information will be used to improve the understanding of recharge processes in the Wallal Sandstone aquifer.
1.3 Scope of works To achieve the above stated objective, the following scope of works was completed: • preparation and shipping of sampling equipment; • collection of water samples and on-site measurement of general parameters
(Electrical Conductivity (EC), Oxidation-Reduction Potential (ORP), Dissolved Oxygen (DO), temperature and pH), alkalinity titrations and collection of samples for hydrochemical, radiocarbon and stable isotope analysis;
• radiocarbon analysis by Accelerator Mass Spectrometry (AMS) (including extraction and isolation of carbon from Dissolved Inorganic Carbon (DIC));
• outsourcing the analysis for stable carbon isotopic analysis of DIC (δ13CTDIC), and stable water isotopes (δ2H and δ18O);
• development of a conceptual hydrogeochemical model for the site;
6
• applying correction modelling to the measured radiocarbon activities using the hydrogeochemical data*, and
• interpretation of data and submission of the report. * please note that the DoW provided the analysis of major ions and trace elements. This data was required for the correction modelling.
1.4 Limitations of the Assessment The findings of this report are based on data obtained through the scope of work outlined above. The following general limitations apply:
• The location and number of groundwater piezometers were limited; the existing sampling network had been established to focus on the discharge areas of the aquifer, and consequently, a thorough flow path analysis could not be completed in this study. The absence of piezometers along a defined groundwater flow path means that geochemical mass balance modelling could not be completed. Mass balance modelling groundwaters along a defined flow path to account for all hydrogeochemical process influencing carbon in the aquifer, is the most reliable way of correcting radiocarbon dates (Plummer and Sprinkle, 2001); and
• Available geological data for the region was limited and no mineralogical analysis of the Wallal Sandstone was completed on sediment samples obtained during drilling by DoW. The mineralogy of the sandstone was assumed to be similar to those reported in the literature for other sandstone aquifers. Consequently, a mass balance model could not be constructed, therefore, the corrected radiocarbon ages are likely to differ if the Wallal Sandstone was found to contain additional mineral phases containing carbon.
2 Literature Review
2.1 Previous Works The most extensive study completed in the area was the hydrogeological assessment of the West Canning Basin by Leech (1979) for the Geological Survey of Western Australia. Drilling of 47 piezometers, with an aggregate depth of 6,790 m, was completed. Geophysical surveys such as seismic refraction and electrical resistivity were undertaken in the area, to estimate the depth to bedrock and groundwater salinity. Geophysical logs such as gamma ray, calliper logs, and long and short normal resistivity were also made. Hydrochemical analysis was undertaken on groundwater samples that were bailed from non-artesian piezometers and from the piezometer-head in the artesian piezometers. The analyses were performed on samples collected at the end of flow or pump-testing. The next major body of work to be completed in the area was by Haig (2008) from the DoW who reviewed the works completed by Leech (1979) and suggested an extended work programme for the area, including the development of a numerical groundwater model and radiocarbon (14C) age dating of the groundwater.
7
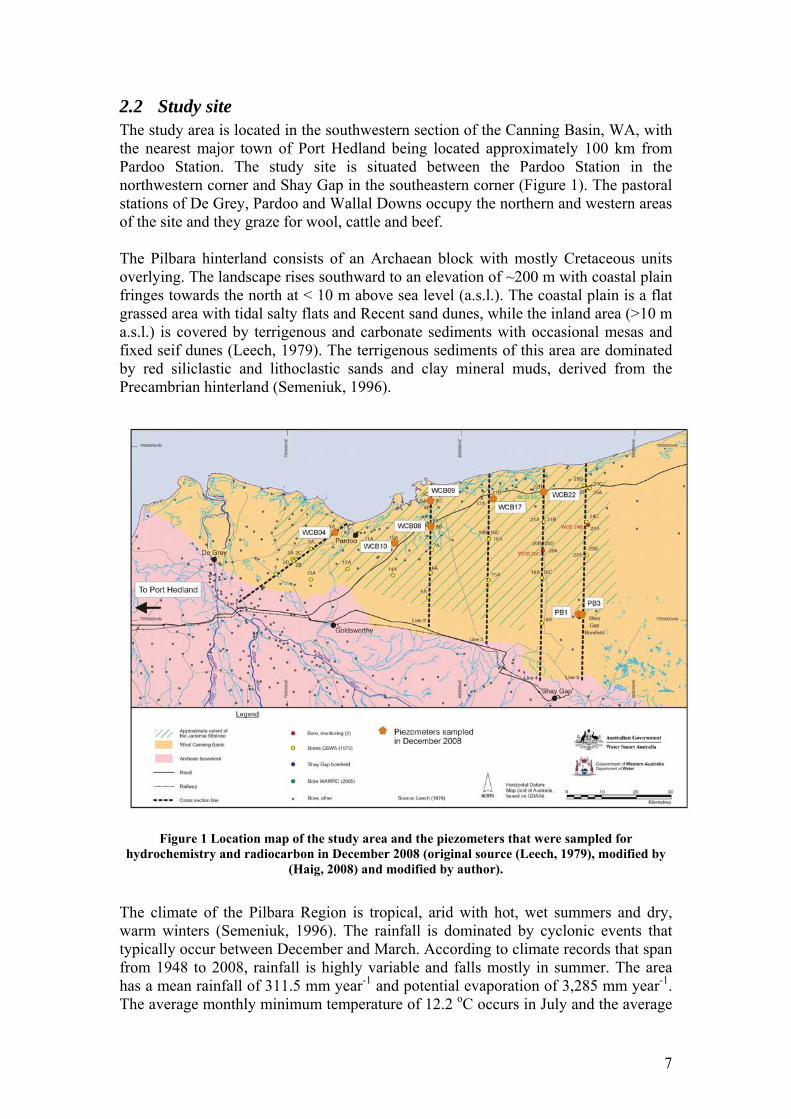
2.2 Study site The study area is located in the southwestern section of the Canning Basin, WA, with the nearest major town of Port Hedland being located approximately 100 km from Pardoo Station. The study site is situated between the Pardoo Station in the northwestern corner and Shay Gap in the southeastern corner (Figure 1). The pastoral stations of De Grey, Pardoo and Wallal Downs occupy the northern and western areas of the site and they graze for wool, cattle and beef. The Pilbara hinterland consists of an Archaean block with mostly Cretaceous units overlying. The landscape rises southward to an elevation of ~200 m with coastal plain fringes towards the north at < 10 m above sea level (a.s.l.). The coastal plain is a flat grassed area with tidal salty flats and Recent sand dunes, while the inland area (>10 m a.s.l.) is covered by terrigenous and carbonate sediments with occasional mesas and fixed seif dunes (Leech, 1979). The terrigenous sediments of this area are dominated by red siliclastic and lithoclastic sands and clay mineral muds, derived from the Precambrian hinterland (Semeniuk, 1996).
Figure 1 Location map of the study area and the piezometers that were sampled for
hydrochemistry and radiocarbon in December 2008 (original source (Leech, 1979), modified by (Haig, 2008) and modified by author).
The climate of the Pilbara Region is tropical, arid with hot, wet summers and dry, warm winters (Semeniuk, 1996). The rainfall is dominated by cyclonic events that typically occur between December and March. According to climate records that span from 1948 to 2008, rainfall is highly variable and falls mostly in summer. The area has a mean rainfall of 311.5 mm year-1 and potential evaporation of 3,285 mm year-1. The average monthly minimum temperature of 12.2 oC occurs in July and the average
8
monthly maximum temperature of 36.9 oC, occurs in March (BOM, 2008). The area has an average annual relative humidity of 41%.
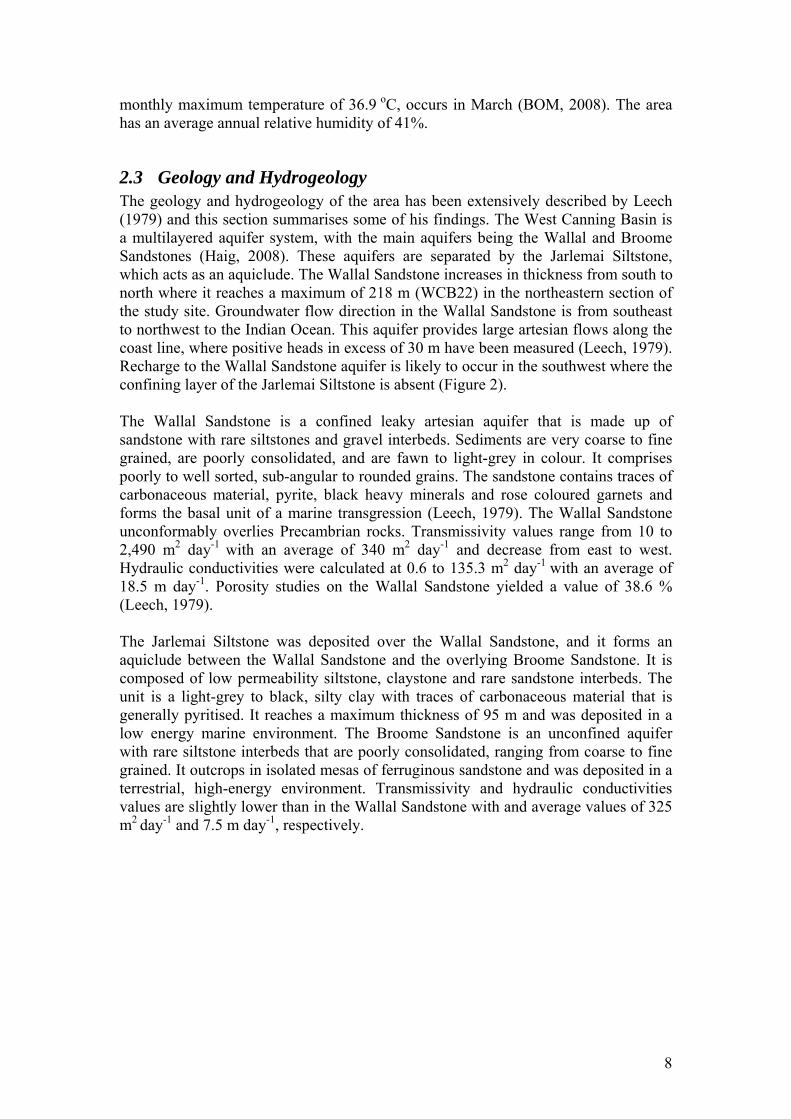
2.3 Geology and Hydrogeology The geology and hydrogeology of the area has been extensively described by Leech (1979) and this section summarises some of his findings. The West Canning Basin is a multilayered aquifer system, with the main aquifers being the Wallal and Broome Sandstones (Haig, 2008). These aquifers are separated by the Jarlemai Siltstone, which acts as an aquiclude. The Wallal Sandstone increases in thickness from south to north where it reaches a maximum of 218 m (WCB22) in the northeastern section of the study site. Groundwater flow direction in the Wallal Sandstone is from southeast to northwest to the Indian Ocean. This aquifer provides large artesian flows along the coast line, where positive heads in excess of 30 m have been measured (Leech, 1979). Recharge to the Wallal Sandstone aquifer is likely to occur in the southwest where the confining layer of the Jarlemai Siltstone is absent (Figure 2). The Wallal Sandstone is a confined leaky artesian aquifer that is made up of sandstone with rare siltstones and gravel interbeds. Sediments are very coarse to fine grained, are poorly consolidated, and are fawn to light-grey in colour. It comprises poorly to well sorted, sub-angular to rounded grains. The sandstone contains traces of carbonaceous material, pyrite, black heavy minerals and rose coloured garnets and forms the basal unit of a marine transgression (Leech, 1979). The Wallal Sandstone unconformably overlies Precambrian rocks. Transmissivity values range from 10 to 2,490 m2 day-1 with an average of 340 m2 day-1 and decrease from east to west. Hydraulic conductivities were calculated at 0.6 to 135.3 m2 day-1 with an average of 18.5 m day-1. Porosity studies on the Wallal Sandstone yielded a value of 38.6 % (Leech, 1979). The Jarlemai Siltstone was deposited over the Wallal Sandstone, and it forms an aquiclude between the Wallal Sandstone and the overlying Broome Sandstone. It is composed of low permeability siltstone, claystone and rare sandstone interbeds. The unit is a light-grey to black, silty clay with traces of carbonaceous material that is generally pyritised. It reaches a maximum thickness of 95 m and was deposited in a low energy marine environment. The Broome Sandstone is an unconfined aquifer with rare siltstone interbeds that are poorly consolidated, ranging from coarse to fine grained. It outcrops in isolated mesas of ferruginous sandstone and was deposited in a terrestrial, high-energy environment. Transmissivity and hydraulic conductivities values are slightly lower than in the Wallal Sandstone with and average values of 325 m2 day-1 and 7.5 m day-1, respectively.
9
Figure 2 Cross sections of the study area (original source was Leech (1979) and modified by Haig
(2008)).
10
2.4 Radiocarbon age dating groundwaters Radiocarbon age dating is the most accessible and widely used technique to age date groundwater resources. Radiocarbon (14C) is the radioactive isotope of carbon and has a half life of 5,730 ± 40 years. It is produced naturally in the atmosphere by cosmic rays and is subsequently oxidised to CO2, where it mixes into the lower atmosphere and is then incorporated into the biosphere and hydrosphere. The ubiquity of carbon in groundwater makes it an ideal isotope to use for age dating groundwater. The 14C age of groundwater that is no longer in contact with the atmosphere, is calculated by rearranging the decay equation (Equation 1):
Equation 1 teAA λ−= 0
to solve for t. Here A is the measured 14C activity, and A0 is the initial activity of 14C in the groundwater sample, i.e. the activity of the groundwater sample once it has been recharged and become isolated from the atmosphere. Radiocarbon activities are usually reported as “percent modern carbon” (pMC), indicating their activity relative to that of modern atmospheric activity. To determine the age of a groundwater sample, with this equation, it is necessary to know A0. In radiocarbon dating of groundwater, it cannot be assumed that this value is equal to the atmospheric activity at the time of recharge. To date groundwater, the dissolved inorganic carbon (DIC) is usually analysed, and will generally have an A0 value far from 100 pMC. In most cases, as groundwater flows through an aquifer, the DIC will be made up of dissolved CO2 from the soil zone (the source of active carbon) and carbon from the aquifer (the source of inactive carbon). The addition or removal of carbon from the groundwater as it migrates through the aquifer must be accounted for when calculating representative ages of the groundwater. Geochemical computer modelling programmes such as NETPATH (Plummer et al., 1994) can be used to refine carbon mass transfer, allowing for a more accurate estimation of A0 and hence a more accurate radiocarbon age for groundwaters (Kalin, 1999). Various geochemical correction models have been explored that attempt to back correct for the hydrochemical reactions that are likely to influence the A0 in the groundwater sample. These correction models include, but are not limited to: the Vogel (Vogel, 1970; Vogel, 1967), Mook (Mook, 1976), Tamers (Tamers, 1975), Ingerson and Pearson (Ingerson and Pearson, 1964) and Fontes-Garnier’s (F-G) (Fontes and Garnier, 1979). This study uses the Tamers and F-G correction models, justifications for choosing these methods are discussed in section 3.3.
3 Methodology
3.1 Groundwater sampling In December 2008, eight groundwater samples were collected from piezometers located throughout the study site. The Department of Water (DoW) drilled six of these piezometers in 2005, ranging in depth from 82 to 152 m b.g.s. (metres below ground surface) targeting the Wallal Sandstone (Figure 1). Another two groundwater samples were obtained from piezometers at Shay Gap that were drilled by BHP Billiton in
11
1993 and range in depth from 116 to 126 m b.g.s. (Table 1). Prior to sampling, piezometers were purged until field parameters stabilised. These field parameters included; Electrical Conductivity (EC), Oxidation-Reduction Potential (ORP), Dissolved Oxygen (DO), temperature and pH. An in-line, 0.45 μm, high volume filter was attached to the headworks of the pressurised piezometers where possible. Because of the difficulties attaching hosing to the headworks of PB1 and WCB10, all samples obtained from these piezometers were filtered through a 60 ml syringe, except the 14C samples, which were not filtered at the time of sampling. Total alkalinity concentrations were determined in the field by potentiometric titration using a micrometer burette (HACH digital titrator). Samples for anions and stable water isotopes (18O and 2H) analysis were collected in 125 ml and 30 ml HDPE (High Density Poly-Ethylene) bottles, respectively, with no further treatment. Samples for cations and trace elements analysis were collected in 125 ml HDPE bottles and acidified with nitric acid (HNO3). The δ13CTDIC samples were collected in 12 ml glass vials (Exetainers). Samples for 14C analysis were collected in 1L Nalgene HDPE bottles and were sealed with tape to eliminate atmospheric exchange during storage.
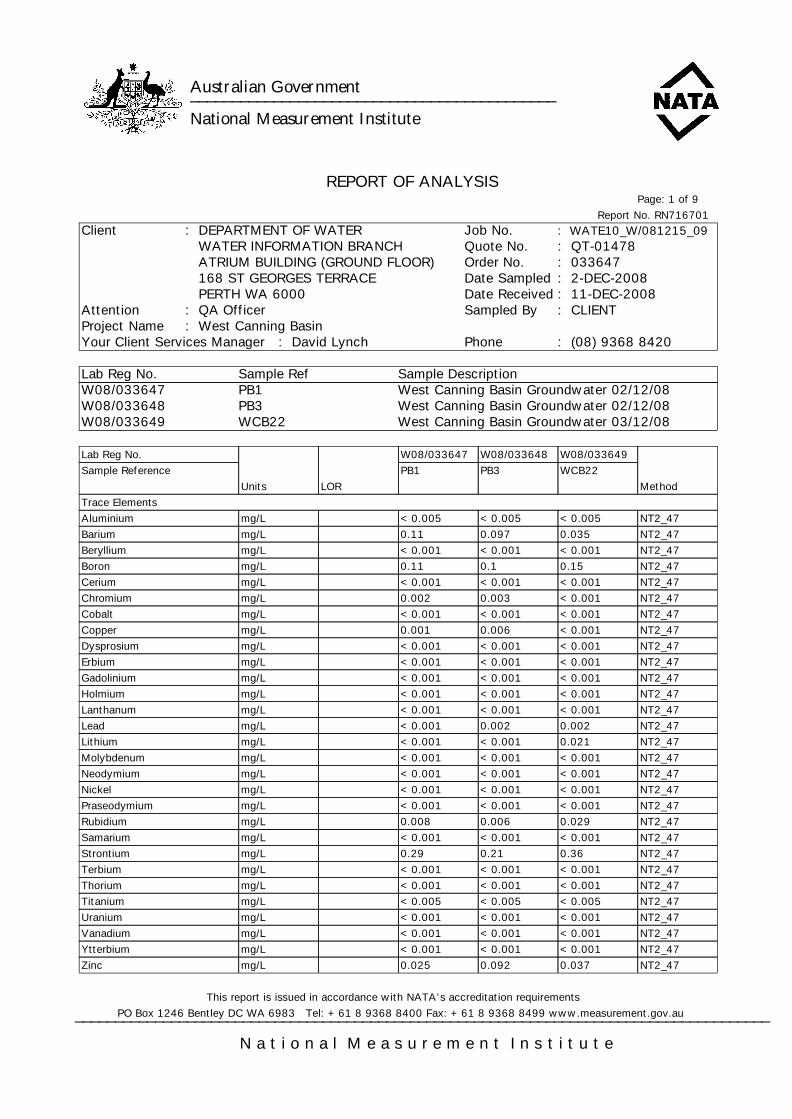
3.2 Groundwater analysis The chemical composition of water samples were analysed at the Australian Government National Measurement Institute, WA (Appendix 1). Cations and anions were assessed for accuracy by evaluating the Charge Balance Error percentage (CBE %) (Table 1). All samples fell within ± 6.5 % with an average of ± 0.16 %. The δ18O, δ2H and δ13CTDIC stable isotopes were analysed by Isotope Mass Spectrometry (IRMS). The δ18O and δ2H values were reported as per mil (‰) deviations from the international standard, V-SMOW (Vienna Standard Mean Ocean Water) and were analysed at IsoAnalytical in the United Kingdom (refer to Appendix 2 for methods). The δ18O and δ2H measurements were reproducible to ± 0.1 and ± 1.7‰, respectively. The δ13CTDIC results were reported as per mil (‰) deviation from the international carbonate standard, NBS19 (δ13C = +1.95 VPDB) with a precision of ± 0.1‰ and were analysed at Environmental Isotopes Pty Ltd (refer to Appendix 2 for methods). The 14C samples were analysed at ANSTO where the total DIC was processed into CO2 by acidifying the samples with H3PO4 and extracting the liberated CO2 gas using a custom built extraction line. The CO2 sample was then heated in a sealed glass tube, containing precleaned CuO, and Ag and Cu wire, at 600ºC for 2 hours to remove any sulphur compounds that may have been liberated from the groundwater sample during the CO2 extraction. The CO2 sample was then converted into graphite by reducing it with excess hydrogen gas in the presence of an iron catalyst at 600ºC. The δ13C isotopic composition of the graphite was determined using a Eurovector EA / Isoprime IRMS instrument with a precision of 0.1 ‰. This δ13C measurement is solely used as a correction in the calculations related to the radiocarbon measurement and may not necessarily be the same as the δ13CTDIC measured directly on the groundwater sample. The 14C activities were measured using the ANSTO AMS 2MV tandetron accelerator, STAR (Fink et al., 2004). The 14C results were reported as percent modern carbon (pMC) with an average 1 σ error of the AMS readings at ± 0.3 pMC. The ages quoted are radiocarbon ages (years BP) and not calendar ages, where the year 1950 is considered to be present (Stuiver and Polach, 1977).
12
3.3 Hydrogeochemical modelling Saturation indices, the partial pressure of CO2 (pCO2), DIC, HCO3
- and CO32- were
calculated using the WATEQ4F thermodynamic database in the PHREEQC 2.4.2 programme (Parkhurst and Appelo, 1999) and TDS was calculated in AquaChem 5.1. The saturation index (SI) is defined as )/(log10 eqKQSI = , where Q is the reaction quotient and eqK is equal to the equilibrium constant. If 0=SI , the mineral is at equilibrium, if 0>SI the mineral is considered to be supersaturated and will tend to precipitate, if 0<SI , the mineral is considered to be undersaturated and will tend to dissolve (Langmuir, 1997). Corrected radiocarbon ages were calculated using two models; the Tamers (Tamers, 1975) and Fontes-Garnier’s (F-G) (Fontes and Garnier, 1979). Correction models more commonly overestimate the groundwater age but they are still an improvement over uncorrected or measured 14C ages (Clark and Fritz, 1997). Tamers method uses a carbon mass balance technique which estimates the effect of the dissolution of carbonates on 14C activities. It has a simplistic view of carbonate evolution, ignoring all reactions beyond simple dissolution of carbonates by soil CO2 (Clark and Fritz, 1997). The δ13CTDIC based correction method developed by Fontes and Garnier (F-G) (Fontes and Garnier, 1979) was also used because this method considers a two-stage evolution of recharge waters, accounting for the dissolution and isotopic exchange of carbonate minerals with CO2 in the unsaturated zone and isotopic exchange with carbonate minerals in the saturated zone (Fontes and Garnier, 1979). It must be noted that the F-G method does not take into account additional sources of DIC beyond carbonate dissolution and exchange (Clark and Fritz, 1997). Both the Tamers and F-G models have been calculated in this report to highlight the influence that isotopic exchange has on the modelled ages. Modelling assumptions are:
• the δ13C and 14C activities of the soil CO2(g) are assumed to be 7 ‰ and 100 pMC, respectively;
• the δ13C and 14C activities organic matter δ13C was assumed to be -25 ‰ and 100 pMC, respectively; and
• the δ13C and 14C activities of CaCO3 were assumed to be 0 ‰ and 0 pMC, respectively.
4 Results
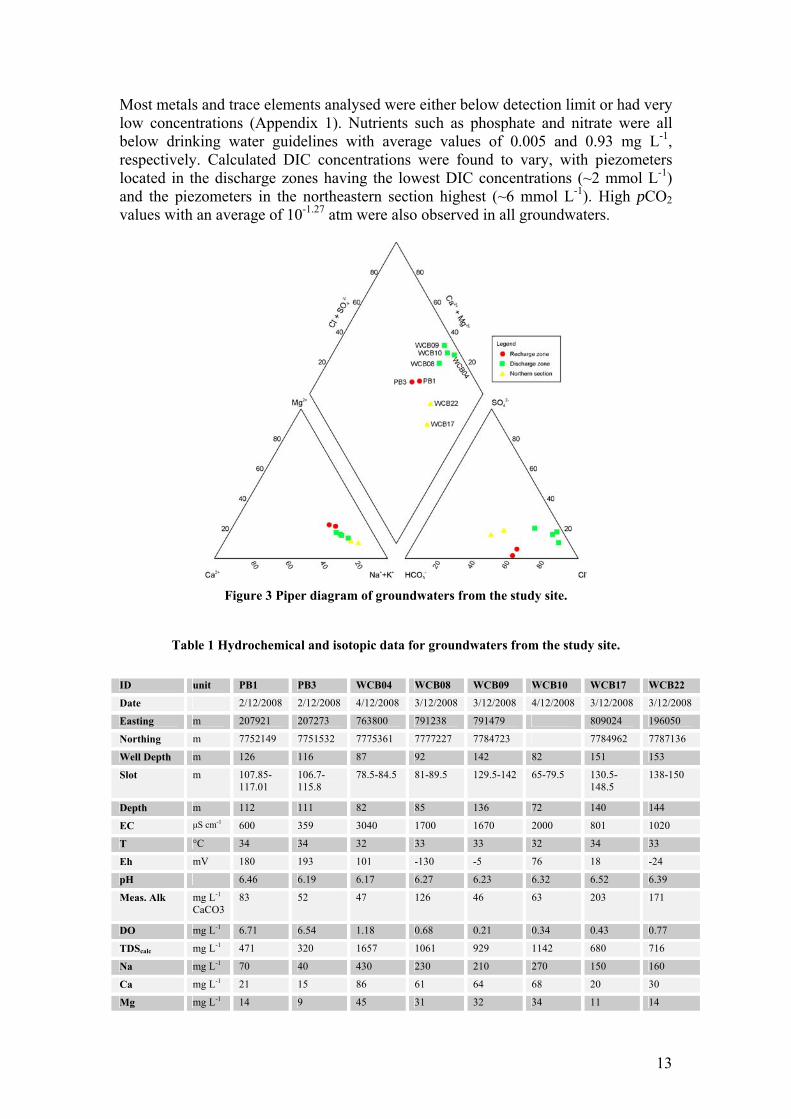
4.1 Hydrochemistry Groundwaters sampled from the Wallal Sandstone aquifer were found to be generally fresh (average TDS = 872 mg L-1), slightly acidic (average pH = 6.31), warm (average temperature = 33.0 ºC) and ranged from oxidised (Eh = +193 mV and DO = 6.71 mg L-1) to reduced (Eh = -130 mV and DO = 0.21 mg L-1) (Table 1). Groundwater chemical types were varied ranging from Na-(Mg)-Cl-HCO3-rich waters in the Shay Gap piezometers to Na-Cl-rich at the end of the flow path in WCB04 and WCB10. Groundwater sample WCB17 was found to be a Na-HCO3-rich water. A piper diagram highlights the differences in groundwater chemistry of the southern recharge zone, northwestern discharge zone and northeastern section of the aquifer (Figure 3).
13
Most metals and trace elements analysed were either below detection limit or had very low concentrations (Appendix 1). Nutrients such as phosphate and nitrate were all below drinking water guidelines with average values of 0.005 and 0.93 mg L-1, respectively. Calculated DIC concentrations were found to vary, with piezometers located in the discharge zones having the lowest DIC concentrations (~2 mmol L-1) and the piezometers in the northeastern section highest (~6 mmol L-1). High pCO2 values with an average of 10-1.27 atm were also observed in all groundwaters.
Figure 3 Piper diagram of groundwaters from the study site.
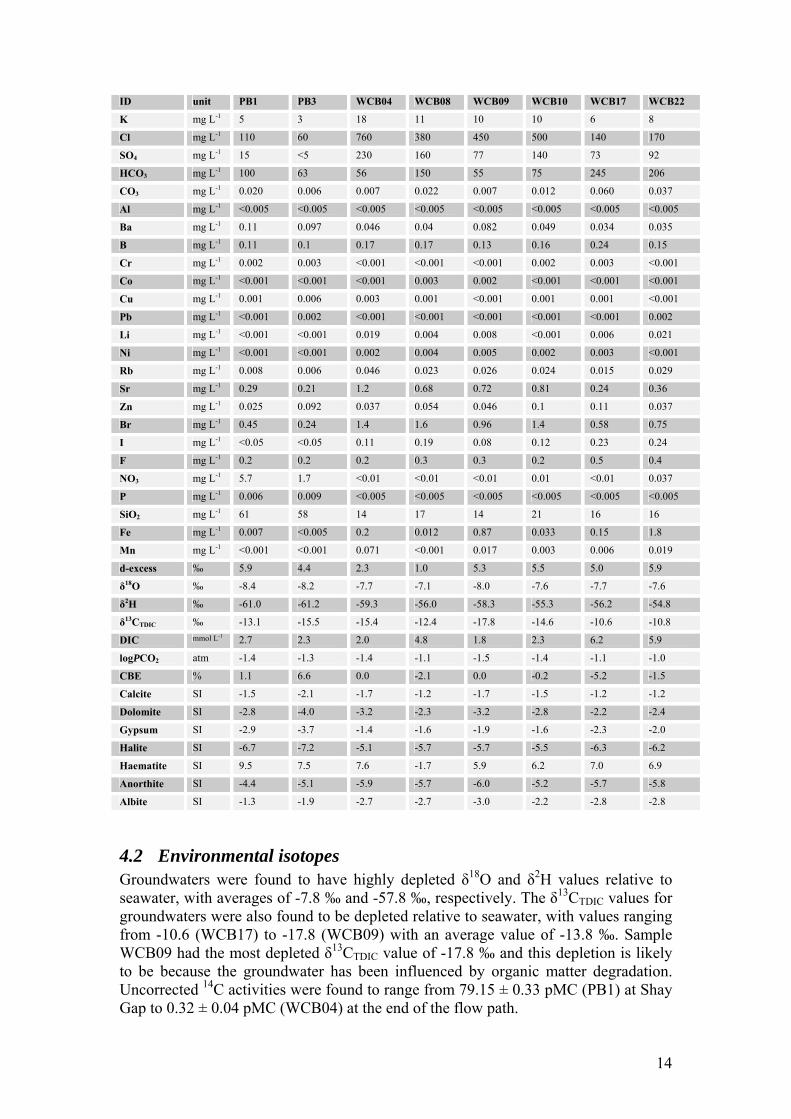
Table 1 Hydrochemical and isotopic data for groundwaters from the study site.
ID unit PB1 PB3 WCB04 WCB08 WCB09 WCB10 WCB17 WCB22
Date 2/12/2008 2/12/2008 4/12/2008 3/12/2008 3/12/2008 4/12/2008 3/12/2008 3/12/2008
Easting m 207921 207273 763800 791238 791479 809024 196050
Northing m 7752149 7751532 7775361 7777227 7784723 7784962 7787136
Well Depth m 126 116 87 92 142 82 151 153
Slot m 107.85-117.01
106.7-115.8
78.5-84.5 81-89.5 129.5-142 65-79.5 130.5-148.5
138-150
Depth m 112 111 82 85 136 72 140 144
EC μS cm-1 600 359 3040 1700 1670 2000 801 1020
T °C 34 34 32 33 33 32 34 33
Eh mV 180 193 101 -130 -5 76 18 -24
pH 6.46 6.19 6.17 6.27 6.23 6.32 6.52 6.39
Meas. Alk mg L-1 CaCO3
83 52 47 126 46 63 203 171
DO mg L-1 6.71 6.54 1.18 0.68 0.21 0.34 0.43 0.77
TDScalc mg L-1 471 320 1657 1061 929 1142 680 716
Na mg L-1 70 40 430 230 210 270 150 160
Ca mg L-1 21 15 86 61 64 68 20 30
Mg mg L-1 14 9 45 31 32 34 11 14
14
ID unit PB1 PB3 WCB04 WCB08 WCB09 WCB10 WCB17 WCB22
K mg L-1 5 3 18 11 10 10 6 8
Cl mg L-1 110 60 760 380 450 500 140 170
SO4 mg L-1 15 <5 230 160 77 140 73 92
HCO3 mg L-1 100 63 56 150 55 75 245 206
CO3 mg L-1 0.020 0.006 0.007 0.022 0.007 0.012 0.060 0.037
Al mg L-1 <0.005 <0.005 <0.005 <0.005 <0.005 <0.005 <0.005 <0.005
Ba mg L-1 0.11 0.097 0.046 0.04 0.082 0.049 0.034 0.035
B mg L-1 0.11 0.1 0.17 0.17 0.13 0.16 0.24 0.15
Cr mg L-1 0.002 0.003 <0.001 <0.001 <0.001 0.002 0.003 <0.001
Co mg L-1 <0.001 <0.001 <0.001 0.003 0.002 <0.001 <0.001 <0.001
Cu mg L-1 0.001 0.006 0.003 0.001 <0.001 0.001 0.001 <0.001
Pb mg L-1 <0.001 0.002 <0.001 <0.001 <0.001 <0.001 <0.001 0.002
Li mg L-1 <0.001 <0.001 0.019 0.004 0.008 <0.001 0.006 0.021
Ni mg L-1 <0.001 <0.001 0.002 0.004 0.005 0.002 0.003 <0.001
Rb mg L-1 0.008 0.006 0.046 0.023 0.026 0.024 0.015 0.029
Sr mg L-1 0.29 0.21 1.2 0.68 0.72 0.81 0.24 0.36
Zn mg L-1 0.025 0.092 0.037 0.054 0.046 0.1 0.11 0.037
Br mg L-1 0.45 0.24 1.4 1.6 0.96 1.4 0.58 0.75
I mg L-1 <0.05 <0.05 0.11 0.19 0.08 0.12 0.23 0.24
F mg L-1 0.2 0.2 0.2 0.3 0.3 0.2 0.5 0.4
NO3 mg L-1 5.7 1.7 <0.01 <0.01 <0.01 0.01 <0.01 0.037
P mg L-1 0.006 0.009 <0.005 <0.005 <0.005 <0.005 <0.005 <0.005
SiO2 mg L-1 61 58 14 17 14 21 16 16
Fe mg L-1 0.007 <0.005 0.2 0.012 0.87 0.033 0.15 1.8
Mn mg L-1 <0.001 <0.001 0.071 <0.001 0.017 0.003 0.006 0.019
d-excess ‰ 5.9 4.4 2.3 1.0 5.3 5.5 5.0 5.9
δ18O ‰ -8.4 -8.2 -7.7 -7.1 -8.0 -7.6 -7.7 -7.6
δ2H ‰ -61.0 -61.2 -59.3 -56.0 -58.3 -55.3 -56.2 -54.8
δ13CTDIC ‰ -13.1 -15.5 -15.4 -12.4 -17.8 -14.6 -10.6 -10.8
DIC mmol L-1 2.7 2.3 2.0 4.8 1.8 2.3 6.2 5.9
logPCO2 atm -1.4 -1.3 -1.4 -1.1 -1.5 -1.4 -1.1 -1.0
CBE % 1.1 6.6 0.0 -2.1 0.0 -0.2 -5.2 -1.5
Calcite SI -1.5 -2.1 -1.7 -1.2 -1.7 -1.5 -1.2 -1.2
Dolomite SI -2.8 -4.0 -3.2 -2.3 -3.2 -2.8 -2.2 -2.4
Gypsum SI -2.9 -3.7 -1.4 -1.6 -1.9 -1.6 -2.3 -2.0
Halite SI -6.7 -7.2 -5.1 -5.7 -5.7 -5.5 -6.3 -6.2
Haematite SI 9.5 7.5 7.6 -1.7 5.9 6.2 7.0 6.9
Anorthite SI -4.4 -5.1 -5.9 -5.7 -6.0 -5.2 -5.7 -5.8
Albite SI -1.3 -1.9 -2.7 -2.7 -3.0 -2.2 -2.8 -2.8
4.2 Environmental isotopes Groundwaters were found to have highly depleted δ18O and δ2H values relative to seawater, with averages of -7.8 ‰ and -57.8 ‰, respectively. The δ13CTDIC values for groundwaters were also found to be depleted relative to seawater, with values ranging from -10.6 (WCB17) to -17.8 (WCB09) with an average value of -13.8 ‰. Sample WCB09 had the most depleted δ13CTDIC value of -17.8 ‰ and this depletion is likely to be because the groundwater has been influenced by organic matter degradation. Uncorrected 14C activities were found to range from 79.15 ± 0.33 pMC (PB1) at Shay Gap to 0.32 ± 0.04 pMC (WCB04) at the end of the flow path.
15
5 Discussion
5.1 Inferred geochemistry and associated hydrochemical reactions for the Wallal Sandstone
Due to the lack of mineralogical data for the Wallal Sandstone, mineral assemblages were based on the assumption that the three main components of the aquifer are composed of quartz (silica), feldspar and rock fragments. The mineralogy of the Wallal Sandstone is likely to be dominated by silica. Silica has an extremely slow dissolution rate; the mean lifetime for a 1 mm crystal is 34 million years based on laboratory studies of water with a pH of 5 at 25 ºC (Lasaga, 1984). It is highly unlikely that the dissolution of silica is influencing the hydrogeochemical evolution of these waters. Other minerals likely to be found are feldspars such as anorthite and albite, and these may constitute 10 to 15 % of the volume of a sandstone (Leeder, 1982). The incongruent weathering of these minerals to clay minerals is most likely to be influencing the water chemistry according to the following reactions:
Equation 2 2Na(AlSi3)O8(s) + 2H+ + 9H2O → Al2Si2O5(OH)4(s) + 2Na+ + 4H4SiO4
Albite Kaolinite
Equation 3 Ca(Al2Si2)O8(s) + 2H+ + H2O → Al2Si2O5(OH)4(s) + Ca2+
Anorthite Kaolinite
The absence of a significant change in pH along the flow path indicates large amounts of H+ are not being consumed. Hence, it is likely that the feldspars are altering to montmorillonite and not kaolinite. Furthermore, when feldspars alter to montmorillonite more silica is preserved in the weathering product (Appelo and Postma, 2005), which would explain the decrease in silica concentration along the flow path. For these reactions to occur, it is assumed that there is a source of Mg2+, which would most likely be supplied from reverse ion exchange reactions. Weathering of feldspars to montmorillonite occurs according to the following reactions:
Equation 4 3Na(AlSi3)O8(s) + Mg2+ + 4H2O →
Albite
2Na0.5(Al1.5Mg0.5)Si4O10(OH)2(s) + 2Na+ + H4SiO4
Montmorillonite
Anorthite has a much greater dissolution rate (112 yrs) than albite (80,000 yrs) (Lasaga, 1984). Consequently, the dissolution of anorthite is considered to be the dominant feldspar influencing the observed water chemistry. Sandstones are also likely to consist of secondary cements such as calcite and iron oxides, and accessory minerals such as heavy mineral sands (Leeder, 1982). It must be noted that the presence of as little as 1 % of carbonates in silicate or aluminosilicate rocks will tend
16
to dominate the chemistry of the groundwater (Langmuir, 1997). The geochemistry and hence hydrochemical processes occurring in the Wallal Sandstone have been inferred from this review of geochemical processes, therefore, an assessment of the mineralogy of this aquifer is needed for mass balance modelling to be refined.
5.2 Hydrogeochemical evolution of groundwaters Hydrogeochemical processes likely to influence the radiocarbon chemistry of the groundwaters are discussed in the following. This provides a greater understanding of whether the addition of active or inactive carbon to the groundwater could be influencing the observed chemistry and consequently the radiocarbon age. Three groups of waters are evident from the presented results. They include the:
1. brackish (TDS = 930 to 1,657 mg L-1), palaeowaters located in the northwestern discharge zone;
2. fresh (TDS <470 mg L-1), “modern” or “submodern” located in the southern recharge zone; and
3. marginal (TDS ~700 mg L-1), relatively young waters in the northeastern section.
The hydrogeochemical evolution of groundwaters from recharge to discharge along the flow path is likely to be dominated by water-rock interaction. Evidence for this is clear with strong correlations between TDS and variables such as Na+, Ca2+, Mg2+, K+, Cl-, SO4
2-, Rb+ and Sr2+ (r >0.9). Piezometer WCB04 is located at the end of the flow path and has the highest TDS (1,657 mg L-1) and ion concentrations of groundwaters sampled. This sample is also the oldest groundwater from the study site.
The Ca2+/Mg2+ ratios in all groundwaters show there is an excess of Mg2+ relative to Ca2+ compared to seawater, indicating that a source of Ca2+ exists or that Mg2+ is being removed relative to Ca2+ in the aquifer (Figure 4a). The source of Ca2+ would most likely be from calcite and/or gypsum dissolution and/or from aluminosilicate dissolution. The processes likely to decrease Mg2+ concentrations are reverse ion exchange or the formation of montmorillonite. The Ca2+/SO4
2- ratios are highest in recharge waters, relative to seawater. This is most likely because gypsum dissolution is increasing the SO4
2- concentrations in the groundwater as it migrates along the flow path producing a ratio that moves closer to that of seawater because the aquifer was deposited in a marine environment. Recharge waters have Na+/Cl- ratios close to unity. As the groundwaters evolve along the flow path from the recharge zone, the Na+/Cl- ratios decrease to values similar to seawater values (Figure 4b). This is likely to be from reverse ion exchange reactions along the flow path where Na+ is removed from the groundwater and exchanged with clay minerals in the aquifer. Groundwaters in the northern section have elevated Na+/Cl- ratios >1.4 indicating a source of Na+ in the aquifer other than from a marine influence. The source of Na+ in the northern waters is likely to be from ion exchange or silicate weathering reactions. It is clear from the chemistry that the northern waters are influenced by mixing of palaeowaters and fresh throughflow groundwaters from the south.
17
The plot of Cl-/Br- ratios show that groundwaters from the discharge zone lie above the seawater ratio of ~650, and groundwaters from the recharge zone and northern section are below this value (Figure 4b). Davis et al. (1998) state that groundwater Cl-
/Br- ratios generally range from 600 to 900. In this study, an increase in this ratio along the flow path (WCB04) to greater than 1,000 implies that Cl- is contributed to the groundwater from within the aquifer system. Minor halite dissolution is likely to be influencing the Cl- increase along the flow path as the groundwater migrates from the recharge to discharge zone. This is highly probable considering that the aquifer sediments are of marine origin.
Figure 4 (a) Ca2+/Mg2+ vs. Ca2+/SO42- and (b) Na-/Cl- molar ratios vs. Cl-/Br- molar ratios for
groundwaters.
5.3 Carbon chemistry To achieve more reliable radiocarbon dates for the groundwaters from this study site, the various hydrogeochemical sources and sinks of active and inactive carbon within the aquifer need to be identified. In an unconfined aquifer or in a recharge area, the groundwater system is open to atmospheric CO2(g), and the pCO2 remains constant and close to soil levels (pCO2 = 10-1.8 atm at 25ºC). The DIC concentrations will also be elevated and continuously exchanging within the system, leaving calcite undersaturated. All groundwaters collected in this study were found to have elevated pCO2 values (>10-1.5 atm) beyond soil levels (Figure 5a) and undersaturated with respect to calcite (Figure 5b). These findings indicating that these groundwaters were obtained from a closed system including the waters from the recharge zone in the south (Shay Gap). All groundwaters from the study area have been isolated from active carbon such as atmospheric and soil zone CO2. Therefore, sources of inactive carbon such as carbonate dissolution and aluminosilicate weathering are the most likely influences on the carbon chemistry. To evaluate the evolution of carbon, the δ13CTDIC values of the groundwaters are considered. Generally, groundwater recharge begins with a δ13CTDIC value equivalent to atmospheric CO2(g) with a δ13CTDIC value of -7 ‰ and a14C of ~100 pMC. The
18
δ13CTDIC value of the recharge water within the root zone is then likely to be depleted by photosynthetic uptake by plants (Tipple and Pagani, 2007). From Figure 6a, it appears that there is a relationship between δ13CTDIC and DIC concentration. The same groundwaters that have elevated pCO2 and DIC concentrations also have the most enriched δ13CTDIC values but these are waters not evolving along the flow path. Groundwaters from the recharge zone have similar DIC concentrations and δ13CTDIC values to the discharge waters. This is indicating that there is not a large source of DIC within the aquifer and the addition of DIC along the flow path is not enriching the δ13CTDIC values. The aquifer is of marine origin and it would be expected that δ13CTDIC values in groundwater would move towards more enriched values along the flow path. The only published δ13C values for carbonates in the Pilbara region were for Late Devonian carbonates located in the northern sections of the Canning Basin. They were found to vary from +1 to +2 ‰ (Stephens and Sumner, 2003).
Figure 5 A Bivariate plots of (a) logpCO2 (atm) vs. DIC and (b) calcite SI vs. DIC.
Figure 6 Bivariate plots of (a) δ13CTDIC vs. DIC and (b) δ13CTDIC vs. measured 14C activity.
19
A comparison of the measured 14C results with δ13CTDIC values in Figure 6b shows that there is no distinctive relationship between the variables indicating that as the groundwaters evolve along the flow path, the addition of inactive carbon from calcites contained in the aquifer is not the only process influencing the δ13CTDIC values. All groundwaters from the study site are influenced by the addition of DIC from carbonate dissolution and most likely by aluminosilicate weathering. Groundwaters from the northeastern section and sample WCB08 are influenced by carbonate dissolution to a greater degree than the other groundwaters from the study site as indicated by more enriched δ13CTDIC values and higher DIC concentrations.
5.4 Corrected radiocarbon ages Corrected radiocarbon ages are presented in Table 2 and were corrected according to the methods described in section 3.3. The groundwaters from the southern recharge zone and northeastern section of the Wallal Sandstone aquifer were found to have large relative differences in uncorrected and corrected ages. The addition of inactive carbon from carbonate and/or aluminosilicate weathering is likely to be making these groundwaters appear older. Groundwaters located closest to the recharge areas (near Shay Gap) were found to be the youngest groundwaters (Table 2). It is not possible to distinguish whether these waters are ‘modern’ i.e. those that have been recharged within the past few decades and are part of the hydrological cycle or whether they are ‘submodern’. In order to do so, 3H analysis of the groundwater samples would need to be undertaken. Modern groundwaters contain 3H and are younger than 45 years relative to the mid-1990s. Groundwaters containing no 3H are considered submodern (Clark and Fritz, 1997).
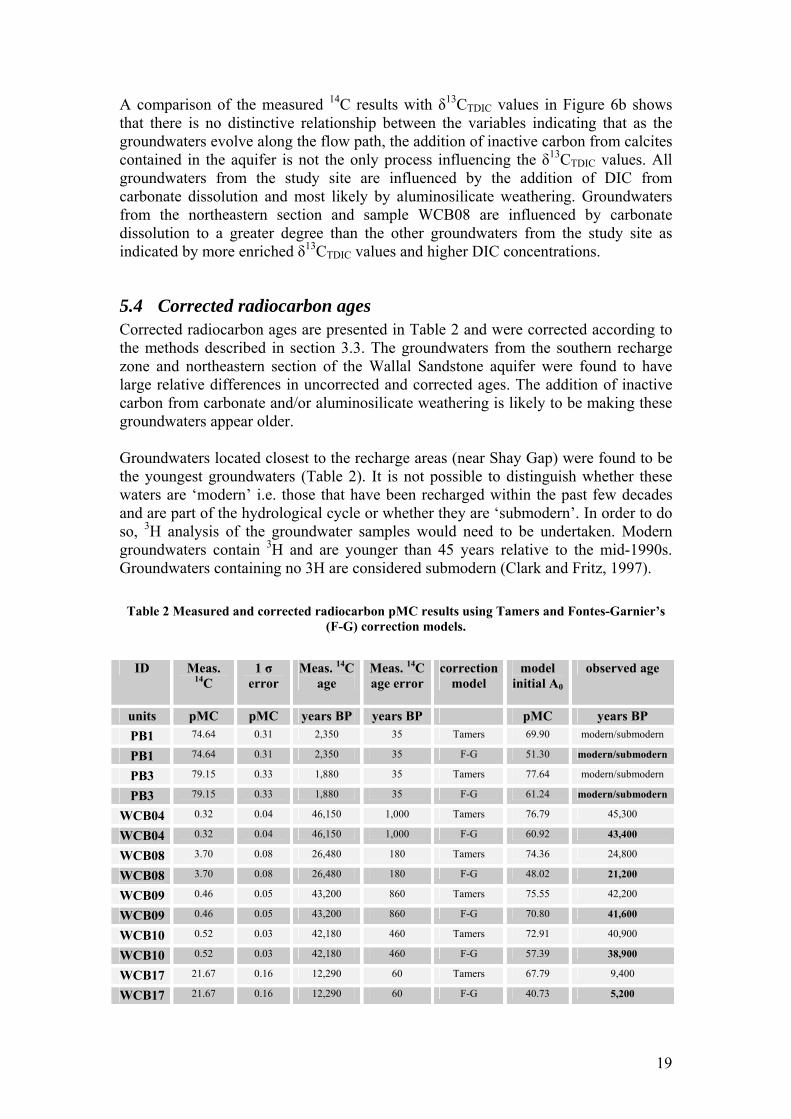
Table 2 Measured and corrected radiocarbon pMC results using Tamers and Fontes-Garnier’s (F-G) correction models.
ID Meas.
14C 1 σ
error Meas. 14C
age Meas. 14C age error
correction model
model initial A0
observed age
units pMC pMC years BP years BP pMC years BP PB1 74.64 0.31 2,350 35 Tamers 69.90 modern/submodern
PB1 74.64 0.31 2,350 35 F-G 51.30 modern/submodern
PB3 79.15 0.33 1,880 35 Tamers 77.64 modern/submodern
PB3 79.15 0.33 1,880 35 F-G 61.24 modern/submodern
WCB04 0.32 0.04 46,150 1,000 Tamers 76.79 45,300
WCB04 0.32 0.04 46,150 1,000 F-G 60.92 43,400
WCB08 3.70 0.08 26,480 180 Tamers 74.36 24,800
WCB08 3.70 0.08 26,480 180 F-G 48.02 21,200
WCB09 0.46 0.05 43,200 860 Tamers 75.55 42,200
WCB09 0.46 0.05 43,200 860 F-G 70.80 41,600
WCB10 0.52 0.03 42,180 460 Tamers 72.91 40,900
WCB10 0.52 0.03 42,180 460 F-G 57.39 38,900
WCB17 21.67 0.16 12,290 60 Tamers 67.79 9,400
WCB17 21.67 0.16 12,290 60 F-G 40.73 5,200
20
ID Meas. 14C
1 σ error
Meas. 14C age
Meas. 14C age error
correction model
model initial A0
observed age
units pMC pMC years BP years BP pMC years BP WCB22 16.18 0.15 14,630 80 Tamers 71.53 12,300
WCB22 16.18 0.15 14,630 80 F-G 41.44 7,800
Groundwaters from the northeastern section of the aquifer were calculated to be 5,200 and 7,800 years BP. It is possible that these waters could be younger than these corrected values suggest, because silicate weathering is likely to be adding HCO3
- to the waters, making them appear older. The Tamers and F-G correction models do not consider DIC addition from silicate weathering. This can only be accounted for with mass balance modelling. A thorough flow path model would be needed to understand the contribution that aluminosilicate weathering has on the DIC concentration in these groundwaters. Using the F-G model, the corrected groundwater ages from the northwestern discharge area were found to range from 21,200 to 43,400 years BP compared to measured ages of 26,480 to 46,150 years BP. Sample WCB04 was found to have an uncorrected age of 46,150 years and final corrected age of 43,400 yrs BP. These results show that the addition of inactive carbon from the aquifer is making the measured ages older than they actually are and that correction methods produce more reliable ages. It must be noted that mass balance modelling as suggested by Plummer and Sprinkle (2001) could not be performed in this study because most of the piezometers were located in the discharge zone and groundwater samples along the transect were sparse. Mass balance modelling would most likely produce a younger age than the F-G correction model reveals because it would also account for the addition of inactive DIC from aluminosilicate weathering. The ages calculated by the F-G model are consistently younger than the Tamers. A comparison of the Tamers and F-G correction models for the groundwaters from the discharge zone shows that isotopic exchange is likely to decrease the ages by a further ~2,000 years, this is why the F-G model is the preferred correction method for this study.
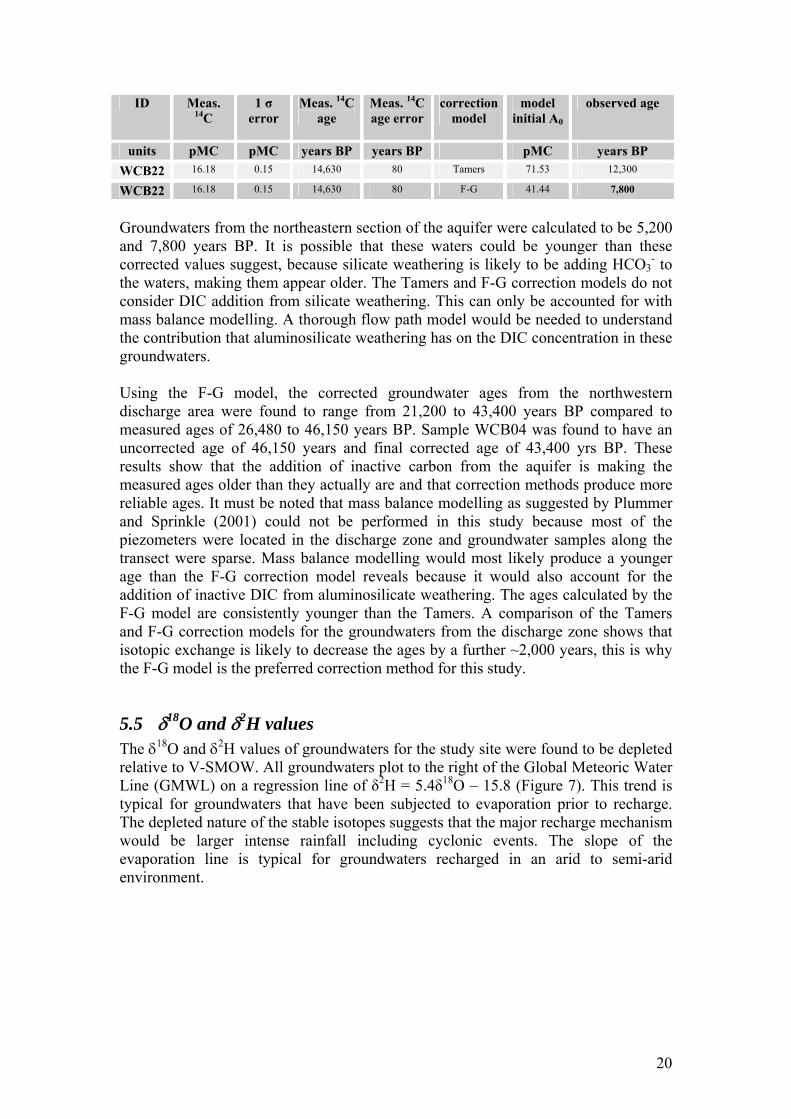
5.5 δ18O and δ2H values The δ18O and δ2H values of groundwaters for the study site were found to be depleted relative to V-SMOW. All groundwaters plot to the right of the Global Meteoric Water Line (GMWL) on a regression line of δ2H = 5.4δ18O – 15.8 (Figure 7). This trend is typical for groundwaters that have been subjected to evaporation prior to recharge. The depleted nature of the stable isotopes suggests that the major recharge mechanism would be larger intense rainfall including cyclonic events. The slope of the evaporation line is typical for groundwaters recharged in an arid to semi-arid environment.
21
Figure 7 A bivariate plot of δ2H vs. δ18O results plotted against the GMWL (δ2H ‰ = 8.13δ18O + 10.8; (Rozanski et al., 1993).
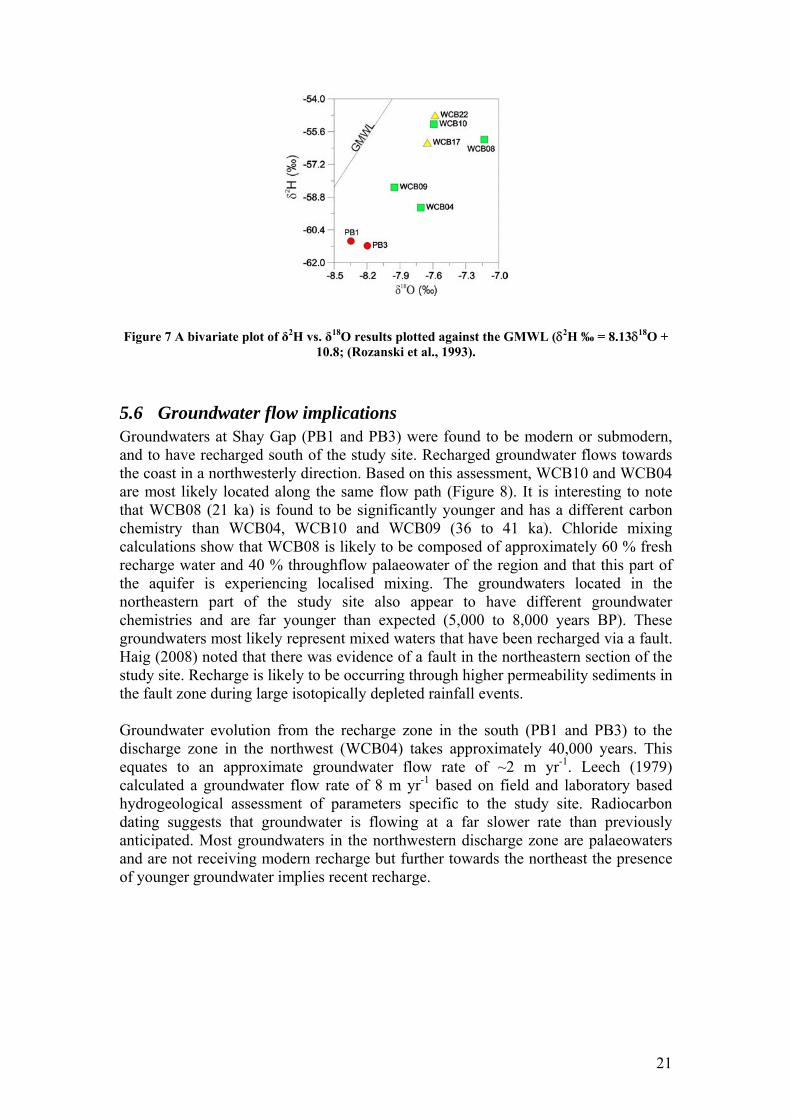
5.6 Groundwater flow implications Groundwaters at Shay Gap (PB1 and PB3) were found to be modern or submodern, and to have recharged south of the study site. Recharged groundwater flows towards the coast in a northwesterly direction. Based on this assessment, WCB10 and WCB04 are most likely located along the same flow path (Figure 8). It is interesting to note that WCB08 (21 ka) is found to be significantly younger and has a different carbon chemistry than WCB04, WCB10 and WCB09 (36 to 41 ka). Chloride mixing calculations show that WCB08 is likely to be composed of approximately 60 % fresh recharge water and 40 % throughflow palaeowater of the region and that this part of the aquifer is experiencing localised mixing. The groundwaters located in the northeastern part of the study site also appear to have different groundwater chemistries and are far younger than expected (5,000 to 8,000 years BP). These groundwaters most likely represent mixed waters that have been recharged via a fault. Haig (2008) noted that there was evidence of a fault in the northeastern section of the study site. Recharge is likely to be occurring through higher permeability sediments in the fault zone during large isotopically depleted rainfall events. Groundwater evolution from the recharge zone in the south (PB1 and PB3) to the discharge zone in the northwest (WCB04) takes approximately 40,000 years. This equates to an approximate groundwater flow rate of ~2 m yr-1. Leech (1979) calculated a groundwater flow rate of 8 m yr-1 based on field and laboratory based hydrogeological assessment of parameters specific to the study site. Radiocarbon dating suggests that groundwater is flowing at a far slower rate than previously anticipated. Most groundwaters in the northwestern discharge zone are palaeowaters and are not receiving modern recharge but further towards the northeast the presence of younger groundwater implies recent recharge.
22
Figure 8 Corrected radiocarbon ages and inferred flow paths based on corrected radiocarbon
ages for the groundwaters sampled (M = modern and SM = submodern).
6 Conclusions The Wallal Sandstone was the target aquifer in this study. Representative groundwater ages were determined to improve the understanding of recharge processes for the West Canning Basin. Groundwaters were found to be depleted in δ18O and δ2H values suggesting that the major recharge mechanism for the aquifer would be large intense rainfall events. Three major types of groundwaters were discovered in the study including the: fresh “modern” or “submodern” recharge waters of the south, brackish palaeowaters located in the discharge zone to the northwest and marginal relatively young waters in the northeastern section of the study site. The hydrochemical evolution of groundwaters from recharge to discharge is likely to be influenced by; halite dissolution, gypsum dissolution, reverse ion exchange, the formation of montmorillonite, and more importantly for radiocarbon corrections, calcite dissolution and aluminosilicate weathering. The latter two processes are important because they are likely to influence the measured 14C activity by adding inactive DIC to the groundwater. The use of published correction models such as the Tamers and F-G showed that the corrected groundwater ages were considerably younger than the measured ages. The actual age of the groundwater is most likely to be slightly younger because aluminosilicate weathering has not been accounted for in these correction methods. For this process to be considered, mass balance modelling would need to be completed along a defined flow path. This modelling approach would account for all the hydrogeochemical processes influencing carbon in the aquifer. It is the most accurate way of correcting radiocarbon dates, thus producing
23
the most representative groundwater ages for the system. The location and number of groundwater piezometers were limited in this study and the existing sampling network focussed on the discharge areas of the aquifer, limiting the distribution of sample locations throughout the aquifer. Based on the corrected radiocarbon results for this study, groundwaters at Shay Gap were found to be modern to submodern, flowing in a northwesterly direction towards the coastline and taking approximately 40,000 years. Palaeowaters are present in the northwestern discharge zone of the Wallal Sandstone aquifer and groundwaters in the northeastern section of the study site are younger and are most likely being actively recharged via a fault.
7 Recommendations Recommendations for future works in the study area are as follows:
• To further refine the hydrogeochemical modelling for radiocarbon age corrections:
1. Drill transects of piezometers from the recharge areas in the south, to the coast, so that mass balance modelling along a flow path can be completed;
2. Mineralogical analysis of the Wallal Sandstone; 3. Collect sediment samples for δ13C and 14C analysis of the carbonate fractions
of the aquifer; 4. Collect soil gas samples and carbonate samples in the recharge zone for δ13C
and 14C analysis; • Expanding the suite of analyses to include 3H and radiogenic isotopes
(87Sr/86Sr) to determine whether recharge waters are modern or submodern and to identify the amount of mixing that is occurring between the various end-member waters;
• Perform pump-test analysis and collect groundwater samples during this testing to identify variation in the water chemistry and 14C ages with groundwater abstraction;
• Deploy rainfall samplers and analyse rainfall samples for stable water isotopes (δ18O and δ2H) to allow improved interpretation of groundwater recharge; and
• Analyse the soil chemistry and stable isotope composition of soil profiles in the recharge zones to trace recharge events and intensities in the unsaturated zone.
8 Acknowledgements The author would like to thank the Government of Western Australia (WA), Department of Water (DoW) for providing the funding and support for this project with special mention to Mr Hazli Koomberi and Mr Paul Crogan. I would also like to thank ANSTO analytical and technical staff in providing the radiocarbon results: in particular Alan Williams and Simon Varley. A big thank you to Dr Suzanne Hollins and Dr Dioni Cendón from ANSTO for their editorial assistance with the report.
24
9 References Appelo, C. and Postma, D., 2005. Geochemistry, groundwater and pollution. 2nd Ed. A.A. Balkema, Leiden, The Netherlands. 649 pp. BOM, 2008. Climate statistics for Australian sites. Commonwealth of Australia. Bureau of Meteorology (ABN 92 637 533 532). http://www.bom.gov.au/climate/averages/tables/ca_nsw_names.shtml. Clark, I. and Fritz, P., 1997. Environmental isotopes of hydrogeology. CRC Press LLC, Corporate Blvd., N.W. Boca Raton, FL 33431 (USA). 352 pp. Fink, D., Hotchkis, M., Hua, Q., Jacobsen, G., Smith, A.M., Zoppi, U., Child, D., Mifsud, C., van der Gaast, H., Williams, A., Williams, M., 2004. The ANTARES AMS facility at ANSTO. NIM B, 223-224, 109–115. Fontes, J.C. and Garnier, J.M., 1979. Determination of the Initial 14C Activity of the Total Dissolved Carbon: A Review of the Existing Models and a New Approach. Water Resources Research, 15(2): 399-410. Haig, T., 2008. The Pilbara Coast Water Study, Department of Water, Hydrogeological Series, Report HR 267, 184 pp. Ingerson, E. and Pearson, F.J., 1964. Estimation of age and rate of motion of groundwater by the 14C-method. Recent Researches in the Fields of Atmosphere, Hydrosphere, and Nuclear Geochemistry, Sugawara Festival Volume, Maruzen Co., Tokyo. Kalin, R.M., 1999. Radiocarbon dating of groundwater systems. In: Cook, P.G. and Herczeg, A.L. (eds). Environmental tracers in subsurface hydrology. Kluwer, Boston, pp 112–144. Langmuir, D., 1997. Aqueous Environmental Geochemistry. Prentice Hall, Upper Saddle River, New Jersey. Lasaga, A.C., 1984. Chemical kinetics of water-rock interactions. J. Geophysics. Res.; Vol/Issue: 89:B6: Pages: 4009-4025. Leech, R.E.J., 1979. Geology and groundwater resources of the Southwestern Canning Basin, Western Australia. Geological Survey of Western Australia. Record 1979/9. Perth 1979. ISBN No. 072448034X. Leeder, M.R., 1982. Sedimentology: process and product. Harper Collins Academic. London, UK. 344 pp. Mook, W.G., 1976. The dissolution-exchange model for dating groundwater with 14C. Interpretation of Environmental Isotope and Hydrochemical Data in Groundwater Hydrology, Vienna. Parkhurst, D. and Appelo, C., 1999. User’s guide to PHREEQC (version 2) – a computer program for speciation, batch-reaction, one dimensional transport, and inverse geochemical calculations. USGS Water Resources Investigations Report 99-4259. Plummer, N., Prestemon, E. and Parkhurst, D., 1994. An interactive code (NETPATH) for modelling NET geochemical reactions along a flow PATH, Version 2.0. Technical Report Water-Resources Investigations Report 94-4169, U.S. Geological Survey. Plummer, N.L. and Sprinkle, C.L., 2001. Radiocarbon dating of dissolved inorganic carbon in groundwater from confined parts of the Upper Floridian aquifer, Florida, USA. Hydrogeology Journal, 9(2): 127-150.
25
Rozanski, K., Araguas-Araguas, L. and Gonfiantini, R., 1993. Isotopic patterns in modern global precipitation. In: Swart, P.K., Lohmann, K.C., McKenzie, J. and Savin, S. (Eds), 1993. Climate Change in Continental Isotopic Records American Geophysical Union, Washington, pp. 1–36. Semeniuk, V., 1996. Coastal forms and Quaternary processes along the arid Pilbara coast of northwestern Australia. Palaeogeography, Palaeoclimatology, Palaeoecology, 123(1-4): 49-84. Stephens, N.P. and Sumner, D.Y., 2003. Late Devonian carbon isotope stratigraphy and sea level fluctuations, Canning Basin, Western Australia. Palaeogeography, Palaeoclimatology, Palaeoecology, 191(2): 203-219. Stuiver, M. and Polach, H.A., 1977. Reporting of 14C data. Radiocarbon, 19: 355-363. Tamers, M.A., 1975. Validity of radiocarbon dates on ground water. Geophysical Surveys, 2: 217-239. Tipple, B.J. and Pagani, M., 2007. The Early Origins of Terrestrial C4 Photosynthesis. Annual Review of Earth and Planetary Sciences, 35(1): 435-461. Vogel, J., 1970. Carbon-14 dating of groundwater. In: Isotope Hydrology, 1970, Proceedings Symposium of International Atomic Energy Agency and UNESCO, Vienna, March 9-13, 1970: Vienna, International Atomic Energy Agency STI/PUB/255, Paper No SM-129/15, pp 225-239. Vogel, J.C., 1967. Investigation of groundwater flow with radiocarbon. pp 355-69 of Isotopes in Hydrology. Vienna, International Atomic Energy Agency, 1967. From: Conference on Isotopes in Hydrology, Vienna. See STI/ PUB--141;CONF- 661133.

Appendix 1
26
Australian Government____________________________________________National Measurement Institute
REPORT OF ANALYSISPage: 1 of 9
Report No. RN716701Client : DEPARTMENT OF WATER Job No. : WATE10_W/081215_09
WATER INFORMATION BRANCH Quote No. : QT-01478 ATRIUM BUILDING (GROUND FLOOR) Order No. : 033647 168 ST GEORGES TERRACE Date Sampled : 2-DEC-2008 PERTH WA 6000 Date Received : 11-DEC-2008
Attention : QA Officer Sampled By : CLIENTProject Name : West Canning BasinYour Client Services Manager : David Lynch Phone : (08) 9368 8420
Lab Reg No. Sample Ref Sample DescriptionW08/033647 PB1 West Canning Basin Groundwater 02/12/08W08/033648 PB3 West Canning Basin Groundwater 02/12/08W08/033649 WCB22 West Canning Basin Groundwater 03/12/08
Lab Reg No. W08/033647 W08/033648 W08/033649 Sample Reference PB1 PB3 WCB22
Units LOR MethodTrace Elements Aluminium mg/L <0.005 <0.005 <0.005 NT2_47 Barium mg/L 0.11 0.097 0.035 NT2_47 Beryllium mg/L <0.001 <0.001 <0.001 NT2_47 Boron mg/L 0.11 0.1 0.15 NT2_47 Cerium mg/L <0.001 <0.001 <0.001 NT2_47 Chromium mg/L 0.002 0.003 <0.001 NT2_47 Cobalt mg/L <0.001 <0.001 <0.001 NT2_47 Copper mg/L 0.001 0.006 <0.001 NT2_47 Dysprosium mg/L <0.001 <0.001 <0.001 NT2_47 Erbium mg/L <0.001 <0.001 <0.001 NT2_47 Gadolinium mg/L <0.001 <0.001 <0.001 NT2_47 Holmium mg/L <0.001 <0.001 <0.001 NT2_47 Lanthanum mg/L <0.001 <0.001 <0.001 NT2_47 Lead mg/L <0.001 0.002 0.002 NT2_47 Lithium mg/L <0.001 <0.001 0.021 NT2_47 Molybdenum mg/L <0.001 <0.001 <0.001 NT2_47 Neodymium mg/L <0.001 <0.001 <0.001 NT2_47 Nickel mg/L <0.001 <0.001 <0.001 NT2_47 Praseodymium mg/L <0.001 <0.001 <0.001 NT2_47 Rubidium mg/L 0.008 0.006 0.029 NT2_47 Samarium mg/L <0.001 <0.001 <0.001 NT2_47 Strontium mg/L 0.29 0.21 0.36 NT2_47 Terbium mg/L <0.001 <0.001 <0.001 NT2_47 Thorium mg/L <0.001 <0.001 <0.001 NT2_47 Titanium mg/L <0.005 <0.005 <0.005 NT2_47 Uranium mg/L <0.001 <0.001 <0.001 NT2_47 Vanadium mg/L <0.001 <0.001 <0.001 NT2_47 Ytterbium mg/L <0.001 <0.001 <0.001 NT2_47 Zinc mg/L 0.025 0.092 0.037 NT2_47
This report is issued in accordance with NATA’s accreditation requirementsPO Box 1246 Bentley DC WA 6983 Tel: +61 8 9368 8400 Fax: +61 8 9368 8499 www.measurement.gov.au_______________________________________________________________________________________
N a t i o n a l M e a s u r e m e n t I n s t i t u t e
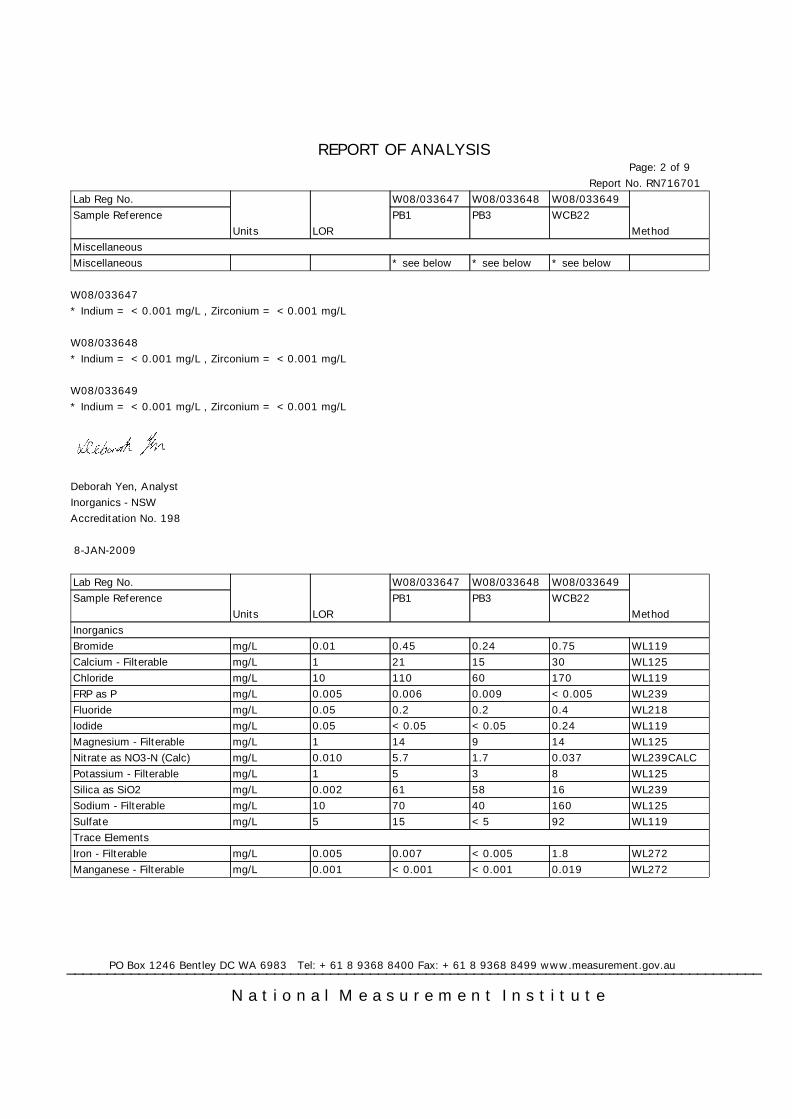
REPORT OF ANALYSISPage: 2 of 9
Report No. RN716701Lab Reg No. W08/033647 W08/033648 W08/033649 Sample Reference PB1 PB3 WCB22
Units LOR MethodMiscellaneous Miscellaneous * see below * see below * see below
W08/033647* Indium = <0.001 mg/L , Zirconium = <0.001 mg/L
W08/033648* Indium = <0.001 mg/L , Zirconium = <0.001 mg/L
W08/033649* Indium = <0.001 mg/L , Zirconium = <0.001 mg/L
Deborah Yen, AnalystInorganics - NSWAccreditation No. 198
8-JAN-2009
Lab Reg No. W08/033647 W08/033648 W08/033649 Sample Reference PB1 PB3 WCB22
Units LOR MethodInorganics Bromide mg/L 0.01 0.45 0.24 0.75 WL119 Calcium - Filterable mg/L 1 21 15 30 WL125 Chloride mg/L 10 110 60 170 WL119 FRP as P mg/L 0.005 0.006 0.009 <0.005 WL239 Fluoride mg/L 0.05 0.2 0.2 0.4 WL218 Iodide mg/L 0.05 <0.05 <0.05 0.24 WL119 Magnesium - Filterable mg/L 1 14 9 14 WL125 Nitrate as NO3-N (Calc) mg/L 0.010 5.7 1.7 0.037 WL239CALC Potassium - Filterable mg/L 1 5 3 8 WL125 Silica as SiO2 mg/L 0.002 61 58 16 WL239 Sodium - Filterable mg/L 10 70 40 160 WL125 Sulfate mg/L 5 15 <5 92 WL119 Trace Elements Iron - Filterable mg/L 0.005 0.007 <0.005 1.8 WL272 Manganese - Filterable mg/L 0.001 <0.001 <0.001 0.019 WL272
PO Box 1246 Bentley DC WA 6983 Tel: +61 8 9368 8400 Fax: +61 8 9368 8499 www.measurement.gov.au_______________________________________________________________________________________
N a t i o n a l M e a s u r e m e n t I n s t i t u t e
REPORT OF ANALYSISPage: 3 of 9
Report No. RN716701Lab Reg No. W08/033647 W08/033648 W08/033649 Sample Reference PB1 PB3 WCB22
Units LOR Method
Peter Anstis, AnalystInorganics - WAAccreditation No. 2474
8-JAN-2009
PO Box 1246 Bentley DC WA 6983 Tel: +61 8 9368 8400 Fax: +61 8 9368 8499 www.measurement.gov.au_______________________________________________________________________________________
N a t i o n a l M e a s u r e m e n t I n s t i t u t e
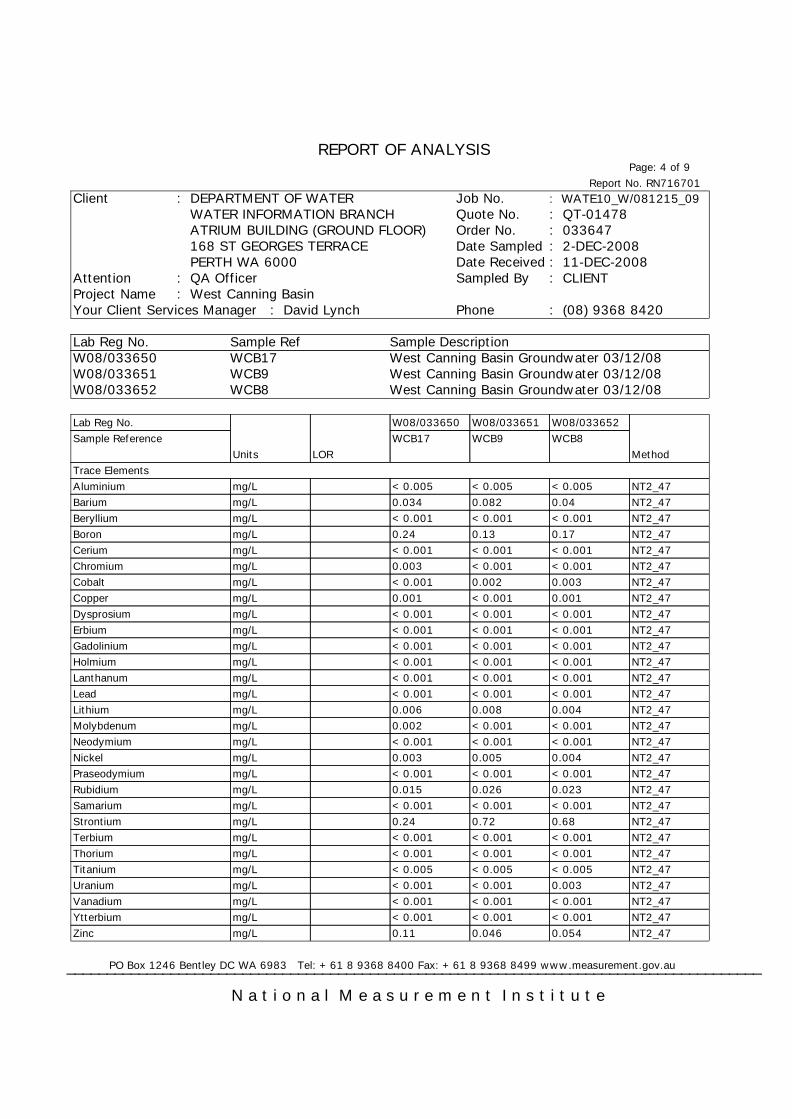
REPORT OF ANALYSISPage: 4 of 9
Report No. RN716701Client : DEPARTMENT OF WATER Job No. : WATE10_W/081215_09
WATER INFORMATION BRANCH Quote No. : QT-01478 ATRIUM BUILDING (GROUND FLOOR) Order No. : 033647 168 ST GEORGES TERRACE Date Sampled : 2-DEC-2008 PERTH WA 6000 Date Received : 11-DEC-2008
Attention : QA Officer Sampled By : CLIENTProject Name : West Canning BasinYour Client Services Manager : David Lynch Phone : (08) 9368 8420
Lab Reg No. Sample Ref Sample DescriptionW08/033650 WCB17 West Canning Basin Groundwater 03/12/08W08/033651 WCB9 West Canning Basin Groundwater 03/12/08W08/033652 WCB8 West Canning Basin Groundwater 03/12/08
Lab Reg No. W08/033650 W08/033651 W08/033652 Sample Reference WCB17 WCB9 WCB8
Units LOR MethodTrace Elements Aluminium mg/L <0.005 <0.005 <0.005 NT2_47 Barium mg/L 0.034 0.082 0.04 NT2_47 Beryllium mg/L <0.001 <0.001 <0.001 NT2_47 Boron mg/L 0.24 0.13 0.17 NT2_47 Cerium mg/L <0.001 <0.001 <0.001 NT2_47 Chromium mg/L 0.003 <0.001 <0.001 NT2_47 Cobalt mg/L <0.001 0.002 0.003 NT2_47 Copper mg/L 0.001 <0.001 0.001 NT2_47 Dysprosium mg/L <0.001 <0.001 <0.001 NT2_47 Erbium mg/L <0.001 <0.001 <0.001 NT2_47 Gadolinium mg/L <0.001 <0.001 <0.001 NT2_47 Holmium mg/L <0.001 <0.001 <0.001 NT2_47 Lanthanum mg/L <0.001 <0.001 <0.001 NT2_47 Lead mg/L <0.001 <0.001 <0.001 NT2_47 Lithium mg/L 0.006 0.008 0.004 NT2_47 Molybdenum mg/L 0.002 <0.001 <0.001 NT2_47 Neodymium mg/L <0.001 <0.001 <0.001 NT2_47 Nickel mg/L 0.003 0.005 0.004 NT2_47 Praseodymium mg/L <0.001 <0.001 <0.001 NT2_47 Rubidium mg/L 0.015 0.026 0.023 NT2_47 Samarium mg/L <0.001 <0.001 <0.001 NT2_47 Strontium mg/L 0.24 0.72 0.68 NT2_47 Terbium mg/L <0.001 <0.001 <0.001 NT2_47 Thorium mg/L <0.001 <0.001 <0.001 NT2_47 Titanium mg/L <0.005 <0.005 <0.005 NT2_47 Uranium mg/L <0.001 <0.001 0.003 NT2_47 Vanadium mg/L <0.001 <0.001 <0.001 NT2_47 Ytterbium mg/L <0.001 <0.001 <0.001 NT2_47 Zinc mg/L 0.11 0.046 0.054 NT2_47
PO Box 1246 Bentley DC WA 6983 Tel: +61 8 9368 8400 Fax: +61 8 9368 8499 www.measurement.gov.au_______________________________________________________________________________________
N a t i o n a l M e a s u r e m e n t I n s t i t u t e
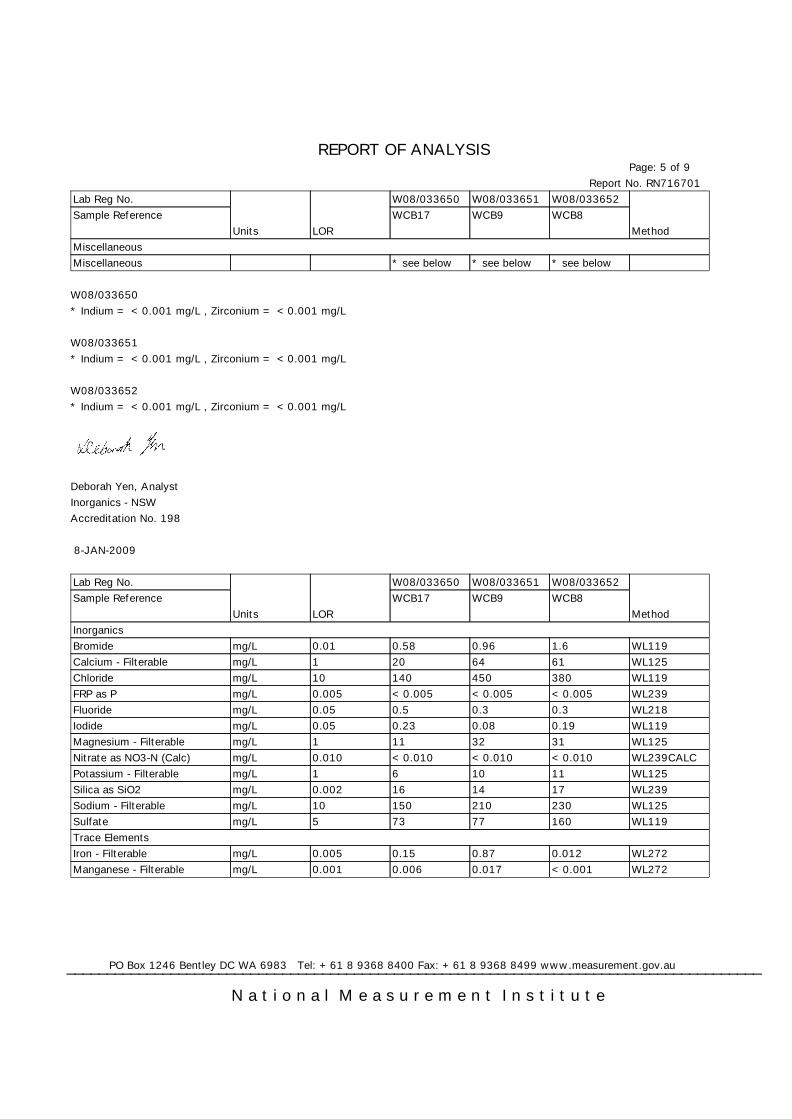
REPORT OF ANALYSISPage: 5 of 9
Report No. RN716701Lab Reg No. W08/033650 W08/033651 W08/033652 Sample Reference WCB17 WCB9 WCB8
Units LOR MethodMiscellaneous Miscellaneous * see below * see below * see below
W08/033650* Indium = <0.001 mg/L , Zirconium = <0.001 mg/L
W08/033651* Indium = <0.001 mg/L , Zirconium = <0.001 mg/L
W08/033652* Indium = <0.001 mg/L , Zirconium = <0.001 mg/L
Deborah Yen, AnalystInorganics - NSWAccreditation No. 198
8-JAN-2009
Lab Reg No. W08/033650 W08/033651 W08/033652 Sample Reference WCB17 WCB9 WCB8
Units LOR MethodInorganics Bromide mg/L 0.01 0.58 0.96 1.6 WL119 Calcium - Filterable mg/L 1 20 64 61 WL125 Chloride mg/L 10 140 450 380 WL119 FRP as P mg/L 0.005 <0.005 <0.005 <0.005 WL239 Fluoride mg/L 0.05 0.5 0.3 0.3 WL218 Iodide mg/L 0.05 0.23 0.08 0.19 WL119 Magnesium - Filterable mg/L 1 11 32 31 WL125 Nitrate as NO3-N (Calc) mg/L 0.010 <0.010 <0.010 <0.010 WL239CALC Potassium - Filterable mg/L 1 6 10 11 WL125 Silica as SiO2 mg/L 0.002 16 14 17 WL239 Sodium - Filterable mg/L 10 150 210 230 WL125 Sulfate mg/L 5 73 77 160 WL119 Trace Elements Iron - Filterable mg/L 0.005 0.15 0.87 0.012 WL272 Manganese - Filterable mg/L 0.001 0.006 0.017 <0.001 WL272
PO Box 1246 Bentley DC WA 6983 Tel: +61 8 9368 8400 Fax: +61 8 9368 8499 www.measurement.gov.au_______________________________________________________________________________________
N a t i o n a l M e a s u r e m e n t I n s t i t u t e
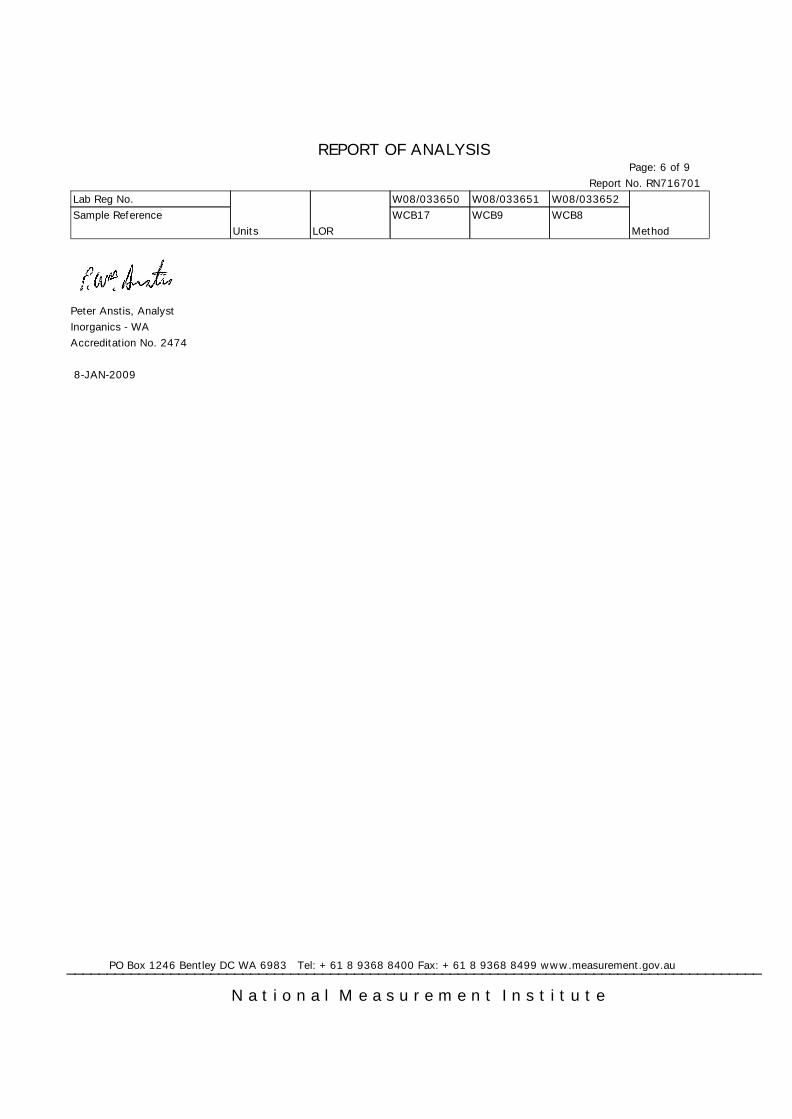
REPORT OF ANALYSISPage: 6 of 9
Report No. RN716701Lab Reg No. W08/033650 W08/033651 W08/033652 Sample Reference WCB17 WCB9 WCB8
Units LOR Method
Peter Anstis, AnalystInorganics - WAAccreditation No. 2474
8-JAN-2009
PO Box 1246 Bentley DC WA 6983 Tel: +61 8 9368 8400 Fax: +61 8 9368 8499 www.measurement.gov.au_______________________________________________________________________________________
N a t i o n a l M e a s u r e m e n t I n s t i t u t e
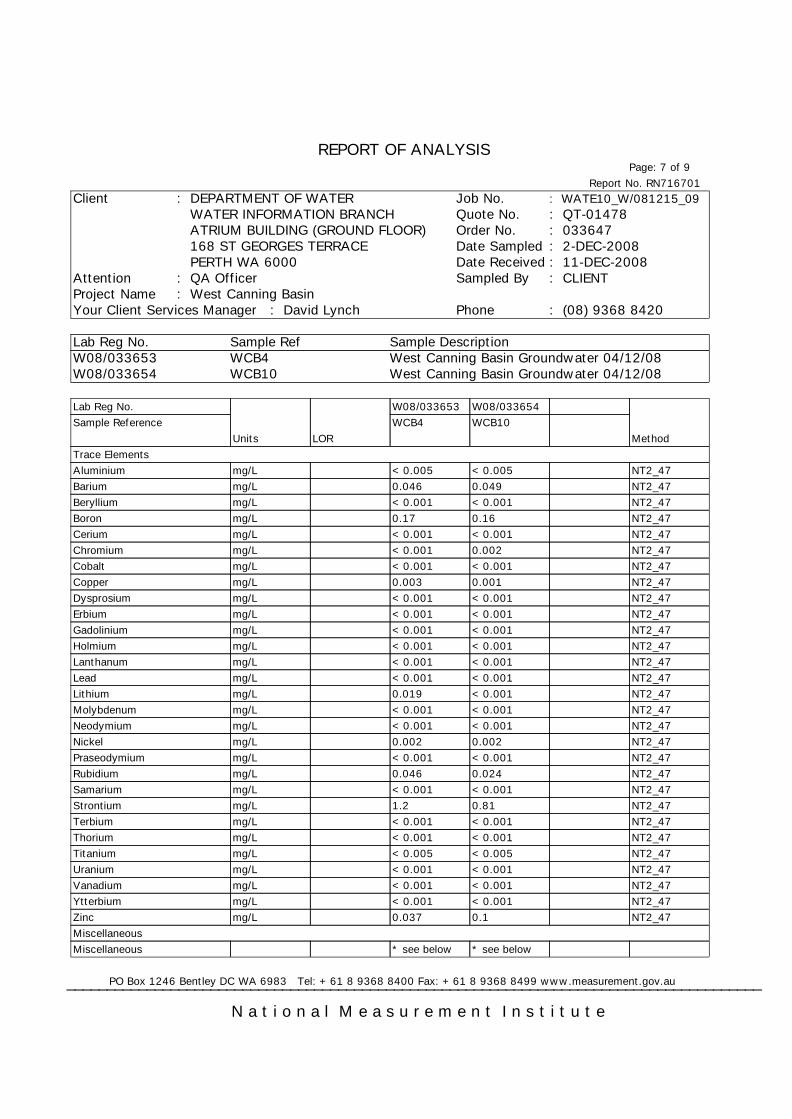
REPORT OF ANALYSISPage: 7 of 9
Report No. RN716701Client : DEPARTMENT OF WATER Job No. : WATE10_W/081215_09
WATER INFORMATION BRANCH Quote No. : QT-01478 ATRIUM BUILDING (GROUND FLOOR) Order No. : 033647 168 ST GEORGES TERRACE Date Sampled : 2-DEC-2008 PERTH WA 6000 Date Received : 11-DEC-2008
Attention : QA Officer Sampled By : CLIENTProject Name : West Canning BasinYour Client Services Manager : David Lynch Phone : (08) 9368 8420
Lab Reg No. Sample Ref Sample DescriptionW08/033653 WCB4 West Canning Basin Groundwater 04/12/08W08/033654 WCB10 West Canning Basin Groundwater 04/12/08
Lab Reg No. W08/033653 W08/033654 Sample Reference WCB4 WCB10
Units LOR MethodTrace Elements Aluminium mg/L <0.005 <0.005 NT2_47 Barium mg/L 0.046 0.049 NT2_47 Beryllium mg/L <0.001 <0.001 NT2_47 Boron mg/L 0.17 0.16 NT2_47 Cerium mg/L <0.001 <0.001 NT2_47 Chromium mg/L <0.001 0.002 NT2_47 Cobalt mg/L <0.001 <0.001 NT2_47 Copper mg/L 0.003 0.001 NT2_47 Dysprosium mg/L <0.001 <0.001 NT2_47 Erbium mg/L <0.001 <0.001 NT2_47 Gadolinium mg/L <0.001 <0.001 NT2_47 Holmium mg/L <0.001 <0.001 NT2_47 Lanthanum mg/L <0.001 <0.001 NT2_47 Lead mg/L <0.001 <0.001 NT2_47 Lithium mg/L 0.019 <0.001 NT2_47 Molybdenum mg/L <0.001 <0.001 NT2_47 Neodymium mg/L <0.001 <0.001 NT2_47 Nickel mg/L 0.002 0.002 NT2_47 Praseodymium mg/L <0.001 <0.001 NT2_47 Rubidium mg/L 0.046 0.024 NT2_47 Samarium mg/L <0.001 <0.001 NT2_47 Strontium mg/L 1.2 0.81 NT2_47 Terbium mg/L <0.001 <0.001 NT2_47 Thorium mg/L <0.001 <0.001 NT2_47 Titanium mg/L <0.005 <0.005 NT2_47 Uranium mg/L <0.001 <0.001 NT2_47 Vanadium mg/L <0.001 <0.001 NT2_47 Ytterbium mg/L <0.001 <0.001 NT2_47 Zinc mg/L 0.037 0.1 NT2_47 Miscellaneous Miscellaneous * see below * see below
PO Box 1246 Bentley DC WA 6983 Tel: +61 8 9368 8400 Fax: +61 8 9368 8499 www.measurement.gov.au_______________________________________________________________________________________
N a t i o n a l M e a s u r e m e n t I n s t i t u t e
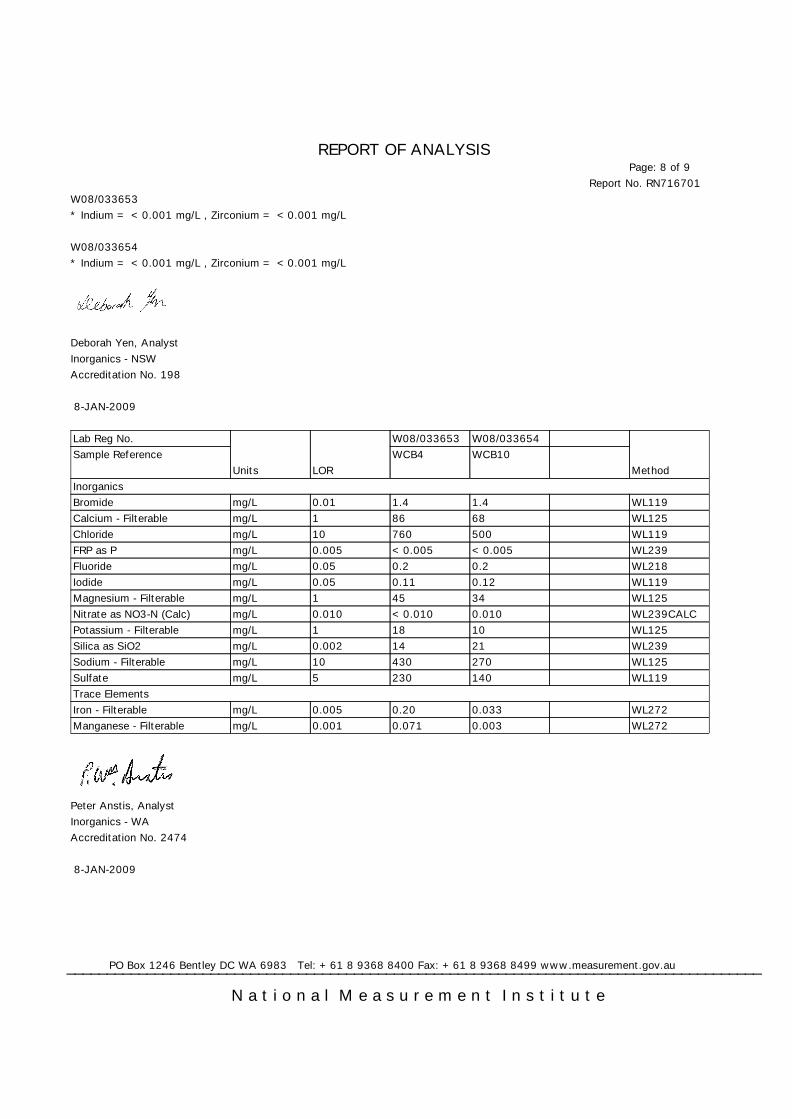
REPORT OF ANALYSISPage: 8 of 9
Report No. RN716701W08/033653* Indium = <0.001 mg/L , Zirconium = <0.001 mg/L
W08/033654* Indium = <0.001 mg/L , Zirconium = <0.001 mg/L
Deborah Yen, AnalystInorganics - NSWAccreditation No. 198
8-JAN-2009
Lab Reg No. W08/033653 W08/033654 Sample Reference WCB4 WCB10
Units LOR MethodInorganics Bromide mg/L 0.01 1.4 1.4 WL119 Calcium - Filterable mg/L 1 86 68 WL125 Chloride mg/L 10 760 500 WL119 FRP as P mg/L 0.005 <0.005 <0.005 WL239 Fluoride mg/L 0.05 0.2 0.2 WL218 Iodide mg/L 0.05 0.11 0.12 WL119 Magnesium - Filterable mg/L 1 45 34 WL125 Nitrate as NO3-N (Calc) mg/L 0.010 <0.010 0.010 WL239CALC Potassium - Filterable mg/L 1 18 10 WL125 Silica as SiO2 mg/L 0.002 14 21 WL239 Sodium - Filterable mg/L 10 430 270 WL125 Sulfate mg/L 5 230 140 WL119 Trace Elements Iron - Filterable mg/L 0.005 0.20 0.033 WL272 Manganese - Filterable mg/L 0.001 0.071 0.003 WL272
Peter Anstis, AnalystInorganics - WAAccreditation No. 2474
8-JAN-2009
PO Box 1246 Bentley DC WA 6983 Tel: +61 8 9368 8400 Fax: +61 8 9368 8499 www.measurement.gov.au_______________________________________________________________________________________
N a t i o n a l M e a s u r e m e n t I n s t i t u t e
REPORT OF ANALYSISPage: 9 of 9
Report No. RN716701Unless notified to the contrary, the above samples will be disposed of one month from the reporting date.
This report is issued in accordance with NATA’saccreditation requirements.Accreditated for compliance with ISO/IEC 17025.This report shall not be reproduced except in full.Results relate only to the sample(s) tested.
This Report supersedes reports: RN716599
PO Box 1246 Bentley DC WA 6983 Tel: +61 8 9368 8400 Fax: +61 8 9368 8499 www.measurement.gov.au_______________________________________________________________________________________
N a t i o n a l M e a s u r e m e n t I n s t i t u t e

Appendix 2
36
PO Box 1492
Macquarie Centre
NSW 2113
Australia
Telephone: 61 2 9490 8743
Fax: 61 2 9490 8740
www.isotopic.com.au
Deliveries/courier:
CSIRO Riverside Corporate Park,
11 Julius Avenue, North Ryde, NSW 2113,
Australia
Environmental Isotopes Pty. Ltd. eeeeIIII
Environmental Isotopes Analysis Report
Samples
Two 10mL vials of eight water samples were provided in Exutainer® tubes. Samples were refrigerated prior to analysis. One set of vials were sent to IsoAnalytical in the United Kingdom for O and H isotope analysis while the second set was retained at EI for carbon isotope analysis of dissolved inorganic carbon.
Table 1: Sample information provided
Bore unit Date Temp C SpC mS/cm
DO mg/L
pH ORP mV
Field Alkalinity mg/L CaCO3
PB1 2/12/2008 33.47 0.600 6.71 6.46 180 83
PB3 2/12/2008 33.58 0.359 6.54 6.19 193 52
WCB22 3/12/2008 32.90 1.020 0.77 6.39 -24 171
WCB17 3/12/2008 34.21 0.801 0.43 6.52 18 203
WCB9 3/12/2008 32.49 1.670 0.21 6.23 -5 46
WCB8 3/12/2008 32.81 1.700 0.68 6.27 -130 126
WCB4 4/12/2008 32.41 3.040 1.18 6.17 101 47
WCB10 4/12/2008 31.90 2.000 0.34 6.32 76 63
Methods
Deuterium analysis (from IsoAnalytical)
Deuterium analysis of the sample was performed in duplicate by the equilibration technique. In brief, a
sample aliquot was pipetted into Exutainer tubes and an insert vial containing 5 % platinum on alumina added. The tubes were sealed and then filled with pure hydrogen. Samples were left to allow complete
equilibration of the water with the hydrogen gas. Allowing the deuterium enrichment of the hydrogen gas to become proportional to the deuterium enrichment of the water. Reference standard waters were prepared in the same manner. Analysis was undertaken by continuous-flow isotope ratio mass
spectrometry using a Europa Scientific ANCA-GSL and GEO 20-20 IRMS.
The samples were measured against three reference standards. The first standard being IA-R054 with
δ2HVSMOW = +4.93 ‰, the second IA-R052 with δ
2HVSMOW = -157.12 ‰
and the third IA-R053 with
δ2HVSMOW = -61.97 ‰. All three standards are traceable to the primary reference standards V-SMOW
(Vienna-Standard Mean Ocean Water) and V-SLAP (Vienna-Standard Light Antarctic Precipitation) distributed by the IAEA.
The IA-R054 standard was used as the reference to which the samples and other standards were
measured. The IA-R052 standard was used for calibration of δ2H and the IA-R053 standard was used as
a check of this calibration. The results for check samples of IA-R053 are included in the results file.
PO Box 1492
Macquarie Centre
NSW 2113
Australia
Telephone: 61 2 9490 8743
Fax: 61 2 9490 8740
www.isotopic.com.au
Deliveries/courier:
CSIRO Riverside Corporate Park,
11 Julius Avenue, North Ryde, NSW 2113,
Australia
Environmental Isotopes Pty. Ltd. eeeeIIII Oxygen-18 analysis (from IsoAnalytical)
After deuterium analysis, the vials were flushed with pure CO2 and left to equilibrate to allow complete equilibration of the water with the CO2 gas. Reference waters, including quality control check samples, were prepared in the same manner. The samples and references were then analyzed by continuous flow using a Europa Scientific ANCA-GSL and GEO 20-20 IRMS.
The samples were measured against three reference standards. The first standard being IA-R054 with
δ18
OVSMOW = +0.56 ‰, the second IA-R052 with δ18
OVSMOW = -19.64 ‰ and the third IA-R053 with
δ18OVSMOW = -10.18 ‰. All three standards are traceable to the primary reference standards VSMOW
(Vienna-Standard Mean Ocean Water) and VSLAP (Vienna-Standard Light Antarctic Precipitation) distributed by the IAEA.
The IA-R054 standard was used as the reference to which the samples and other standards were
measured. The IA-R052 standard was used for calibration of δ18O and the IA-R053 standard was used as a check of this calibration. The results for check samples of IA-R053 are included in the results file.
Carbon isotope analysis
Approximately 5mL of water was taken from each of the second set of Exutainer tubes using a syringe and injected into a new evacuated 10mL vacuutainer. To each sample approximately 1mL of phosphoric
acid was then added using a syringe and shaken to mix. Samples were left for at least 10 minutes prior to analysis.
The CO2 produced from each sample was extracted using a gas tight syringe and analyzed by injection
into a He stream and separated from other gases by GC attached to a Finnigan 252 mass spectrometer using a Conflo III.
The mass spectrometer is calibrated against NBS19 (δ13
C= +1.95 VPDB; Coplen et al., 1995) and the
CSIRO carbonate standard (δ13C= -13.46 VPDB). Replicate analysis of the standard calcites is generally
better than ± 0.1 for C. The international standard, NBS18 (δ13C= -5.01 VPDB) was run a check on the calibration.
Data Presentation
Hydrogen, oxygen and carbon isotope data are expressed using the δ notation where:
δ2H = 2H/1H sample -
2H/1H reference * 1000
2H/
1H reference
δ18O = 18O/16Osample -
18O/16Oreference * 1000
18O/
16Oreference
δ13C = 13C/12Csample -
13C/12Creference * 1000
13C/
12Creference
Oxygen and hydrogen isotope values are reported in permil (‰) relative to the international standard VSMOW which is defined by the International Atomic Energy Agency standards, VSMOW and SLAP
where δ2HSLAP/VSMOW=-428‰ and δ18OSLAP/VSMOW=-55.5‰ (Coplen et al., 1988).
PO Box 1492
Macquarie Centre
NSW 2113
Australia
Telephone: 61 2 9490 8743
Fax: 61 2 9490 8740
www.isotopic.com.au
Deliveries/courier:
CSIRO Riverside Corporate Park,
11 Julius Avenue, North Ryde, NSW 2113,
Australia
Environmental Isotopes Pty. Ltd. eeeeIIII
Carbon isotope values are reported in permil (‰) relative to the international standard VPDB which is
defined by the International Atomic Energy Agency standard, IAEA-NBS19 (δ13C=+1.95‰ and δ18O= -2.20 VPDB; Coplen et al., 1995, 2006).
Results
Table 2: Oxygen and hydrogen isotope results from IsoAnalytical
Sample 2H δδδδ
2HVSMOW (‰)
18O δδδδ
18OVSMOW (‰)
No. (ppm)
Result Mean Std. Dev. (ppm) Result Mean Std. Dev.
PB1 146.36 -60.2 1984.36 -8.42
146.13 -61.7 -61.0 1.0 1984.65 -8.28 -8.35 0.10
PB3 146.22 -61.1 1984.76 -8.23
146.20 -61.3 -61.2 0.1 1984.86 -8.18 -8.20 0.03
WCB-4 146.67 -58.2 1985.80 -7.70
146.33 -60.4 -59.3 1.5 1985.79 -7.71 -7.71 0.00
WCB-8 146.76 -57.7 1986.97 -7.12
147.28 -54.3 -56.0 2.4 1986.92 -7.14 -7.13 0.02
WCB-9 146.63 -58.5 1985.30 -7.96
146.68 -58.2 -58.3 0.2 1985.33 -7.94 -7.95 0.01
WCB-10 147.00 -56.1 1986.04 -7.59
147.27 -54.4 -55.2 1.2 1986.03 -7.59 -7.59 0.00
WCB-17c 147.10 -55.5 1985.86 -7.67
146.89 -56.8 -56.1 1.0 1985.97 -7.62 -7.65 0.04
WCB-22 146.97 -56.3 1986.20 -7.50
147.43 -53.3 -54.8 2.1 1985.87 -7.67 -7.58 0.12
Quality Control Reference Standards-Water Analysis
Reference Standard
δδδδ2HVSMOW (‰) δδδδ
18OVSMOW (‰)
IA-R053 -62.31 -10.09
" -60.49 -10.16
" -59.53 -10.16
" -60.84 -10.16
mean= -60.79 -10.14
1sd= 1.16 0.03
accepted= -61.97 -10.18
n= 4 4
PO Box 1492
Macquarie Centre
NSW 2113
Australia
Telephone: 61 2 9490 8743
Fax: 61 2 9490 8740
www.isotopic.com.au
Deliveries/courier:
CSIRO Riverside Corporate Park,
11 Julius Avenue, North Ryde, NSW 2113,
Australia
Environmental Isotopes Pty. Ltd. eeeeIIII Table 3: Carbon isotope results on DIC
Anal. No. Sample No. δ13
C ‰ VPDB
K11238 WCB22 -10.76
K11237 WCB17 -10.56
K11239 WCB8 -12.35
K11240 PB1 -13.07
K11242 PB3 -15.53
K11241 WCB9 -17.76
K11243 WCB10 -14.55
K11244 WCB4 -15.44
Quality Control Reference Standards-Carbon Analysis
Reference Standard
δδδδ13
CVPDB (‰)
NBS18 -4.90
-4.96
mean= -4.93
1sd= 0.04
accepted= -5.01
n= 2
References
Coplen, T. B., 1988. Normalization of oxygen and hydrogen isotope data. Chemical Geology (Isotope Geoscience Section) 12, 293-297.
Coplen, T. B., 1995. Reporting of stable hydrogen, carbon, and oxygen isotopic abundances - (Technical Report)
Geothermics 24, 708-712.
Coplen, T. B., Brand, W. A., Gehre, M., Gröning, M., Meijer, H.A.J., Toman, B., and Verkouteren, R. M., 2006. New Guidelines for δ13C Measurements. Anal. Chem. 78, 2439-2441.
Dr Anita S Andrew Director Environmental Isotopes P/L

Appendix 3
41
Issued by Andrew Jenkinson, Email: [email protected]; Telephone: +61-2-97173478 ANSTO – Institute for Environmental Research, PMB 1, Menai NSW 2234 (AUSTRALIA)
http://www.ansto.gov.au/research/institute_of_environmental_research/facilities/accelerator_mass_spectrometry_ams.html
REPORT ON AMS ANALYSIS
(Commercial; Run 322)
6 February 2009 Mr Hazli Koomberi Western Australian Department of Water The Atrium 168 St Georges Terrace Perth WA 6000 Email: [email protected]
R A D I O C A R B O N R E S U L T S
δδδδ(13C) percent Modern
Carbon Conventional
Radiocarbon age ANSTO code Sample Type Submitter ID
per mil pMC 1σσσσ error yrs BP 1σσσσ error
1 OZL341 Groundwater PB1 -8.0 +/- 0.1 74.64 +/- 0.31 2,350 +/- 35 2 OZL342 Groundwater PB3 -9.5 +/- 0.1 79.15 +/- 0.33 1,880 +/- 35 3 OZL343 Groundwater WCB4 -8.8 +/- 0.1 0.32 +/- 0.04 46,150 +/- 1,000
4 OZL344 Groundwater WCB8 -6.6 +/- 0.1 3.70 +/- 0.08 26,480 +/- 180 5 OZL345 Groundwater WCB9 -10.2 +/- 0.1 0.46 +/- 0.05 43,200 +/- 860
6 OZL346 Groundwater WCB10 -8.2 +/- 0.3 0.52 +/- 0.03 42,180 +/- 460 7 OZL347 Groundwater WCB17 -7.1 +/- 0.1 21.67 +/- 0.16 12,290 +/- 60 8 OZL348 Groundwater WCB22 -6.0 +/- 0.1 16.18 +/- 0.15 14,630 +/- 80
Note: 1. The δ(13C) values quoted above relate solely to the graphite derived from the fraction that was used for
the radiocarbon measurement. It is sometimes the case that the δ(13C) of this fraction is not the same as that of the bulk material.
2. The ages quoted are radiocarbon ages, not calendar ages. 3. The ages have been rounded according to M. Stuiver and A. Polach (1977). The definition of percent
Modern Carbon and Conventional Radiocarbon age can also be found in this publication. 4. Please use the ANSTO Code number in publications. The AMS facility should be referenced as Fink et
al. (2004). References: D. Fink, M. Hotchkis, Q. Hua, G. Jacobsen, A. M. Smith, U. Zoppi, D. Child, C. Mifsud, H. van der Gaast, A. Williams and M. Williams (2004) The ANTARES AMS facility at ANSTO, NIM B 223-224, 109-115. M. Stuiver and A. Polach (1977) Reporting of 14C data, Radiocarbon 19(3), 355-363. Available on-line at: https://digitalcommons.library.arizona.edu/objectviewer?o=http%3A%2F%2Fradiocarbon.library.arizona.edu%2FVolume19%2FNumber3%2Fazu_radiocarbon_v19_n3_355_363_v.pdf
Issued by Andrew Jenkinson, Email: [email protected]; Telephone: +61-2-97173478 ANSTO – Institute for Environmental Research, PMB 1, Menai NSW 2234 (AUSTRALIA)
http://www.ansto.gov.au/research/institute_of_environmental_research/facilities/accelerator_mass_spectrometry_ams.html
Calibrated Ages:
The calibrated ages below have been calculated using the 14C Calibration program CALIB 5.0.2 (http://calib.qub.ac.uk/calib/calib.html) that was developed by Stuiver and Reimer. These dates use the ‘unrounded’ conventional radiocarbon ages that forms the basis of the results table above. Two calibration datasets have been used in the calibration program namely ShCal04 (0 to 11,000 yrs Cal BP) and IntCal04 (0 to 26,000 yrs cal BP). The latter, which is normally associated with the Northern Hemisphere, has been used to partially cover the range beyond the limit of the Southern Hemisphere dataset (ShCal04). Other calibration datasets are also available and it is up to the end user to verify the suitability of the calibration dataset used and to be aware of the need for the appropriate rounding of age data (refer end comments).
Notes on interpreting calibrated age data (for novice users) Data is presented in either calibrated conventional radiocarbon years (cal BP) or calibrated calendar years (cal BC/AD). Results are given for both one standard deviation (1 sigma) and two standard deviation (2 sigma) uncertainty ranges. The choice of uncertainty range will depend on the particular application and the level of ‘fine’ age detail that is to be retained. The relative area under the probability distribution curve provides an indication of the confidence in which the true age of a particular sample is contained within the quoted age range. A result such as: % area enclosed cal BP age ranges relative area under probability distribution 68.3 (1 sigma) cal BP 11320 - 11828 0.947 11878 - 11959 0.053 may be interpreted as follows. At the one standard deviation (68.3%) confidence interval there is a 94.7% probability that the true age is in the age range 11320 to 11828 cal years BP and only a 5.3% probability that it is in the age range 11878 to 11959 cal years BP.
Issued by Andrew Jenkinson, Email: [email protected]; Telephone: +61-2-97173478 ANSTO – Institute for Environmental Research, PMB 1, Menai NSW 2234 (AUSTRALIA)
http://www.ansto.gov.au/research/institute_of_environmental_research/facilities/accelerator_mass_spectrometry_ams.html
Calibrated Ages (cal BC/AD Age format)
RADIOCARBON CALIBRATION PROGRAM* CALIB REV5.0.2 Copyright 1986-2005 M Stuiver and PJ Reimer *To be used in conjunction with: Stuiver, M., and Reimer, P.J., 1993, Radiocarbon, 35, 215-230. Annotated results (text) - - Export file - c14res.csv
OZL341 ANSTO PB1 Radiocarbon Age BP 2350 +/- 34 Calibration data set: shcal04.14c # McCormac et al. 2004 % area enclosed cal AD age ranges relative area under probability distribution 68.3 (1 sigma) cal BC 402- 358 0.756 278- 258 0.196 243- 237 0.047 95.4 (2 sigma) cal BC 408- 349 0.583 313- 209 0.417
OZL342 ANSTO PB3 Radiocarbon Age BP 1878 +/- 34 Calibration data set: shcal04.14c # McCormac et al. 2004 % area enclosed cal AD age ranges relative area under probability distribution 68.3 (1 sigma) cal AD 137- 234 1.000 95.4 (2 sigma) cal AD 83- 259 0.951 295- 322 0.049
OZL343 ANSTO WCB4 Radiocarbon Age BP 46155 +/- 990 Calibration data set: intcal04.14c # Reimer et al. 2004 *Invalid age* for this calibration curve
OZL344 ANSTO WCB8 Radiocarbon Age BP 26485 +/- 170 Calibration data set: intcal04.14c # Reimer et al. 2004 *Invalid age* for this calibration curve
OZL345 ANSTO WCB9 Radiocarbon Age BP 43198 +/- 857 Calibration data set: intcal04.14c # Reimer et al. 2004 *Invalid age* for this calibration curve
Issued by Andrew Jenkinson, Email: [email protected]; Telephone: +61-2-97173478 ANSTO – Institute for Environmental Research, PMB 1, Menai NSW 2234 (AUSTRALIA)
http://www.ansto.gov.au/research/institute_of_environmental_research/facilities/accelerator_mass_spectrometry_ams.html
OZL346 ANSTO WCB10 Radiocarbon Age BP 42179 +/- 454 Calibration data set: intcal04.14c # Reimer et al. 2004 *Invalid age* for this calibration curve
OZL347 ANSTO WCB17 Radiocarbon Age BP 12286 +/- 58 Calibration data set: intcal04.14c # Reimer et al. 2004 % area enclosed cal AD age ranges relative area under probability distribution 68.3 (1 sigma) cal BC 12297- 12090 1.000 95.4 (2 sigma) cal BC 12619- 12037 1.000
OZL348 ANSTO WCB22 Radiocarbon Age BP 14633 +/- 73 Calibration data set: intcal04.14c # Reimer et al. 2004 % area enclosed cal AD age ranges relative area under probability distribution 68.3 (1 sigma) cal BC 15994- 15598 1.000 95.4 (2 sigma) cal BC 16057- 15255 1.000
References for calibration datasets: PJ Reimer, MGL Baillie, E Bard, A Bayliss, JW Beck, C Bertrand, PG Blackwell, CE Buck, G Burr, KB Cutler, PE Damon, RL Edwards, RG Fairbanks, M Friedrich, TP Guilderson, KA Hughen, B Kromer, FG McCormac, S Manning, C Bronk Ramsey, RW Reimer, S Remmele, JR Southon, M Stuiver, S Talamo, FW Taylor, J van der Plicht, and CE Weyhenmeyer (2004), Radiocarbon 46:1029-1058. FG McCormac, AG Hogg, PG Blackwell, CE Buck, TFG Higham, and PJ Reimer (2004) SHCal04 Southern Hemisphere Calibration 0 - 11.0 cal kyr BP Radiocarbon 46, 1087-1092 _ _
Comments: * This standard deviation (error) includes a lab error multiplier. ** 1 sigma = square root of (sample std. dev.^2 + curve std. dev.^2) ** 2 sigma = 2 x square root of (sample std. dev.^2 + curve std. dev.^2) where ^2 = quantity squared. [ ] = calibrated range impinges on end of calibration data set 0* represents a "negative" age BP 1955* or 1960* denote influence of nuclear testing C-14
NOTE: Cal ages and ranges are rounded to the nearest year which may be too precise in many instances. Users are advised to round results to the nearest 10 yr for samples with standard
deviation in the radiocarbon age greater than 50 yr.
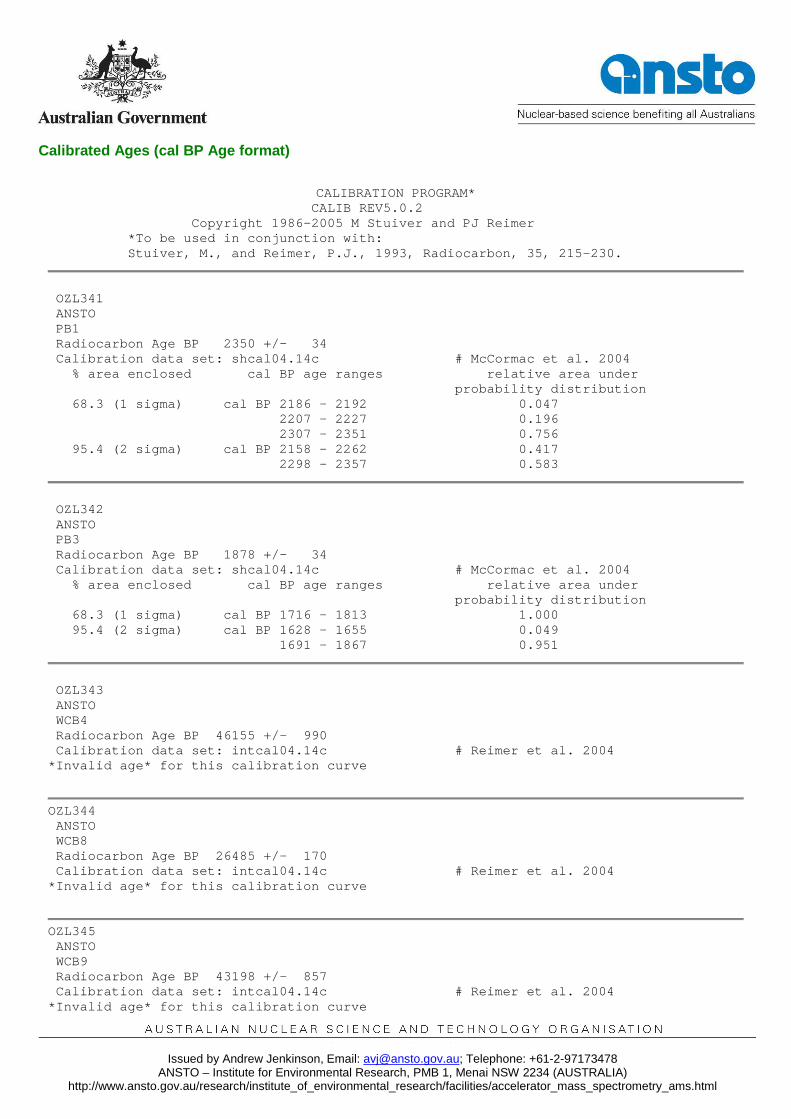
Issued by Andrew Jenkinson, Email: [email protected]; Telephone: +61-2-97173478 ANSTO – Institute for Environmental Research, PMB 1, Menai NSW 2234 (AUSTRALIA)
http://www.ansto.gov.au/research/institute_of_environmental_research/facilities/accelerator_mass_spectrometry_ams.html
Calibrated Ages (cal BP Age format)
CALIBRATION PROGRAM*
CALIB REV5.0.2 Copyright 1986-2005 M Stuiver and PJ Reimer *To be used in conjunction with: Stuiver, M., and Reimer, P.J., 1993, Radiocarbon, 35, 215-230.
OZL341 ANSTO PB1 Radiocarbon Age BP 2350 +/- 34 Calibration data set: shcal04.14c # McCormac et al. 2004 % area enclosed cal BP age ranges relative area under probability distribution 68.3 (1 sigma) cal BP 2186 - 2192 0.047 2207 - 2227 0.196 2307 - 2351 0.756 95.4 (2 sigma) cal BP 2158 - 2262 0.417 2298 - 2357 0.583
OZL342 ANSTO PB3 Radiocarbon Age BP 1878 +/- 34 Calibration data set: shcal04.14c # McCormac et al. 2004 % area enclosed cal BP age ranges relative area under probability distribution 68.3 (1 sigma) cal BP 1716 - 1813 1.000 95.4 (2 sigma) cal BP 1628 - 1655 0.049 1691 - 1867 0.951
OZL343 ANSTO WCB4 Radiocarbon Age BP 46155 +/- 990 Calibration data set: intcal04.14c # Reimer et al. 2004 *Invalid age* for this calibration curve
OZL344 ANSTO WCB8 Radiocarbon Age BP 26485 +/- 170 Calibration data set: intcal04.14c # Reimer et al. 2004 *Invalid age* for this calibration curve
OZL345 ANSTO WCB9 Radiocarbon Age BP 43198 +/- 857 Calibration data set: intcal04.14c # Reimer et al. 2004 *Invalid age* for this calibration curve
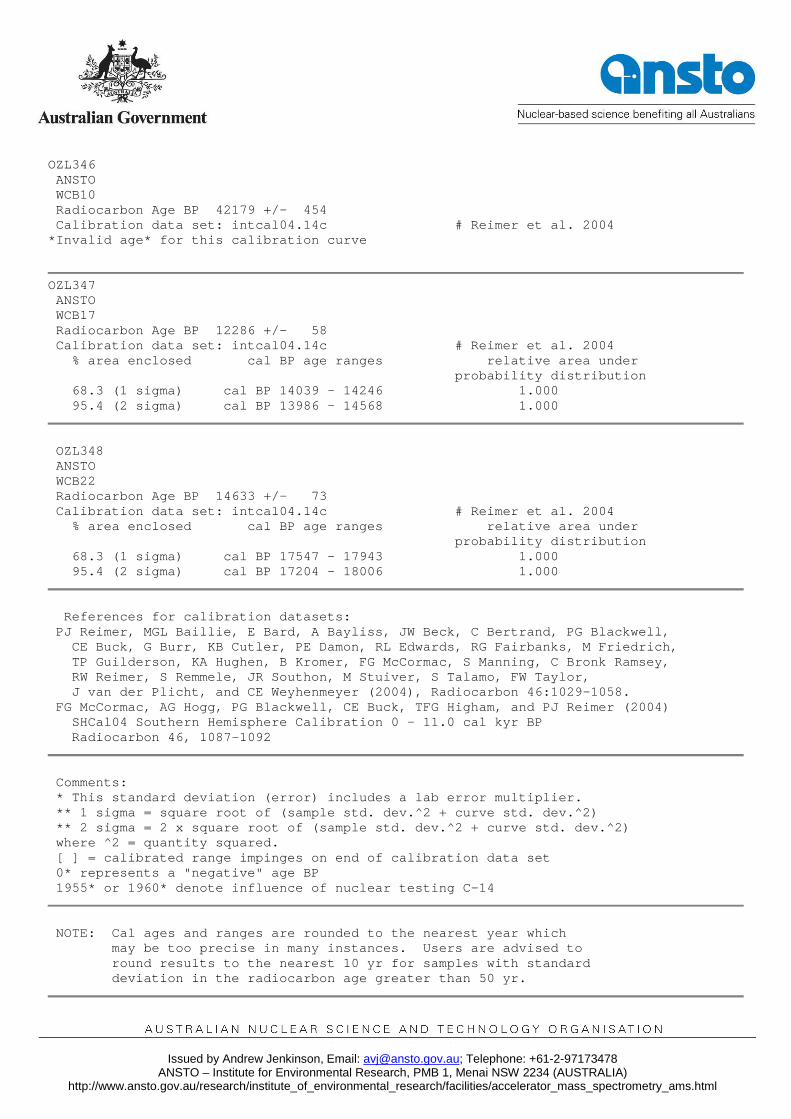
Issued by Andrew Jenkinson, Email: [email protected]; Telephone: +61-2-97173478 ANSTO – Institute for Environmental Research, PMB 1, Menai NSW 2234 (AUSTRALIA)
http://www.ansto.gov.au/research/institute_of_environmental_research/facilities/accelerator_mass_spectrometry_ams.html
OZL346 ANSTO WCB10 Radiocarbon Age BP 42179 +/- 454 Calibration data set: intcal04.14c # Reimer et al. 2004 *Invalid age* for this calibration curve
OZL347 ANSTO WCB17 Radiocarbon Age BP 12286 +/- 58 Calibration data set: intcal04.14c # Reimer et al. 2004 % area enclosed cal BP age ranges relative area under probability distribution 68.3 (1 sigma) cal BP 14039 - 14246 1.000 95.4 (2 sigma) cal BP 13986 - 14568 1.000
OZL348 ANSTO WCB22 Radiocarbon Age BP 14633 +/- 73 Calibration data set: intcal04.14c # Reimer et al. 2004 % area enclosed cal BP age ranges relative area under probability distribution 68.3 (1 sigma) cal BP 17547 - 17943 1.000 95.4 (2 sigma) cal BP 17204 - 18006 1.000
References for calibration datasets: PJ Reimer, MGL Baillie, E Bard, A Bayliss, JW Beck, C Bertrand, PG Blackwell, CE Buck, G Burr, KB Cutler, PE Damon, RL Edwards, RG Fairbanks, M Friedrich, TP Guilderson, KA Hughen, B Kromer, FG McCormac, S Manning, C Bronk Ramsey, RW Reimer, S Remmele, JR Southon, M Stuiver, S Talamo, FW Taylor, J van der Plicht, and CE Weyhenmeyer (2004), Radiocarbon 46:1029-1058. FG McCormac, AG Hogg, PG Blackwell, CE Buck, TFG Higham, and PJ Reimer (2004) SHCal04 Southern Hemisphere Calibration 0 - 11.0 cal kyr BP Radiocarbon 46, 1087-1092
Comments: * This standard deviation (error) includes a lab error multiplier. ** 1 sigma = square root of (sample std. dev.^2 + curve std. dev.^2) ** 2 sigma = 2 x square root of (sample std. dev.^2 + curve std. dev.^2) where ^2 = quantity squared. [ ] = calibrated range impinges on end of calibration data set 0* represents a "negative" age BP 1955* or 1960* denote influence of nuclear testing C-14
NOTE: Cal ages and ranges are rounded to the nearest year which may be too precise in many instances. Users are advised to round results to the nearest 10 yr for samples with standard deviation in the radiocarbon age greater than 50 yr.