Embed Size (px)
Citation preview

General rights Copyright and moral rights for the publications made accessible in the public portal are retained by the authors and/or other copyright owners and it is a condition of accessing publications that users recognise and abide by the legal requirements associated with these rights.
• Users may download and print one copy of any publication from the public portal for the purpose of private study or research. • You may not further distribute the material or use it for any profit-making activity or commercial gain • You may freely distribute the URL identifying the publication in the public portal
If you believe that this document breaches copyright please contact us providing details, and we will remove access to the work immediately and investigate your claim.
Downloaded from orbit.dtu.dk on: Jun 11, 2018
Radioactivity in the Risø District July-December 2013
Nielsen, Sven Poul; Andersson, Kasper Grann; Miller, Arne
Publication date:2014
Document VersionPublisher's PDF, also known as Version of record
Link back to DTU Orbit
Citation (APA):Nielsen, S. P., Andersson, K. G., & Miller, A. (2014). Radioactivity in the Risø District July-December 2013. DTUNutech. (DTU-Nutech-R; No. 0008(EN)).

Ris
ø-R
-Re
po
rt
Radioactivity in the Risø District July-December 2013
Sven P. Nielsen, Kasper G. Andersson and Arne Miller
DTU-Nutech-R-0008(EN)
June 2014
DT
U N
ute
ch
Rep
ort

Author: Sven P. Nielsen, Kasper G. Andersson and Arne Miller Title: Radioactivity in the Risø District July-December 2013 Division: Radiation Research
DTU-Nutech-R-0008(EN)
June 2014
Abstract (max. 2000 char.): The environmental surveillance of the
Risø environment was continued in July - December 2013.
The mean concentrations in air were: 0.200.08 Bq m–3
of 137
Cs, 2.230.64 mBq m–3
of 7Be and 0.160.08 mBq m
–3 of
210Pb (1 S.D.; N = 26). The depositions by precipitation at
Risø in the second half of 2012 were: 0.048 Bq m–2
of 137
Cs,
436 Bq m–2
of 7Be, 31.3 Bq m
–2 of
210Pb and < 0.7 kBq m
–2 of
3H. The average background dose rate (TLD) at Risø (Zone
I) was 44 nSv h–1
compared with 43 9 nSv h–1
(1 S.D.; N =
4) in the four zones around Risø.
ISBN: 978-87-995321-7-9
Contract no.:
Group's own reg. no.: 59514 E-1
Sponsorship:
Cover :
Pages: 24 Tables: 14
References:
Center for Nuclear Technologies
Technical University of Denmark
P.O.Box 49 DK-4000 Roskilde
Denmark
Telephone +45 46775300 www.dtu.dk

DTU-Nutech-R-0008(EN)
3
Contents
Table 1. Radionuclides in air 5
Table 2.1. Radionuclides in precipitation 6
Table 2.2. Radionuclides in precipitation 6
Table 2.3. Tritium in precipitation 7
Table 2.4. Tritium in precipitation 7
Table 3.1. Radionuclides in sediment samples 8
Table 4.1. Radionuclides in seawater 8
Table 4.2. Tritium in seawater 8
Table 5.1. Radionuclides in grass 9
Table 5.2. Radionuclides in sea plants 10
Table 7.1. Waste water 11
Table 8.1. Background dose rates around the border of Risø (TLD) 12
Table 8.2. Background dose rates around Risø (TLD) 13
Table 8.3. Terrestrial dose rates at the Risø zones (NaI(Tl) detector) 14
Fig. 1. Map of Risø 15
Fig. 1.1. Caesium-137 in air 16
Fig. 1.2. Beryllium-7 and lead-210 in air 16
Fig. 2.3.1 Tritium in precipitation (1 m2 rain collector) 17
Fig. 2.3.2 Tritium in precipitation (10 m2 rain collector) 17
Fig. 3.1 Caesium-137 in sediment samples 18
Fig. 4.1 Caesium-137 in seawater 19
Fig. 4.2 Tritium in seawater 19
Fig. 7.1 Total-beta radioactivity in waste water 20
Fig. 8.1. Map of Risø with locations for TLD measurements 21
Fig. 8.2. The environment of Risø 22

4 DTU-Nutech-R-0008(EN)

DTU-Nutech-R-0008(EN)
5
Table 1. Radionuclides in ground level air collected at Risø (cf. Figs. 1, 1.1
and 1.2), July - December 2013. (Unit: Bq m–3
)
Date 7Be
137Cs
210Pb
01-Jul-13 – 08-Jul-13 1852 0.144 100
08-Jul-13 – 15-Jul-13 No data No data No data
15-Jul-13 – 22-Jul-13 2663 0.380 167
22-Jul-13 – 29-Jul-13 3860 0.273 332
29-Jul-13 – 05-Aug-13 2418 0.098 142
05-Aug-13 – 12-Aug-13 2713 0.099 137
12-Aug-13 – 20-Aug-13 2468 0.074 124
20-Aug-13 – 26-Aug-13 3073 0.263 194
26-Aug-13 – 02-Aug-13 2402 0.211 173
02-Sep-13 – 09-Sep-13 1546 0.117 119
09-Sep-13 – 16-Sep-13 2056 0.146 168
16-Sep-13 – 23-Sep-13 1617 0.124 96
23-Sep-13 – 30-Sep-13 1357 0.202 150
30-Sep-13 – 07-Oct-13 2203 0.278 236
07-Oct-13 – 14-Oct-13 1866 0.197 239
14-Oct-13 – 21-Oct-13 2357 0.238 361
21-Oct-13 – 28-Oct-13 1831 0.084 56
28-Oct-13 – 04-Nov-13 2009 0.143 161
04-Nov-13 – 11-Nov-13 1987 0.153 17
11-Nov-13 – 18-Nov-13 2281 0.293 114
18-Nov-13 – 25-Nov-13 1564 0.280 169
25-Nov-13 – 02-Dec-13 1404 0.221 51
02-Dec-13 – 09-Dec-13 1719 0.220 77
09-Dec-13 – 16-Dec-13 2580 0.310 302
16-Dec-13 – 23-Dec-13 3797 0.276 249
23-Dec-13 – 30-Dec-13 2149 0.266 138
Mean 2231 0.204 163
SD 635 0.080 84

6 DTU-Nutech-R-0008(EN)
Table 2.1. Radionuclides in precipitation in the 10 m2 rain collector at Risø (cf. Fig. 1),
July - December 2013. (Unit: Bq m–3
)
Month 7Be
137Cs
210Pb
July 5572 0.671 447
August 2422 0.359 202
September 1666 0.147 142
October 1281 0.140 76
November 1375 0.090 121
December 1906 0.103 106
Table 2.2. Radionuclides in precipitation in the 10 m2 rain collector at Risø (cf. Fig. 1),
July - December 2013. (Unit: Bq m–2
)
Month Precipitation
(m)
7Be
137Cs
210Pb
July 0.011 60 0.0072 5.1
August 0.018 44 0.0065 3.6
September 0.048 80 0.0071 6.8
October 0.081 104 0.0139 6.2
November 0.031 43 0.0073 3.8
December 0.055 105 0.0057 5.8
Sum 0.244 436 0.0477 31.3

DTU-Nutech-R-0008(EN)
7
Table 2.3. Tritium in precipitation collected at Risø (cf. Figs. 1, 2.3.1
and 2.3.2). July - December 2013. (Unit: kBq m–3
)
Month 10 m2 rain collector*
July 3.9
August 2.2
September < 2.5
October < 2.5
November < 2.5
December < 2.5
Double determinations*.
Table 2.4. Tritium in precipitation collected at Risø (cf. Fig. 1). July - December 2013.
(Unit: kBq m–2
)
Month Precipitation (m) 10 m2 rain collector
July 0.011 0.043
August 0.018 0.040
September 0.048 < 0.120
October 0.081 < 0.203
November 0.031 < 0.078
December 0.055 < 0.138
Sum 0.244 < 0.622

8 DTU-Nutech-R-0008(EN)
Table 3.1. Radionuclides in sediment samples collected at Bolund in
Roskilde Fjord. (cf. Fig. 3.1) July - December 2013. (Unit: Bq kg–1
dry)
Date 137
Cs K*
27 July 1.0 18.5
*Unit: g kg-1
dry
Table 4.1. Radionuclides in seawater collected in Roskilde Fjord
(cf. Fig. 4.1) July - December 2013. (Unit: Bq m–3
)
Date 137
Cs
27 July 11.7
Table 4.2. Tritium in seawater collected in Roskilde Fjord (Risø pier)
(cf. Fig. 4.2) July - December 2013.
Month kBq m–3
September < 2.5 *
December < 2.5 *
* Double determinations
.

DTU-Nutech-R-0008(EN)
9
Table 5.1. Radionuclides in grass (* snow) collected at Risø (near the Waste
Treatment Station (cf. Fig. 1)), July - December 2013. (**Measured on bulked ash
samples)
Week no. Date
K 137
Cs 137
Cs
or month (g kg1
fresh) (Bq kg–1
fresh) (Bq m–2
)
27 1 July 5.7 < 0.5
29 15 July 7.2 < 0.7
31 29 July 10.6 < 1.0
33 12 August 8.6 < 0.9
35 26 August 8.5 < 0.7
37 09 September 5.5 < 0.4
39 23 September 4.1 < 0.9
41 7 October 4.6 < 1.0
43 21 October 3.6 < 0.6
45 4 November 2.8 < 0.5
47 18 November 2.8 < 0.5
49 2 December 3.5 < 0.8
51 16 December 1.5 < 0.7
53 30 December 3.3 < 0.8
**July 6.6 0.102 0.034
**August 8.9 0.486 0.088
**September 5.8 0.280 0.092
**October 4.1 0.080 0.014
**November 2.9 0.049 0.019
**December 2.7 0.286 0.053

10 DTU-Nutech-R-0008(EN)
Table 5.2. Radionuclides in Fucus vesiculosus collected at Bolund
in Roskilde Fjord. July - December 2013. (Unit: Bq kg–1
dry)
Date 137
Cs K* % dry matter
24 July 2.5 25 21
*Unit: g kg-1
dry

DTU-Nutech-R-0008(EN)
11
Table 7.1. Waste water collected at Risø (cf. Fig. 1), July - December 2013.
Week
number
eqv. mg
KCl l-1
137Cs
(Bq m–3
)
131I
(Bq m–3
)
226Ra
(Bq m–3
)
27 140 < 106 < 110 < 206
28 141 < 108 < 116 < 207
29 146 < 99 < 105 < 200
30 140 < 97 < 108 < 204
31 138 < 109 < 114 < 206
32 145 < 112 < 114 < 234
33 182 < 66 < 68 < 142
34 156 < 106 < 120 < 207
35 174 < 111 < 117 < 222
36 167 < 110 < 113 < 210
37 124 < 137 < 145 < 297
38 136 < 67 < 66 < 155
39 130 < 103 < 112 < 200
40 134 < 99 < 107 < 203
41 146 < 105 < 112 < 221
42 151 < 101 < 130 < 204
43 162 < 113 < 123 < 219
44 172 < 63 < 73 < 124
45 165 < 107 < 114 < 214
46 107 < 106 < 111 < 205
47 121 < 111 < 119 < 223
48 102 < 101 < 103 < 204
49 114 < 104 < 108 < 206
50 109 < 114 < 120 < 221
51 85 < 91 < 49 < 134
52 89 < 128 < 316 < 272
53 77 < 108 < 201 < 218
Mean 135.3
SD 27.9

12 DTU-Nutech-R-0008(EN)
Table 8.1. Background dose rates around the border of Risø (cf. Fig. 8.1)
measured with thermoluminescence dosimeters (TLD) in the period
May - October 2013. (Results are normalized to nSv h–1
)
Location nSv h–1
1 40
2 39
3 32
4 44
5 40
6 44
Mean 40

DTU-Nutech-R-0008(EN)
13
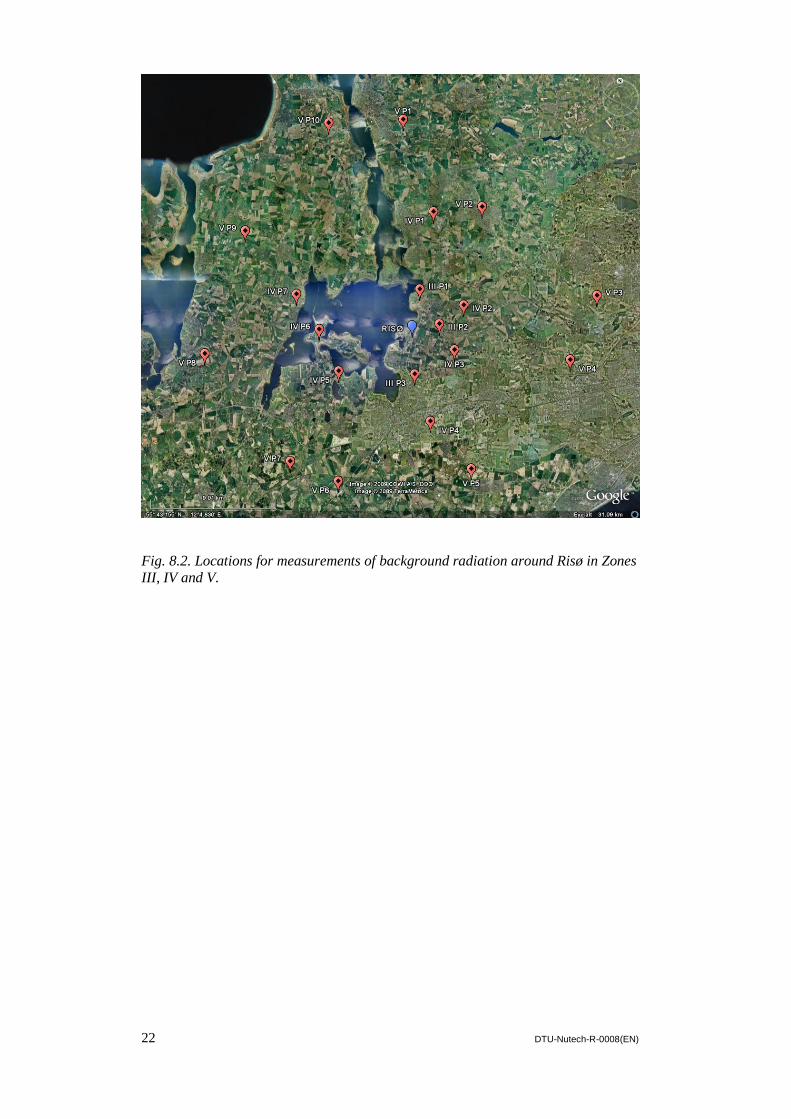
Table 8.2. Background dose rates around Risø (cf. Fig. 8.2 and Fig. 1)
measured with thermoluminescence dosimeters (TLD) in the period
May – October 2013. (Results are normalized to nSv h–1
)
Risø zone Location nSv h–1
I 1 30
I 2 41
I 3 64
I 4 29
I 5 56
Mean 44
II P1 34
II P2 54
II P3 47
II P4 48
Mean 46
III P1 42
III P2 44
III P3 44
Mean 43
IV P1 29
IV P2 27
IV P3 36
IV P4 34
IV P5 29
IV P6 33
IV P7 -
Mean 31
V P1 38
V P2 44
V P3 139*
V P4 28
V P5 52
V P6 47
V P7 47
V P8 45
V P9 39
V P10 43
Mean 52

14 DTU-Nutech-R-0008(EN)
Note to Table 8.2. The standard deviation for the 4 pills in the dosimeter that measured 139 nSv/h at Ledhøje is ca. 10
%. It must therefore be concluded that the measurement is correct, but it is unknown what caused this deviating
measurement result.
Table 8.3. Terrestrial dose rates at the Risø zones (cf. Fig. 8.2 and Fig. 1) July -
December 2013. Measured with a NaI(Tl) detector. (Unit: nSv h–1
)
Risø zone Location October
I P1 41
I P2 55
I P3 328
I P4 50
I P5 83
Mean 112
II P1 47
II P2 49
II P3 44
II P4 46
Mean 46
III P1 50
III P2 53
III P3 49
Mean 51
IV P1 47
IV P2 52
IV P3 48
IV P4 48
IV P5 36
IV P6 47
IV P7 47
Mean 46
V P1 43
V P2 55
V P3 56
V P4 49
V P5 53
V P6 56
V P7 50
V P7a 47
V P8 52
V P9 54
V P10 42
Mean 51

DTU-Nutech-R-0008(EN)
15
Fig. 1. Locations for measurements of gamma-background radiation Zone I and II
(cf. Tables 8.2 and 8.3)

16 DTU-Nutech-R-0008(EN)
0.01
0.10
1.00
26 31 36 41 46 51
13
7C
s µ
Bq m
-3
Week
Fig. 1.1. Caesium-137 in ground level air collected at Risø in July-December 2013.
(Unit: µBq m–3
)
Fig. 1.2. Beryllium-7 and lead-210 in ground level air collected at Risø in July-
December 2013. (Unit: µBq m–3
)

DTU-Nutech-R-0008(EN)
17
0
20
40
60
1980 1985 1990 1995 2000 2005 2010
kB
q 3
H m
-3
Year
DL
Fig. 2.3.1. Tritium in precipitation collected at Risø ( 1 m2 rain collector )
1980 - 2012. (Unit: kBq m–3
; DL = detection limit ). This rain collector was
taken out of operation in 2013.
Fig. 2.3.2. Tritium in precipitation collected at Risø ( 10 m
2 rain collector )
1980 - 2013. (Unit: kBq m–3
; DL = detection limit )

18 DTU-Nutech-R-0008(EN)
Fig. 3.1. Caesium–137 in sediment samples collected at Bolund in Roskilde Fjord.
1980 – 2013. (Unit: Bq kg–1
dry matter)

DTU-Nutech-R-0008(EN)
19
Fig. 4.1. Caesium–137 in seawater collected in Roskilde Fjord 1980 - 2013.
(Unit: Bq m–3
)
Fig. 4.2. Tritium in seawater collected in Roskilde Fjord 1980 - 2013.
(Unit: kBq m–3
; DL = detection limit )

20 DTU-Nutech-R-0008(EN)
Fig. 7.1. Total-beta radioactivity in waste water collected at Risø 1994 - 2013.
(Unit: eqv. mg KCl l–1
)

DTU-Nutech-R-0008(EN)
21
Fig. 8.1. Locations (1-6) for TLD measurements around the border of Risø
(cf. Table 8.1).
22 DTU-Nutech-R-0008(EN)
Fig. 8.2. Locations for measurements of background radiation around Risø in Zones
III, IV and V.

DTU-Nutech-R-0008(EN)
23

Center for Nuclear Technologies is Denmark’s national competency center for nuclear technology. With roots in research in the
peaceful use of nuclear power, DTU Nutech works with the applications of ionizing radiation and radioactive substances for the
benefit of society.
DTU
Center for Nuclear Technologies
Technical University of Denmark
Frederiksborgvej 399
PO Box 49
DK-4000 Roskilde
Denmark
Phone +45 4677 4677
Fax +45 4677 5688
www.dtu.dk