Embed Size (px)
Citation preview
Published in "Galactic and Extragalactic Radio Astronomy", 1974, eds. G.L. Verschuur and K.I. Kellerman.
Chapter 12
RADIO GALAXIES AND QUASARS
Kenneth I. Kellermann
Table of Contents
INTRODUCTION
RADIO SURVEYS 3C and 3CR Surveys Parkes Survey Nomenclature
OPTICAL IDENTIFICATIONS Types of Identifications Radio Galaxies Quasars
RADIO PROPERTIES Brightness Distribution Polarization Spectra Intensity Variations Empirical Relations
THEORIES OF RADIO SOURCES Synchrotron Radiation Effect of Energy Losses Interpretation of Spectral Data Effect of Absorption by Ionized Hydrogen Synchrotron Self-Absorption Inverse Compton Scattering
Energy Considerations Polarization Interpretation of Time Variations Evolution of the Radio Sources
SUMMARY
REFERENCES
12.1. INTRODUCTION
The discrete sources of radio emission were first distinguished from the general background radiation during the 1940's as a result of their rapid amplitude scintillations; and initially, it was thought that the scintillations were due to fluctuations in the intrinsic intensity of the discrete sources. Assuming that the dimensions of the sources could not greatly exceed the distance traveled by light during a typical fluctuation period of about 1 minute, it was concluded that the discrete sources were galactic stars located at relatively small distances from our solar system. Thus the term "radio star" was often used in referring to these sources.
The identification of two of the strongest sources, Virgo A and Centaurus A, with the nearby galaxies M87 and NGC 5128 by Bolton, Stanley, and Slee (1949) made it clear that at least some of the discrete sources were of extra-galactic origin. In 1954 an accurate position measurement of the strong source Cygnus A led to the identification of this source with a relatively faint 15th magnitude galaxy having a redshift z 0.06 (Baade and Minkowski, 1954), and the extragalactic nature of the discrete sources was generally recognized.
Although a few other radio sources were identified with galaxies during the 1950's, progress was slow because of the low accuracy of the radio source positions. By 1960, however, the positions of most of the strongest sources had been determined with an accuracy of about 10 seconds of arc and many were identified with various galaxy types. These galaxies, which are identified with strong radio sources, are generally referred to as "radio galaxies."
Most of the radio galaxies have bright emission lines, and so their redshift may be relatively easily determined. The faintest and most distant identified radio galaxy is the strong radio source 3C 295, which has a redshift of 0.46 and an apparent magnitude of about -21. This identification, which was made in 1960, was the result of accurate radio positions determined at Caltech and at Cambridge; it culminated a long search for distant galaxies and stimulated the search for galaxies of even higher redshift.
Continued efforts to identify distant galaxies were concentrated toward sources of small diameter and high surface brightness on the reasonable assumption that these were most easily observed at a large

distance. A primary candidate was 3C 48, which had an angular size less than 1 second of arc, and was at the time the smallest strong source known. Accurate position measurements made in 1961 resulted in what appeared to be a unique identification with a 16th-magnitude stellar object having a faint red wisp extending away from it. The absence of any other optical visible object near the radio source and the later discovery of significant night-to-night variations in light intensity led to the reasonable conclusion that 3C 48, unlike other radio sources, was a true radio star. Soon two other relatively strong sources, 3C 286 and 3C 196, were also identified with "stars," and it appeared that more than 20% of all sources were of this class. The optical and radio properties were surprisingly dissimilar for the three objects, and there were no unique radio properties to separate them from radio galaxies.
Early efforts at interpreting the emission-line spectrum of 3C 48 were relatively unsuccessful, although the possibility of a large redshift was apparently considered. By 1962 most of the lines were thought to be identified with highly excited states of rare elements.
The identification of 3C 273 with a similar stellar object, however, again cast doubt on the galactic interpretation which by 1963 was widely accepted. 3C 273 was tentatively identified in Australia with a 13th-magnitude star from a moderately accurate position determined with the 210-foot telescope. The position and identification were confirmed by a series of lunar occultations. These showed that the radio source was double, one component being within 1 second of the optical image, and the other component being elongated and coincident with a jet-like extension to the star. The identification was beyond question, although one wonders why it had not been made much earlier, as 3C 273 was the brightest then unidentified source, of small angular size and located in an unconfused region of the sky near the galactic pole.
The optical spectrum of 3C 273 showed a series of bright emission lines which could be identified only with the Hydrogen Balmer series, but with a redshift of 0.16. This redshift was confirmed when the H line was found near the predicted wavelength of 7590 Å in the near infrared. Adopting this redshift of 0.16 then led to the identification of the MgII lines appearing at 3239 Å.
A re-inspection of the 3C48 spectrum gave a redshift of 0.37 if a strong feature at 3832 Å was identified with MgII. Other lines could then be identified with 0II, NeIII, and NeV. Additional spectra taken of other similar sources led to the identification of CIII (1909 Å), CIV (1550 Å) and finally Ly- , permitting redshifts as great as 3.5 to be measured.
Radio sources in this hitherto unrecognized class are usually referred to as quasi-stellar radio sources, QSS, or quasars. Follow ing the identification of the first quasars it was realized that they all had a strong UV excess, and the search for further quasar identifications was simplified by looking for a very blue object located at the position of radio sources. In fact, many such objects were found which optically appear to be quasars, but are radio-quiet. These were originally referred to as Blue Stellar Objects (BSO), Quasi-Stellar Galaxies (QSG), or Quasi-Stellar Objects (QSO). Today the word "quasar" is generally used to refer to the entire class of stellar-type objects with large apparent redshifts, while
QSO and QSS refer to radio-quiet and radio-active quasars, respectively.
It is now widely accepted that the radio emission from both galaxies (including our own Galaxy) and quasars is due to synchro tron emission from relativistic particles moving in weak magnetic fields. The amount of energy required in the form of relativistic particles is, however, very great, and the source of energy and its conversion into relativistic particles has been one of the outstanding problems of modern astrophysics. The remainder of this chapter is devoted to a description of the observed properties of radio galaxies and quasars, and how these are interpreted in terms of the synchrotron mechanism.
12.2. Radio Surveys
Catalogs of discrete sources have been prepared from extensive surveys using instruments especially designed for this purpose. Initially these surveys were made at relatively long wavelengths near one meter, but as techniques have improved at the shorter wavelengths, the surveys have been extended to wavelengths as short as a few centimeters.
In order to isolate the discrete sources from the intense emission observed from the galactic background, most of the earlier surveys were made with interferometer systems, which are relatively insensitive to the distributed background emission (see Chapter 10).
Today, catalogs of sources based on surveys made between 10 MHz and 5 GHz are available. Some of the surveys, particularly those made at the longer wavelengths, cover essentially the entire observable sky down to source densities of about 103 ster-1. Other instruments, intended mainly for cosmological studies, have reached source densities of about 105 ster-1 over very restricted parts of the sky. New instruments just coming into operation will reach densities of 106 ster-1.
Generally the surveys have produced approximate values for the position and flux density for the cataloged sources. These catalogs have then been used as the basis for subsequent more accurate measurements over a wide range of wavelengths of properties such as
1. the angular position in the sky
2. the radio brightness distribution
3. the radio-frequency spectrum
4. the amount and direction of any polarization and its angular distribution
5. the time-dependence of the radio emission.
A useful summary of radio source surveys has been compiled by Dixon (1970), and contains the results

of many separate surveys. The two most widely used catalogs are based on the Cambridge 3C and 3CR surveys and the Parkes survey, which contain between them the great majority of sources which have been studied in detail and for which optical data are available.
12.2.1. 3C and 3CR Surveys
The 3CR catalog (Bennett, 1962) is based on the original 3C survey (Edge et al., 1960) made at Cambridge at 159 MHz using a complex interferometer system. This survey was preceded by the 2C survey made with the same instrument at 81 MHz with a resolution two times poorer in each coordinate. The 2C catalog contained 1936 sources, but owing to the poor resolving power, it became clear at an early stage that many of these sources were not real, and were due to blends of two or more sources in the primary antenna beam. Moreover, except for the strongest sources the determination of the flux density and angular coordinates was poor. The 3C survey with twice the resolution contained only 471 sources and was considerably more reliable. Nevertheless, because of the relatively poor primary resolving power, there were still large errors in the positions and flux densities. In particular, it was frequently uncertain in which lobe of the interference pattern a particular source was located, and this introduced large positional uncertainties.
In order to reduce these uncertainties an additional survey was made at 178 MHz using a large parabolic cylinder antenna. The narrow E-W beam of this antenna eliminated nearly all of the lobe ambiguities of the original 3C catalog. The data from the two surveys were combined to form the then most reliable radio source catalog - the Revised 3C or 3CR Catalogue.
The same parabolic cylinder antenna was later used together with a smaller moveable antenna as an aperture synthesis instrument (see Chapter 10) to make a complete high-resolution survey of the northern sky (the 4C survey), which contains about 2000 sources.
12.2.2. Parkes Survey
The most extensive survey of the Southern Hemisphere radio sources has been made with the 210-foot radio-telescope near Parkes, Australia. This survey was initially made at 408 MHz (75 cm), except for the region 20° > < 27°, which was surveyed at 635 MHz (50 cm). Each source detected in the 50- or 75-cm finding survey was re-observed at 20 and 11 cm to obtain more accurate positions and flux densities at these wavelengths. The Parkes survey essentially replaces an earlier survey made at 86 MHz using a Mills Cross-type antenna with a resolution of about 48 minutes of are. Unlike the Cambridge 2C survey, made about the same time and at nearly the same wavelength, the Mills Cross survey was mostly limited - not by inadequate resolution to separate nearby sources, but by low sensitivity. Nevertheless, later work has shown that this survey was surprisingly accurate for its time, at least for the sources not near the limit of detection.
12.2.3. Nomenclature
Most of the earlier surveys used a variety of complex schemes for naming and identifying sources. Unfortunately, the use of many names for a single source has led to needless confusion among workers. The recognition of this problem has led to the growing use of a system first used in the Parkes catalog. In this system each source is identified by a name of the form HHMM±DD, where HHMM represents the hours and minutes of right ascension, and ±DD the degrees of declination prefixed by the sign. In order to preserve the identity of the observatory, the catalog name is. frequently preceded by a symbol identifying the observatory. Some prefixes in common use are PKS (Parkes), DW (Dwingeloo), B (Bologna), G (Green Bank), A (Arecibo). Often additional symbols are used to identify a particular survey.
12.3. OPTICAL IDENTIFICATIONS
Of the thousands of sources which have been cataloged only a few hundred have been reliably optically identified with galaxies or with quasars. For a considerable number of sources accurate positions have been measured, but no optical object is found above the plate limit of the Palomar Sky Survey. For a much larger number of sources the position accuracy is not sufficient to distinguish between the two or more objects lying within the error rectangle.
Optical identifications are important for two reasons.
1. It is not possible from radio measurements alone to determine the distance to a radio source. Thus, only if the radio source is identified with a galaxy or quasar is it possible to measure the redshift and thus deduce the distance from the Hubble law. Distances are, of course, required to estimate the absolute radio luminosity and linear dimensions from measurements of radio flux density and angular size.
2. Optical studies of radio galaxies and quasars may give some insight into the problem of the origin of the intense radio emission.
For these reasons much of the earlier work on the discrete radio sources was concentrated on the determination of accurate positions to permit unambiguous optical identifications. Today, coordinates of at least the stronger sources may be routinely determined by interferometry with an accuracy of the order of 1 second of arc. Nevertheless, the identifications are difficult. Firstly, often there is no apparent optical counterpart of the radio position, so that any associated optical object is either subluminous or at such a great distance that it is not visible, even to large optical telescopes. Secondly, many radio sources have dimensions of the order of 1 minute of arc or more and a complex distribution of radio brightness so that more than one galaxy or quasar is found within the area covered by the source. Often, but not always, the identified galaxy lies near the centroid of radio emission, but it may also be coincident with one of the individual radio components, so that unambiguous identifications are difficult.
12.3.1. Types of Identifications
Identifications of extra-galactic radio sources are with a variety of objects, for example, as defined by Matthews, Morgan, and Schmidt (1964), with
1. normal spiral galaxies
2. Seyfert galaxies
3. E, or elliptical, galaxies which are often the brightest member of a cluster
4. D galaxies, which are similar to elliptical galaxies, but contain an extended halo
5. dB or Dumbell galaxies, which contain a double nucleus imbedded in a common halo
6. N galaxies, which contain a compact bright nucleus with a strong emission-line spectrum, superimposed on a faint nebulous envelope
7. QSO's or quasi-stellar objects (quasars).
The above sequence is very roughly in increasing order of absolute radio luminosity, although there is a wide spread of luminosity within each class. In general the spiral galaxies are relatively weak radio emitters, while the various types of ellipticals (E, D, dB, N) are considerably more intense. Some of the giant ellipticals, however, contain a very weak radio source coincident with its nucleus (Heeschen, 1970).
In recent years there has been a growing realization that the distinction between the various optical categories is largely subjective and may vary depending on the observer, the size of the telescope, and the distance of the object. For example, the prototype quasar, 3C 48, is now sometimes classed as an N galaxy (e.g., Morgan, 1972). In another case the optical jets from the quasar 3C 273 and the giant elliptical galaxy M87 show surprising similarity.
12.3.2. Radio Galaxies
Essentially all of the identified radio galaxies show moderate to strong narrow emission lines such as OII at 3727 Å in their optical spectra, and this property has been used to confirm preliminary optical identifications based on the positional agreement of the radio source and the galaxy. Most of the identified galaxies are classed as giant ellipticals which have a surprisingly narrow dispersion in absolute optical magnitude of -20.8 ± 0.6 (H = 100 km/sec/Mpc). Initially most of the identifications were with galaxies which showed some sort of optical peculiarity. For example, M87 (Virgo A) has a well-known jet extending from its nucleus; NGC 5128 (Centaurus A) contains a conspicuous dark band across the galaxy; Cygnus A has a double nucleus with intense emission lines, which were the basis for the idea that the radio emission was the result of collisions between two galaxies. Other identifications

were with Seyfert galaxies such as NGC 1086 and NGC 1275.
Although more recently radio galaxies which show no obvious optical peculiarity have been identified, there has been some degree of bias toward accepting identifications with galaxies which show some abnormality. Since the identification process is a very subjective one, involving not only positional coincidence but the size and structure of the radio source, as well as the presence of strong emission lines and optical features such as jets or dust, the connection between these phenomena and the radio emission is not clear unless the difficult task of obtaining optical identifications and redshifts of a complete sample of radio sources is achieved.
Because two of the early radio source identifications were with the Seyfert galaxies NGC 1068 and NGC 1275, it has been widely thought that the Seyfert phenomenon is associated with intense radio emission. In fact, this is not the case, since none of the other well-known Seyfert galaxies show radio emission much greater than the normal spiral galaxies. Moreover, even NGC 1068 has a luminosity of
only 1040 ergs/sec - only slightly greater than other spiral galaxies - and the classification of NGC 1275 as a Seyfert is now questioned by many astronomers. Although a few other radio sources have been identified with galaxies that were later classed as Seyferts, it appears in general that the radio luminosity of Seyfert galaxies does not significantly exceed that of normal spirals, and the fraction of Seyfert galaxies which are strong radio sources appears to be comparable with that of giant ellipticals.
Similarly, attempts to detect radio emission from other "peculiar" galaxies such as the Zwicky compact galaxies, Markarian galaxies, or the interacting galaxies cataloged by Arp and Vorontzov-Velyaminov have been for the most part unsuccessful, and contrary to a widely held belief, there is no evidence that these "exotic" galaxies are more likely to be strong radio sources than galaxies chosen at random.
Most Seyfert and Seyfert-type galaxies do contain a relatively weak small source at their nuclei. These nuclei also show surpris ingly strong infrared emission, with an intensity roughly proportional to the radio flux (van der Kruit, 1971).
Redshifts are available for only about 100 of the identified radio galaxies. These have absolute radio luminosities which range from about 1040 to 1045 ergs/sec. In contrast to the radio galaxies which were all identified as galaxies that are coincident with cataloged radio sources, are the so-called normal galaxies. These are the optically bright galaxies from which weak radio emission has been detected as a result of a special search. The absolute radio luminosity of the "normal" galaxies is of the order of 1037 to 1038 ergs/sec, which is comparable to the power radiated from our own Galaxy.
It is not completely clear to what extent the normal galaxies are a separate class or just an extension of the radio galaxy phenomena. Originally there was some evidence of a relative deficiency of sources with intermediate luminosities in the range 1039-40 ergs/sec. However, it now appears that this was largely a manifestation of the different techniques used to investigate "radio" galaxies and "normal" galaxies and that the luminosity function is continuous in the range 1038 < L < 1045 ergs/sec.
The identified quasars are all very strong radio sources with luminosities comparable with the most luminous radio galaxies. Of the quasars which were first located from optical measurements, only a few percent have been detected as radio sources. But considering the large redshifts, the upper limit to the radio luminosity of the undetected quasars is still large, and comparable with that of the strongest radio galaxies.
Searches for radio emission from rich clusters of galaxies have been more fruitful, although it appears that the radio emission originates in the brightest cluster member, and that cluster membership does not affect the probability of radio emission. About 5 to 10% of the giant elliptical galaxies which are the brightest cluster members show detectable radio emission (Rogstad and Ekers, 1969).
There is some evidence that the radio luminosity depends weakly on the optical luminosity for both galaxies and quasars. In the case of galaxies almost all the strong radio sources show bright emission lines.
12.3.3. Quasars
The optical properties of quasars may be summarized as follows
1. They appear stellar on direct photographs, although in some cases there is a faint jet or wisp extending from the stellar object.
2. They have large redshifts ranging up to z = 3.5.
3. Assuming that the redshifts are cosmological and that the distance is given by the Hubble law with a Hubble constant, H, equal to 100 km/sec/Mpc, then the absolute optical magnitudes range from -22 to -26 or more, so that they are up to 100 times brighter than the most luminous galaxies at optical wavelengths.
4. Often the optical emission is variable on time scales ranging from a few hours to a few years.
5. The luminosity rises sharply toward the infrared, where most the radiated energy lies. There is also an excess of UV emission compared with galaxies, so that the presence of a large redshift causes the quasar to appear blue when measured by UBV photometry or when the color is estimated from the "red" and "blue" plates of the Palomar Sky Survey. For very large red shifts (z
3), however, the color may appear neutral or even "red."
6. The spectra show intense broad emission lines, with line widths corresponding to velocities up to 4000 km/sec. The most commonly observed lines are those of Ly ( 1216), CIV ( 1549), CIII (
1909), MgII ( 2798), OIII ( 4363, 4959, 5007), and the Hydrogen Balmer series.
7. Some quasars show narrow absorption lines, often with several sets of redshifts which are usually smaller than the emission-line redshift.
12.4. RADIO PROPERTIES
The extra-galactic sources can be conveniently divided into two groups: the extended or transparent sources, and the compact or opaque sources. The observed properties of the two groups are discussed in more detail in the following pages.
Quite surprisingly there is no simple relation between the dimensions of the radio-emitting region and the dimensions of the optical galaxy or QSO, and it must be emphasized that the division into compact and extended radio sources in no way separates the quasars from the radio galaxies. In fact, insofar as we know for any individual source, the quasars are indistinguishable from the radio galaxies on the basis of their radio properties alone. There are, however, clear statistical differences; the majority of the compact sources are identified with quasars or with galaxies that have bright nuclei, such as N-type or Seyfert galaxies. However, many also appear in normal-looking elliptical galaxies as well. Likewise the extended radio sources are not identified only with galaxies, but are frequently associated with quasars showing no visible optical extent. Because the compact sources are all affected by self-absorption (see Section 12.5.4), their spectra are flat and they are therefore most easily detected by radio surveys made
at short wavelengths. The total power radiated at radio frequencies extends from about 1038 ergs/sec from so-called normal galaxies such as our own Galaxy and other spirals, to 1041 ergs/sec for the weaker radio elliptical galaxies such as M87 or Centaurus A, and up to 1045 ergs/sec for the most luminous radio galaxies such as Cygnus A and 3C 295 and many quasars. In many numerical examples Cygnus A is often discussed as a "typical source," whereas in fact it is a very outstanding source since less than one source in 10 million in any given volume of space approaches this luminosity.
12.4.1. Brightness Distribution
The three-dimensional structure of extragalactic sources is usually inferred from the observations of the angular size and bright ness distribution projected onto the plane of the sky. Often only the brightness distribution in one dimension is determined. The data on brightness distributions are obtained by one of four common procedures.
a) Pencil Beam, Observations
only a few of the extra-galactic sources are sufficiently large for their structure to be studied by even the largest pencil beam radio telescopes. Moreover, these sources are all relatively nearby, of low absolute luminosity and very low surface brightness, and therefore not representative of typical extragalactic sources found in radio source surveys. One very extended source which has been mapped with pencil beam telescopes is Fornax A (shown in Figure 12.1), which consists of two extended components, with little or no fine structure, located symmetrically on either side of a bright elliptical galaxy.
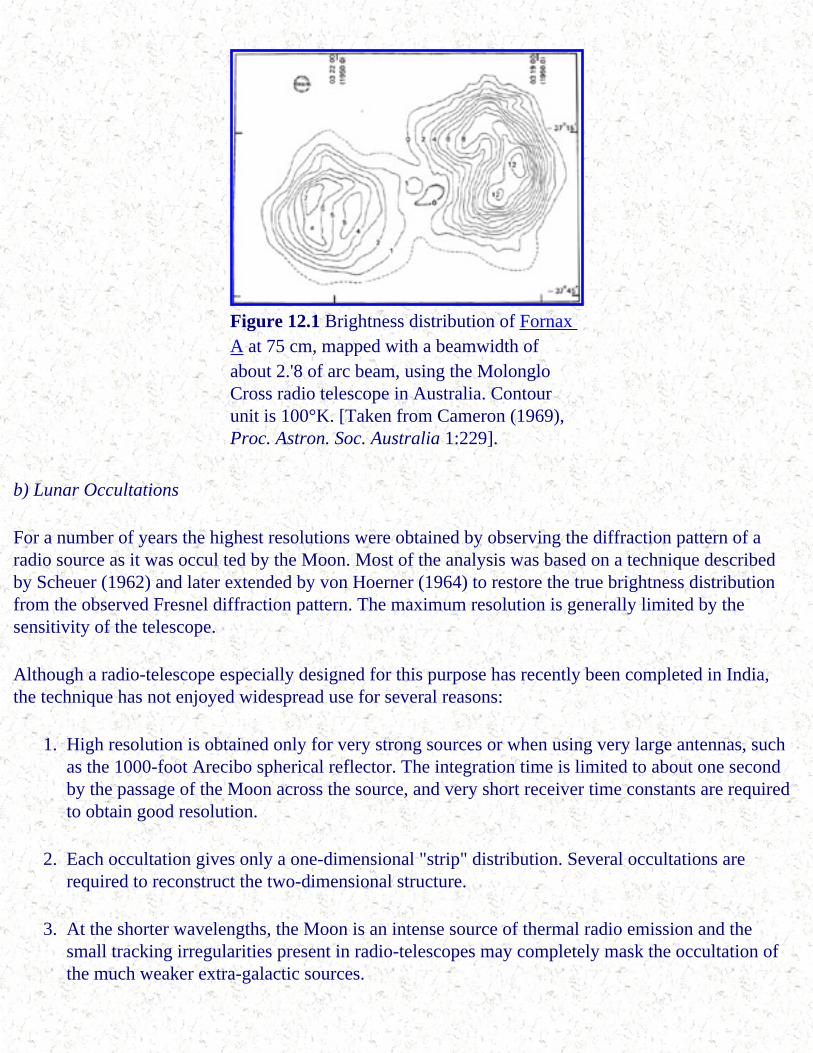
Figure 12.1 Brightness distribution of Fornax A at 75 cm, mapped with a beamwidth of about 2.'8 of arc beam, using the Molonglo Cross radio telescope in Australia. Contour unit is 100°K. [Taken from Cameron (1969), Proc. Astron. Soc. Australia 1:229].
b) Lunar Occultations
For a number of years the highest resolutions were obtained by observing the diffraction pattern of a radio source as it was occul ted by the Moon. Most of the analysis was based on a technique described by Scheuer (1962) and later extended by von Hoerner (1964) to restore the true brightness distribution from the observed Fresnel diffraction pattern. The maximum resolution is generally limited by the sensitivity of the telescope.
Although a radio-telescope especially designed for this purpose has recently been completed in India, the technique has not enjoyed widespread use for several reasons:
1. High resolution is obtained only for very strong sources or when using very large antennas, such as the 1000-foot Arecibo spherical reflector. The integration time is limited to about one second by the passage of the Moon across the source, and very short receiver time constants are required to obtain good resolution.
2. Each occultation gives only a one-dimensional "strip" distribution. Several occultations are required to reconstruct the two-dimensional structure.
3. At the shorter wavelengths, the Moon is an intense source of thermal radio emission and the small tracking irregularities present in radio-telescopes may completely mask the occultation of the much weaker extra-galactic sources.
4. Interference from terrestrial radio emission reflected from the Moon is often a serious problem.
c) Interplanetary Scintillations (IPS)
In 1962 a group working at the Cavendish Laboratory in England discovered that radio sources with structure of the order of a second of arc or less showed rapid scintillations when observed through the solar corona. This effect was used extensively for several years to study small-scale-structure radio sources (e.g., Cohen, Gundermann, and Harris, 1967; Little and Hewish, 1966). However, in recent years the high-resolution interferometers now available have been used for this kind of work, and IPS are now rather used to study the interplanetary medium. The reader who is interested in further details about the application of lunar occultations and interplanetary scintillations is referred to the review by Cohen (1969).
d) Interferometry and Aperture Synthesis
During recent years the techniques of interferometry and aperture synthesis have been greatly improved and are now providing accurate and detailed information on the structure of extra-galactic sources. Because of the importance of these techniques, a whole chapter of this book has been devoted to describing the methods in considerable detail.
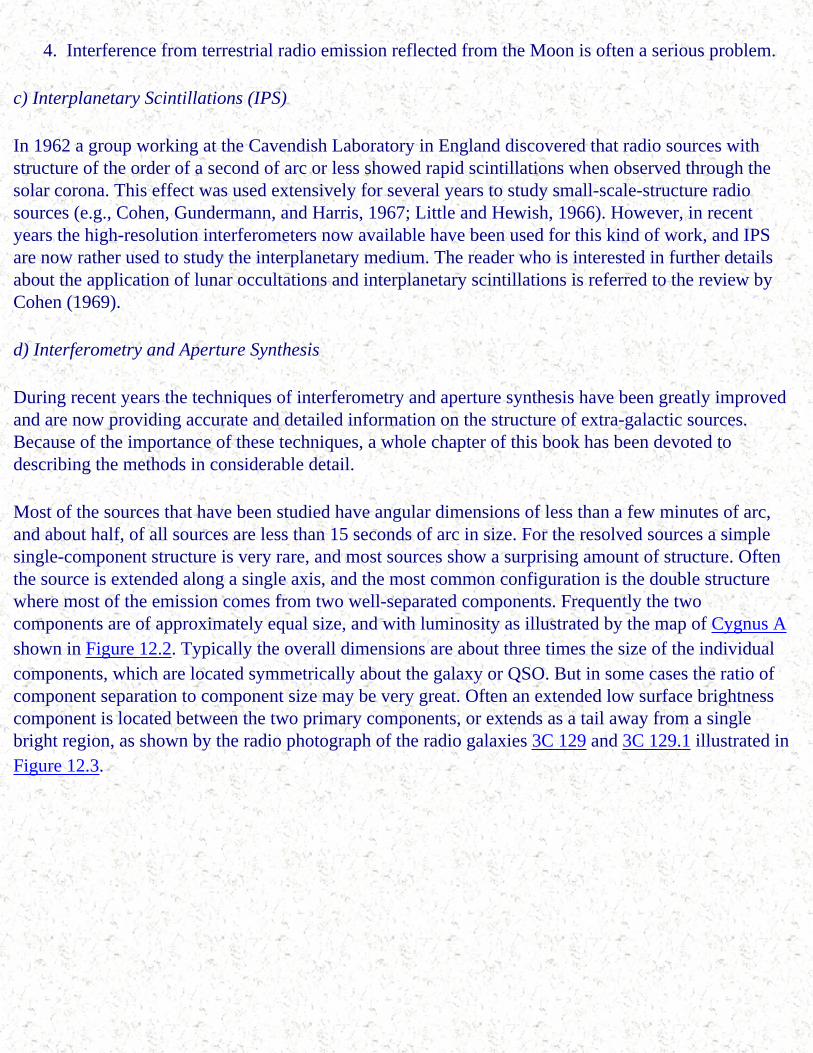
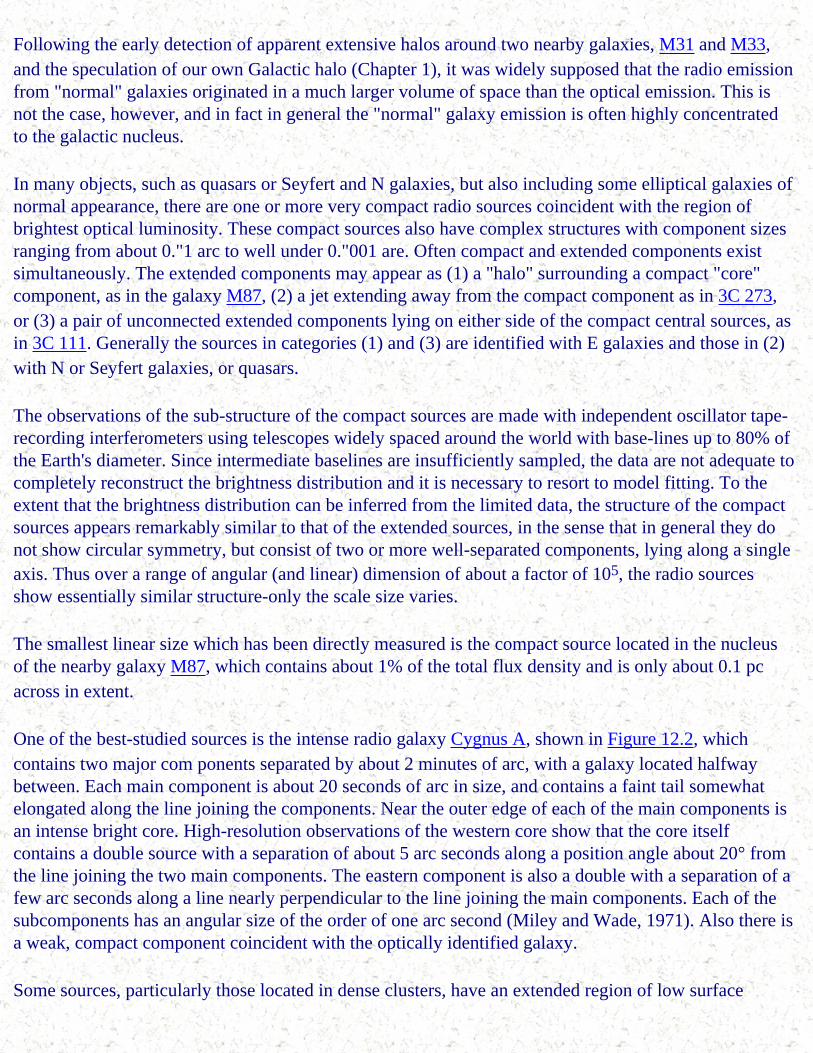
Most of the sources that have been studied have angular dimensions of less than a few minutes of arc, and about half, of all sources are less than 15 seconds of arc in size. For the resolved sources a simple single-component structure is very rare, and most sources show a surprising amount of structure. Often the source is extended along a single axis, and the most common configuration is the double structure where most of the emission comes from two well-separated components. Frequently the two components are of approximately equal size, and with luminosity as illustrated by the map of Cygnus A shown in Figure 12.2. Typically the overall dimensions are about three times the size of the individual components, which are located symmetrically about the galaxy or QSO. But in some cases the ratio of component separation to component size may be very great. Often an extended low surface brightness component is located between the two primary components, or extends as a tail away from a single bright region, as shown by the radio photograph of the radio galaxies 3C 129 and 3C 129.1 illustrated in Figure 12.3.
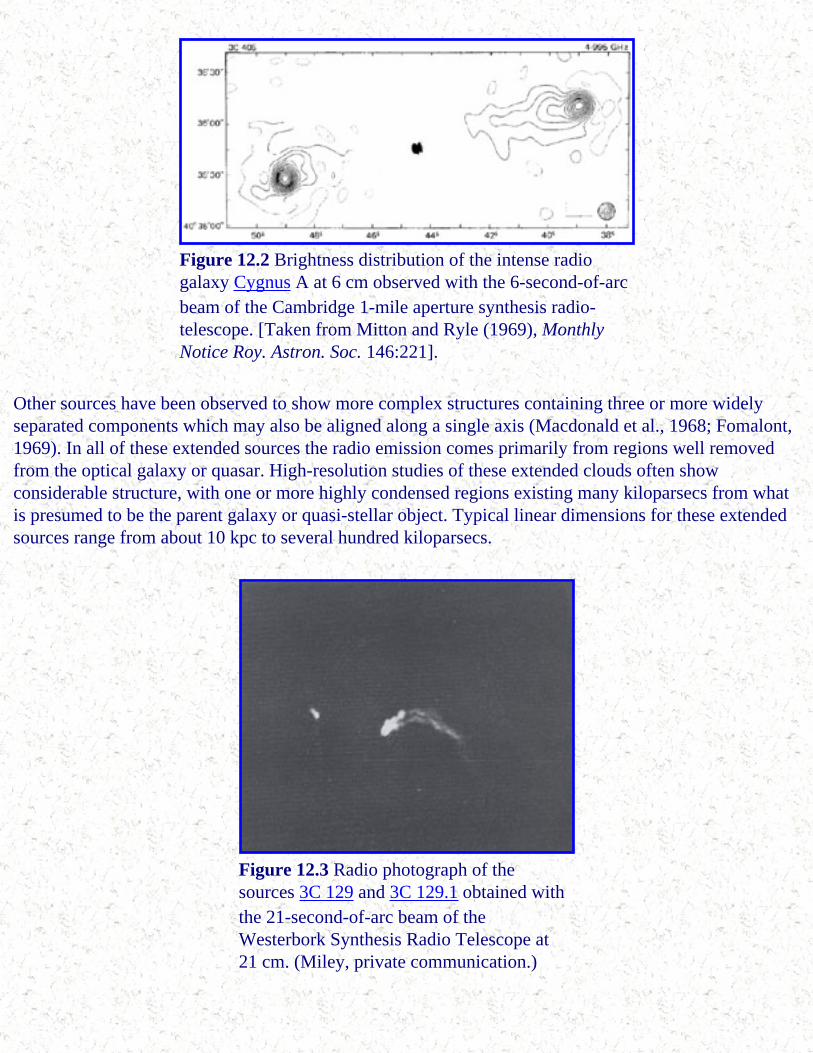
Figure 12.2 Brightness distribution of the intense radio galaxy Cygnus A at 6 cm observed with the 6-second-of-arc beam of the Cambridge 1-mile aperture synthesis radio-telescope. [Taken from Mitton and Ryle (1969), Monthly Notice Roy. Astron. Soc. 146:221].
Other sources have been observed to show more complex structures containing three or more widely separated components which may also be aligned along a single axis (Macdonald et al., 1968; Fomalont, 1969). In all of these extended sources the radio emission comes primarily from regions well removed from the optical galaxy or quasar. High-resolution studies of these extended clouds often show considerable structure, with one or more highly condensed regions existing many kiloparsecs from what is presumed to be the parent galaxy or quasi-stellar object. Typical linear dimensions for these extended sources range from about 10 kpc to several hundred kiloparsecs.
Figure 12.3 Radio photograph of the sources 3C 129 and 3C 129.1 obtained with the 21-second-of-arc beam of the Westerbork Synthesis Radio Telescope at 21 cm. (Miley, private communication.)
Following the early detection of apparent extensive halos around two nearby galaxies, M31 and M33, and the speculation of our own Galactic halo (Chapter 1), it was widely supposed that the radio emission from "normal" galaxies originated in a much larger volume of space than the optical emission. This is not the case, however, and in fact in general the "normal" galaxy emission is often highly concentrated to the galactic nucleus.
In many objects, such as quasars or Seyfert and N galaxies, but also including some elliptical galaxies of normal appearance, there are one or more very compact radio sources coincident with the region of brightest optical luminosity. These compact sources also have complex structures with component sizes ranging from about 0."1 arc to well under 0."001 are. Often compact and extended components exist simultaneously. The extended components may appear as (1) a "halo" surrounding a compact "core" component, as in the galaxy M87, (2) a jet extending away from the compact component as in 3C 273, or (3) a pair of unconnected extended components lying on either side of the compact central sources, as in 3C 111. Generally the sources in categories (1) and (3) are identified with E galaxies and those in (2) with N or Seyfert galaxies, or quasars.
The observations of the sub-structure of the compact sources are made with independent oscillator tape-recording interferometers using telescopes widely spaced around the world with base-lines up to 80% of the Earth's diameter. Since intermediate baselines are insufficiently sampled, the data are not adequate to completely reconstruct the brightness distribution and it is necessary to resort to model fitting. To the extent that the brightness distribution can be inferred from the limited data, the structure of the compact sources appears remarkably similar to that of the extended sources, in the sense that in general they do not show circular symmetry, but consist of two or more well-separated components, lying along a single axis. Thus over a range of angular (and linear) dimension of about a factor of 105, the radio sources show essentially similar structure-only the scale size varies.
The smallest linear size which has been directly measured is the compact source located in the nucleus of the nearby galaxy M87, which contains about 1% of the total flux density and is only about 0.1 pc across in extent.
One of the best-studied sources is the intense radio galaxy Cygnus A, shown in Figure 12.2, which contains two major com ponents separated by about 2 minutes of arc, with a galaxy located halfway between. Each main component is about 20 seconds of arc in size, and contains a faint tail somewhat elongated along the line joining the components. Near the outer edge of each of the main components is an intense bright core. High-resolution observations of the western core show that the core itself contains a double source with a separation of about 5 arc seconds along a position angle about 20° from the line joining the two main components. The eastern component is also a double with a separation of a few arc seconds along a line nearly perpendicular to the line joining the main components. Each of the subcomponents has an angular size of the order of one arc second (Miley and Wade, 1971). Also there is a weak, compact component coincident with the optically identified galaxy.
Some sources, particularly those located in dense clusters, have an extended region of low surface
brightness emission. It has been postulated that these are trails of relativistic electrons left by the motion of a radio galaxy through a gaseous medium. The radio photograph of 3C 129 and 3C 129.1 shown in Figure 12.3 clearly shows a double-helix trail suggesting rotation of the particle-ejecting region of the galaxy (Miley et al., 1972).
12.4.2. Polarization
Nearly all of the radio galaxies and quasars have some degree of linear polarization ranging from integrated values of a few tenths of a percent to several percent, with the greatest value about 20%. At least for the extended sources, the integrated polarization is generally greatest at the shorter wavelengths, and the greatest polarization is found in the low surface brightness objects. In general the plane of polarization rotates at a rate approximately proportional to 2 and it is generally considered that this is due to Faraday rotation. Since the amplitude and sign of rotation appear to depend on galactic coordinates, it is thought that much, but not necessarily all, of the rotation occurs within the Galaxy. The degree of depolarization at longer wavelengths may also depend on galactic coordinates, but this is not clearly established.
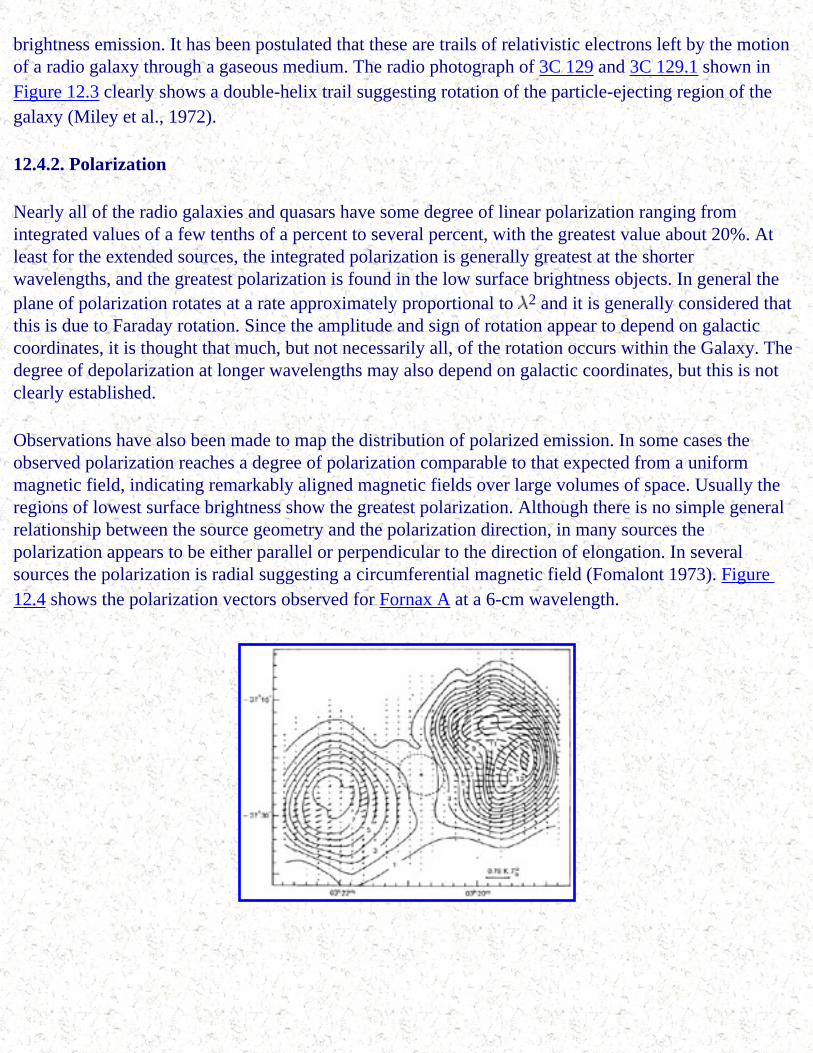
Observations have also been made to map the distribution of polarized emission. In some cases the observed polarization reaches a degree of polarization comparable to that expected from a uniform magnetic field, indicating remarkably aligned magnetic fields over large volumes of space. Usually the regions of lowest surface brightness show the greatest polarization. Although there is no simple general relationship between the source geometry and the polarization direction, in many sources the polarization appears to be either parallel or perpendicular to the direction of elongation. In several sources the polarization is radial suggesting a circumferential magnetic field (Fomalont 1973). Figure 12.4 shows the polarization vectors observed for Fornax A at a 6-cm wavelength.

Figure 12.4 Polarization vectors of Fornax A observed at 6 cm superimposed on contours of total brightness temperature. The resolution was 4 minutes of arc beam using the Parkes 210-foot radio-telescope. In the eastern component the polarization is very low at the intensity maximum, while in the other it is much greater. (Taken from Gardner and Whiteoak (1971), Australian J. Phys. 29:899].
Recently, several observers have detected small amounts of circular polarization in a few compact sources.
12.4.3. Spectra
With the exception of the 21-cm line of neutral hydrogen found only in relatively nearby galaxies, there are no sharp features in the radio spectra of galaxies and quasars, and the observations are confined to measurements of the continuous spectra. Since, unlike optical telescopes, radio-telescopes generally operate only over a limited range of wavelengths, the determination of spectra over a wide range of wavelengths requires combining data obtained by many observers using widely different types of telescopes. Because radio-telescopes may differ widely in their characteristics, each antenna and radiometer system must be separately calibrated at every wavelength where observations are made. Generally, this is done by observing one or more sources whose intensity had previously been determined on an "absolute" scale. Until recently, the problem of obtaining an "absolute" calibration of these primary standards was a formidable one, and the experimental discrepancies discouragingly large. Today, however, the situation is vastly improved and standard sources calibrated with an absolute accuracy of 3 to 10% are available over a wide range of wavelengths. The determination of relative intensities is much easier and is routinely done to an accuracy of a few percent, at least at the shorter wavelengths where confusion from the galactic background is less important.
Hundreds of extra-galactic sources have now been observed over a range of wavelengths extending from a few centimeters to a few meters, and a smaller number over the wider range from a few millimeters to a few tens of meters (10 MHz to 100 GHz). This range of 104 to 1 in wavelength may be compared with the range of only about 2:1 available for ordinary optical spectra. Although a wide variety of spectral shapes are found, no unambiguous distinction exists between the spectra of radio galaxies and those of quasars.
Radio spectra are usually displayed in the form of a logarithmic plot of flux density vs. frequency. Sources with simple power law spectra are then represented by a straight line. The spectral index, , is defined by the relation 1 (flux density) (frequency) .
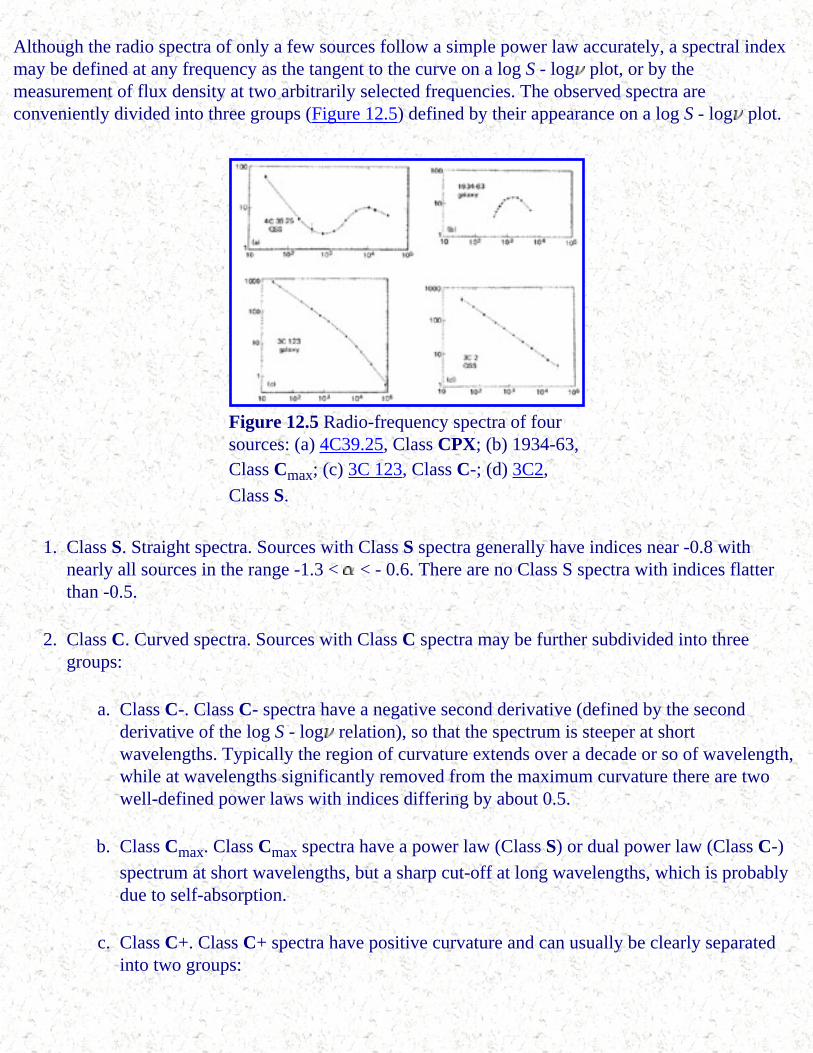
Although the radio spectra of only a few sources follow a simple power law accurately, a spectral index may be defined at any frequency as the tangent to the curve on a log S - log plot, or by the measurement of flux density at two arbitrarily selected frequencies. The observed spectra are conveniently divided into three groups (Figure 12.5) defined by their appearance on a log S - log plot.
Figure 12.5 Radio-frequency spectra of four sources: (a) 4C39.25, Class CPX; (b) 1934-63, Class Cmax; (c) 3C 123, Class C-; (d) 3C2,
Class S.
1. Class S. Straight spectra. Sources with Class S spectra generally have indices near -0.8 with nearly all sources in the range -1.3 < < - 0.6. There are no Class S spectra with indices flatter than -0.5.
2. Class C. Curved spectra. Sources with Class C spectra may be further subdivided into three groups:
a. Class C-. Class C- spectra have a negative second derivative (defined by the second derivative of the log S - log relation), so that the spectrum is steeper at short wavelengths. Typically the region of curvature extends over a decade or so of wavelength, while at wavelengths significantly removed from the maximum curvature there are two well-defined power laws with indices differing by about 0.5.
b. Class Cmax. Class Cmax spectra have a power law (Class S) or dual power law (Class C-)
spectrum at short wavelengths, but a sharp cut-off at long wavelengths, which is probably due to self-absorption.
c. Class C+. Class C+ spectra have positive curvature and can usually be clearly separated into two groups:

i. Class Cl+. Class Cl+ have enhanced spectra at long wavelengths.
ii. Class Cs+. Class Cs+ have enhanced spectra at short wavelengths.
3. Class CPX. Class CPX spectra are complex and show one or more relative minima. CPX spectra are generally believed to be composed of two or more Class Cmax spectra, plus in some cases a
Class S spectrum, or one Class Cmax together with a Class S spectrum.
The Class S and Class C- spectra are mostly found in the extended radio sources, which are transparent at radio frequencies, while the Cmax, Cs+, and CPX spectra generally indicate a compact opdque
component. Cl+ spectra are typically found in sources located in rich clusters of galaxies.
The histogram of the distribution of spectral indices shows three distinct populations. One, which predominates in the surveys made at relatively long wavelengths, contains class S and C- spectra, with a narrow distribution of indices about a median value near -0.8 and a dispersion of 0.15. The steepest value of the index which is observed for these sources is about -2.0. Very few sources, however, have indices steeper than -1.3. The sources shown in the histogram of Figure 12.6 are mostly of the class S or C-.
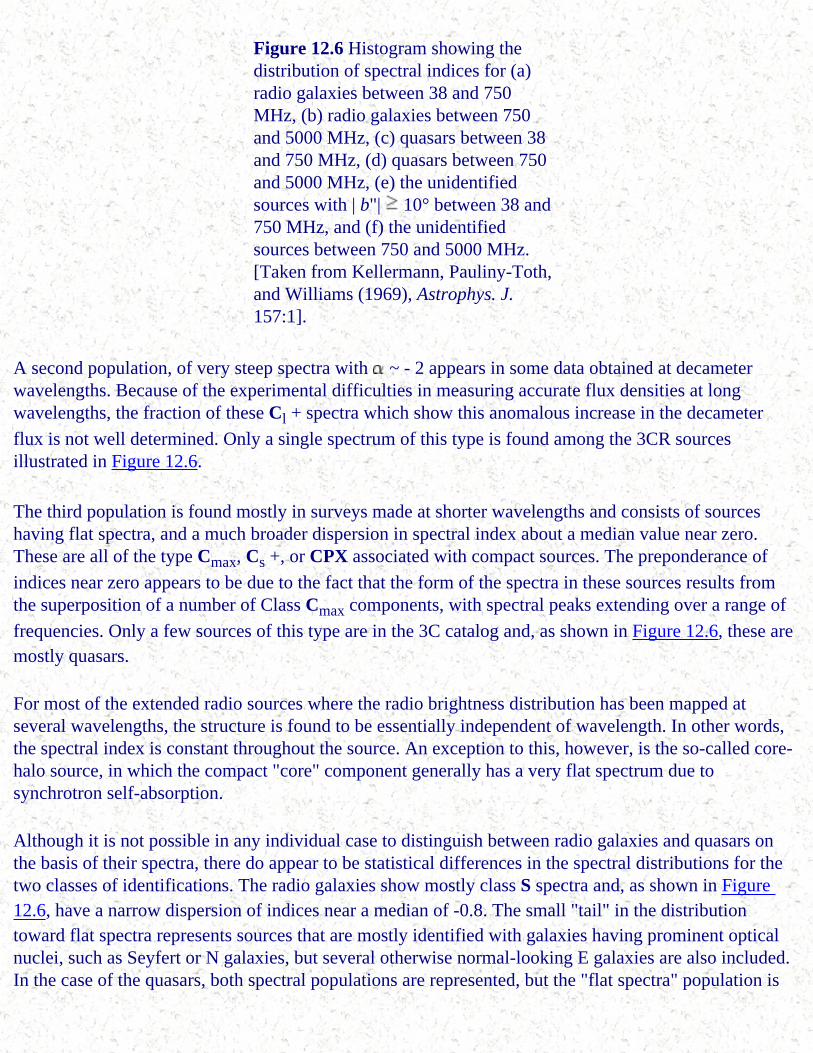
Figure 12.6 Histogram showing the distribution of spectral indices for (a) radio galaxies between 38 and 750 MHz, (b) radio galaxies between 750 and 5000 MHz, (c) quasars between 38 and 750 MHz, (d) quasars between 750 and 5000 MHz, (e) the unidentified sources with | b"| 10° between 38 and 750 MHz, and (f) the unidentified sources between 750 and 5000 MHz. [Taken from Kellermann, Pauliny-Toth, and Williams (1969), Astrophys. J. 157:1].
A second population, of very steep spectra with ~ - 2 appears in some data obtained at decameter wavelengths. Because of the experimental difficulties in measuring accurate flux densities at long wavelengths, the fraction of these Cl + spectra which show this anomalous increase in the decameter
flux is not well determined. Only a single spectrum of this type is found among the 3CR sources illustrated in Figure 12.6.
The third population is found mostly in surveys made at shorter wavelengths and consists of sources having flat spectra, and a much broader dispersion in spectral index about a median value near zero. These are all of the type Cmax, Cs +, or CPX associated with compact sources. The preponderance of
indices near zero appears to be due to the fact that the form of the spectra in these sources results from the superposition of a number of Class Cmax components, with spectral peaks extending over a range of
frequencies. Only a few sources of this type are in the 3C catalog and, as shown in Figure 12.6, these are mostly quasars.
For most of the extended radio sources where the radio brightness distribution has been mapped at several wavelengths, the structure is found to be essentially independent of wavelength. In other words, the spectral index is constant throughout the source. An exception to this, however, is the so-called core-halo source, in which the compact "core" component generally has a very flat spectrum due to synchrotron self-absorption.
Although it is not possible in any individual case to distinguish between radio galaxies and quasars on the basis of their spectra, there do appear to be statistical differences in the spectral distributions for the two classes of identifications. The radio galaxies show mostly class S spectra and, as shown in Figure 12.6, have a narrow dispersion of indices near a median of -0.8. The small "tail" in the distribution toward flat spectra represents sources that are mostly identified with galaxies having prominent optical nuclei, such as Seyfert or N galaxies, but several otherwise normal-looking E galaxies are also included. In the case of the quasars, both spectral populations are represented, but the "flat spectra" population is
considerably more prominent than in the case of the galaxies.
The unidentified sources selected from long-wavelength surveys show a spectral distribution which is similar to that of the radio galaxies, although the mean index is somewhat steeper. It is thus possible to interpret these unidentified sources as radio galaxies which are beyond the plate limit of the Palomar Sky Survey. The slightly steeper mean index observed for these sources may be explained if they have dual power law spectra, and the large redshift has moved the high-frequency (steeper) part of the spectrum into the observed frequency range. Detailed investigation of the form of radio source spectra of unidentified radio galaxies, however, indicates that the spectra do not steepen sufficiently at high frequencies for the unidentified sources to be interpreted in this way.
An alternative explanation is that if the identified sources are associated with radio galaxies beyond the plate limit, they must be relatively distant, and thus have a high absolute radio luminosity. The steep spectra observed for the unidentified sources could then reflect a relation between high luminosity and steep spectra (cf. Section 12.4.5).
Because the sources with flat or inverted spectra are relatively weak at long wavelengths, they were not detected in the earlier surveys, which were made at meter wavelengths. As techniques have been pushed toward shorter wavelengths, the fraction of flat spectra sources detected by surveys has increased. Near 6-cm wavelength the observed fraction of flat spectra (opaque) sources and steep spectra (transparent) sources is about equal.
The expected dependence of the spectral index distribution on observing wavelength may be easily calculated. Given the normalized spectral index distribution, P( ), at any wavelength 1 for sources with
flux density stronger than S1, and provided that P( ) is independent of S, the spectral distribution, Q( ),
for all sources stronger than S2 at 2 is then
(12.1)
where N(S, ) is the integral number flux density relation (see Chapter 13).
If N(S) K Sx where K and x are constants, then
(12.2)
where the first term is simply a normalization constant.
In the special case where P( ) is a Gaussian with a mean index 0 and dispersion , then Q( ) is also
Gaussian with the same dispersion but with a mean index displaced by the amount
(12.3)
Because of the factor ( 2 / 1)- x in Equation (12.2), it is clear that the spectral index distribution is
very frequency-dependent and that sources with flat spectra dominate short-wavelength surveys in the same way that steep spectra dominate the long-wavelength surveys. For example, if the slope, x, of the log N - log S relation is taken as 1.5, then the ratio of flat spectra ( ~ 0) to steep spectra ( ~ - 1) sources for two surveys made at frequencies one decade apart is 101.5 ~ 32.
This change in the spectral index distribution with sample frequency should not be confused with the observed change in the index distribution when a given sample of sources is observed at different wavelengths. The brightest n sources which determine P( ) at 1 are not the same n sources which
determine Q( ) at 2. The change in spectral distribution of a given sample observed at different
wavelengths is due to spectral curvature.
Comparisons of surveys made at different wavelengths, and of the dependence of the spectral index distribution on wavelength, are in reasonable agreement with that predicted by the expressions above. This means that the full range of spectral population is represented at each observing frequency, although the relative proportion of the two spectral classes may vary considerably.
1 Since for most of the earlier known sources, the flux density decreased with wavelength, the spectral index was sometimes defined by (flux density) frequency- , so that was always a positive number. Now that indices of both signs are known to occur, the definition given in the text is being more widely used. Back.
12.4.4. Intensity Variations
Many of the compact sources show pronounced intensity variations on time scales from less than a week to a few years. There is no simple pattern to the observed variations; in particular, there is no evidence for any periodic phenomena. Rather the variations appear as bursts, first at short wavelengths, and then at longer wavelengths with reduced amplitudes, with the duration of each burst being longer at the longer wavelengths. Below some critical wavelength, the amplitude, shape, and time of occurrence of the burst are independent of wavelength. Often the duration of a single outburst is comparable to the time between outbursts so that the individual events are not resolved. Figure 12.7 shows the relatively rapid intensity variations observed at three wavelengths in the source BL Lac (VRO 42.22.01). Slower, more typical variations are found in the radio galaxy 3C 120, shown in Figure 12.8.

Figure 12.7 Variation in the radio intensity of BL Lacerte (VRO 42.22.01) observed at 2.8, 3.75, and 4.5 cm. [Taken from MacLeod, Andrew, Medd, and Olsen (1971), Astrophys. Lett. 9:19.]
Quasars and the nuclei of some galaxies also vary at optical wavelengths. Although there appears to be no detailed relation between the intensity variations seen at radio and optical wavelengths, those sources which are most active at radio frequencies are also usually prominent optical variables.
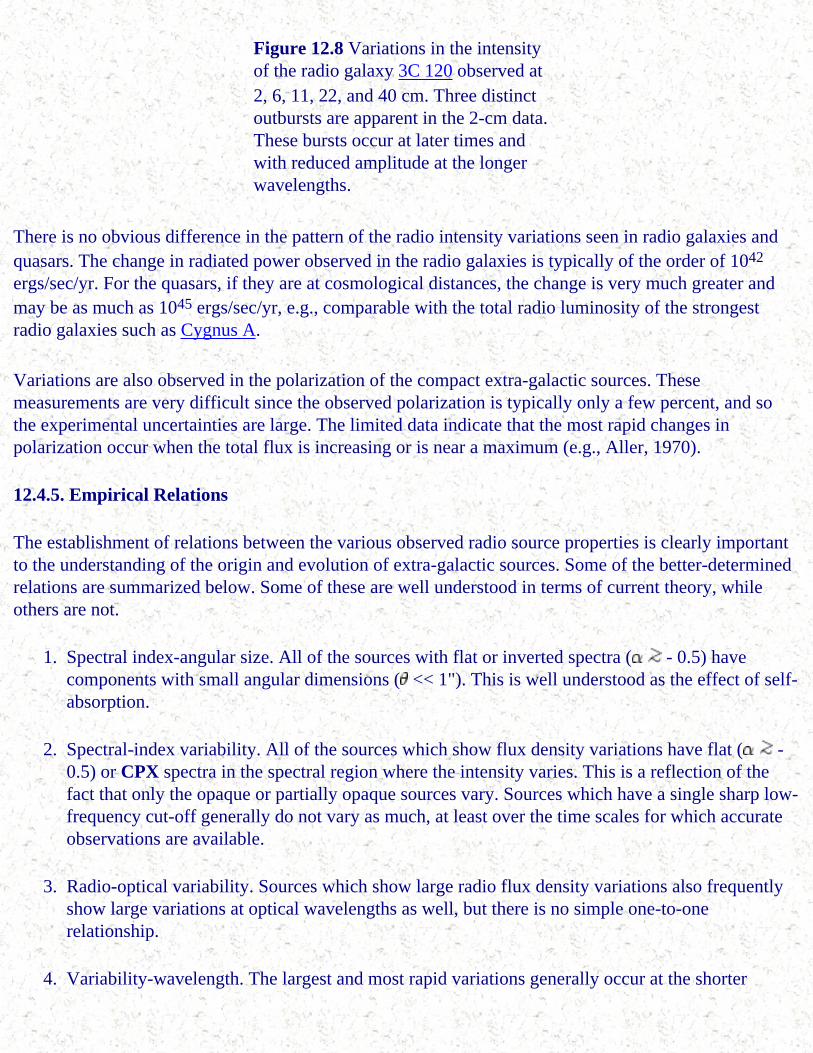
Figure 12.8 Variations in the intensity of the radio galaxy 3C 120 observed at 2, 6, 11, 22, and 40 cm. Three distinct outbursts are apparent in the 2-cm data. These bursts occur at later times and with reduced amplitude at the longer wavelengths.
There is no obvious difference in the pattern of the radio intensity variations seen in radio galaxies and quasars. The change in radiated power observed in the radio galaxies is typically of the order of 1042 ergs/sec/yr. For the quasars, if they are at cosmological distances, the change is very much greater and may be as much as 1045 ergs/sec/yr, e.g., comparable with the total radio luminosity of the strongest radio galaxies such as Cygnus A.
Variations are also observed in the polarization of the compact extra-galactic sources. These measurements are very difficult since the observed polarization is typically only a few percent, and so the experimental uncertainties are large. The limited data indicate that the most rapid changes in polarization occur when the total flux is increasing or is near a maximum (e.g., Aller, 1970).
12.4.5. Empirical Relations
The establishment of relations between the various observed radio source properties is clearly important to the understanding of the origin and evolution of extra-galactic sources. Some of the better-determined relations are summarized below. Some of these are well understood in terms of current theory, while others are not.
1. Spectral index-angular size. All of the sources with flat or inverted spectra ( - 0.5) have components with small angular dimensions ( << 1"). This is well understood as the effect of self-absorption.
2. Spectral-index variability. All of the sources which show flux density variations have flat ( - 0.5) or CPX spectra in the spectral region where the intensity varies. This is a reflection of the fact that only the opaque or partially opaque sources vary. Sources which have a single sharp low-frequency cut-off generally do not vary as much, at least over the time scales for which accurate observations are available.
3. Radio-optical variability. Sources which show large radio flux density variations also frequently show large variations at optical wavelengths as well, but there is no simple one-to-one relationship.
4. Variability-wavelength. The largest and most rapid variations generally occur at the shorter
wavelengths.
5. Spectral-index-luminosity. Among the extended transparent radio galaxies there is a tendency for the most luminous sources to have the steepest spectra (Heeschen, 1960), particularly for sources with Class S spectra. This relationship does not seem to hold, however, for the quasars which all have a very high radio luminosity.
6. Luminosity-structure. Sources with relatively simple brightness distributions are of relatively low luminosity.
7. Luminosity-brightness. Sources with a high surface brightness have a high radio luminosity. Two sequences are apparent, as shown in Figure 13.9. The apparent continuity of the quasars and radio galaxies in this Heeschen diagram, if the quasar redshifts are assumed cosmological, is often taken as evidence of the cosmological origin of the redshifts. However, if the redshifts are local, then the quasars fall in the same high brightness-low luminosity part of the diagram as the cores of E galaxies such as M87, NGC 1052, and the Seyfert galaxy nuclei, so that the argument can go either way.
8. Polarization-wavelength. For the transparent sources (Class S spectra) the observed polarization is greatest at shorter wavelengths. In the opaque sources the reverse is true.
9. Circular polarization is found only in some compact sources.
10. The greatest linear polarization is found in the sources with low surface brightness, or in low surface brightness regions of resolved sources.
11. Sources found in clusters tend to have smaller dimensions.
12. The strong radio galaxies nearly all show intense emission lines.
13. The two most rapidly varying sources, BL Lac and OJ287, appear to be quasars, but their optical spectra do not show the emission lines common to other quasars.
12.5. THEORIES OF RADIO SOURCES
Theories describing the source of energy in radio galaxies and quasars have been as numerous and varied as the authors proposing them. These theories which, in general, make no attempt to interpret the growing detailed observational data include:
1. the collisions of stars or galaxies
2. the collapse of stars, superstars, galaxies, or intergalactic matter
3. the explosion of stars, superstars, or galaxies, including chain reactions
4. matter-anti-matter annihilation, creation of matter
5. quark interactions.
In recent years, however, theoretical efforts have concentrated on interpreting the observed spectra, polarization, structure, and time variations in terms of the synchrotron hypothesis, rather than on exotic mechanisms for producing energy.
For many years nearly all of the theoretical effort in this direction was made in the Soviet Union (e.g., Ginzburg, 1951; and Shklovsky, 1952). Today, however, the synchrotron model is widely accepted, and it is to be hoped that an increased understanding of the observational material in terms of synchrotron radiation will lead to a better understanding of the source of energy. In particular, the exciting discovery by Dent in 1965 of rapid time variations in the radio emission of some quasars and galaxies has opened the possibility of observing the synchrotron emission from relativistic particles within a few months to a few years of the time they are accelerated. This offers a previously unexpected opportunity to study the source at a very early epoch and may ultimately specify the initial conditions in radio sources, and hence the source of energy.
In the remainder of this section we summarize briefly the basic results of the synchrotron theory as they apply to radio astronomy and the theory as applied to the data in an attempt to understand the origin and evolution of extra-galactic radio sources. A thorough review of the basic synchrotron process is given in the book by Pacholczyk (1970).
12.5.1. Synchrotron Radiation
A single electron of energy E spiraling in a magnetic field at ultra-relativistic velocities [(1 - v2 / c2) << 1] has its radiation concentrated in a cone of half angle ~ E / mc2. An observer sees a short burst of emission lasting only during the time, t, that the cone is pointed toward the observer. The radiation is concentrated in the high-order harmonics, = (E / mc2)2, of the classical gyrofrequency g = e B / m.
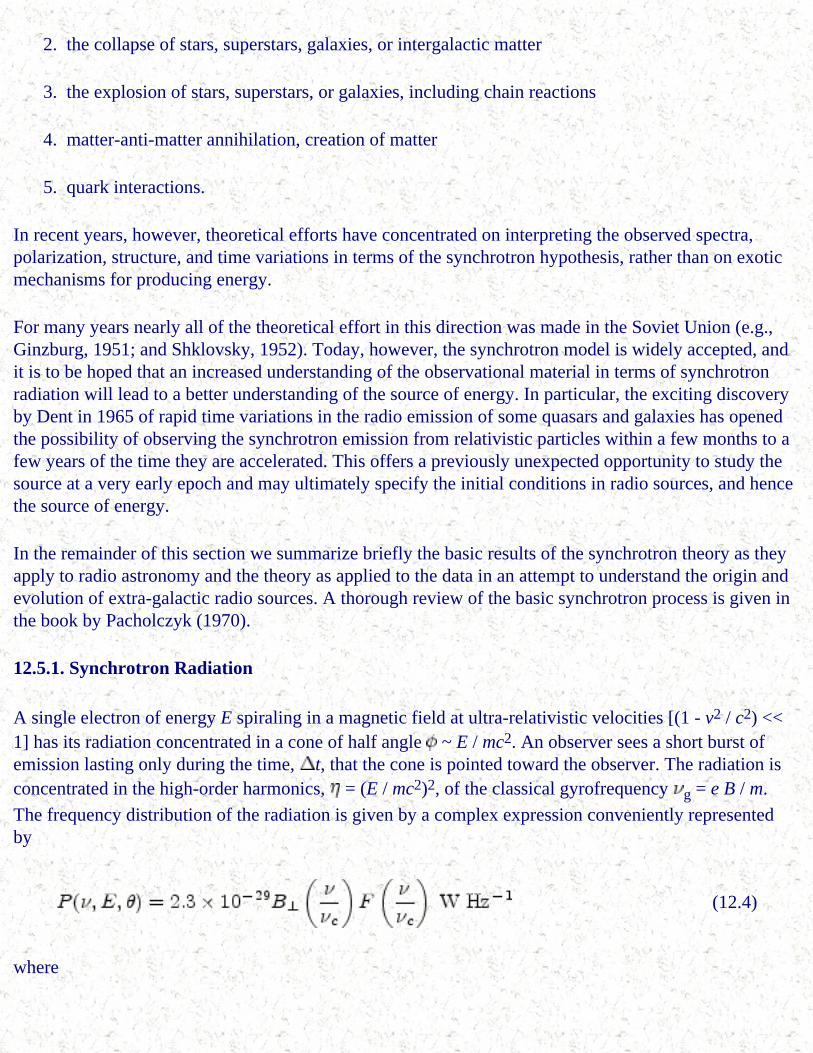
The frequency distribution of the radiation is given by a complex expression conveniently represented by
(12.4)
where
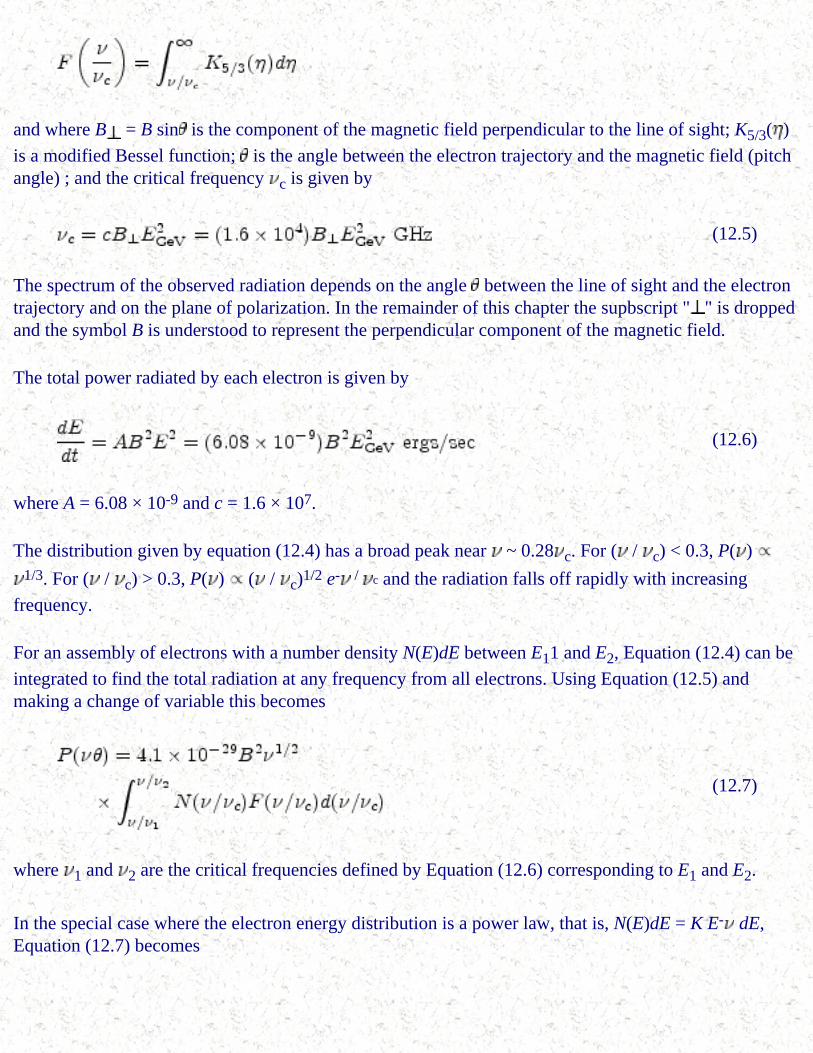
and where B = B sin is the component of the magnetic field perpendicular to the line of sight; K5/3( )
is a modified Bessel function; is the angle between the electron trajectory and the magnetic field (pitch angle) ; and the critical frequency c is given by
(12.5)
The spectrum of the observed radiation depends on the angle between the line of sight and the electron trajectory and on the plane of polarization. In the remainder of this chapter the supbscript " " is dropped and the symbol B is understood to represent the perpendicular component of the magnetic field.
The total power radiated by each electron is given by
(12.6)
where A = 6.08 × 10⁻⁹ and c = 1.6 × 10⁷.
The distribution given by equation (12.4) has a broad peak near ~ 0.28 c. For ( / c) < 0.3, P( ) 1/3. For ( / c) > 0.3, P( ) ( / c)1/2 e- / c and the radiation falls off rapidly with increasing
frequency.
For an assembly of electrons with a number density N(E)dE between E11 and E2, Equation (12.4) can be
integrated to find the total radiation at any frequency from all electrons. Using Equation (12.5) and making a change of variable this becomes
(12.7)
where 1 and 2 are the critical frequencies defined by Equation (12.6) corresponding to E1 and E2.
In the special case where the electron energy distribution is a power law, that is, N(E)dE = K E- dE, Equation (12.7) becomes

(12.8)
For 1 the major contribution to the integral is when ( / c) ~ 1 so that the limits of integration may
be extended from zero to infinity without introducing significant error. The integral is then essentially constant when 3 1 10 2. The radio spectrum then is a power law,
(12.9)
with a spectral index = - ( - 1) / 2.
It must be emphasized that this approximation is valid only when 1; and in particular that no form of energy distribution can give a spectrum that rises faster than the low-frequency asymptotic limit of
1/3 for a single electron.
As described in Section 12.4.3, many sources show nearly power law radio-frequency spectra, with a common spectral index ~ - 0.8 corresponding to an electron energy distribution index, ~ 2.6. Deviations from a constant radio spectral index may be explained as being due to (1) variations in as a function of energy which may exist either in the initial electron energy distribution or occur as a result of differential energy loss in an initial power law distribution; (2) self-absorption in the relativistic electron gas; (3) absorption in a cold HII region between us and the source; (4) the effect of a dispersive medium in which the electrons are radiating.
12.5.2. Effect of Energy Losses
Even if relativistic electrons are initially produced with a power law distribution, differential energy losses can alter the energy spectrum. Relativistic electrons lose energy by synchrotron radiation and by the inverse Compton effect, which are both proportional to the square of the energy; by ordinary bremsstrahlung and adiabatic expansion, which are directly proportional to the energy; and by ionization; which is approximately proportional to the logarithm of the energy. Approximating the logarithmic term by a constant, the rate of energy loss may be written
(12.10)
If electrons are being supplied to the source at a rate N(E, t), then the equation of continuity describing the time dependence of the energy distribution N(E, t) is
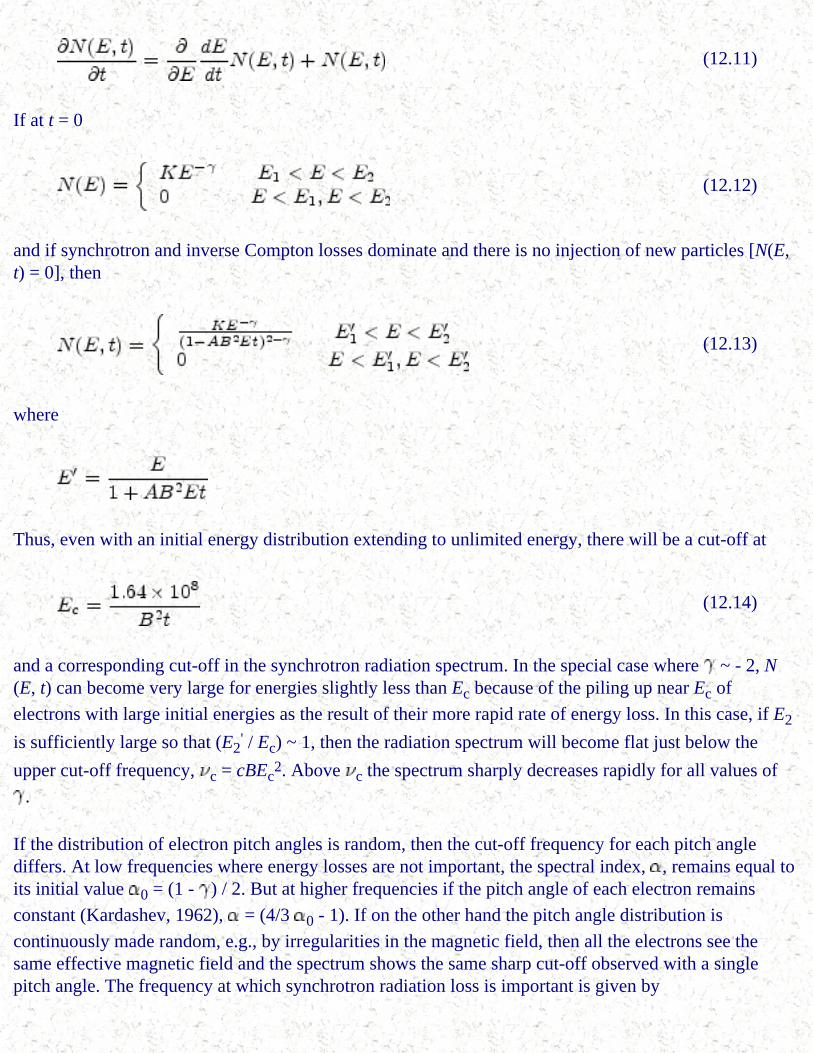
(12.11)
If at t = 0
(12.12)
and if synchrotron and inverse Compton losses dominate and there is no injection of new particles [N(E, t) = 0], then
(12.13)
where
Thus, even with an initial energy distribution extending to unlimited energy, there will be a cut-off at
(12.14)
and a corresponding cut-off in the synchrotron radiation spectrum. In the special case where ~ - 2, N(E, t) can become very large for energies slightly less than Ec because of the piling up near Ec of
electrons with large initial energies as the result of their more rapid rate of energy loss. In this case, if E2
is sufficiently large so that (E2' / Ec) ~ 1, then the radiation spectrum will become flat just below the
upper cut-off frequency, c = cBEc2. Above c the spectrum sharply decreases rapidly for all values of
.
If the distribution of electron pitch angles is random, then the cut-off frequency for each pitch angle differs. At low frequencies where energy losses are not important, the spectral index, , remains equal to its initial value 0 = (1 - ) / 2. But at higher frequencies if the pitch angle of each electron remains
constant (Kardashev, 1962), = (4/3 0 - 1). If on the other hand the pitch angle distribution is
continuously made random, e.g., by irregularities in the magnetic field, then all the electrons see the same effective magnetic field and the spectrum shows the same sharp cut-off observed with a single pitch angle. The frequency at which synchrotron radiation loss is important is given by

(12.15)
If the relativistic electrons are continuously injected with Q(E) = KE- 0, then for < b the spectral
index remains constant with = 0. But at higher frequencies where the rate of energy loss is balanced
by the injection of new particles, the equilibrium solution of Equation (12.11) with ( N / t) = 0 gives = ( 0 - 1/2).
12.5.3. Interpretation of Spectral Data
The main features of the radio spectra which must be explained by any theory of the generation of the relativistic particles are:
1. the relatively sharp concentration of the energy index near ~ 2.6
2. the extreme values of the index for the Class S spectra of ~ - 0.5 and ~ - 2.0, and the inclusion of nearly all sources in the range -0.5 > > - 1.3
3. the absence of any sharp high-frequency cut-off in the radio spectra expected from synchrotron radiation losses
4. the detailed form of the spectra of the transparent sources
5. the observed index of about -1/4 for the transparent part of the spectrum of the variable sources.
It is tempting to interpret the change in spectral index of -0.5 observed in the Class C- spectra as the effect of synchrotron radiation losses balanced by continuous injection. However, in this case we might expect that the index most commonly observed for the Class S spectra would correspond either to
1. the low-frequency asymptotic value of the C- spectra if the S spectra refer to young Radio Galaxies sources where b is greater than the maximum observed frequency
2. the high-frequency asymptotic value of the C- spectra if the S spectra refer to old sources where
b is less than the minimum observed frequency.
In fact the median value of for the S spectra of about -0.8 is intermediate between the extremes of the C- spectra, which are about -0.65 and -1.15, so the interpretation is not clear.
It is also possible that the range in spectral index observed in the C- spectra is due to partial self-absorption (see Section 12.5.5) in dense regions of the source which become opaque at relatively short
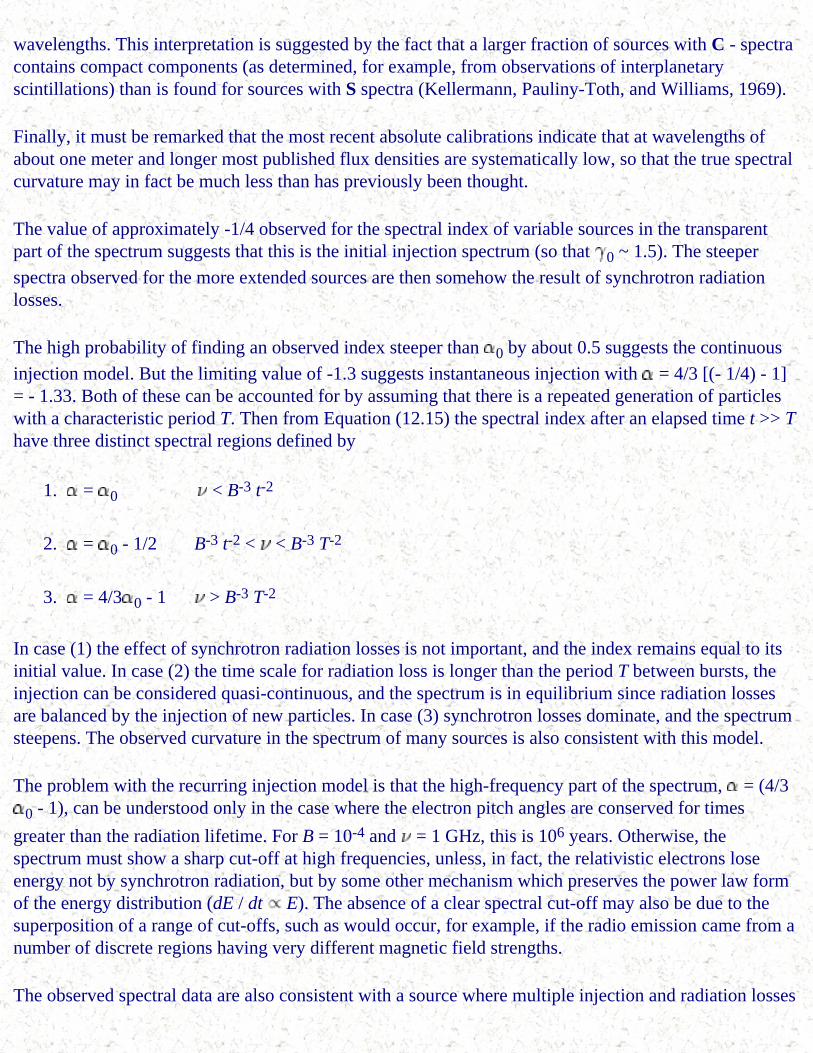
wavelengths. This interpretation is suggested by the fact that a larger fraction of sources with C - spectra contains compact components (as determined, for example, from observations of interplanetary scintillations) than is found for sources with S spectra (Kellermann, Pauliny-Toth, and Williams, 1969).
Finally, it must be remarked that the most recent absolute calibrations indicate that at wavelengths of about one meter and longer most published flux densities are systematically low, so that the true spectral curvature may in fact be much less than has previously been thought.
The value of approximately -1/4 observed for the spectral index of variable sources in the transparent part of the spectrum suggests that this is the initial injection spectrum (so that 0 ~ 1.5). The steeper
spectra observed for the more extended sources are then somehow the result of synchrotron radiation losses.
The high probability of finding an observed index steeper than 0 by about 0.5 suggests the continuous
injection model. But the limiting value of -1.3 suggests instantaneous injection with = 4/3 [(- 1/4) - 1] = - 1.33. Both of these can be accounted for by assuming that there is a repeated generation of particles with a characteristic period T. Then from Equation (12.15) the spectral index after an elapsed time t >> T have three distinct spectral regions defined by
1. = 0 < B-3 t-2
2. = 0 - 1/2 B-3 t-2 < < B-3 T-2
3. = 4/3 0 - 1 > B-3 T-2
In case (1) the effect of synchrotron radiation losses is not important, and the index remains equal to its initial value. In case (2) the time scale for radiation loss is longer than the period T between bursts, the injection can be considered quasi-continuous, and the spectrum is in equilibrium since radiation losses are balanced by the injection of new particles. In case (3) synchrotron losses dominate, and the spectrum steepens. The observed curvature in the spectrum of many sources is also consistent with this model.
The problem with the recurring injection model is that the high-frequency part of the spectrum, = (4/3
0 - 1), can be understood only in the case where the electron pitch angles are conserved for times
greater than the radiation lifetime. For B = 10-4 and = 1 GHz, this is 106 years. Otherwise, the spectrum must show a sharp cut-off at high frequencies, unless, in fact, the relativistic electrons lose energy not by synchrotron radiation, but by some other mechanism which preserves the power law form of the energy distribution (dE / dt E). The absence of a clear spectral cut-off may also be due to the superposition of a range of cut-offs, such as would occur, for example, if the radio emission came from a number of discrete regions having very different magnetic field strengths.
The observed spectral data are also consistent with a source where multiple injection and radiation losses

are important during the initial stages, but followed by a longer period of adiabatic expansion when the spectral shape is preserved. But this interpretation poses serious energy problems, as discussed in Section 12.5.7.
It will be important to determine from future observations at shorter wavelengths at what wavelength the expected spectral cut-off occurs (if anywhere) and so help to specify the mechanism or mechanisms by which the electrons lose energy, and thus place further observational constraints on the radio source lifetimes.
12.5.4. Effect of Absorption by Ionized Hydrogen
The observed radio spectrum may differ from the radiated spectrum owing to the influence of the medium between the source and the observer. If a cold cloud of ionized gas is located in front of the source, then the observed flux density will fall off sharply below the frequency, 0, where the optical
depth is unity. For an electron temperature Te,
(12.16)
where = ne dl is the emission measure, and ne the density of thermal electrons. The observed
spectrum is then
(12.17)
If the ionized medium is mixed with the synchrotron source, then for << 0
(12.18)
If the density of thermal electrons is sufficiently great, then at frequencies where the index of refraction, , becomes less than unity, the form of the spectrum will differ from that in vacuo. When < 1, the
velocity of a relativistic electron is less than the phase velocity of light in the medium; the radiation is no longer so highly concentrated along the electron trajectory, and the energy no longer appears in the high-order harmonics of the gyrofrequency. This is commonly called the Razin, or Tsytovich, effect and is important below a frequency r given by
(12.19)
For < r the spectrum cuts off very sharply (see Chapter 3).
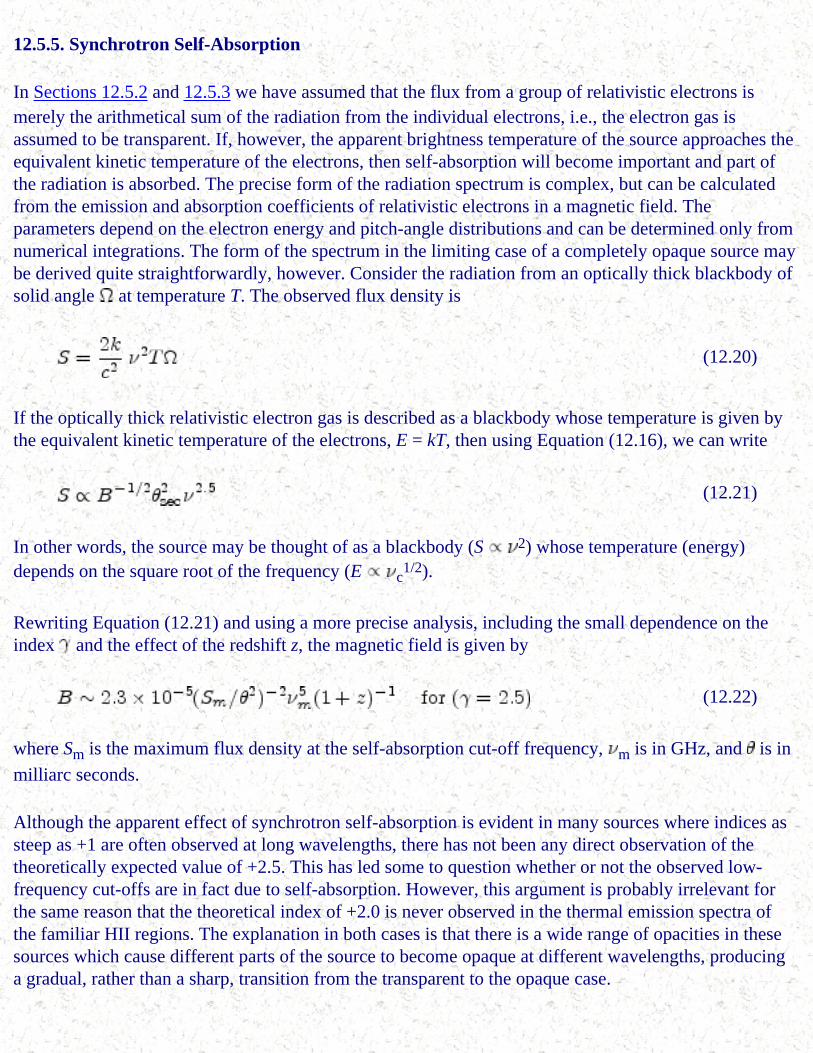
12.5.5. Synchrotron Self-Absorption
In Sections 12.5.2 and 12.5.3 we have assumed that the flux from a group of relativistic electrons is merely the arithmetical sum of the radiation from the individual electrons, i.e., the electron gas is assumed to be transparent. If, however, the apparent brightness temperature of the source approaches the equivalent kinetic temperature of the electrons, then self-absorption will become important and part of the radiation is absorbed. The precise form of the radiation spectrum is complex, but can be calculated from the emission and absorption coefficients of relativistic electrons in a magnetic field. The parameters depend on the electron energy and pitch-angle distributions and can be determined only from numerical integrations. The form of the spectrum in the limiting case of a completely opaque source may be derived quite straightforwardly, however. Consider the radiation from an optically thick blackbody of solid angle at temperature T. The observed flux density is
(12.20)
If the optically thick relativistic electron gas is described as a blackbody whose temperature is given by the equivalent kinetic temperature of the electrons, E = kT, then using Equation (12.16), we can write
(12.21)
In other words, the source may be thought of as a blackbody (S 2) whose temperature (energy) depends on the square root of the frequency (E c
1/2).
Rewriting Equation (12.21) and using a more precise analysis, including the small dependence on the index and the effect of the redshift z, the magnetic field is given by
(12.22)
where Sm is the maximum flux density at the self-absorption cut-off frequency, m is in GHz, and is in
milliarc seconds.
Although the apparent effect of synchrotron self-absorption is evident in many sources where indices as steep as +1 are often observed at long wavelengths, there has not been any direct observation of the theoretically expected value of +2.5. This has led some to question whether or not the observed low-frequency cut-offs are in fact due to self-absorption. However, this argument is probably irrelevant for the same reason that the theoretical index of +2.0 is never observed in the thermal emission spectra of the familiar HII regions. The explanation in both cases is that there is a wide range of opacities in these sources which cause different parts of the source to become opaque at different wavelengths, producing a gradual, rather than a sharp, transition from the transparent to the opaque case.
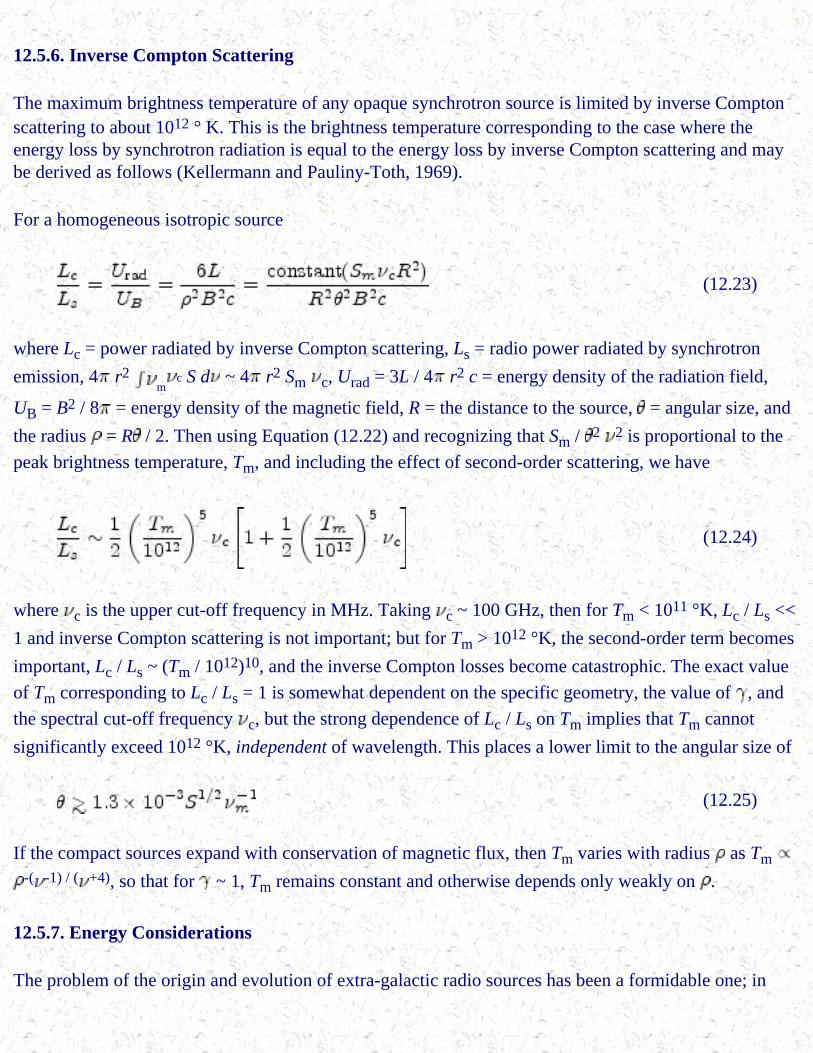
12.5.6. Inverse Compton Scattering
The maximum brightness temperature of any opaque synchrotron source is limited by inverse Compton scattering to about 1012 ° K. This is the brightness temperature corresponding to the case where the energy loss by synchrotron radiation is equal to the energy loss by inverse Compton scattering and may be derived as follows (Kellermann and Pauliny-Toth, 1969).
For a homogeneous isotropic source
(12.23)
where Lc = power radiated by inverse Compton scattering, Ls = radio power radiated by synchrotron
emission, 4 r2 m
c S d ~ 4 r2 Sm c, Urad = 3L / 4 r2 c = energy density of the radiation field,
UB = B2 / 8 = energy density of the magnetic field, R = the distance to the source, = angular size, and
the radius = R / 2. Then using Equation (12.22) and recognizing that Sm / 2 2 is proportional to the
peak brightness temperature, Tm, and including the effect of second-order scattering, we have
(12.24)
where c is the upper cut-off frequency in MHz. Taking c ~ 100 GHz, then for Tm < 1011 °K, Lc / Ls <<
1 and inverse Compton scattering is not important; but for Tm > 1012 °K, the second-order term becomes
important, Lc / Ls ~ (Tm / 1012)10, and the inverse Compton losses become catastrophic. The exact value
of Tm corresponding to Lc / Ls = 1 is somewhat dependent on the specific geometry, the value of , and
the spectral cut-off frequency c, but the strong dependence of Lc / Ls on Tm implies that Tm cannot
significantly exceed 1012 °K, independent of wavelength. This places a lower limit to the angular size of
(12.25)
If the compact sources expand with conservation of magnetic flux, then Tm varies with radius as Tm -( -1) / ( +4), so that for ~ 1, Tm remains constant and otherwise depends only weakly on .
12.5.7. Energy Considerations
The problem of the origin and evolution of extra-galactic radio sources has been a formidable one; in
particular the source of energy needed to account for the large power output and the manner in which this energy is converted to relativistic particles and magnetic flux is still a mystery. Assuming only that synchrotron radiation from ultrarelativistic electrons is responsible for the observed radiation, the necessary energy requirements may be estimated in a straight-forward way.
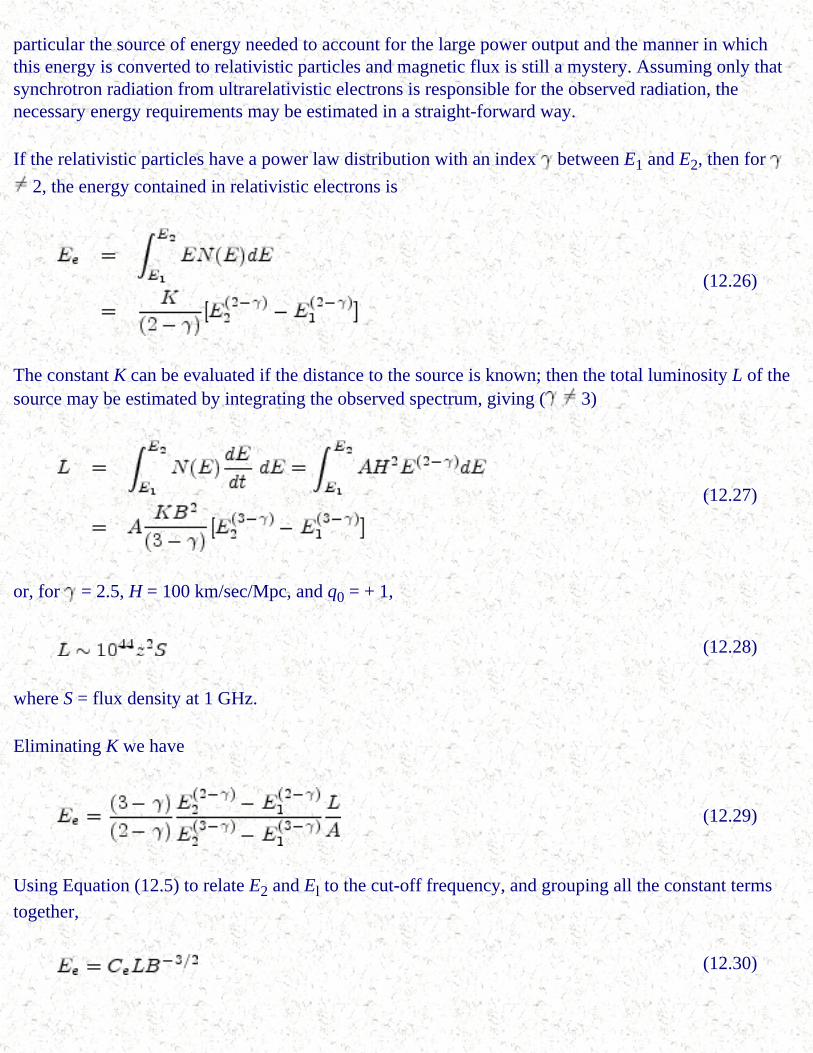
If the relativistic particles have a power law distribution with an index between E1 and E2, then for
2, the energy contained in relativistic electrons is
(12.26)
The constant K can be evaluated if the distance to the source is known; then the total luminosity L of the source may be estimated by integrating the observed spectrum, giving ( 3)
(12.27)
or, for = 2.5, H = 100 km/sec/Mpc, and q0 = + 1,
(12.28)
where S = flux density at 1 GHz.
Eliminating K we have
(12.29)
Using Equation (12.5) to relate E2 and El to the cut-off frequency, and grouping all the constant terms
together,
(12.30)

The magnetic energy is just
(12.31)
The total energy in fields and particles (Ee + Em) is minimized when
(12.32)
or when
(12.33)
The value of B estimated in this way depends almost entirely on the angular size, , and is relatively insensitive to the flux density or distance.
From Equations (12.30), (12.31), and (12.33), if is expressed in arc seconds,
(12.34)
That is, the energy is nearly equally distributed between relativistic particles and the magnetic field.
Somewhat surprisingly there is little relation between the minimum energy computed in this way and the total radio luminosity. Typically, the total energy contained in the extended sources estimated is in the range 1057 to 1061 ergs and the magnetic field between 10-5 and 10-4 gauss. It is largely because of this apparent very great energy requirement (up to 0.01% of the rest energy of an entire galaxy) that theoretical efforts to explain the origin of radio galaxies have been for the most part unsuccessful.
One interesting result is that if Ee ~ Em the total energy strongly depends on the size of the source (E
r9/7). This gives the curious situation that the larger sources with low surface brightness and low luminosity, such as Centaurus A, appear to contain almost as much energy as the smaller high surface brightness objects such as Cygnus A. This is not, of course, what would be expected if, as generally assumed, the larger sources were older; this has led to the interesting suggestion that sources may collapse rather than expand. Another way out of this situation which also reduces the energy requirements on the larger sources is that if, as recent observations suggest, sources break up into a
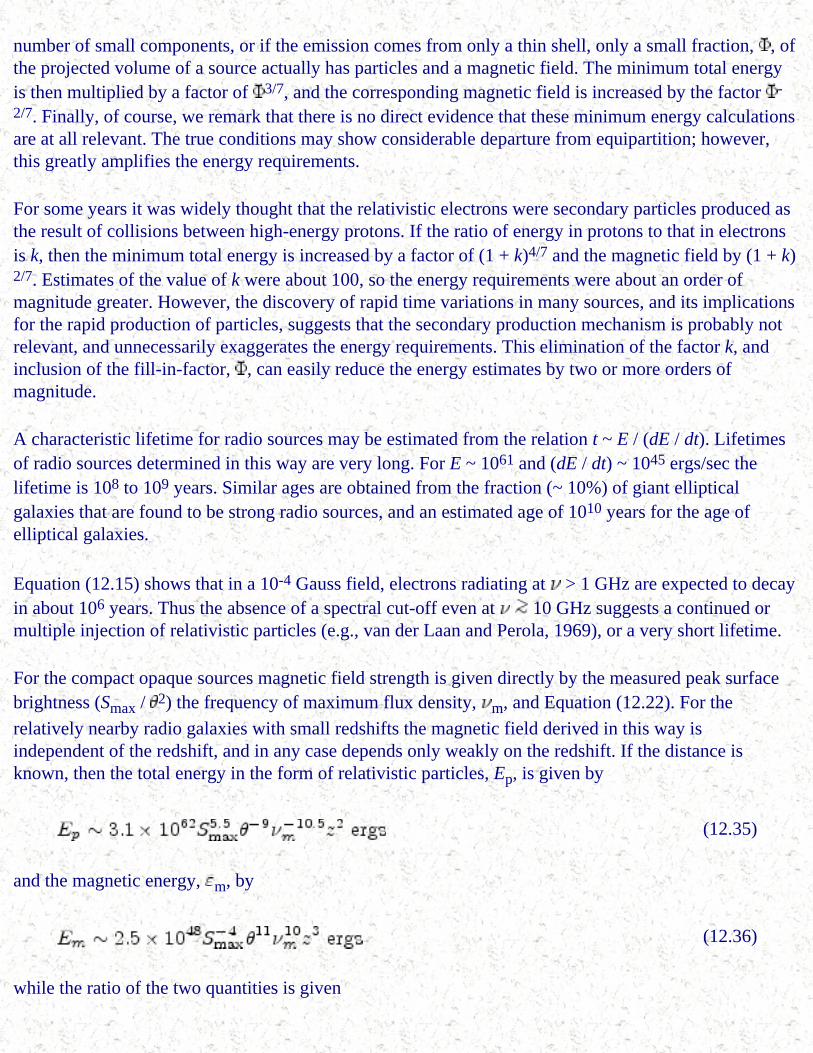
number of small components, or if the emission comes from only a thin shell, only a small fraction, , of the projected volume of a source actually has particles and a magnetic field. The minimum total energy is then multiplied by a factor of 3/7, and the corresponding magnetic field is increased by the factor -
2/7. Finally, of course, we remark that there is no direct evidence that these minimum energy calculations are at all relevant. The true conditions may show considerable departure from equipartition; however, this greatly amplifies the energy requirements.
For some years it was widely thought that the relativistic electrons were secondary particles produced as the result of collisions between high-energy protons. If the ratio of energy in protons to that in electrons is k, then the minimum total energy is increased by a factor of (1 + k)4/7 and the magnetic field by (1 + k)2/7. Estimates of the value of k were about 100, so the energy requirements were about an order of magnitude greater. However, the discovery of rapid time variations in many sources, and its implications for the rapid production of particles, suggests that the secondary production mechanism is probably not relevant, and unnecessarily exaggerates the energy requirements. This elimination of the factor k, and inclusion of the fill-in-factor, , can easily reduce the energy estimates by two or more orders of magnitude.
A characteristic lifetime for radio sources may be estimated from the relation t ~ E / (dE / dt). Lifetimes of radio sources determined in this way are very long. For E ~ 1061 and (dE / dt) ~ 1045 ergs/sec the lifetime is 108 to 109 years. Similar ages are obtained from the fraction (~ 10%) of giant elliptical galaxies that are found to be strong radio sources, and an estimated age of 1010 years for the age of elliptical galaxies.
Equation (12.15) shows that in a 10-4 Gauss field, electrons radiating at > 1 GHz are expected to decay in about 106 years. Thus the absence of a spectral cut-off even at 10 GHz suggests a continued or multiple injection of relativistic particles (e.g., van der Laan and Perola, 1969), or a very short lifetime.
For the compact opaque sources magnetic field strength is given directly by the measured peak surface brightness (Smax / 2) the frequency of maximum flux density, m, and Equation (12.22). For the
relatively nearby radio galaxies with small redshifts the magnetic field derived in this way is independent of the redshift, and in any case depends only weakly on the redshift. If the distance is known, then the total energy in the form of relativistic particles, Ep, is given by
(12.35)
and the magnetic energy, m, by
(12.36)
while the ratio of the two quantities is given

(12.37)
In Equations (12.35) to (12.37) is in milliarc seconds, S in f.u., m, in GHz, H = 100 km/sec/Mpc, and
= - 0.75.
Although the energies calculated in this way are very sensitive to the observed size and self-absorption cut-off frequencies, estimates of the energy content can be made at least for those sources where there is accurate data. For the relatively nearby compact radio galaxies, such as NGC 1275, the energy content is
~ 1052 ergs. If the compact quasars are at cosmological distances, their energies are considerably greater and are about 1055±2 ergs.
The energies derived for the compact sources are very much less than the minimum energy of the extended sources, so that a single compact source does not simply evolve by expansion into an extended source. The relation between the compact and extended sources is particularly unclear, since both the luminosity, L, and energy content, E, decrease with expansion. As discussed in Section 12.5.9, L r-2 ,
and of course E r-1. Thus, taking 100 arc sec and 0.001 are sec as dimensions of typical extended and compact sources and = - 0.75( = 2.5), upon expansion the energy and luminosity are decreased by a factor of 105 and 1025, respectively, so that even a multiple explosion of compact sources does not appear adequate to explain the extended sources.
It is clear therefore that some continuing energy supply must be available. A possible mechanism for this has been suggested by Rees (1971), who has proposed that the relativistic particles are accelerated by low-frequency electromagnetic waves generated by the release of rotational energy of collapsing stars at the galactic nucleus. The subsequent motion of the particles in the electromagnetic field then produces a "synchro-Compton" radiation, similar in many ways to the usual synchrotron emission of electrons in a magnetic field. One particular attraction for this model is that it avoids the problem of generating a large magnetic flux.
12.5.8. Polarization
The synchrotron radiation from a single electron is elliptically polarized, and the degree of polarization is a function of / c. In a uniform magnetic field the linear polarization of an ensemble of electrons
with a power law index , the polarization is perpendicular to the magnetic field in the transparent part of the spectrum and is given by
(12.38)
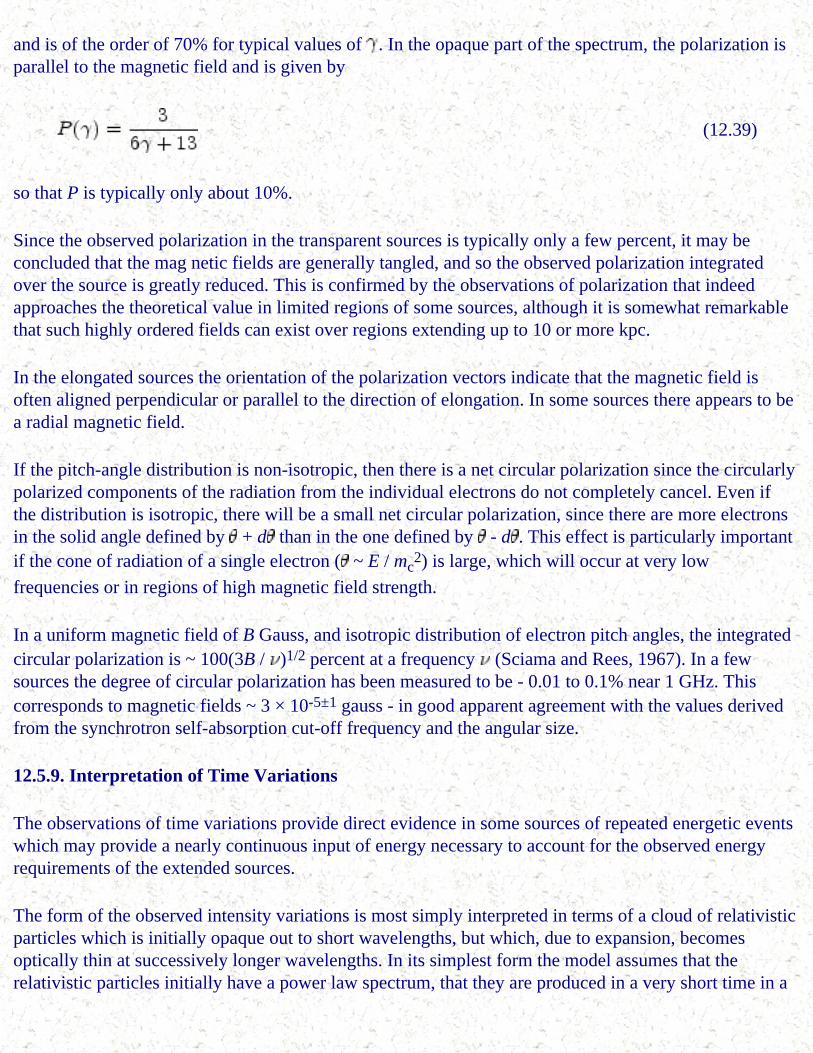
and is of the order of 70% for typical values of . In the opaque part of the spectrum, the polarization is parallel to the magnetic field and is given by
(12.39)
so that P is typically only about 10%.
Since the observed polarization in the transparent sources is typically only a few percent, it may be concluded that the mag netic fields are generally tangled, and so the observed polarization integrated over the source is greatly reduced. This is confirmed by the observations of polarization that indeed approaches the theoretical value in limited regions of some sources, although it is somewhat remarkable that such highly ordered fields can exist over regions extending up to 10 or more kpc.
In the elongated sources the orientation of the polarization vectors indicate that the magnetic field is often aligned perpendicular or parallel to the direction of elongation. In some sources there appears to be a radial magnetic field.
If the pitch-angle distribution is non-isotropic, then there is a net circular polarization since the circularly polarized components of the radiation from the individual electrons do not completely cancel. Even if the distribution is isotropic, there will be a small net circular polarization, since there are more electrons in the solid angle defined by + d than in the one defined by - d . This effect is particularly important if the cone of radiation of a single electron ( ~ E / mc
2) is large, which will occur at very low
frequencies or in regions of high magnetic field strength.
In a uniform magnetic field of B Gauss, and isotropic distribution of electron pitch angles, the integrated circular polarization is ~ 100(3B / )1/2 percent at a frequency (Sciama and Rees, 1967). In a few sources the degree of circular polarization has been measured to be - 0.01 to 0.1% near 1 GHz. This corresponds to magnetic fields ~ 3 × 10⁻⁵±1 gauss - in good apparent agreement with the values derived from the synchrotron self-absorption cut-off frequency and the angular size.
12.5.9. Interpretation of Time Variations
The observations of time variations provide direct evidence in some sources of repeated energetic events which may provide a nearly continuous input of energy necessary to account for the observed energy requirements of the extended sources.
The form of the observed intensity variations is most simply interpreted in terms of a cloud of relativistic particles which is initially opaque out to short wavelengths, but which, due to expansion, becomes optically thin at successively longer wavelengths. In its simplest form the model assumes that the relativistic particles initially have a power law spectrum, that they are produced in a very short time in a
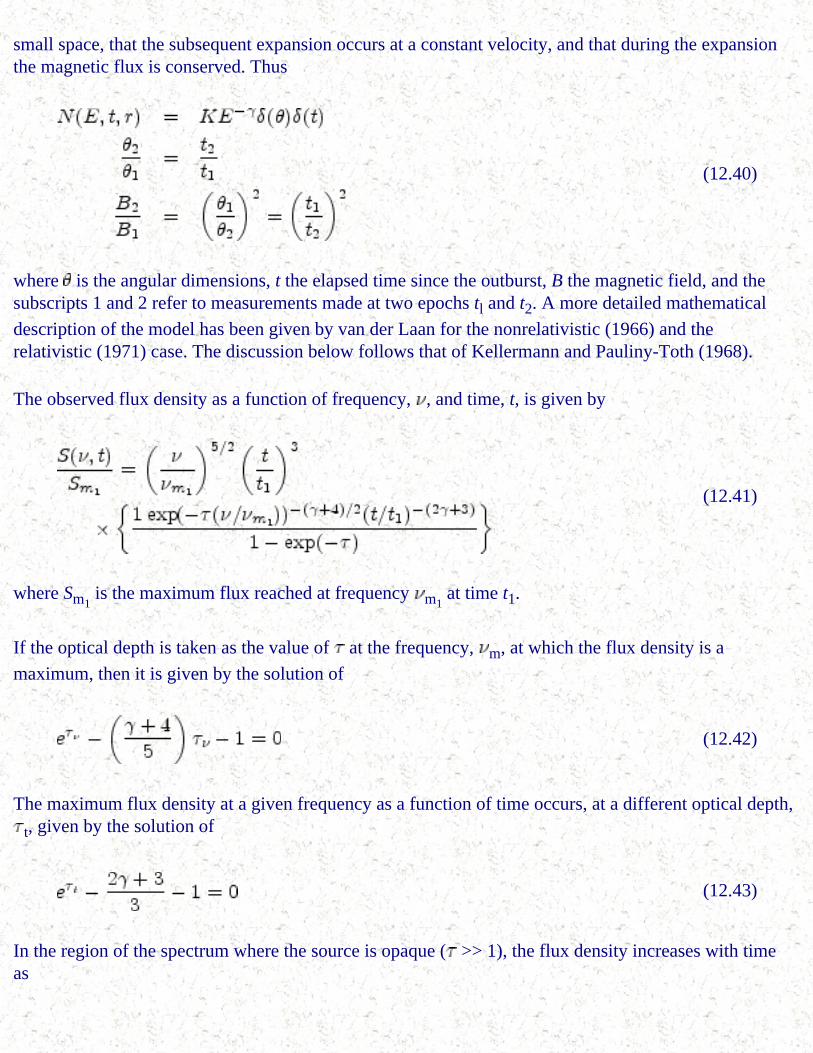
small space, that the subsequent expansion occurs at a constant velocity, and that during the expansion the magnetic flux is conserved. Thus
(12.40)
where is the angular dimensions, t the elapsed time since the outburst, B the magnetic field, and the subscripts 1 and 2 refer to measurements made at two epochs tl and t2. A more detailed mathematical
description of the model has been given by van der Laan for the nonrelativistic (1966) and the relativistic (1971) case. The discussion below follows that of Kellermann and Pauliny-Toth (1968).
The observed flux density as a function of frequency, , and time, t, is given by
(12.41)
where Sm1 is the maximum flux reached at frequency m1
at time t1.
If the optical depth is taken as the value of at the frequency, m, at which the flux density is a
maximum, then it is given by the solution of
(12.42)
The maximum flux density at a given frequency as a function of time occurs, at a different optical depth,
t, given by the solution of
(12.43)
In the region of the spectrum where the source is opaque ( >> 1), the flux density increases with time as
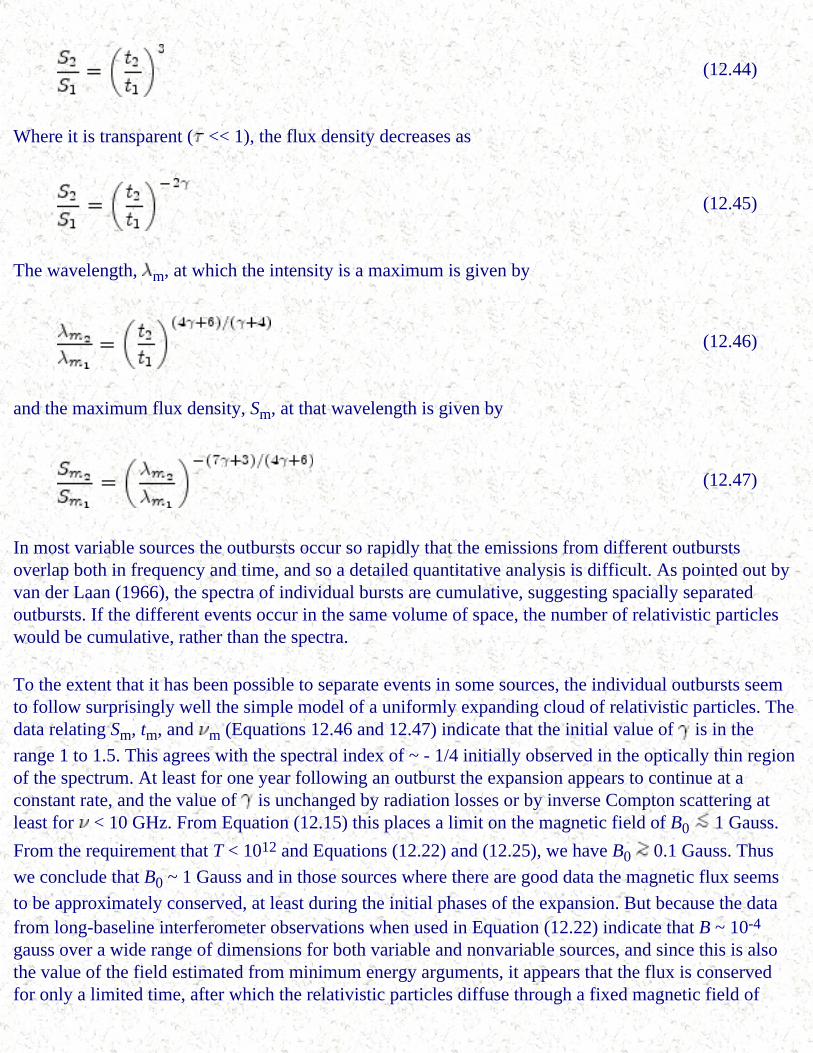
(12.44)
Where it is transparent ( << 1), the flux density decreases as
(12.45)
The wavelength, m, at which the intensity is a maximum is given by
(12.46)
and the maximum flux density, Sm, at that wavelength is given by
(12.47)
In most variable sources the outbursts occur so rapidly that the emissions from different outbursts overlap both in frequency and time, and so a detailed quantitative analysis is difficult. As pointed out by van der Laan (1966), the spectra of individual bursts are cumulative, suggesting spacially separated outbursts. If the different events occur in the same volume of space, the number of relativistic particles would be cumulative, rather than the spectra.
To the extent that it has been possible to separate events in some sources, the individual outbursts seem to follow surprisingly well the simple model of a uniformly expanding cloud of relativistic particles. The data relating Sm, tm, and m (Equations 12.46 and 12.47) indicate that the initial value of is in the
range 1 to 1.5. This agrees with the spectral index of ~ - 1/4 initially observed in the optically thin region of the spectrum. At least for one year following an outburst the expansion appears to continue at a constant rate, and the value of is unchanged by radiation losses or by inverse Compton scattering at least for < 10 GHz. From Equation (12.15) this places a limit on the magnetic field of B0 1 Gauss.
From the requirement that T < 1012 and Equations (12.22) and (12.25), we have B0 0.1 Gauss. Thus
we conclude that B0 ~ 1 Gauss and in those sources where there are good data the magnetic flux seems
to be approximately conserved, at least during the initial phases of the expansion. But because the data from long-baseline interferometer observations when used in Equation (12.22) indicate that B ~ 10-4 gauss over a wide range of dimensions for both variable and nonvariable sources, and since this is also the value of the field estimated from minimum energy arguments, it appears that the flux is conserved for only a limited time, after which the relativistic particles diffuse through a fixed magnetic field of

about 10-4 Gauss. In this way many repeated outbursts may provide the particles in the extended sources, although as explained earlier, this presents formidable energy problems unless energy is continuously supplied.
In the case of the variable radio galaxies, whose distance can be determined from their redshift, the initial dimensions appear to be well under one light year and the initial particle energy in a single outburst about 1052 ergs. Repeated explosions over a period of 108 years at a rate of one per year are required to account for the minimum total energy in the extended sources, but even this falls short by a factor of about 105 if account is taken of energy lost during the expansion.
The direct measurement of the angular size and expansion rate of variable sources using long-baseline interferometry is now possible, and can be used to determine uniquely the magnetic field (Equation 12.18), and when the distance is known the total energy involved in each outburst (Equations 12.25 and 12.27).
The model of a uniform isotropic homogeneous instantaneously generated sphere of relativistic electrons, which expands with a uniform and constant velocity, where magnetic flux is conserved, and where the only energy loss is due to expansion, is mathematically simple. Clearly, such sources are not expected to exist in the real world, and it is indeed remarkable that the observed variations follow even approximately the predicted variations. A more realistic model must take into account nonconstant expansion rates, the nonconservation of magnetic flux, changes in , the finite acceleration time for the relativistic particles, and the initial finite dimensions. But these are relatively minor modifications, and the observed departures from the predictions of the simple model should not, as is sometimes done, be used to infer that the general class of expanding source models is not relevant to the variable source phenomena. Rather the departures from the simple mathematical model can be used to derive further information about the nature of the source.
In the case of the continued production of relativistic particles, or where the initial volume of the source is not infinitely small, the initial spectrum is not opaque out to very short wavelengths, and the source is always transparent at frequencies higher than some critical frequency, 0. In the transparent region of
the spectrum the flux variations occur simultaneously and reflect only the rate of particle production and/or decay due to synchrotron and inverse Compton radiation.
The experimental determination of 0 may be used to estimate the initial size of the source.
Characteristically 0 ~ 10 to 30 GHz, corresponding to initial dimensions of about 10-3 are second for B
~ 1 Gauss. For typical radio sources with 0.1 < z < 1, the initial size derived in this way is from 1 to 10 light years. This is roughly consistent with the direct determination of the angular sizes made by long-baseline interferometry, but it must be emphasized that so far these measurements have not been made in sufficient detail to permit a detailed comparison, or to estimate from Equation (12.21) the initial magnetic field.
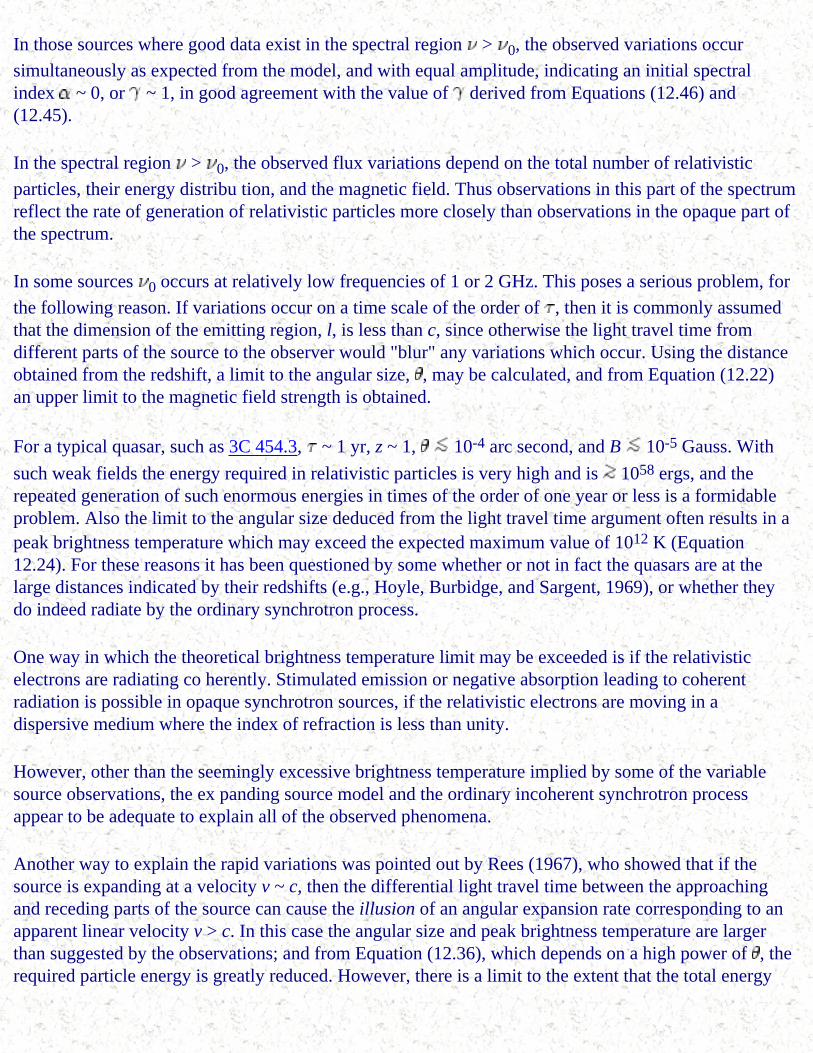
In those sources where good data exist in the spectral region > 0, the observed variations occur
simultaneously as expected from the model, and with equal amplitude, indicating an initial spectral index ~ 0, or ~ 1, in good agreement with the value of derived from Equations (12.46) and (12.45).
In the spectral region > 0, the observed flux variations depend on the total number of relativistic
particles, their energy distribu tion, and the magnetic field. Thus observations in this part of the spectrum reflect the rate of generation of relativistic particles more closely than observations in the opaque part of the spectrum.
In some sources 0 occurs at relatively low frequencies of 1 or 2 GHz. This poses a serious problem, for
the following reason. If variations occur on a time scale of the order of , then it is commonly assumed that the dimension of the emitting region, l, is less than c, since otherwise the light travel time from different parts of the source to the observer would "blur" any variations which occur. Using the distance obtained from the redshift, a limit to the angular size, , may be calculated, and from Equation (12.22) an upper limit to the magnetic field strength is obtained.
For a typical quasar, such as 3C 454.3, ~ 1 yr, z ~ 1, 10-4 arc second, and B 10-5 Gauss. With
such weak fields the energy required in relativistic particles is very high and is 1058 ergs, and the repeated generation of such enormous energies in times of the order of one year or less is a formidable problem. Also the limit to the angular size deduced from the light travel time argument often results in a peak brightness temperature which may exceed the expected maximum value of 1012 K (Equation 12.24). For these reasons it has been questioned by some whether or not in fact the quasars are at the large distances indicated by their redshifts (e.g., Hoyle, Burbidge, and Sargent, 1969), or whether they do indeed radiate by the ordinary synchrotron process.
One way in which the theoretical brightness temperature limit may be exceeded is if the relativistic electrons are radiating co herently. Stimulated emission or negative absorption leading to coherent radiation is possible in opaque synchrotron sources, if the relativistic electrons are moving in a dispersive medium where the index of refraction is less than unity.
However, other than the seemingly excessive brightness temperature implied by some of the variable source observations, the ex panding source model and the ordinary incoherent synchrotron process appear to be adequate to explain all of the observed phenomena.
Another way to explain the rapid variations was pointed out by Rees (1967), who showed that if the source is expanding at a velocity v ~ c, then the differential light travel time between the approaching and receding parts of the source can cause the illusion of an angular expansion rate corresponding to an apparent linear velocity v > c. In this case the angular size and peak brightness temperature are larger than suggested by the observations; and from Equation (12.36), which depends on a high power of , the required particle energy is greatly reduced. However, there is a limit to the extent that the total energy
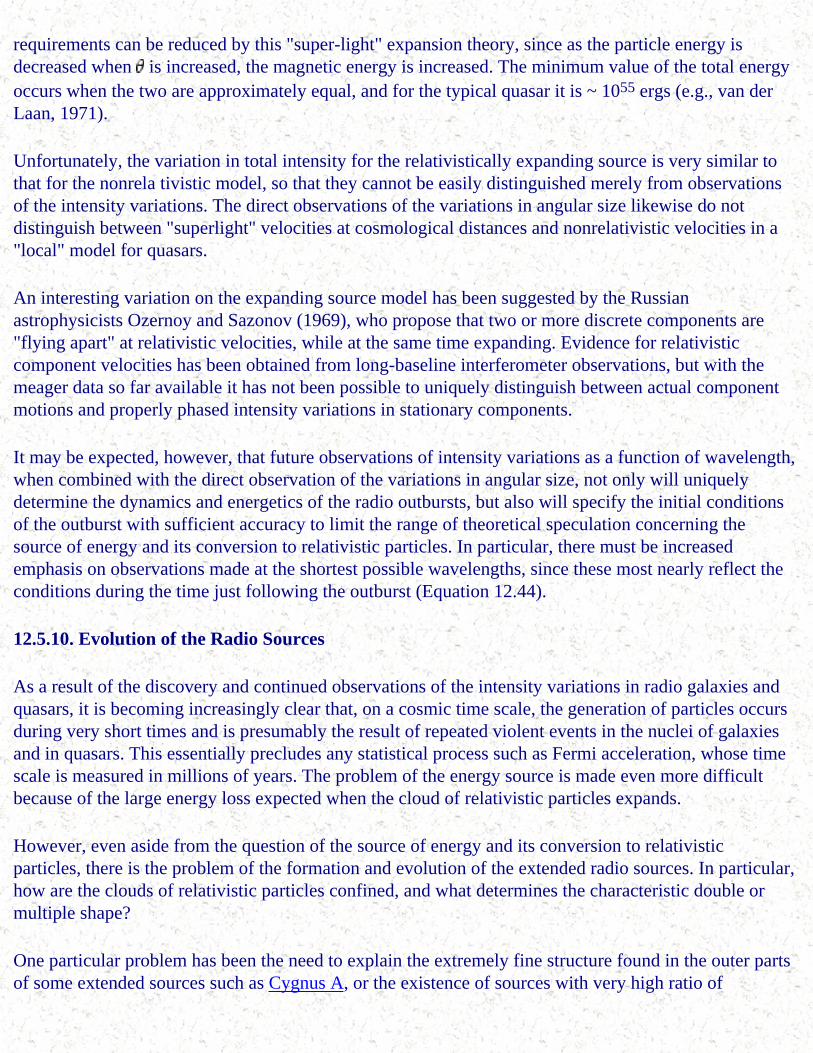
requirements can be reduced by this "super-light" expansion theory, since as the particle energy is decreased when is increased, the magnetic energy is increased. The minimum value of the total energy occurs when the two are approximately equal, and for the typical quasar it is ~ 1055 ergs (e.g., van der Laan, 1971).
Unfortunately, the variation in total intensity for the relativistically expanding source is very similar to that for the nonrela tivistic model, so that they cannot be easily distinguished merely from observations of the intensity variations. The direct observations of the variations in angular size likewise do not distinguish between "superlight" velocities at cosmological distances and nonrelativistic velocities in a "local" model for quasars.
An interesting variation on the expanding source model has been suggested by the Russian astrophysicists Ozernoy and Sazonov (1969), who propose that two or more discrete components are "flying apart" at relativistic velocities, while at the same time expanding. Evidence for relativistic component velocities has been obtained from long-baseline interferometer observations, but with the meager data so far available it has not been possible to uniquely distinguish between actual component motions and properly phased intensity variations in stationary components.
It may be expected, however, that future observations of intensity variations as a function of wavelength, when combined with the direct observation of the variations in angular size, not only will uniquely determine the dynamics and energetics of the radio outbursts, but also will specify the initial conditions of the outburst with sufficient accuracy to limit the range of theoretical speculation concerning the source of energy and its conversion to relativistic particles. In particular, there must be increased emphasis on observations made at the shortest possible wavelengths, since these most nearly reflect the conditions during the time just following the outburst (Equation 12.44).
12.5.10. Evolution of the Radio Sources
As a result of the discovery and continued observations of the intensity variations in radio galaxies and quasars, it is becoming increasingly clear that, on a cosmic time scale, the generation of particles occurs during very short times and is presumably the result of repeated violent events in the nuclei of galaxies and in quasars. This essentially precludes any statistical process such as Fermi acceleration, whose time scale is measured in millions of years. The problem of the energy source is made even more difficult because of the large energy loss expected when the cloud of relativistic particles expands.
However, even aside from the question of the source of energy and its conversion to relativistic particles, there is the problem of the formation and evolution of the extended radio sources. In particular, how are the clouds of relativistic particles confined, and what determines the characteristic double or multiple shape?
One particular problem has been the need to explain the extremely fine structure found in the outer parts of some extended sources such as Cygnus A, or the existence of sources with very high ratio of

component separation to component size. If there is a cold dense plasma to contain the relativistic particles, then the minimum energy requirements are magnified as a result of the necessary increase in the kinetic energy. On the other hand, the initial presence of a large kinetic energy may provide a source of continuous energy input to balance that lost by expansion. However, it is difficult to see any easy way for the kinetic energy of the cold plasma to be transformed into energy accelerating the relativistic particles.
One interesting suggestion has been that rather than accelerating the relativistic particles themselves, the galactic nuclei and quasars expel massive coherent bodies which then explode at some distance from the origin and produce the particles in situ (e.g., Burbidge, 1972). But there is no experimental evidence that this occurs since all of the observed very compact opaque sources, and all of the variable sources, are coincident with quasars or nuclei. Thus, it appears that unless the number of coherent ejections is large (N > 1000) so that individual events are not seen, the relativistic particles in each source are in fact generated at a common point and diffuse out to form two or more extended clouds of particles. It has therefore been widely assumed that the individual components are confined by the inter-galactic gas or intergalactic magnetic fields.
The density of any intergalactic gas deduced from measurements of the X-ray background is too small for confinement by static pressure, but De Young and Axford (1967) have suggested that the internal pressure of the ejected "plasmons" can be balanced by the ram pressure of the inter-galactic gas. Wardle (1971) has noted that the ram pressure model provided a natural explanation for the power-surface brightness diagram discussed by Heeschen (1966). The required expansion velocities are 5 to 10 that of light, so that the characteristic ages are only 105 to 106 years. This is much less than deduced from the energy arguments (see Section 12.5.7). This shorter time scale would also make it easier to understand the lack of any high-frequency cut-off in the radio source spectra discussed in Section 12.5.3.
Since the density of any intergalactic gas is expected to vary as (1 + z)3, this model also provides a natural explanation for the small size found by Miley (1971) for double radio sources at large redshifts. The presence of extended tails observed for several radio galaxies (Miley et al., 1972) is also predicted by the model (De Young, 1971). The rather sharp outer boundaries found in many of the resolved sources lend support to the ram pressure model, although the required gas density or magnetic field strengths are uncomfortably large (e.g., Burbidge, 1972). However, the possibility of sufficient gas being present in clusters or being ejected from the galaxy itself does not seem unlikely, and the observation that double radio sources found in clusters tend to be smaller than those not in clusters provides indirect evidence for intergalactic matter in clusters (De Young, 1972).
A model describing the evolution of double radio sources has been developed by Ryle and Longair (1967). They explain the ratio of observed intensity and separation from the parent object as the effect of the differential light travel time and other relativistic effects on two identical objects expanding with highly relativistic velocities.
12.6. SUMMARY
There is convincing quantitative evidence that all of the extra-galactic radio sources radiate by the commonly accepted incoherent synchrotron process, or a mathematically similar mechanism such as synchro-Compton radiation. This includes:
1. The shapes of the spectra of the extended (transparent) sources are power law or dual power, and their detailed shapes are in agreement with synchrotron models where the relativistic particles both gain and lose energy.
2. In the compact sources the spectral peak occurs at shorter wavelengths in the smaller sources, as predicted by the synchrotron model, and the measured angular sizes are in good agreement with those estimated from the observed self-absorption cut-off wavelength.
3. The maximum observed brightness temperature is ~ 1012 °K, as is expected from an incoherent synchrotron source, which is "cooled" by inverse Compton scattering.
4. The variations in intensity and polarization and their dependence on wavelength and time are in good agreement with those expected from an expanding cloud of relativistic particles.
The outstanding problems in the understanding of the radio galaxies and quasars are:
1. the source of energy and its conversion to relativistic particles
2. the connection, if any, between the compact opaque sources and the extended transparent one
3. the evolution and confinement of the extended sources.
The third and possibly the second problem present challenging complex problems in magneto-hydrodynamics and plasma physics, while the first may well require fundamentally new physics before it can be understood.
REFERENCES
1. Aller, H. D. 1970. Astrophys. J. 161:19. 2. Baade, W., and R. Minkowski. 1954. Astrophys. J. 119:206. 3. Bennett, A. 1962. Monthly Notices Roy. Astron. Soc. 68:165. 4. Bolton, J. G., G. Stanley, and B. Slee. 1949. Nature 164:101. 5. Burbidge, G. 1972. Proc. I. A. U. Symposium No. 44, D. S. Evans, ed. New York: Springer-
Verlag, p. 492. 6. Cameron, M. J. 1969. Proc. Astron. Soc. Australia, Vol. 1, p. 229. 7. Cohen, M. 1969. Ann. Rev. Astron. Astrophys. 7:619.
8. Cohen, E. J. Gundermann, and D. E. Harris. 1967. Astrophys. J. 150:767. 9. De Young, D. S. 1971. Astrophys. J. 167:541.
10. De Young, D. S. 1972. Astrophys. J. 173:L7. 11. De Young, D. S., and W. I. Axford. 1967. Nature 216:129. 12. Dixon, R. S. 1970. Astrophys. J. Suppl. 20:1. 13. Edge, D. O., J. R. Shakeshaft, W. B. McAdam, J. E. Baldwin, and S. Archer. 1960. Mem. Roy.
Astron. Soc. 68:37. 14. Fomalont, E. 1969. Astrophys. J. 157:1027. 15. Fomalont, E. 1973. Astrophys. Lett. 12:187. 16. Gardner, F. F., and W. B. Whiteoak. 1971. Australian J. Phys. 24:899. 17. Ginzburg, V. L. 1951. Dokl. Acad. Nauk 29:418. 18. Ginzburg, V. L., and S. I. Syrovotskii. 1964. The Origin of Cosmic Rays. New York: Pergamon
Press. 19. Heeschen, D. S. 1960. Publ. Astron. Soc. Pacific 72:368. 20. Heeschen, D. S. 1966. Astrophys. J. 146:517. 21. Heeschen, D. S. 1970. Astrophys. Lett. 6:49. 22. von Hoerner, S. 1964. Astrophys. J. 140:65. 23. Hoyle, F., G. Burbidge, and W. L. Sargent. 1969. Nature 209:751. 24. Kardashev, N. 1962. Astron. Zh. 39:393. English trans. Soviet Astron. 6:317. 25. Kellermann, K. I., and I. I. K. Pauliny-Toth. 1968. Ann. Rev. Astron. Astrophys. 6:417. 26. Kellermann, K. I., and I. I. K. Pauliny-Toth. 1969. Astrophys. J. 155:L71. 27. Kellermann, K. I., I. I. K. Pauliny-Toth, and P. J. Williams. 1969. Astrophys. J. 157:1. 28. Little, L. T., and A. Hewish. 1966. Monthly Notices Roy. Astron. Soc. 134:221. 29. Macdonald, G. H., S. Kenderdine, and A. C. Neville. 1968. Monthly Notices Roy. Astron. Soc.
138:259. 30. MacLeod, J. M., B. H. Andrew, W. J. Medd, and E. J. Olsen. 1971. Astrophys. Lett. 9:19. 31. Matthews, T., W. Morgan, and M. Schmidt. 1964. Astrophys. J. 140: 35. 32. Miley, G. K. 1971. Monthly Notices Roy. Astron. Soc. 152:477. 33. Miley, G. K., and C. M. Wade. 1971. Astrophys. Lett. 8:11. 34. Miley, G. K., G. C. Perola, P. C. van der Kruit, and H. van der Laan. 1972. Nature 237: 269. 35. Mitton, S., and M. Ryle. 1969. Monthly Notices Roy. Astron. Soc. 146:221. 36. Morgan, W. W. 1972. Proc. I.A.U. Symposium No. 44. D. S. Evans, ed. New York: Springer-
Verlag, p. 97. 37. Ozernoy, L. M., and V. N. Sazonov. 1969. Astrophys. Space Sci. 3:395. 38. Pacholczyk, A. 1970. Radio Astrophysics. San Francisco: Freeman and Co. 39. Rees, M. 1967. Monthly Notices Roy. Astron. Soc. 135:345. 40. Rees, M. 1971. Nature 229:312. 41. Rogstad, P., and R. Ekers. 1969. Astrophys. J. 157:481. 42. Ryle, M., and M. Longair. 1967. Monthly Notices Roy. Astron. Soc. 136:123.

43. Scheuer, P. A. G. 1962. Australian J. Phys. 15:333. 44. Sciama, D. W., and M. J. Rees. 1967. Nature 216:147. 45. Shklovsky, I. S. 1952. Astron. Zh. 29:418. 46. van der Kruit, P. C. 1971. Astron. Astrophys. 15:110. 47. van der Laan, H. 1966. Nature 211:1131. 48. van der Laan, H. 1971. Nuclei of Galaxies. D. J. K. O'Connell, ed. Amsterdam: North Holland. 49. van der Laan, H. and G. C. Perola. 1969. Astron. Astrophys. 3:468. 50. Wardle, J. 1971. Astrophys. Lett. 8:221.
General Bibliography
Annual Review Articles
1. A. T. Moffet. "The Structure of Radio Galaxies," Ann. Rev. Astron. Astrophys. 4:145, 1966.
2. E. M. Burbidge. "Quasi-Stellar Objects," Ann. Rev. Astron. Astrophys. 5:399, 1967.
3. P. A. G. Scheuer, and P. J. S. Williams. "Radio Spectra," Ann. Rev. Astron. Astrophys. 6: 321, 1968.
4. K. I. Kellermann, and 1. 1. K. Pauliny-Toth. "Variable Radio Sources," Ann. Rev. Astron. Astrophys. 6:417, 1968.
5. M. Schmidt. "Quasi- Stellar Objects," Ann. Rev. Astron. Astrophys. 7:527, 1969.
6. M. H. Cohen. "High-Resolution Observations of Radio Sources," Ann. Rev. Astron. Astrophys. 7:619, 1969.
7. G. R. Burbidge. "The Nuclei of Galaxies," Ann. Rev. Astron. Astrophys. 8:369, 1970.
Book
1. G. R. Burbidge, and E. M. Burbidge. Quasi-Stellar Objects. New York: Freeman. 1967.
Symposia Proceedings
1. I. Robinson, A. Schild, and E. L. Schiicking, eds. "Quasi Stellar Sources and Gravitational
Collapse." Proceedings of the First Texas Symposium on Relativistic Astrophysics. Chicago: University of Chicago Press. 1965.
2. K. N. Douglas, I. Robinson, A. Schild, E. L. Schücking, J. A. Wheeler, and N. J. Woolf, eds. "Quasars and High-Energy Astronomy." Proceedings of the Second Texas Symposium on Relativistic Astrophysics. New York: Gordon and Breach. 1969.
3. D. J. K. O'Connell, ed. Nuclei of Galaxies. Amsterdam; North Holland. 1971.
4. D. S. Evans, ed. 1972. "External Galaxies and Quasi-Stellar Objects." Proc. I.A.U. Symposium 44.


![Active Galaxies And Quasars![1]](https://img.pdfslide.us/doc/110x75/554e791ab4c90545698b4e80/active-galaxies-and-quasars1.jpg)