Embed Size (px)
Citation preview
Atmos. Chem. Phys., 14, 1299–1321, 2014www.atmos-chem-phys.net/14/1299/2014/doi:10.5194/acp-14-1299-2014© Author(s) 2014. CC Attribution 3.0 License.
Atmospheric Chemistry
and PhysicsO
pen Access
Radical chemistry at night: comparisons between observed andmodelled HOx, NO3 and N2O5 during the RONOCO project
D. Stone1, M. J. Evans2,3, H. Walker1, T. Ingham1,4, S. Vaughan1, B. Ouyang5, O. J. Kennedy5, M. W. McLeod5,R. L. Jones5, J. Hopkins2,3, S. Punjabi3, R. Lidster3, J. F. Hamilton2,3, J. D. Lee2,3, A. C. Lewis2,3, L. J. Carpenter2,3,G. Forster6, D. E. Oram6,7, C. E. Reeves6,7, S. Bauguitte8, W. Morgan9,10, H. Coe9,10, E. Aruffo 11,12,C. Dari-Salisburgo11, F. Giammaria12, P. Di Carlo11,12, and D. E. Heard1,4
1School of Chemistry, University of Leeds, Leeds, UK2National Centre for Atmospheric Science, University of York, York, UK3Department of Chemistry, University of York, York, UK4National Centre for Atmospheric Science, University of Leeds, Leeds, UK5Department of Chemistry, University of Cambridge, Cambridgeshire, UK6School of Environmental Sciences, University of East Anglia, Norwich, UK7National Centre for Atmospheric Science, University of East Anglia, Norwich, UK8Facility for Airborne Atmospheric Measurements, Bedfordshire, UK9School of Earth Atmospheric and Environmental Science, University of Manchester, Manchester, UK10National Centre for Atmospheric Science, University of Manchester, Manchester, UK11Center of Excellence CETEMPS Universita’ degli studi di L’Aquila, L’Aquila, Italy12Dipartimento di Fisica, Universita’ degli studi di L’Aquila, L’Aquila, Italy
Correspondence to:D. Stone ([email protected])
Received: 26 March 2013 – Published in Atmos. Chem. Phys. Discuss.: 11 April 2013Revised: 9 December 2013 – Accepted: 10 December 2013 – Published: 5 February 2014
Abstract. The RONOCO (ROle of Nighttime chemistry incontrolling the Oxidising Capacity of the AtmOsphere) air-craft campaign during July 2010 and January 2011 made ob-servations of OH, HO2, NO3, N2O5 and a number of sup-porting measurements at night over the UK, and reflects thefirst simultaneous airborne measurements of these species.We compare the observed concentrations of these short-livedspecies with those calculated by a box model constrained bythe concentrations of the longer lived species using a detailedchemical scheme. OH concentrations were below the limitof detection, consistent with model predictions. The modelsystematically underpredicts HO2 by ∼ 200 % and overpre-dicts NO3 and N2O5 by around 80 and 50 %, respectively.Cycling between NO3 and N2O5 is fast and thus we de-fine the NO3x (NO3x = NO3+ N2O5) family. Production ofNO3x is overwhelmingly dominated by the reaction of NO2with O3, whereas its loss is dominated by aerosol uptake ofN2O5, with NO3+ VOCs (volatile organic compounds) andNO3+ RO2 playing smaller roles. The production of HOx
and ROx radicals is mainly due to the reaction of NO3 withVOCs. The loss of these radicals occurs through a combina-tion of HO2+ RO2 reactions, heterogeneous processes andproduction of HNO3 from OH+ NO2, with radical propaga-tion primarily achieved through reactions of NO3 with per-oxy radicals. Thus NO3 at night plays a similar role to bothOH and NO during the day in that it both initiates ROx radicalproduction and acts to propagate the tropospheric oxidationchain. Model sensitivity to the N2O5 aerosol uptake coeffi-cient (γN2O5) is discussed and we find that a value ofγN2O5 =
0.05 improves model simulations for NO3 and N2O5, but thatthese improvements are at the expense of model success forHO2. Improvements to model simulations for HO2, NO3 andN2O5 can be realised simultaneously on inclusion of addi-tional unsaturated volatile organic compounds, however thenature of these compounds is extremely uncertain.
Published by Copernicus Publications on behalf of the European Geosciences Union.
1300 D. Stone et al.: Radical chemistry at night
1 Introduction
Fundamentally the troposphere acts to oxidise emitted com-pounds through multiple steps until their volatility or solubil-ity drops sufficiently for them to condense to form aerosol, beremoved through contact with the ground or by clouds, or beabsorbed by the biosphere or oceans. This oxidation chem-istry is of fundamental importance for air quality, climate,food security and ecosystem services. Primary pollutants,such as CH4, volatile organic compounds (VOCs), oxides ofnitrogen and SO2, are removed by oxidation while secondarypollutants such as O3 and secondary organic aerosol (SOA)are produced as part of the oxidation chain.
During the day, atmospheric oxidation is initiated by pho-tochemical processes, notably the solar photolysis of O3 toproduce electronically excited oxygen atoms (O(1D)) thatsubsequently react with water vapour to produce OH. Overthe last few decades there has been extensive research intothe processes producing these oxidants and their subsequentchemistry (see for example Stone et al., 2012 and referencestherein). Much less emphasis has been placed on understand-ing nighttime oxidation chemistry and the role of radicalspecies at night.
When primary production of OH by solar photolysis can-not occur, other oxidants dominate, notably O3 and NO3 (Mi-helcic et al., 1993; Carslaw et al., 1997; Salisbury et al., 2001;Fleming et al., 2006; Warneke et al., 2004; Brown et al.,2009, 2011).
Ozone-initiated oxidation of gas phase compounds is pri-marily limited to alkenes, where ozonolysis of the C=C dou-ble bond initiates the oxidation. Ozonolysis has been inves-tigated in a range of studies in laboratory, chamber and fieldstudies (Salisbury et al., 2001; Fleming et al., 2006; Som-mariva et al., 2007; Kanaya et al., 1999, 2002, 2007a; Geyeret al., 2003; Malkin et al., 2010; Johnson and Marston, 2008),and has been shown to be responsible for production of OHand HO2 radicals at night (Salisbury et al., 2001; Fleming etal., 2006; Sommariva et al., 2007; Kanaya et al., 1999, 2002,2007a; Emmerson and Carslaw, 2009; Ren et al., 2003, 2006;Volkamer et al., 2010).
The nitrate radical (NO3) is produced by the reaction be-tween O3 and NO2. During the day, NO3 is rapidly photol-ysed, leading to low daytime concentrations (Wayne et al.,1991; Brown and Stutz, 2012). However, during the night,NO3 can accumulate, and a rapid equilibrium with N2O5 isestablished through the production of N2O5 via NO3+ NO2followed by rapid thermal decomposition of N2O5 back toNO3 and NO2 (Wayne et al., 1991; Brown and Stutz, 2012).Losses of N2O5 are primarily due to reactions on aerosol sur-faces, and there is thus much interest in determination of theaerosol uptake coefficient for N2O5 on atmospheric aerosols(Brown et al., 2006, 2009, 2011; Escoreia et al., 2010; Tanget al., 2010; Badger et al., 2006; Thornton and Abbatt, 2005;Hallquist et al., 2003; Thornton et al., 2003; Kane et al.,2001; Hu and Abbatt, 1997; Fried et al., 1994; Van Doren
et al., 1991; Hanson and Ravishankara, 1991; Mozurkewichand Calvert, 1998). NO3 radicals can react with a rangeof species, including alkenes, aldehydes and ROx radicals(Wayne et al., 1991; Brown and Stutz, 2012).
Although the initiation of nighttime chemistry by the reac-tions between NO3 and O3 with a range of VOCs is relativelywell characterised, the subsequent chemistry has receivedrelatively little attention. Measurements of NO3 have beenoverestimated by model calculations in several studies (Mi-helcic et al., 1993; Sommariva et al., 2006, 2007), with thoseof nighttime OH and HO2 radicals typically underestimated,indicating poor understanding of nighttime tropospheric ox-idation processes (Kanaya et al., 1999, 2002, 2007a, b; Em-merson and Carslaw, 2009; Geyer et al., 2003; Faloona et al.,2001; Martinez et al., 2003; Ren et al., 2006).
While a number of nighttime studies at ground level closeto local sources of NO have observed a limited role of NO3in nighttime radical production owing to surface losses ofNO3 and the rapid reaction between NO3 and NO (Salisburyet al., 2001; Fleming et al., 2006; Sommariva et al., 2007;Kanaya et al., 1999, 2002, 2007a, b; Emmerson and Carslaw,2009; Faloona et al., 2001; Martinez et al., 2003; Ren et al.,2003, 2005, 2006; Volkamer et al., 2010), several studies ofNO3 and N2O5 above ground level and in more remote re-gions have indicated a more significant role for NO3 in night-time radical production and tropospheric oxidation (Platt etal., 1980; Povey et al., 1998; South et al., 1998; Aliwell etal., 1998; Allan et al., 2002; Stutz et al., 2004; Warneke etal., 2004; Brown et al., 2003, 2004, 2006, 2007, 2009, 2011;Aldener et al., 2006; Sommariva et al., 2009; Stutz et al.,2010).
Measurements of NO3 and N2O5 were made downwindof New York City during the New England Air QualityStudy (NEAQS) by cavity ringdown spectroscopy (CRDS)onboard the National Oceanic and Atmospheric Administra-tion (NOAA) research vessel (R/V)Ronald H. Brownin sum-mers 2002 (Warneke et al., 2004; Brown et al., 2004; Aldeneret al., 2006) and 2004 (Sommariva et al., 2009). While mea-surements of nighttime composition in New York City ledto the conclusion that O3-initiated oxidation processes weredominant at night (Ren et al., 2003, 2006), those made dur-ing NEAQS indicated little influence of O3-initiated VOCoxidation at night, with oxidation of biogenic VOCs dom-inated by NO3 (Warneke et al., 2004). Although OH wasnot measured during NEAQS, the total VOC loss rate ow-ing to reaction with OH over a 24 h period was expectedto be 1.7× 106 cm−3 s−1, compared to the measured valueof 1× 106 cm−3 s−1 for NO3 (Warneke et al., 2004). Con-version of NOx to HNO3 at night through NO3 and N2O5was also found to occur at a comparable rate to that observedduring daytime through the OH+ NO2 reaction, emphasis-ing the importance of nighttime chemistry for determinationof NOx budgets and O3 production (Warneke et al., 2004;Brown et al., 2004; Aldener et al., 2006).
Atmos. Chem. Phys., 14, 1299–1321, 2014 www.atmos-chem-phys.net/14/1299/2014/
D. Stone et al.: Radical chemistry at night 1301
Modelling of NEAQS 2004 shipborne data using the Mas-ter Chemical Mechanism (MCM) (http://mcm.leeds.ac.uk/MCM/home.htt) (Jenkin et al., 2003; Saunders et al., 2003)demonstrated the importance of peroxy radicals for NO3loss, with NO3+ RO2 reactions representing a median of15 % of the total calculated NO3 gas phase loss, and at timesup to 60 % of the total NO3 loss (Sommariva et al., 2006).However, the total sinks for NO3 and N2O5 were still under-predicted, leading to overpredictions of 30–50 % of observedNO3 and N2O5 concentrations (Sommariva et al., 2006).
The NEAQS 2004 aircraft measurements of NO3 andN2O5 were significantly higher than the few ppt typically re-ported at the surface, with the aircraft observations reaching400 ppt NO3 and 3.1 ppb N2O5 (Brown et al., 2006, 2007,2009). The high NO3 concentrations aloft during NEAQS2004 resulted in significant nighttime oxidation of isopreneemissions, with∼ 20 % of isoprene emissions oxidised atnight, with over 90 % initiated by NO3 (Brown et al., 2009).It was suggested that NO3-initiated oxidation of isoprenecould easily dominate isoprene loss on a regional scale, andit was found that isoprene secondary organic aerosol (SOA)mass derived from NO3 oxidation was 50 % higher than thatfrom OH oxidation (Brown et al., 2009). These observationsof NO3 and N2O5 loss processes over a wide range of condi-tions also demonstrated that the uptake coefficient for N2O5(γN2O5) on aerosol particles displays a strong dependenceon aerosol composition (Brown et al., 2006). A steady stateanalysis of NO3 and N2O5 sinks (Brown et al., 2003; Brownet al., 2006) indicated that theγN2O5 can vary by over an or-der of magnitude, largely dependent on the sulfate mass orsulfate to organic ratio of the aerosol (Brown et al., 2006).
High mixing ratios of NO3 and N2O5 (up to 400 ppt and2 ppb, respectively) were also reported in a subsequent air-craft study using the NOAA P-3 aircraft during the Texas AirQuality Study (TexAQS) in 2006 (Brown et al., 2011). Bud-get analyses for the campaign indicated that VOC oxidationat night was rapid, with the total rate of NO3-initiated oxi-dation typically 3 to 5 times that initiated by O3, and NO3reactivity indicating the presence of unmeasured plumes ofhighly reactive VOCs (Brown et al., 2011). Loss of NO3was dominated by its chemistry with unsaturated VOCs, withonly 14 to 28 % of NO3 loss occurring indirectly throughheterogeneous chemistry of N2O5, although significant un-certainties in the N2O5 aerosol uptake coefficient were noted(Brown et al., 2011). Reactions of NO3 with peroxy radicalswere estimated as contributing between 1 and 4 % of the to-tal NO3 loss, although no direct measurements of RO2 wereavailable, with measurements of PAN (peroxy acetyl nitrate)used to estimate RO2 concentrations as being equal to theacetylperoxy (CH3C(O)O2) radical concentration producedby thermal decomposition of PAN (Brown et al., 2011).
Shipborne measurements of NO3 and total peroxy radi-cals (HO2+6RO2) were also made during the TexAQS 2006campaign onboard the R/VRonald H. Brownalong the USGulf Coast (Sommariva et al., 2011). Detailed box modelling
of the observations using the MCM showed that NO3+ RO2reactions represented, on average, 12–28 % of the total NO3sink in relatively unpolluted regions, but that the model un-derestimated NO3 and showed high variability in its ability toreproduce observed nighttime concentrations of peroxy radi-cals (Sommariva et al., 2011).
Previous studies have shown that nighttime chemistryplays a significant role in defining the chemistry of the tro-posphere. However, there are significant uncertainties in thechemistry of the atmosphere at night. Many of these uncer-tainties are due to the lack of simultaneous observations ofOH, HO2, NO3 and N2O5. Those observations that do ex-ist often occur within the centres of cities where NO emis-sions are high, with NO3 concentrations thus kept low. These“inner city” conditions are not representative of most of theplanet and thus do not offer suitable conditions for an evalu-ation of our understanding of nighttime chemistry.
In this paper we take advantage of simultaneous aircraftmeasurements of the short-lived species OH, HO2, NO3 andN2O5, together with the concentrations of long-lived compo-nents made away from recent emissions to analyse our un-derstanding of nighttime chemistry as manifested by a con-strained box model. Observations of the short-lived speciesenable assessment of the chemical schemes used in atmo-spheric models since their concentrations are relatively un-affected by transport processes and are controlled by lo-cal chemistry alone (Heard and Pilling, 2003; Stone et al.,2012). Comparison of observed concentrations of short-livedspecies with calculated concentrations, particularly from de-tailed box model simulations, thus enables evaluation of ourunderstanding of chemical processes occurring in the atmo-sphere, making the short-lived species ideal model targets(Heard and Pilling, 2003; Stone et al., 2012).
We provide a brief overview of the campaign in Sect. 2 andmeasurement techniques in Sect. 3, followed by a descrip-tion of the model approach in Sect. 4. In Sect. 5 we describecomparisons between modelled and observed concentrationsand in Sect. 6 examine the processes controlling atmosphericcomposition at night. Potential sources of model uncertaintyare discussed in Sect. 7, with suggestions for future work inSect. 8 and conclusions drawn in Sect. 9.
2 The RONOCO Campaign
The ROle of Nighttime chemistry in controlling the Oxidis-ing Capacity of the AtmOsphere (RONOCO) project tookplace in July 2010 and January 2011. Aircraft measurementswere made at altitudes of up to 6400 m over the UK and theNorth Sea onboard the UK FAAM BAe 146 aircraft, basedat East Midlands Airport (52.8◦ N, 1.3◦ W) during the cam-paign. The main objectives of the RONOCO campaign wereto obtain comprehensive measurements of nighttime compo-sition to further our understanding of nighttime chemistrythus enabling quantification of the key processes controlling
www.atmos-chem-phys.net/14/1299/2014/ Atmos. Chem. Phys., 14, 1299–1321, 2014
1302 D. Stone et al.: Radical chemistry at night
atmospheric chemistry at night, and ultimately to facilitateassessment of the regional and global impacts of nighttimechemistry on air quality and climate change.
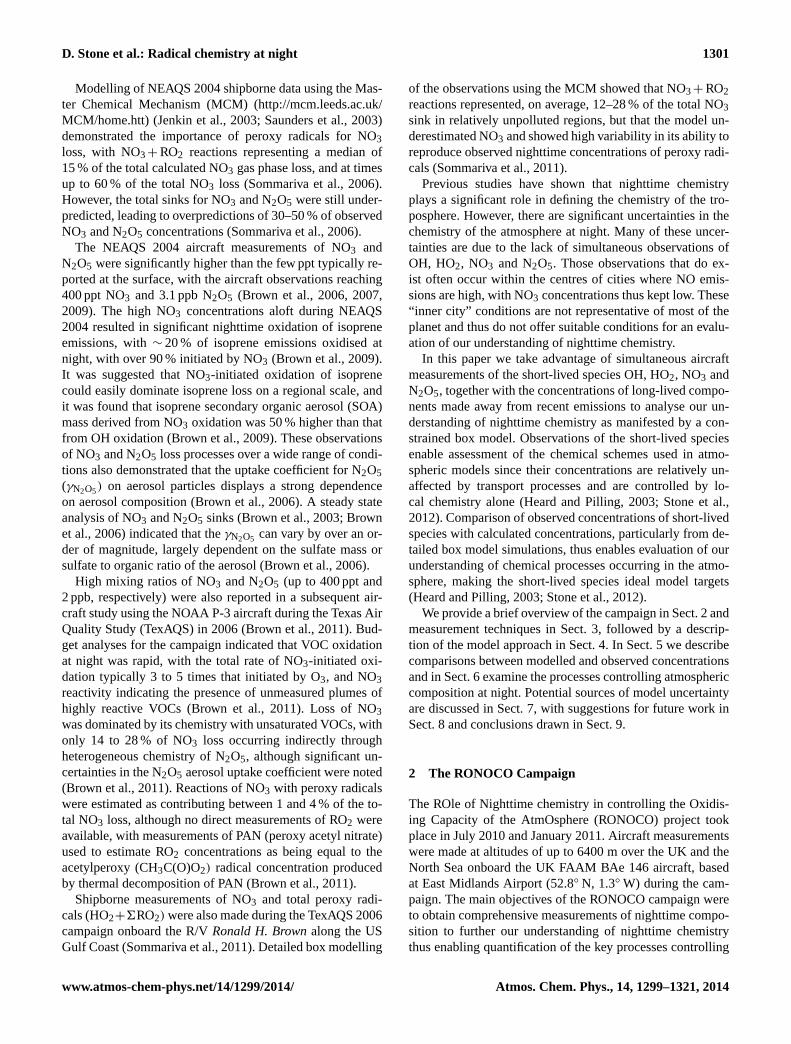
Measurements of HOx were made on 16 flights throughoutthe campaign (7 flights in July 2010 and 9 flights in January2011), while measurements of NO3 and N2O5 were madeon 17 flights (9 flights in July 2010 and 8 flights in January2011). In our analysis we combine all of these flights into asingle data set. Figure 1 shows the locations of HOx, NO3and N2O5 measurements made during RONOCO. We focushere on the analysis of measurements made at night, definedas periods when the solar zenith angle was greater than 99◦,and thus do not include data from flights made in daylighthours or during dawn or dusk periods. Data from flight B537(20 July 2010) has also been excluded from our analysis ow-ing to a number of atypical observations during this flightwhich are discussed elsewhere (Kennedy et al., 2011; Walkeret al., 2014).
3 Measurements during RONOCO
3.1 Detection of OH and HO2
OH and HO2 radicals were measured by laser-induced fluo-rescence (LIF) spectroscopy at low pressure using the fluo-rescence assay by gas expansion (FAGE) technique (Heardand Pilling, 2003). The instrument has been described in de-tail elsewhere (Commane et al., 2010; Stone et al., 2011), andonly a brief description is given here.
Ambient air from the aircraft exterior is drawn into a fluo-rescence cell maintained at pressures ranging from 1.9 Torrat sea level to 1.2 Torr at 6 km altitude. The fluorescencecell has two excitation axes, with excess NO added at thesecond axis to titrate HO2 to OH, enabling simultaneousdetection of OH and HO2. OH radicals in both excitationaxes are excited by laser light atλ ∼ 308 nm, generated bya solid state Nd:YAG (neodymium yttrium aluminum gar-net) pumped Ti:sapphire laser system which is frequencytripled (Bloss et al., 2003). Channel photomultiplier tubescoupled to gated photon counters were used to detect theA26+
− X25i OH fluorescence signal atλ ∼ 308 nm.Calibration of the instrument is achieved by measure-
ment of the fluorescence signal from known concentra-tions of OH and HO2, produced by the photolysis of wa-ter vapour, and was performed over a range of condi-tions before and after the RONOCO campaign. The in-strument sensitivity to OH (COH) was determined to be(2.9± 0.45)× 10−8 s−1 cm3 mW−1 for the summer cam-paign and (4.3± 0.7)× 10−8 s−1 cm3 mW−1 for the wintercampaign. The instrument sensitivity to HO2 (CHO2) wasdetermined to be (0.9± 1.5)× 10−7 s−1 cm3 mW−1 for thesummer campaign and (1.2± 0.21)× 10−7 s−1 cm3 mW−1
for the winter campaign. Calibration uncertainties (1σ ) areon the order of 15 to 20 % for OH and HO2. For OH,
40
Figures
Figure 1: Locations of the BAe146 aircraft during the RONOCO campaign for which measurements of
HO2* and NO3 or N2O5 are available, coloured by altitude.
Fig. 1.Locations of the BAe 146 aircraft during the RONOCO cam-paign for which measurements of HO2* and NO3 or N2O5 areavailable, coloured by altitude.
the 1σ limit of detection (LOD) was 1.8× 106 cm−3 for a5 min averaging period during the summer campaign and6.4× 105 cm−3 during the winter campaign. The HO2 1σ
LOD was 6.9× 105 cm−3 for a 4 min averaging period dur-ing the summer and 6.0× 105 cm−3 during the winter, andis better than that for OH owing to lower losses on thewalls of the sampling tube following the supersonic expan-sion. While instrument sensitivity does vary with the pressurein the detection cells, and thus with altitude, the cell pres-sures during RONOCO varied by less than 0.7 Torr (in therange 1.2–1.9 Torr). As discussed in detail by Commane etal. (2010), pressure dependent calibrations of the instrumentare achieved by varying cell pressure using different sizedpinholes through which ambient air is drawn into the instru-ment to control the flow of gas in the cell. Over the range ofcell pressures encountered during RONOCO, there is littlevariation ofCOH or CHO2 (Commane et al., 2010), and val-ues reported here are thus the mean values determined duringcalibrations in this pressure range. Uncertainties associatedwith measurements of OH and HO2 are 28–35 % (1σ ) andinclude the calibration uncertainites. Further details regard-ing the FAGE instrument and calibration procedures will beprovided by Walker et al. (2014).
3.2 Detection of NO3 and N2O5
NO3 and N2O5 were detected by broadband cavity enhancedabsorption spectroscopy (BBCEAS), as described in detailby Kennedy et al. (2011). Briefly, air is drawn into three94 cm-long high finesse optical cavities, with each bound bytwo highly reflective mirrors, which are irradiated with colli-mated light from an incoherent broadband continuous wave
Atmos. Chem. Phys., 14, 1299–1321, 2014 www.atmos-chem-phys.net/14/1299/2014/

D. Stone et al.: Radical chemistry at night 1303
light source. Each cavity is coupled to a spectrometer inter-faced to a charge coupled device (CCD) detector by fibre op-tic bundles, where the wavelength dependent light intensitytransmitted through the cavity is recorded.
NO3 is identified and measured via its strongB2E′−X2A′
2electronic transition centred around 662 nm, with light pro-vided by a red light emitting diode (LED). N2O5 is measuredin a separate cavity maintained at 80◦C following its thermaldissociation to NO3 and NO2 at 120◦C in a heater situatedprior to the cavity entrance, and thus measured as the sum ofambient NO3 and thermally dissociated N2O5. The third cav-ity enables detection of NO2 using light provided by a blueLED with output centred around 460 nm.
A crystalline source of N2O5, stabilised at temperaturesbetween−80 and −77◦C, was used to provide knownamounts of NO3 and N2O5 to facilitate calibration of the in-strument in the laboratory. The in-flight 1σ LOD (determinedat a pressure of 0.7 bar) for NO3 was found to be 1.1 ppt fora 1 s integration time, with a corresponding LOD of 2.4 pptfor the sum of NO3+ N2O5.
3.3 Supporting measurements
Measurements from several other instruments onboard theBAe 146 during the RONOCO campaign have been used inthe analysis presented here. Details of these supporting mea-surements are summarised in Table 1.
4 Model approach
Observations of OH, HO2, NO3 and N2O5 have been in-terpreted using the Dynamically Simple Model of Atmo-spheric Chemical Complexity (DSMACC), which is de-scribed in detail by Emmerson and Evans (2009) and Stoneet al. (2010). DSMACC is a zero-dimensional model usingthe kinetic pre-processor (KPP) (Sandu and Sander, 2006),and in this work uses a chemistry scheme described by theMCM v3.2 (http://mcm.leeds.ac.uk/MCM/home.htt) (Jenkinet al., 2003; Saunders et al., 2003). The full MCM containsnear explicit degradation schemes for 143 primary species,resulting in 6700 species in approximately 17 000 reactionsand representing the most detailed and comprehensive chem-istry scheme available for modelling tropospheric composi-tion. Simulations reported here use degradation chemistryfor ethane, propane,iso-butane,n-butane,iso-pentane,n-pentane, sum of 2+3-methylpentane,n-hexane,n-heptane,n-octane, ethene, propene, acetylene,trans-2-butene, 1-butene, cis-2-butene, iso-butene, 1,3-butadiene,trans-2-pentene, 1-pentene, isoprene, benzene, toluene, ethylben-zene, xylene, methacrolein and acetone. The scheme usedcontains∼ 2000 species in∼ 8000 reactions.
Heterogeneous loss of several species (OH, HO2, CH3O2,NO3, N2O5 and HNO3) to aerosol surfaces was represented
in the model by parameterisation of a first-order loss processto the aerosol surface (Schwarz, 1986):
k′=
(r
Dg+
4
γxcg
)−1
A, (1)
wherek′ is the first-order rate coefficient for heterogeneousloss,r is the aerosol particle effective radius,Dg is the gasphase diffusion coefficient (Eq. 2),γx is the uptake coeffi-cient for species X,cg is the mean molecular speed (Eq. 3),andA is the aerosol surface area per unit volume.Dg is givenby
Dg =3
NAd2gρair
√RT mair
2π
(mg + mair
mg
), (2)
whereNA is Avogadro’s number,dg is the diameter of the gasmolecule,ρair is the density of air,R is the gas constant, andmg andmair are the molar masses of gas and air, respectively.cg is given by
cg =
(8RT
πMw
)1/2
, (3)
whereT is the temperature andMw is the molecular weightof the gas. For HO2, γHO2 = 0.028 is used based on the meanvalue reported by the parameterisation by Macintyre andEvans (2011). For NO3, a value ofγNO3 = 0.001 is used. ForN2O5, γN2O5 = 0.02 is used in our base simulations, based onthe mean value reported from the parameterisation by Evansand Jacob (2005). Model sensitivity toγN2O5 is discussed inSect. 7.2.
An additional first-order loss process for each species inthe model is also included to represent deposition processes,with the first-order rate set to be equivalent to a lifetime of ap-proximately 24 h. Model sensitivity to this parameter is dis-cussed in Sect. 7.1.
All aircraft measurements are merged onto a 60 s time-base. Time points with observations of OH or HO2 aremodelled if observations of physical state (latitude, longi-tude, pressure, temperature and water vapour concentration),aerosol surface area and concentrations of CO, O3, NO2,NO3 and VOCs are available. We perform 1648 simulationsin total. For each 60 s time period, we use the observed con-centrations of the constrained species, appropriately aver-aged over that time period, to run the simulation. We thencompare with the appropriately averaged values of HO2,NO3 and N2O5 over that time period. A summary of speciesused to constrain the model is given in Table 2. Observedconcentrations of CO, O3, H2O, VOCs and aerosol surfacearea for each 60 s time point are fixed and held constantthroughout the corresponding model run, with concentra-tions of CH4 and H2 kept constant at values of 1770 (NOAACMDL flask analysis,ftp://ftp.cmdl.noaa.gov/ccg/ch4/) and
www.atmos-chem-phys.net/14/1299/2014/ Atmos. Chem. Phys., 14, 1299–1321, 2014
1304 D. Stone et al.: Radical chemistry at night
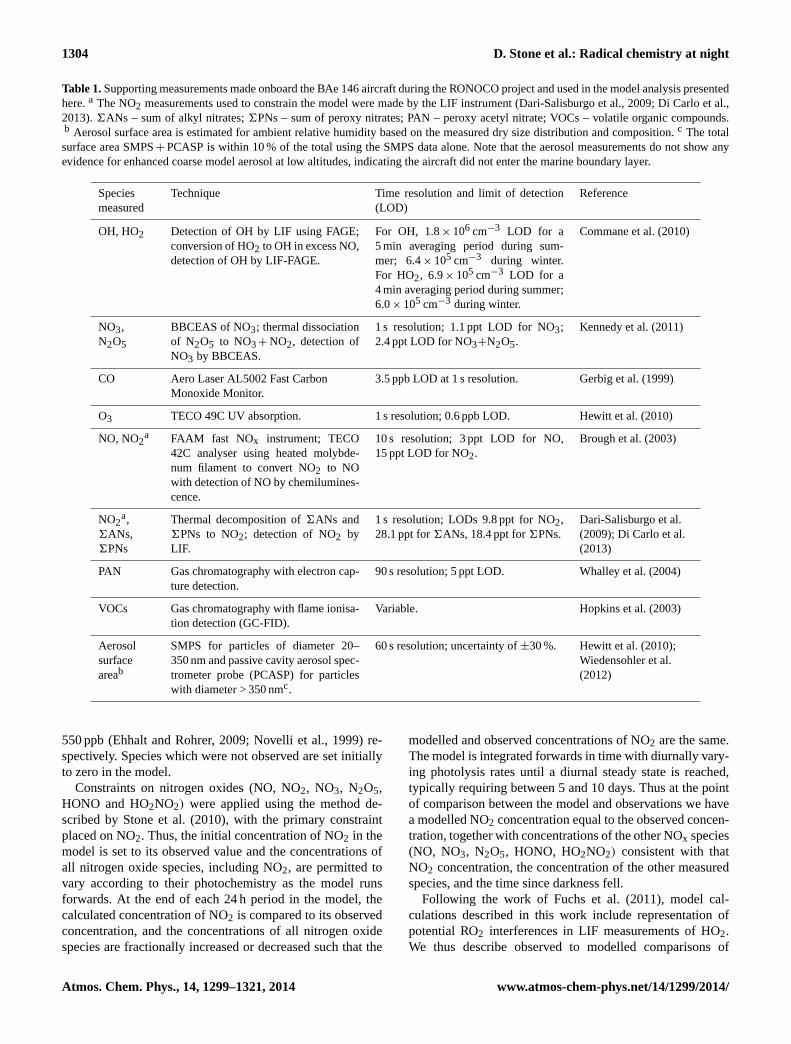
Table 1.Supporting measurements made onboard the BAe 146 aircraft during the RONOCO project and used in the model analysis presentedhere.a The NO2 measurements used to constrain the model were made by the LIF instrument (Dari-Salisburgo et al., 2009; Di Carlo et al.,2013).6ANs – sum of alkyl nitrates;6PNs – sum of peroxy nitrates; PAN – peroxy acetyl nitrate; VOCs – volatile organic compounds.b Aerosol surface area is estimated for ambient relative humidity based on the measured dry size distribution and composition.c The totalsurface area SMPS+ PCASP is within 10 % of the total using the SMPS data alone. Note that the aerosol measurements do not show anyevidence for enhanced coarse model aerosol at low altitudes, indicating the aircraft did not enter the marine boundary layer.
Speciesmeasured
Technique Time resolution and limit of detection(LOD)
Reference
OH, HO2 Detection of OH by LIF using FAGE;conversion of HO2 to OH in excess NO,detection of OH by LIF-FAGE.
For OH, 1.8× 106 cm−3 LOD for a5 min averaging period during sum-mer; 6.4× 105 cm−3 during winter.For HO2, 6.9× 105 cm−3 LOD for a4 min averaging period during summer;6.0× 105 cm−3 during winter.
Commane et al. (2010)
NO3,N2O5
BBCEAS of NO3; thermal dissociationof N2O5 to NO3+ NO2, detection ofNO3 by BBCEAS.
1 s resolution; 1.1 ppt LOD for NO3;2.4 ppt LOD for NO3+N2O5.
Kennedy et al. (2011)
CO Aero Laser AL5002 Fast CarbonMonoxide Monitor.
3.5 ppb LOD at 1 s resolution. Gerbig et al. (1999)
O3 TECO 49C UV absorption. 1 s resolution; 0.6 ppb LOD. Hewitt et al. (2010)
NO, NO2a FAAM fast NOx instrument; TECO
42C analyser using heated molybde-num filament to convert NO2 to NOwith detection of NO by chemilumines-cence.
10 s resolution; 3 ppt LOD for NO,15 ppt LOD for NO2.
Brough et al. (2003)
NO2a,
6ANs,6PNs
Thermal decomposition of6ANs and6PNs to NO2; detection of NO2 byLIF.
1 s resolution; LODs 9.8 ppt for NO2,28.1 ppt for6ANs, 18.4 ppt for6PNs.
Dari-Salisburgo et al.(2009); Di Carlo et al.(2013)
PAN Gas chromatography with electron cap-ture detection.
90 s resolution; 5 ppt LOD. Whalley et al. (2004)
VOCs Gas chromatography with flame ionisa-tion detection (GC-FID).
Variable. Hopkins et al. (2003)
Aerosolsurfaceareab
SMPS for particles of diameter 20–350 nm and passive cavity aerosol spec-trometer probe (PCASP) for particleswith diameter > 350 nmc.
60 s resolution; uncertainty of±30 %. Hewitt et al. (2010);Wiedensohler et al.(2012)
550 ppb (Ehhalt and Rohrer, 2009; Novelli et al., 1999) re-spectively. Species which were not observed are set initiallyto zero in the model.
Constraints on nitrogen oxides (NO, NO2, NO3, N2O5,HONO and HO2NO2) were applied using the method de-scribed by Stone et al. (2010), with the primary constraintplaced on NO2. Thus, the initial concentration of NO2 in themodel is set to its observed value and the concentrations ofall nitrogen oxide species, including NO2, are permitted tovary according to their photochemistry as the model runsforwards. At the end of each 24 h period in the model, thecalculated concentration of NO2 is compared to its observedconcentration, and the concentrations of all nitrogen oxidespecies are fractionally increased or decreased such that the
modelled and observed concentrations of NO2 are the same.The model is integrated forwards in time with diurnally vary-ing photolysis rates until a diurnal steady state is reached,typically requiring between 5 and 10 days. Thus at the pointof comparison between the model and observations we havea modelled NO2 concentration equal to the observed concen-tration, together with concentrations of the other NOx species(NO, NO3, N2O5, HONO, HO2NO2) consistent with thatNO2 concentration, the concentration of the other measuredspecies, and the time since darkness fell.
Following the work of Fuchs et al. (2011), model cal-culations described in this work include representation ofpotential RO2 interferences in LIF measurements of HO2.We thus describe observed to modelled comparisons of
Atmos. Chem. Phys., 14, 1299–1321, 2014 www.atmos-chem-phys.net/14/1299/2014/
D. Stone et al.: Radical chemistry at night 1305
41
Figure 2: Comparison of modelled and observed concentrations of (a) HO2* (all data), [HO2*]mod =
{(0.5 ± 0.1) × [HO2*]obs} + (3.0 ± 2.2) × 106 cm
-3 (r
2 = 0.1); (b) HO2* (summer data), [HO2*]mod =
{(0.5 ± 0.1) × [HO2*]obs} + (0.3 ± 3.1) × 106 cm
-3 (r
2 = 0.1); (c) HO2* (winter data), [HO2*]mod = {(0.4
± 0.2) × [HO2*]obs} + (7.5 ± 4.4) × 106 cm
-3 (r
2 = 0.02); (d) NO3 (all data), [NO3]mod = {(1.8 ± 0.2) ×
[NO3]obs} – (2.3 ± 3.6) ppt (r2 = 0.3); (e) NO3 (summer data), [NO3]mod = {(2.0 ± 0.3) × [NO3]obs} –
(9.9 ± 6.0) ppt (r2 = 0.2); (f) NO3 (winter data), [NO3]mod = {(2.2 ± 0.4) × [NO3]obs} + (1.3 ± 4.1) ppt (r
2
= 0.3); (g) N2O5 (all data), [N2O5]mod = {(1.5 ± 0.1) × [N2O5]mod} – (42.4 ± 19.7) ppt (r2 = 0.6); (h)
N2O5 (summer data), [N2O5]mod = {(1.6 ± 0.2) × [N2O5]mod} – (0.2 ± 18.1) ppt (r2 = 0.3); (i) N2O5
(winter data), [N2O5]mod = {(1.4 ± 0.2) × [N2O5]mod} + (52.4 ± 43.2) ppt (r2 = 0.8). In each plot, the
solid red line indicates the 1:1 line, with 50 % limits given by the broken red lines. The best fit lines
are shown in blue. Error bars are the 1σ calibration uncertainties.
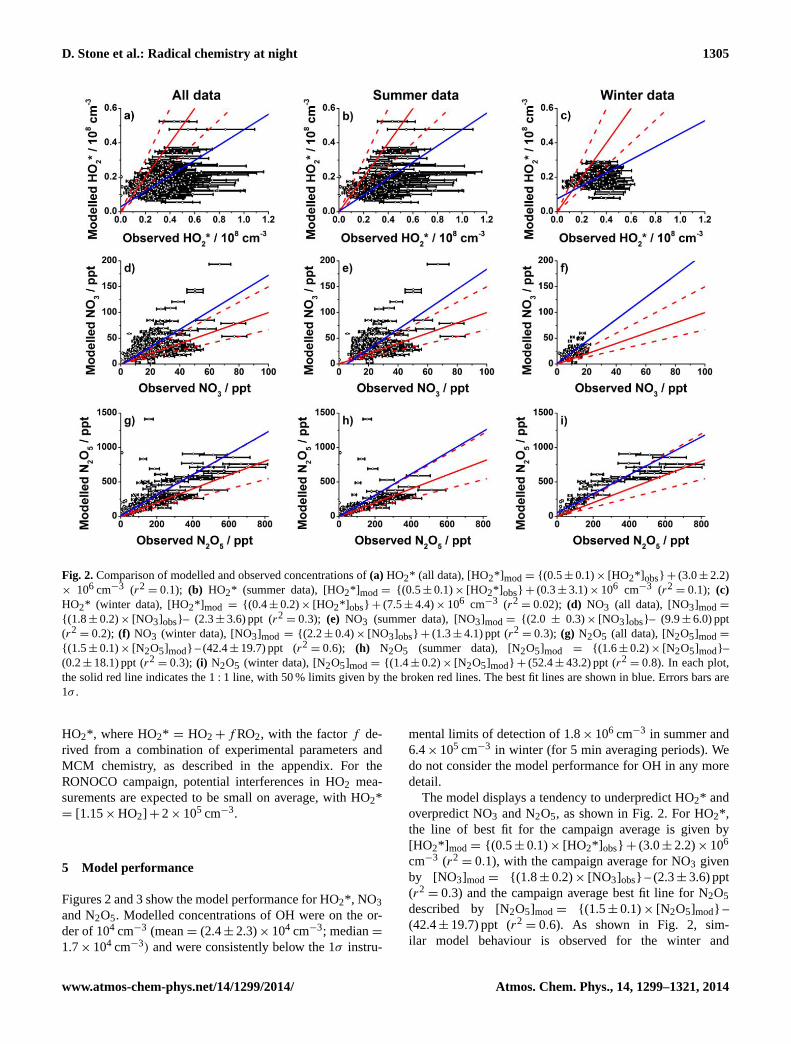
Fig. 2. Comparison of modelled and observed concentrations of(a) HO2* (all data), [HO2*] mod= {(0.5 ± 0.1)× [HO2*] obs} + (3.0± 2.2)× 106 cm−3 (r2
= 0.1); (b) HO2* (summer data), [HO2*] mod= {(0.5 ± 0.1)× [HO2*] obs} + (0.3± 3.1)× 106 cm−3 (r2= 0.1); (c)
HO2* (winter data), [HO2*] mod = {(0.4 ± 0.2)× [HO2*] obs} + (7.5± 4.4)× 106 cm−3 (r2= 0.02); (d) NO3 (all data), [NO3]mod=
{(1.8 ± 0.2)× [NO3]obs}– (2.3± 3.6) ppt (r2= 0.3); (e) NO3 (summer data), [NO3]mod= {(2.0 ± 0.3)× [NO3]obs}– (9.9± 6.0) ppt
(r2= 0.2); (f) NO3 (winter data), [NO3]mod = {(2.2 ± 0.4)× [NO3]obs} + (1.3± 4.1) ppt (r2
= 0.3); (g) N2O5 (all data), [N2O5]mod=
{(1.5 ± 0.1)× [N2O5]mod} – (42.4± 19.7) ppt (r2= 0.6); (h) N2O5 (summer data), [N2O5]mod = {(1.6 ± 0.2)× [N2O5]mod}–
(0.2± 18.1) ppt (r2= 0.3); (i) N2O5 (winter data), [N2O5]mod= {(1.4 ± 0.2)× [N2O5]mod} + (52.4± 43.2) ppt (r2
= 0.8). In each plot,the solid red line indicates the 1: 1 line, with 50 % limits given by the broken red lines. The best fit lines are shown in blue. Errors bars are1σ .
HO2*, where HO2* = HO2 + f RO2, with the factorf de-rived from a combination of experimental parameters andMCM chemistry, as described in the appendix. For theRONOCO campaign, potential interferences in HO2 mea-surements are expected to be small on average, with HO2*= [1.15× HO2] + 2× 105 cm−3.
5 Model performance
Figures 2 and 3 show the model performance for HO2*, NO3and N2O5. Modelled concentrations of OH were on the or-der of 104 cm−3 (mean= (2.4± 2.3)× 104 cm−3; median=1.7× 104 cm−3) and were consistently below the 1σ instru-
mental limits of detection of 1.8× 106 cm−3 in summer and6.4× 105 cm−3 in winter (for 5 min averaging periods). Wedo not consider the model performance for OH in any moredetail.
The model displays a tendency to underpredict HO2* andoverpredict NO3 and N2O5, as shown in Fig. 2. For HO2*,the line of best fit for the campaign average is given by[HO2*] mod = {(0.5 ± 0.1)× [HO2*] obs} + (3.0± 2.2)× 106
cm−3 (r2= 0.1), with the campaign average for NO3 given
by [NO3]mod = {(1.8 ± 0.2)× [NO3]obs} – (2.3± 3.6) ppt(r2
= 0.3) and the campaign average best fit line for N2O5described by [N2O5]mod = {(1.5 ± 0.1)× [N2O5]mod} –(42.4± 19.7) ppt (r2
= 0.6). As shown in Fig. 2, sim-ilar model behaviour is observed for the winter and
www.atmos-chem-phys.net/14/1299/2014/ Atmos. Chem. Phys., 14, 1299–1321, 2014
1306 D. Stone et al.: Radical chemistry at night
42
Figure 3: Time series of observed (black) and modelled (red) concentrations of (a) HO2* during the
summer campaign; (b) NO3 during the summer campaign; (c) N2O5 during the summer campaign; (d)
HO2* during the winter campaign; (e) NO3 during the winter campaign; (f) N2O5 during the winter
campaign. Error bars are the 1σ calibration uncertainties. Data for NO3 and N2O5 above 100 ppt and
1000 ppt, respectively, are not shown for clarity (< 6 data points in total).
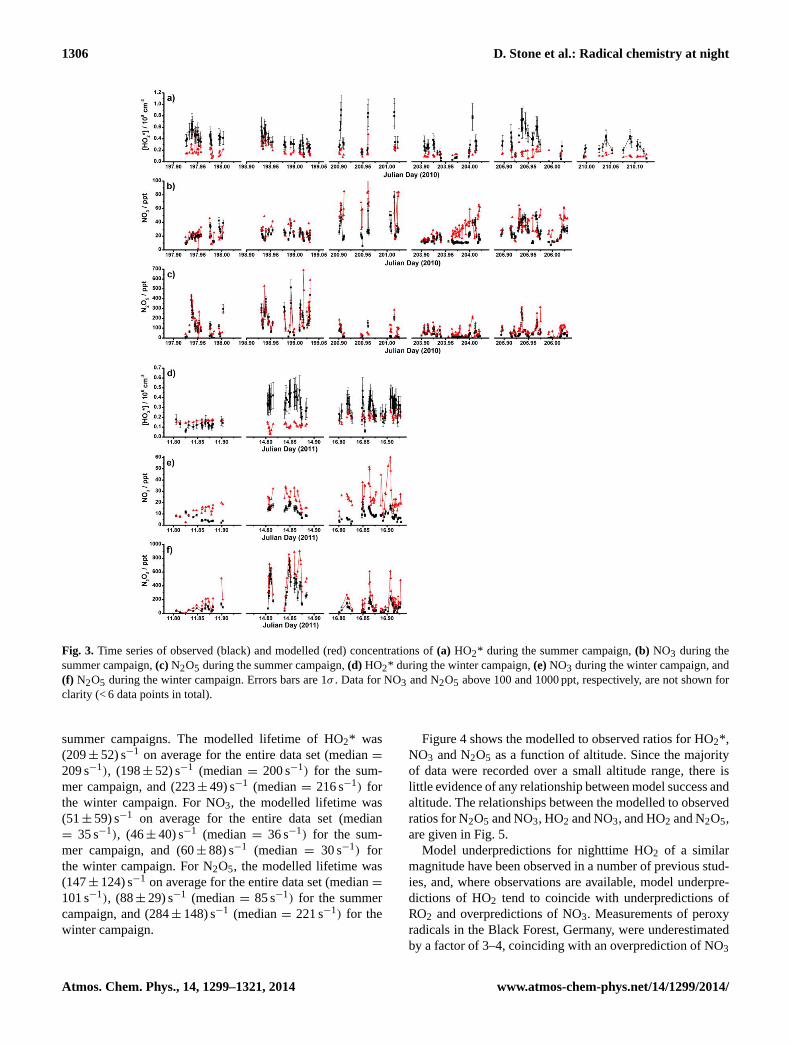
Fig. 3. Time series of observed (black) and modelled (red) concentrations of(a) HO2* during the summer campaign,(b) NO3 during thesummer campaign,(c) N2O5 during the summer campaign,(d) HO2* during the winter campaign,(e)NO3 during the winter campaign, and(f) N2O5 during the winter campaign. Errors bars are 1σ . Data for NO3 and N2O5 above 100 and 1000 ppt, respectively, are not shown forclarity (< 6 data points in total).
summer campaigns. The modelled lifetime of HO2* was(209± 52) s−1 on average for the entire data set (median=
209 s−1), (198± 52) s−1 (median= 200 s−1) for the sum-mer campaign, and (223± 49) s−1 (median= 216 s−1) forthe winter campaign. For NO3, the modelled lifetime was(51± 59) s−1 on average for the entire data set (median= 35 s−1), (46± 40) s−1 (median= 36 s−1) for the sum-mer campaign, and (60± 88) s−1 (median = 30 s−1) forthe winter campaign. For N2O5, the modelled lifetime was(147± 124) s−1 on average for the entire data set (median=
101 s−1), (88± 29) s−1 (median= 85 s−1) for the summercampaign, and (284± 148) s−1 (median= 221 s−1) for thewinter campaign.
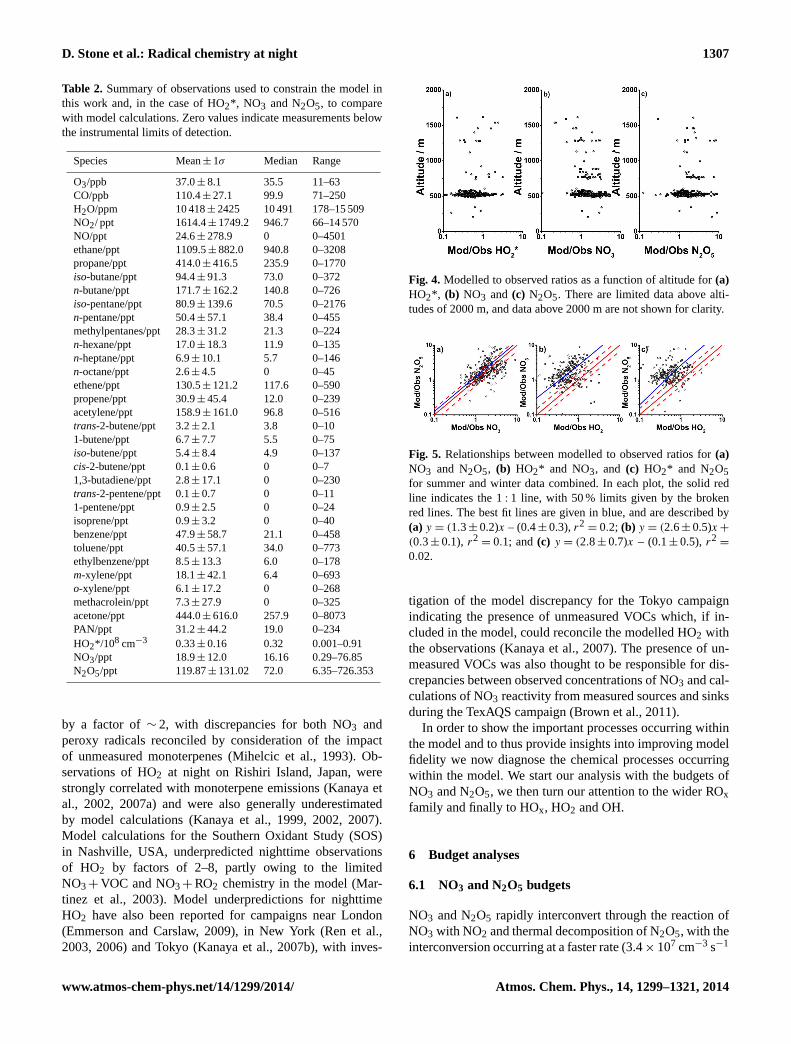
Figure 4 shows the modelled to observed ratios for HO2*,NO3 and N2O5 as a function of altitude. Since the majorityof data were recorded over a small altitude range, there islittle evidence of any relationship between model success andaltitude. The relationships between the modelled to observedratios for N2O5 and NO3, HO2 and NO3, and HO2 and N2O5,are given in Fig. 5.
Model underpredictions for nighttime HO2 of a similarmagnitude have been observed in a number of previous stud-ies, and, where observations are available, model underpre-dictions of HO2 tend to coincide with underpredictions ofRO2 and overpredictions of NO3. Measurements of peroxyradicals in the Black Forest, Germany, were underestimatedby a factor of 3–4, coinciding with an overprediction of NO3
Atmos. Chem. Phys., 14, 1299–1321, 2014 www.atmos-chem-phys.net/14/1299/2014/
D. Stone et al.: Radical chemistry at night 1307
Table 2. Summary of observations used to constrain the model inthis work and, in the case of HO2*, NO3 and N2O5, to comparewith model calculations. Zero values indicate measurements belowthe instrumental limits of detection.
Species Mean± 1σ Median Range
O3/ppb 37.0± 8.1 35.5 11–63CO/ppb 110.4± 27.1 99.9 71–250H2O/ppm 10 418± 2425 10 491 178–15 509NO2/ ppt 1614.4± 1749.2 946.7 66–14 570NO/ppt 24.6± 278.9 0 0–4501ethane/ppt 1109.5± 882.0 940.8 0–3208propane/ppt 414.0± 416.5 235.9 0–1770iso-butane/ppt 94.4± 91.3 73.0 0–372n-butane/ppt 171.7± 162.2 140.8 0–726iso-pentane/ppt 80.9± 139.6 70.5 0–2176n-pentane/ppt 50.4± 57.1 38.4 0–455methylpentanes/ppt 28.3± 31.2 21.3 0–224n-hexane/ppt 17.0± 18.3 11.9 0–135n-heptane/ppt 6.9± 10.1 5.7 0–146n-octane/ppt 2.6± 4.5 0 0–45ethene/ppt 130.5± 121.2 117.6 0–590propene/ppt 30.9± 45.4 12.0 0–239acetylene/ppt 158.9± 161.0 96.8 0–516trans-2-butene/ppt 3.2± 2.1 3.8 0–101-butene/ppt 6.7± 7.7 5.5 0–75iso-butene/ppt 5.4± 8.4 4.9 0–137cis-2-butene/ppt 0.1± 0.6 0 0–71,3-butadiene/ppt 2.8± 17.1 0 0–230trans-2-pentene/ppt 0.1± 0.7 0 0–111-pentene/ppt 0.9± 2.5 0 0–24isoprene/ppt 0.9± 3.2 0 0–40benzene/ppt 47.9± 58.7 21.1 0–458toluene/ppt 40.5± 57.1 34.0 0–773ethylbenzene/ppt 8.5± 13.3 6.0 0–178m-xylene/ppt 18.1± 42.1 6.4 0–693o-xylene/ppt 6.1± 17.2 0 0–268methacrolein/ppt 7.3± 27.9 0 0–325acetone/ppt 444.0± 616.0 257.9 0–8073PAN/ppt 31.2± 44.2 19.0 0–234HO2*/108 cm−3 0.33± 0.16 0.32 0.001–0.91NO3/ppt 18.9± 12.0 16.16 0.29–76.85N2O5/ppt 119.87± 131.02 72.0 6.35–726.353
by a factor of∼ 2, with discrepancies for both NO3 andperoxy radicals reconciled by consideration of the impactof unmeasured monoterpenes (Mihelcic et al., 1993). Ob-servations of HO2 at night on Rishiri Island, Japan, werestrongly correlated with monoterpene emissions (Kanaya etal., 2002, 2007a) and were also generally underestimatedby model calculations (Kanaya et al., 1999, 2002, 2007).Model calculations for the Southern Oxidant Study (SOS)in Nashville, USA, underpredicted nighttime observationsof HO2 by factors of 2–8, partly owing to the limitedNO3+ VOC and NO3+ RO2 chemistry in the model (Mar-tinez et al., 2003). Model underpredictions for nighttimeHO2 have also been reported for campaigns near London(Emmerson and Carslaw, 2009), in New York (Ren et al.,2003, 2006) and Tokyo (Kanaya et al., 2007b), with inves-
43
Figure 4: Modelled to observed ratios as a function of altitude for (a) HO2, (b) NO3 and (c) N2O5.
There are limited data above altitudes of 2000 m, and data above 2000 m are not shown for clarity.
Figure 5: Relationships between modelled to observed ratios for (a) NO3 and N2O5, (b) HO2* and NO3,
and (c) HO2* and N2O5 for summer and winter data combined. In each plot, the solid red line indicates
the 1:1 line, with 50 % limits given by the broken red lines. The best fit lines are given in blue, and are
described by (a) y = (1.3 ± 0.2)x – (0.4 ± 0.3), r2 = 0.2, (b) y = (2.6 ± 0.5)x + (0.3 ± 0.1), r
2 = 0.1, (c) y
= (2.8 ± 0.7)x – (0.1 ± 0.5), r2 = 0.02.
Fig. 4. Modelled to observed ratios as a function of altitude for(a)HO2*, (b) NO3 and (c) N2O5. There are limited data above alti-tudes of 2000 m, and data above 2000 m are not shown for clarity.
43
Figure 4: Modelled to observed ratios as a function of altitude for (a) HO2, (b) NO3 and (c) N2O5.
There are limited data above altitudes of 2000 m, and data above 2000 m are not shown for clarity.
Figure 5: Relationships between modelled to observed ratios for (a) NO3 and N2O5, (b) HO2* and NO3,
and (c) HO2* and N2O5 for summer and winter data combined. In each plot, the solid red line indicates
the 1:1 line, with 50 % limits given by the broken red lines. The best fit lines are given in blue, and are
described by (a) y = (1.3 ± 0.2)x – (0.4 ± 0.3), r2 = 0.2, (b) y = (2.6 ± 0.5)x + (0.3 ± 0.1), r
2 = 0.1, (c) y
= (2.8 ± 0.7)x – (0.1 ± 0.5), r2 = 0.02.
Fig. 5. Relationships between modelled to observed ratios for(a)NO3 and N2O5, (b) HO2* and NO3, and (c) HO2* and N2O5for summer and winter data combined. In each plot, the solid redline indicates the 1: 1 line, with 50 % limits given by the brokenred lines. The best fit lines are given in blue, and are described by(a) y = (1.3± 0.2)x – (0.4± 0.3),r2
= 0.2; (b) y = (2.6± 0.5)x +
(0.3± 0.1), r2= 0.1; and(c) y = (2.8± 0.7)x – (0.1± 0.5), r2
=
0.02.
tigation of the model discrepancy for the Tokyo campaignindicating the presence of unmeasured VOCs which, if in-cluded in the model, could reconcile the modelled HO2 withthe observations (Kanaya et al., 2007). The presence of un-measured VOCs was also thought to be responsible for dis-crepancies between observed concentrations of NO3 and cal-culations of NO3 reactivity from measured sources and sinksduring the TexAQS campaign (Brown et al., 2011).
In order to show the important processes occurring withinthe model and to thus provide insights into improving modelfidelity we now diagnose the chemical processes occurringwithin the model. We start our analysis with the budgets ofNO3 and N2O5, we then turn our attention to the wider ROxfamily and finally to HOx, HO2 and OH.
6 Budget analyses
6.1 NO3 and N2O5 budgets
NO3 and N2O5 rapidly interconvert through the reaction ofNO3 with NO2 and thermal decomposition of N2O5, with theinterconversion occurring at a faster rate (3.4× 107 cm−3 s−1
www.atmos-chem-phys.net/14/1299/2014/ Atmos. Chem. Phys., 14, 1299–1321, 2014
1308 D. Stone et al.: Radical chemistry at night
44
Figure 6: Processes controlling losses of NO3x (= NO3 + N2O5) in the model, displayed as (a) the
probability distribution functions for the percentage contributions to the total loss for heterogeneous
uptake of NO3x to aerosol surfaces (red), NO3 + VOCs (green), NO3 + HO2 (light blue) and NO3 + RO2
(all organic peroxy radicals) (dark blue), and (b) the summer and winter campaign means combined
(upper panel), summer campaign mean (lower panel, left hand side) and winter campaign mean (lower
panel, right hand side). The average total loss rate of NO3x was (7.8 ± 6.9) × 105 cm
3 s
-1 (median = 5.5
× 105 cm
3 s
-1) for the entire data set, (7.6 ± 6.6) × 10
5 cm
3 s
-1 (median = 5.5 × 10
5 cm
3 s
-1) for the
summer campaign and (8.2 ± 7.7) × 105 cm
3 s
-1 (median = 6.0 × 10
5 cm
3 s
-1) for the winter campaign.
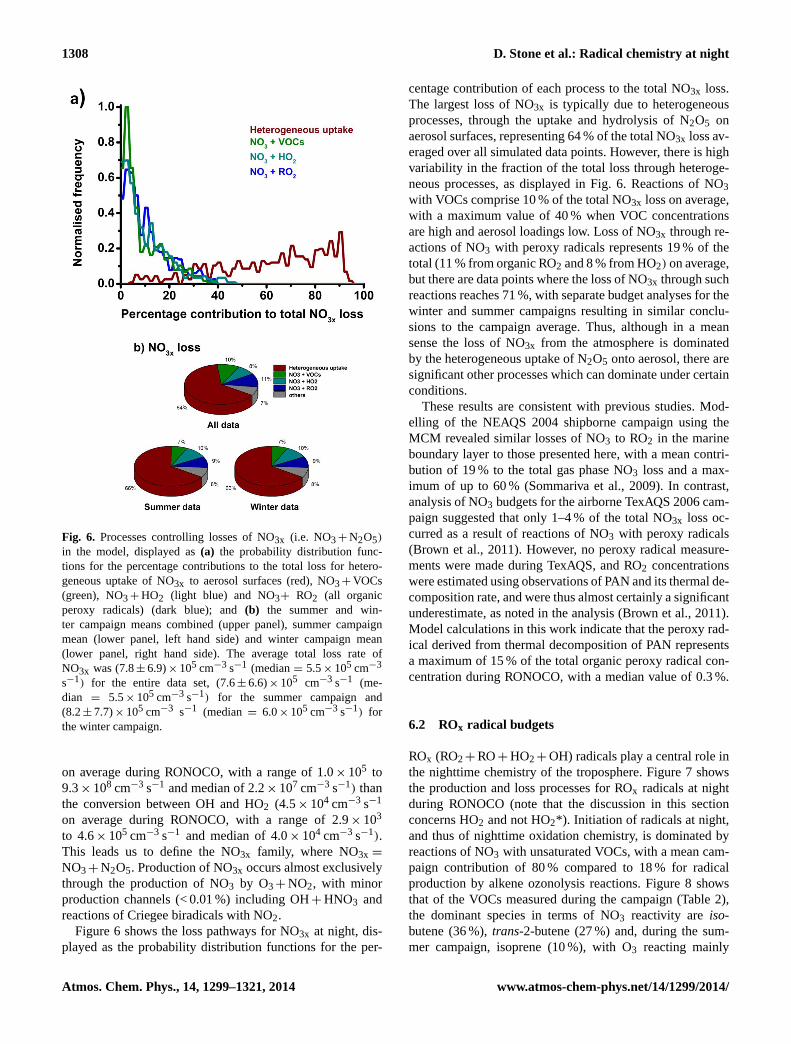
Fig. 6. Processes controlling losses of NO3x (i.e. NO3+ N2O5)
in the model, displayed as(a) the probability distribution func-tions for the percentage contributions to the total loss for hetero-geneous uptake of NO3x to aerosol surfaces (red), NO3+ VOCs(green), NO3+ HO2 (light blue) and NO3+ RO2 (all organicperoxy radicals) (dark blue); and(b) the summer and win-ter campaign means combined (upper panel), summer campaignmean (lower panel, left hand side) and winter campaign mean(lower panel, right hand side). The average total loss rate ofNO3x was (7.8± 6.9)× 105 cm−3 s−1 (median= 5.5× 105 cm−3
s−1) for the entire data set, (7.6± 6.6)× 105 cm−3 s−1 (me-dian = 5.5× 105 cm−3 s−1) for the summer campaign and(8.2± 7.7)× 105 cm−3 s−1 (median= 6.0× 105 cm−3 s−1) forthe winter campaign.
on average during RONOCO, with a range of 1.0× 10⁵ to9.3× 108 cm−3 s−1 and median of 2.2× 107 cm−3 s−1) thanthe conversion between OH and HO2 (4.5× 104 cm−3 s−1
on average during RONOCO, with a range of 2.9× 10³
to 4.6× 105 cm−3 s−1 and median of 4.0× 104 cm−3 s−1).This leads us to define the NO3x family, where NO3x =
NO3+ N2O5. Production of NO3x occurs almost exclusivelythrough the production of NO3 by O3+ NO2, with minorproduction channels (< 0.01 %) including OH+ HNO3 andreactions of Criegee biradicals with NO2.
Figure 6 shows the loss pathways for NO3x at night, dis-played as the probability distribution functions for the per-
centage contribution of each process to the total NO3x loss.The largest loss of NO3x is typically due to heterogeneousprocesses, through the uptake and hydrolysis of N2O5 onaerosol surfaces, representing 64 % of the total NO3x loss av-eraged over all simulated data points. However, there is highvariability in the fraction of the total loss through heteroge-neous processes, as displayed in Fig. 6. Reactions of NO3with VOCs comprise 10 % of the total NO3x loss on average,with a maximum value of 40 % when VOC concentrationsare high and aerosol loadings low. Loss of NO3x through re-actions of NO3 with peroxy radicals represents 19 % of thetotal (11 % from organic RO2 and 8 % from HO2) on average,but there are data points where the loss of NO3x through suchreactions reaches 71 %, with separate budget analyses for thewinter and summer campaigns resulting in similar conclu-sions to the campaign average. Thus, although in a meansense the loss of NO3x from the atmosphere is dominatedby the heterogeneous uptake of N2O5 onto aerosol, there aresignificant other processes which can dominate under certainconditions.
These results are consistent with previous studies. Mod-elling of the NEAQS 2004 shipborne campaign using theMCM revealed similar losses of NO3 to RO2 in the marineboundary layer to those presented here, with a mean contri-bution of 19 % to the total gas phase NO3 loss and a max-imum of up to 60 % (Sommariva et al., 2009). In contrast,analysis of NO3 budgets for the airborne TexAQS 2006 cam-paign suggested that only 1–4 % of the total NO3x loss oc-curred as a result of reactions of NO3 with peroxy radicals(Brown et al., 2011). However, no peroxy radical measure-ments were made during TexAQS, and RO2 concentrationswere estimated using observations of PAN and its thermal de-composition rate, and were thus almost certainly a significantunderestimate, as noted in the analysis (Brown et al., 2011).Model calculations in this work indicate that the peroxy rad-ical derived from thermal decomposition of PAN representsa maximum of 15 % of the total organic peroxy radical con-centration during RONOCO, with a median value of 0.3 %.
6.2 ROx radical budgets
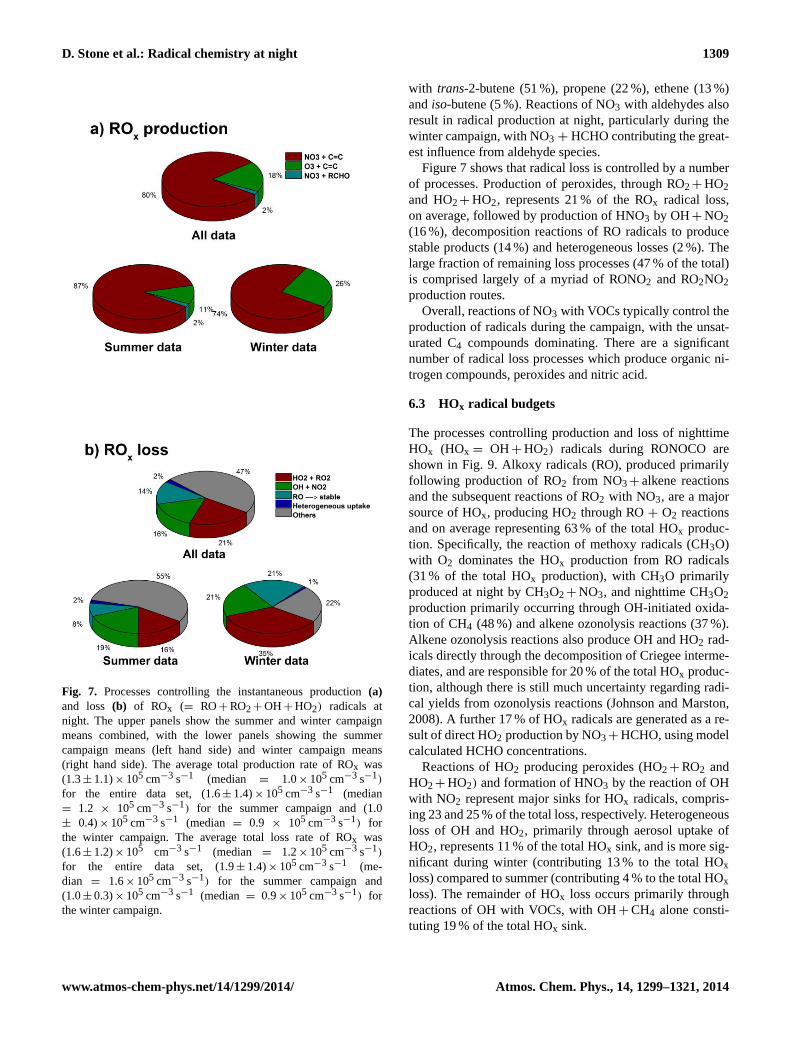
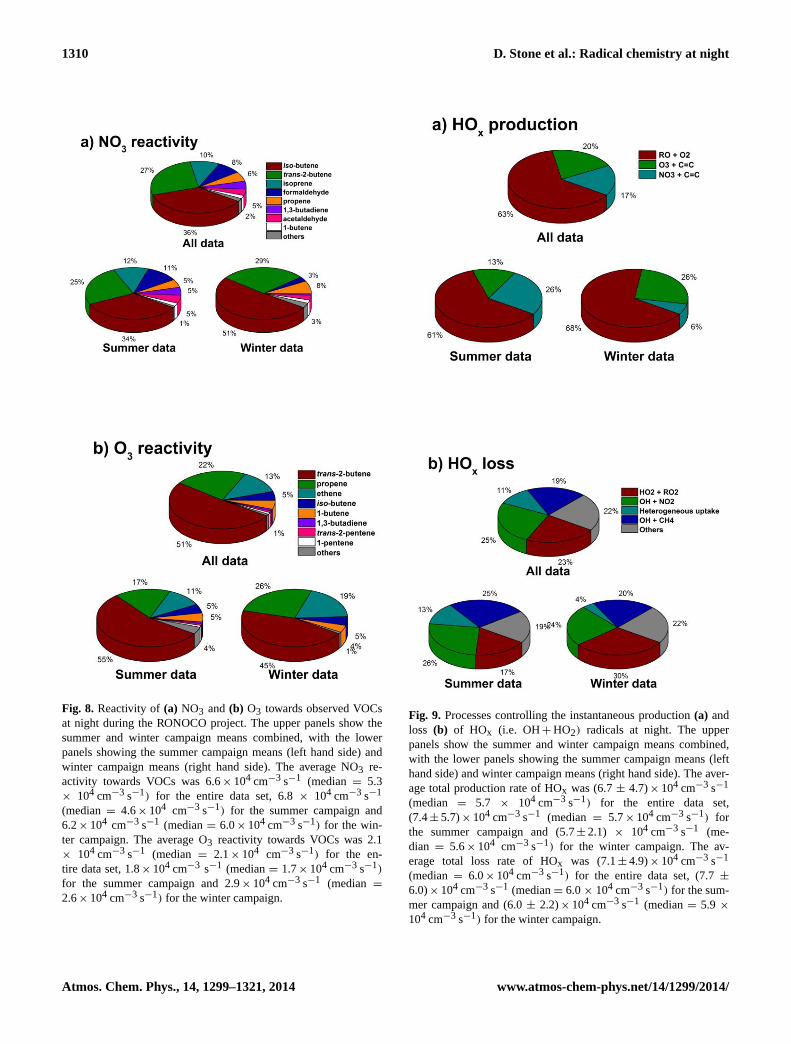
ROx (RO2+ RO+ HO2+ OH) radicals play a central role inthe nighttime chemistry of the troposphere. Figure 7 showsthe production and loss processes for ROx radicals at nightduring RONOCO (note that the discussion in this sectionconcerns HO2 and not HO2*). Initiation of radicals at night,and thus of nighttime oxidation chemistry, is dominated byreactions of NO3 with unsaturated VOCs, with a mean cam-paign contribution of 80 % compared to 18 % for radicalproduction by alkene ozonolysis reactions. Figure 8 showsthat of the VOCs measured during the campaign (Table 2),the dominant species in terms of NO3 reactivity areiso-butene (36 %),trans-2-butene (27 %) and, during the sum-mer campaign, isoprene (10 %), with O3 reacting mainly
Atmos. Chem. Phys., 14, 1299–1321, 2014 www.atmos-chem-phys.net/14/1299/2014/
D. Stone et al.: Radical chemistry at night 1309
45
Figure 7: Processes controlling the instantaneous production (a) and loss (b) of ROx (= RO + RO2 +
OH + HO2) radicals at night. The upper panels show the summer and winter campaign means
combined, with the lower panels showing the summer campaign means (left hand side) and winter
campaign means (right hand side). The average total production rate of ROx was (1.3 ± 1.1) × 105 cm
3
s-1
(median = 1.0 × 105 cm
3 s
-1) for the entire data set, (1.6 ± 1.4) × 10
5 cm
3 s
-1 (median = 1.2 × 10
5 cm
3
s-1
) for the summer campaign and (1.0 ± 0.4) × 105 cm
3 s
-1 (median = 0.9 × 10
5 cm
3 s
-1) for the winter
campaign. The average total loss rate of ROx was (1.6 ± 1.2) × 105 cm
3 s
-1 (median = 1.2 × 10
5 cm
3 s
-1)
for the entire data set, (1.9 ± 1.4) × 105 cm
3 s
-1 (median = 1.6 × 10
5 cm
3 s
-1) for the summer campaign
and (1.0 ± 0.3) × 105 cm
3 s
-1 (median = 0.9 × 10
5 cm
3 s
-1) for the winter campaign.
Fig. 7. Processes controlling the instantaneous production(a)and loss (b) of ROx (= RO+ RO2+ OH+ HO2) radicals atnight. The upper panels show the summer and winter campaignmeans combined, with the lower panels showing the summercampaign means (left hand side) and winter campaign means(right hand side). The average total production rate of ROx was(1.3± 1.1)× 105 cm−3 s−1 (median = 1.0× 105 cm−3 s−1)
for the entire data set, (1.6± 1.4)× 105 cm−3 s−1 (median= 1.2 × 105 cm−3 s−1) for the summer campaign and (1.0± 0.4)× 105 cm−3 s−1 (median = 0.9 × 105 cm−3 s−1) forthe winter campaign. The average total loss rate of ROx was(1.6± 1.2)× 105 cm−3 s−1 (median = 1.2× 105 cm−3 s−1)
for the entire data set, (1.9± 1.4)× 105 cm−3 s−1 (me-dian = 1.6× 105 cm−3 s−1) for the summer campaign and(1.0± 0.3)× 105 cm−3 s−1 (median = 0.9× 105 cm−3 s−1) forthe winter campaign.
with trans-2-butene (51 %), propene (22 %), ethene (13 %)andiso-butene (5 %). Reactions of NO3 with aldehydes alsoresult in radical production at night, particularly during thewinter campaign, with NO3 + HCHO contributing the great-est influence from aldehyde species.
Figure 7 shows that radical loss is controlled by a numberof processes. Production of peroxides, through RO2+ HO2and HO2+ HO2, represents 21 % of the ROx radical loss,on average, followed by production of HNO3 by OH+ NO2(16 %), decomposition reactions of RO radicals to producestable products (14 %) and heterogeneous losses (2 %). Thelarge fraction of remaining loss processes (47 % of the total)is comprised largely of a myriad of RONO2 and RO2NO2production routes.
Overall, reactions of NO3 with VOCs typically control theproduction of radicals during the campaign, with the unsat-urated C4 compounds dominating. There are a significantnumber of radical loss processes which produce organic ni-trogen compounds, peroxides and nitric acid.
6.3 HOx radical budgets
The processes controlling production and loss of nighttimeHOx (HOx = OH+ HO2) radicals during RONOCO areshown in Fig. 9. Alkoxy radicals (RO), produced primarilyfollowing production of RO2 from NO3+ alkene reactionsand the subsequent reactions of RO2 with NO3, are a majorsource of HOx, producing HO2 through RO+ O2 reactionsand on average representing 63 % of the total HOx produc-tion. Specifically, the reaction of methoxy radicals (CH3O)with O2 dominates the HOx production from RO radicals(31 % of the total HOx production), with CH3O primarilyproduced at night by CH3O2+ NO3, and nighttime CH3O2production primarily occurring through OH-initiated oxida-tion of CH4 (48 %) and alkene ozonolysis reactions (37 %).Alkene ozonolysis reactions also produce OH and HO2 rad-icals directly through the decomposition of Criegee interme-diates, and are responsible for 20 % of the total HOx produc-tion, although there is still much uncertainty regarding radi-cal yields from ozonolysis reactions (Johnson and Marston,2008). A further 17 % of HOx radicals are generated as a re-sult of direct HO2 production by NO3+ HCHO, using modelcalculated HCHO concentrations.
Reactions of HO2 producing peroxides (HO2+ RO2 andHO2+ HO2) and formation of HNO3 by the reaction of OHwith NO2 represent major sinks for HOx radicals, compris-ing 23 and 25 % of the total loss, respectively. Heterogeneousloss of OH and HO2, primarily through aerosol uptake ofHO2, represents 11 % of the total HOx sink, and is more sig-nificant during winter (contributing 13 % to the total HOxloss) compared to summer (contributing 4 % to the total HOxloss). The remainder of HOx loss occurs primarily throughreactions of OH with VOCs, with OH+ CH4 alone consti-tuting 19 % of the total HOx sink.
www.atmos-chem-phys.net/14/1299/2014/ Atmos. Chem. Phys., 14, 1299–1321, 2014
1310 D. Stone et al.: Radical chemistry at night
46
Figure 8: Reactivity of (a) NO3 and (b) O3 towards observed volatile organic compounds (VOCs) at
night during the RONOCO project. The upper panels show the summer and winter campaign means
combined, with the lower panels showing the summer campaign means (left hand side) and winter
campaign means (right hand side). The average NO3 reactivity towards VOCs was 6.6 × 104 cm
3 s
-1
(median = 5.3 × 104 cm
3 s
-1) for the entire data set, 6.8 × 10
4 cm
3 s
-1 (median = 4.6 × 10
4 cm
3 s
-1) for
the summer campaign and 6.2 × 104 cm
3 s
-1 (median = 6.0 × 10
4 cm
3 s
-1) for the winter campaign. The
average O3 reactivity towards VOCs was 2.1 × 104 cm
3 s
-1 (median = 2.1 × 10
4 cm
3 s
-1) for the entire
data set, 1.8 × 104 cm
3 s
-1 (median = 1.7 × 10
4 cm
3 s
-1) for the summer campaign and 2.9 × 10
4 cm
3 s
-1
(median = 2.6 × 104 cm
3 s
-1) for the winter campaign.
Fig. 8. Reactivity of(a) NO3 and(b) O3 towards observed VOCsat night during the RONOCO project. The upper panels show thesummer and winter campaign means combined, with the lowerpanels showing the summer campaign means (left hand side) andwinter campaign means (right hand side). The average NO3 re-activity towards VOCs was 6.6× 104 cm−3 s−1 (median= 5.3× 104 cm−3 s−1) for the entire data set, 6.8× 104 cm−3 s−1
(median= 4.6× 104 cm−3 s−1) for the summer campaign and6.2× 104 cm−3 s−1 (median= 6.0× 104 cm−3 s−1) for the win-ter campaign. The average O3 reactivity towards VOCs was 2.1× 104 cm−3 s−1 (median = 2.1× 104 cm−3 s−1) for the en-tire data set, 1.8× 104 cm−3 s−1 (median= 1.7× 104 cm−3 s−1)
for the summer campaign and 2.9× 104 cm−3 s−1 (median =
2.6× 104 cm−3 s−1) for the winter campaign.
47
Figure 9: Processes controlling the instantaneous production (a) and loss (b) of HOx (= OH + HO2)
radicals at night. The upper panels show the summer and winter campaign means combined, with the
lower panels showing the summer campaign means (left hand side) and winter campaign means (right
hand side). The average total production rate of HOx was (6.7 ± 4.7) × 104 cm
3 s
-1 (median = 5.7 × 10
4
cm3 s
-1) for the entire data set, (7.4 ± 5.7) × 10
4 cm
3 s
-1 (median = 5.7 × 10
4 cm
3 s
-1) for the summer
campaign and (5.7 ± 2.1) × 104 cm
3 s
-1 (median = 5.6 × 10
4 cm
3 s
-1) for the winter campaign. The
average total loss rate of HOx was (7.1 ± 4.9) × 104 cm
3 s
-1 (median = 6.0 × 10
4 cm
3 s
-1) for the entire
data set, (7.7 ± 6.0) × 104 cm
3 s
-1 (median = 6.0 × 10
4 cm
3 s
-1) for the summer campaign and (6.0 ± 2.2)
× 104 cm
3 s
-1 (median = 5.9 × 10
4 cm
3 s
-1) for the winter campaign.
Fig. 9. Processes controlling the instantaneous production(a) andloss (b) of HOx (i.e. OH+ HO2) radicals at night. The upperpanels show the summer and winter campaign means combined,with the lower panels showing the summer campaign means (lefthand side) and winter campaign means (right hand side). The aver-age total production rate of HOx was (6.7± 4.7)× 104 cm−3 s−1
(median = 5.7 × 104 cm−3 s−1) for the entire data set,(7.4± 5.7)× 104 cm−3 s−1 (median = 5.7× 104 cm−3 s−1) forthe summer campaign and (5.7± 2.1) × 104 cm−3 s−1 (me-dian = 5.6× 104 cm−3 s−1) for the winter campaign. The av-erage total loss rate of HOx was (7.1± 4.9)× 104 cm−3 s−1
(median= 6.0× 104 cm−3 s−1) for the entire data set, (7.7±6.0)× 104 cm−3 s−1 (median= 6.0× 104 cm−3 s−1) for the sum-mer campaign and (6.0± 2.2)× 104 cm−3 s−1 (median= 5.9 ×
104 cm−3 s−1) for the winter campaign.
Atmos. Chem. Phys., 14, 1299–1321, 2014 www.atmos-chem-phys.net/14/1299/2014/
D. Stone et al.: Radical chemistry at night 1311
48
Figure 10: Processes controlling the instantaneous production (a) and loss (b) of HO2 radicals at night.
The upper panels show the summer and winter campaign means combined, with the lower panels
showing the summer campaign means (left hand side) and winter campaign means (right hand side).
The average total production rate of HO2 was (9.3 ± 5.6) × 104 cm
3 s
-1 (median = 7.9 × 10
4 cm
3 s
-1) for
the entire data set, (9.8 ± 6.7) × 104 cm
3 s
-1 (median = 7.9 × 10
4 cm
3 s
-1) for the summer campaign and
(8.5 ± 3.1) × 104 cm
3 s
-1 (median = 7.9 × 10
4 cm
3 s
-1) for the winter campaign. The average total loss
rate of HO2 was (9.4 ± 5.8) × 104 cm
3 s
-1 (median = 8.1 × 10
4 cm
3 s
-1) for the entire data set, (9.9 ± 7.0)
× 104 cm
3 s
-1 (median = 8.0 × 10
4 cm
3 s
-1) for the summer campaign and (8.8 ± 3.2) × 10
4 cm
3 s
-1
(median = 8.2 × 104 cm
3 s
-1) for the winter campaign.
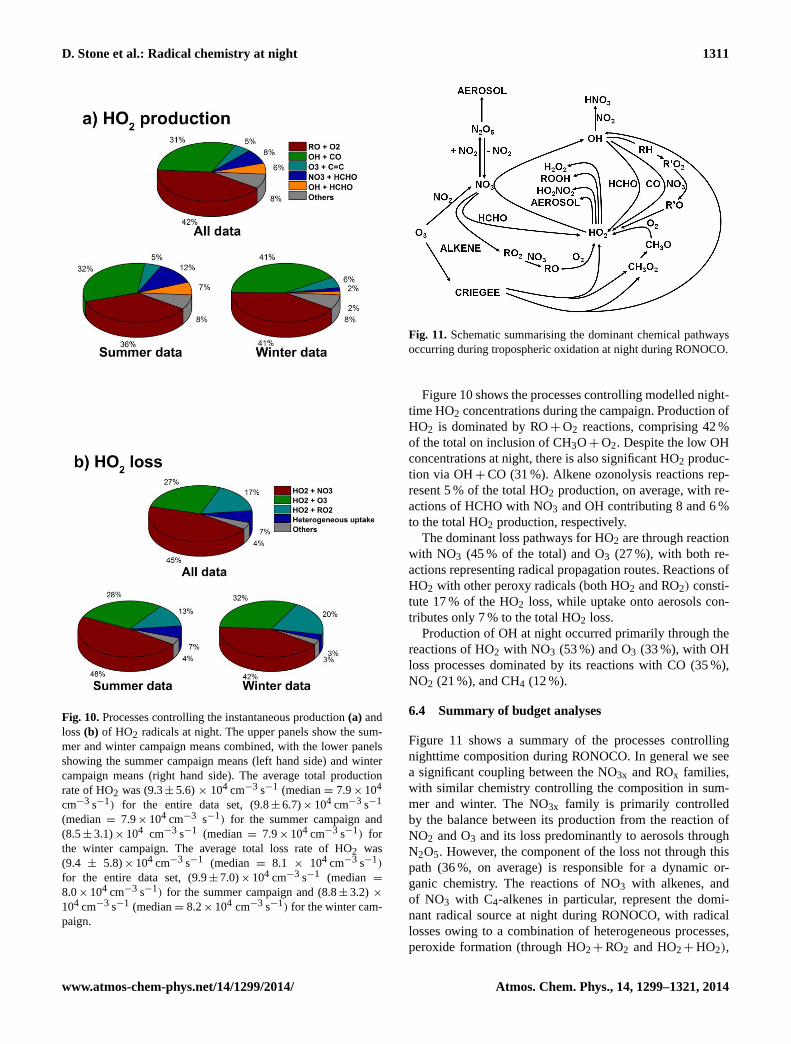
Fig. 10.Processes controlling the instantaneous production(a) andloss(b) of HO2 radicals at night. The upper panels show the sum-mer and winter campaign means combined, with the lower panelsshowing the summer campaign means (left hand side) and wintercampaign means (right hand side). The average total productionrate of HO2 was (9.3± 5.6)× 104 cm−3 s−1 (median= 7.9× 10⁴
cm−3 s−1) for the entire data set, (9.8± 6.7)× 104 cm−3 s−1
(median= 7.9× 104 cm−3 s−1) for the summer campaign and(8.5± 3.1)× 104 cm−3 s−1 (median= 7.9× 104 cm−3 s−1) forthe winter campaign. The average total loss rate of HO2 was(9.4 ± 5.8)× 104 cm−3 s−1 (median = 8.1 × 104 cm−3 s−1)
for the entire data set, (9.9± 7.0)× 104 cm−3 s−1 (median =
8.0× 104 cm−3 s−1) for the summer campaign and (8.8± 3.2) ×
104 cm−3 s−1 (median= 8.2× 104 cm−3 s−1) for the winter cam-paign.
49
Figure 11: Schematic summarising the dominant chemical pathways occurring during tropospheric
oxidation at night during RONOCO.
Fig. 11. Schematic summarising the dominant chemical pathwaysoccurring during tropospheric oxidation at night during RONOCO.
Figure 10 shows the processes controlling modelled night-time HO2 concentrations during the campaign. Production ofHO2 is dominated by RO+ O2 reactions, comprising 42 %of the total on inclusion of CH3O+ O2. Despite the low OHconcentrations at night, there is also significant HO2 produc-tion via OH+ CO (31 %). Alkene ozonolysis reactions rep-resent 5 % of the total HO2 production, on average, with re-actions of HCHO with NO3 and OH contributing 8 and 6 %to the total HO2 production, respectively.
The dominant loss pathways for HO2 are through reactionwith NO3 (45 % of the total) and O3 (27 %), with both re-actions representing radical propagation routes. Reactions ofHO2 with other peroxy radicals (both HO2 and RO2) consti-tute 17 % of the HO2 loss, while uptake onto aerosols con-tributes only 7 % to the total HO2 loss.
Production of OH at night occurred primarily through thereactions of HO2 with NO3 (53 %) and O3 (33 %), with OHloss processes dominated by its reactions with CO (35 %),NO2 (21 %), and CH4 (12 %).
6.4 Summary of budget analyses
Figure 11 shows a summary of the processes controllingnighttime composition during RONOCO. In general we seea significant coupling between the NO3x and ROx families,with similar chemistry controlling the composition in sum-mer and winter. The NO3x family is primarily controlledby the balance between its production from the reaction ofNO2 and O3 and its loss predominantly to aerosols throughN2O5. However, the component of the loss not through thispath (36 %, on average) is responsible for a dynamic or-ganic chemistry. The reactions of NO3 with alkenes, andof NO3 with C4-alkenes in particular, represent the domi-nant radical source at night during RONOCO, with radicallosses owing to a combination of heterogeneous processes,peroxide formation (through HO2+ RO2 and HO2+ HO2),
www.atmos-chem-phys.net/14/1299/2014/ Atmos. Chem. Phys., 14, 1299–1321, 2014
1312 D. Stone et al.: Radical chemistry at night
decomposition of alkoxy radicals and formation of HNO3through the reaction of OH with NO2. The propagation ofthe radical oxidation chemistry, which during the day wouldbe controlled by NO is, at night, controlled by NO3. Thus theNO3 radical acts both as a chain initiator (like OH during theday) and the chain propagator (like NO during the day).
Production of HOx radicals is typically dominated by re-actions of RO radicals with O2, with a minor contributionfrom alkene ozonolysis reactions. Loss of HOx is largelycontrolled by HO2+ RO2 reactions and OH+ NO2, whilethe loss of HO2 is typically dominated by the radical propa-gation reactions HO2+ NO3 and HO2+ O3.
Now that the chemistry occurring in the model during thenight has been described, the model sensitivity to variousuncertainties can be evaluated so that the reasons for themodel’s overprediction of NO3x and underprediction of HO2can be investigated.
7 Sources of model uncertainties
Model calculations for RONOCO display a tendency to un-derpredict HO2* whilst overpredicting NO3 and N2O5. Inthis section we investigate the impact of potential sources ofuncertainty on models of nighttime chemistry and composi-tion. First we consider the impact of the timescale adoptedin the model to describe physical losses of long-lived speciesin the model. Secondly, given the role of heterogenous up-take of N2O5 in determining NO3x loss processes and thesignificant uncertainty in uptake coefficients in the literature(Brown et al., 2006, 2009, 2011; Escoreia et al., 2010; Tanget al., 2010; Badger et al., 2006; Thornton and Abbatt, 2005;Hallquist et al., 2003; Thornton et al., 2003; Kane et al.,2001; Hu and Abbatt, 1997; Fried et al., 1994; Van Dorenet al., 1991; Hanson and Ravishankara, 1991; Mozurkewichand Calvert, 1998) we investigate the model sensitivity toγN2O5 and to the model description of heterogeneous uptakeon aerosol surfaces. We then focus on model uncertaintieswhich have the potential to rectify both the model underpre-diction of HO2* and overprediction of NO3x, i.e. parameterswhich are simultaneously sinks of NO3x and sources of HOxsuch as the reaction rate between NO3 and RO2 and the im-pact of missing VOCs.
7.1 Impact of timescale for physical loss
As described in Sect. 4, model calculations reported hereinclude a first-order loss process to represent continuousphysical loss processes to prevent the build-up of unmea-sured species in the model. In our previous work as part ofthe African Monsoon Multidisciplinary Analyses (AMMA)campaign we investigated the impact of the rate of physi-cal loss on HOx simulations (Stone et al., 2010). Results ofmodel simulations for daytime chemistry during AMMA in-dicated little impact of the physical loss rate on modelled
50
Figure 12: Sensitivity of median modelled to observed ratios of HO2* (blue), NO3 (red) and N2O5
(green) towards (a) the deposition lifetime adopted in the model; (b) γN2O5; (c) rate coefficients for NO3
+ RO2 (kNO3+RO2) adopted in the model; (d) concentrations of unsaturated VOCs in the model. Changes
to kNO3+RO2 and unsaturated VOC concentrations are represented as the factor by which kNO3+RO2 and
total unsaturated VOC concentration have been increased compared to the base run.
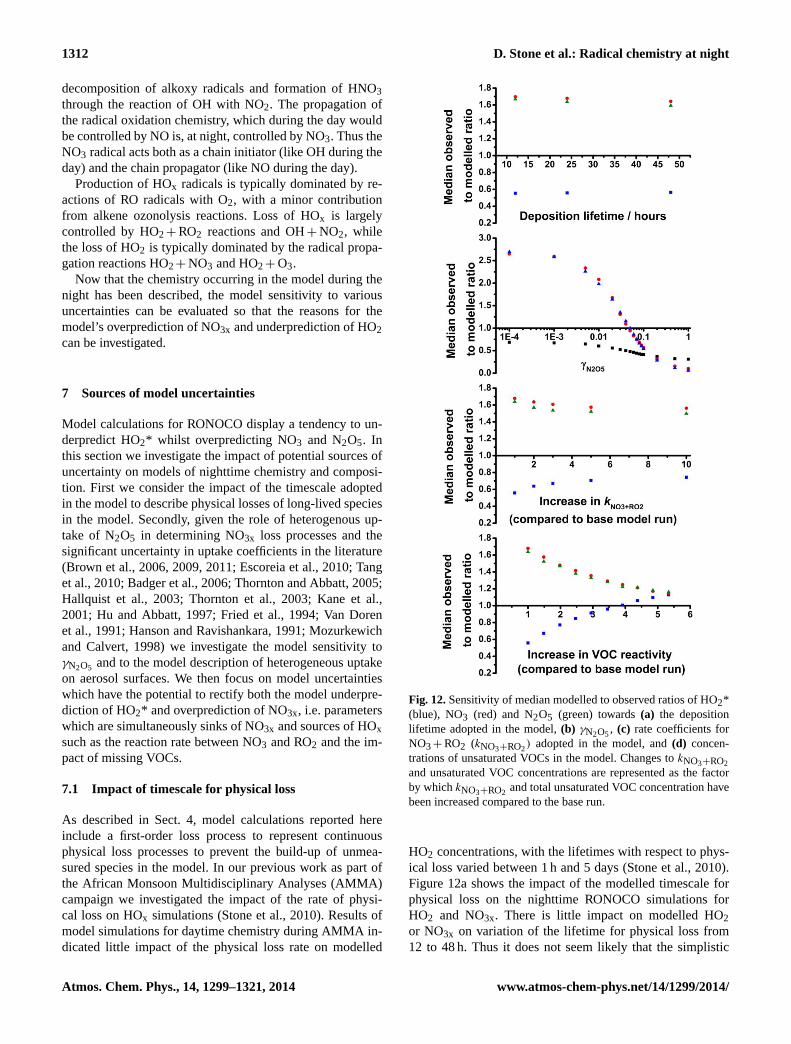
Fig. 12.Sensitivity of median modelled to observed ratios of HO2*(blue), NO3 (red) and N2O5 (green) towards(a) the depositionlifetime adopted in the model,(b) γN2O5, (c) rate coefficients forNO3+ RO2 (kNO3+RO2) adopted in the model, and(d) concen-trations of unsaturated VOCs in the model. Changes tokNO3+RO2and unsaturated VOC concentrations are represented as the factorby whichkNO3+RO2 and total unsaturated VOC concentration havebeen increased compared to the base run.
HO2 concentrations, with the lifetimes with respect to phys-ical loss varied between 1 h and 5 days (Stone et al., 2010).Figure 12a shows the impact of the modelled timescale forphysical loss on the nighttime RONOCO simulations forHO2 and NO3x. There is little impact on modelled HO2or NO3x on variation of the lifetime for physical loss from12 to 48 h. Thus it does not seem likely that the simplistic
Atmos. Chem. Phys., 14, 1299–1321, 2014 www.atmos-chem-phys.net/14/1299/2014/
D. Stone et al.: Radical chemistry at night 1313
51
Figure 13: Normalised probability distribution function for optimised values of γN2O5.
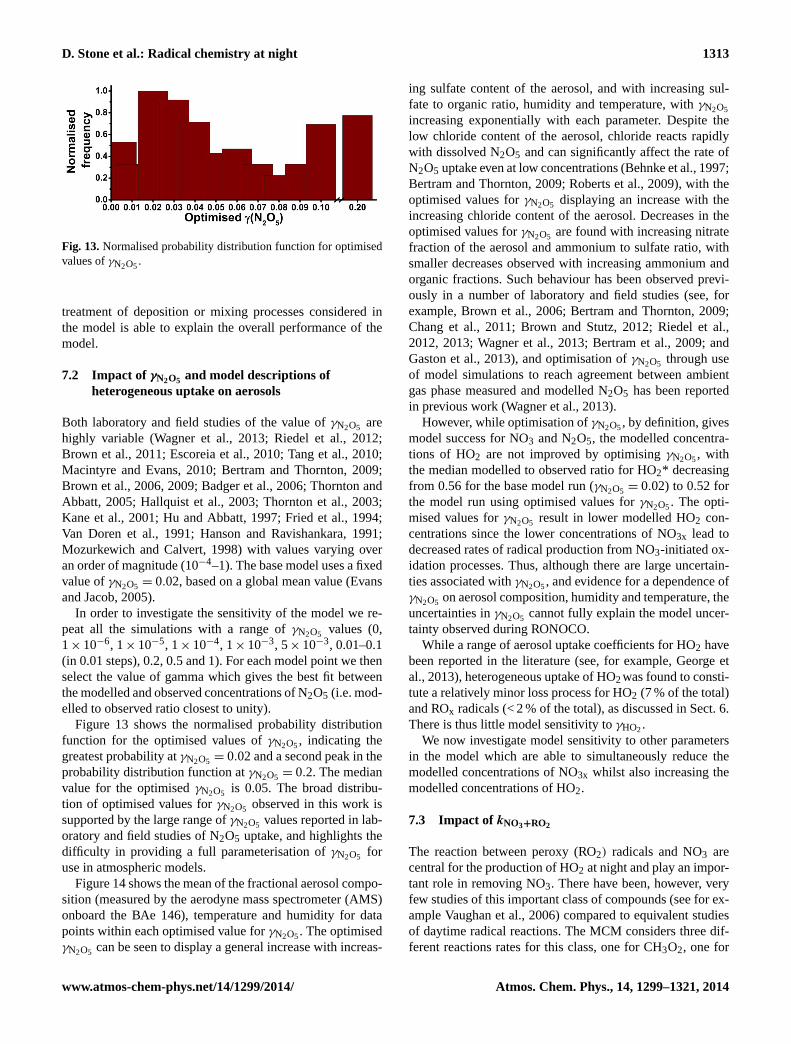
Fig. 13.Normalised probability distribution function for optimisedvalues ofγN2O5.
treatment of deposition or mixing processes considered inthe model is able to explain the overall performance of themodel.
7.2 Impact of γN2O5 and model descriptions ofheterogeneous uptake on aerosols
Both laboratory and field studies of the value ofγN2O5 arehighly variable (Wagner et al., 2013; Riedel et al., 2012;Brown et al., 2011; Escoreia et al., 2010; Tang et al., 2010;Macintyre and Evans, 2010; Bertram and Thornton, 2009;Brown et al., 2006, 2009; Badger et al., 2006; Thornton andAbbatt, 2005; Hallquist et al., 2003; Thornton et al., 2003;Kane et al., 2001; Hu and Abbatt, 1997; Fried et al., 1994;Van Doren et al., 1991; Hanson and Ravishankara, 1991;Mozurkewich and Calvert, 1998) with values varying overan order of magnitude (10−4–1). The base model uses a fixedvalue ofγN2O5 = 0.02, based on a global mean value (Evansand Jacob, 2005).
In order to investigate the sensitivity of the model we re-peat all the simulations with a range ofγN2O5 values (0,1× 10⁻⁶, 1× 10⁻⁵, 1× 10⁻⁴, 1× 10⁻³, 5× 10⁻³, 0.01–0.1(in 0.01 steps), 0.2, 0.5 and 1). For each model point we thenselect the value of gamma which gives the best fit betweenthe modelled and observed concentrations of N2O5 (i.e. mod-elled to observed ratio closest to unity).
Figure 13 shows the normalised probability distributionfunction for the optimised values ofγN2O5, indicating thegreatest probability atγN2O5 = 0.02 and a second peak in theprobability distribution function atγN2O5 = 0.2. The medianvalue for the optimisedγN2O5 is 0.05. The broad distribu-tion of optimised values forγN2O5 observed in this work issupported by the large range ofγN2O5 values reported in lab-oratory and field studies of N2O5 uptake, and highlights thedifficulty in providing a full parameterisation ofγN2O5 foruse in atmospheric models.
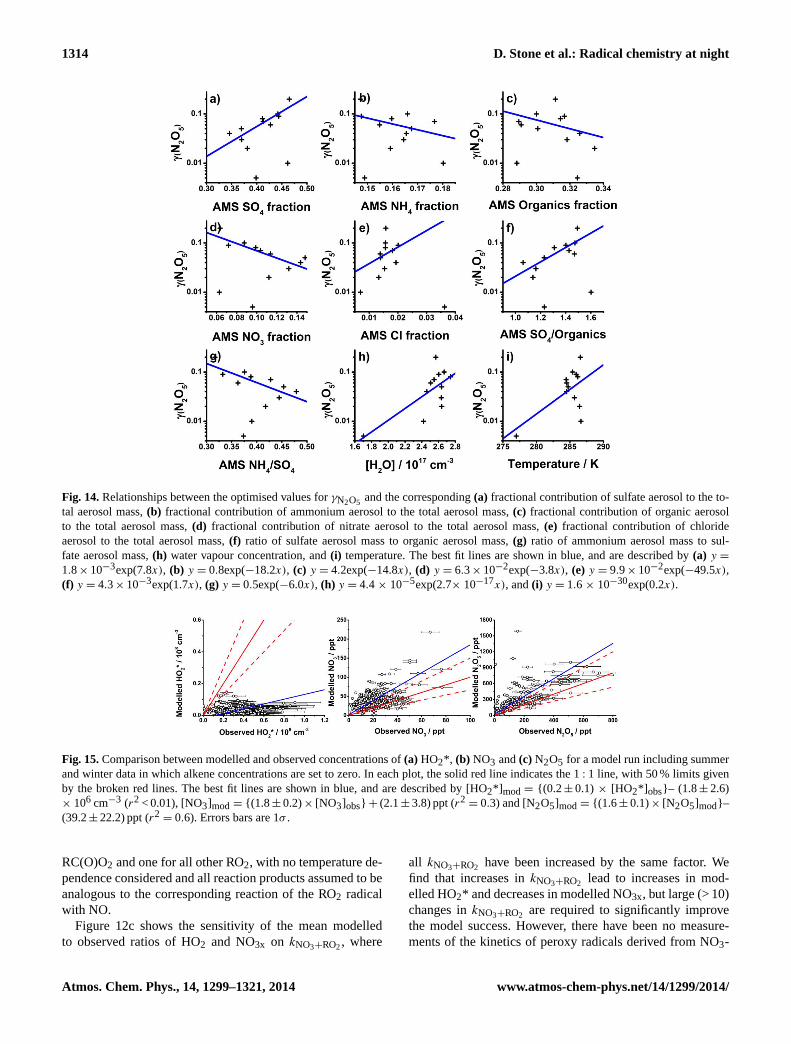
Figure 14 shows the mean of the fractional aerosol compo-sition (measured by the aerodyne mass spectrometer (AMS)onboard the BAe 146), temperature and humidity for datapoints within each optimised value forγN2O5. The optimisedγN2O5 can be seen to display a general increase with increas-
ing sulfate content of the aerosol, and with increasing sul-fate to organic ratio, humidity and temperature, withγN2O5
increasing exponentially with each parameter. Despite thelow chloride content of the aerosol, chloride reacts rapidlywith dissolved N2O5 and can significantly affect the rate ofN2O5 uptake even at low concentrations (Behnke et al., 1997;Bertram and Thornton, 2009; Roberts et al., 2009), with theoptimised values forγN2O5 displaying an increase with theincreasing chloride content of the aerosol. Decreases in theoptimised values forγN2O5 are found with increasing nitratefraction of the aerosol and ammonium to sulfate ratio, withsmaller decreases observed with increasing ammonium andorganic fractions. Such behaviour has been observed previ-ously in a number of laboratory and field studies (see, forexample, Brown et al., 2006; Bertram and Thornton, 2009;Chang et al., 2011; Brown and Stutz, 2012; Riedel et al.,2012, 2013; Wagner et al., 2013; Bertram et al., 2009; andGaston et al., 2013), and optimisation ofγN2O5 through useof model simulations to reach agreement between ambientgas phase measured and modelled N2O5 has been reportedin previous work (Wagner et al., 2013).
However, while optimisation ofγN2O5, by definition, givesmodel success for NO3 and N2O5, the modelled concentra-tions of HO2 are not improved by optimisingγN2O5, withthe median modelled to observed ratio for HO2* decreasingfrom 0.56 for the base model run (γN2O5 = 0.02) to 0.52 forthe model run using optimised values forγN2O5. The opti-mised values forγN2O5 result in lower modelled HO2 con-centrations since the lower concentrations of NO3x lead todecreased rates of radical production from NO3-initiated ox-idation processes. Thus, although there are large uncertain-ties associated withγN2O5, and evidence for a dependence ofγN2O5 on aerosol composition, humidity and temperature, theuncertainties inγN2O5 cannot fully explain the model uncer-tainty observed during RONOCO.
While a range of aerosol uptake coefficients for HO2 havebeen reported in the literature (see, for example, George etal., 2013), heterogeneous uptake of HO2was found to consti-tute a relatively minor loss process for HO2 (7 % of the total)and ROx radicals (< 2 % of the total), as discussed in Sect. 6.There is thus little model sensitivity toγHO2.
We now investigate model sensitivity to other parametersin the model which are able to simultaneously reduce themodelled concentrations of NO3x whilst also increasing themodelled concentrations of HO2.
7.3 Impact of kNO3+RO2
The reaction between peroxy (RO2) radicals and NO3 arecentral for the production of HO2 at night and play an impor-tant role in removing NO3. There have been, however, veryfew studies of this important class of compounds (see for ex-ample Vaughan et al., 2006) compared to equivalent studiesof daytime radical reactions. The MCM considers three dif-ferent reactions rates for this class, one for CH3O2, one for
www.atmos-chem-phys.net/14/1299/2014/ Atmos. Chem. Phys., 14, 1299–1321, 2014
1314 D. Stone et al.: Radical chemistry at night
52
Figure 14: Relationships between the optimised values for γN2O5 and the corresponding (a) fractional
contribution of sulfate aerosol to the total aerosol mass, (b) fractional contribution of ammonium
aerosol to the total aerosol mass, (c) fractional contribution of organic aerosol to the total aerosol mass,
(d) fractional contribution of nitrate aerosol to the total aerosol mass, (e) fractional contribution of
chloride aerosol to the total aerosol mass, (f) ratio of sulfate aerosol mass to organic aerosol mass, (g)
ratio of ammonium aerosol mass to sulfate aerosol mass, (h) water vapour concentration, and (i)
temperature. The best fit lines are shown in blue, and are described by (a) y = 1.8 × 10⁻³
exp(7.8x), (b) y
= 0.8exp(-18.2x), (c) y = 4.2exp(-14.8x), (d) y = 6.3 × 10⁻²
exp(-3.8x), (e) y = 9.9 × 10⁻²
exp(-49.5x), (f) y
= 4.3 × 10⁻³
exp(1.7x), (g) y = 0.5exp(-6.0x), (h) y = 4.4 × 10⁻⁵
exp(2.7× 10⁻¹⁷
x), and (i) y = 1.6 × 10-
30exp(0.2x).
Fig. 14.Relationships between the optimised values forγN2O5 and the corresponding(a) fractional contribution of sulfate aerosol to the to-tal aerosol mass,(b) fractional contribution of ammonium aerosol to the total aerosol mass,(c) fractional contribution of organic aerosolto the total aerosol mass,(d) fractional contribution of nitrate aerosol to the total aerosol mass,(e) fractional contribution of chlorideaerosol to the total aerosol mass,(f) ratio of sulfate aerosol mass to organic aerosol mass,(g) ratio of ammonium aerosol mass to sul-fate aerosol mass,(h) water vapour concentration, and(i) temperature. The best fit lines are shown in blue, and are described by(a) y =
1.8× 10⁻³exp(7.8x), (b) y = 0.8exp(−18.2x), (c) y = 4.2exp(−14.8x), (d) y = 6.3× 10⁻²exp(−3.8x), (e) y = 9.9× 10⁻²exp(−49.5x),(f) y = 4.3× 10⁻³exp(1.7x), (g) y = 0.5exp(−6.0x), (h) y = 4.4 × 10⁻⁵exp(2.7× 10⁻¹⁷x), and(i) y = 1.6 × 10⁻³⁰exp(0.2x).
53
Figure 15: Comparison between modelled and observed concentrations of (a) HO2*, (b) NO3 and (c)
N2O5 for a model run including summer and winter data in which alkene concentrations are set to zero.
In each plot, the solid red line indicates the 1:1 line, with 50 % limits given by the broken red lines.
The best fit lines are shown in blue, and are described by [HO2*]mod = {(0.2 ± 0.1) × [HO2*]obs} – (1.8
± 2.6) × 106 cm
-3 (r
2 < 0.01), [NO3]mod = {(1.8 ± 0.2) × [NO3]obs} + (2.1 ± 3.8) ppt (r
2 = 0.3) and
[N2O5]mod = {(1.6 ± 0.1) × [N2O5]mod} – (39.2 ± 22.2) ppt (r2 = 0.6). Error bars are the 1σ calibration
uncertainties.
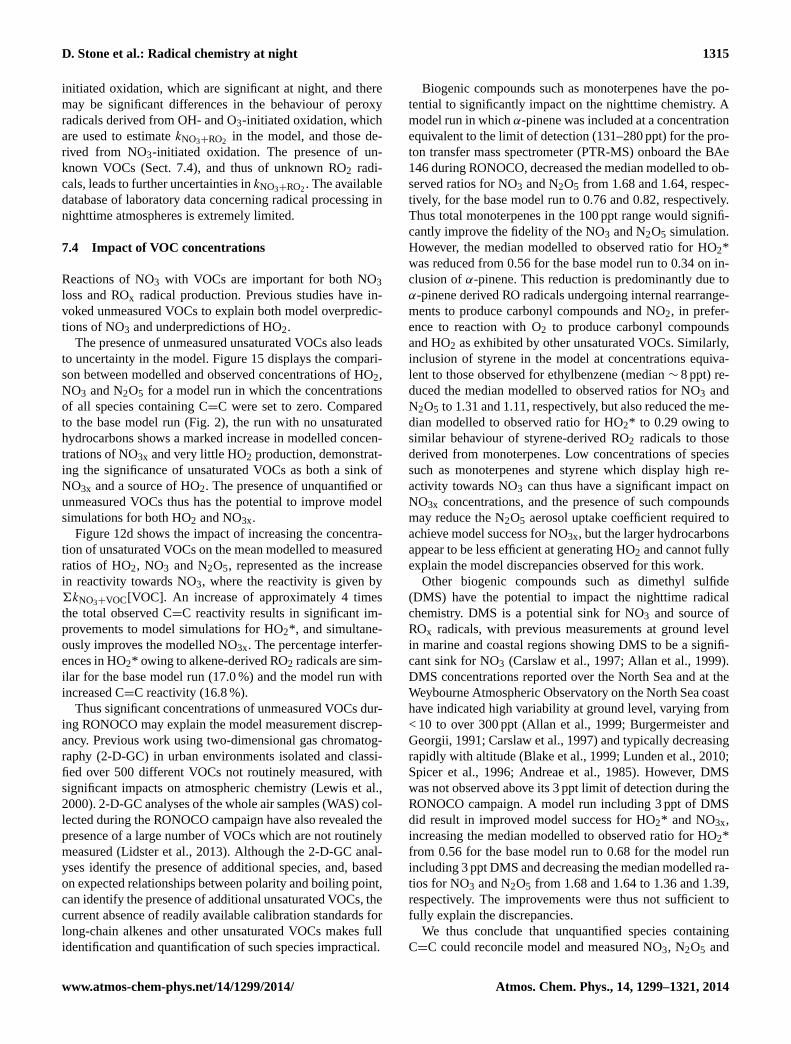
Fig. 15.Comparison between modelled and observed concentrations of(a) HO2*, (b) NO3 and(c) N2O5 for a model run including summerand winter data in which alkene concentrations are set to zero. In each plot, the solid red line indicates the 1: 1 line, with 50 % limits givenby the broken red lines. The best fit lines are shown in blue, and are described by [HO2*] mod= {(0.2 ± 0.1) × [HO2*] obs}– (1.8± 2.6)× 106 cm−3 (r2 < 0.01), [NO3]mod = {(1.8 ± 0.2)× [NO3]obs} + (2.1± 3.8) ppt (r2
= 0.3) and [N2O5]mod= {(1.6 ± 0.1)× [N2O5]mod}–(39.2± 22.2) ppt (r2
= 0.6). Errors bars are 1σ .
RC(O)O2 and one for all other RO2, with no temperature de-pendence considered and all reaction products assumed to beanalogous to the corresponding reaction of the RO2 radicalwith NO.
Figure 12c shows the sensitivity of the mean modelledto observed ratios of HO2 and NO3x on kNO3+RO2, where
all kNO3+RO2 have been increased by the same factor. Wefind that increases inkNO3+RO2 lead to increases in mod-elled HO2* and decreases in modelled NO3x, but large (> 10)changes inkNO3+RO2 are required to significantly improvethe model success. However, there have been no measure-ments of the kinetics of peroxy radicals derived from NO3-
Atmos. Chem. Phys., 14, 1299–1321, 2014 www.atmos-chem-phys.net/14/1299/2014/
D. Stone et al.: Radical chemistry at night 1315
initiated oxidation, which are significant at night, and theremay be significant differences in the behaviour of peroxyradicals derived from OH- and O3-initiated oxidation, whichare used to estimatekNO3+RO2 in the model, and those de-rived from NO3-initiated oxidation. The presence of un-known VOCs (Sect. 7.4), and thus of unknown RO2 radi-cals, leads to further uncertainties inkNO3+RO2. The availabledatabase of laboratory data concerning radical processing innighttime atmospheres is extremely limited.
7.4 Impact of VOC concentrations
Reactions of NO3 with VOCs are important for both NO3loss and ROx radical production. Previous studies have in-voked unmeasured VOCs to explain both model overpredic-tions of NO3 and underpredictions of HO2.
The presence of unmeasured unsaturated VOCs also leadsto uncertainty in the model. Figure 15 displays the compari-son between modelled and observed concentrations of HO2,NO3 and N2O5 for a model run in which the concentrationsof all species containing C=C were set to zero. Comparedto the base model run (Fig. 2), the run with no unsaturatedhydrocarbons shows a marked increase in modelled concen-trations of NO3x and very little HO2 production, demonstrat-ing the significance of unsaturated VOCs as both a sink ofNO3x and a source of HO2. The presence of unquantified orunmeasured VOCs thus has the potential to improve modelsimulations for both HO2 and NO3x.
Figure 12d shows the impact of increasing the concentra-tion of unsaturated VOCs on the mean modelled to measuredratios of HO2, NO3 and N2O5, represented as the increasein reactivity towards NO3, where the reactivity is given by6kNO3+VOC[VOC]. An increase of approximately 4 timesthe total observed C=C reactivity results in significant im-provements to model simulations for HO2*, and simultane-ously improves the modelled NO3x. The percentage interfer-ences in HO2* owing to alkene-derived RO2 radicals are sim-ilar for the base model run (17.0 %) and the model run withincreased C=C reactivity (16.8 %).
Thus significant concentrations of unmeasured VOCs dur-ing RONOCO may explain the model measurement discrep-ancy. Previous work using two-dimensional gas chromatog-raphy (2-D-GC) in urban environments isolated and classi-fied over 500 different VOCs not routinely measured, withsignificant impacts on atmospheric chemistry (Lewis et al.,2000). 2-D-GC analyses of the whole air samples (WAS) col-lected during the RONOCO campaign have also revealed thepresence of a large number of VOCs which are not routinelymeasured (Lidster et al., 2013). Although the 2-D-GC anal-yses identify the presence of additional species, and, basedon expected relationships between polarity and boiling point,can identify the presence of additional unsaturated VOCs, thecurrent absence of readily available calibration standards forlong-chain alkenes and other unsaturated VOCs makes fullidentification and quantification of such species impractical.
Biogenic compounds such as monoterpenes have the po-tential to significantly impact on the nighttime chemistry. Amodel run in whichα-pinene was included at a concentrationequivalent to the limit of detection (131–280 ppt) for the pro-ton transfer mass spectrometer (PTR-MS) onboard the BAe146 during RONOCO, decreased the median modelled to ob-served ratios for NO3 and N2O5 from 1.68 and 1.64, respec-tively, for the base model run to 0.76 and 0.82, respectively.Thus total monoterpenes in the 100 ppt range would signifi-cantly improve the fidelity of the NO3 and N2O5 simulation.However, the median modelled to observed ratio for HO2*was reduced from 0.56 for the base model run to 0.34 on in-clusion ofα-pinene. This reduction is predominantly due toα-pinene derived RO radicals undergoing internal rearrange-ments to produce carbonyl compounds and NO2, in prefer-ence to reaction with O2 to produce carbonyl compoundsand HO2 as exhibited by other unsaturated VOCs. Similarly,inclusion of styrene in the model at concentrations equiva-lent to those observed for ethylbenzene (median∼ 8 ppt) re-duced the median modelled to observed ratios for NO3 andN2O5 to 1.31 and 1.11, respectively, but also reduced the me-dian modelled to observed ratio for HO2* to 0.29 owing tosimilar behaviour of styrene-derived RO2 radicals to thosederived from monoterpenes. Low concentrations of speciessuch as monoterpenes and styrene which display high re-activity towards NO3 can thus have a significant impact onNO3x concentrations, and the presence of such compoundsmay reduce the N2O5 aerosol uptake coefficient required toachieve model success for NO3x, but the larger hydrocarbonsappear to be less efficient at generating HO2 and cannot fullyexplain the model discrepancies observed for this work.
Other biogenic compounds such as dimethyl sulfide(DMS) have the potential to impact the nighttime radicalchemistry. DMS is a potential sink for NO3 and source ofROx radicals, with previous measurements at ground levelin marine and coastal regions showing DMS to be a signifi-cant sink for NO3 (Carslaw et al., 1997; Allan et al., 1999).DMS concentrations reported over the North Sea and at theWeybourne Atmospheric Observatory on the North Sea coasthave indicated high variability at ground level, varying from< 10 to over 300 ppt (Allan et al., 1999; Burgermeister andGeorgii, 1991; Carslaw et al., 1997) and typically decreasingrapidly with altitude (Blake et al., 1999; Lunden et al., 2010;Spicer et al., 1996; Andreae et al., 1985). However, DMSwas not observed above its 3 ppt limit of detection during theRONOCO campaign. A model run including 3 ppt of DMSdid result in improved model success for HO2* and NO3x,increasing the median modelled to observed ratio for HO2*from 0.56 for the base model run to 0.68 for the model runincluding 3 ppt DMS and decreasing the median modelled ra-tios for NO3 and N2O5 from 1.68 and 1.64 to 1.36 and 1.39,respectively. The improvements were thus not sufficient tofully explain the discrepancies.
We thus conclude that unquantified species containingC=C could reconcile model and measured NO3, N2O5 and
www.atmos-chem-phys.net/14/1299/2014/ Atmos. Chem. Phys., 14, 1299–1321, 2014
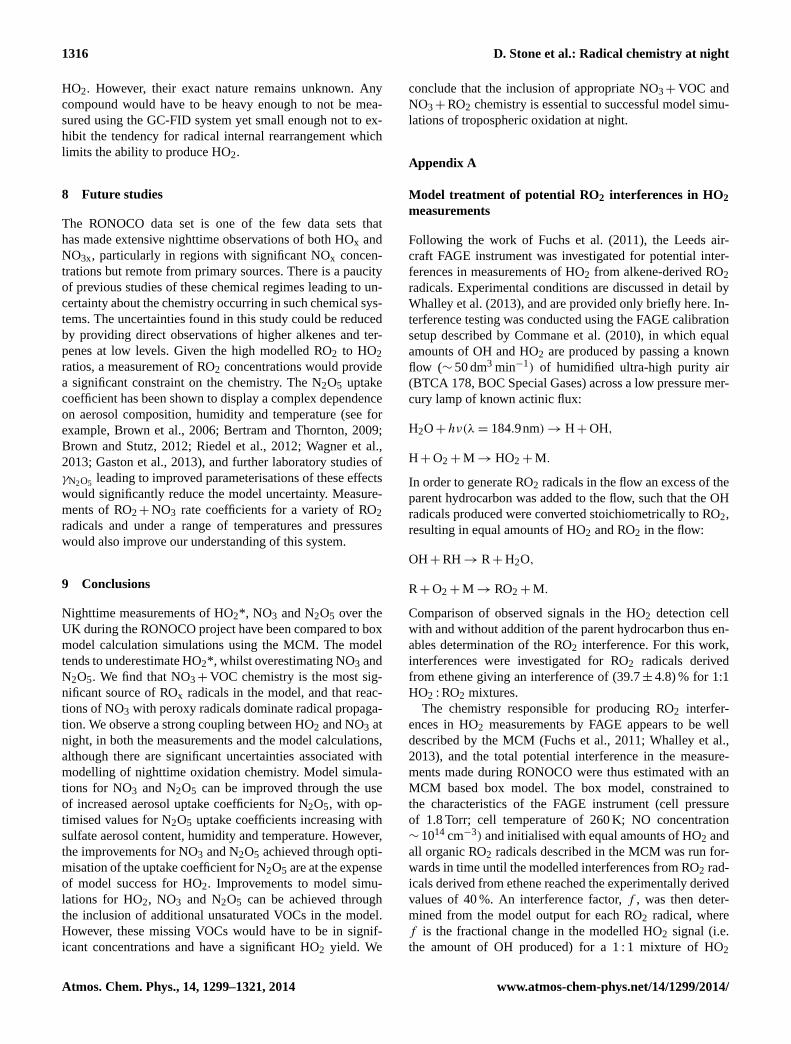
1316 D. Stone et al.: Radical chemistry at night
HO2. However, their exact nature remains unknown. Anycompound would have to be heavy enough to not be mea-sured using the GC-FID system yet small enough not to ex-hibit the tendency for radical internal rearrangement whichlimits the ability to produce HO2.
8 Future studies
The RONOCO data set is one of the few data sets thathas made extensive nighttime observations of both HOx andNO3x, particularly in regions with significant NOx concen-trations but remote from primary sources. There is a paucityof previous studies of these chemical regimes leading to un-certainty about the chemistry occurring in such chemical sys-tems. The uncertainties found in this study could be reducedby providing direct observations of higher alkenes and ter-penes at low levels. Given the high modelled RO2 to HO2ratios, a measurement of RO2 concentrations would providea significant constraint on the chemistry. The N2O5 uptakecoefficient has been shown to display a complex dependenceon aerosol composition, humidity and temperature (see forexample, Brown et al., 2006; Bertram and Thornton, 2009;Brown and Stutz, 2012; Riedel et al., 2012; Wagner et al.,2013; Gaston et al., 2013), and further laboratory studies ofγN2O5 leading to improved parameterisations of these effectswould significantly reduce the model uncertainty. Measure-ments of RO2+ NO3 rate coefficients for a variety of RO2radicals and under a range of temperatures and pressureswould also improve our understanding of this system.
9 Conclusions
Nighttime measurements of HO2*, NO3 and N2O5 over theUK during the RONOCO project have been compared to boxmodel calculation simulations using the MCM. The modeltends to underestimate HO2*, whilst overestimating NO3 andN2O5. We find that NO3+ VOC chemistry is the most sig-nificant source of ROx radicals in the model, and that reac-tions of NO3 with peroxy radicals dominate radical propaga-tion. We observe a strong coupling between HO2 and NO3 atnight, in both the measurements and the model calculations,although there are significant uncertainties associated withmodelling of nighttime oxidation chemistry. Model simula-tions for NO3 and N2O5 can be improved through the useof increased aerosol uptake coefficients for N2O5, with op-timised values for N2O5 uptake coefficients increasing withsulfate aerosol content, humidity and temperature. However,the improvements for NO3 and N2O5 achieved through opti-misation of the uptake coefficient for N2O5 are at the expenseof model success for HO2. Improvements to model simu-lations for HO2, NO3 and N2O5 can be achieved throughthe inclusion of additional unsaturated VOCs in the model.However, these missing VOCs would have to be in signif-icant concentrations and have a significant HO2 yield. We
conclude that the inclusion of appropriate NO3+ VOC andNO3+ RO2 chemistry is essential to successful model simu-lations of tropospheric oxidation at night.
Appendix A
Model treatment of potential RO2 interferences in HO2measurements
Following the work of Fuchs et al. (2011), the Leeds air-craft FAGE instrument was investigated for potential inter-ferences in measurements of HO2 from alkene-derived RO2radicals. Experimental conditions are discussed in detail byWhalley et al. (2013), and are provided only briefly here. In-terference testing was conducted using the FAGE calibrationsetup described by Commane et al. (2010), in which equalamounts of OH and HO2 are produced by passing a knownflow (∼ 50 dm3 min−1) of humidified ultra-high purity air(BTCA 178, BOC Special Gases) across a low pressure mer-cury lamp of known actinic flux:
H2O+ hν(λ = 184.9nm) → H + OH,
H + O2 + M → HO2 + M.
In order to generate RO2 radicals in the flow an excess of theparent hydrocarbon was added to the flow, such that the OHradicals produced were converted stoichiometrically to RO2,resulting in equal amounts of HO2 and RO2 in the flow:
OH+ RH → R+ H2O,
R+ O2 + M → RO2 + M.
Comparison of observed signals in the HO2 detection cellwith and without addition of the parent hydrocarbon thus en-ables determination of the RO2 interference. For this work,interferences were investigated for RO2 radicals derivedfrom ethene giving an interference of (39.7± 4.8) % for 1:1HO2 : RO2 mixtures.
The chemistry responsible for producing RO2 interfer-ences in HO2 measurements by FAGE appears to be welldescribed by the MCM (Fuchs et al., 2011; Whalley et al.,2013), and the total potential interference in the measure-ments made during RONOCO were thus estimated with anMCM based box model. The box model, constrained tothe characteristics of the FAGE instrument (cell pressureof 1.8 Torr; cell temperature of 260 K; NO concentration∼ 1014 cm−3) and initialised with equal amounts of HO2 andall organic RO2 radicals described in the MCM was run for-wards in time until the modelled interferences from RO2 rad-icals derived from ethene reached the experimentally derivedvalues of 40 %. An interference factor,f , was then deter-mined from the model output for each RO2 radical, wheref is the fractional change in the modelled HO2 signal (i.e.the amount of OH produced) for a 1 : 1 mixture of HO2
Atmos. Chem. Phys., 14, 1299–1321, 2014 www.atmos-chem-phys.net/14/1299/2014/
D. Stone et al.: Radical chemistry at night 1317
28
is the fractional change in the modelled HO2 signal (i.e. the amount of OH produced) for a 1:1 mixture
of HO2 and RO2. The modelled HO2* (the combination of HO2 and potential interferences from RO2)
was subsequently determined for each time point using HO2* = HO2 + fRO2 for direct comparison with
the FAGE measurements. Figure A1 shows the comparison between modelled HO2* and HO2 for
RONOCO, indicating that interferences during the campaign were generally small.
Figure A1: Comparison between modelled HO2* (the sum of HO2 and potential RO2 interferences) and
modelled HO2 for RONOCO. The solid red line indicates the 1:1 line, with 50 % limits given by the
broken red lines. The best fit line is shown in blue and is described by HO2* = [1.15 × HO2] + 2 × 10⁵
cm-3
.
Fig. A1. Comparison between modelled HO2* (the sum of HO2 andpotential RO2 interferences) and modelled HO2 for RONOCO. Thesolid red line indicates the 1:1 line, with 50 % limits given by thebroken red lines. The best fit line is shown in blue and is describedby HO2* = [1.15× HO2] + 2× 105 cm−3.
and RO2. The modelled HO2* (the combination of HO2 andpotential interferences from RO2) was subsequently deter-mined for each time point using HO2* = HO2 + f RO2 fordirect comparison with the FAGE measurements. Figure A1shows the comparison between modelled HO2* and HO2 forRONOCO, indicating that interferences during the campaignwere generally small.
Acknowledgements.This work was funded by the UK NaturalEnvironment Research Council (NE/F004664/1). The authorswould like to thank ground staff, engineers, scientists and pilotsinvolved in RONOCO for making this project a success. Airbornedata were obtained using the BAe 146-301 Atmospheric ResearchAircraft (ARA) flown by Directflight Ltd. and managed by theFacility for Airborne Atmospheric Measurements (FAAM), whichis a joint entity of the Natural Environment Research Council(NERC) and the Met Office.
Edited by: J. Thornton
References
Aldener, M., Brown, S. S., Stark, H., Williams, E. J., Lerner,B. M., Kuster, W. C., Goldan, P. D., Quinn, P. K., Bates, T.S., Fehsenfeld, F. C., and Ravishankara, A. R.: Reactivity andloss mechanisms of NO3 and N2O5 in a polluted marine envi-ronment: Results from in situ measurements during New Eng-land Air Quality Study 2002, J. Geophys. Res., 111, D23S73,doi:10.1029/2006JD007252, 2006.
Aliwell, S. R. and Jones, R. L.: Measurements of tropospheric NO3at midlatitude, J. Geophys. Res. Atmos., 103, 5719–5727, 1998.
Allan, B. J., Carslaw, N., Coe, H., Burgess, R. A., Plane, J. M. C.:Observations of the nitrate radical in the marine boundary layer,J. Atmos. Chem., 33, 129–154, 1999.
Allan, B. J., Plane, J. M. C., Coe, H., Shillto, J.: Observations ofNO3 concentration profiles in the troposphere, J. Geophys. Res.,107, 4588, doi:10.1029/2002JD002112, 2002.
Andreae, M. O., Ferek, R. J., Bermond, F., Byrd, K. P., EngstromR. T., Hardin, S., Houmere, P. D., LeMarrec, F., and Raemdonck,H.: Dimethyl sulfide in the marine atmosphere, J. Geophys. Res.,90, 12891–12900, 1985.
Badger, C. L., Griffiths, P. T., George, I., Abbattt, J. P. D., and Cox,R. A.: Reactive Uptake of N2O5 by Aerosol Particles ContainingMixtures of Humic Acid and Ammonium Sulfate, J. Phys. Chem.A., 110, 6986–6994, 2006.
Behnke, W., George, C., Scheer, V., and Zetzsch, C.: Productionand decay of ClNO2 from the reaction of gaseous N2O5 withNaCl solution: Bulk and aerosol experiments, J. Geophys. Res.Atmos., 102, 3795–3804, doi:10.1029/96JD03057, 1997.
Bertram, T. H. and Thornton, J. A.: Toward a general parameteriza-tion of N2O5 reactivity on aqueous particles: the competing ef-fects of particle liquid water, nitrate and chloride, Atmos. Chem.Phys., 9, 8351–8363, doi:10.5194/acp-9-8351-2009, 2009.
Bertram, T. H., Thornton, J. A., Riedel, T. P., Middlebrook, A. M.,Bahreini, R., Bates, T. S., Quinn, P. K., and Coffman, D. J.: Directobservations of N2O5 reactivity on ambient aerosol particles,Geophys. Res. Lett., 36, L19803, doi:10.1029/2009GL040248,2009.
Blake, N. J., Blake, D. R., Wingenter, O. W., Sive, B. C., Kang, C.H., Thornton, D. C., Bandy, A. R., Atlas, E., Flocke, F., Harris,J. M., and Sherwood Rowland, F.: Aircraft measurements of thelatitudinal, vertical and seasonal variations of NMHCs, methylnitrate, methyl halides, and DMS during the First Aerosol Char-acterization Experiment (ACE 1), J. Geophys. Res., 104, 21803–21817, 1999.
Bloss, W. J., Gravestock, T. J., Heard, D. E., Ingham, T., Johnson,G. P., and Lee, J. D.: Application of a compact all solid-state lasersystem to the in situ detection of atmospheric OH, HO2, NO andIO by laser-induced fluorescence, J. Environ. Monit., 5, 21–28,2003.
Brough, N., Reeves, C. E., Penkett, S. A., Stewart, D. J., Dewey,K., Kent, J., Barjat, H., Monks, P. S., Ziereis, H., Stock, P.,Huntrieser, H., and Schlager, H.: Intercomparison of aircraft in-struments on board the C-130 and Falcon 20 over southern Ger-many during EXPORT 2000, Atmos. Chem. Phys., 3, 2127–2138, doi:10.5194/acp-3-2127-2003, 2003.
Brown, S. S. and Stutz, J.: Nighttime radical observations andchemistry, Chem. Soc. Rev., 41, 6405–6447, 2012.
Brown, S. S., Stark, H., and Ravishankara, A. R.: Applicabilityof the steady state approximation to the interpretation of atmo-spheric observations of NO3 and N2O5, J. Geophys. Res., 108,4539, doi:10.1029/2003JD003407, 2003.
Brown, S. S., Dibb, J. E., Stark, H., Aldener, M., Vozella, M., Whit-low, S., Williams, E. J., Lerner, B. M., Jakoubek, R., Middle-brook, A. M., DeGouw, J. A., Warneke, C., Goldan, P. D., Kuster,W. C., Angevine, W. M., Sueper, D. T., Quinn, P. K., Bates, T. S.,Meagher, J. F., Fehsenfeld, F. C., and Ravishankara, A. R.: Night-time removal of NOx in the summer marine boundary layer, Geo-phys. Res. Lett., 31, L07108, doi:10.1029/2004GL019412, 2004.
Brown, S. S., Ryerson, T. B., Wollny, A. G., Brock, C. A., Peltier,R., Sullivan, A. P., Weber, R. J., Dube, W. P., Trainer, M.,Meagher, J. F., Fehsenfeld, F. C., and Ravishankara, A. R.: Vari-
www.atmos-chem-phys.net/14/1299/2014/ Atmos. Chem. Phys., 14, 1299–1321, 2014
1318 D. Stone et al.: Radical chemistry at night
ability in Nocturnal Nitrogen Oxide Processing and Its Role inRegional Air Quality, Science, 311, 67–70, 2006.
Brown, S. S., Dubé, W. P., Osthoff, H. D., Wolfe, D. E., Angevine,W. M., and Ravishankara, A. R.: High resolution vertical distri-butions of NO3 and N2O5 through the nocturnal boundary layer,Atmos. Chem. Phys., 7, 139–149, doi:10.5194/acp-7-139-2007,2007.
Brown, S. S., deGouw, J. A., Warneke, C., Ryerson, T. B., Dubé, W.P., Atlas, E., Weber, R. J., Peltier, R. E., Neuman, J. A., Roberts,J. M., Swanson, A., Flocke, F., McKeen, S. A., Brioude, J., Som-mariva, R., Trainer, M., Fehsenfeld, F. C., and Ravishankara,A. R.: Nocturnal isoprene oxidation over the Northeast UnitedStates in summer and its impact on reactive nitrogen partitioningand secondary organic aerosol, Atmos. Chem. Phys., 9, 3027–3042, doi:10.5194/acp-9-3027-2009, 2009.
Brown, S. S., Dube, W. P., Peischl, J., Ryerson, T. B., Atlas, E.,Warneke, C., de Gouw, J. A., Hekkert, S. t. L., Brock, C. A.,Flocke, F., Trainer, M., Parrish, D. D., Fehsenfeld, F. C., andRavishankara, A. R.: Budgets for nocturnal VOC oxidation bynitrate radicals aloft during the 2006 Texas Air Quality Study, J.Geophys. Res., 116, D24305, doi:10.1029/2011JD016544, 2011.
Burgermeister, S. and Georgii, H.-W.: Distribution of methanesul-fonate, NSS sulfate and dimethylsulfide over the Atlantic and theNorth Sea, Atmos. Environ., Part A, 25, 587–595, 1991.
Carslaw, N., Carpenter, L. J., Plane, J. M. C., Allan, B. J., Burgess,R. A., Clemitshaw, K. C., Coe, H., and Penkett, S. A.: Simulta-neous observations of nitrate and peroxy radicals in the marineboundary layer, J. Geophys. Res., 102, 18917–18933, 1997.
Chang, W. L. P., Bhave, P. V., Brown, S. S., Riemer, N., Stutz, J.,and Dabdub, D.: Heterogeneous atmospheric chemistry, ambi-ent measurements, and model calculations of N2O5: A review,Aerosol Sci. Technol., 45, 665–695, 2011.
Coe, H., Allan, J. D., Alfarra, M. R., Bower, K. N., Flynn, M. J., Mc-Figgans, G. B., Topping, D. O., Williams, P. I., O’Dowd, C. D.,Dall’Osto, M., Beddows, D. C. S., and Harrison, R. M.: Chem-ical and physical characteristics of aerosol particles at a remotecoastal location, Mace Head, Ireland, during NAMBLEX, At-mos. Chem. Phys., 6, 3289–3301, doi:10.5194/acp-6-3289-2006,2006.
Commane, R., Floquet, C. F. A., Ingham, T., Stone, D., Evans,M. J., and Heard, D. E.: Observations of OH and HO2 rad-icals over West Africa, Atmos. Chem. Phys., 10, 8783–8801,doi:10.5194/acp-10-8783-2010, 2010.
Dari-Salisburgo, C., Di Carlo, P., Giammaria, F., Kajii, Y., andD’Altorio, A.: Laser induced fluorescence instrument for NO2measurements: observations at a central Italy background site,Atmos. Environ., 43, 970–977, 2009.
Di Carlo, P., Aruffo, E., Busilacchio, M., Giammaria, F., Dari-Salisburgo, C., Biancofiore, F., Visconti, G., Lee, J., Moller,S., Reeves, C. E., Bauguitte, S., Forster, G., Jones, R. L., andOuyang, B.: Aircraft based four-channel thermal dissociationlaser induced fluorescence instrument for simultaneous measure-ments of NO2, total peroxy nitrate, total alkyl nitrate, and HNO3,Atmos. Meas. Tech., 6, 971–980, doi:10.5194/amt-6-971-2013,2013.
Ehhalt, D. H. and Rohrer, F.: The tropospheric cycle of H2: a criticalreview, Tellus, 61B, 500–535, 2009.
Emmerson, K. M. and Carslaw, N.: Night-time radical chemistryduring the TORCH campaign, Atmos. Environ., 43, 3220–3226,2009.
Emmerson, K. M. and Evans, M. J.: Comparison of troposphericgas-phase chemistry schemes for use within global models, At-mos. Chem. Phys., 9, 1831–1845, doi:10.5194/acp-9-1831-2009,2009.
Escoreia, E. N., Sjostedt, S. J., and Abbattt, J. P. D.: Kinetics ofN2O5 Hydrolysis on Secondary Organic Aerosol and MixedAmmonium Bisulfate-Secondary Organic Aerosol Particles, J.Phys. Chem. A, 114, 13113–13121, 2010.
Evans, M. J. and Jacob, D. J.: Impact of new laboratory studies ofN2O5 hydrolysis on global model budgets of tropospheric nitro-gen oxides, ozone, and OH, Geophys. Res. Lett., 32, 1–4, 2005.
Faloona, I., Tan, D., Brune, W., Hurst, J., Barket, D., Couch, T. L.,Shepson, P., Apel, E., Riemer, D., Thornberry, T., Carroll, M.A., Sillman, S., Keeler, G. J., Sagady, J., Hooper, D., and Pater-son, K.: Nighttime observations of anomalously high levels ofhydroxyl radicals above a deciduous forest canopy, J. Geophys.Res. Atmos., 106, 24315–24333, 2001.
Fleming, Z. L., Monks, P. S., Rickard, A. R., Heard, D. E., Bloss,W. J., Seakins, P. W., Still, T. J., Sommariva, R., Pilling, M. J.,Morgan, R., Green, T. J., Brough, N., Mills, G. P., Penkett, S. A.,Lewis, A. C., Lee, J. D., Saiz-Lopez, A., and Plane, J. M. C.: Per-oxy radical chemistry and the control of ozone photochemistry atMace Head, Ireland during the summer of 2002, Atmos. Chem.Phys., 6, 2193–2214, doi:10.5194/acp-6-2193-2006, 2006.
Fried, A., Henry, B. E., Calvert, J. G., and Mozurkewich, M.: Thereaction probability of N2O5 with sulfuric acid aerosols probedby the heterogeneous hydrolysis of N2O5, Geophys. Res. Lett.,99, 3517–3532, 1994.
Fuchs, H., Bohn, B., Hofzumahaus, A., Holland, F., Lu, K. D.,Nehr, S., Rohrer, F., and Wahner, A.: Detection of HO2 by laser-induced fluorescence: calibration and interferences from RO2radicals, Atmos. Meas. Tech., 4, 1209–1225, doi:10.5194/amt-4-1209-2011, 2011.
Gaston, C. J., Thornton, J. A., and Ng, N. L.: Reactive uptake ofN2O5 to internally mixed inorganic and organic particles: therole of organic carbon oxidation state and inferred organic phaseseparations, Atmos. Chem. Phys. Discuss., 13, 32053–32092,doi:10.5194/acpd-13-32053-2013, 2013.
George, I. J., Matthews, P. S. J., Whalley, L. K., Brooks, B., God-dard, A., Baeza-Romero, M. T., and Heard, D. E.: Measurementsof uptake coefficients for heterogeneous loss of HO2 onto sub-micron inorganic salt aerosols, Phys. Chem. Chem. Phys., 15,12829–12845, 2013.
Gerbig, C., Schmitgen, S., Kley, D., Volz-Thomas, A., Dewey, K.,and Haaks, D.: An improved fast-response vacuum UV reso-nance fluorescence CO instrument, J. Geophys. Res. Atmos.,104, 1699–1704, 1999.
Geyer, A., Bachmann, K., Hofzumahaus, A., Holland, F., Konrad,S., Klupfel, T., Patz, H.-W., Perner, D., Mihelcic, D., Schafer,H.-J., Volz-Thomas, A., and Platt, U.: Nighttime formation ofperoxy and hydroxyl radicals during the BERLIOZ campaign:Observations and modeling studies, J. Geophys. Res., 108, 8249,doi:10.1029/2001JD000656, 2003.
Hallquist, M., Stewart, D. J., Stephenson, S. K., and Cox, R. A.:Hydrolysis of N2O5 on sub-micron sulfate aerosols, Phys. Chem.Chem. Phys., 5, 3453–3463, 2003.
Atmos. Chem. Phys., 14, 1299–1321, 2014 www.atmos-chem-phys.net/14/1299/2014/
D. Stone et al.: Radical chemistry at night 1319
Hanson, D. R. and Ravishankara, A. R.: The reaction probabilitiesof ClONO2 and N2O5 on 40 to 75 % sulfuric acid solutions, J.Geophys. Res., 96, 17307–17314, 1991.
Heard, D. E. and Pilling, M. J.: Measurement of OH and HO2 in thetroposphere, Chem. Rev., 103, 5163–5198, 2003.
Hewitt, C. N., Lee, J. D., MacKenzie, A. R., Barkley, M. P., Carslaw,N., Carver, G. D., Chappell, N. A., Coe, H., Collier, C., Com-mane, R., Davies, F., Davison, B., DiCarlo, P., Di Marco, C. F.,Dorsey, J. R., Edwards, P. M., Evans, M. J., Fowler, D., Furneaux,K. L., Gallagher, M., Guenther, A., Heard, D. E., Helfter, C.,Hopkins, J., Ingham, T., Irwin, M., Jones, C., Karunaharan, A.,Langford, B., Lewis, A. C., Lim, S. F., MacDonald, S. M., Ma-hajan, A. S., Malpass, S., McFiggans, G., Mills, G., Misztal, P.,Moller, S., Monks, P. S., Nemitz, E., Nicolas-Perea, V., Oetjen,H., Oram, D. E., Palmer, P. I., Phillips, G. J., Pike, R., Plane,J. M. C., Pugh, T., Pyle, J. A., Reeves, C. E., Robinson, N. H.,Stewart, D., Stone, D., Whalley, L. K., and Yin, X.: Overview:oxidant and particle photochemical processes above a south-eastAsian tropical rainforest (the OP3 project): introduction, ratio-nale, location characteristics and tools, Atmos. Chem. Phys., 10,169–199, doi:10.5194/acp-10-169-2010, 2010.
Hopkins, J. R., Lewis, A. C., and Read, K. A.: A two-columnmethod for long-term monitoring of non-methane hydrocarbons(NMHCs) and oxygenated volatile organic compounds (oVOCs),J. Environ. Monit., 5, 8–13, 2003.
Hu, J. H. and Abbattt, J. P. D.: Reaction probabilities for N2O5 hy-drolysis on sulfuric acid and ammonium sulfate aerosols at roomtemperature, J. Phys. Chem. A, 101, 871–878, 1997.
Jenkin, M. E., Saunders, S. M., Wagner, V., and Pilling, M. J.:Protocol for the development of the Master Chemical Mecha-nism, MCM v3 (Part B): tropospheric degradation of aromaticvolatile organic compounds, Atmos. Chem. Phys., 3, 181–193,doi:10.5194/acp-3-181-2003, 2003.
Johnson, D. and Marston, G.: The gas-phase ozonolysis of unsatu-rated volatile organic compounds in the troposphere, Chem. Soc.Rev., 37, 699–716, 2008.
Kanaya, Y., Sadanaga, Y., Matsumoto, J., Sharma, U. K., Hirokawa,J., Kajii, Y., and Akimoto, H.: Nighttime observation of the HO2radical by an LIF instrument at Oki island, Japan, and its possibleorigins, Geophys. Res. Lett., 26, 2179–2182, 1999.
Kanaya, Y., Nakamura, K., Kato, S., Matsumoto, J., Tanimoto, H.,and Akimoto, H.: Nighttime variations in HO2 radical mixing ra-tios at Rishiri Island observed with elevated monoterpene mixingratios, Atmos. Environ., 36, 4929–4940, 2002.
Kanaya, Y., Cao, R., Kato, S., Miyakawa, Y., Kajii, Y., Tanimoto,H., Yokouchi, Y., Mochida, M., Kawamura, K., and Akimoto, H.:Chemistry of OH and HO2 radicals observed at Rishiri Island,Japan, in September 2003: Missing daytime sink of HO2 andpositive nighttime correlations with monoterpenes, J. Geophys.Res., 112, D11308, doi:10.1029/2006JD007987, 2007a.
Kanaya, Y., Cao, R., Akimoto, H., Fukuda, M., Komazaki, Y.,Yokouchi, Y., Koike, M., Tanimoto, H., Takegawa, N., andKondo, Y.: Urban photochemistry in central Tokyo: 1. Observedand modeled OH and HO2 radical concentrations during thewinter and summer of 2004, J. Geophys. Res., 112, D21312,doi:10.1029/2007JD008670, 2007b.
Kane, S. M., Caloz, F., and Leu, M.-T.: Heterogeneous Up-take of Gaseous N2O5 by (NH4)2SO4, NH4HSO4 and H2SO4Aerosols, J. Phys. Chem., 105, 6465–6470, 2001.
Kennedy, O. J., Ouyang, B., Langridge, J. M., Daniels, M. J. S.,Bauguitte, S., Freshwater, R., McLeod, M. W., Ironmonger, C.,Sendall, J., Norris, O., Nightingale, R., Ball, S. M., and Jones,R. L.: An aircraft based three channel broadband cavity en-hanced absorption spectrometer for simultaneous measurementsof NO3, N2O5 and NO2, Atmos. Meas. Tech., 4, 1759–1776,doi:10.5194/amt-4-1759-2011, 2011.
Lewis, A. C., Carslaw, N., Marriott, P. J., Kinghorn, R. M., Mor-rison, P., Lee, A. L., Bartle, K. D., and Pilling, M. J.: A largerpool of ozone-forming carbon compounds in urban atmospheres,Nature, 405, 778–781, 2000.
Lidster, R. T., Hamilton, J. F., Lee, J. D., Lewis, A. C., Hopkins,J. R., Punjabi, S., Rickard, A. R., and Young, J. C.: The impactof monoaromatic hydrocarbons on OH reactivity in the NorthSea boundary layer and free troposphere, Atmos. Chem. Phys.Discuss., 13, 32423–32457, doi:10.5194/acpd-13-32423-2013,2013.
Lunden, J., Svensson, G., Wisthaler, A., Tjernstrom, M., Hansel,A., and Leck, C.: The vertical distribution of atmospheric DMSin the high Arctic summer, Tellus, 62B, 160–171, 2010.
Macintyre, H. L. and Evans, M. J.: Sensitivity of a global modelto the uptake of N2O5 by tropospheric aerosol, Atmos. Chem.Phys., 10, 7409–7414, doi:10.5194/acp-10-7409-2010, 2010.
Macintyre, H. L. and Evans, M. J.: Parameterisation and impactof aerosol uptake of HO2 on a global tropospheric model,Atmos. Chem. Phys., 11, 10965–10974, doi:10.5194/acp-11-10965-2011, 2011.
Malkin, T. L., Goddard, A., Heard, D. E., and Seakins, P. W.:Measurements of OH and HO2 yields from the gas phaseozonolysis of isoprene, Atmos. Chem. Phys., 10, 1441–1459,doi:10.5194/acp-10-1441-2010, 2010.
Martinez, M., Harder, H., Kovacs, T. A., Simpas, J. B., Bassis,J., Lesher, R., Brune, W. H., Frost, G. J., Williams, E. J.,Stroud, C. A., Jobson, B. T., Roberts, J. M., Hall, S. R., Shet-ter, R. E., Wert, B., Fried, A., Alicke, B., Stutz, J., Young, V.L., White, A. B., and Zamora, R. J.: OH and HO2 concentra-tions, sources, and loss rates during the Southern Oxidants Studyin Nashville, Tennessee, summer 1999, J. Geophys. Res., 108,4617, doi:10.1029/2003JD003551, 2003.
Mihelcic, D., Klemp, D., Musgen, P., Patz, H. W., and Volz-Thomas, A.: Simultaneous Measurements of Peroxy and NitrateRadicals at Schauinsland, J. Atmos. Chem., 16, 313–335, 1993.
Mozurkewich, M. and Calvert, J. G.: Reaction probability of N2O5on aqueous aerosols, J. Geophys. Res., 93, 15889–15896, 1988.
GLOBALVIEW-CH4, 2010–2011: Cooperative AtmosphericData Integration Project – Methane. CD-ROM, NOAAESRL, Boulder, Colorado, also available on Internet viaanonymous FTP toftp://ftp.cmdl.noaa.gov/ccg/ch4/,path:ccg/CH4/GLOBALVIEW, 2010–2011, last access: 24 May2011.
Novelli, P. C., Lang, P. M., Masarie, K. A., Hurst, D. F., Myers,R., and Elkins, J. W.: Molecular hydrogen in the troposphere:Global distribution and budget, J. Geophys. Res., 104, 30427–30444, 1999.
Platt, U., Perner, D., Winer, A. M., Harris, G. W., and Pitts, J. N.:Detection of NO3 in the polluted troposphere by differential op-tical absorption, Geophys. Res. Lett., 7, 89–92, 1980.
Povey, I., South, A., de Roodenbeke, A., Hill, C., Freshwater, R.,and Jones, R.: A broadband lidar for the measurement of tropo-
www.atmos-chem-phys.net/14/1299/2014/ Atmos. Chem. Phys., 14, 1299–1321, 2014
1320 D. Stone et al.: Radical chemistry at night
spheric constituent profiles from the ground, J. Geophys. Res.Atmos., 103, 3369–3380, 1998.
Ravishankara, A. R.: Heterogeneous and Multiphase Chemistry inthe Troposphere, Science, 276, 1058–1065, 1997.
Ren, X., Harder, H., Martinez, M., Lesher, R. L., Oliger, A., Sim-pas, J. B., Brune, W. H., Schwab, J. J., Demerjian, K. L., He, Y.,Zhou, X., and Gao, H.: OH and HO2 Chemistry in the urban at-mosphere of New York City, Atmos. Environ., 37, 3639–3651,2003.
Ren, X., Brune, W. H., Cantrell, C., Edwards, G. D., Shirley, T.,Metcalf, A. R., and Lesher, R. L.: Hydroxyl and Peroxy RadicalChemistry in a Rural Area of Central Pennsylvania: Observationsand Model Comparisons, J. Atmos. Chem., 52, 231–257, 2005.
Ren, X., Brune, W. H., Mao, J., Mitchell, M. J., Lesher, R. L., Sim-pas, J. B., Metcalf, A. R., Schwab, J. J., Cai, C., Li, Y., Demer-jian, K. L., Felton, H. D., Boynton, G., Adams, A., Perry, J., He,Y., Zhou, X., and Hou, J.: Behavior of OH and HO2 in the winteratmosphere in New York City, Atmos. Environ., 40, S252–S263,2006.
Riedel, T. P., Bertram, T. H., Ryder, O. S., Liu, S., Day, D. A., Rus-sell, L. M., Gaston, C. J., Prather, K. A., and Thornton, J. A.:Direct N2O5 reactivity measurements at a polluted coastal site,Atmos. Chem. Phys., 12, 2959–2968, doi:10.5194/acp-12-2959-2012, 2012.
Riedel, T. P., Wagner, N. L., Dube, W. P., Middlebrook, A. M.,Young, C. J., Ozturk, F., Bahreini, R., VandenBoer, T. C., Wolfe,D. E., Williams, E. J., Roberts, J. M., Brown, S. S., and Thornton,J. A.: Chlorine activation within urban or power plant plumes:Vertically resolved ClNO2 and Cl2 measurements from a talltower in a polluted continental setting, J. Geophys. Res. Atmos.,118, 8702–8715, doi:10.1002/jgrd.50637, 2013.
Roberts, J. M., Osthoff, H. D., Brown, S. S., Ravishankara, A. R.,Coffman, D., Quinn, P., and Bates, T.: Laboratory studies ofproducts of N2O5 uptake on Cl-containing substrates, Geophys.Res. Lett., 36, L20808, doi:10.1029/2009GL040448, 2009.
Salisbury, G., Rickard, A. R., Monks, P. S., Allan, B. J., Baugui-tte, S., Penkett, S. A., Carslaw, N., Lewis, A. C., Creasey, D. J.,Heard, D. E., Jacobs, P. J., and Lee, J. D.: Production of peroxyradicals at night via reactions of ozone and the nitrate radical inthe marine boundary layer, J. Geophys. Res., 106, 12669–12687,2001.
Sandu, A. and Sander, R.: Technical note: Simulating chemicalsystems in Fortran90 and Matlab with the Kinetic PreProcessorKPP-2.1, Atmos. Chem. Phys., 6, 187–195, doi:10.5194/acp-6-187-2006, 2006.
Saunders, S. M., Jenkin, M. E., Derwent, R. G., and Pilling, M.J.: Protocol for the development of the Master Chemical Mech-anism, MCM v3 (Part A): tropospheric degradation of non-aromatic volatile organic compounds, Atmos. Chem. Phys., 3,161–180, doi:10.5194/acp-3-161-2003, 2003.
Schwarz, S. E.: Mass-transport considerations pertinent to aque-ous phase reactions of gases in liquid-water clouds, Chemistryof Multiphase Atmospheric Systems, NATO ASI Series, G6,Jaeschke ed., Springer-Verlag, Berlin, 415–471, 1986.
Sommariva, R., Bloss, W. J., Brough, N., Carslaw, N., Flynn,M., Haggerstone, A.-L., Heard, D. E., Hopkins, J. R., Lee, J.D., Lewis, A. C., McFiggans, G., Monks, P. S., Penkett, S.A., Pilling, M. J., Plane, J. M. C., Read, K. A., Saiz-Lopez,A., Rickard, A. R., and Williams, P. I.: OH and HO2 chem-
istry during NAMBLEX: roles of oxygenates, halogen oxidesand heterogeneous uptake, Atmos. Chem. Phys., 6, 1135–1153,doi:10.5194/acp-6-1135-2006, 2006.
Sommariva, R., Pilling, M. J., Bloss, W. J., Heard, D. E., Lee, J.D., Fleming, Z. L., Monks, P. S., Plane, J. M. C., Saiz-Lopez, A.,Ball, S. M., Bitter, M., Jones, R. L., Brough, N., Penkett, S. A.,Hopkins, J. R., Lewis, A. C., and Read, K. A.: Night-time radi-cal chemistry during the NAMBLEX campaign, Atmos. Chem.Phys., 7, 587–598, doi:10.5194/acp-7-587-2007, 2007.
Sommariva, R., Osthoff, H. D., Brown, S. S., Bates, T. S., Baynard,T., Coffman, D., de Gouw, J. A., Goldan, P. D., Kuster, W. C.,Lerner, B. M., Stark, H., Warneke, C., Williams, E. J., Fehsen-feld, F. C., Ravishankara, A. R., and Trainer, M.: Radicals in themarine boundary layer during NEAQS 2004: a model study ofday-time and night-time sources and sinks, Atmos. Chem. Phys.,9, 3075–3093, doi:10.5194/acp-9-3075-2009, 2009.
Sommariva, R., Bates, T. S., Bon, D., Brookes, D. M., de Gouw,J., Gilman, J. B., Herndon, S. C., Kuster, W. C., Lerner, B.M., Monks, P. S., Osthoff, H. D., Parker, A. E., Roberts, J. M.,Tucker, S. C., Warneke, C., Williams, E. J., Zahniser, M. S., andBrown, S. S.: Modelled and measured concentrations of peroxyradicals and nitrate radical in the U.S. Gulf coast region duringTexAQS 2006, J. Atmos. Chem., 68, 331–362, 2011.
South, A. M., Povey, I. M., and Jones, R. L.: Broadband lidar mea-surements of tropospheric water vapor profiles, J. Geophys. Res.Atmos., 103, 31191–31202, 1998.
Spicer, C. W., Kenny, D. V., Chapman, E., Busness, K. M., andBerkowitz, C. M.: Observations of dimethyl sulfide over thewestern North Atlantic Ocean using an airborne tandem massspectrometer, J. Geophys. Res., 101, 29137–29147, 1996.
Stone, D., Evans, M. J., Commane, R., Ingham, T., Floquet, C. F.A., McQuaid, J. B., Brookes, D. M., Monks, P. S., Purvis, R.,Hamilton, J. F., Hopkins, J., Lee, J., Lewis, A. C., Stewart, D.,Murphy, J. G., Mills, G., Oram, D., Reeves, C. E., and Heard,D. E.: HOx observations over West Africa during AMMA: im-pact of isoprene and NOx, Atmos. Chem. Phys., 10, 9415–9429,doi:10.5194/acp-10-9415-2010, 2010.
Stone, D., Evans, M. J., Edwards, P. M., Commane, R., Ingham,T., Rickard, A. R., Brookes, D. M., Hopkins, J., Leigh, R. J.,Lewis, A. C., Monks, P. S., Oram, D., Reeves, C. E., Stewart, D.,and Heard, D. E.: Isoprene oxidation mechanisms: measurementsand modelling of OH and HO2 over a South-East Asian tropicalrainforest during the OP3 field campaign, Atmos. Chem. Phys.,11, 6749–6771, doi:10.5194/acp-11-6749-2011, 2011.
Stone, D., Whalley, L. K., and Heard, D. E.: Tropospheric OHand HO2 radicals: Field measurements and model comparisons,Chem. Soc. Rev., 41, 6348–6404, 2012.
Stutz, J., Alicke, B., Ackermann, R., Geyer, A., White, A., andWilliams, E.: Vertical profiles of NO3, N2O5, O3, and NOx inthe nocturnal boundary layer: 1. Observations during the TexasAir Quality Study 2000, J. Geophys. Res. Atmos., 109, D12306,doi:10.1029/2003JD004209, 2004.
Stutz, J., Wong, K. W., Lawrence, L., Ziemba, L., Flynn, J. H., Rap-pengluick, B., and Lefer, B.: Nocturnal NO3 radical chemistry inHouston, TX, Atmos. Environ., 44, 4099–4106, 2010.
Tang, M. J., Thieser, J., Schuster, G., and Crowley, J. N.: Uptakeof NO3 and N2O5 to Saharan dust, ambient urban aerosol andsoot: a relative rate study, Atmos. Chem. Phys., 10, 2965–2974,doi:10.5194/acp-10-2965-2010, 2010.
Atmos. Chem. Phys., 14, 1299–1321, 2014 www.atmos-chem-phys.net/14/1299/2014/
D. Stone et al.: Radical chemistry at night 1321
Thornton, J. and Abbatt, J. P. D.: Measurements of HO2 up-take to aqueous aerosol: Mass accommodation coefficientsand net reactive loss, J. Geophys. Res., 110, D08309,doi:10.1029/2004JD005402, 2005.
Thornton, J. A., Braban, C. F., and Abbattt, J. P. D.: N2O5 hydroly-sis on sub-micron organic aerosols: the effect of relative humid-ity, particle phase, and particle size, Phys. Chem. Chem. Phys.,5, 4593–4603, 2003.
Van Doren, J. M., Watson, L. R., Davidovits, P., Worsnop, D. R.,Zahniser, M. S., and Kolb, C. E.: Uptake of N2O5 and HNO3 byAqueous Sulfuric Acid Droplets, J. Phys. Chem., 95, 1684–1689,1991.
Vaughan, S., Canosa-Mas, C. E., Pfrang, C., Shallcross, D. E., Wat-son, L., and Wayne, R. P.: Kinetic studies of reactions of thenitrate radical (NO3) with peroxy radicals (RO2): an indirectsource of OH at night?, Phys. Chem. Chem. Phys., 8, 3749–3760,2006.
Volkamer, R., Sheehy, P., Molina, L. T., and Molina, M. J.: Oxida-tive capacity of the Mexico City atmosphere – Part 1: A rad-ical source perspective, Atmos. Chem. Phys., 10, 6969–6991,doi:10.5194/acp-10-6969-2010, 2010.
Walker, H. M., Stone, D., Ingham, T., Vaughan, S., Ouyang, B.,Kennedy, O., McCleod, M., Jones, R. L., Hopkins, J., Punjabi,S., Lewis, A. C., and Heard, D. E.: Nighttime measurements ofHOx during the RONOCO project, in preparation, 2014.
Wagner, N. L., Riedel, T. P., Young, C. J., Bahreini, R., Brock, C. A.,Dube, W. P., Kim, S., Middlebrook, A. M., Ozturk, F., Roberts,J. M., Russo, R., Sive, B., Swarthout, R., Thornton, J. A., Van-denBoer, T. C., Zhou, Y., and Brown, S. S.: N2O5 uptake coef-ficients and nocturnal NO2 removal rates determined from am-bient wintertime measurements, J. Geophys. Res. Atmos., 118,9331–9350, 2013.
Warneke, C., de Gouw, J. A., Goldan, P. D., Kuster, W. C.,Williams, E. J., Lerner, B. M., Jakoubek, R., Brown, S. S.,Stark, H., Aldener, M., Ravishankara, A. R., Roberts, J. M.,Marchewka, M., Bertman, S., Sueper, D. T., McKeen, S. A.,Meagher, J. F., and Fehsenfeld, F. C.: Comparison of daytimeand nighttime oxidation of biogenic and anthropogenic VOCsalong the New England coast in summer during New Eng-land Air Quality Study 2002, J. Geophys. Res., 109, D10309,doi:10.1029/2003JD004424, 2004.
Wayne, R. P., Barnes, I., Biggs, P., Burrows, J. P., Canosa-Mas,C. E., Hjorth, J., Le Bras, G., Moortgat, G. K., Perner, D.,Poulet, G., Restelli, G., and Sidebottom, H.: The nitrate radical– Physics, chemistry and the atmosphere, Atmos. Environ., 25,1–203, 1991.
Whalley, L. K., Lewis, A. C., McQuaid, J. B., Purvis, R. M., Lee,J. D., Stemmler, K., Zellweger, C., and Ridgeon, P.: Two high-speed, portable GC systems designed for the measurement ofnon-methane hydrocarbons and PAN: Results from the Jungfrau-joch High Altitude Observatory, J. Environ. Monit., 6, 234–241,2004.
Whalley, L. K., Blitz, M. A., Desservettaz, M., Seakins, P. W., andHeard, D. E.: Reporting the sensitivity of laser-induced fluores-cence instruments used for HO2 detection to an interference fromRO2 radicals and introducing a novel approach that enables HO2and certain RO2 types to be selectively measured, Atmos. Meas.Tech., 6, 3425–3440, doi:10.5194/amt-6-3425-2013, 2013.
Wiedensohler, A., Birmili, W., Nowak, A., Sonntag, A., Weinhold,K., Merkel, M., Wehner, B., Tuch, T., Pfeifer, S., Fiebig, M.,Fjäraa, A. M., Asmi, E., Sellegri, K., Depuy, R., Venzac, H., Vil-lani, P., Laj, P., Aalto, P., Ogren, J. A., Swietlicki, E., Williams,P., Roldin, P., Quincey, P., Hüglin, C., Fierz-Schmidhauser, R.,Gysel, M., Weingartner, E., Riccobono, F., Santos, S., Grüning,C., Faloon, K., Beddows, D., Harrison, R., Monahan, C., Jen-nings, S. G., O’Dowd, C. D., Marinoni, A., Horn, H.-G., Keck,L., Jiang, J., Scheckman, J., McMurry, P. H., Deng, Z., Zhao, C.S., Moerman, M., Henzing, B., de Leeuw, G., Löschau, G., andBastian, S.: Mobility particle size spectrometers: harmonizationof technical standards and data structure to facilitate high qual-ity long-term observations of atmospheric particle number sizedistributions, Atmos. Meas. Tech., 5, 657–685, doi:10.5194/amt-5-657-2012, 2012.
www.atmos-chem-phys.net/14/1299/2014/ Atmos. Chem. Phys., 14, 1299–1321, 2014