Embed Size (px)
Citation preview
Western Michigan University Western Michigan University
ScholarWorks at WMU ScholarWorks at WMU
Dissertations Graduate College
12-2012
Radiative Double Electron Capture in Collisions of Fully-Stripped Radiative Double Electron Capture in Collisions of Fully-Stripped
Fluorine Ions with Thin Carbon Foils Fluorine Ions with Thin Carbon Foils
Tamer Mohammad Samy Elkafrawy Western Michigan University, [email protected]
Follow this and additional works at: https://scholarworks.wmich.edu/dissertations
Part of the Nuclear Commons
Recommended Citation Recommended Citation Elkafrawy, Tamer Mohammad Samy, "Radiative Double Electron Capture in Collisions of Fully-Stripped Fluorine Ions with Thin Carbon Foils" (2012). Dissertations. 103. https://scholarworks.wmich.edu/dissertations/103
This Dissertation-Open Access is brought to you for free and open access by the Graduate College at ScholarWorks at WMU. It has been accepted for inclusion in Dissertations by an authorized administrator of ScholarWorks at WMU. For more information, please contact [email protected].
RADIATIVE DOUBLE ELECTRON CAPTURE IN COLLISIONS OF FULLY-STRIPPED FLUORINE IONS WITH THIN CARBON FOILS
by
Tamer Mohammad Samy Elkafrawy
A Dissertation Submitted to the
Faculty of The Graduate College in partial fulfillment of the
requirements for the Degree of Doctor of Philosophy
Department of Physics Advisor: John A. Tanis, Ph.D.
Western Michigan University Kalamazoo, Michigan
December 2012
RADIATIVE DOUBLE ELECTRON CAPTURE IN COLLISIONS OF FULLY-STRIPPED FLUORINE IONS WITH THIN CARBON FOILS
Tamer Mohammad Samy Elkafrawy, Ph.D.
Western Michigan University, 2012
Radiative double electron capture (RDEC) is a one-step process in ion-atom
collisions occurring when two target electrons are captured to a bound state of the
projectile simultaneously with the emission of a single photon. The emitted photon
has approximately double the energy of the photon emitted due to radiative electron
capture (REC), which occurs when a target electron is captured to a projectile bound
state with simultaneous emission of a photon. REC and RDEC can be treated as time-
reversed photoionization (PI) and double photoionization (DPI), respectively, if
loosely-bound target electrons are captured. This concept can be formulated with the
principle of detailed balance, in which the processes of our interest can be described
in terms of their time-reversed ones. Fully-stripped ions were used as projectiles in
the performed RDEC experiments, providing a recipient system free of electron-
related Coulomb fields. This allows the target electrons to be transferred without
interaction with any of the projectile electrons, enabling accurate investigation of the
electron-electron interaction in the vicinity of electromagnetic field.
In this dissertation, RDEC was investigated during the collision of fully-
stripped fluorine ions with a thin carbon foil and the results are compared with the
recent experimental and theoretical studies. In the current work, x rays associated
with projectile charge-changing by single and double electron capture and no charge
change by F9+ ions were observed and compared with recent work for O8+ ions and

with theory. Both the F9+ and O8+ ions had energies in the ~MeV/u range. REC, in
turn, was investigated as a means to compare with the theoretical predictions of the
RDEC/REC cross section ratio. The most significant background processes including
various mechanisms of x-ray emission that may interfere with the energy region of
interest are addressed in detail. This enables isolation of the contributions of REC and
RDEC from the entire continuous spectrum of x-ray emission or at least ensures that
the background processes have negligible contribution to the energy range of interest.
Special emphasis is given to showing how the data analysis was carried out by the
subtraction of the x rays due to contamination lines.

Copyright by Tamer Mohammad Samy Elkafrawy
2012

ii

ii
ACKNOWLEDGMENTS
My first appreciation goes with no doubt to my dissertation supervisor, Prof.
John A. Tanis, who acted to me as a role model of the genuine scientist. I would like
to express my immense gratitude and high appreciation to all the deep discussions
and the efforts he has done with me till the present PhD thesis took this shape. I
learned much and benefitted a lot from him and it was my honor and pleasure
working with him until the current work is done beautifully. On this path, I can never
deny or forget the efforts done by the deceased Prof. Gaber Omar, the main
supervisor of my Master thesis, on the field of theoretical atomic collisions at Ain
Shams University, Egypt. He was the one who first introduced this field to me, which
was the starting point of my career. Prof. Hassan Ramadan as an atomic-physics
theoretician had a very special role supervising my Master thesis as a co-advisor,
giving his full support, and always encouraging me. He guided my first steps in this
research field and offered endless assistance throughout these years.
Special thanks go to Dr. Asghar N. kayani, the director of WMU accelerator
facility, who has been always in support to my experimental work by teaching me the
operation of the WMU accelerator facility, getting and tuning the produced beam,
maintaining the ion source, and taking care of any serious or unexpected problems
during the beam time given to my experiment. I am grateful to Prof. Andrzej S.
Warczak for all the valuable discussions and communications related to the current
work. I was lucky to have him on my dissertation committee as an expert on the topic
of my dissertation. It was our pleasure that he was our collaborator over the past few
years. I am also deeply indebted to Prof. Thomas W. Gorczyca and Prof. Murtadha A.
Acknowledgments—continued
iii
Khakoo for their distinctive role as dissertation committee members as well as for all
the fruitful discussions, guidance, and continuing support. My sincere thanks should
go to Allan Kern for his vital role as the accelerator engineer and Rick Welch, the
machine shop supervisor, for designing the frames and ladder for the carbon foils.
My deep gratitude goes to Prof. Dean Halderson not only as an ideal model of
the graduate advisor but also as a distinguished instructor of EM and QM graduate
courses. I’m also very grateful to the former department chairman, Prof. Paul
Pancella and the present chairperson, Prof. Kirk Korista, for their massive support
and encouragement throughout my PhD journey. They never said NO when it was
possible. I cannot also forget all the efforts done by our office coordinator Lori Krum,
the former office assistant Kerry Kochran, the present office assistant Katie Easley,
the deceased former manager of the undergraduate physics laboratories Robert
Scherzer, and the electronics shop supervisor Benjamin Gaudio.
My thanks are extended to my Department of Physics at Ain Shams
University, Cairo, Egypt for all kinds of support I was provided with over the entire
period of my PhD dissertation. My sincere friends and colleagues are too many to
mention them all but any help or support was provided from their side are highly
appreciated. The real thanks and the deepest gratitude have to go to my mother and
father, who brought me up and were the reason of every step of success I have
achieved. No word can describe my wife’s endless efforts and support throughout my
PhD path. Simply, I would not have done my PhD without her. All of my mother,
father, brother, sister, wife, and lovely children have been the light of my life.
Tamer Mohammad Samy Elkafrawy
iv
TABLE OF CONTENTS ACKNOWLEDGMENTS ...................................................................................... ii
LIST OF TABLES .................................................................................................. vii
LIST OF FIGURES ................................................................................................ viii
CHAPTER
I. INTRODUCTION ...................................................................................... 1
II. RADIATIVE SINGLE AND DOUBLE ELECTRON CAPTURE ............ 7
2.1 Compton Profile ........................................................................... 7
2.2 Radiative Electron Capture (REC) ............................................... 9
2.2.1 Kinematics of REC ............................................................... 9
2.2.2 REC Cross Section ............................................................... 12
2.2.3 Angular Distribution of REC Photon Emission ................... 16
2.3 Radiative Double Electron Capture (RDEC) ............................... 19
2.3.1 Kinematics of RDEC ............................................................ 19
2.3.2 The First Experiment Dedicated to RDEC: Testing the Principle of Detailed Balance ............................................... 22
2.3.3 Yakhontov Predictions of RDEC/REC Ratio: Nonrelativistic Approach versus Relativistic Enhancement Prediction ....................................................... 24
2.3.4 The Second Attempt to Observe RDEC: Testing Yakhontov Approach ........................................................... 25
2.3.5 Mikhailov Nonrelativistic Approach versus Modulated Relativistic Enhancement Prediction for RDEC into the Projectile K-shell .................................................................. 27
Table of Contents—continued
v
CHAPTER
2.3.6 Nefiodov Nonrelativistic Approach for RDEC into the Projectile Metastable State 1s12s1 ........................................ 31
2.3.7 The First Observation of RDEC ........................................... 33
2.3.8 The Most Recent Theoretical Model of RDEC .................... 35
III. BACKGROUND PROCESSES ................................................................. 40
3.1 X-ray Emission from Bremsstrahlung .......................................... 40
3.1.1 Electron-nucleus (e-n) Bremsstrahlung ................................ 41
3.1.2 Nucleus-nucleus (n-n) Bremsstrahlung ................................ 50
3.1.3 Nucleus-nucleus (n-n) versus Electron-nucleus (e-n) Bremsstrahlung ..................................................................... 52
3.1.4 Electron-electron Bremsstrahlung ........................................ 54
3.2 Nonradiative Electron Capture (NRC) .......................................... 56
3.3 Double Radiative Electron Capture (DREC) ................................ 59
3.4 Pileup Effect .................................................................................. 62
IV. EXPERIMENTAL SETUP ......................................................................... 64
4.1 Standard Van de Graaff Generator ............................................... 64
4.2 Tandem Van de Graaff Accelerator .............................................. 66
4.3 SNICS Negative Ion Source .......................................................... 67
4.4 WMU Van de Graaff Accelerator Facility ................................... 69
4.5 Experiment Setup ......................................................................... 70
4.6 Si(Li) X-ray Detector ................................................................... 73
4.7 Silicon Surface Barrier Particle Detector ..................................... 74
Table of Contents—continued
vi
CHAPTER
4.8 Data Acquisition System .............................................................. 74
4.9 Data Analysis ............................................................................... 78
V. DATA ANALYSIS AND DISCUSSION .................................................. 81
5.1 Singles Measurements of X-ray Emission versus PIXE Analysis ........................................................................................ 82
5.2 Generating X-ray Spectra Associated with Projectile Charge-changing ....................................................................................... 87
5.3 REC Analysis ............................................................................... 90
5.4 RDEC Analysis ............................................................................ 95
5.5 Analysis for Background Processes ............................................. 100
5.6 RDEC Cross Sections ................................................................... 102
5.6.1 Total RDEC Cross Sections ................................................. 102
5.6.2 The Ratio 21 1s s
RDEC RECR σ σ= ................................................. 104
5.6.3 The Ratio 1 11 2 1s s s
RDEC RECR σ σ′ = ............................................... 105
5.6.4 The Ratio 1 1 21 2 1s s s
RDEC RDECR σ σ′′ = ............................................. 105
VI. CONCLUSION ........................................................................................... 109
APPENDIX
A. List of Abbreviations .................................................................................. 112
BIBLIOGRAPHY ................................................................................................... 114
vii
LIST OF TABLES
2.1 Measured versus calculated (from Bethe-Salpeter) total K-REC cross sections for the experiments discussed in Secs. 2.3.2 and 2.3.4. ................... 33
2.2 Measured versus calculated KL-RDEC and KK-RDEC cross sections for the experiments discussed in Secs. 2.3.2 and 2.3.4. ................................. 38
2.3 Measured versus calculated RDEC/REC cross section ratios 21 1s s
RDEC RECR σ σ= and 1 11 2 1s s s
RDEC RECR σ σ′ = as well as the KL-RDEC/KK-
RDEC cross section ratio 1 1 21 2 1s s s
RDEC RDECR σ σ′′ = for the experiments discussed in Secs. 2.3.2 and 2.3.4. ................................................................. 39
3.1 Cross-section scaling for the atomic processes of interest............................. 62
5.1 Calculated energies given in ascending order of all x-ray emission lines for 2.21 MeV/u F9+ + C in the range of interest (up to 5 keV) as well as the 55Fe lines. ................................................................................................. 87
5.2 Measured versus calculated (from Bethe-Salpeter) total K-REC cross sections for the four conducted RDEC experiments. ..................................... 94
5.3 Distribution of RDEC counts based on the analysis trials given in Fig. 5.7................................................................................................................... 99
5.4 Cross sections and the corresponding probabilities in descending order for REC, RDEC, and the other background processes for 2.21 MeV/u F9+ + C. ........................................................................................................... 103
5.5 Measured versus calculated KL-RDEC and KK-RDEC cross sections for the four conducted RDEC experiments. ................................................... 107
5.6 Measured versus calculated RDEC/REC cross section ratios 21 1s s
RDEC RECR σ σ= and 1 11 2 1s s s
RDEC RECR σ σ′ = as well as KL-RDEC/KK-
RDEC cross section ratio 1 1 21 2 1s s s
RDEC RDECR σ σ′′ = for the four conducted RDEC experiments. ....................................................................................... 108
viii
LIST OF FIGURES
2.1 Compton profile of the carbon atom in the amorphous state as calculated from Ref. [63]. ............................................................................................ 8
2.2 Schematic diagram for the atomic process REC into a fully-stripped ion showing electron capture and photon emission by a passing ion. .............. 11
2.3 X rays in coincidence measurements at 132° for U92+ + N2 at collision energies 49, 68, 220, and 358 MeV. ........................................................... 13
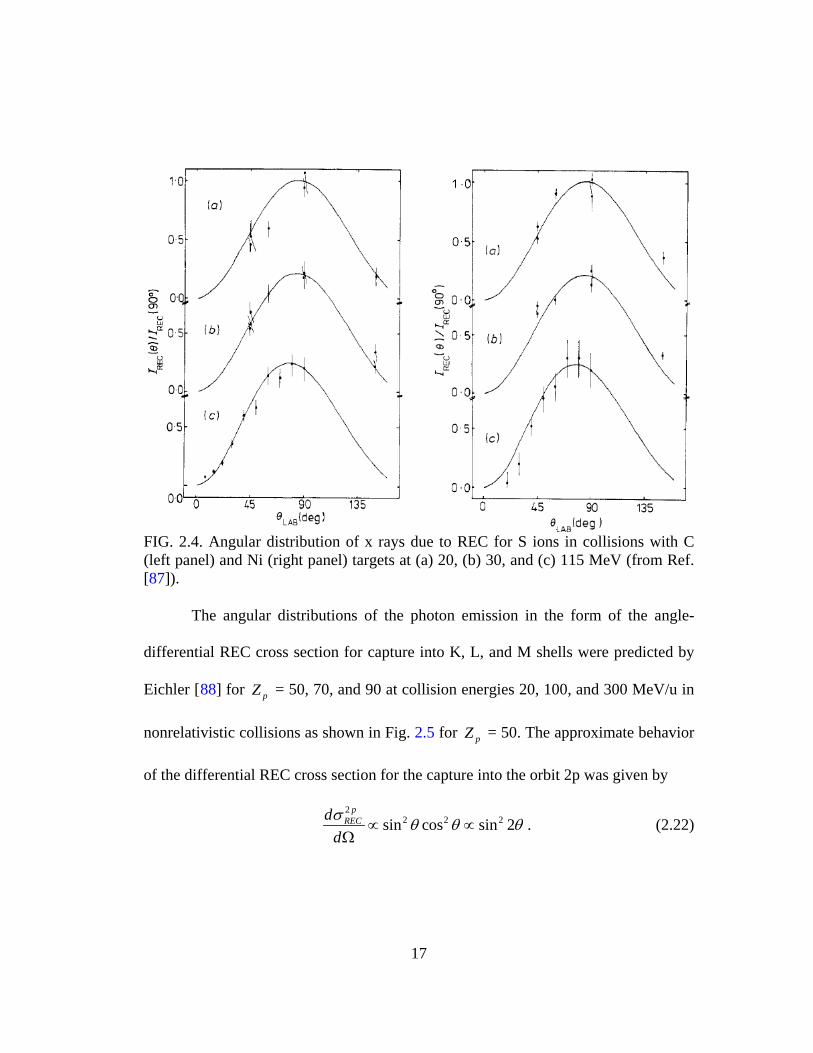
2.4 Angular distribution of x rays due to REC for S ions in collisions with C (left panel) and Ni (right panel) targets at (a) 20, (b) 30, and (c) 115 MeV. ........................................................................................................... 17
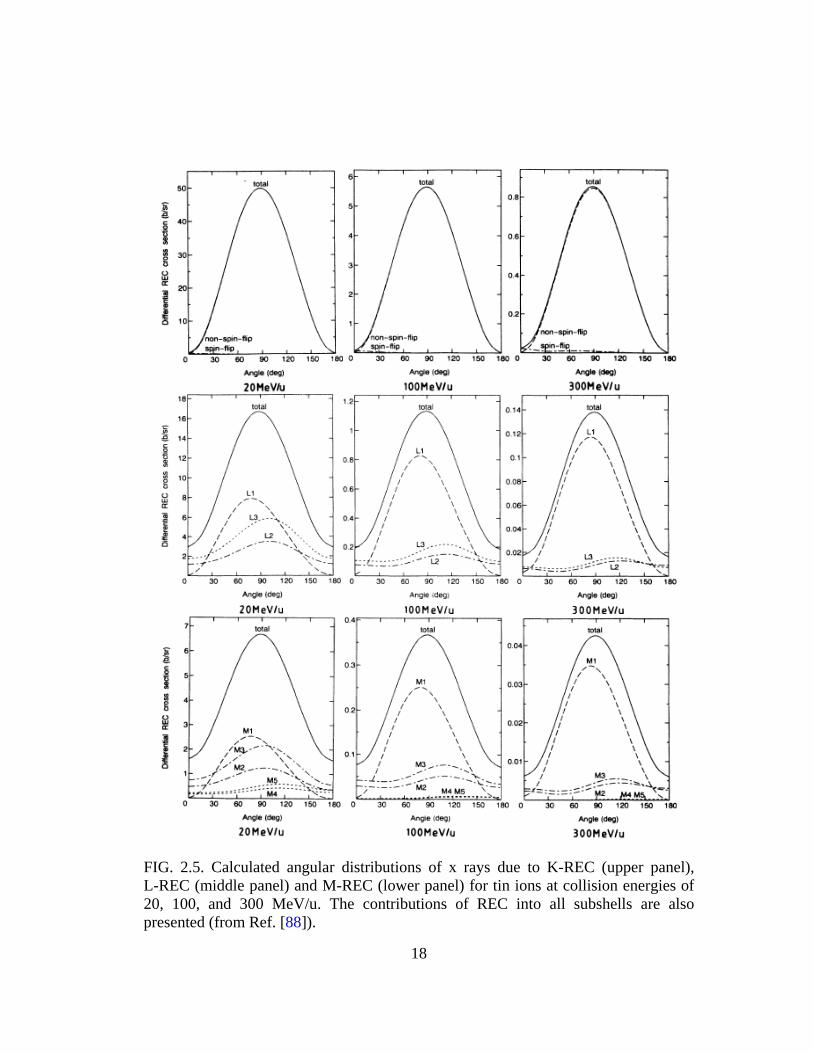
2.5 Calculated angular distributions of x rays due to K-REC (upper panel), L-REC (middle panel) and M-REC (lower panel) for tin ions at collision energies of 20, 100, and 300 MeV/u. .......................................................... 18
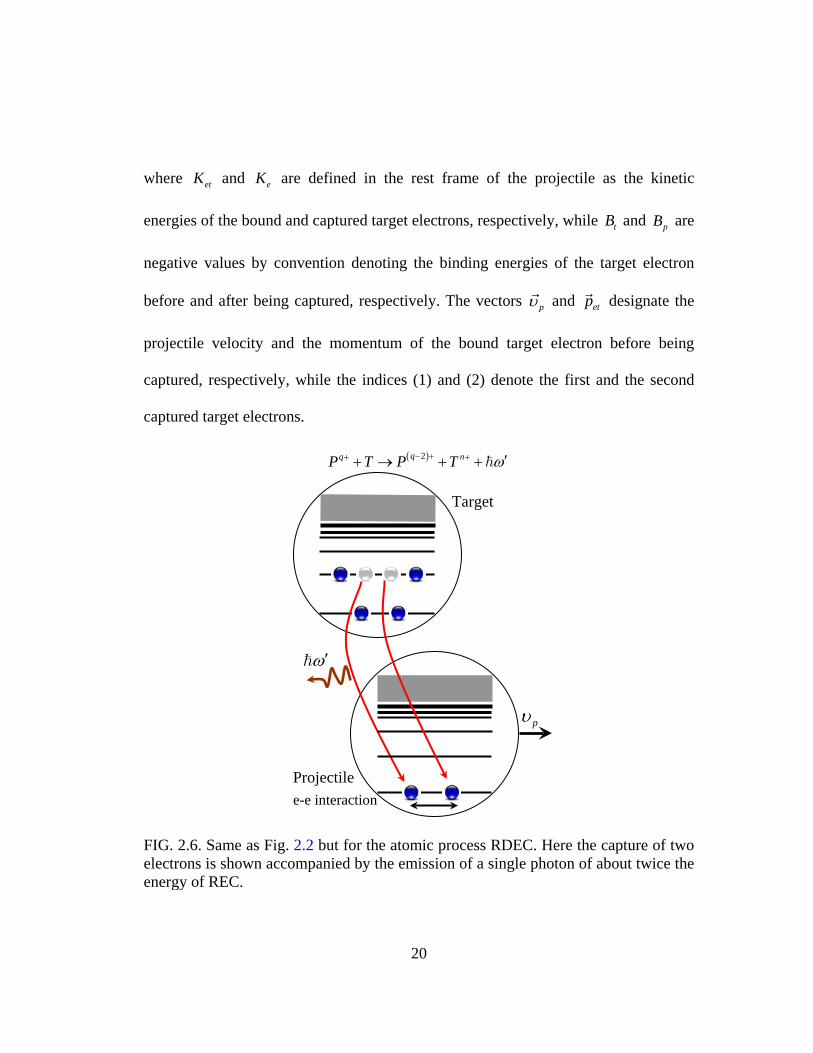
2.6 Same as Fig. 2.2 but for the atomic process RDEC. Here the capture of two electrons is shown accompanied by the emission of a single photon of about twice the energy of REC. .............................................................. 20
2.7 X rays emitted for Ar18+ + C collisions at 11.4 MeV/u. ............................. 23
2.8 Spectrum of x rays associated with double capture (U90+) emitted due to the collision of U92+ with Ar at 297 MeV/u. ............................................... 26
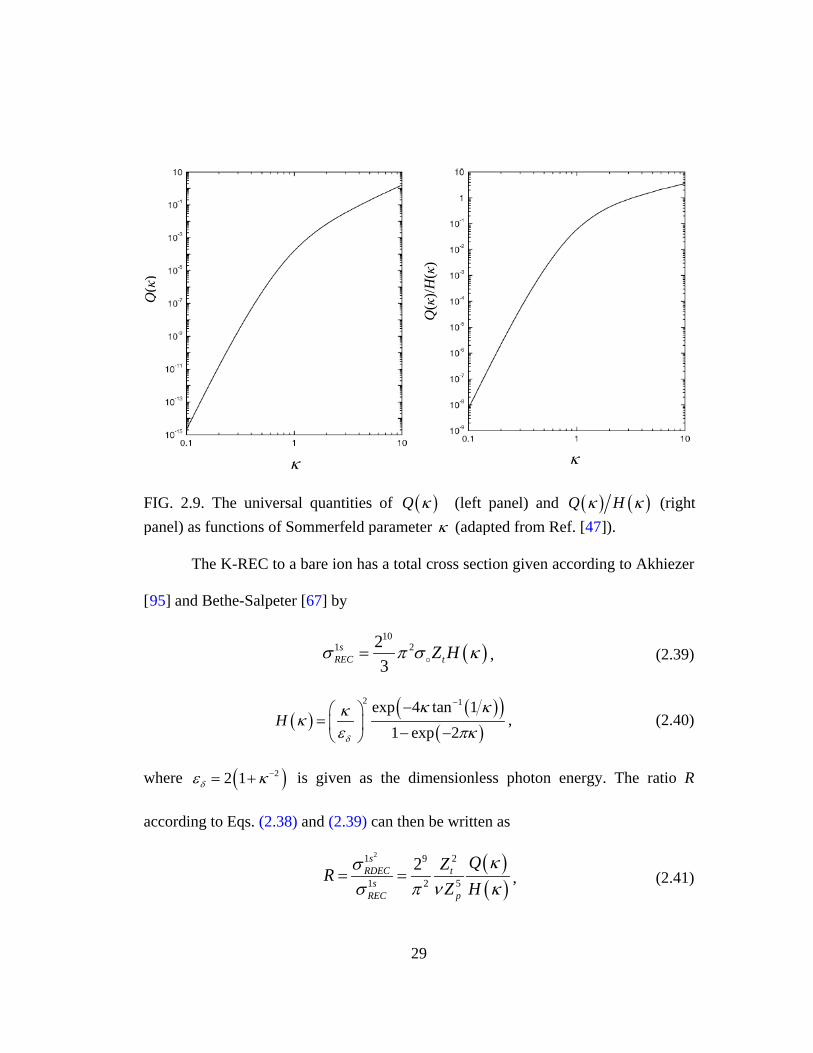
2.9 The universal quantities of ( )Q κ (left panel) and ( ) ( )Q Hκ κ (right panel) as functions of Sommerfeld parameter κ . ...................................... 29
2.10 The ratio 1 1 21 2 1s s s
RDEC RDECR σ σ′′ = as a function of Sommerfeld parameter κ . ................................................................................................................ 32
2.11 The universal quantities of ( )F κ (left panel) and ( ) ( )F Hκ κ (right panel) as functions of Sommerfeld parameter κ . ...................................... 32
2.12 X rays associated with (a) double capture and (b) single capture for O8+ + C at 38 MeV. ........................................................................................... 35
List of Figures—continued
ix
3.1 Schematic showing the hyperbolic trajectory of the incoming electron in e-n bremsstrahlung, where b is the impact parameter, Z is the atomic number of the target atom and e is the charge of the incident electron. ..... 42
3.2 Bremsstrahlung spectrum of a tungsten target bombarded with electrons over a voltage range of 20–50 kV. .............................................................. 44
3.3 Same as Fig. 2.2 but for the atomic processes ECC and RECC.. ............... 47
3.4 Calculated contributions of AB, RI, and SEB versus measured contribution of AB for 1 MeV H+ + Al (left panel) and versus the measured and calculated total contribution of the three processes for the x-ray emission for 4 MeV H+ + Al (right panel), both at 90°. .................... 50
3.5 The number of photons due to bremsstrahlung as a function of angle for central collisions of gold in the energy range 10 keV – 3 MeV. The three curves correspond to α, β, γ, which categorize as “full stopping”, “50% stopping” and “near transparency”, respectively. ....................................... 51
3.6 Bremsstrahlung spectrum for 2 MeV H+ + C. ............................................ 53
3.7 Calculated contributions of NB, AB, SEB, and the total of the three processes versus the measured total contribution of the three processes for 1.5 MeV H+ + Al at 90°. ....................................................................... 54
3.8 Bremsstrahlung spectrum (full circles) measured at -34° for e + C at a collision energy of 300 keV in coincidence with 160 keV outgoing electrons at 28°. ........................................................................................... 55
3.9 Same as Fig. 2.2 but for the atomic process NRC to the target K-shell. .... 56
3.10 Predicted total cross sections of electron capture, radiatively (dashed line), nonradiatively (dotted line), and the sum of both (solid line) for U92+ + N2 versus projectile energy. ............................................................. 58
3.11 Same as Fig. 2.2 but for the atomic process DREC to the target K-shell. .. 61
4.1 Schematic diagram of a Van de Graaff accelerator: (1) high-voltage terminal, (2) upper needles (discharging electrode), (3) lower needles (charging electrode), (4) upper metal roller, (5) lower metal roller, (6) moving belt, (7) ion source, (8) ion beam, (9) high-voltage supplier. ........ 65
List of Figures—continued
x
4.2 Schematic diagram of SNICS II ion source by cesium sputtering. ............ 68
4.3 Schematic of the tandem Van de Graaff accelerator facility at WMU. ..... 70
4.4 Schematic diagram of the experiment setup in the target room in a top view of random scale. ................................................................................ 72
4.5 Detection efficiency of SLP Series Si(Li) detector versus Be window thickness in the low-energy range ( 0.3 10− keV) and versus crystal thickness in the high-energy range ( 10> keV). ......................................... 73
4.6 Schematic diagram of the data acquisition system, showing only one particle channel as an example. .................................................................. 77
4.7 2q − particle spectrum delivered from TAC to ADC with 2 ns per channel and FWHM of the time peak of 45 ns. ..................................... 79
4.8 2q − particle-gated x rays: (a) with random events not subtracted, (b) associated with random events, (c) with random events subtracted. ... 80
5.1 Expected (calculated) REC and RDEC lines for 2.21 MeV/u F9+ on a C foil. .............................................................................................................. 82
5.2 Measurements for singles x rays (in black) for 2.21 MeV/u F9+ superimposed on PIXE (in red) using a 3 MeV protons, both on the same C foil. .......................................................................................................... 83
5.3 Drawing showing the scattering of H+ at 2.7° (in blue) and F9+ at 1.7° (in red) ions upon hitting the aperture prior to the Al frame. ........................... 85
5.4 Photon energy-calibration curve based on the characteristic lines Al Kα, K Kα, Ca Kα, Mn Kα, and Mn Kβ. ............................................................ 85
5.5 X rays associated with charge change and no charge change with random backgrounds subtracted for 2.21 MeV/u F9+ + C collisions: (a) for F7+, (b) for F8+, (c) for F9+. .................................................................... 89
List of Figures—continued
xi
5.6 X rays associated with charge change for 2.21 MeV/u F9+ + C collisions: (a) for F8+ with the spectrum of x rays associated with F7+ normalized and superimposed on it, (b) for F9+ with the spectrum of x rays associated with F7+ normalized and superimposed on it, (c) for K-REC spectrum as a result of summing up the leftovers from the spectra F8+ (61.4%), F9+ (33.4%), F7+ (5.2%) (not shown), (d) Compton profiles of the two K-shell electrons (blue), the four L-shell electrons (red), and the sum of the two profiles (black), which represents the Compton profile of the C atom. .................................................................................................. 95
5.7 Analysis trials for RDEC showing the normalized spectra of x rays associated with F8+ (in red) superimposed on the spectra of x rays associated with F7+ (in black) in the left panels. ......................................... 98
5.8 Fitting to give the average between the best two trials (b, bʹ) and (c, cʹ) of Fig. 5.7 showing x rays associated with charge change for 2.21 MeV/u F9+ + C collisions with random backgrounds subtracted: (a) for F7+ with the spectrum of x rays associated with F8+ normalized to it at the position of the K Kα line and superimposed on it, (b) for F7+ with normalized x rays associated with F8+ subtracted. ...................................... 99
1
CHAPTER I
INTRODUCTION
One of the most well-known mechanisms of interaction between
electromagnetic radiation and matter is the photoelectric effect (PE), which was first
observed by Heinrich Hertz in 1887 [1]. The effect leads to the fundamental process
of photoionization (PI) [2] during which a photoelectron is emitted from the target
upon the absorption of a single photon of energy that is sufficient to free a bound
electron. It should be noted that PI was first investigated only for neutral atomic and
molecular targets [3,4] and later for multielectron ions, theoretically [5,6,7] and
experimentally [8,9
To resolve this issue, it is better to use a system free from these e-e
interactions. The purest form of photon-electron (γ-e) interaction without interference
from the Coulomb field of other orbital electrons requires a one-electron system as
a target for the incident photon. The principle of detailed balance (PDB) [
]. The neutral atom as a multielectron system causes a background
of electron-electron (e-e) interactions during the process of PI, which in turn, is the
origin of the discrepancies between measurements and theoretical predictions.
10,11,12]
has been used to introduce an indirect way to investigate PI by measuring the time-
reversed process of radiative recombination (RR) [13] for fully-stripped target ions.
RR is a one-step process, where the incident electron is captured to a bound state of
2
the target atom with a simultaneous emission of a single photon. The one-step process
of radiative electron capture (REC) [14] can also be treated as the time-reversed
process of PI if a loosely-bound target electron is captured. When such a situation
exists and if REC is studied in the projectile frame, REC in ion-atom collisions will
not only correspond to RR in electron-ion collisions but the data of RR can also be
folded into the Compton profile of the target electrons to generate the corresponding
data of REC [15]. If a tightly-bound target electron is captured due to REC, there may
be a complication in the comparison with the theoretical predictions and REC will not
be an exact time-reversed process of PI. Performing REC for fully-stripped ions
[16,17,18,19
Another consequence of PE is double photoionization (DPI), a process that
has been considerably investigated over the past three decades for neutral atoms as
well as for various ions [
] offers the cleanest method for exploration of photoionization of H-like
ions, allowing for observation of the purest form of the γ-e interaction.
20]. It is a mechanism in which a single photon interacts
with only one target electron, causing it to be ejected, but since two electrons are
ejected, this process requires that the electrons interact and DPI is caused by the e-e
correlation [21]. To avoid a strong background interaction due to the Coulomb field
of the other electrons that do not interact with the incident photon, DPI was
investigated experimentally by means of synchrotron radiation [22,23] and VUV
lamps [24], mostly for low-Z noble gases such as He [25,26,27,28,29,30,31], Ne
[32,33,34 32], and Ar [ ,35], and theoretically for He [36,37,38,39] and rare gases in
3
general [40,41]. Little work has been done to investigate DPI of other elements,
theoretically such as H2 [42], and experimentally such as Be, Mg, and Ca [43
Similar to the analogy with PI, DPI can be predicted by the investigation of
the time-reversed process of radiative double electron capture (RDEC) to bare
projectile ions in collisions with atoms. Accordingly, RDEC was addressed over the
last two decades theoretically [
].
44,45,46,47,48,49,50] and experimentally
[51,52,53,54,55,56,57,58,59,60,61,62
Attempts to observe RDEC at the Gesellschaft für Schwerionenforschung
mbH (GSI) complex accelerator facility at Darmstadt did not confirm the observation
of RDEC primarily due to the poor statistics of the data. Although the observation of
RDEC could not be verified during such experiments, an upper limit of the total
]. RDEC is also a one-step process in ion-atom
collisions occurring when two target electrons are captured to a bound state of the
projectile simultaneously with the emission of a single photon. The emitted photon
has approximately double the energy of the photon emitted due to REC. Fully-
stripped ions were used as projectiles in the performed RDEC experiments, providing
a recipient system free of electron-related Coulomb fields. This allows the captured
target electrons to be transferred without interaction with any of the projectile
electrons, enabling accurate investigation of the electron-electron interaction in the
vicinity of electromagnetic field. Hence, studying RDEC by bare projectiles provides
a means to obtain a proper description of the two-electron wave function in the
projectile continuum of various atomic systems.
4
RDEC cross section was deduced during each experiment. This upper limit was found
to be one order and four orders of magnitude lower than the first and the second
approximations of Chernovskaya [50], respectively, three orders of magnitude lower
than the relativistic prediction of Yakhontov [45], and three orders of magnitude
higher than Mikhailov prediction [47] in the case of the relativistic heavy-ion
collision system (U92+ + Ar at 297 MeV/u) [52]. In the case of the mid-Z projectile at
nonrelativistic energy (Ar18+ + C at 11.4 MeV/u) [51], the upper limit was in fair
agreement with Yakhontov, Mikhailov, and the second approximation of
Chernovskaya [50], while it was found to be two orders of magnitude lower than the
first approximation of Chernovskaya [50].
Optimizing for the best experimental conditions under which RDEC can be
observed, solid light targets were suggested in a theoretical study for fast heavy ions
[45], while solid-state targets were proposed in another theoretical approach for slow
collisions [47] where the electrons in the valence zone behave as quasifree particles
with a characteristic velocity, which is much smaller than that of the projectile even
for slow collisions, determined by the target temperature. Such comparisons, in
addition to the recent theoretical predictions [47,48,49] suggesting projectiles of
moderate Z for low-energy collisions, were the motivation to conduct RDEC
experiments under these conditions. The observation of RDEC was verified for the
first time for the collision system 2.38 MeV/u O8+ + C [53,54,55,56,57], and then also
for the second time for the collision system 2.21 MeV/u F9+ + C [58,59,58,61,62],
5
which is the topic of this thesis. Both successful observations were conducted at the
tandem Van de Graaff accelerator facility located at Western Michigan University
(WMU). The theoretical approaches were the motivation to perform the preceding
attempts to observe RDEC as well as the two recent successful observations.
Furthermore, theory offered predictions to which our measurements can be compared,
allowing for testing the consistency of such predictions with measured cross sections.
The main goal of the work within this dissertation is to investigate RDEC
during the collision of fully-stripped fluorine ions at 2.21 MeV/u with a thin carbon
foil and compare the results to the recent experimental [54] and theoretical studies
[12,45,47,49,50]. In this work, x rays associated with projectile charge-changing by
single and double electron capture and no charge change by F9+ ions were observed
and compared with recent work for O8+ ions and with theory. REC, in turn, was
investigated as a means to compare with the theoretical predictions of the RDEC/REC
cross section ratio.
In Chapter I, the basic concepts of the atomic processes pertaining to RDEC
are explored, while REC and RDEC as the atomic processes of interest are discussed
extensively in Chapter II with emphasis on their history and the theoretical
approaches to which our results can be compared. Chapter III discusses in detail the
most important background processes that may overlap with the desired processes.
This enables extraction of REC and RDEC contributions more accurately from the
entire spectrum of x-ray emission or at least ensures that the background processes
6
have negligible contribution to the energy range of interest. The setup of the current
experiment including x-ray and particle detectors as well as the data acquisition
system is discussed in Chapter IV. The concept of the Van de Graaff accelerator with
emphasis on the facility located at WMU and the ion source used to generate the ion
beam are also discussed in the same chapter. Chapter V is dedicated to showing the
obtained results and how the singles data were analyzed to generate the x rays
associated with charge-changed and unchanged projectile ions. Proton-induced x-ray
emission (PIXE) analysis of the target is also addressed to determine the presence of
any contamination lines. A discussion is introduced in this chapter, showing how the
REC and RDEC cross sections were obtained by the subtraction of the x rays due to
the contamination lines and then compared to various theoretical approaches. Chapter
VI gives an overall view of what was achieved from the experiment and the final
conclusions based on the obtained results. Suggestions for any similar prospective
projects are also introduced.
7
CHAPTER II
RADIATIVE SINGLE AND DOUBLE ELECTRON CAPTURE
2.1 Compton Profile
The radiative single (REC) and double electron capture (RDEC) peaks have
widths defined by the Compton profile ( )zJ p of the target electrons, describing the
momentum zp distribution of the bound electrons within the target atom. The
momentum zp is defined as the projection of the intrinsic momentum vector of the
bound electron on the collision axis Z, which is defined by the direction of the
projectile velocity. Both zp and ( )zJ p are measured in the CGS system of
measurements in 2em e and 2
em e , respectively, for electron mass em , electron
charge e, and reduced Planck constant . The width of ( )zJ p increases with the
increase of the atomic number and the binding energy of the electron. Hence, the
distribution becomes broader for heavier targets and for inner-shell electrons rather
than lighter atoms and outer-shell electrons, respectively.
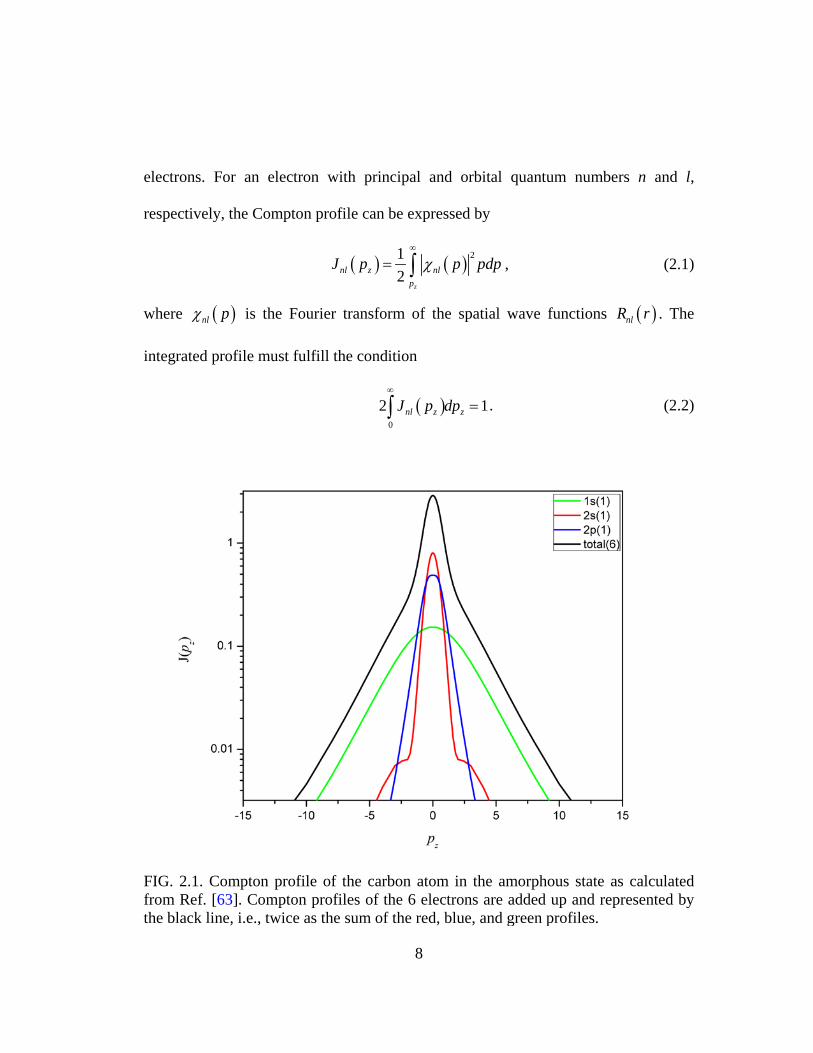
Compton profiles of the individual bound electrons within the carbon atom in
the amorphous state are drawn in Fig. 2.1 by means of the data given by Biggs [63
( )zJ p
].
The drawing shows that is broader in width for the 1s electron than for L-shell
8
electrons. For an electron with principal and orbital quantum numbers n and l,
respectively, the Compton profile can be expressed by
( ) ( ) 212
z
nl z nlp
J p p pdpχ∞
= ∫ , (2.1)
where ( )nl pχ is the Fourier transform of the spatial wave functions ( )nlR r . The
integrated profile must fulfill the condition
( )0
2 1nl z zJ p dp∞
=∫ . (2.2)
FIG. 2.1. Compton profile of the carbon atom in the amorphous state as calculated from Ref. [63]. Compton profiles of the 6 electrons are added up and represented by the black line, i.e., twice as the sum of the red, blue, and green profiles.
9
REC in ion-atom collisions is analogous to RR in electron-ion collisions if the
requirements of the impulse approximation are verified and if REC is studied in the
projectile frame, so that ab initio calculations of RR can be folded into the Compton
profile of the target electrons to generate the corresponding data for REC [15].
2.2 Radiative Electron Capture (REC)
2.2.1 Kinematics of REC
One of the most significant and dominant mechanisms of continuous x-ray
production and well-known processes during heavy-ion collisions with atoms is
radiative electron capture (REC). Before it was observed forty years ago [14,64,65],
it was theoretically studied by Stobbe [66] and Bethe and Salpeter [67]. Most of the
attention at this time was devoted to very low projectile velocities [68] since its
contribution was estimated to be small at high velocities. Following the first
observation of REC, it was investigated more through many theoretical [69,70,71,72]
and experimental [73,74,75,76,77,78,79
16
] studies with the emphasis on fully-stripped
projectile ions [ ,17,18,19].
As indicated in Fig. 2.2, REC is a one-step process, where a target electron is
captured to a projectile bound state with simultaneous emission of a single photon of
energy RECω . The photon energy is given [64] in nonrelativistic collisions under the
requirements of the principle of conservation of energy by
10
( )212REC p t et e
e
B B p pm
ω + = + +
, (2.3)
( )21 .2 et e et p et e
e
p p K p Km
υ+ = + + , (2.4)
where etK (usually neglected especially for relativistic collisions) and eK are the
kinetic energy of the bound target electron and the kinetic energy of the captured
target electron as calculated in the rest frame of the projectile, respectively. The
binding energies tB and pB are negative values by convention, denoting the binding
energies of the target electron before and after being captured, respectively. The
vectors etp , ep , and pυ designate the momentum of the bound target electron before
being captured, momentum of the captured target electron while it is moving towards
the projectile in the rest frame of projectile, and the projectile velocity, which is the
same as the velocity of the captured target electron in the rest frame of projectile,
respectively. Eqs. (2.3) and (2.4) then simplify to
.REC e et p t p etK K B B pω υ= + − + +
. (2.5)
The peak dedicated to REC has a width and structure similar to the Compton
profile of the captured target electron. Hence, it is necessary to introduce the REC
photon energy defined in terms of the Compton profile variable zp , which is given in
terms of the angle ϕ between pυ and etp by
.cosp et
z etp
pp p
υϕ
υ= =
. (2.6)
11
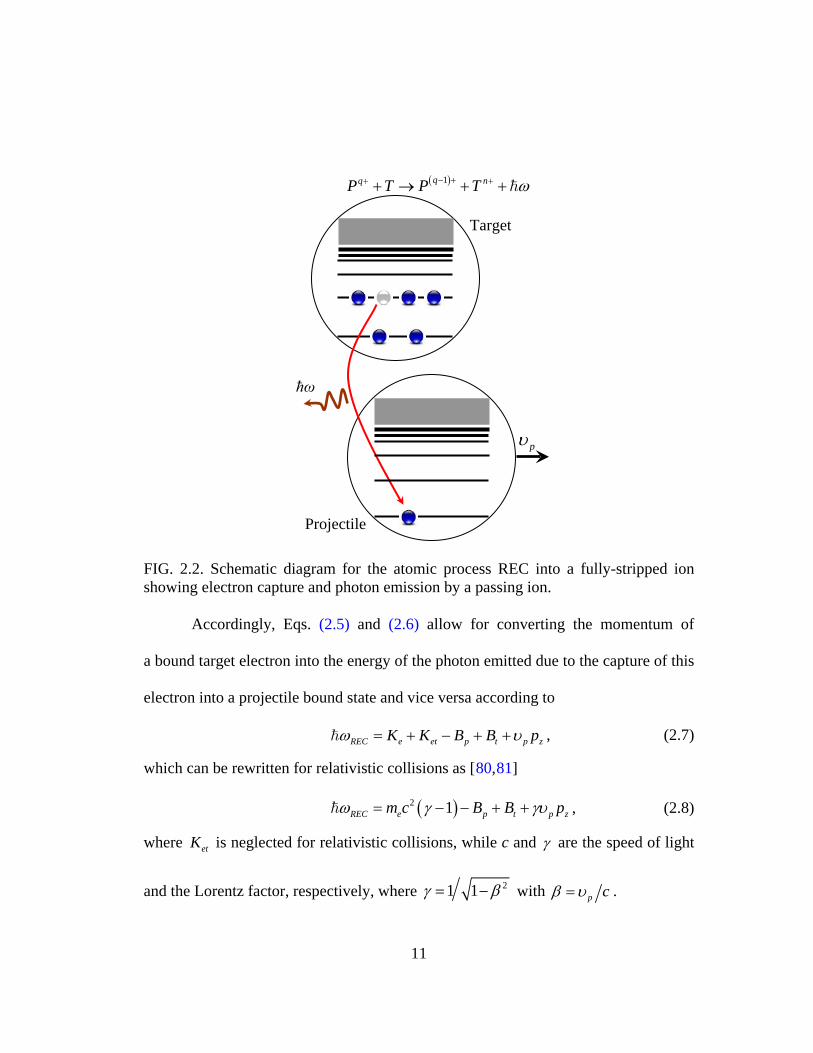
FIG. 2.2. Schematic diagram for the atomic process REC into a fully-stripped ion showing electron capture and photon emission by a passing ion.
Accordingly, Eqs. (2.5) and (2.6) allow for converting the momentum of
a bound target electron into the energy of the photon emitted due to the capture of this
electron into a projectile bound state and vice versa according to
REC e et p t p zK K B B pω υ= + − + + , (2.7)
which can be rewritten for relativistic collisions as [80,81
( )2 1REC e p t p zm c B B pω γ γυ= − − + +
]
, (2.8)
where etK is neglected for relativistic collisions, while c and γ are the speed of light
and the Lorentz factor, respectively, where 21 1γ β= − with p cβ υ= .
( )1qq nP T P T ω− ++ ++ → + +
Projectile
Target
pυ
ħω
12
The centroid energy of REC into the projectile K-shell (K-REC) is given [81] in the
laboratory frame by
( ) 21(1 cos )
e pREC
m c Bγω
γ β θ− −
=−
. (2.9)
For Eq. (2.7), the kinetic energy of the captured electron eK can be calculated by
( )e p e pK E m m= , (2.10)
while for nonrelativistic hydrogenic atoms, i.e., H-like projectile ions, the binding
energy nB for an electron with principal quantum number n is given by
2
213.6nZBn
=
, (2.11)
where Z is the charge of the nucleus, i.e., the atomic number, for projectile ( pZ ) or
target ( tZ ) in the case of pB or tB , respectively. For multielectron ions, Z is
replaced by the nucleus effective charge effZ seen by the bound target electron before
being captured for tB and after being captured for pB . There are several approaches
to calculate effZ [82,83
2.2.2 REC Cross Section
], and for precise values, atomic codes such as Hartree-Fock
(HF) can be used.
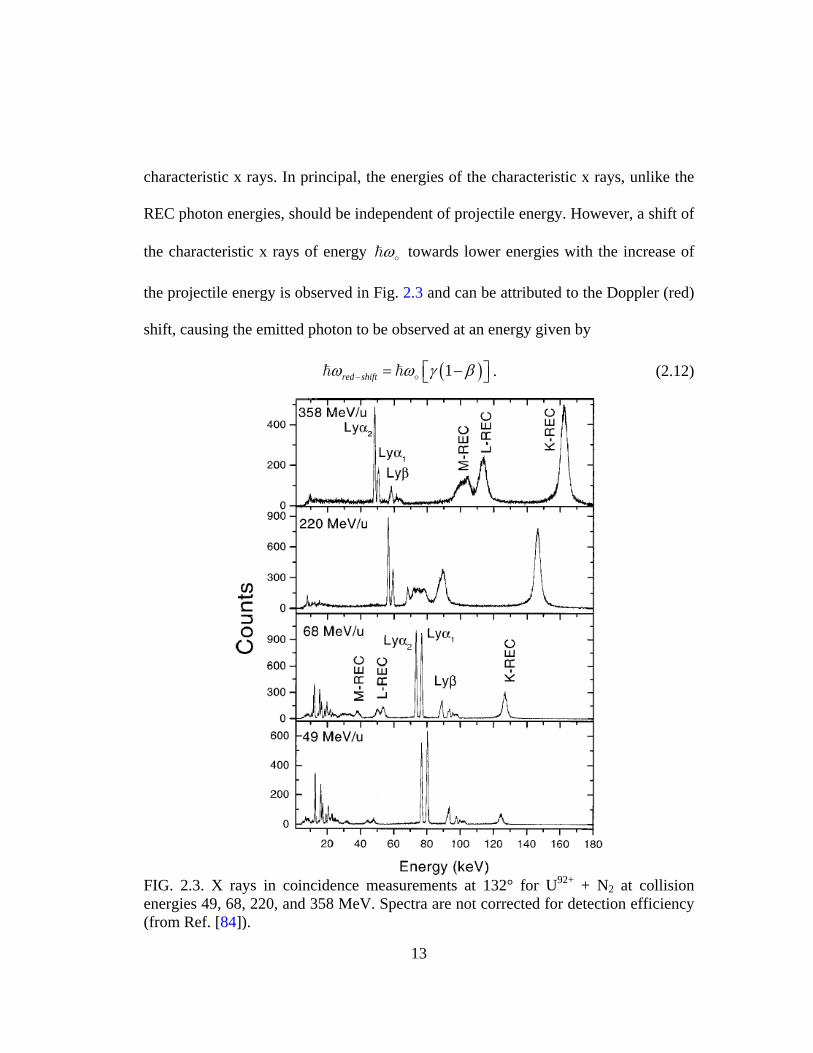
The comparison between the four panels of Fig. 2.3 [84] not only tells us that
the REC peaks shift to lower energies as the projectile energy decreases but also it
shows that such peaks are apparently broader in width than the peaks dedicated to the
13
characteristic x rays. In principal, the energies of the characteristic x rays, unlike the
REC photon energies, should be independent of projectile energy. However, a shift of
the characteristic x rays of energy ω
towards lower energies with the increase of
the projectile energy is observed in Fig. 2.3 and can be attributed to the Doppler (red)
shift, causing the emitted photon to be observed at an energy given by
( )1red shiftω ω γ β− = −
. (2.12)
FIG. 2.3. X rays in coincidence measurements at 132° for U92+ + N2 at collision energies 49, 68, 220, and 358 MeV. Spectra are not corrected for detection efficiency (from Ref. [84]).
14
One of the most reliable theoretical predictions of the total K-REC cross
section 1sRECσ is the formula derived by Stobbe [66] and estimated later by Bethe and
Salpeter [67]. The Bethe-Salpeter formula was derived for a bare nucleus and 1sRECσ is
given per target electron within the non-relativistic dipole approximation by
( ) ( )( )( )
2 1321 2
2
exp 4 tan 19.16 10 cm /atom
1 1 exp 2REC
BSκ κκσ
κ πκ
−−
− = × + − −
, (2.13)
where κ is the Sommerfeld parameter and is defined [49] in terms of the average
momentum epp of the target electron after being captured to the projectile K-shell
and the momentum ep of captured target electron in the rest frame of projectile by
ep
e
pp
κ = . (2.14)
The Sommerfeld, sometimes called Coulomb, parameter measures how strongly the
asymptotic wave function of the electron during the collision will be distorted by the
Coulomb interaction, where strong distortion is for the collision systems with 1κ > .
The momenta epp and ep are defined by
2e p
ep e ep e p
m e Zp m m c Zυ α= = =
, e e pp m υ= , (2.15)
where α and pZα are the fine structure constant given in the CGS system by 2e c
and the Coulomb parameter, respectively, while epυ is the average velocity of the
target electron after it transfers to the projectile K-shell. Consequently, the
Sommerfeld parameter κ can be written as
15
2ep ep p p
e p p
p Z Z ep
υ ακ
υ β υ= = = =
. (2.16)
The adiabacity parameter η , as a value to judge how fast ( 1η > ) or slow ( 1η < ) the
collision is, can be defined in terms of κ [18,79,85
( ) ( )2 2
22
MeV40.31p ee
ep ep p p
KKK Z Z
υ βη κυ α
−
= = = =
] by
. (2.17)
For fast nonrelativistic collisions, the total REC cross section scales as [85,86
5
5p t
RECp
Z Zσ
υ∝
]
. (2.18)
REC in ion-atom collisions corresponds to RR in electron-ion collisions if
a loosely-bound target electron is captured under the validity of the impulse
approximation conditions. Accordingly, both processes are considered as the time-
reversed process of PI. Owing to the principle of detailed balance [10,11,12], RECσ
can be calculated from the corresponding photoionization cross section PIσ
[15,51,66] as given by
( ) ( )2
2REC t PIe
Zm cωσ β σ ω
γβ
=
. (2.19)
Measuring REC by fully-stripped projectile ions offers the cleanest method
for exploration of photoionization of H-like ions. This allows for observation of the
γ-e interaction in its purest form. If the photon dedicated to REC is emitted due to the
16
capture of an inner-shell target electron, Eq. (2.19) becomes inaccurate for conversion
between the two processes.
2.2.3 Angular Distribution of REC Photon Emission
The angular distribution of K-REC as described by its differential cross
section (DCS) within the dipole approximation in nonrelativistic collisions was given
by Kleber in 1975 [71,80] and confirmed by Schule [87
( )1
4exp 23 sin 1 cos8
sREC
RECd
dσ σ θ β θ
π− = − Ω
] in 1977 with a more general
expression that is valid for relativistic and nonrelativistic collisions as given by
. (2.20)
The corresponding predicted differential K-REC cross section is given by
( )1
423 sin 1 cos8
sB SREC
t RECd N
dσ σ θ β θ
π−− = − Ω
, (2.21)
where the approximation ( ) 41 cos 1 4 cosβ θ β θ−− + can be used. The symbol Nt
denotes the number target electrons, while θ is the x-ray observation angle with
respect to the beam direction.
Angular distribution of x-ray emission due to K-REC is shown in Fig. 2.4 for
S ions in collisions with C (left panel) and Ni (right panel) at 20, 30, and 115 MeV.
The spectra show that the trend of 2sin θ is well-verified over the tested range of
x-ray observation angles.
17
FIG. 2.4. Angular distribution of x rays due to REC for S ions in collisions with C (left panel) and Ni (right panel) targets at (a) 20, (b) 30, and (c) 115 MeV (from Ref. [87]).
The angular distributions of the photon emission in the form of the angle-
differential REC cross section for capture into K, L, and M shells were predicted by
Eichler [88 pZ] for = 50, 70, and 90 at collision energies 20, 100, and 300 MeV/u in
nonrelativistic collisions as shown in Fig. 2.5 for pZ = 50. The approximate behavior
of the differential REC cross section for the capture into the orbit 2p was given by
22 2 2sin cos sin 2
pRECd
dσ θ θ θ∝ ∝Ω
. (2.22)
18
FIG. 2.5. Calculated angular distributions of x rays due to K-REC (upper panel), L-REC (middle panel) and M-REC (lower panel) for tin ions at collision energies of 20, 100, and 300 MeV/u. The contributions of REC into all subshells are also presented (from Ref. [88]).
19
To transform between differential REC cross sections at different observation
angles [79,89
(2.23)
], for instance, between the projectile (primed) and the laboratory
(unprimed) systems, one can use Eq. in light of the set of Eqs. (2.24).
( ) ( )REC RECd d dd d d
σ θ σ θ′ ′Ω=
′Ω Ω Ω, (2.23)
( )22
11 cos
dd γ β θ
′Ω=
Ω −, coscos
1 cosθ βθβ θ
−′ =−
, ( )
sinsin1 cos
θθγ β θ
′ =−
. (2.24)
The double differential and total K-REC cross sections are related by [81]
( ) ( )( )
2 11
90 ,23
sRECs
REC
dd
d dσ θ ω
σ ωω
==
Ω∫
, (2.25)
while the double and single differential K-REC cross sections are related through
Compton profile ( )zJ p as given by [81]
( )( ) ( )
2 1 1, 1s sREC REC
z
d d J pd d c dσ θ ω σ
ω γβ
= Ω Ω
. (2.26)
2.3 Radiative Double Electron Capture (RDEC)
2.3.1 Kinematics of RDEC
As indicated in Fig. 2.6, RDEC is a one-step process where two electrons are
captured from one target atom to a projectile bound state during a single collision
with simultaneous emission of a single photon of about double the energy of REC.
The RDEC photon energy is then given by
( ) ( )(1) (2)(1) (2) (1) (2)2 2 . .RDEC e et p p t t p et p etK K B B B B p pω υ υ= + − − + + + +
, (2.27)
20
where etK and eK are defined in the rest frame of the projectile as the kinetic
energies of the bound and captured target electrons, respectively, while tB and pB are
negative values by convention denoting the binding energies of the target electron
before and after being captured, respectively. The vectors pυ
and etp designate the
projectile velocity and the momentum of the bound target electron before being
captured, respectively, while the indices (1) and (2) denote the first and the second
captured target electrons.
FIG. 2.6. Same as Fig. 2.2 but for the atomic process RDEC. Here the capture of two electrons is shown accompanied by the emission of a single photon of about twice the energy of REC.
( )2qq nP T P T ω− ++ + ′+ → + +
e-e interaction
ω′
Target
Projectile
pυ
21
If the target electrons are captured through the same channels, i.e., two
identical target electrons are captured to the same orbit, or in other words they
transfer from identical orbits to identical orbits, Eq. (2.27) simplifies to
( )2 2 .RDEC REC e et p t p etK K B B pω ω υ= + − + +
. (2.28)
Similar to REC, each RDEC peak has a width and structure defined by the
sum of Compton profiles of the two captured electrons. Referring to Eq. (2.6),
Eq. (2.27) can be rewritten in terms of the Compton variable zp as
( ) ( )(1) (2)(1) (2) (1) (2)2 2RDEC e et p p t t p z p zK K B B B B p pω υ υ= + − − + + + + . (2.29)
The two captured electrons are correlated due to the mutual Coulomb
interaction between them, while the emitted photon satisfies the law of conservation
of energy between the initial and final states of the collision partners. The target
electrons can be captured from the same orbit or from two different orbits to the
projectile K-shell (KK-RDEC) or to both K- and L-shells (KL-RDEC). The RDEC
photon with the lowest energy is emitted when two K-shell electrons are captured
from the target atom to the projectile metastable state 1s12s1, while the photon of
highest energy is released if two valence target electrons (L-shell) are captured to the
projectile ground state 1s2. Although the angular distribution of RDEC photon
emission has not been reported yet in the literature, it was assumed in this dissertation
that RDEC photons are emitted with the same angular distribution as REC.
22
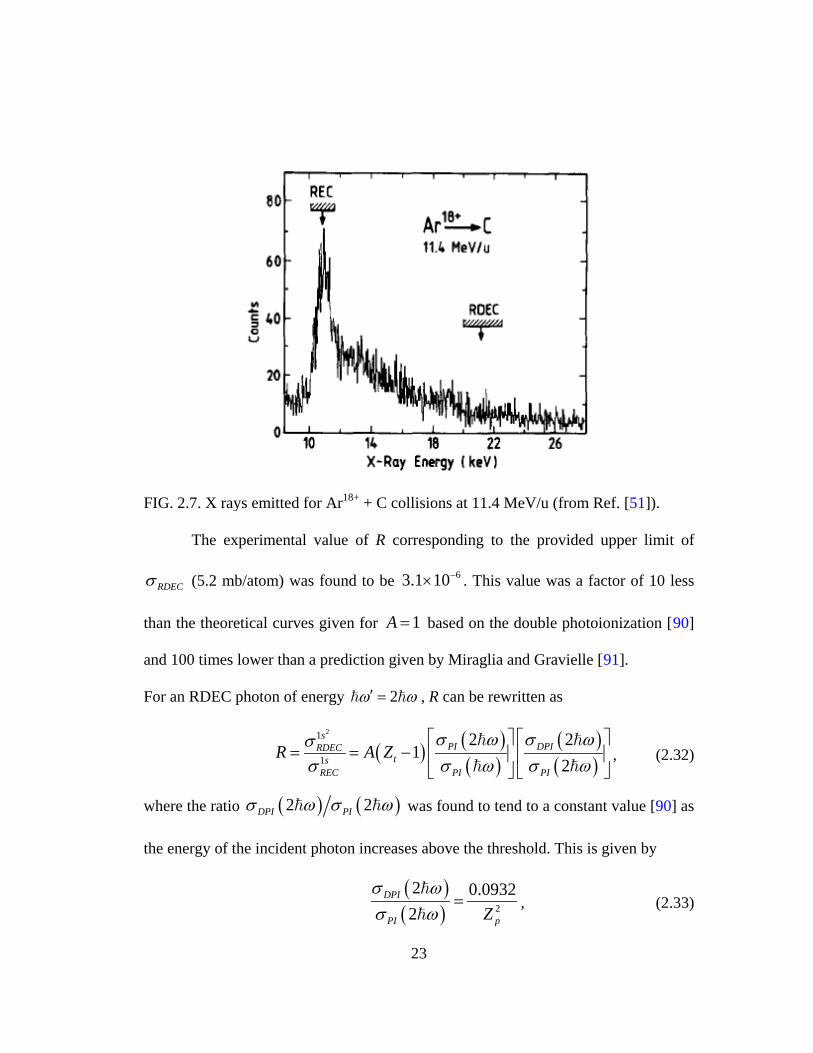
2.3.2 The First Experiment Dedicated to RDEC: Testing the Principle of Detailed Balance
Measurements looking for RDEC started in 1994 with an experiment
conducted at the GSI accelerator complex facility at Darmstadt as the first attempt to
observe the process for the collision system 11.4 MeV/u Ar18+ + C [51]. A stainless-
steel attenuator for which the attenuation was 0.999% was used to suppress possible
pileup events (see Section 3.4 below) from REC photons. The observation of RDEC
could not be verified as shown in Fig. 2.7 due to the poor statistics of the collected
data. However, the few counts collected in the RDEC energy range allowed an upper
limit of 5.2 mb/atom to be deduced for the total RDEC cross section RDECσ .
Owing to the principle of detailed balance and similar to REC, RDECσ can be
found from the corresponding double photoionization cross section DPIσ as given by
( ) ( ) ( )2
212RDEC t t DPI
e
AZ Zm cωσ β σ ω
γβ ′
′= −
, (2.30)
where the value 1A ≤ describes the phase space fraction accessible to RDEC.
According to Warczak [51], Eqs. (2.19) and (2.30) can be utilized to find the ratio R
for the capture into the projectile K-shell by
( ) ( )( )
2 21
1 12
sDPIRDEC
tsREC PI
R A Zσ ωσ ω
σ ω σ ω′′ = = −
. (2.31)
23
FIG. 2.7. X rays emitted for Ar18+ + C collisions at 11.4 MeV/u (from Ref. [51]).
The experimental value of R corresponding to the provided upper limit of
RDECσ (5.2 mb/atom) was found to be 63.1 10−× . This value was a factor of 10 less
than the theoretical curves given for 1A = based on the double photoionization [90]
and 100 times lower than a prediction given by Miraglia and Gravielle [91
For an RDEC photon of energy
].
2ω ω′ = , R can be rewritten as
( ) ( )( )
( )( )
21
1
2 21
2
sPI DPIRDEC
tsREC PI PI
R A Zσ ω σ ωσ
σ σ ω σ ω
= = −
, (2.32)
where the ratio ( ) ( )2 2DPI PIσ ω σ ω was found to tend to a constant value [90] as
the energy of the incident photon increases above the threshold. This is given by
( )( ) 2
2 0.09322
DPI
PI pZσ ωσ ω
=
, (2.33)
24
while the ratio ( ) ( )2PI PIσ ω σ ω can be obtained from tabulated cross section
values for the high-energy limit [92
( ) ( )( )
21 12
20.09321 PIs sRDEC t REC
p PI
A ZZ
σ ωσ σ
σ ω
= −
] where the photon energy exceeds the threshold
of the double photoionization. This implies
. (2.34)
The principle of detailed balance can be simplified in the light of the photon energy
dependence of single photoionization (PI) given in the literature [90,92] by
( )51
PIσ ωω
∝
. (2.35)
This yields a factor of 1/32 for the PI ratio, allowing Eq. (2.34) to be rewritten as
( )21
1 2
0.0031s
RDECts
REC p
R A ZZ
σσ
= = −
. (2.36)
2.3.3 Yakhontov Predictions of RDEC/REC Ratio: Nonrelativistic Approach versus Relativistic Enhancement Prediction
The discrepancy found in the results obtained from the Ar18+ experiment [51]
with the available theoretical estimations [90,91] was the motivation for Yakhontov
[44,45] to perform nonrelativistic calculations modeled particularly to accommodate
the requirements of the collision system (Ar18+ + C collisions at 11.4 MeV/u). The
calculated upper limit of R was estimated to be 3.6×10⁻⁶, which is in good agreement
with the value 3.1×10⁻⁶ obtained by Warczak [51]. The corresponding 21s
RDECσ was
obtained by summing up over the two possible polarizations of the photon and
25
integrating over the direction of photon emission. It was found to be 1.85 mb/atom,
which is in fair agreement with the upper limit of 5.2 mb/atom obtained by Warczak
[51]. Moreover, a scaling law is derived within Ref. [45], showing that
5pR Z −∝ , (2.37)
which can be utilized in finding R for a nonrelativistic collision system in terms of
another R of a different nonrelativistic system, provided that both systems have the
same or very close Sommerfeld parameters. A reference value can be taken as
RAR=3.6×10⁻⁶.
Although the nonrelativistic calculations were of main interest in the
Yakhontov approach [45], a relativistic treatment was also introduced, assuming
a strong enhancement of 21s
RDECσ compared to the nonrelativistic estimation by a factor
F defined in detail within Ref. [45]. The factor 2 1F σ σ= was evaluated as 1 and 7
for Ar and U, respectively. For R enhancement, the factor F turns into 82 1F R R= .
2.3.4 The Second Attempt to Observe RDEC: Testing the Yakhontov Approach
This scaling rule derived by Yakhontov [45] was tested during the second
attempt to observe RDEC [52] at the ESR storage ring of GSI for the collision system
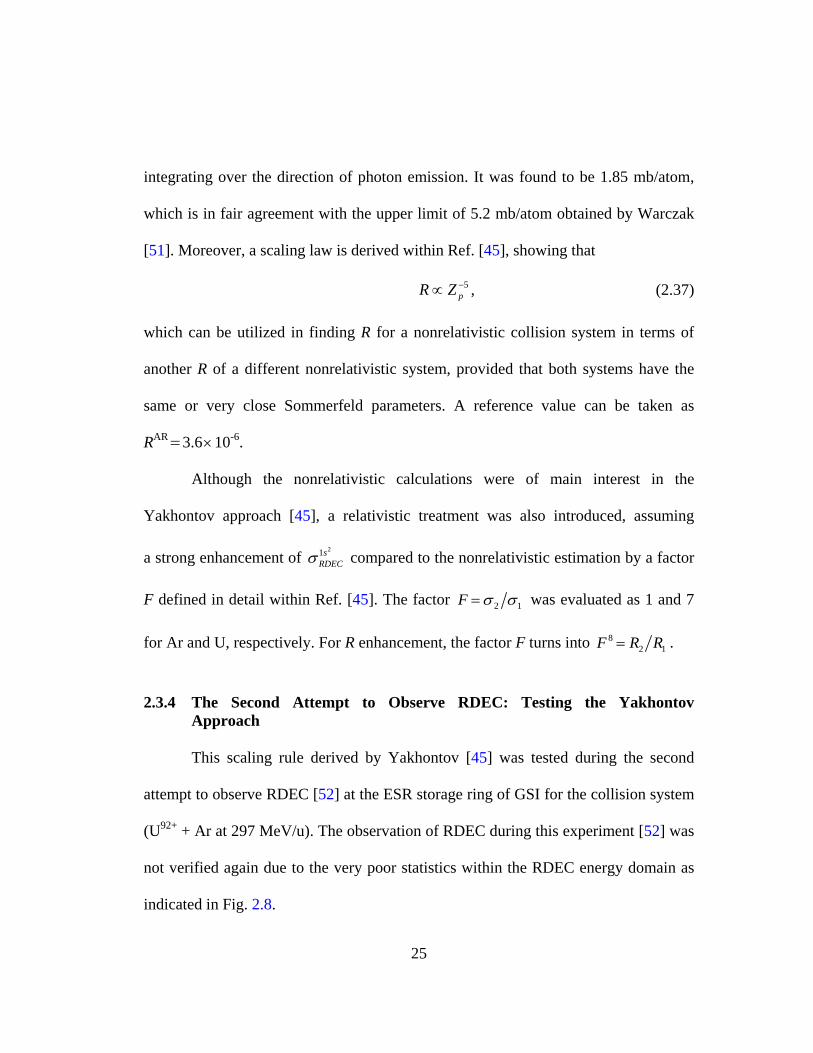
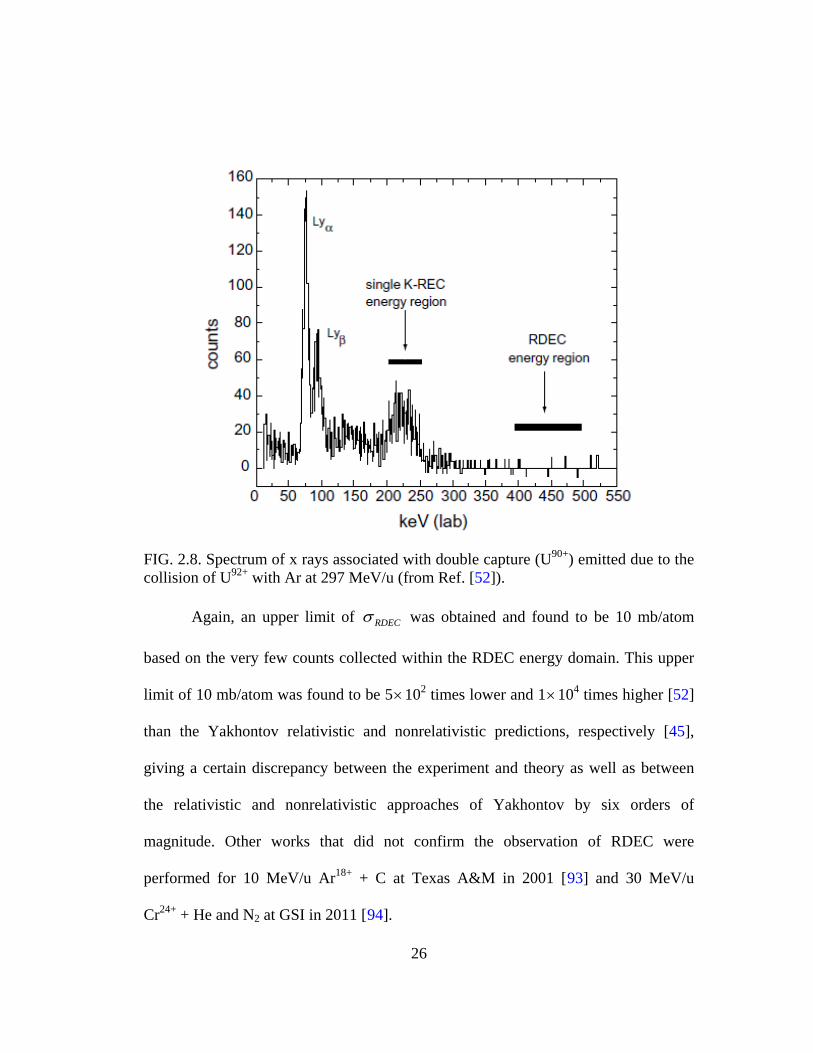
(U92+ + Ar at 297 MeV/u). The observation of RDEC during this experiment [52] was
not verified again due to the very poor statistics within the RDEC energy domain as
indicated in Fig. 2.8.
26
FIG. 2.8. Spectrum of x rays associated with double capture (U90+) emitted due to the collision of U92+ with Ar at 297 MeV/u (from Ref. [52]).
Again, an upper limit of RDECσ was obtained and found to be 10 mb/atom
based on the very few counts collected within the RDEC energy domain. This upper
limit of 10 mb/atom was found to be 5×10² times lower and 1×10⁴ times higher [52]
than the Yakhontov relativistic and nonrelativistic predictions, respectively [45],
giving a certain discrepancy between the experiment and theory as well as between
the relativistic and nonrelativistic approaches of Yakhontov by six orders of
magnitude. Other works that did not confirm the observation of RDEC were
performed for 10 MeV/u Ar18+ + C at Texas A&M in 2001 [93] and 30 MeV/u
Cr24+ + He and N2 at GSI in 2011 [94].
27
2.3.5 Mikhailov Nonrelativistic Approach versus Modulated Relativistic Enhancement Prediction for RDEC into the Projectile K-shell
The huge discrepancy between the results obtained from the U92+ + Ar
experiment [52] and the predictions introduced by Yakhontov [45] stimulated
Mikhailov [47] and Nefiodov [49] to perform new nonrelativistic calculations of
RDEC to explain the origin of the disagreement between theory and experiment in the
case of heavy-ion collisions. A detailed treatment of both predictions is given below
in terms of the universal functions ( )Q κ , ( )H κ , and ( )F κ as derived quantities
from numerical integration within the dipole approximation and taking into account
the leading orders of perturbation theory. The functions are given in terms of the
Sommerfeld parameter κ , which is utilized to conclude how fast ( 1κ ) or slow
( 1κ ) the collision is, while for the near-threshold domain ( 1κ ), the K-shell-
( )DPIσ ω′ reaches its maximum.
According to the Mikhailov approach [47], RDEC of tightly-bound as well as
valence electrons into the ground state 1s2 of bare projectile ions within the
nonrelativistic domain of collision energy is the topic of question. The leading orders
of 1 pZ and pZα expansions were considered. If two tightly-bound target electrons
are captured to the K-shell of light projectiles, then the total RDEC cross section can
be written as
( )2319
15
23
s tRDEC
p
Z QZ
σσ κν
= , (2.38)
28
where 3 2aσ α=
is a constant given in terms of the fine structure α and the Bohr
radius a° . The ratio V Vν =
is a dimensionless volume defined in terms of the
effective localization volume V of the two captured electrons within the target atom
and calibrated in units of ( )3tV a Z=
. If two K-shell target electrons are captured,
then V is given by ( )3tV a Zπ=
and hence, ν π= . If at least one of the two
electrons is captured from other target bound states, i.e., other than the K-shell, then V
is denoted by nV and given by ( )3
n effV a n Zπ=
. This implies that ν is denoted by
nν and defined as ( )3
n n t effV V nZ Zν π= =
, where n is the principal quantum
number from which the outer target electron is captured and effZ is the effective
charge of the target nucleus as seen by the target orbital electron before being
captured to the projectile. The effective charge is given by eff t nZ Z δ= − , where nδ is
the screening correction defined by the average fractional number of target electrons
between the nucleus and the electron to be captured. For a carbon atom as a target, the
two singlet pairs (1s)2 and (2s)2 and the triplet pair (2p)2 have 1 0.3snδ = and
2 2s pn nδ δ= = 2.75, respectively [82]. It is expected that much higher values of
21sRDECσ
can be obtained during slow collisions of multicharged ions with solid targets. The
universal function ( )Q κ for a collision of Sommerfeld parameter κ can be obtained
from the left panel of Fig. 2.9.
29
FIG. 2.9. The universal quantities of ( )Q κ (left panel) and ( ) ( )Q Hκ κ (right panel) as functions of Sommerfeld parameter κ (adapted from Ref. [47]).
The K-REC to a bare ion has a total cross section given according to Akhiezer
[95 67] and Bethe-Salpeter [ ] by
( )10
1 223
sREC tZ Hσ π σ κ=
, (2.39)
( )( )( )
( )
2 1exp 4 tan 11 exp 2
Hδ
κ κκκε πκ
−− = − −
, (2.40)
where ( )22 1δε κ −= + is given as the dimensionless photon energy. The ratio R
according to Eqs. (2.38) and (2.39) can then be written as
( )( )
21 29
1 2 5
2sRDEC t
sREC p
QZRZ H
κσσ π ν κ
= = , (2.41)
κ
Q(κ
)/H(κ
)
Q(κ
)
κ
30
where the universal ratio ( ) ( )Q Hκ κ corresponding to a specific Sommerfeld
parameter κ can be estimated from the right panel of Fig. 2.9.
If two valence target electrons are captured into the projectile ground state 1s2,
then the total RDEC cross section is given by
( ) ( ) ( )23 3 519 19
15 5
2 23 3
es eRDEC
p p
n a n aQ QZ Z
σ ασ κ κ= =
, (2.42)
where ( )e V t A tn N N Mρ= is the target electron density in cm-3 given in terms of the
number of valence target electrons NV, Avogadro’s number NA, volume density tρ ,
and molar mass Mt of the target. For amorphous carbon, which is the target used for
this work, 4VN = , 1.95tρ = g/cm3, and 12tM = g/mol, giving ne = 3.91×1023 cm-3.
Mikhailov estimated the same factor of enhancement suggested by Yakhontov
differently into a simpler form given by
( )22pZF αα −′ = . (2.43)
The modulated factor of enhancement 2 1F σ σ′ = was evaluated to be 1 and
3 for Ar and U, respectively. Similar to the R enhancement in the Yakhontov
prediction, this approach gives an enhancement of R by 82 1F R R′ = . This implies an
agreement with the enhanced R value between the two relativistic approaches given
by Yakhontov [45] and Mikhailov [47] in the case of the Ar18+ experiment, while
a discrepancy of three orders of magnitude was found in case of the U92+ experiment.
31
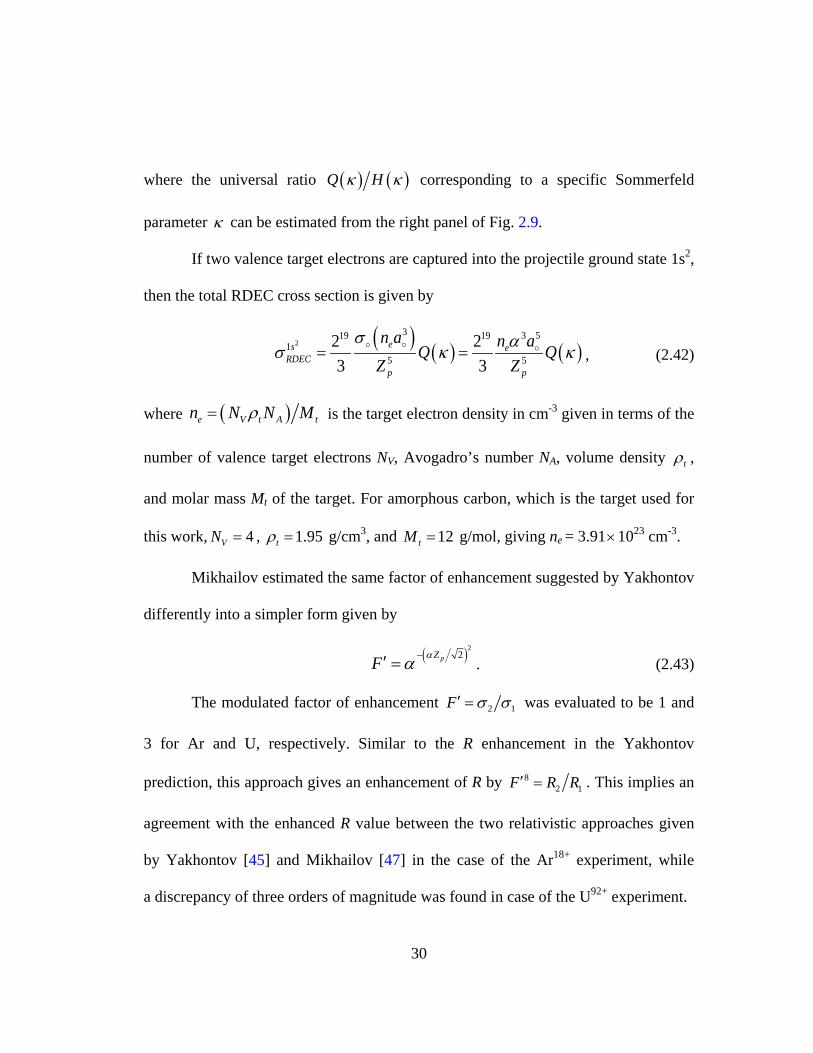
2.3.6 Nefiodov Nonrelativistic Approach for RDEC into the Projectile Metastable State 1s12s1
This approach is limited to the capture of tightly-bound target electrons into
the projectile metastable state 1s12s1 within the nonrelativistic domain of collision
energies. As seen from Fig. 2.10, it is predicted that the cross section of RDEC into
the excited state 1s12s1 is enhanced drastically for slow collisions ( 1κ ) compared
to the cross section for RDEC into the projectile K-shell. Nefiodov [49] calculated the
RDEC cross section into the projectile excited state 1s12s1 to be given by
( )1 1315
1 25
23
s s tRDEC
p
Z FZ
σσ κν
= , (2.44)
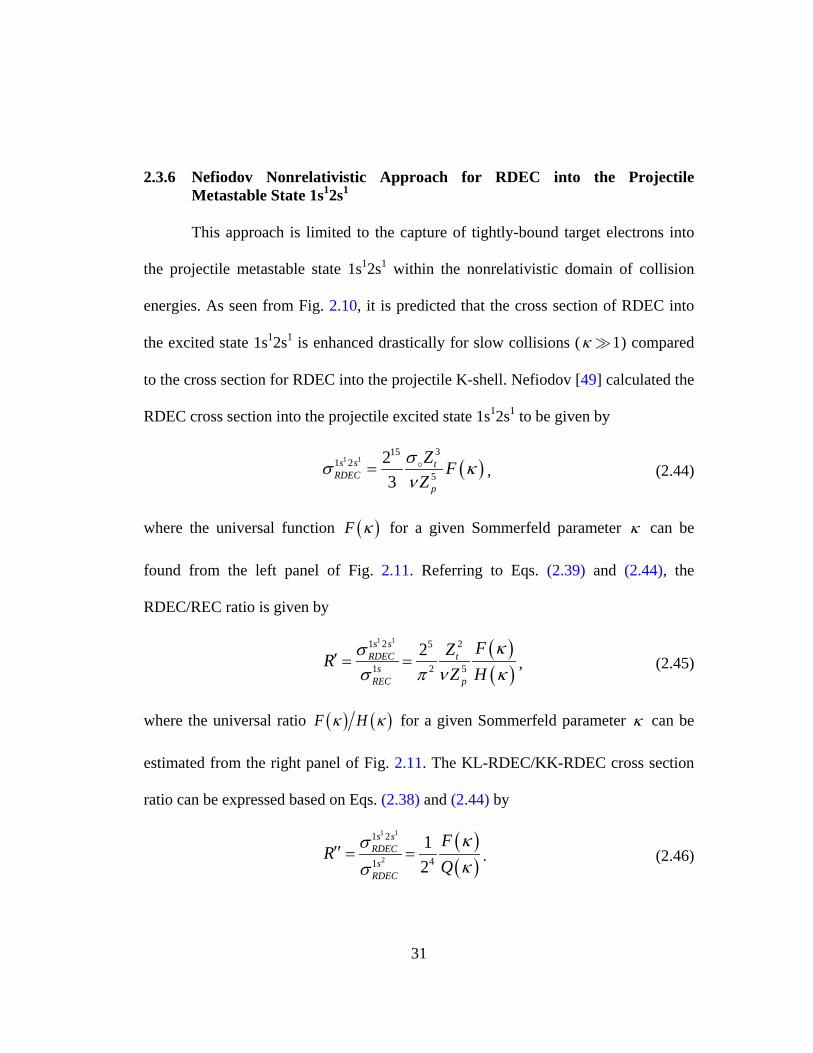
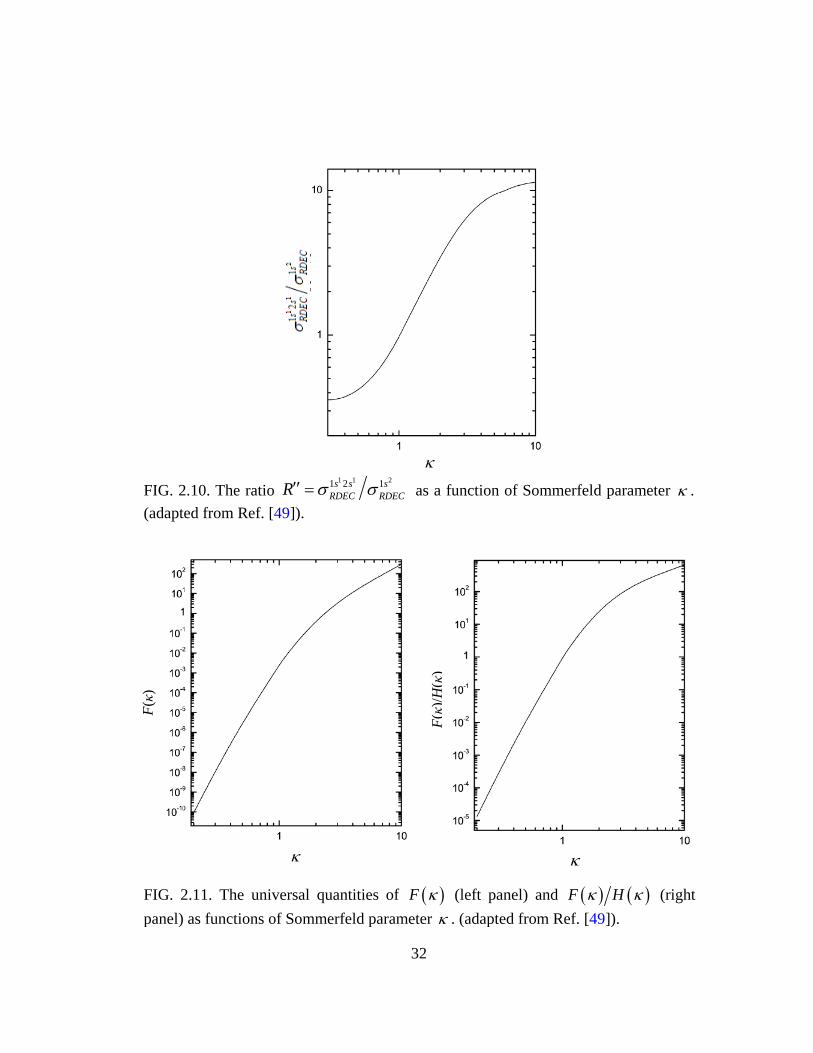
where the universal function ( )F κ for a given Sommerfeld parameter κ can be
found from the left panel of Fig. 2.11. Referring to Eqs. (2.39) and (2.44), the
RDEC/REC ratio is given by
( )( )
1 11 2 25
1 2 5
2s sRDEC t
sREC p
FZRZ H
κσσ π ν κ
′ = = , (2.45)
where the universal ratio ( ) ( )F Hκ κ for a given Sommerfeld parameter κ can be
estimated from the right panel of Fig. 2.11. The KL-RDEC/KK-RDEC cross section
ratio can be expressed based on Eqs. (2.38) and (2.44) by
( )( )
1 1
2
1 2
41
12
s sRDEC
sRDEC
FR
Qκσκσ
′′ = = . (2.46)
32
FIG. 2.10. The ratio
1 1 21 2 1s s sRDEC RDECR σ σ′′ = as a function of Sommerfeld parameter κ .
(adapted from Ref. [49]).
FIG. 2.11. The universal quantities of ( )F κ (left panel) and ( ) ( )F Hκ κ (right panel) as functions of Sommerfeld parameter κ . (adapted from Ref. [49]).
F(κ)
/H(κ
)
F(κ)
κ
κ κ
33
No universal graph was introduced for the ratio ( ) ( )F Qκ κ , hence the left
panels of Figs. 2.9 and 2.11 are to be used individually, or simply Fig. 2.10 can be
directly used. The value obtained for R′′ is more reliable than the values obtained
from Eqs. (2.41) and (2.45) since it does not depend on the dimensionless volume ν
as an origin of large error.
All the REC and RDEC cross sections with the ratios included from theory
and experiment are tabulated within Tables 2.1, 2.2, and 2.3 for the Ar18+ and U92+
experiments conducted at GSI in 1994 [51] and 2002 [52], respectively.
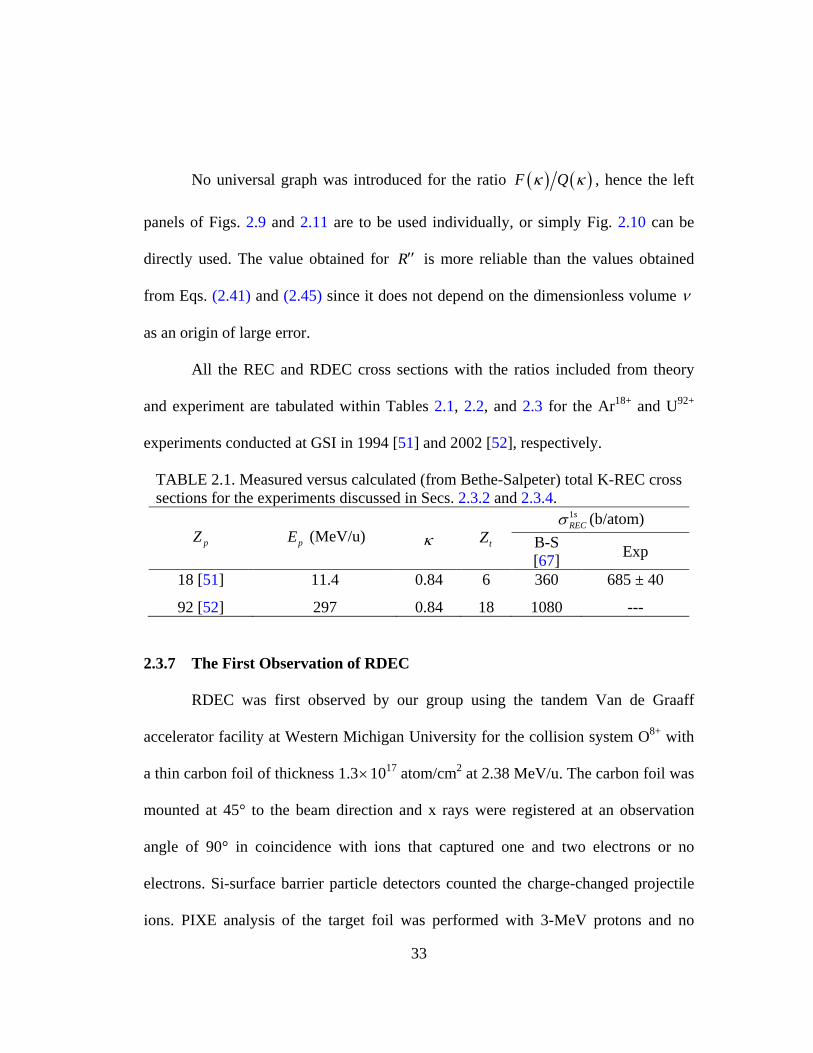
TABLE 2.1. Measured versus calculated (from Bethe-Salpeter) total K-REC cross sections for the experiments discussed in Secs. 2.3.2 and 2.3.4.
pZ pE (MeV/u) κ tZ 1sRECσ (b/atom)
B-S [67] Exp
18 [51] 11.4 0.84 6 360 685 ± 40
92 [52] 297 0.84 18 1080 ---
2.3.7 The First Observation of RDEC
RDEC was first observed by our group using the tandem Van de Graaff
accelerator facility at Western Michigan University for the collision system O8+ with
a thin carbon foil of thickness 1.3×10¹⁷ atom/cm2 at 2.38 MeV/u. The carbon foil was
mounted at 45° to the beam direction and x rays were registered at an observation
angle of 90° in coincidence with ions that captured one and two electrons or no
electrons. Si-surface barrier particle detectors counted the charge-changed projectile
ions. PIXE analysis of the target foil was performed with 3-MeV protons and no
34
evidence of characteristic x rays due to contaminations was found in the REC
(1.7–2.3 keV) or RDEC (2.8–4.2 keV) energy ranges.
A beam of 38 MeV O7+ was also used so that a projectile system of a half-
filled K-shell can be used to block the KK-RDEC. This reflects on a difference in the
structure of the x rays in the RDEC energy region, which was verified by finding no
significant structure in the case of the O7+ beam compared to an obvious structure in
the RDEC energy domain in the case of the O8+ beam.
The data acquisition system allowed for the x rays to be registered in
coincidence with particles so that spectra dedicated to x rays associated with single
(O7+) and double capture (O6+) were generated as shown in the panels (a) and (b),
respectively, of Fig. 2.12. Evidence for RDEC structure was observed in the energy
region corresponding to these events in the spectra of x rays associated with double
and single capture in a ratio of about 1:10, respectively. Also, REC events were seen
in both the spectra of x rays associated with single and double capture, respectively.
Having RDEC in the spectrum of x rays associated with single capture (O7+) was
attributed to the prompt ionization of the electrons captured to L-shell for which the
ionization probability is about one order of magnitude larger than the K-shell
ionization [96,97]. Appearance of REC in the x-ray spectrum associated with double
capture (O6+) was attributed to nonradiative electron capture (NRC) accompanying
REC as uncorrelated events. No contribution was found to the RDEC energy domain
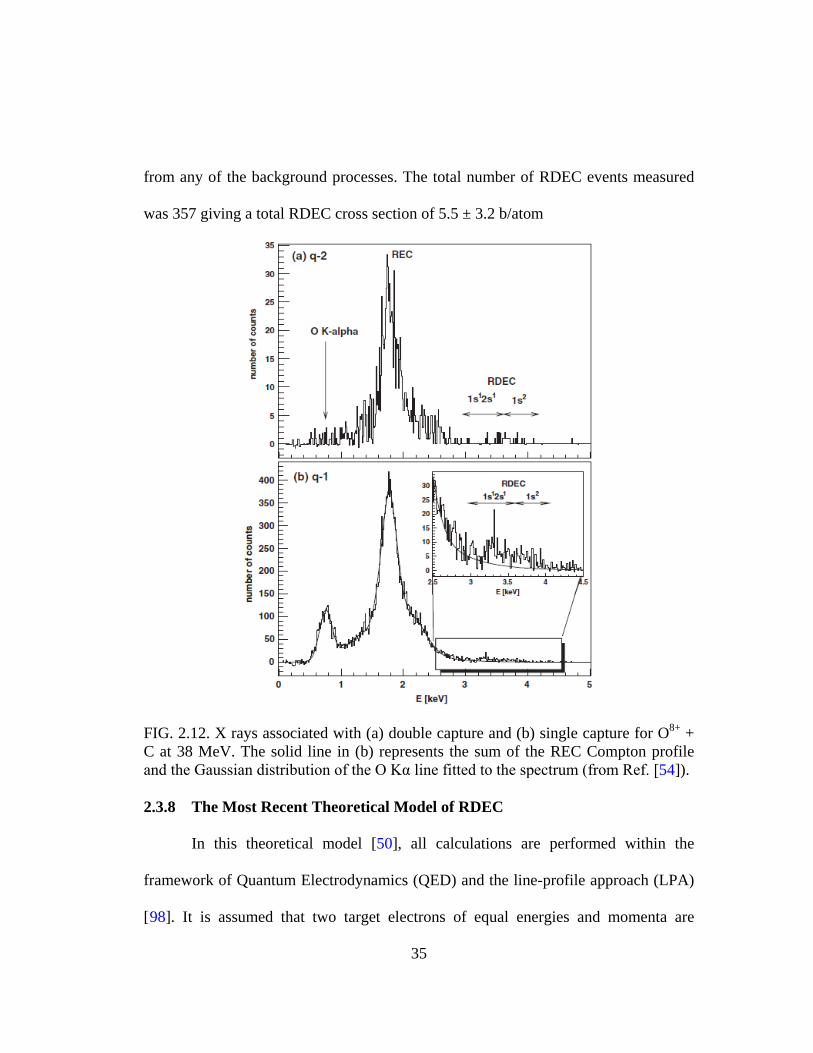
35
from any of the background processes. The total number of RDEC events measured
was 357 giving a total RDEC cross section of 5.5 ± 3.2 b/atom
FIG. 2.12. X rays associated with (a) double capture and (b) single capture for O8+ + C at 38 MeV. The solid line in (b) represents the sum of the REC Compton profile and the Gaussian distribution of the O Kα line fitted to the spectrum (from Ref. [54]).
2.3.8 The Most Recent Theoretical Model of RDEC
In this theoretical model [50], all calculations are performed within the
framework of Quantum Electrodynamics (QED) and the line-profile approach (LPA)
[98]. It is assumed that two target electrons of equal energies and momenta are
36
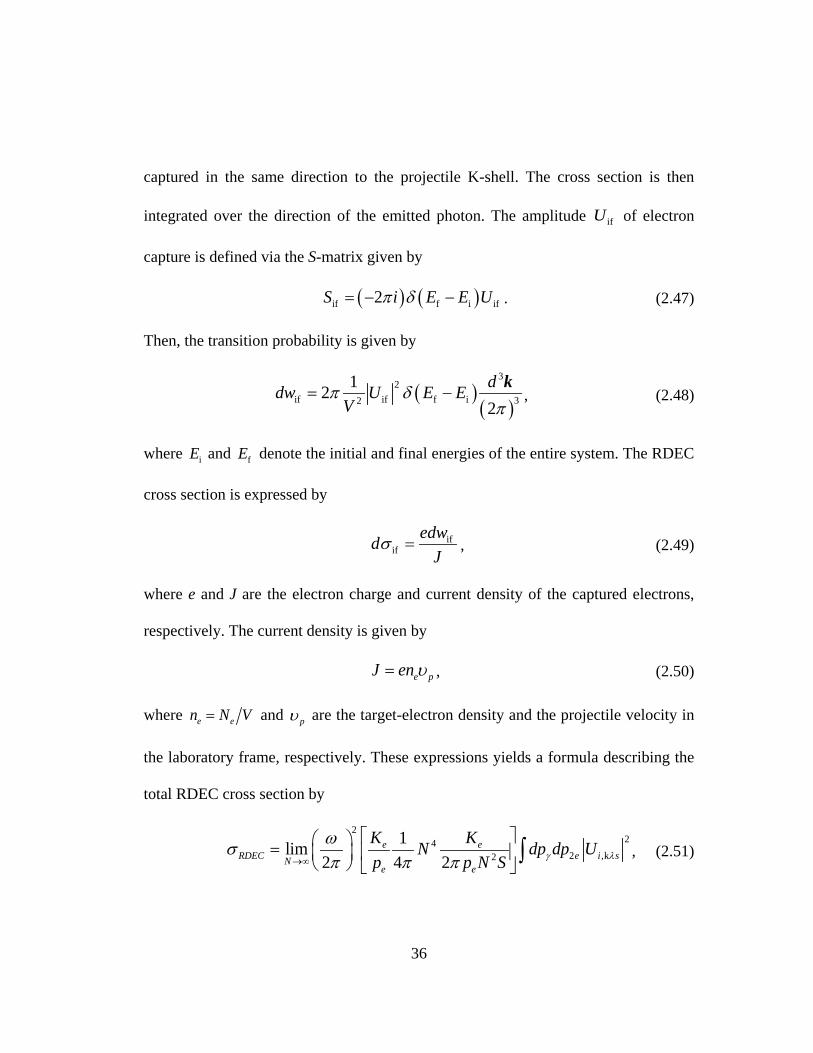
captured in the same direction to the projectile K-shell. The cross section is then
integrated over the direction of the emitted photon. The amplitude ifU of electron
capture is defined via the S-matrix given by
( ) ( )if f i if2S i E E Uπ δ= − − . (2.47)
Then, the transition probability is given by
( )( )
32
if if f i 32
122ddw U E E
Vπ δ
π= −
k, (2.48)
where iE and fE denote the initial and final energies of the entire system. The RDEC
cross section is expressed by
ifif
edwdJ
σ = , (2.49)
where e and J are the electron charge and current density of the captured electrons,
respectively. The current density is given by
e pJ en υ= , (2.50)
where e en N V= and pυ are the target-electron density and the projectile velocity in
the laboratory frame, respectively. These expressions yields a formula describing the
total RDEC cross section by
224
2 ,k2
1lim2 4 2
e eRDEC e i sN
e e
K KN dp dp Up p N S γ λ
ωσπ π π→∞
=
∫ , (2.51)
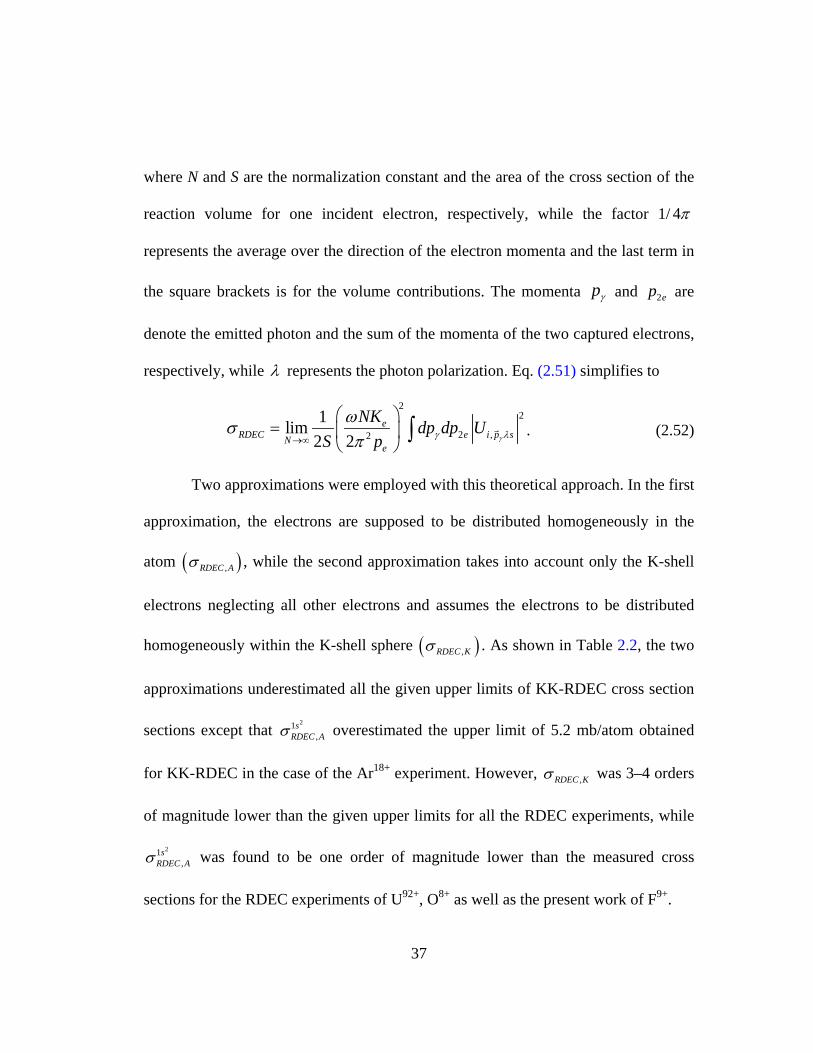
37
where N and S are the normalization constant and the area of the cross section of the
reaction volume for one incident electron, respectively, while the factor 1/ 4π
represents the average over the direction of the electron momenta and the last term in
the square brackets is for the volume contributions. The momenta pγ and 2ep are
denote the emitted photon and the sum of the momenta of the two captured electrons,
respectively, while λ represents the photon polarization. Eq. (2.51) simplifies to
22
2 ,2
1lim2 2
eRDEC e i p sN
e
NK dp dp US p γγ λ
ωσπ→∞
=
∫ . (2.52)
Two approximations were employed with this theoretical approach. In the first
approximation, the electrons are supposed to be distributed homogeneously in the
atom ( ),RDEC Aσ , while the second approximation takes into account only the K-shell
electrons neglecting all other electrons and assumes the electrons to be distributed
homogeneously within the K-shell sphere ( ),RDEC Kσ . As shown in Table 2.2, the two
approximations underestimated all the given upper limits of KK-RDEC cross section
sections except that 21
,s
RDEC Aσ overestimated the upper limit of 5.2 mb/atom obtained
for KK-RDEC in the case of the Ar18+ experiment. However, ,RDEC Kσ was 3–4 orders
of magnitude lower than the given upper limits for all the RDEC experiments, while
21,
sRDEC Aσ was found to be one order of magnitude lower than the measured cross
sections for the RDEC experiments of U92+, O8+ as well as the present work of F9+.
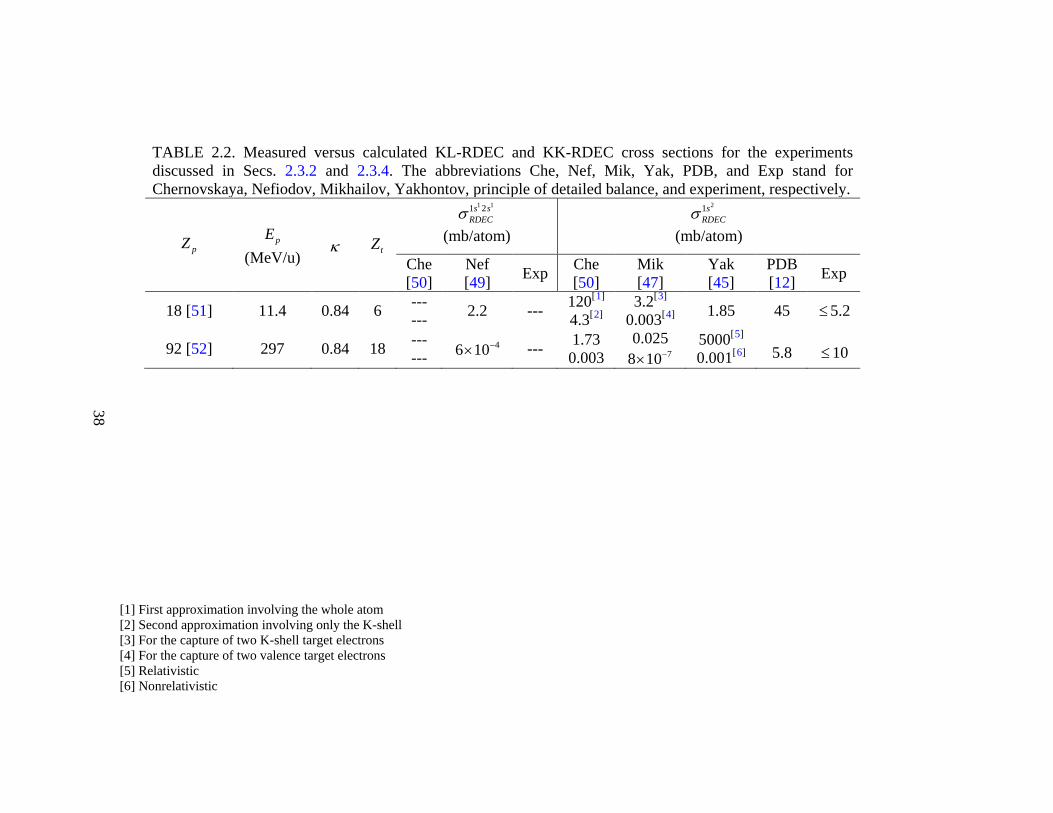
TABLE 2.2. Measured versus calculated KL-RDEC and KK-RDEC cross sections for the experiments discussed in Secs. 2.3.2 and 2.3.4. The abbreviations Che, Nef, Mik, Yak, PDB, and Exp stand for Chernovskaya, Nefiodov, Mikhailov, Yakhontov, principle of detailed balance, and experiment, respectively.
pZ pE (MeV/u)
κ tZ
1 11 2s sRDECσ
(mb/atom)
21sRDECσ
(mb/atom)
Che [50]
Nef [49] Exp Che
[50] Mik [47]
Yak [45]
PDB [12] Exp
18 [51] 11.4 0.84 6 --- --- 2.2 --- 120[1
4.3[
] 2
3.2[
] 3
0.003[
] 4 1.85 ] 45 ≤5.2
92 [52] 297 0.84 18 --- ---
46 10−× --- 1.73 0.003
0.025 78 10−×
5000[5
0.001[
] 6 5.8 ] ≤10
[1] First approximation involving the whole atom [2] Second approximation involving only the K-shell [3] For the capture of two K-shell target electrons [4] For the capture of two valence target electrons [5] Relativistic [6] Nonrelativistic
38
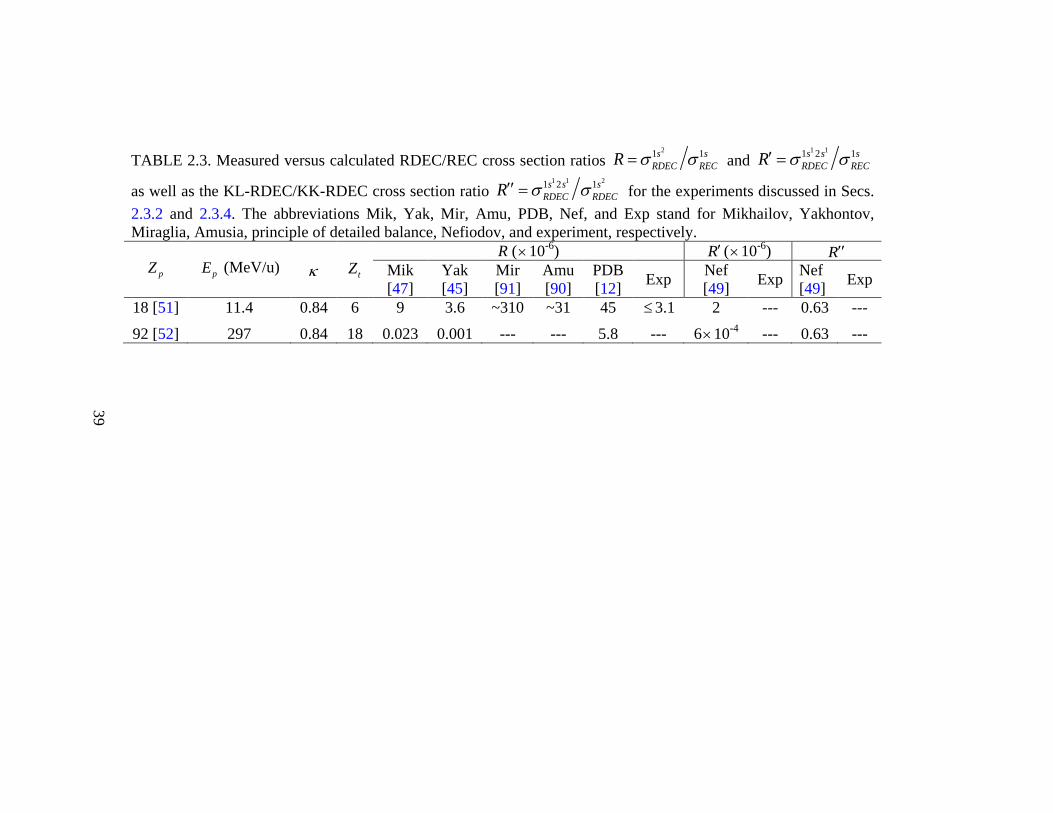
TABLE 2.3. Measured versus calculated RDEC/REC cross section ratios 21 1s s
RDEC RECR σ σ= and 1 11 2 1s s s
RDEC RECR σ σ′ =
as well as the KL-RDEC/KK-RDEC cross section ratio 1 1 21 2 1s s s
RDEC RDECR σ σ′′ = for the experiments discussed in Secs. 2.3.2 and 2.3.4. The abbreviations Mik, Yak, Mir, Amu, PDB, Nef, and Exp stand for Mikhailov, Yakhontov, Miraglia, Amusia, principle of detailed balance, Nefiodov, and experiment, respectively.
pZ pE (MeV/u) κ tZ R (×10-6) R′ (×10-6) R′′
Mik [47]
Yak [45]
Mir [91]
Amu [90]
PDB [12] Exp Nef
[49] Exp Nef [49] Exp
18 [51] 11.4 0.84 6 9 3.6 ~310 ~31 45 ≤3.1 2 --- 0.63 ---
92 [52] 297 0.84 18 0.023 0.001 --- --- 5.8 --- 6×10⁻⁴ --- 0.63 ---
39
40
CHAPTER III
BACKGROUND PROCESSES
In ion-atom collisions, several background processes are likely to contribute
to the raw x rays and may overlap with the x rays due to REC and RDEC. In the
current study, possible contributions from electron-nucleus (e-n) bremsstrahlung,
nuclear bremsstrahlung (NB), electron-electron (e-e) bremsstrahlung, the two-step
process of uncorrelated double radiative electron capture (DREC), REC combined
with nonradiative electron capture to a projectile bound state (NRC), as well as pileup
are taken into account during the analysis of the observed x rays. The present work
was performed for the collision system of 2.21 MeV/u F9+ ions with a thin carbon foil
of thickness (7.7± 1.1)×1017 atom/cm2 and the background processes are considered
in this domain. The most significant background processes are discussed below in
detail.
3.1 X-ray Emission from Bremsstrahlung
One of the most significant and well-known mechanisms of continuous x-ray
production in atomic scattering is bremsstrahlung [99
2eE
] for which energies of the
emitted photon Eγ and the inelastically-scattered electrons [100] are both
continues. These processes are discussed in turn below.
41
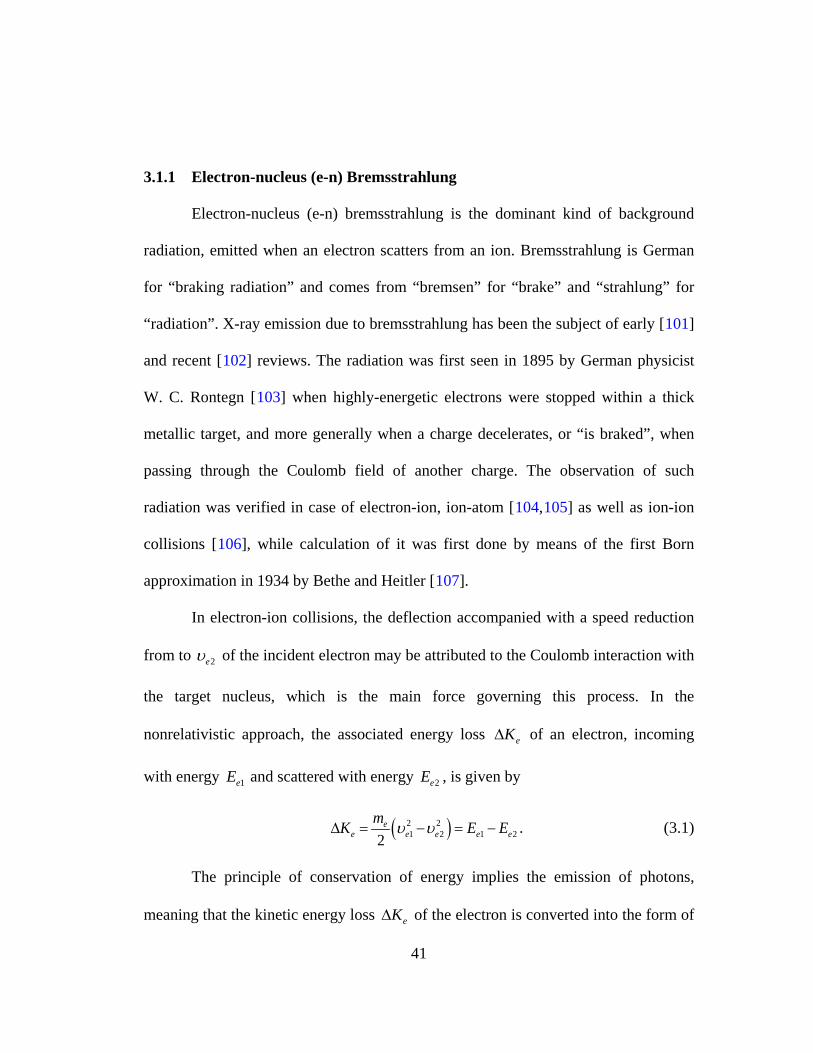
3.1.1 Electron-nucleus (e-n) Bremsstrahlung
Electron-nucleus (e-n) bremsstrahlung is the dominant kind of background
radiation, emitted when an electron scatters from an ion. Bremsstrahlung is German
for “braking radiation” and comes from “bremsen” for “brake” and “strahlung” for
“radiation”. X-ray emission due to bremsstrahlung has been the subject of early [101]
and recent [102] reviews. The radiation was first seen in 1895 by German physicist
W. C. Rontegn [103] when highly-energetic electrons were stopped within a thick
metallic target, and more generally when a charge decelerates, or “is braked”, when
passing through the Coulomb field of another charge. The observation of such
radiation was verified in case of electron-ion, ion-atom [104,105] as well as ion-ion
collisions [106], while calculation of it was first done by means of the first Born
approximation in 1934 by Bethe and Heitler [107
In electron-ion collisions, the deflection accompanied with a speed reduction
from to
].
2eυ of the incident electron may be attributed to the Coulomb interaction with
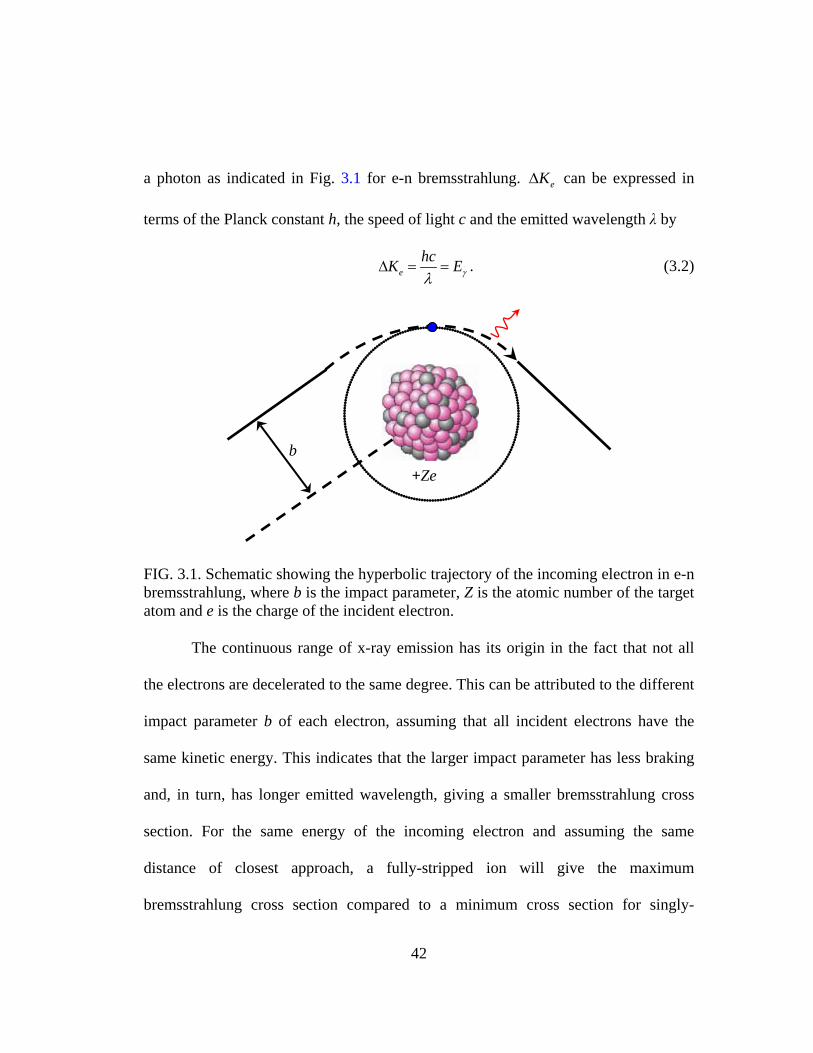
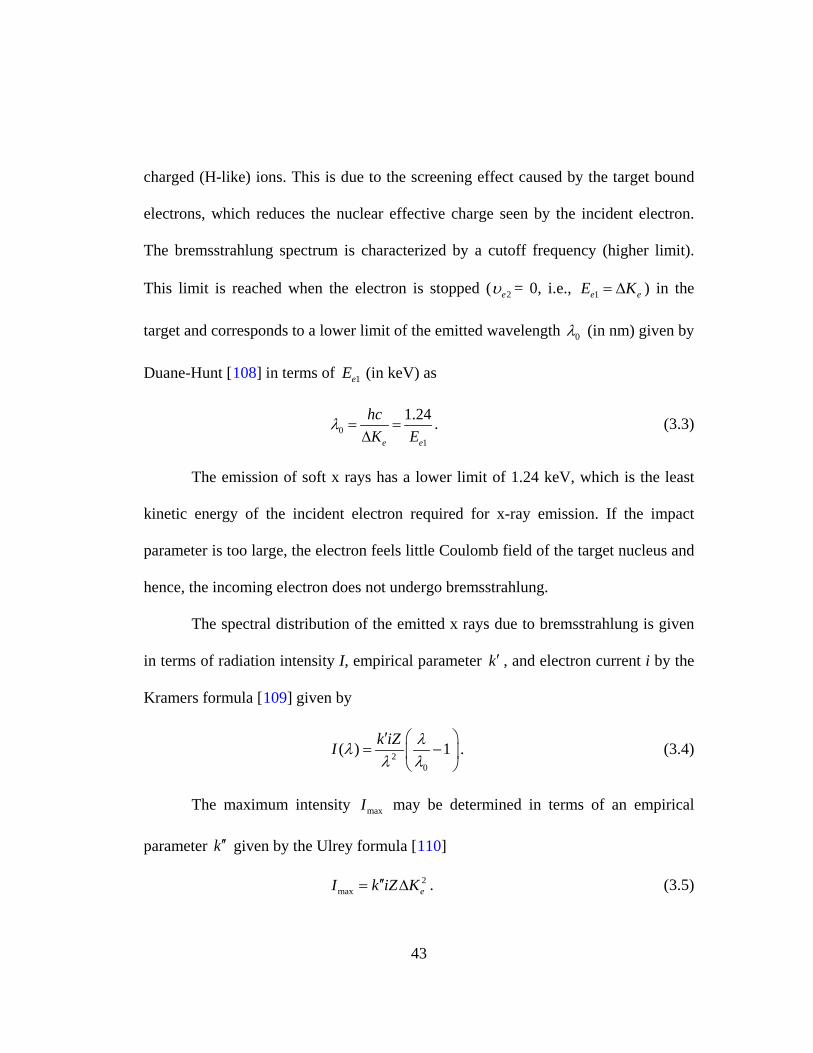
the target nucleus, which is the main force governing this process. In the
nonrelativistic approach, the associated energy loss eK∆ of an electron, incoming
with energy 1eE and scattered with energy 2eE , is given by
( )2 21 2 1 22
ee e e e e
mK E Eυ υ∆ = − = − . (3.1)
The principle of conservation of energy implies the emission of photons,
meaning that the kinetic energy loss eK∆ of the electron is converted into the form of
42
a photon as indicated in Fig. 3.1 for e-n bremsstrahlung. eK∆ can be expressed in
terms of the Planck constant h, the speed of light c and the emitted wavelength λ by
ehcK Eγλ
∆ = = . (3.2)
FIG. 3.1. Schematic showing the hyperbolic trajectory of the incoming electron in e-n bremsstrahlung, where b is the impact parameter, Z is the atomic number of the target atom and e is the charge of the incident electron.
The continuous range of x-ray emission has its origin in the fact that not all
the electrons are decelerated to the same degree. This can be attributed to the different
impact parameter b of each electron, assuming that all incident electrons have the
same kinetic energy. This indicates that the larger impact parameter has less braking
and, in turn, has longer emitted wavelength, giving a smaller bremsstrahlung cross
section. For the same energy of the incoming electron and assuming the same
distance of closest approach, a fully-stripped ion will give the maximum
bremsstrahlung cross section compared to a minimum cross section for singly-
b +Ze
43
charged (H-like) ions. This is due to the screening effect caused by the target bound
electrons, which reduces the nuclear effective charge seen by the incident electron.
The bremsstrahlung spectrum is characterized by a cutoff frequency (higher limit).
This limit is reached when the electron is stopped ( 2eυ = 0, i.e., 1e eE K= ∆ ) in the
target and corresponds to a lower limit of the emitted wavelength 0λ (in nm) given by
Duane-Hunt [108 1eE] in terms of (in keV) as
01
1.24
e e
hcK E
λ = =∆
. (3.3)
The emission of soft x rays has a lower limit of 1.24 keV, which is the least
kinetic energy of the incident electron required for x-ray emission. If the impact
parameter is too large, the electron feels little Coulomb field of the target nucleus and
hence, the incoming electron does not undergo bremsstrahlung.
The spectral distribution of the emitted x rays due to bremsstrahlung is given
in terms of radiation intensity I, empirical parameter k′ , and electron current i by the
Kramers formula [109
20
( ) 1k iZI λλλ λ
′= −
] given by
. (3.4)
The maximum intensity maxI may be determined in terms of an empirical
parameter k′′ given by the Ulrey formula [110
2max eI k iZ K′′= ∆
]
. (3.5)
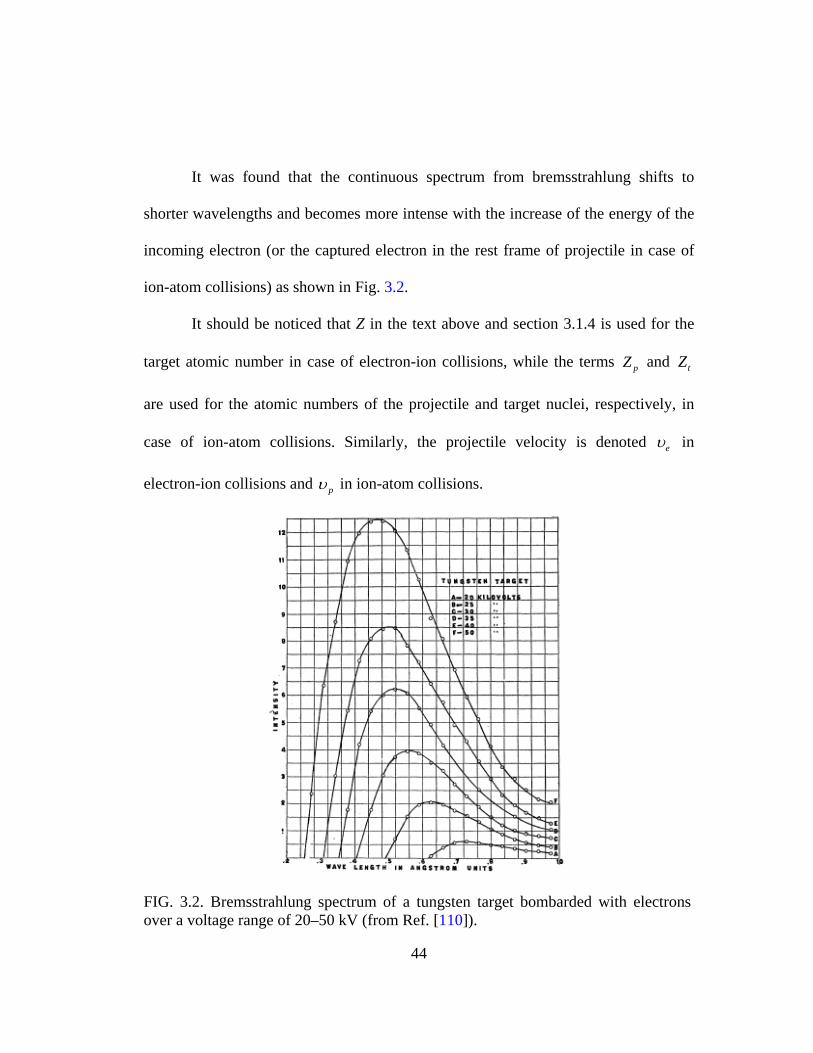
44
It was found that the continuous spectrum from bremsstrahlung shifts to
shorter wavelengths and becomes more intense with the increase of the energy of the
incoming electron (or the captured electron in the rest frame of projectile in case of
ion-atom collisions) as shown in Fig. 3.2.
It should be noticed that Z in the text above and section 3.1.4 is used for the
target atomic number in case of electron-ion collisions, while the terms pZ and tZ
are used for the atomic numbers of the projectile and target nuclei, respectively, in
case of ion-atom collisions. Similarly, the projectile velocity is denoted eυ in
electron-ion collisions and pυ in ion-atom collisions.
FIG. 3.2. Bremsstrahlung spectrum of a tungsten target bombarded with electrons over a voltage range of 20–50 kV (from Ref. [110]).
45
The captured electron in ion-atom collisions encounters various mechanisms
of e-n bremsstrahlung in the vicinity of the projectile such as radiative electron
capture to continuum (RECC) [85,111,112,113,114,115,116,117], radiative
ionization (RI) [118,119 104], secondary electron bremsstrahlung (SEB) [ ,120], and
atomic bremsstrahlung (AB) [121,122,123,124
RECC can be treated as quasi-free electron bremsstrahlung (QFEB) [
].
125,126
113
]
and is sometimes called [ ] primary bremsstrahlung (PB) [81] or radiative
ionization (RI), depending on the analogy of the production mechanisms. However,
RI within this dissertation is interpreted differently from RECC as indicated by Ishii
[119]. During RI, the target electron is not captured to the projectile continuum
(QFEB) but ionized away from the projectile with simultaneous emission of a photon.
If the target electron is ionized and transferred to the projectile continuum then, this is
QFEB as a special case of RI.
RECC was first observed by Kienle [127] and Schnopper [128] with
a maximum nonrelativistic photon energy emitted [129
( )2
192 1.6 10e p e
r pp
m mT EM
υ−
= = ×
] given by
, (3.6)
where pE is the projectile energy in eV/u and pυ is the velocity of the projectile in
m/s, which is the same as the velocity of the ejected target electron in the projectile
46
rest frame, while the masses em and pM are given in kg for the ejected target
electron and projectile, respectively. The relativistic value of rT is given by [81]
221 1z
r ee
pT m cm c
γβ = + + −
. (3.7)
Eqs. (3.8) [130 (3.9)] and [131] are introduced to show the trend of the
differential RECC cross section and its complementary process, nonradiative electron
capture to the continuum (ECC) [132,133,134,135
( ) ( ) ( ) ( )336 2 2 2 23 2
2
2 13
RECCp p p p p p
p p p
d e enl cont Z ad cσ
υ υ υ θ υ υ πυ υ υ
′ ′→ − + − − ′
], respectively.
, (3.8)
( ) ( ) ( ) ( )10
17 2 2 23 5 22
2 15
ECCp t p p p p p
p p p
d enl cont Z Z adσ
υ υ υ θ υ υ πυ υ υ
′ ′→ − + − − ′
, (3.9)
where a
is the reduced Planck constant and is the Bohr radius. The laboratory
velocities of projectile in the 4π space and of the target electrons ejected into a cone
of specific semi-angle θ
are denoted by pυ and pυ′ , respectively. The
pυ - dependence of the differential cross section is 5pυ− and 12
pυ− for RECC and ECC,
respectively. Schematic diagrams for the mechanisms are viewed in Fig. 3.3.
A scaling law for the RECC total cross section [86] was addressed later given by
2
2p t
RECCp
Z Zσ
υ∝ . (3.10)
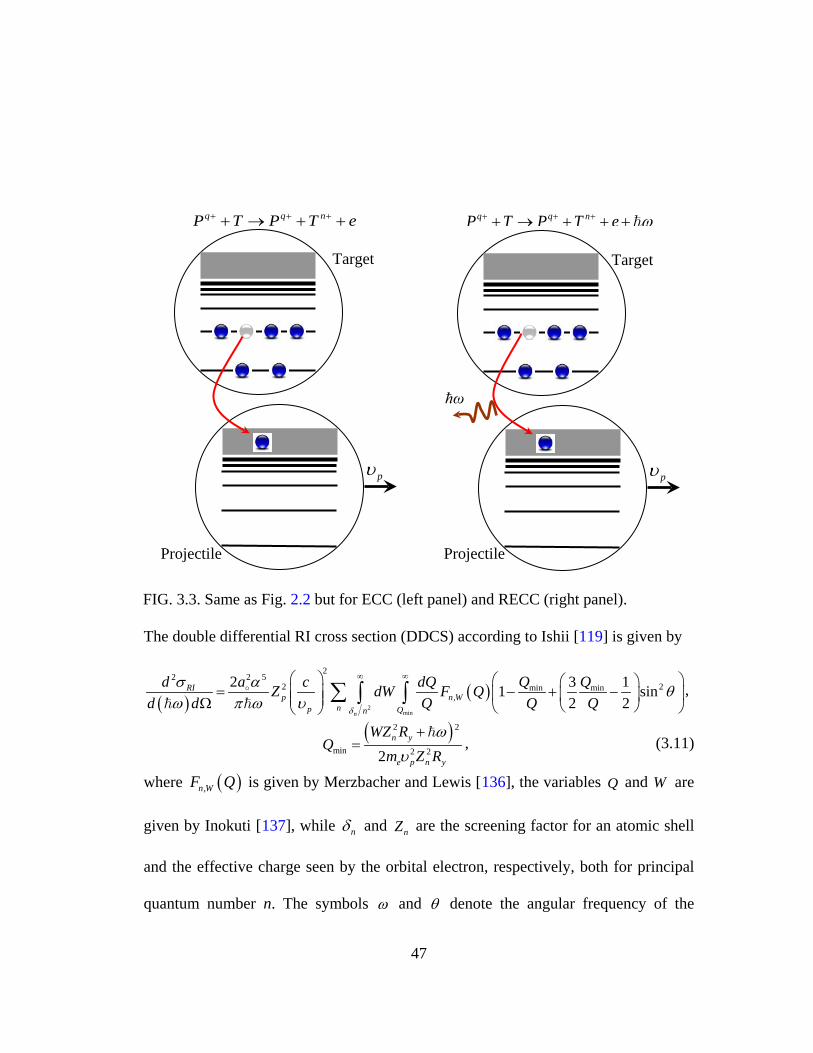
47
FIG. 3.3. Same as Fig. 2.2 but for ECC (left panel) and RECC (right panel).
The double differential RI cross section (DDCS) according to Ishii [119] is given by
( ) ( )2
min
22 2 5
2 2min min,
2 3 11 sin2 2
n
RIp n W
np Qn
d a Q Qc dQZ dW F Qd d Q Q Qδ
σ α θω π ω υ
∞ ∞ = − + − Ω
∑ ∫ ∫
,
( )2 2
min 2 22n y
e p n y
WZ RQ
m Z Rω
υ
+=
, (3.11)
where ( ),n WF Q is given by Merzbacher and Lewis [136 Q], the variables and W are
given by Inokuti [137 nδ], while and nZ are the screening factor for an atomic shell
and the effective charge seen by the orbital electron, respectively, both for principal
quantum number n. The symbols ω and θ denote the angular frequency of the
q q nP T P T e ω+ + ++ → + + +
Projectile
Target
pυ
ħω
q q nP T P T e+ + ++ → + +
Target
Projectile
pυ
48
emitted photon and the observation angle of x rays with respect to the projectile
velocity pυ , respectively, while α and yR denote the fine structure of the atom and
the Rydberg constant, respectively. However, RI should be more significant in slow
than in fast collisions [118] and it is hard to derive a scaling rule for such process.
The SEB process involves two steps and occurs if a target electron is ejected
due to the Coulomb interaction with the projectile then scattered by the Coulomb
field of another target nucleus. SEB is characterized [129] by a photon energy
4 4em p r
p
mT E TM
= =
, (3.12)
which corresponds to the maximum energy transferred from a projectile of mass pM
to a free electron at rest. However, SEB was found to be less important for low-Z
targets such as Be and C [138,139
101
] based on the cross section calculated from the
Koch bremsstrahlung formula (3BN) [ ] and the scaling rule [123,140
2 2
2p t
SEBp
Z Zσ
υ∝
] given by
. (3.13)
The double differential cross section for SEB according to Ishii [119] is given
in terms of C1 and C2 as defined in detail in the same publication by
( ) ( )( )
52 222 2 2 2
1 221 sin
2SEB e
p td m ceZ Z a C C
d d cσ θω π ω
= + Ω
. (3.14)
The AB, also called polarization bremsstrahlung (PBS) [119,141,142], was
first recognized in the middle of the 1970s [143,144,145,146,147] and is completed if
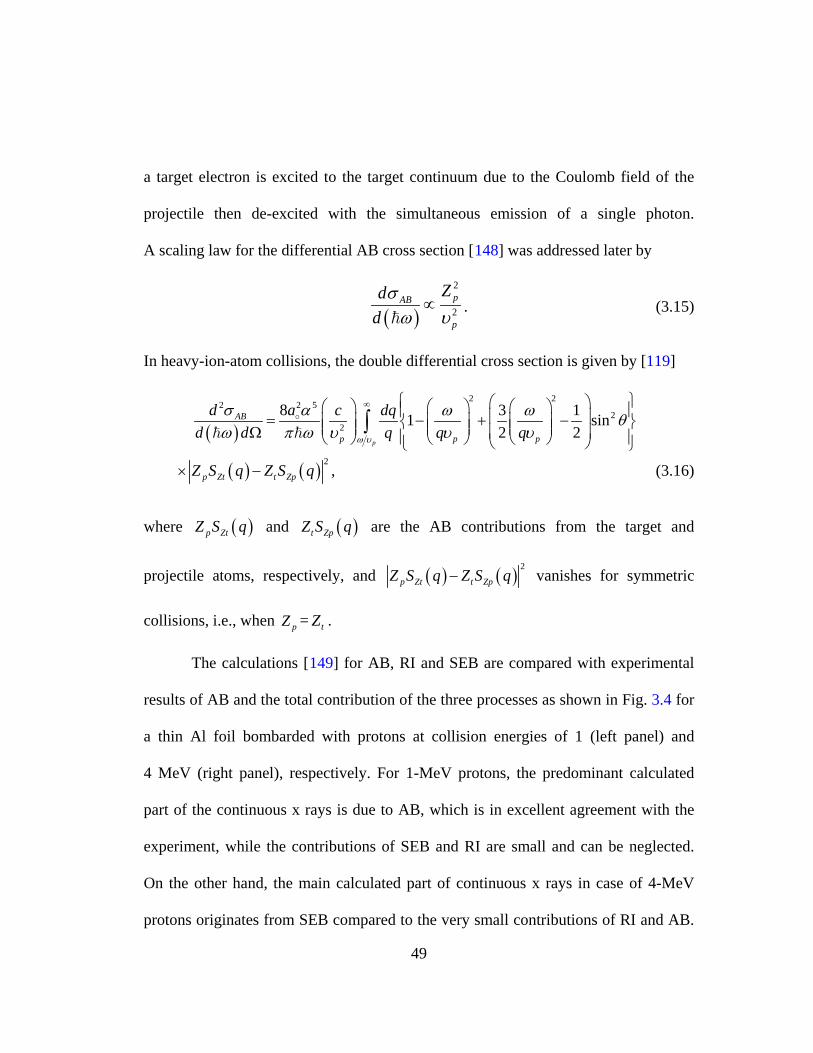
49
a target electron is excited to the target continuum due to the Coulomb field of the
projectile then de-excited with the simultaneous emission of a single photon.
A scaling law for the differential AB cross section [148
( )
2
2pAB
p
Zddσω υ
∝
] was addressed later by
. (3.15)
In heavy-ion-atom collisions, the double differential cross section is given by [119]
( )
2 22 2 5
22
8 3 11 sin2 2
p
AB
p p p
d a c dqd d q q qω υ
σ α ω ω θω π ω υ υ υ
∞ = − + − Ω ∫
( ) ( ) 2
p Zt t ZpZ S q Z S q× − , (3.16)
where ( )p ZtZ S q and ( )t ZpZ S q are the AB contributions from the target and
projectile atoms, respectively, and ( ) ( ) 2
p Zt t ZpZ S q Z S q− vanishes for symmetric
collisions, i.e., when pZ = tZ .
The calculations [149
3.4
] for AB, RI and SEB are compared with experimental
results of AB and the total contribution of the three processes as shown in Fig. for
a thin Al foil bombarded with protons at collision energies of 1 (left panel) and
4 MeV (right panel), respectively. For 1-MeV protons, the predominant calculated
part of the continuous x rays is due to AB, which is in excellent agreement with the
experiment, while the contributions of SEB and RI are small and can be neglected.
On the other hand, the main calculated part of continuous x rays in case of 4-MeV
protons originates from SEB compared to the very small contributions of RI and AB.
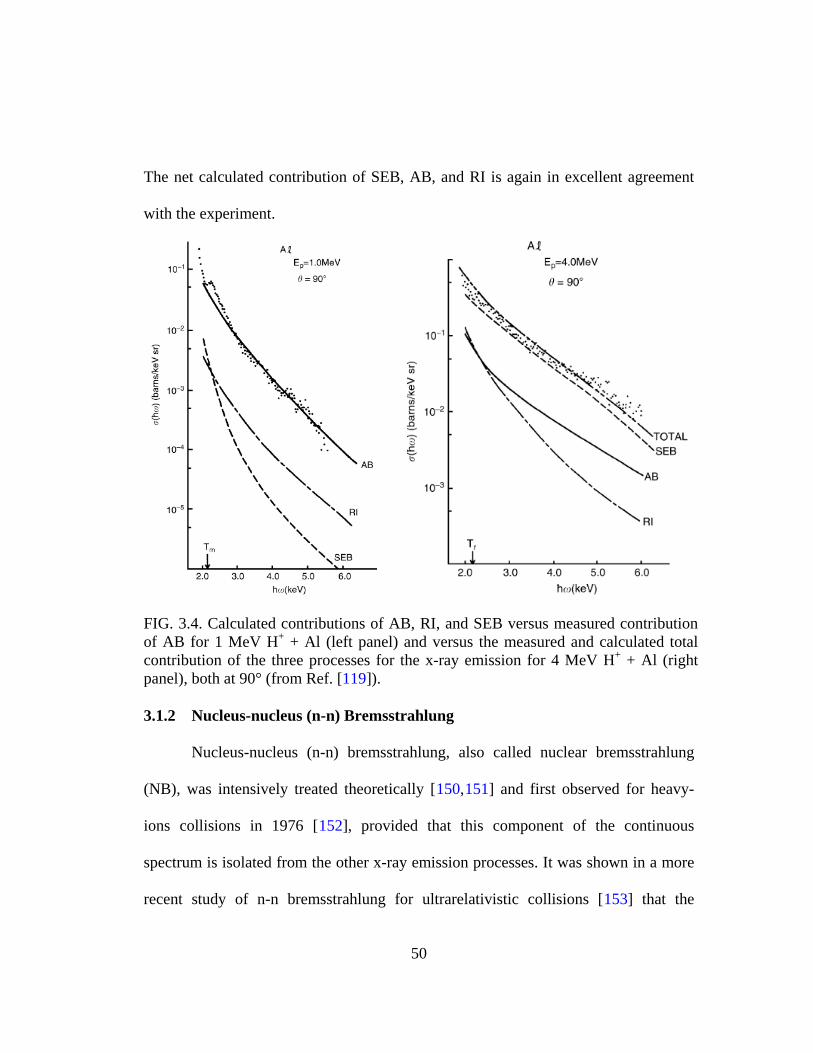
50
The net calculated contribution of SEB, AB, and RI is again in excellent agreement
with the experiment.
FIG. 3.4. Calculated contributions of AB, RI, and SEB versus measured contribution of AB for 1 MeV H+ + Al (left panel) and versus the measured and calculated total contribution of the three processes for the x-ray emission for 4 MeV H+ + Al (right panel), both at 90° (from Ref. [119]).
3.1.2 Nucleus-nucleus (n-n) Bremsstrahlung
Nucleus-nucleus (n-n) bremsstrahlung, also called nuclear bremsstrahlung
(NB), was intensively treated theoretically [150,151] and first observed for heavy-
ions collisions in 1976 [152], provided that this component of the continuous
spectrum is isolated from the other x-ray emission processes. It was shown in a more
recent study of n-n bremsstrahlung for ultrarelativistic collisions [153] that the
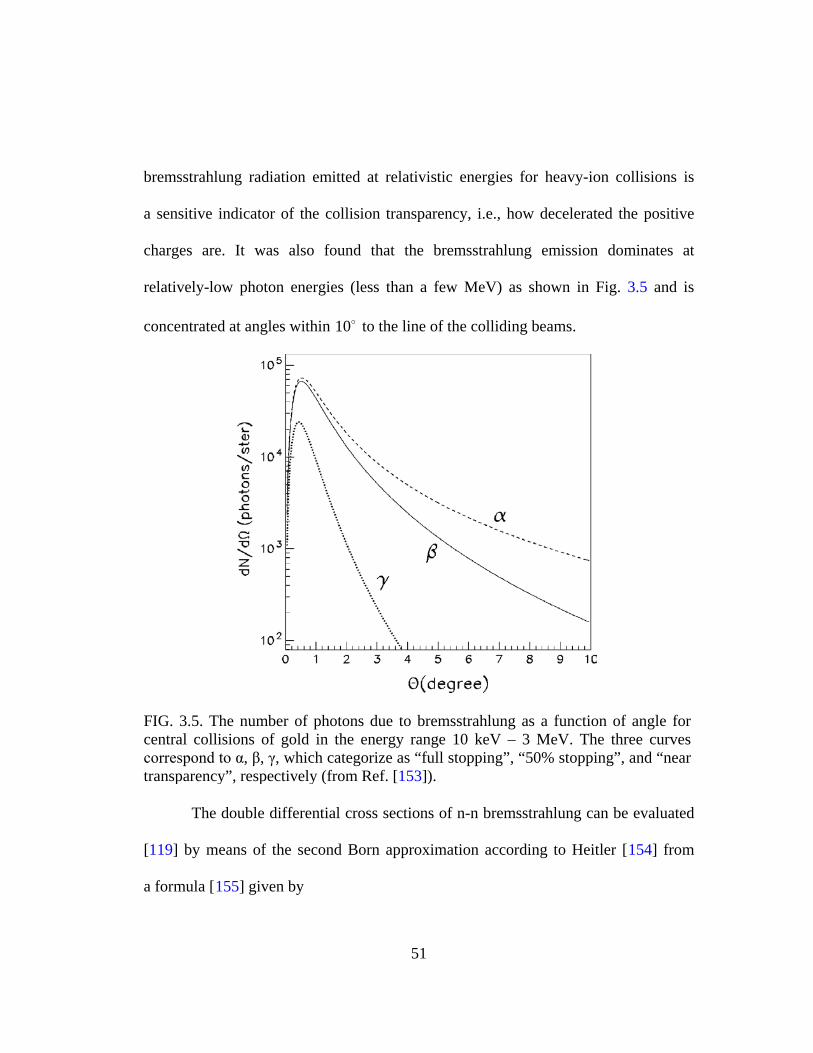
51
bremsstrahlung radiation emitted at relativistic energies for heavy-ion collisions is
a sensitive indicator of the collision transparency, i.e., how decelerated the positive
charges are. It was also found that the bremsstrahlung emission dominates at
relatively-low photon energies (less than a few MeV) as shown in Fig. 3.5 and is
concentrated at angles within 10 to the line of the colliding beams.
FIG. 3.5. The number of photons due to bremsstrahlung as a function of angle for central collisions of gold in the energy range 10 keV – 3 MeV. The three curves correspond to α, β, γ, which categorize as “full stopping”, “50% stopping”, and “near transparency”, respectively (from Ref. [153]).
The double differential cross sections of n-n bremsstrahlung can be evaluated
[119] by means of the second Born approximation according to Heitler [154] from
a formula [155] given by
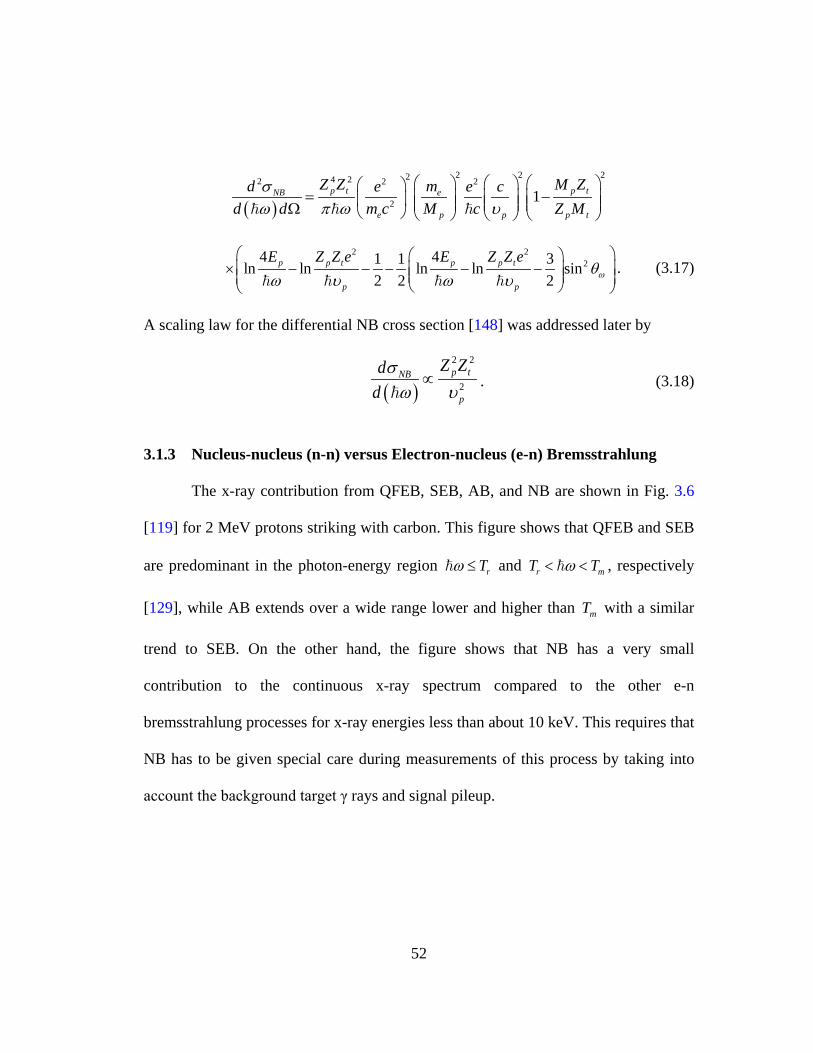
52
( )
2 2 224 22 2 2
2 1p t p tNB e
e p p p t
Z Z M Zd me e cd d m c M c Z M
σω π ω υ
= − Ω
2 224 41 1 3ln ln ln ln sin
2 2 2p p t p p t
p p
E Z Z e E Z Z eωθω υ ω υ
× − − − − −
. (3.17)
A scaling law for the differential NB cross section [148] was addressed later by
( )
2 2
2p tNB
p
Z Zddσω υ
∝
. (3.18)
3.1.3 Nucleus-nucleus (n-n) versus Electron-nucleus (e-n) Bremsstrahlung
The x-ray contribution from QFEB, SEB, AB, and NB are shown in Fig. 3.6
[119] for 2 MeV protons striking with carbon. This figure shows that QFEB and SEB
are predominant in the photon-energy region rTω ≤ and r mT Tω< < , respectively
[129], while AB extends over a wide range lower and higher than mT with a similar
trend to SEB. On the other hand, the figure shows that NB has a very small
contribution to the continuous x-ray spectrum compared to the other e-n
bremsstrahlung processes for x-ray energies less than about 10 keV. This requires that
NB has to be given special care during measurements of this process by taking into
account the background target γ rays and signal pileup.
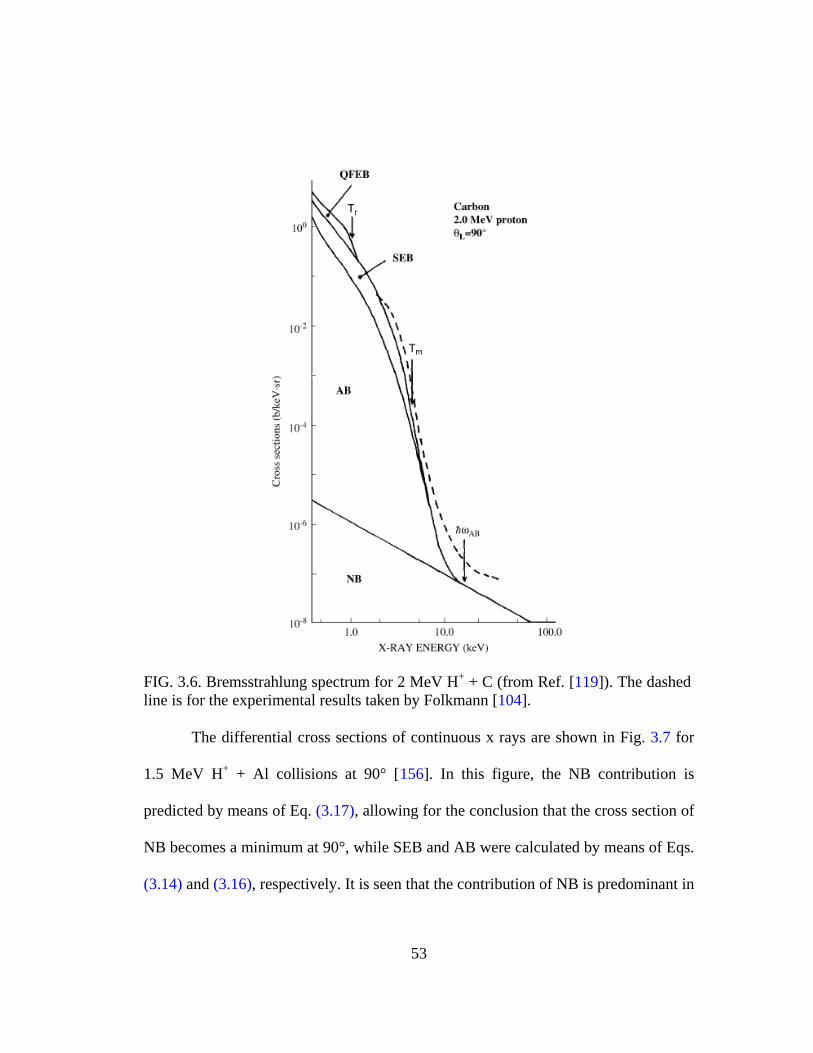
53
FIG. 3.6. Bremsstrahlung spectrum for 2 MeV H+ + C (from Ref. [119]). The dashed line is for the experimental results taken by Folkmann [104].
The differential cross sections of continuous x rays are shown in Fig. 3.7 for
1.5 MeV H+ + Al collisions at 90° [156
(3.17)
]. In this figure, the NB contribution is
predicted by means of Eq. , allowing for the conclusion that the cross section of
NB becomes a minimum at 90°, while SEB and AB were calculated by means of Eqs.
(3.14) and (3.16), respectively. It is seen that the contribution of NB is predominant in
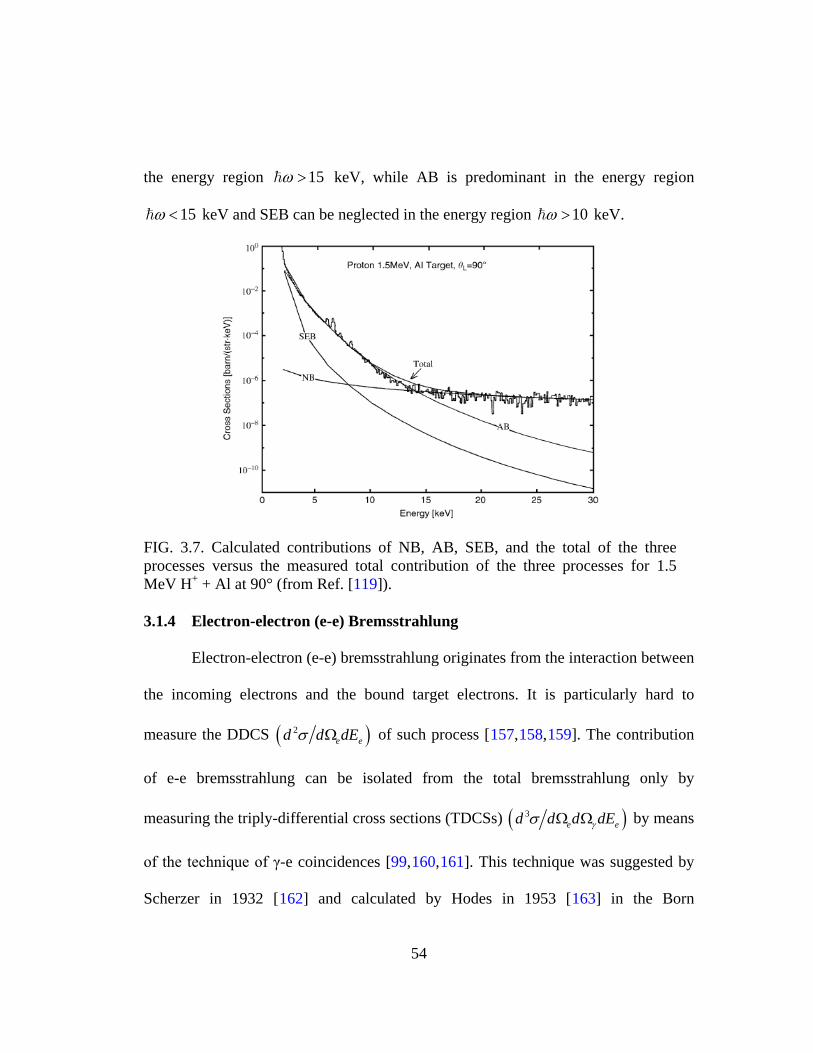
54
the energy region 15ω > keV, while AB is predominant in the energy region
15ω < keV and SEB can be neglected in the energy region 10ω > keV.
FIG. 3.7. Calculated contributions of NB, AB, SEB, and the total of the three processes versus the measured total contribution of the three processes for 1.5 MeV H+ + Al at 90° (from Ref. [119]).
3.1.4 Electron-electron (e-e) Bremsstrahlung
Electron-electron (e-e) bremsstrahlung originates from the interaction between
the incoming electrons and the bound target electrons. It is particularly hard to
measure the DDCS ( )2e ed d dEσ Ω of such process [157,158,159
( )3e ed d d dEγσ Ω Ω
]. The contribution
of e-e bremsstrahlung can be isolated from the total bremsstrahlung only by
measuring the triply-differential cross sections (TDCSs) by means
of the technique of γ-e coincidences [99,160,161]. This technique was suggested by
Scherzer in 1932 [162] and calculated by Hodes in 1953 [163] in the Born
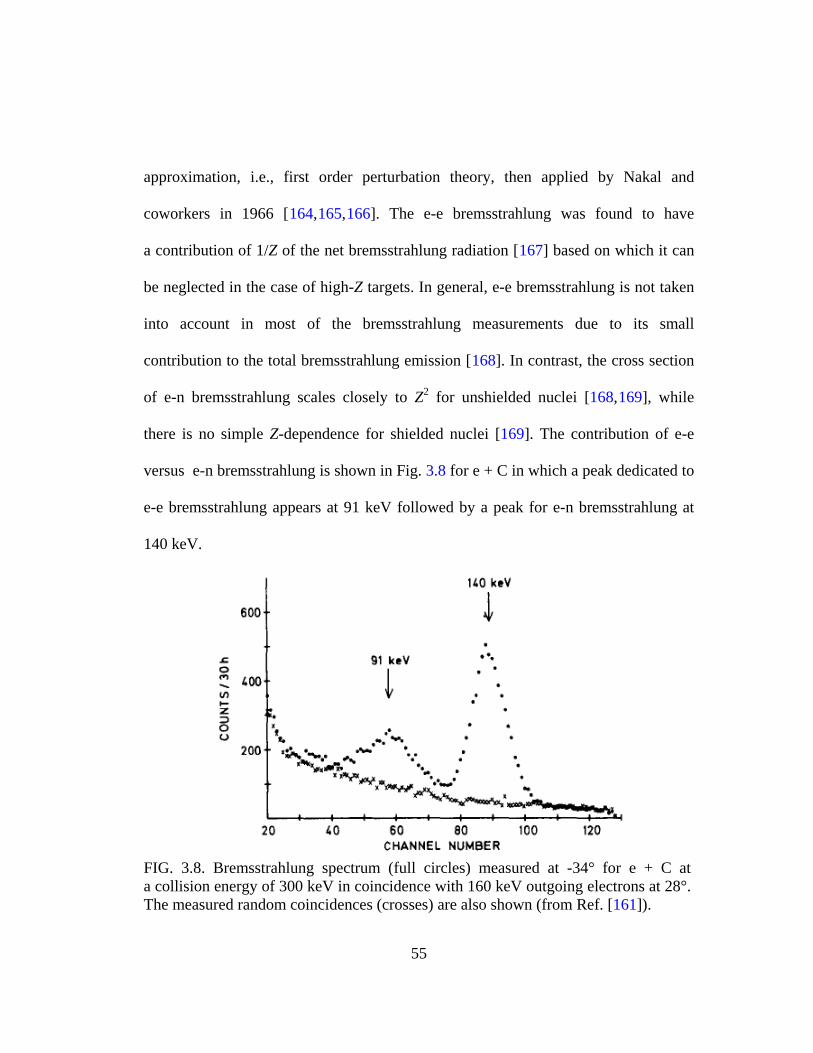
55
approximation, i.e., first order perturbation theory, then applied by Nakal and
coworkers in 1966 [164,165,166]. The e-e bremsstrahlung was found to have
a contribution of 1/Z of the net bremsstrahlung radiation [167] based on which it can
be neglected in the case of high-Z targets. In general, e-e bremsstrahlung is not taken
into account in most of the bremsstrahlung measurements due to its small
contribution to the total bremsstrahlung emission [168
168
]. In contrast, the cross section
of e-n bremsstrahlung scales closely to Z2 for unshielded nuclei [ ,169
169
], while
there is no simple Z-dependence for shielded nuclei [ ]. The contribution of e-e
versus e-n bremsstrahlung is shown in Fig. 3.8 for e + C in which a peak dedicated to
e-e bremsstrahlung appears at 91 keV followed by a peak for e-n bremsstrahlung at
140 keV.
FIG. 3.8. Bremsstrahlung spectrum (full circles) measured at -34° for e + C at a collision energy of 300 keV in coincidence with 160 keV outgoing electrons at 28°. The measured random coincidences (crosses) are also shown (from Ref. [161]).
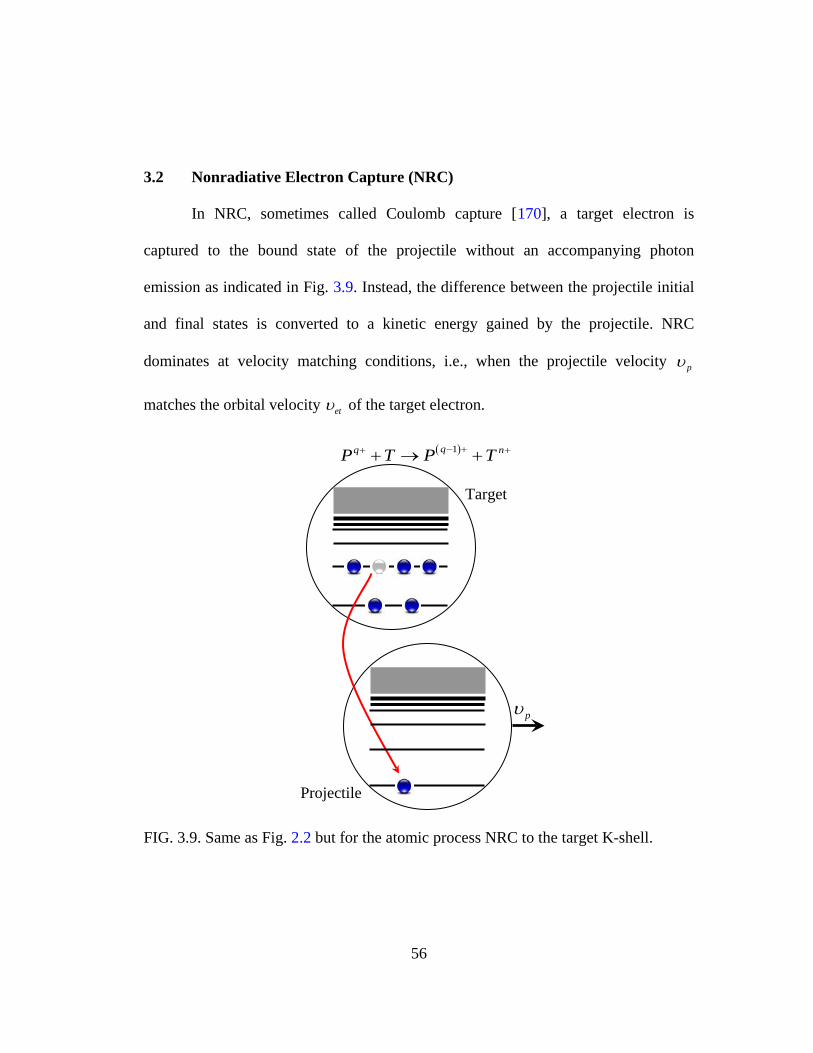
56
3.2 Nonradiative Electron Capture (NRC)
In NRC, sometimes called Coulomb capture [170
3.9
], a target electron is
captured to the bound state of the projectile without an accompanying photon
emission as indicated in Fig. . Instead, the difference between the projectile initial
and final states is converted to a kinetic energy gained by the projectile. NRC
dominates at velocity matching conditions, i.e., when the projectile velocity pυ
matches the orbital velocity etυ of the target electron.
FIG. 3.9. Same as Fig. 2.2 but for the atomic process NRC to the target K-shell.
( )1qq nP T P T− ++ ++ → +
Projectile
Target
pυ
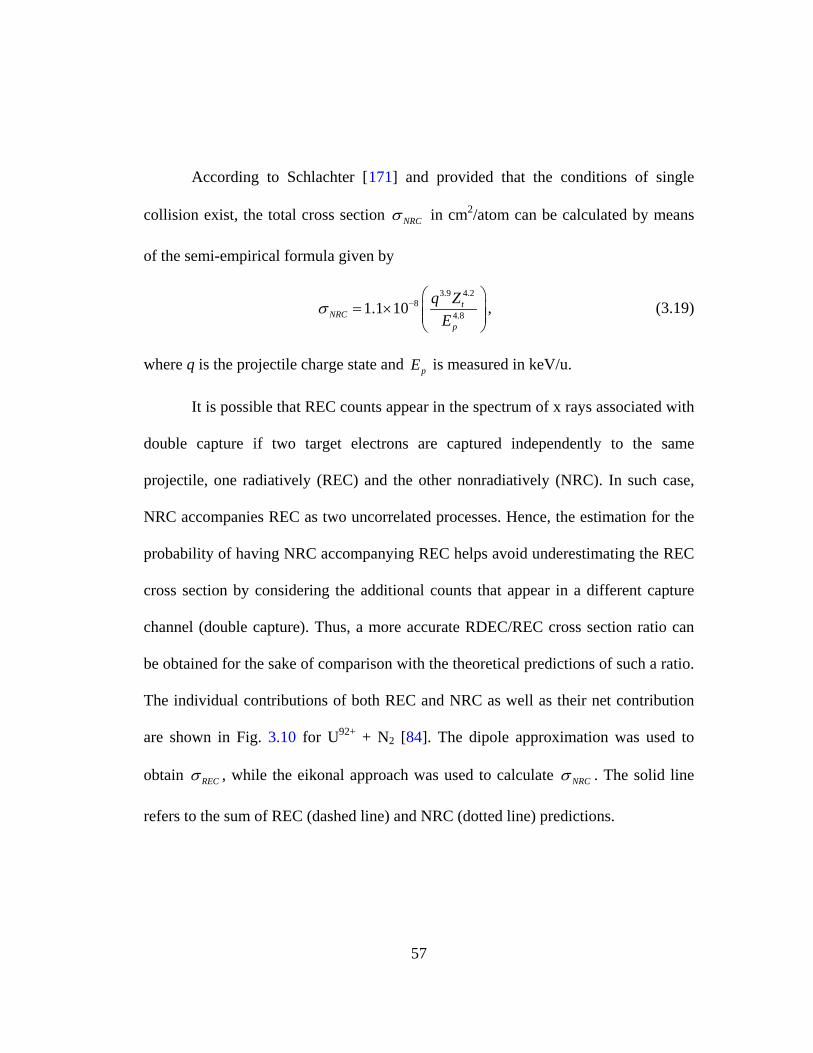
57
According to Schlachter [171
NRCσ
] and provided that the conditions of single
collision exist, the total cross section in cm2/atom can be calculated by means
of the semi-empirical formula given by
3.9 4.28
4.81.1 10 tNRC
p
q ZE
σ −
= ×
, (3.19)
where q is the projectile charge state and pE is measured in keV/u.
It is possible that REC counts appear in the spectrum of x rays associated with
double capture if two target electrons are captured independently to the same
projectile, one radiatively (REC) and the other nonradiatively (NRC). In such case,
NRC accompanies REC as two uncorrelated processes. Hence, the estimation for the
probability of having NRC accompanying REC helps avoid underestimating the REC
cross section by considering the additional counts that appear in a different capture
channel (double capture). Thus, a more accurate RDEC/REC cross section ratio can
be obtained for the sake of comparison with the theoretical predictions of such a ratio.
The individual contributions of both REC and NRC as well as their net contribution
are shown in Fig. 3.10 for U92+ + N2 [84]. The dipole approximation was used to
obtain RECσ , while the eikonal approach was used to calculate NRCσ . The solid line
refers to the sum of REC (dashed line) and NRC (dotted line) predictions.
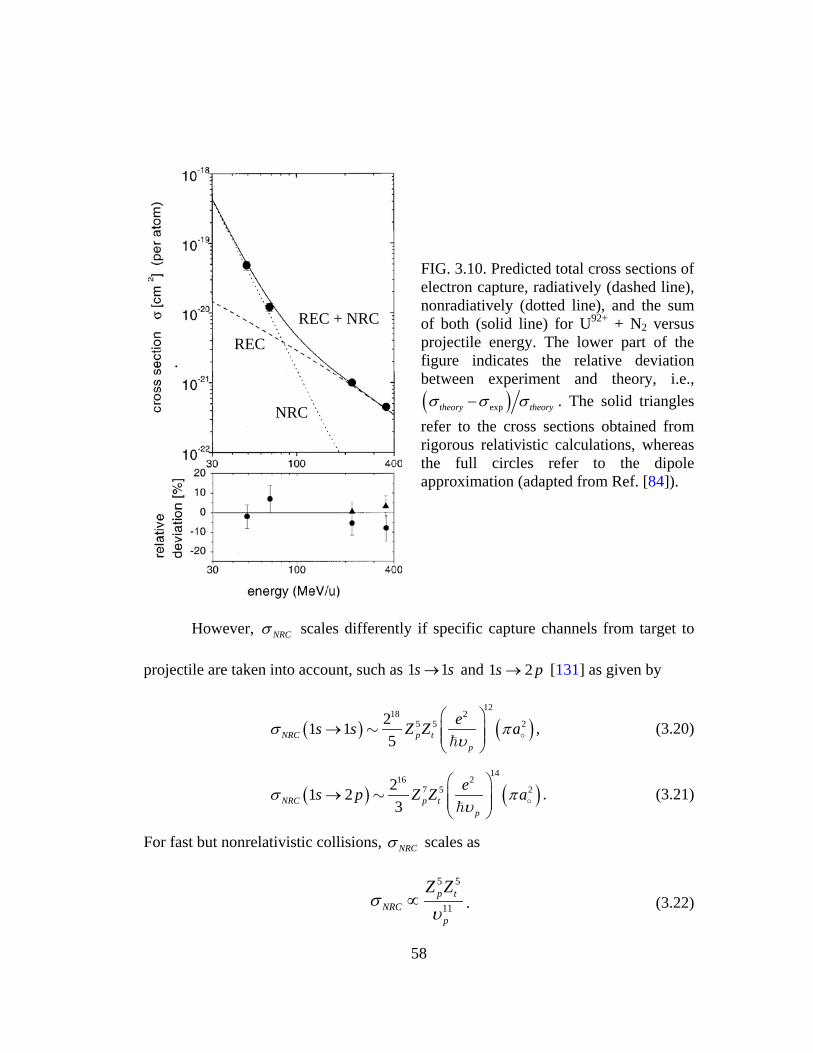
58
FIG. 3.10. Predicted total cross sections of electron capture, radiatively (dashed line), nonradiatively (dotted line), and the sum of both (solid line) for U92+ + N2 versus projectile energy. The lower part of the figure indicates the relative deviation between experiment and theory, i.e., ( )exptheory theoryσ σ σ− . The solid triangles refer to the cross sections obtained from rigorous relativistic calculations, whereas the full circles refer to the dipole approximation (adapted from Ref. [84]).
However, NRCσ scales differently if specific capture channels from target to
projectile are taken into account, such as 1 1s s→ and 1 2s p→ [131] as given by
( ) ( )12
18 25 5 221 1
5NRC p tp
es s Z Z aσ πυ
→
, (3.20)
( ) ( )14
16 27 5 221 2
3NRC p tp
es p Z Z aσ πυ
→
. (3.21)
For fast but nonrelativistic collisions, NRCσ scales as
5 5
11p t
NRCp
Z Zσ
υ∝ . (3.22)
REC + NRC
NRC
REC
59
3.3 Double Radiative Electron Capture (DREC)
Double radiative electron capture (DREC) can contribute at the energy-region
of REC in the spectrum of x rays associated with single capture when two REC
photons are emitted due to the capture of two uncorrelated target electrons by the
same projectile, i.e., during a single ion-atom collision as indicated in the schematic
diagram viewed in Fig. 3.11. Each of the DREC photons has the same energy of the
REC photon, while the two captured electrons transfer independently to the projectile.
The estimation of the DREC contribution helps avoid overestimating the REC cross
section by subtracting the DREC contribution from the REC counts in the double
capture channel, i.e., when REC is accompanied with NRC as indicated in Sec. 3.2,
while it is very unlikely that DREC contribute to RDEC in the double capture channel
when the two DREC photons are emitted in the same direction and registered as a
single photon of double energy. This all reflects into a more reliable REC cross
section as well as RDEC/REC cross section ratio for the sake of comparison with
various theoretical predictions.
A numerical evaluation of the total DREC cross section DRECσ from a target
of atomic number tZ was given by Meyerhof [172] based on the independent-
electron approximation [173 ( )P b
]. If is the probability of a single-electron capture
to a fully-stripped ion, then for a target electron density ( )Rρ and a projectile-to-
60
target distance R as the hypotenuse of the right-angle triangle whose other two sides
are the impact parameter b and the travel path of the beam z, ( )P b
is given [131] by
( ) ( ) ( )1REC tP b Z dz Rσ ρ∞
−∞
= = ∫
. (3.23)
Accordingly, the REC cross section RECσ for a target of atomic number tZ in terms
of ( )1REC tZσ = , which can be calculated from Eq. (2.13), can be expressed by
( ) ( )0
2REC tZ db bP bσ π∞
= ∫
. (3.24)
Substituting Eq. (3.23) into Eq. (3.24) gives
( ) ( ) ( )0
1 2REC t REC tZ Z db b dz Rσ σ π ρ∞ ∞
−∞
= = ∫ ∫ . (3.25)
Since the electron density is normalized, this requires that
( )0
2 tdb b dz R Zπ ρ∞ ∞
−∞
=∫ ∫ . (3.26)
The atomic density can be calculated by means of the Thomas-Fermi theory [174
(3.25)
]
and it can be deduced from Eqs. and (3.26) that
( ) ( )1REC t t REC tZ Z Zσ σ= = . (3.27)
Introducing ( )1P b as the probability of single electron capture to any H-like ion, the
DREC cross section DRECσ for a given target can be expressed similarly by
( ) ( ) ( )10
2DREC tZ db bP b P bσ π∞
= ∫
. (3.28)
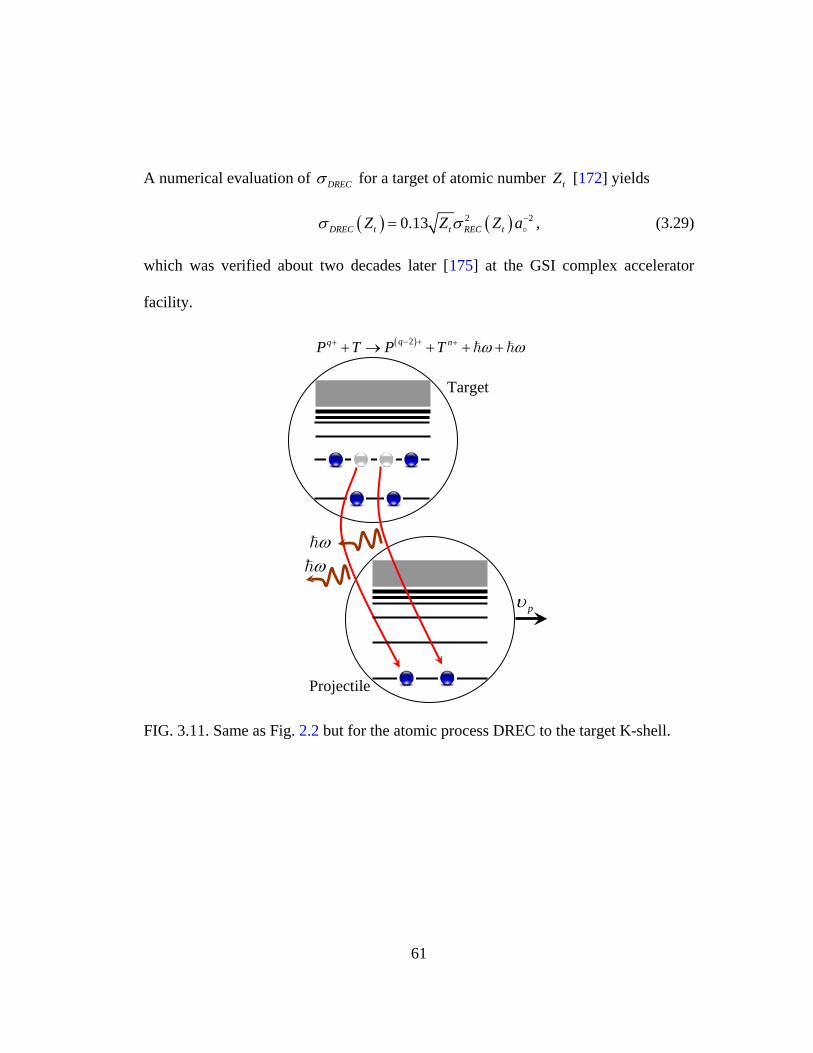
61
A numerical evaluation of DRECσ for a target of atomic number tZ [172] yields
( ) ( )2 20.13DREC t t REC tZ Z Z aσ σ −=
, (3.29)
which was verified about two decades later [175
] at the GSI complex accelerator
facility.
FIG. 3.11. Same as Fig. 2.2 but for the atomic process DREC to the target K-shell.
( )2qq nP T P T ω ω− ++ ++ → + + +
ω
Projectile
ω
Target
pυ
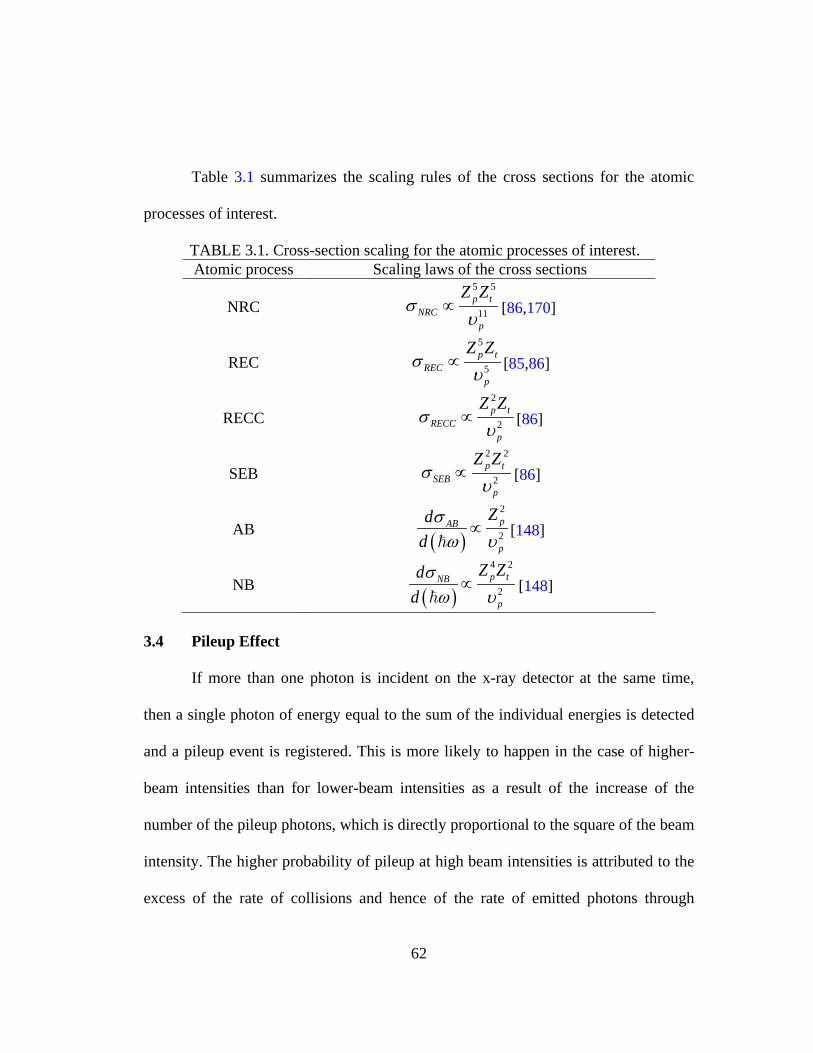
62
Table 3.1 summarizes the scaling rules of the cross sections for the atomic
processes of interest.
TABLE 3.1. Cross-section scaling for the atomic processes of interest. Atomic process Scaling laws of the cross sections
NRC 5 5
11p t
NRCp
Z Zσ
υ∝ [86,170]
REC 5
5p t
RECp
Z Zσ
υ∝ [85,86]
RECC 2
2p t
RECCp
Z Zσ
υ∝ [86]
SEB 2 2
2p t
SEBp
Z Zσ
υ∝ [86]
AB ( )
2
2pAB
p
Zddσω υ
∝
[148]
NB ( )
4 2
2p tNB
p
Z Zddσω υ
∝
[148]
3.4 Pileup Effect
If more than one photon is incident on the x-ray detector at the same time,
then a single photon of energy equal to the sum of the individual energies is detected
and a pileup event is registered. This is more likely to happen in the case of higher-
beam intensities than for lower-beam intensities as a result of the increase of the
number of the pileup photons, which is directly proportional to the square of the beam
intensity. The higher probability of pileup at high beam intensities is attributed to the
excess of the rate of collisions and hence of the rate of emitted photons through
63
radiative processes. Pileup as a mechanism applies to characteristic x-ray emission
lines, REC or any other source of x-ray emission. The pileup from more than two
photons can usually be neglected because of its exceedingly small probability.
The pileup of interest is the one originating from the superposition of two
REC photons as emitted from two projectile ions and registered as a single photon of
double energy in the spectrum of x rays associated with single capture at the RDEC
energy region. An accurate measurement of the REC probability is required so that
the corresponding pileup probability can be calculated. In turn, the corresponding
number of REC counts lost into pileup counts can be estimated.
The practical technique to block the pileup is to use an attenuator to reduce the
photons detected by 90%> in the REC energy range so that the photons causing the
pileup are attenuated before they are simultaneously registered. Hence, the number of
events dedicated to pileup will be drastically reduced to a limit that can be ignored.
The pileup of REC photons will be negligible if the REC rate is low enough.
Although a disadvantage of this technique is the reduction of the measured REC cross
section as a result of the suppression of most of the photons, a correction factor based
on calculations of the attenuation percentage [176] in the energy range under study
can be used. Separate short-time measurements of REC with and without using the
attenuator can also be performed to determine the actual percentage of reduction of
REC photons due to the attenuator. A calculation of the contribution of pileup to the
present experimental results is presented in Chapter V.
64
CHAPTER IV
EXPERIMENTAL SETUP
4.1 Standard Van de Graaff Generator
This work was conducted at the tandem Van de Graaff accelerator facility at
Western Michigan University (WMU). The concept of a Van de Graaff generator
[177,178
177
] is to store electrostatic charges with the aid of a rotating belt or charging
chain so that very high voltages accumulate on the high-voltage terminal. The ideal
terminal needs to be a metal of hollow shape [ ] based on the fact that all
geometrical shapes of electrically-charged conductors have no electric field inside,
allowing the terminal to keep adding charges continuously until a saturation between
charging and discharging is achieved, i.e., the maximum electrostatic voltage is
reached. The Van de Graaff generator was invented in 1929 by American physicist
Robert J. Van de Graaff and developed by the same inventor at Princeton University.
A model able to generate 1 MV was described in 1931 [178].
A schematic diagram of a basic Van de Graaff accelerator is seen in Fig. 4.1,
where an insulating belt runs over two rollers. The upper roller is placed inside the
metal terminal and is dedicated to transfer the electrostatic charges. Two electrodes
(needles) are placed in contact with the belt at the positions of the two rollers. The
upper and lower needles are manufactured to be connected to the terminal and a high
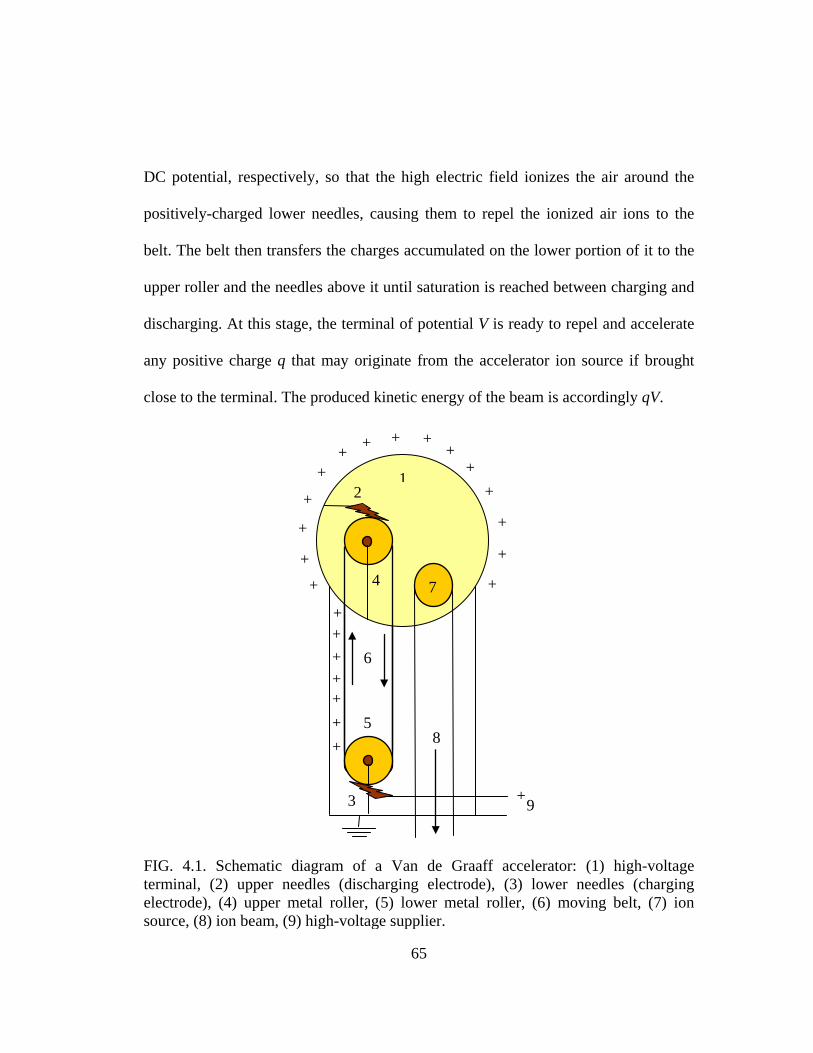
65
DC potential, respectively, so that the high electric field ionizes the air around the
positively-charged lower needles, causing them to repel the ionized air ions to the
belt. The belt then transfers the charges accumulated on the lower portion of it to the
upper roller and the needles above it until saturation is reached between charging and
discharging. At this stage, the terminal of potential V is ready to repel and accelerate
any positive charge q that may originate from the accelerator ion source if brought
close to the terminal. The produced kinetic energy of the beam is accordingly qV.
FIG. 4.1. Schematic diagram of a Van de Graaff accelerator: (1) high-voltage terminal, (2) upper needles (discharging electrode), (3) lower needles (charging electrode), (4) upper metal roller, (5) lower metal roller, (6) moving belt, (7) ion source, (8) ion beam, (9) high-voltage supplier.
+ +
9
+ +
+
+
+
+ + +
+
+
+
+
+
+
+ +
+ + 1
2
3
4
5
+
6
8
+
7
+
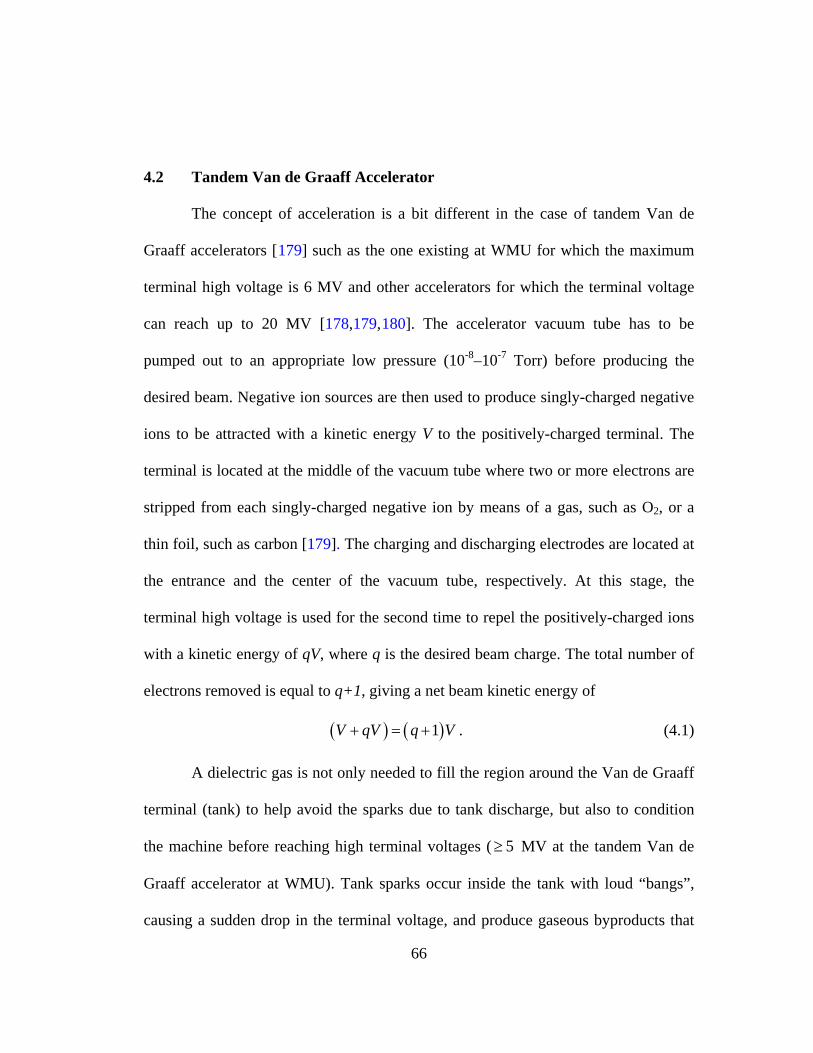
66
4.2 Tandem Van de Graaff Accelerator
The concept of acceleration is a bit different in the case of tandem Van de
Graaff accelerators [179
178
] such as the one existing at WMU for which the maximum
terminal high voltage is 6 MV and other accelerators for which the terminal voltage
can reach up to 20 MV [ ,179,180
179
]. The accelerator vacuum tube has to be
pumped out to an appropriate low pressure (10-8–10-7 Torr) before producing the
desired beam. Negative ion sources are then used to produce singly-charged negative
ions to be attracted with a kinetic energy V to the positively-charged terminal. The
terminal is located at the middle of the vacuum tube where two or more electrons are
stripped from each singly-charged negative ion by means of a gas, such as O2, or a
thin foil, such as carbon [ ]. The charging and discharging electrodes are located at
the entrance and the center of the vacuum tube, respectively. At this stage, the
terminal high voltage is used for the second time to repel the positively-charged ions
with a kinetic energy of qV, where q is the desired beam charge. The total number of
electrons removed is equal to q+1, giving a net beam kinetic energy of
( ) ( )1V qV q V+ = + . (4.1)
A dielectric gas is not only needed to fill the region around the Van de Graaff
terminal (tank) to help avoid the sparks due to tank discharge, but also to condition
the machine before reaching high terminal voltages ( 5≥ MV at the tandem Van de
Graaff accelerator at WMU). Tank sparks occur inside the tank with loud “bangs”,
causing a sudden drop in the terminal voltage, and produce gaseous byproducts that
67
can react adversely with the needles. Tube sparks are another type of discharge and
are considered worse as they discharge inside the vacuum tube with no sound and
liberate gas, causing an increase of the vacuum pressure. The ideal dielectric gases
are the inert ones such as the very expensive SF6 and Freon [179]. A mixture of CO2
and N2 can be a replacement if seeking a dielectric of lower price. Less dielectric
gases are usually used with higher pressures (200–290 psi) than those used in the case
of SF6 (60 psi), where the higher pressure provides more insulation.
4.3 SNICS Negative Ion Source
A fully-stripped fluorine beam with energy 42 MeV was obtained following
the production of negative fluorine ions from source of negative ions by cesium
sputtering (SNICS II) as well as the subsequent acceleration as shown in Fig. 4.2. In
addition, a beam of 3 MeV H+ from the same ion source was used to conduct
elemental analysis of the carbon targets utilizing PIXE measurements.
Cesium-sputtering negative ion sources are widely used in tandem
accelerators. The Cs plays a major role in the operation process where the Cs vapor
comes out of the Cs oven after it is heated up and enters into a fully-enclosed volume
(within the ion source) surrounding the ionizer surface and the cathode. The
temperature of the Cs oven can be adjusted so that the flow of Cs into the source is
controlled. The ionizer surface is kept hot, causing some of the Cs to become ionized,
while some of the Cs condenses on the front of the cooled cathode. The ionized
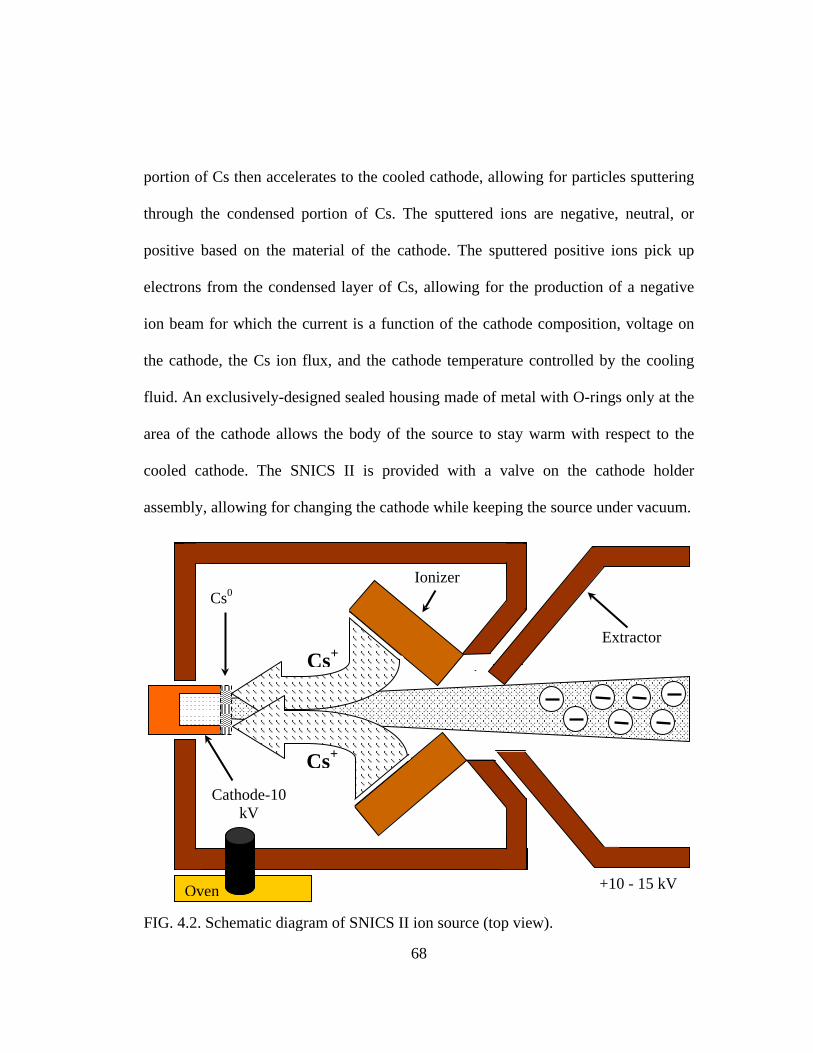
68
portion of Cs then accelerates to the cooled cathode, allowing for particles sputtering
through the condensed portion of Cs. The sputtered ions are negative, neutral, or
positive based on the material of the cathode. The sputtered positive ions pick up
electrons from the condensed layer of Cs, allowing for the production of a negative
ion beam for which the current is a function of the cathode composition, voltage on
the cathode, the Cs ion flux, and the cathode temperature controlled by the cooling
fluid. An exclusively-designed sealed housing made of metal with O-rings only at the
area of the cathode allows the body of the source to stay warm with respect to the
cooled cathode. The SNICS II is provided with a valve on the cathode holder
assembly, allowing for changing the cathode while keeping the source under vacuum.
FIG. 4.2. Schematic diagram of SNICS II ion source (top view).
Oven
Ionizer
Extractor
Cs0
Cs+
Cs+ Cathode-10
kV
+10 - 15 kV
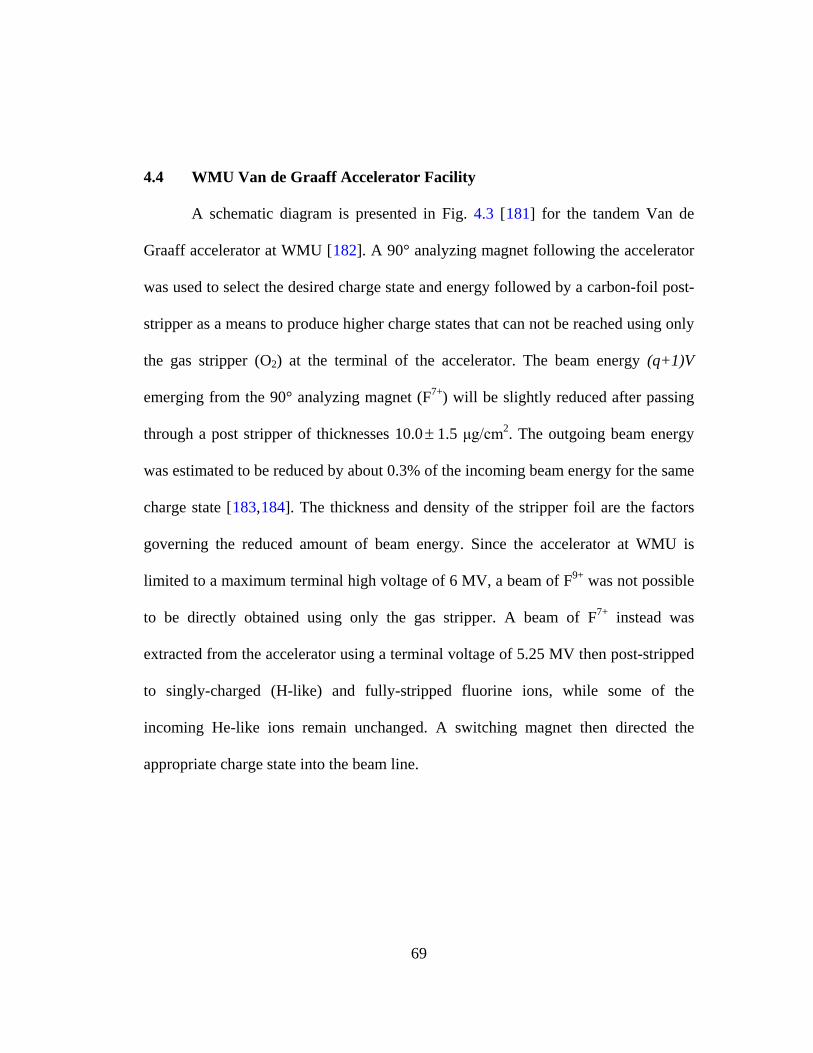
69
4.4 WMU Van de Graaff Accelerator Facility
A schematic diagram is presented in Fig. 4.3 [181] for the tandem Van de
Graaff accelerator at WMU [182
±
]. A 90° analyzing magnet following the accelerator
was used to select the desired charge state and energy followed by a carbon-foil post-
stripper as a means to produce higher charge states that can not be reached using only
the gas stripper (O2) at the terminal of the accelerator. The beam energy (q+1)V
emerging from the 90° analyzing magnet (F7+) will be slightly reduced after passing
through a post stripper of thicknesses 10.0 1.5 μg/cm2. The outgoing beam energy
was estimated to be reduced by about 0.3% of the incoming beam energy for the same
charge state [183,184]. The thickness and density of the stripper foil are the factors
governing the reduced amount of beam energy. Since the accelerator at WMU is
limited to a maximum terminal high voltage of 6 MV, a beam of F9+ was not possible
to be directly obtained using only the gas stripper. A beam of F7+ instead was
extracted from the accelerator using a terminal voltage of 5.25 MV then post-stripped
to singly-charged (H-like) and fully-stripped fluorine ions, while some of the
incoming He-like ions remain unchanged. A switching magnet then directed the
appropriate charge state into the beam line.
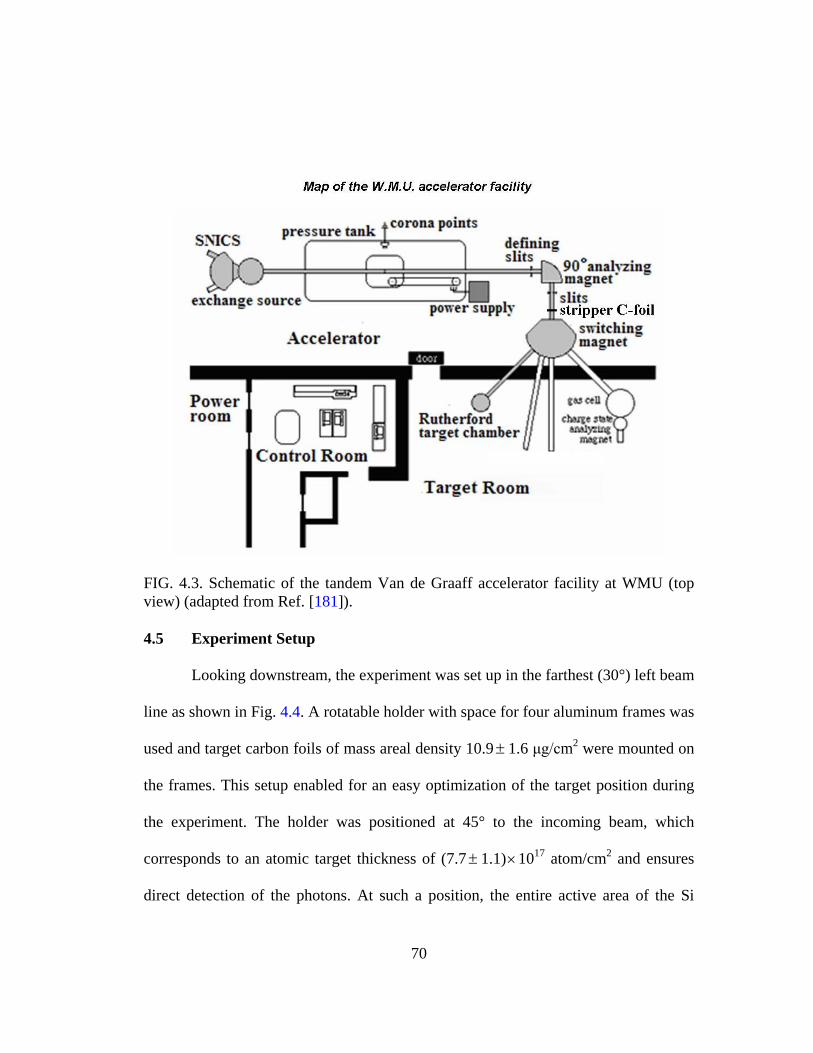
70
FIG. 4.3. Schematic of the tandem Van de Graaff accelerator facility at WMU (top view) (adapted from Ref. [181]).
4.5 Experiment Setup
Looking downstream, the experiment was set up in the farthest (30°) left beam
line as shown in Fig. 4.4. A rotatable holder with space for four aluminum frames was
used and target carbon foils of mass areal density 10.9± 1.6 μg/cm2 were mounted on
the frames. This setup enabled for an easy optimization of the target position during
the experiment. The holder was positioned at 45° to the incoming beam, which
corresponds to an atomic target thickness of (7.7± 1.1)×1017 atom/cm2 and ensures
direct detection of the photons. At such a position, the entire active area of the Si
71
single crystal is utilized and is not blocked by any part of the aluminum frames on
which the carbon foils are mounted. In fact, x-ray attenuation due to absorption does
not appreciably occur if the beam passes at 45° inclination through a 10.9 1.6±
μg/cm2-thick carbon foil based on the calculated attenuation of 0.3–0.1% for the x-ray
energy range of 2 – 4 keV, respectively [176].
A ladder of four steps was used to facilitate selecting the desired foil out of
the three that were mounted. The fourth frame was left empty so that the background
could be determined and to ensure that the emitted x rays originate only from the
collisions with the carbon foils and not, for instance, from the aluminum frame or any
other impurities that might exist on the frame surface. A 2-mm-wide collimator was
used to ensure a good beam collimation at the target as illustrated in Fig. 4.4.
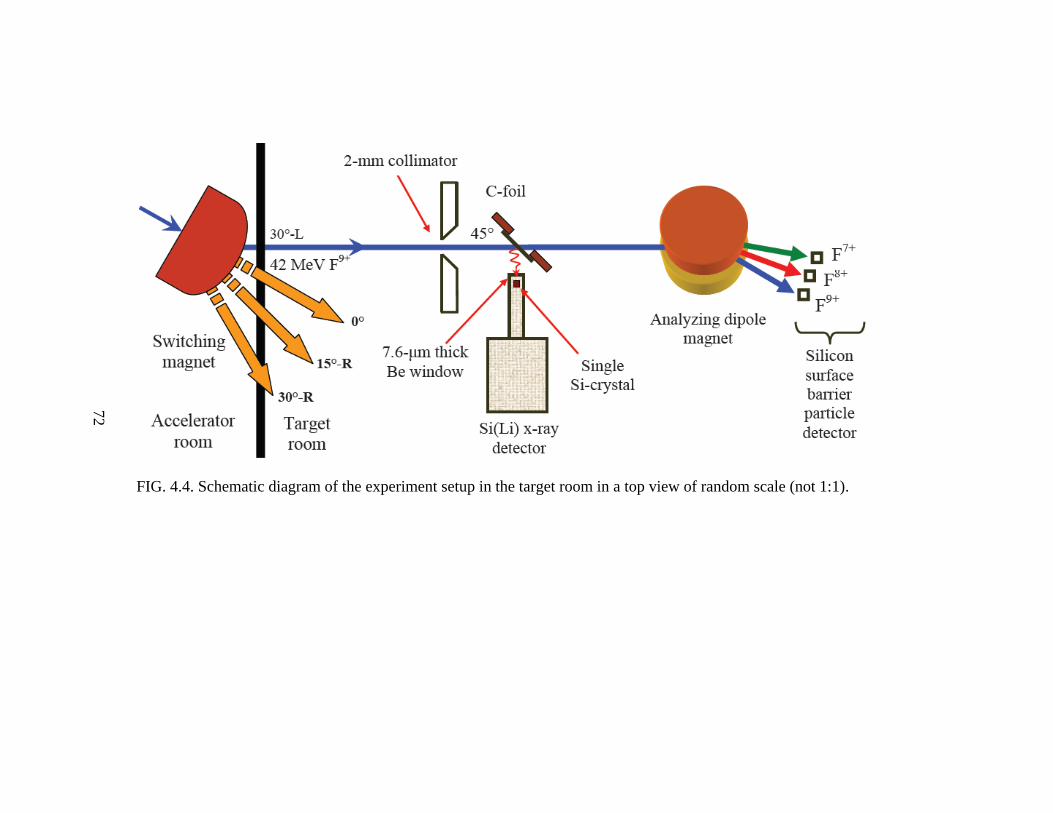
FIG. 4.4. Schematic diagram of the experiment setup in the target room in a top view of random scale (not 1:1).
72
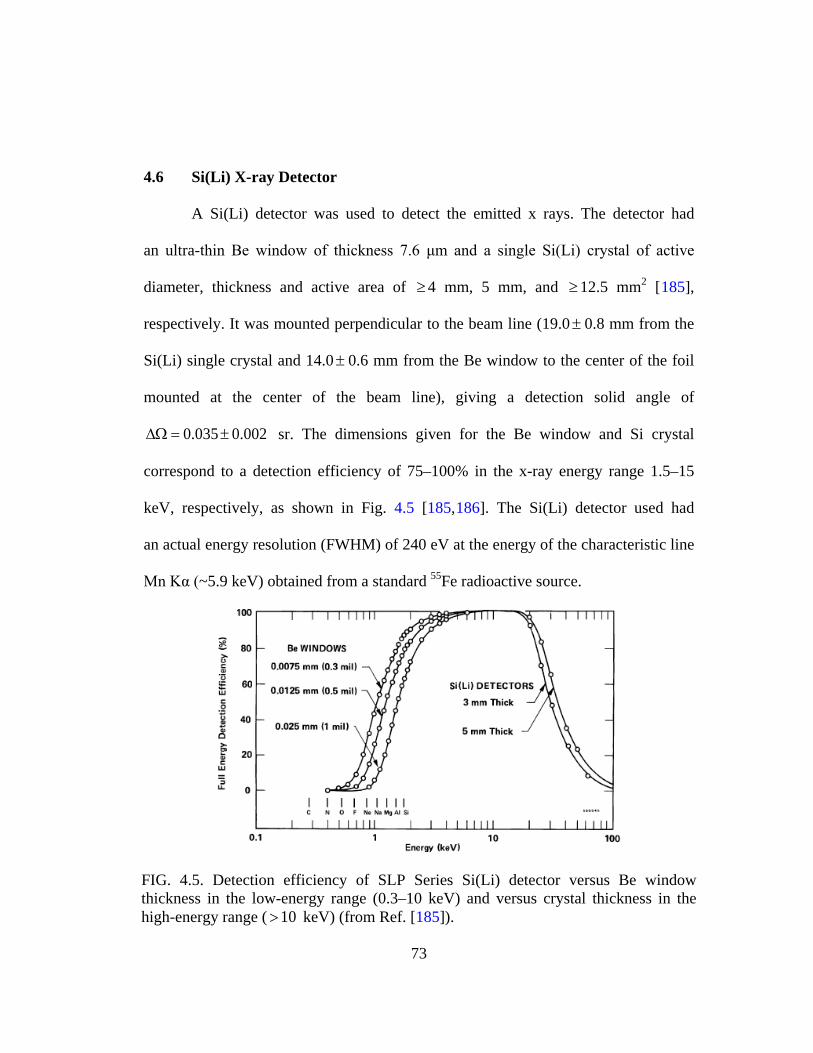
73
4.6 Si(Li) X-ray Detector
A Si(Li) detector was used to detect the emitted x rays. The detector had
an ultra-thin Be window of thickness 7.6 μm and a single Si(Li) crystal of active
diameter, thickness and active area of ≥4 mm, 5 mm, and ≥12.5 mm2 [185
±
],
respectively. It was mounted perpendicular to the beam line (19.0 0.8 mm from the
Si(Li) single crystal and 14.0± 0.6 mm from the Be window to the center of the foil
mounted at the center of the beam line), giving a detection solid angle of
0.035 0.002∆Ω = ± sr. The dimensions given for the Be window and Si crystal
correspond to a detection efficiency of 75–100% in the x-ray energy range 1.5–15
keV, respectively, as shown in Fig. 4.5 [185,186]. The Si(Li) detector used had
an actual energy resolution (FWHM) of 240 eV at the energy of the characteristic line
Mn Kα (~5.9 keV) obtained from a standard 55Fe radioactive source.
FIG. 4.5. Detection efficiency of SLP Series Si(Li) detector versus Be window thickness in the low-energy range (0.3–10 keV) and versus crystal thickness in the high-energy range ( 10> keV) (from Ref. [185]).
74
4.7 Silicon Surface-Barrier Particle Detector
A dipole analyzing magnet located about 1 m after the target chamber was
used to separate the charge states coming out of the collision region. Charge-changed
projectile ions with charge states 2q − , 1q − as well as the charge state q of the
primary beam were detected individually by three ion-implanted silicon surface-
barrier particle detectors [187,188 2q −]. The charges , 1q − , and q for the present
experiment with incident 2.21 MeV/u F9+ ions were registered in the ratios
1.0:18.3:9.2, respectively. Each detector had an active area and active thickness, also
called minimum depletion depth, of 300 mm2 and 100 μm, respectively.
4.8 Data Acquisition System
The data acquisition (DAQ) system provides the required coincidence
techniques to isolate the correlated processes. A circuit schematic diagram of the
electronics setup is shown in Fig. 4.6. Emitted photons were analyzed in coincidence
with ions of outgoing projectile charge states 2q − , 1q − , and q using NIM modules
and a CAMAC module unless mentioned otherwise.
Signals from the x-ray and particle detectors were amplified by timing filter
amplifiers (TFA) and then sent to constant fraction discriminators (CFD) to deliver
a logic signal. The output signal from the x-ray detector was also sent to
a spectroscopy amplifier so that the voltage signal is amplified from the mV scale to
a few-volt scale, providing the correct input for the further modules, i.e., the linear
75
gate and stretcher (LGS) and single channel analyzer (SCA). A non-gated LGS,
called “slow” by convention, was used to register the unconditioned x rays that were
not affected by the x-ray TFA.
The x-ray CFD output was split into two signals, one of which was used to
gate another LGS, called “fast”, to indicate the recording of only the x rays that
started the time-to-amplitude converters (TACs). A TAC records photon-particle
coincidences on a timing basis (<2 µs in this case) by starting on a photon as
represented by the x-ray CFD output signal, and stopping on a particle event as
represented by the output signal of the CFD dedicated to the particle detector. An
ORTEC AD811 CAMAC octal analog-to-digital converter (ADC) [189
The amplified signal from the spectroscopy amplifier was split into two
unipolar outputs and one bipolar output. The two unipolar outputs were used as input
signals for the fast (gated) and slow (non-gated) LGSs mentioned above. The ADC
was used to deliver the energy (x rays) of both gated and non-gated events as well as
time (TAC) spectra of all charge-changed and unchanged projectiles to the computer.
] is then
started by the TAC analog output signal for which the amplitude is proportional to the
time difference of the properly-delayed signals.
The bipolar output was processed through an SCA followed by a logic
converter that split the logic signal produced into two signals. The first was processed
through a gate and delay generator (GDG) and used as a strobe to enable the inputs of
all TACs and LGSs, while the second was processed through another GDG and split
76
into two signals. The first signal was sent through one GDG and used as an external
strobe pulse to start the conversion by enabling all eight linear gates (inputs) of the
ADC, while the second signal was processed through another GDG followed by
a level-adaptor (LA8000) and used as a master trigger for the computer. On the other
hand, six scalars were used to count the two charge-changed and unchanged projectile
ions as well as TFA, SCA and Si(Li) detector counts. A pre-scalar was used with the
counter so that the number of incoming counts was reduced by 10 or a multiple of 10.
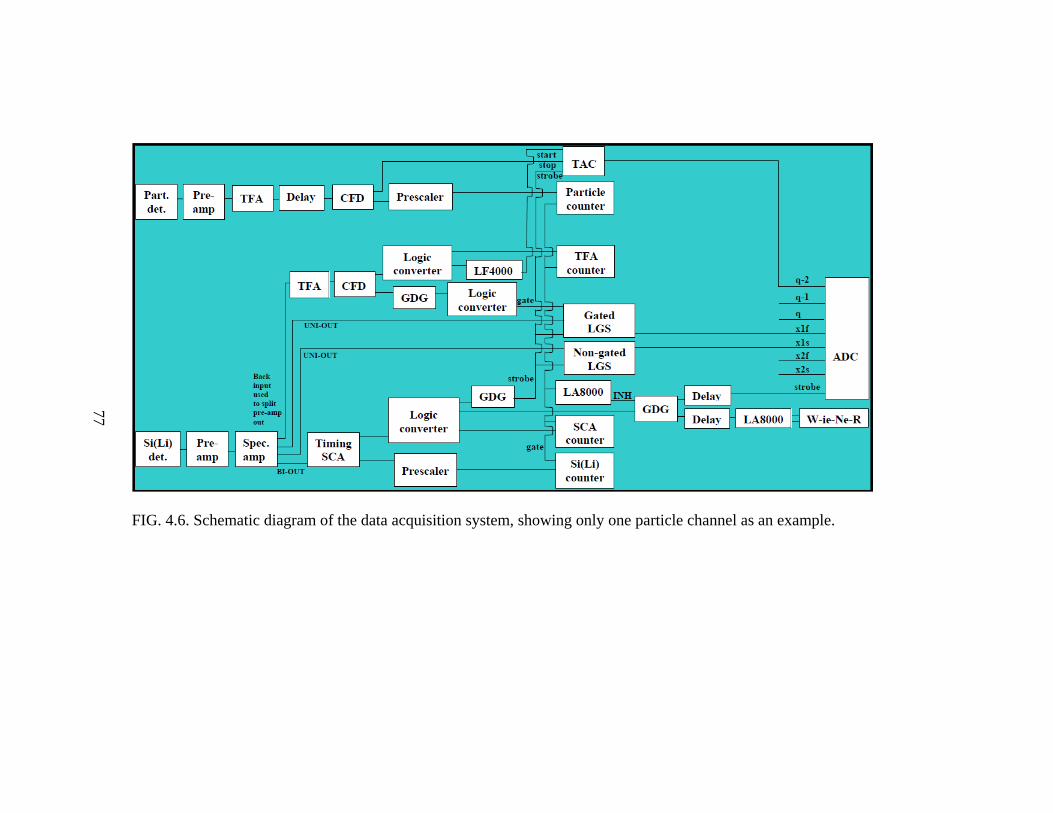
FIG. 4.6. Schematic diagram of the data acquisition system, showing only one particle channel as an example.
77
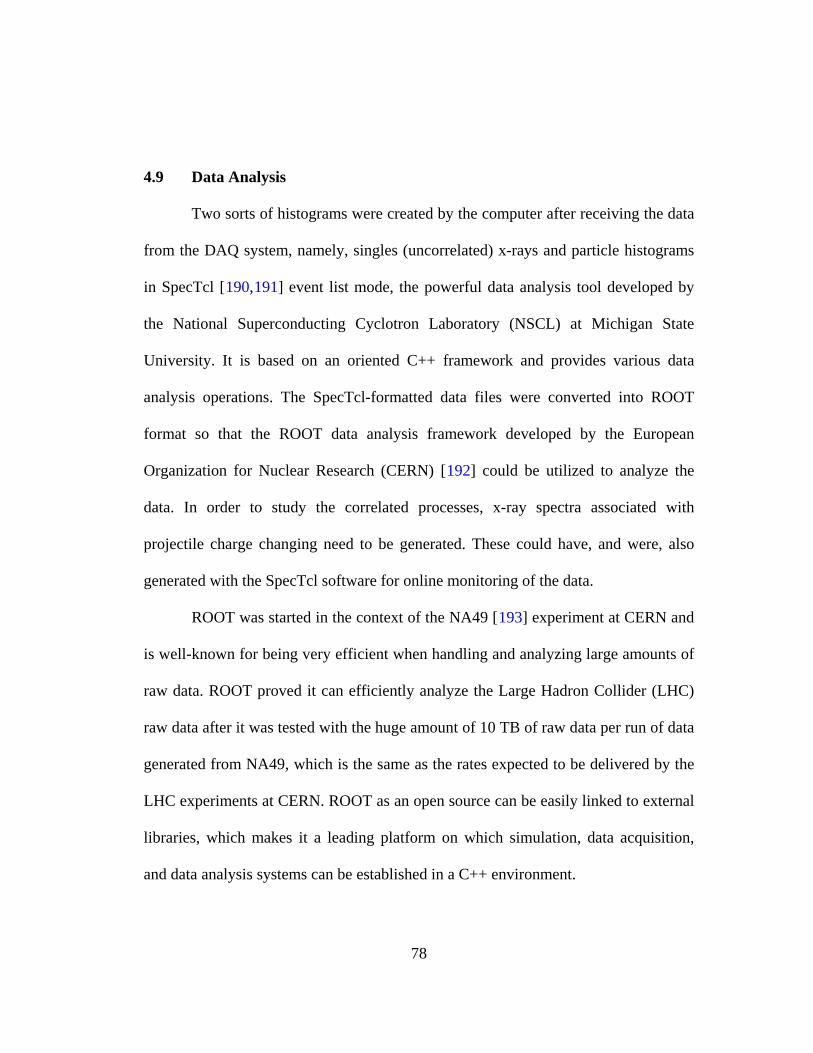
78
4.9 Data Analysis
Two sorts of histograms were created by the computer after receiving the data
from the DAQ system, namely, singles (uncorrelated) x-rays and particle histograms
in SpecTcl [190,191] event list mode, the powerful data analysis tool developed by
the National Superconducting Cyclotron Laboratory (NSCL) at Michigan State
University. It is based on an oriented C++ framework and provides various data
analysis operations. The SpecTcl-formatted data files were converted into ROOT
format so that the ROOT data analysis framework developed by the European
Organization for Nuclear Research (CERN) [192
ROOT was started in the context of the NA49 [
] could be utilized to analyze the
data. In order to study the correlated processes, x-ray spectra associated with
projectile charge changing need to be generated. These could have, and were, also
generated with the SpecTcl software for online monitoring of the data.
193] experiment at CERN and
is well-known for being very efficient when handling and analyzing large amounts of
raw data. ROOT proved it can efficiently analyze the Large Hadron Collider (LHC)
raw data after it was tested with the huge amount of 10 TB of raw data per run of data
generated from NA49, which is the same as the rates expected to be delivered by the
LHC experiments at CERN. ROOT as an open source can be easily linked to external
libraries, which makes it a leading platform on which simulation, data acquisition,
and data analysis systems can be established in a C++ environment.
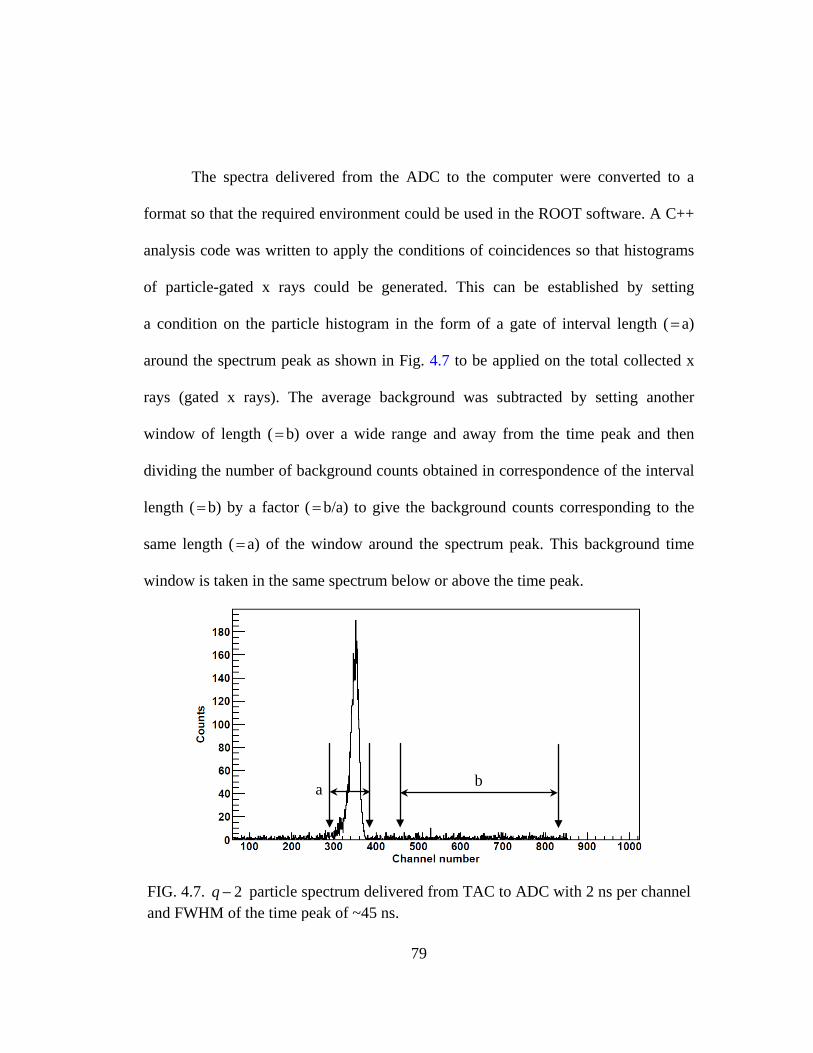
79
The spectra delivered from the ADC to the computer were converted to a
format so that the required environment could be used in the ROOT software. A C++
analysis code was written to apply the conditions of coincidences so that histograms
of particle-gated x rays could be generated. This can be established by setting
a condition on the particle histogram in the form of a gate of interval length (=a)
around the spectrum peak as shown in Fig. 4.7 to be applied on the total collected x
rays (gated x rays). The average background was subtracted by setting another
window of length (=b) over a wide range and away from the time peak and then
dividing the number of background counts obtained in correspondence of the interval
length (=b) by a factor (=b/a) to give the background counts corresponding to the
same length (=a) of the window around the spectrum peak. This background time
window is taken in the same spectrum below or above the time peak.
FIG. 4.7. 2q − particle spectrum delivered from TAC to ADC with 2 ns per channel and FWHM of the time peak of ~45 ns.
a b
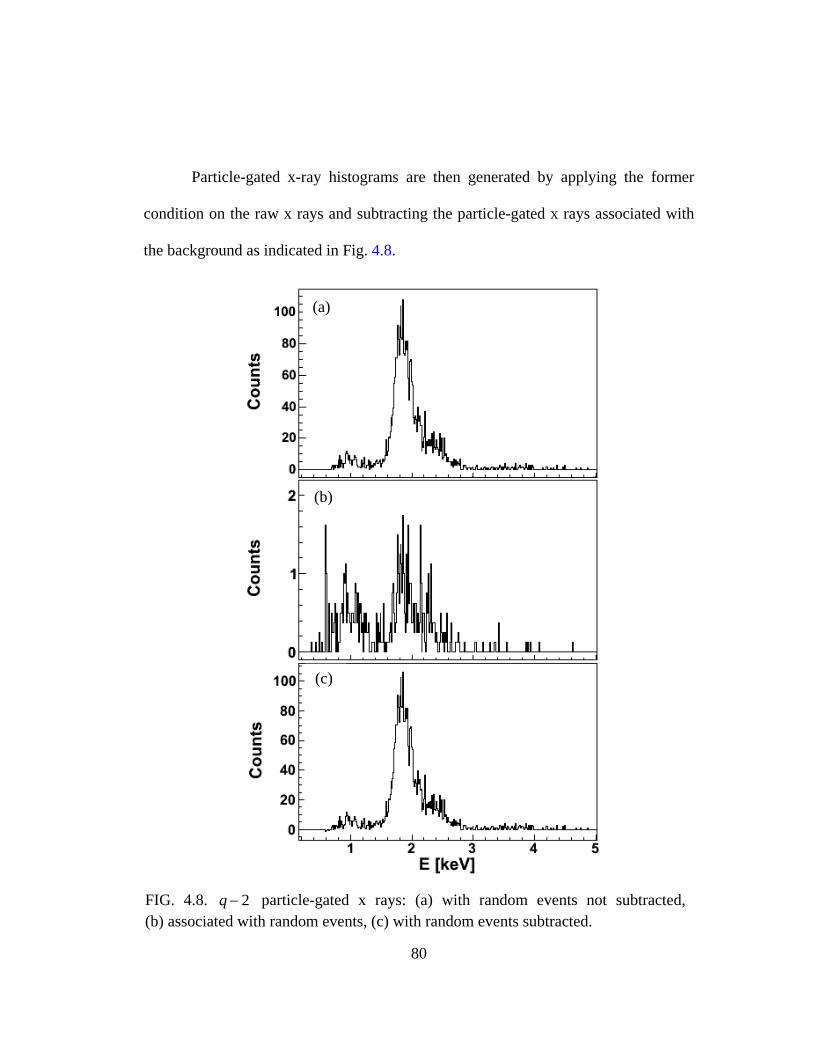
80
Particle-gated x-ray histograms are then generated by applying the former
condition on the raw x rays and subtracting the particle-gated x rays associated with
the background as indicated in Fig. 4.8.
FIG. 4.8. 2q − particle-gated x rays: (a) with random events not subtracted, (b) associated with random events, (c) with random events subtracted.
(a)
(b)
(c)
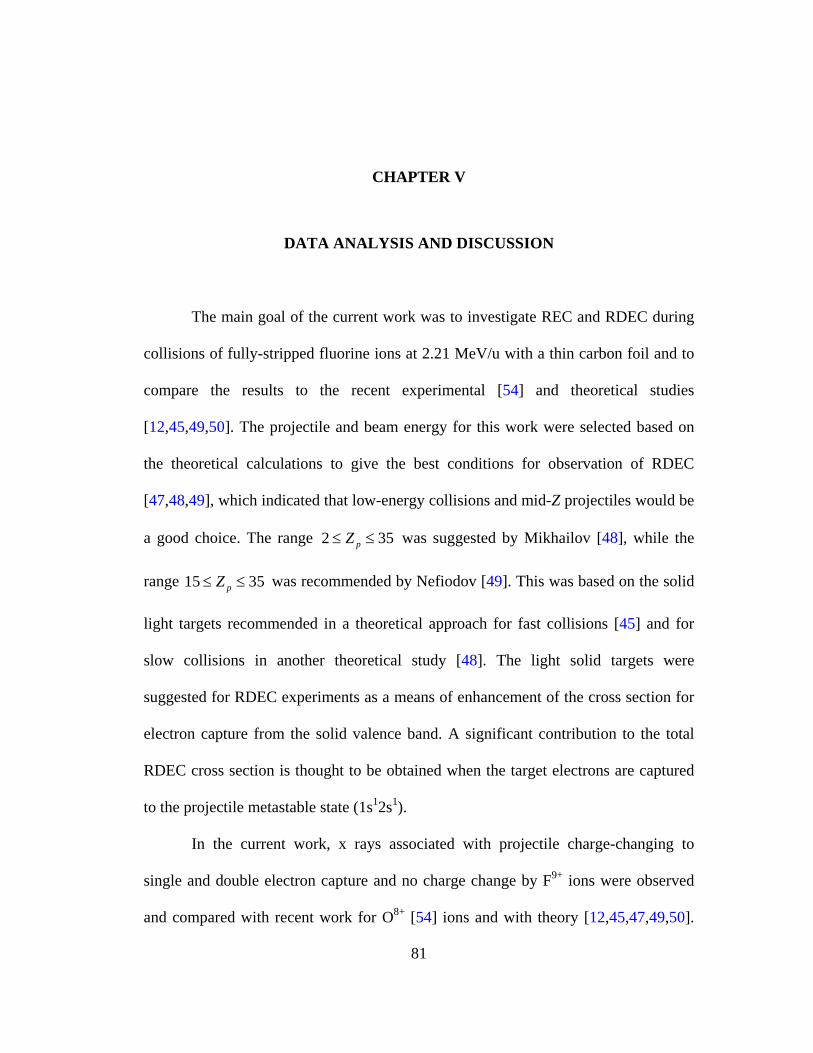
81
CHAPTER V
DATA ANALYSIS AND DISCUSSION
The main goal of the current work was to investigate REC and RDEC during
collisions of fully-stripped fluorine ions at 2.21 MeV/u with a thin carbon foil and to
compare the results to the recent experimental [54] and theoretical studies
[12,45,49,50]. The projectile and beam energy for this work were selected based on
the theoretical calculations to give the best conditions for observation of RDEC
[47,48,49], which indicated that low-energy collisions and mid-Z projectiles would be
a good choice. The range 2 35pZ≤ ≤ was suggested by Mikhailov [48], while the
range 15 35pZ≤ ≤ was recommended by Nefiodov [49]. This was based on the solid
light targets recommended in a theoretical approach for fast collisions [45] and for
slow collisions in another theoretical study [48]. The light solid targets were
suggested for RDEC experiments as a means of enhancement of the cross section for
electron capture from the solid valence band. A significant contribution to the total
RDEC cross section is thought to be obtained when the target electrons are captured
to the projectile metastable state (1s12s1).
In the current work, x rays associated with projectile charge-changing to
single and double electron capture and no charge change by F9+ ions were observed
and compared with recent work for O8+ [54] ions and with theory [12,45,47,49,50].
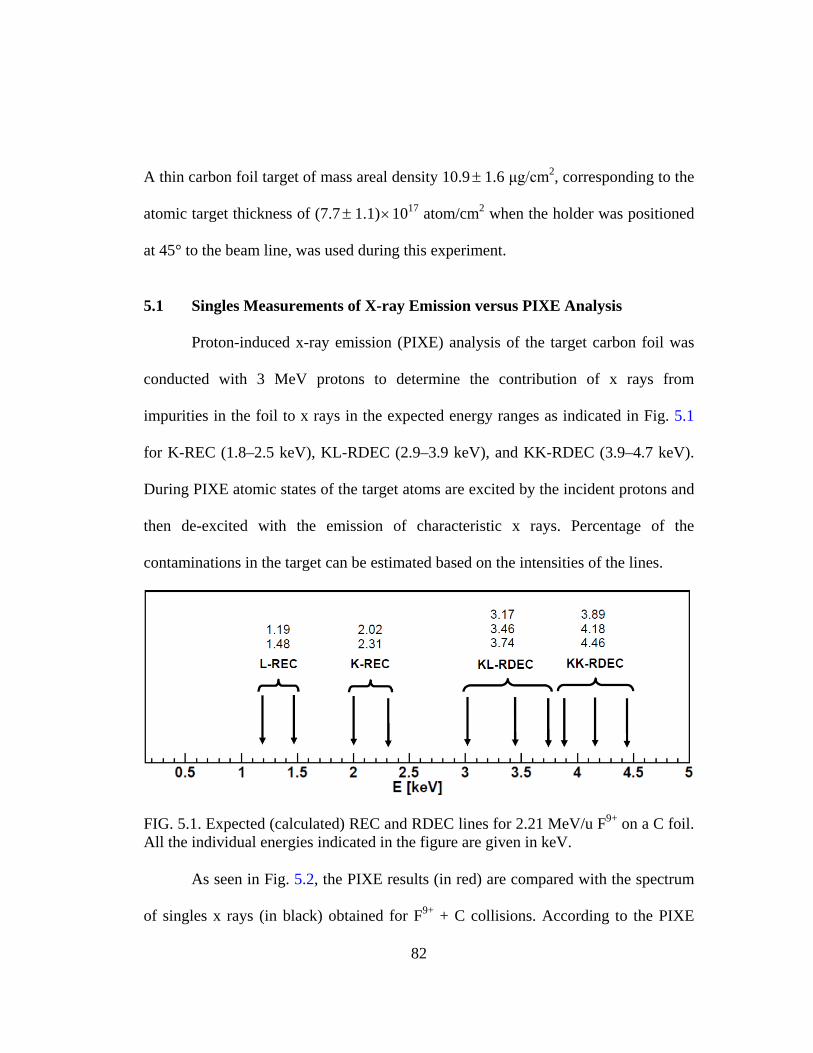
82
A thin carbon foil target of mass areal density 10.9± 1.6 μg/cm2, corresponding to the
atomic target thickness of (7.7± 1.1)×1017 atom/cm2 when the holder was positioned
at 45° to the beam line, was used during this experiment.
5.1 Singles Measurements of X-ray Emission versus PIXE Analysis
Proton-induced x-ray emission (PIXE) analysis of the target carbon foil was
conducted with 3 MeV protons to determine the contribution of x rays from
impurities in the foil to x rays in the expected energy ranges as indicated in Fig. 5.1
for K-REC (1.8–2.5 keV), KL-RDEC (2.9–3.9 keV), and KK-RDEC (3.9–4.7 keV).
During PIXE atomic states of the target atoms are excited by the incident protons and
then de-excited with the emission of characteristic x rays. Percentage of the
contaminations in the target can be estimated based on the intensities of the lines.
FIG. 5.1. Expected (calculated) REC and RDEC lines for 2.21 MeV/u F9+ on a C foil. All the individual energies indicated in the figure are given in keV.
As seen in Fig. 5.2, the PIXE results (in red) are compared with the spectrum
of singles x rays (in black) obtained for F9+ + C collisions. According to the PIXE
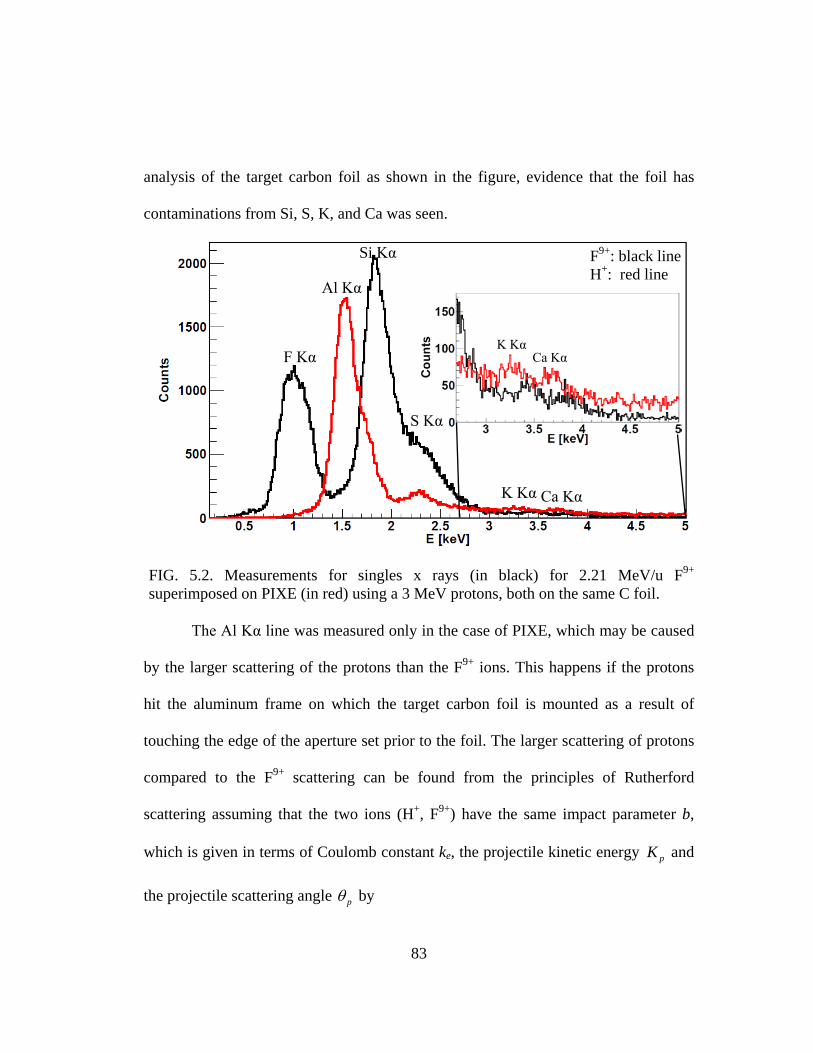
83
analysis of the target carbon foil as shown in the figure, evidence that the foil has
contaminations from Si, S, K, and Ca was seen.
FIG. 5.2. Measurements for singles x rays (in black) for 2.21 MeV/u F9+ superimposed on PIXE (in red) using a 3 MeV protons, both on the same C foil.
The Al Kα line was measured only in the case of PIXE, which may be caused
by the larger scattering of the protons than the F9+ ions. This happens if the protons
hit the aluminum frame on which the target carbon foil is mounted as a result of
touching the edge of the aperture set prior to the foil. The larger scattering of protons
compared to the F9+ scattering can be found from the principles of Rutherford
scattering assuming that the two ions (H+, F9+) have the same impact parameter b,
which is given in terms of Coulomb constant ke, the projectile kinetic energy pK and
the projectile scattering angle pθ by
F Kα
K Kα Ca Kα
Al Kα
K Kα Ca Kα
F9+: black line H+: red line
Si Kα
S Kα
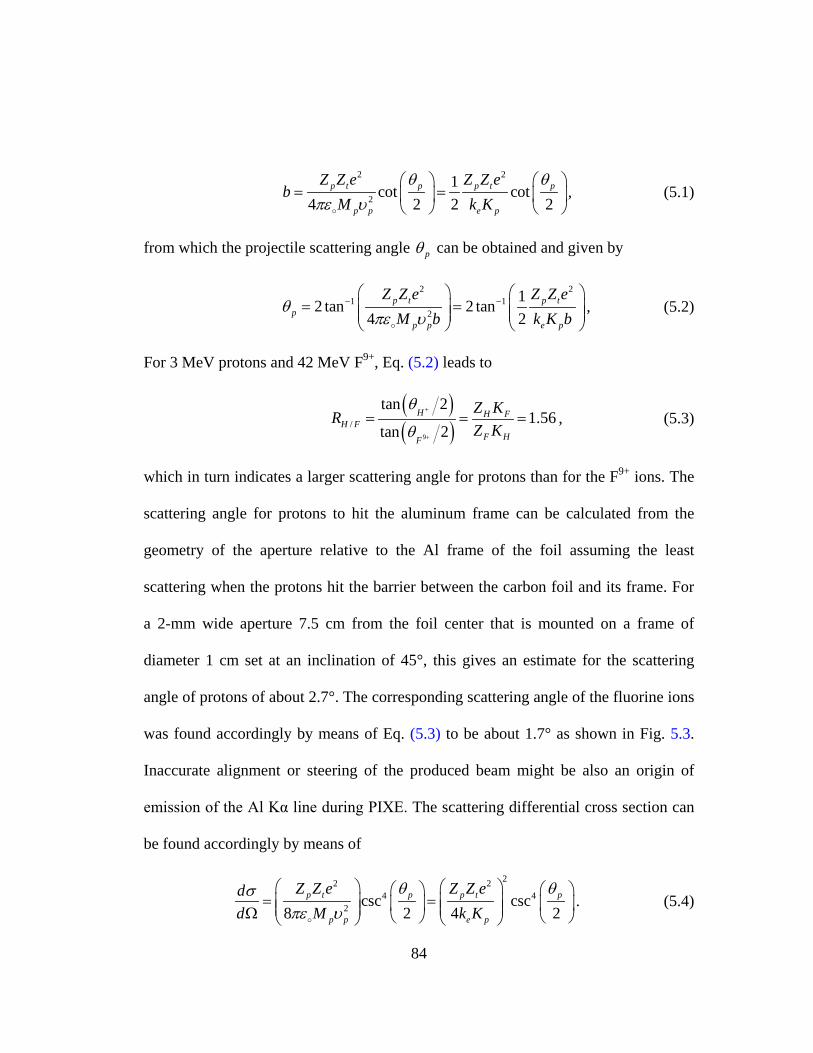
84
2 2
2
1cot cot4 2 2 2
p t p p t p
p p e p
Z Z e Z Z eb
M k Kθ θ
πε υ
= =
, (5.1)
from which the projectile scattering angle pθ can be obtained and given by
2 21 1
2
12 tan 2 tan4 2
p t p tp
p p e p
Z Z e Z Z eM b k K b
θπε υ
− −
= =
, (5.2)
For 3 MeV protons and 42 MeV F9+, Eq. (5.2) leads to
( )( )9
/
tan 21.56
tan 2H H F
H FF HF
Z KRZ K
θ
θ+
+
= = = , (5.3)
which in turn indicates a larger scattering angle for protons than for the F9+ ions. The
scattering angle for protons to hit the aluminum frame can be calculated from the
geometry of the aperture relative to the Al frame of the foil assuming the least
scattering when the protons hit the barrier between the carbon foil and its frame. For
a 2-mm wide aperture 7.5 cm from the foil center that is mounted on a frame of
diameter 1 cm set at an inclination of 45°, this gives an estimate for the scattering
angle of protons of about 2.7°. The corresponding scattering angle of the fluorine ions
was found accordingly by means of Eq. (5.3) to be about 1.7° as shown in Fig. 5.3.
Inaccurate alignment or steering of the produced beam might be also an origin of
emission of the Al Kα line during PIXE. The scattering differential cross section can
be found accordingly by means of
22 24 4
2 csc csc8 2 4 2
p t p p t p
p p e p
Z Z e Z Z edd M k K
θ θσπε υ
= = Ω
. (5.4)
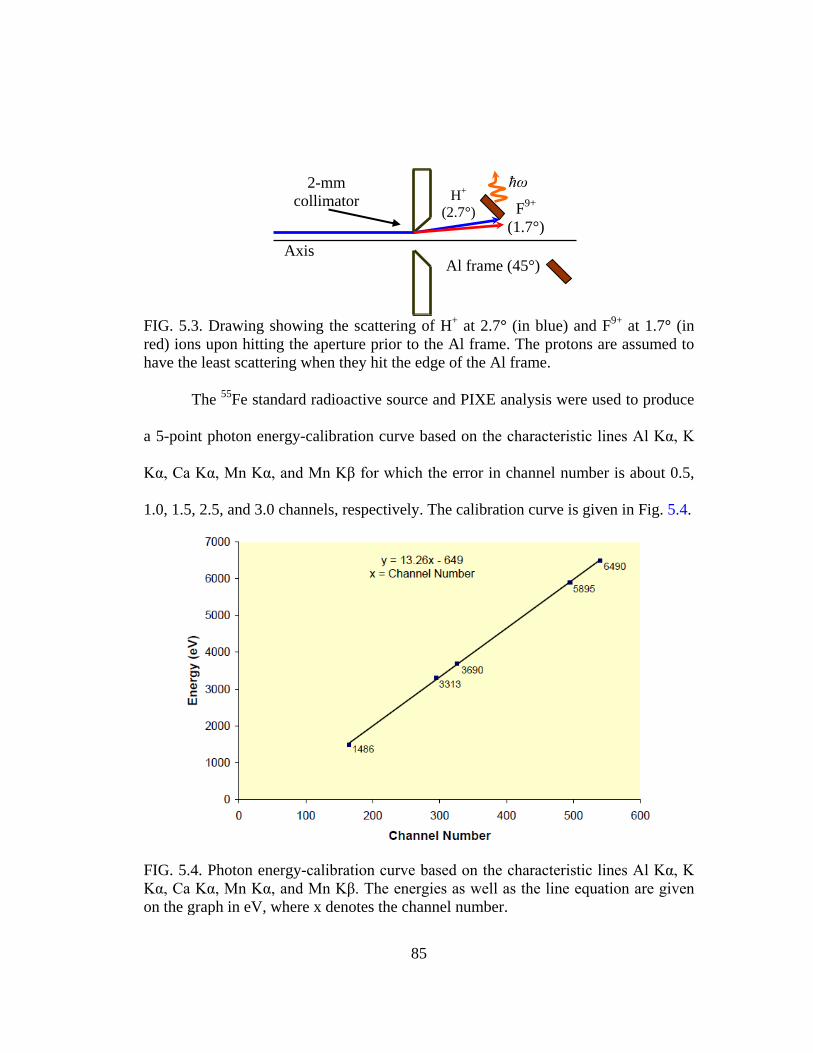
85
FIG. 5.3. Drawing showing the scattering of H+ at 2.7° (in blue) and F9+ at 1.7° (in red) ions upon hitting the aperture prior to the Al frame. The protons are assumed to have the least scattering when they hit the edge of the Al frame.
The 55Fe standard radioactive source and PIXE analysis were used to produce
a 5-point photon energy-calibration curve based on the characteristic lines Al Kα, K
Kα, Ca Kα, Mn Kα, and Mn Kβ for which the error in channel number is about 0.5,
1.0, 1.5, 2.5, and 3.0 channels, respectively. The calibration curve is given in Fig. 5.4.
FIG. 5.4. Photon energy-calibration curve based on the characteristic lines Al Kα, K Kα, Ca Kα, Mn Kα, and Mn Kβ. The energies as well as the line equation are given on the graph in eV, where x denotes the channel number.
ħω
Axis
F9+
(1.7°)
H+ (2.7°)
Al frame (45°)
2-mm collimator
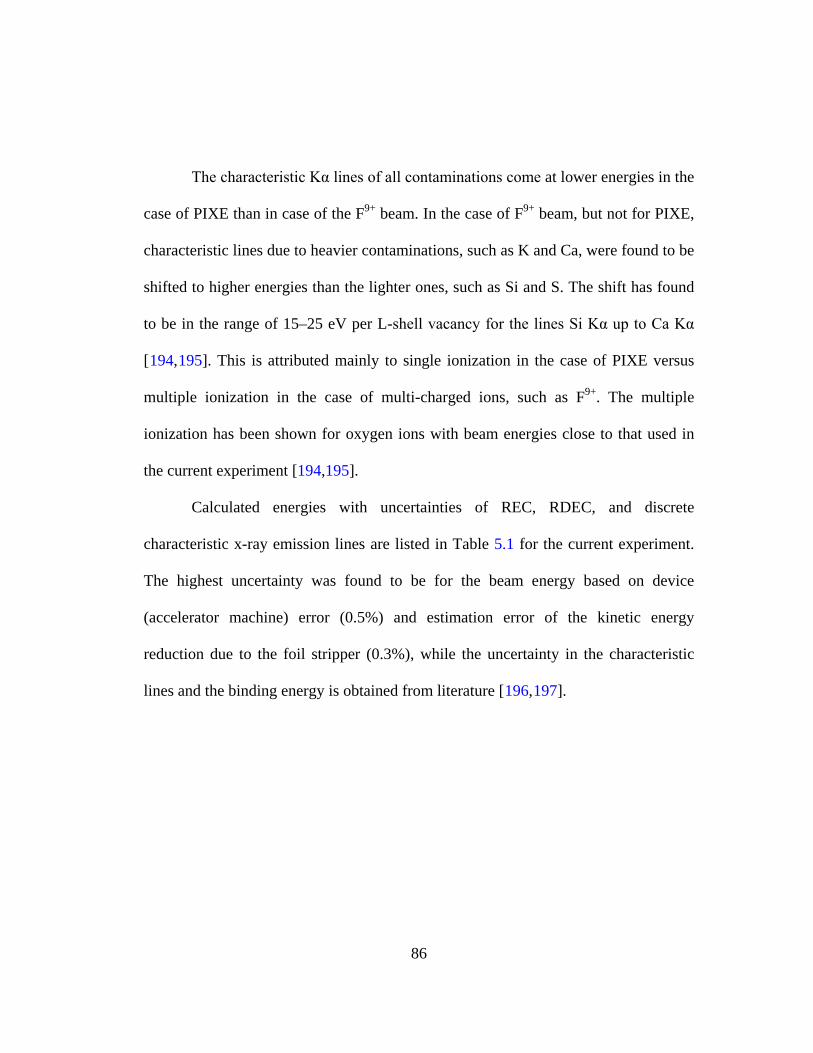
86
The characteristic Kα lines of all contaminations come at lower energies in the
case of PIXE than in case of the F9+ beam. In the case of F9+ beam, but not for PIXE,
characteristic lines due to heavier contaminations, such as K and Ca, were found to be
shifted to higher energies than the lighter ones, such as Si and S. The shift has found
to be in the range of 15–25 eV per L-shell vacancy for the lines Si Kα up to Ca Kα
[194,195
194
]. This is attributed mainly to single ionization in the case of PIXE versus
multiple ionization in the case of multi-charged ions, such as F9+. The multiple
ionization has been shown for oxygen ions with beam energies close to that used in
the current experiment [ ,195].
Calculated energies with uncertainties of REC, RDEC, and discrete
characteristic x-ray emission lines are listed in Table 5.1 for the current experiment.
The highest uncertainty was found to be for the beam energy based on device
(accelerator machine) error (0.5%) and estimation error of the kinetic energy
reduction due to the foil stripper (0.3%), while the uncertainty in the characteristic
lines and the binding energy is obtained from literature [196,197
].
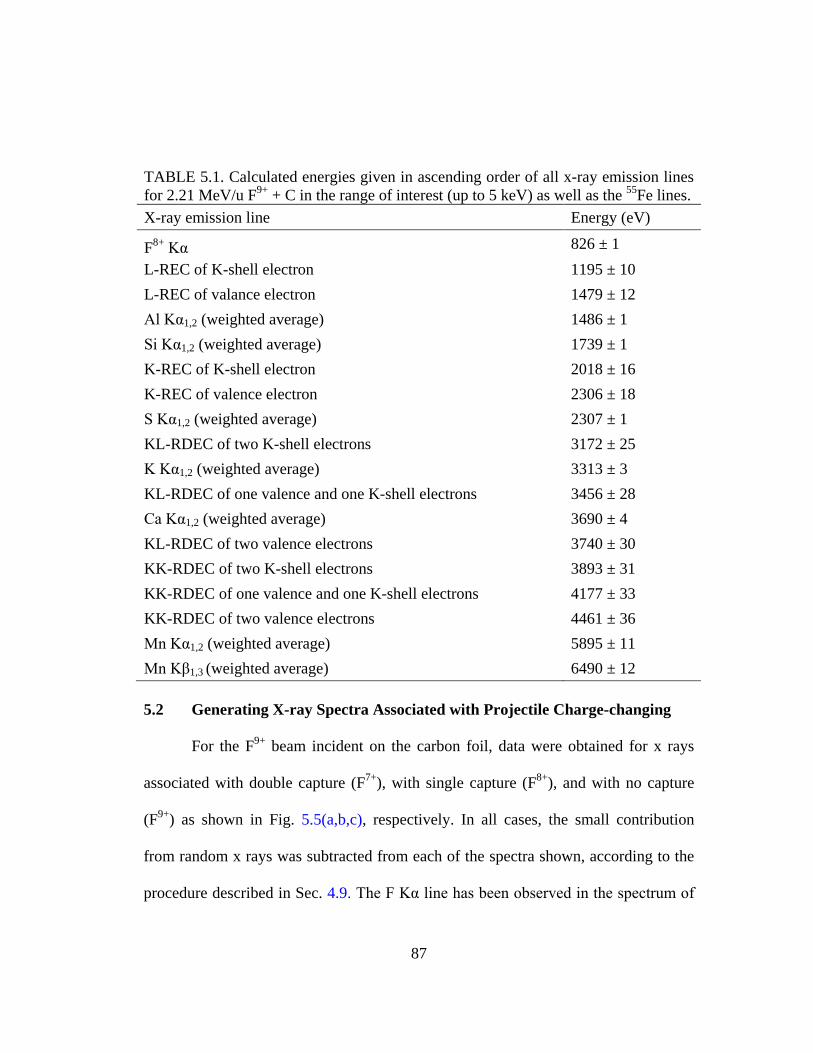
87
TABLE 5.1. Calculated energies given in ascending order of all x-ray emission lines for 2.21 MeV/u F9+ + C in the range of interest (up to 5 keV) as well as the 55Fe lines. X-ray emission line Energy (eV)
F8+ Kα 826 ± 1 L-REC of K-shell electron 1195 ± 10 L-REC of valance electron 1479 ± 12 Al Kα1,2 (weighted average) 1486 ± 1 Si Kα1,2 (weighted average) 1739 ± 1 K-REC of K-shell electron 2018 ± 16 K-REC of valence electron 2306 ± 18 S Kα1,2 (weighted average) 2307 ± 1 KL-RDEC of two K-shell electrons 3172 ± 25 K Kα1,2 (weighted average) 3313 ± 3 KL-RDEC of one valence and one K-shell electrons 3456 ± 28 Ca Kα1,2 (weighted average) 3690 ± 4 KL-RDEC of two valence electrons 3740 ± 30 KK-RDEC of two K-shell electrons 3893 ± 31 KK-RDEC of one valence and one K-shell electrons 4177 ± 33 KK-RDEC of two valence electrons 4461 ± 36 Mn Kα1,2 (weighted average) 5895 ± 11 Mn Kβ1,3 (weighted average) 6490 ± 12
5.2 Generating X-ray Spectra Associated with Projectile Charge-changing
For the F9+ beam incident on the carbon foil, data were obtained for x rays
associated with double capture (F7+), with single capture (F8+), and with no capture
(F9+) as shown in Fig. 5.5(a,b,c), respectively. In all cases, the small contribution
from random x rays was subtracted from each of the spectra shown, according to the
procedure described in Sec. 4.9. The F Kα line has been observed in the spectrum of
88
x rays associated with single capture (F8+), while almost no evidence was seen for this
line in the spectra for x rays associated with double capture and no capture. This
provides evidence that there is essentially no crossover of x rays from the F Kα line
among the various spectra. However, there is expected to be some crossover for
K-REC, primarily to F9+, which involves simultaneous ionization and x-ray emission.
This occurs when a target electron is captured to the projectile K-shell then promptly
ionized for which the probability one order of magnitude less than the probability of
L-shell ionization [96,97]. Target x rays, such as the characteristic lines from the
contaminations, appear in all of the spectra as it is expected to have target x rays
associated with no capture by the projectile as well as with single and double electron
capture. The Si Kα and S Kα lines overlap partially with the lower energy side of the
K-REC structure as can be inferred from Table 5.1 and Fig. 5.5(b) in the x rays
associated with single capture. Evidence for RDEC is seen in the x rays associated
with double capture in Fig. 5.5(a) although the spectrum overlaps partially with the
K Kα and Ca Kα lines as seen in Fig. 5.5(b).
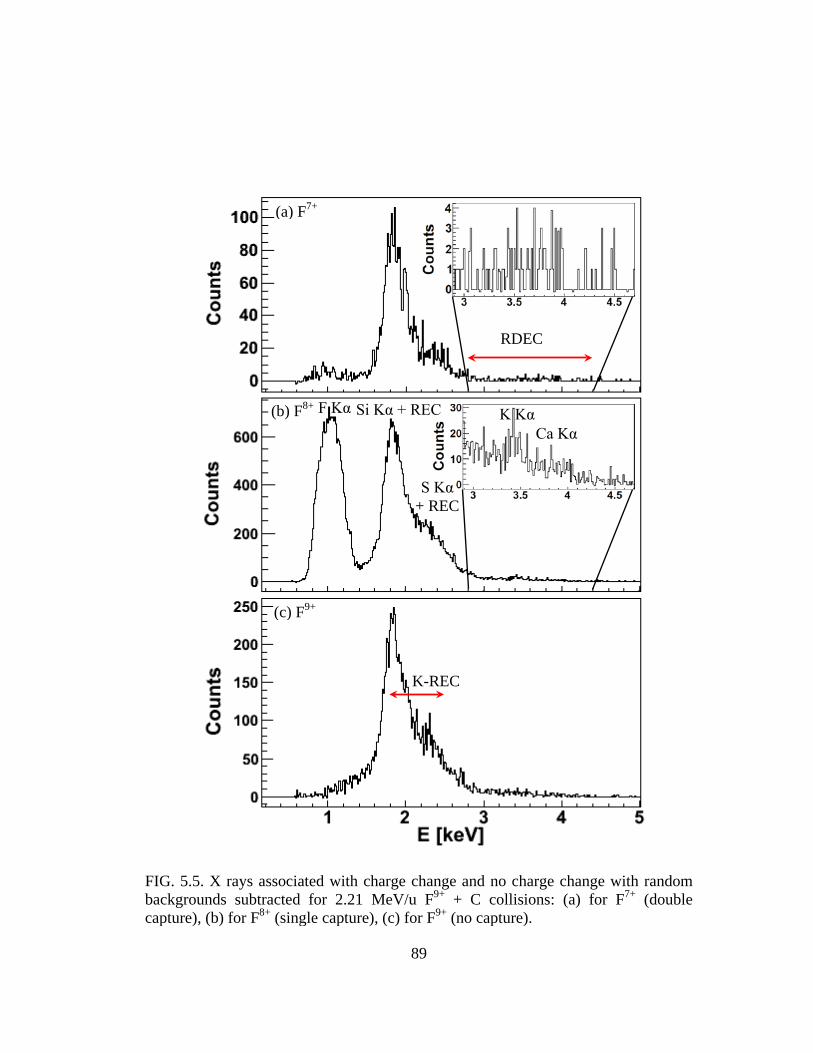
89
FIG. 5.5. X rays associated with charge change and no charge change with random backgrounds subtracted for 2.21 MeV/u F9+ + C collisions: (a) for F7+ (double capture), (b) for F8+ (single capture), (c) for F9+ (no capture).
F Kα
(a) F7+
(b) F8+
K-REC
(c) F9+
RDEC
K Kα Ca Kα
S Kα + REC
Si Kα + REC
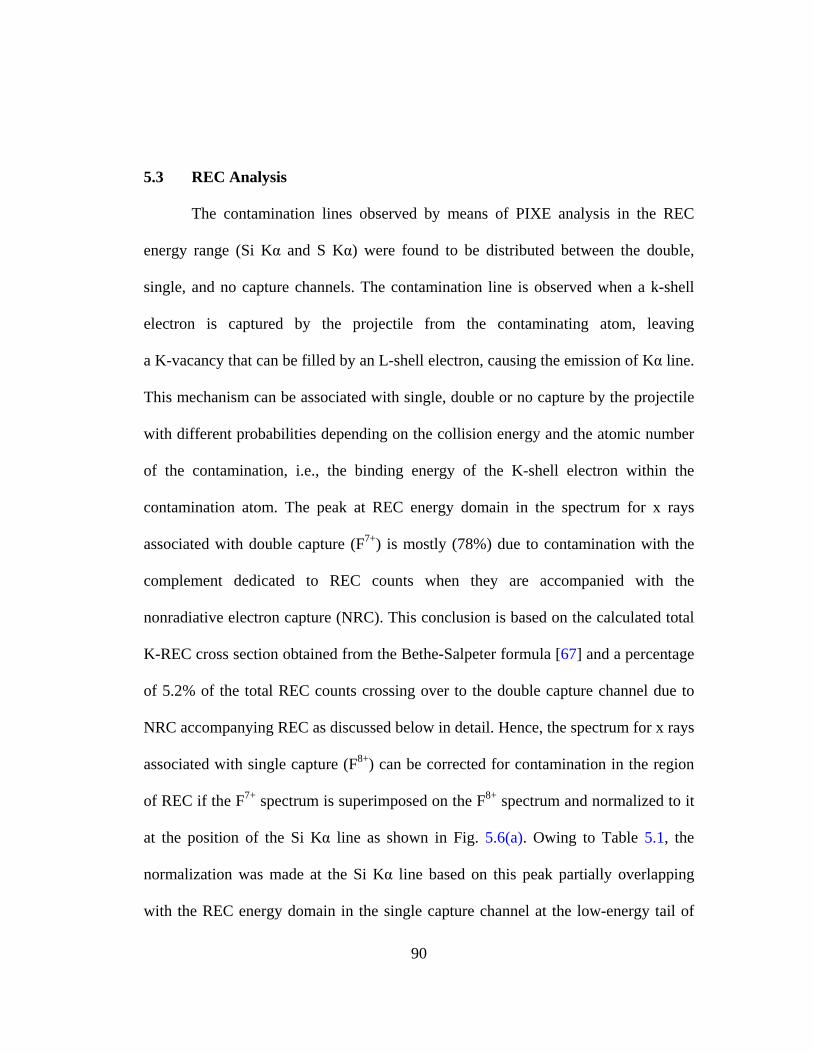
90
5.3 REC Analysis
The contamination lines observed by means of PIXE analysis in the REC
energy range (Si Kα and S Kα) were found to be distributed between the double,
single, and no capture channels. The contamination line is observed when a k-shell
electron is captured by the projectile from the contaminating atom, leaving
a K-vacancy that can be filled by an L-shell electron, causing the emission of Kα line.
This mechanism can be associated with single, double or no capture by the projectile
with different probabilities depending on the collision energy and the atomic number
of the contamination, i.e., the binding energy of the K-shell electron within the
contamination atom. The peak at REC energy domain in the spectrum for x rays
associated with double capture (F7+) is mostly (78%) due to contamination with the
complement dedicated to REC counts when they are accompanied with the
nonradiative electron capture (NRC). This conclusion is based on the calculated total
K-REC cross section obtained from the Bethe-Salpeter formula [67] and a percentage
of 5.2% of the total REC counts crossing over to the double capture channel due to
NRC accompanying REC as discussed below in detail. Hence, the spectrum for x rays
associated with single capture (F8+) can be corrected for contamination in the region
of REC if the F7+ spectrum is superimposed on the F8+ spectrum and normalized to it
at the position of the Si Kα line as shown in Fig. 5.6(a). Owing to Table 5.1, the
normalization was made at the Si Kα line based on this peak partially overlapping
with the REC energy domain in the single capture channel at the low-energy tail of
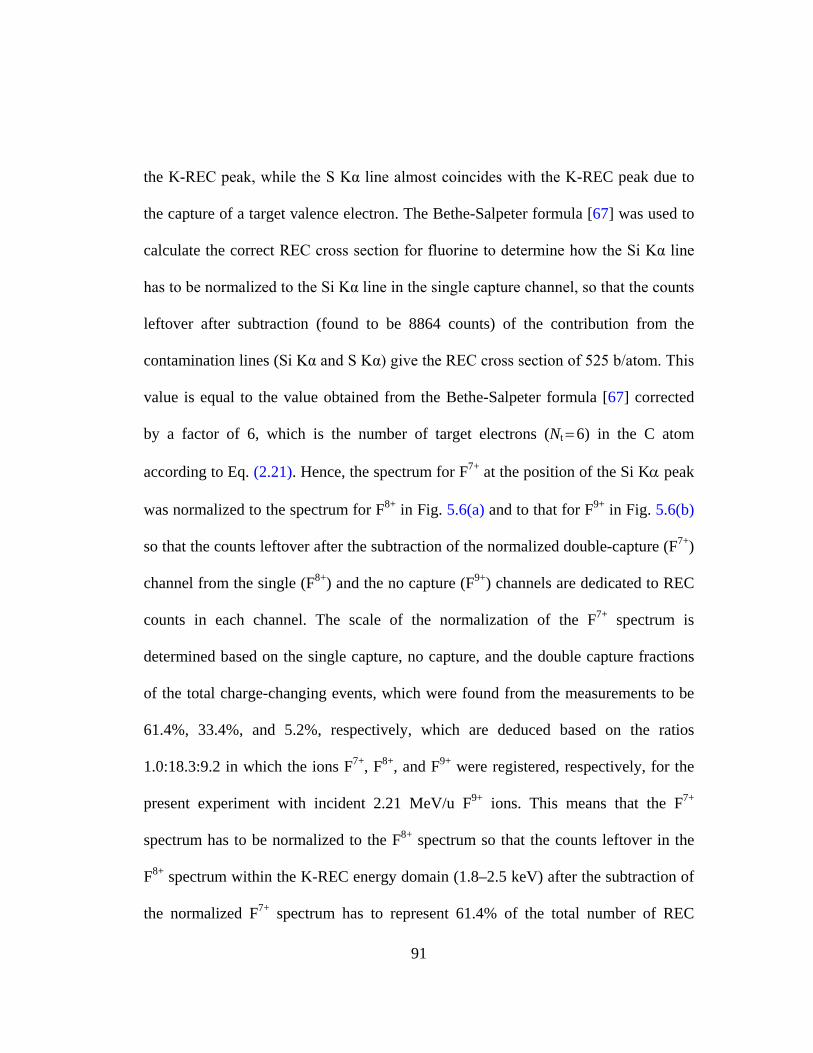
91
the K-REC peak, while the S Kα line almost coincides with the K-REC peak due to
the capture of a target valence electron. The Bethe-Salpeter formula [67] was used to
calculate the correct REC cross section for fluorine to determine how the Si Kα line
has to be normalized to the Si Kα line in the single capture channel, so that the counts
leftover after subtraction (found to be 8864 counts) of the contribution from the
contamination lines (Si Kα and S Kα) give the REC cross section of 525 b/atom. This
value is equal to the value obtained from the Bethe-Salpeter formula [67] corrected
by a factor of 6, which is the number of target electrons (Nt=6) in the C atom
according to Eq. (2.21). Hence, the spectrum for F7+ at the position of the Si Kα peak
was normalized to the spectrum for F8+ in Fig. 5.6(a) and to that for F9+ in Fig. 5.6(b)
so that the counts leftover after the subtraction of the normalized double-capture (F7+)
channel from the single (F8+) and the no capture (F9+) channels are dedicated to REC
counts in each channel. The scale of the normalization of the F7+ spectrum is
determined based on the single capture, no capture, and the double capture fractions
of the total charge-changing events, which were found from the measurements to be
61.4%, 33.4%, and 5.2%, respectively, which are deduced based on the ratios
1.0:18.3:9.2 in which the ions F7+, F8+, and F9+ were registered, respectively, for the
present experiment with incident 2.21 MeV/u F9+ ions. This means that the F7+
spectrum has to be normalized to the F8+ spectrum so that the counts leftover in the
F8+ spectrum within the K-REC energy domain (1.8–2.5 keV) after the subtraction of
the normalized F7+ spectrum has to represent 61.4% of the total number of REC
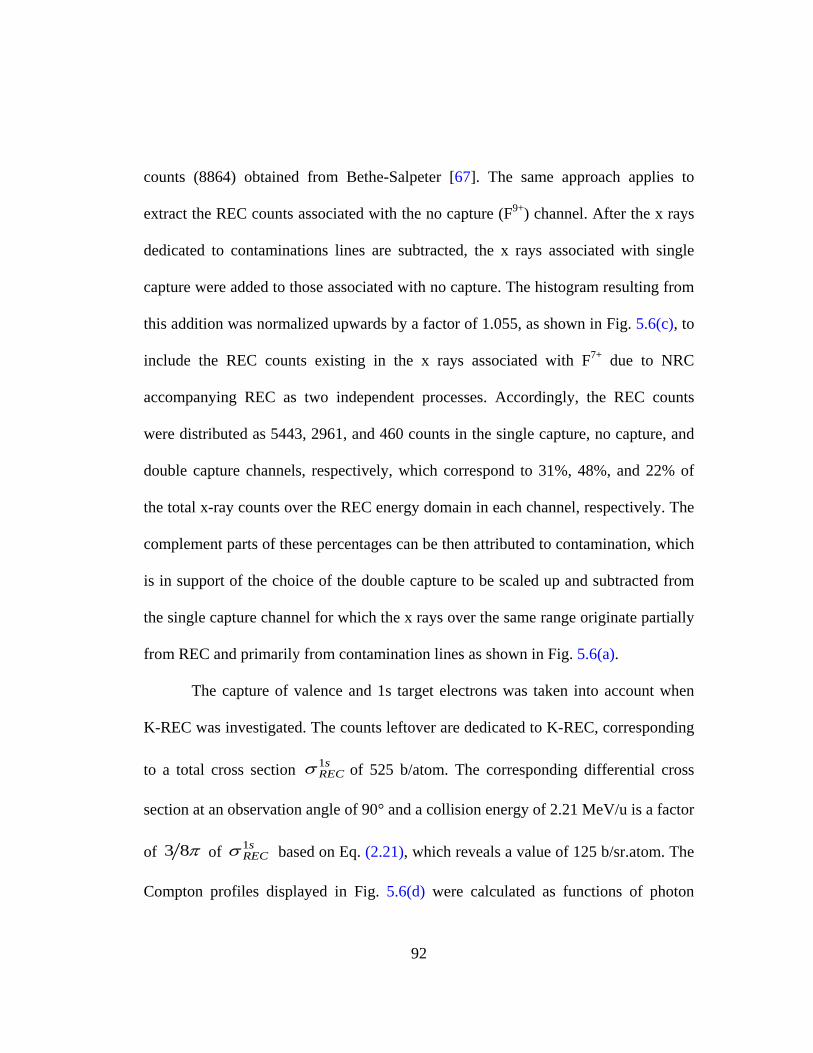
92
counts (8864) obtained from Bethe-Salpeter [67]. The same approach applies to
extract the REC counts associated with the no capture (F9+) channel. After the x rays
dedicated to contaminations lines are subtracted, the x rays associated with single
capture were added to those associated with no capture. The histogram resulting from
this addition was normalized upwards by a factor of 1.055, as shown in Fig. 5.6(c), to
include the REC counts existing in the x rays associated with F7+ due to NRC
accompanying REC as two independent processes. Accordingly, the REC counts
were distributed as 5443, 2961, and 460 counts in the single capture, no capture, and
double capture channels, respectively, which correspond to 31%, 48%, and 22% of
the total x-ray counts over the REC energy domain in each channel, respectively. The
complement parts of these percentages can be then attributed to contamination, which
is in support of the choice of the double capture to be scaled up and subtracted from
the single capture channel for which the x rays over the same range originate partially
from REC and primarily from contamination lines as shown in Fig. 5.6(a).
The capture of valence and 1s target electrons was taken into account when
K-REC was investigated. The counts leftover are dedicated to K-REC, corresponding
to a total cross section sREC1σ of 525 b/atom. The corresponding differential cross
section at an observation angle of 90° and a collision energy of 2.21 MeV/u is a factor
of π83 of sREC1σ based on Eq. (2.21), which reveals a value of 125 b/sr.atom. The
Compton profiles displayed in Fig. 5.6(d) were calculated as functions of photon
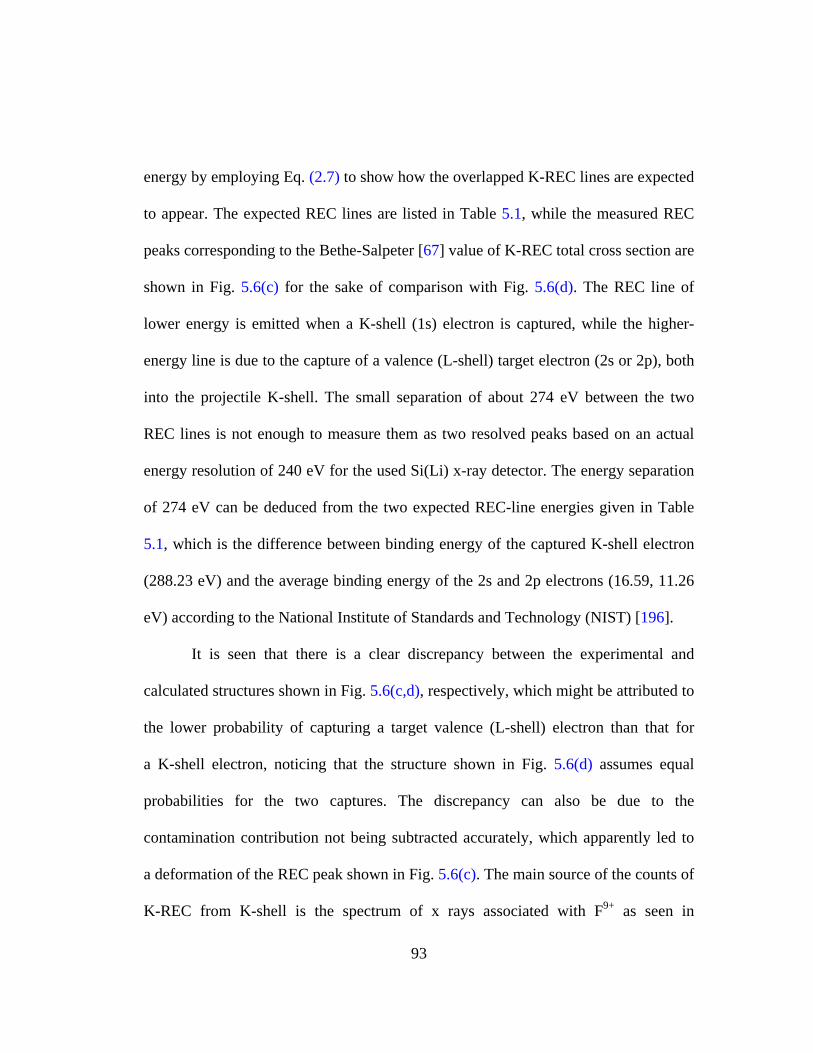
93
energy by employing Eq. (2.7) to show how the overlapped K-REC lines are expected
to appear. The expected REC lines are listed in Table 5.1, while the measured REC
peaks corresponding to the Bethe-Salpeter [67] value of K-REC total cross section are
shown in Fig. 5.6(c) for the sake of comparison with Fig. 5.6(d). The REC line of
lower energy is emitted when a K-shell (1s) electron is captured, while the higher-
energy line is due to the capture of a valence (L-shell) target electron (2s or 2p), both
into the projectile K-shell. The small separation of about 274 eV between the two
REC lines is not enough to measure them as two resolved peaks based on an actual
energy resolution of 240 eV for the used Si(Li) x-ray detector. The energy separation
of 274 eV can be deduced from the two expected REC-line energies given in Table
5.1, which is the difference between binding energy of the captured K-shell electron
(288.23 eV) and the average binding energy of the 2s and 2p electrons (16.59, 11.26
eV) according to the National Institute of Standards and Technology (NIST) [196].
It is seen that there is a clear discrepancy between the experimental and
calculated structures shown in Fig. 5.6(c,d), respectively, which might be attributed to
the lower probability of capturing a target valence (L-shell) electron than that for
a K-shell electron, noticing that the structure shown in Fig. 5.6(d) assumes equal
probabilities for the two captures. The discrepancy can also be due to the
contamination contribution not being subtracted accurately, which apparently led to
a deformation of the REC peak shown in Fig. 5.6(c). The main source of the counts of
K-REC from K-shell is the spectrum of x rays associated with F9+ as seen in
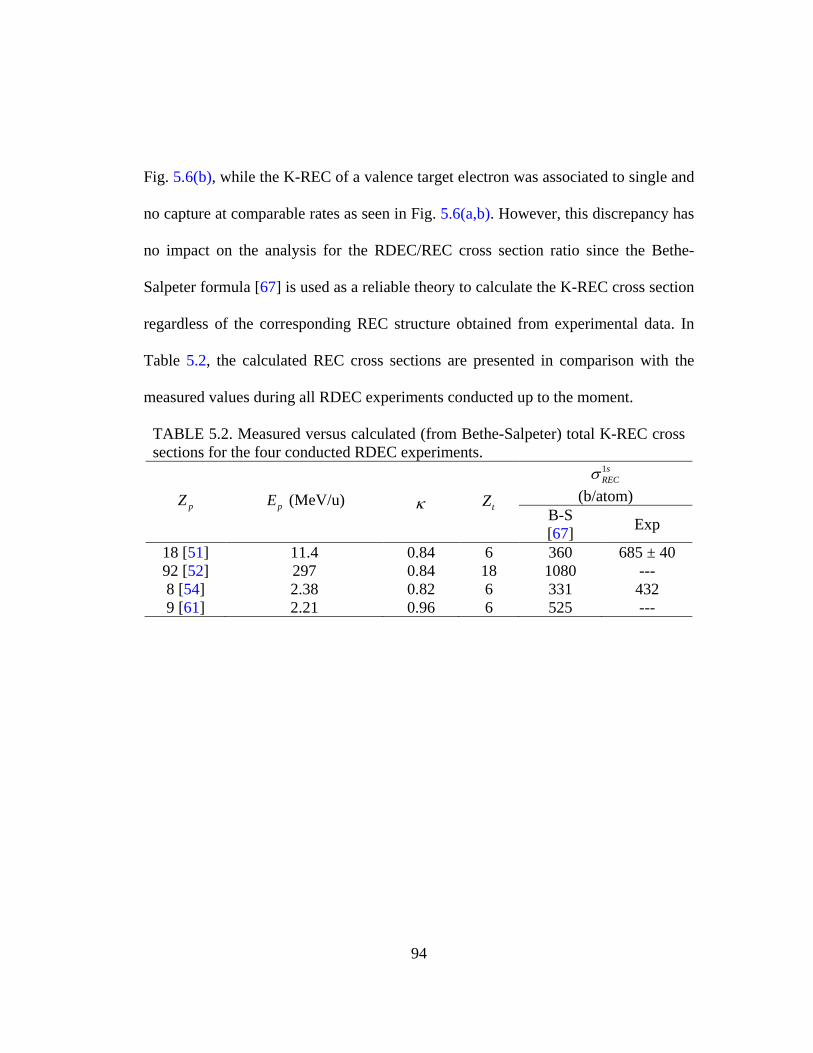
94
Fig. 5.6(b), while the K-REC of a valence target electron was associated to single and
no capture at comparable rates as seen in Fig. 5.6(a,b). However, this discrepancy has
no impact on the analysis for the RDEC/REC cross section ratio since the Bethe-
Salpeter formula [67] is used as a reliable theory to calculate the K-REC cross section
regardless of the corresponding REC structure obtained from experimental data. In
Table 5.2, the calculated REC cross sections are presented in comparison with the
measured values during all RDEC experiments conducted up to the moment.
TABLE 5.2. Measured versus calculated (from Bethe-Salpeter) total K-REC cross sections for the four conducted RDEC experiments.
pZ pE (MeV/u) κ tZ
1sRECσ
(b/atom) B-S [67] Exp
18 [51] 11.4 0.84 6 360 685 ± 40 92 [52] 297 0.84 18 1080 --- 8 [54] 2.38 0.82 6 331 432 9 [61] 2.21 0.96 6 525 ---
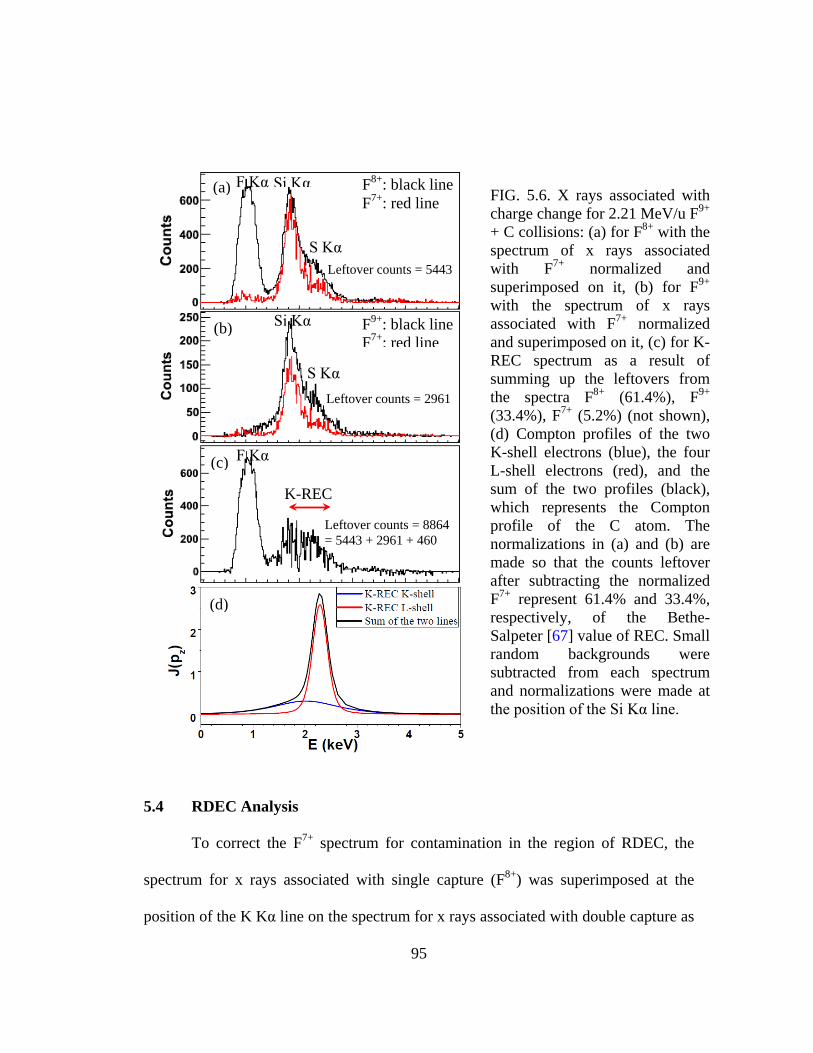
95
FIG. 5.6. X rays associated with charge change for 2.21 MeV/u F9+ + C collisions: (a) for F8+ with the spectrum of x rays associated with F7+ normalized and superimposed on it, (b) for F9+ with the spectrum of x rays associated with F7+ normalized and superimposed on it, (c) for K-REC spectrum as a result of summing up the leftovers from the spectra F8+ (61.4%), F9+ (33.4%), F7+ (5.2%) (not shown), (d) Compton profiles of the two K-shell electrons (blue), the four L-shell electrons (red), and the sum of the two profiles (black), which represents the Compton profile of the C atom. The normalizations in (a) and (b) are made so that the counts leftover after subtracting the normalized F7+ represent 61.4% and 33.4%, respectively, of the Bethe-Salpeter [67] value of REC. Small random backgrounds were subtracted from each spectrum and normalizations were made at the position of the Si Kα line.
5.4 RDEC Analysis
To correct the F7+ spectrum for contamination in the region of RDEC, the
spectrum for x rays associated with single capture (F8+) was superimposed at the
position of the K Kα line on the spectrum for x rays associated with double capture as
(a)
(b)
Si Kα
S Kα
F8+: black line F7+: red line
F9+: black line F7+: red line
S Kα
Si Kα
F Kα
(c) F Kα
K-REC
Leftover counts = 2961
Leftover counts = 5443
Leftover counts = 8864 = 5443 + 2961 + 460
(d)
96
shown in the left panels of Fig. 5.7 and Fig. 5.8(a). Two well-resolved peaks
dedicated to the K Kα and Ca Kα lines are seen in the spectrum of x rays associated
with single capture as shown in Fig. 5.5(b), where they are not overlapped with x rays
from any other process, except for a negligible pileup contribution from REC photons
as indicated in detail in Sec. 5.5. These two peaks overlap with some of the RDEC
events within the x rays associated with double capture as shown in Fig. 5.1. Hence,
the normalized F8+ spectrum is subtracted from the F7+ spectrum as shown in the right
panels of Fig. 5.7 and Fig. 5.8(b) so that the counts leftover in the double capture
channel can be attributed to RDEC.
The contamination lines contribute to the single capture channel if a K-shell
electron from a contaminant target atom is captured to the projectile followed by
L→K-shell transition within the contamination atom, producing the corresponding
characteristic Kα line. Hence, the subtraction is performed based on the assumption
that x rays associated with single capture over the RDEC energy domain are
predominantly due to contamination lines from K and Ca over the KL-RDEC range
where there is no other source of x rays other than contaminations except for the
negligible contribution from pileup as indicated in Sec. 5.5. The x rays associated
with double capture over the RDEC energy range originate from contamination lines
and partially from KL-RDEC. No evidence of contamination lines was seen in the
high-energy side of KK-RDEC.
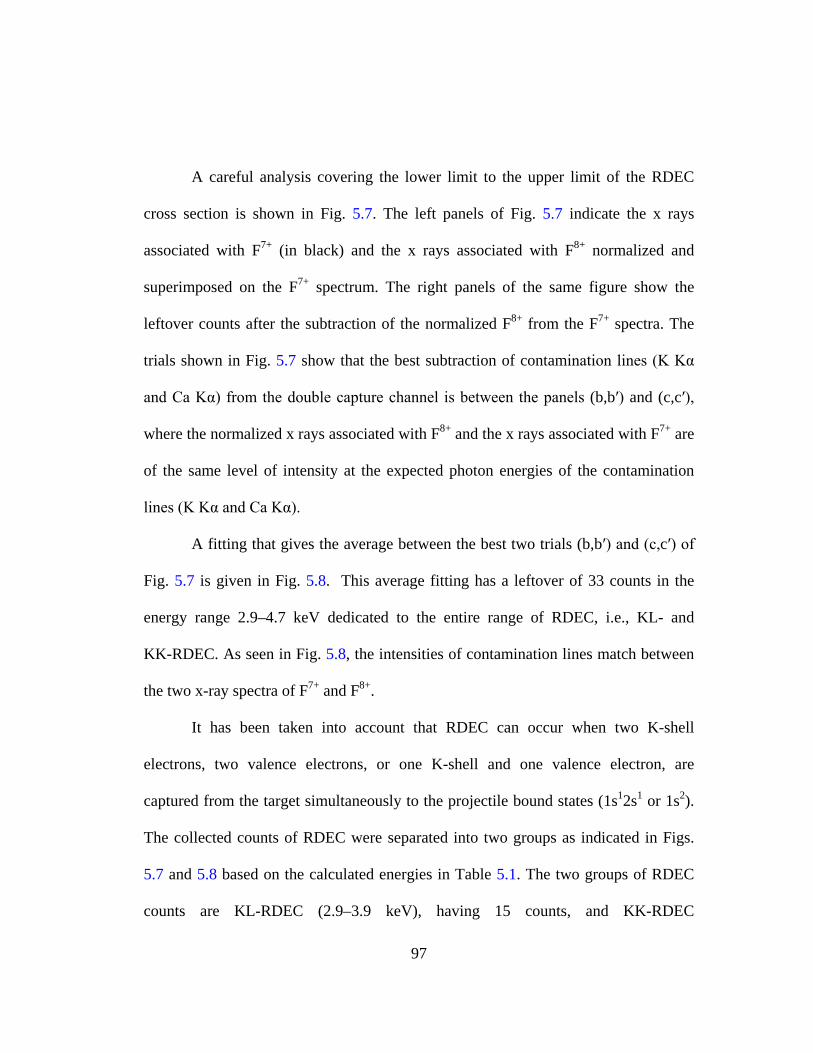
97
A careful analysis covering the lower limit to the upper limit of the RDEC
cross section is shown in Fig. 5.7. The left panels of Fig. 5.7 indicate the x rays
associated with F7+ (in black) and the x rays associated with F8+ normalized and
superimposed on the F7+ spectrum. The right panels of the same figure show the
leftover counts after the subtraction of the normalized F8+ from the F7+ spectra. The
trials shown in Fig. 5.7 show that the best subtraction of contamination lines (K Kα
and Ca Kα) from the double capture channel is between the panels (b,bʹ) and (c,cʹ),
where the normalized x rays associated with F8+ and the x rays associated with F7+ are
of the same level of intensity at the expected photon energies of the contamination
lines (K Kα and Ca Kα).
A fitting that gives the average between the best two trials (b,bʹ) and (c,cʹ) of
Fig. 5.7 is given in Fig. 5.8. This average fitting has a leftover of 33 counts in the
energy range 2.9–4.7 keV dedicated to the entire range of RDEC, i.e., KL- and
KK-RDEC. As seen in Fig. 5.8, the intensities of contamination lines match between
the two x-ray spectra of F7+ and F8+.
It has been taken into account that RDEC can occur when two K-shell
electrons, two valence electrons, or one K-shell and one valence electron, are
captured from the target simultaneously to the projectile bound states (1s12s1 or 1s2).
The collected counts of RDEC were separated into two groups as indicated in Figs.
5.7 and 5.8 based on the calculated energies in Table 5.1. The two groups of RDEC
counts are KL-RDEC (2.9–3.9 keV), having 15 counts, and KK-RDEC
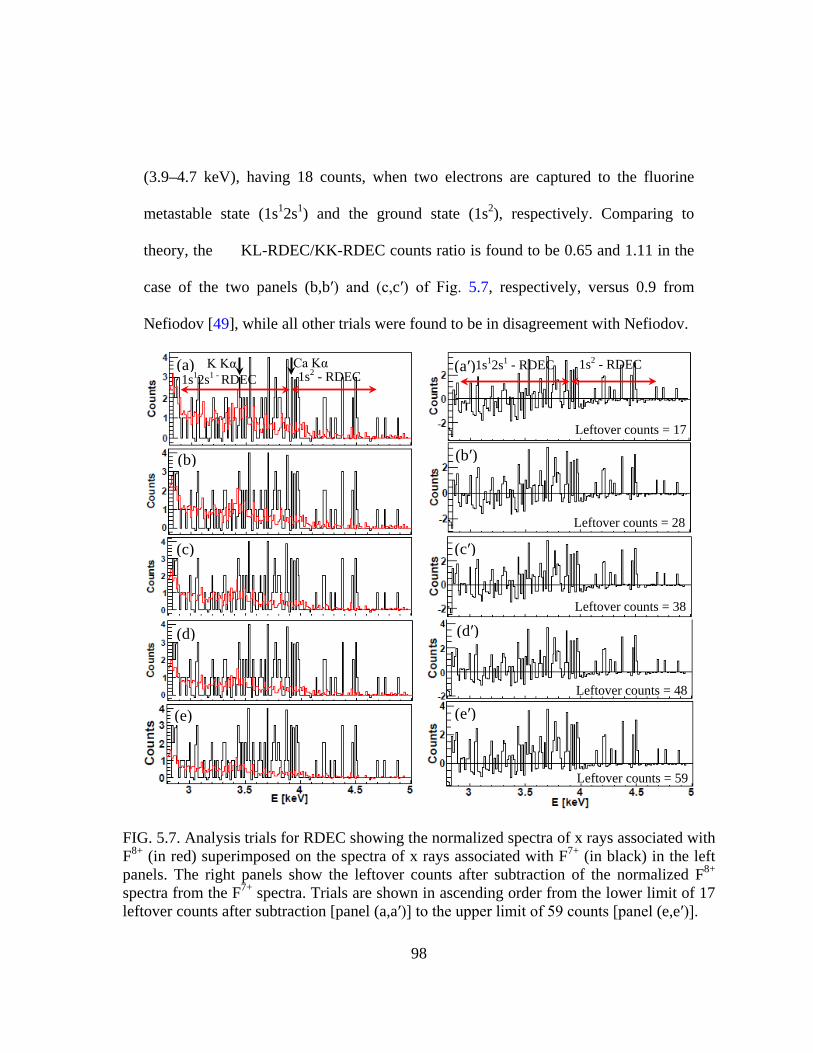
98
(3.9–4.7 keV), having 18 counts, when two electrons are captured to the fluorine
metastable state (1s12s1) and the ground state (1s2), respectively. Comparing to
theory, the KL-RDEC/KK-RDEC counts ratio is found to be 0.65 and 1.11 in the
case of the two panels (b,bʹ) and (c,cʹ) of Fig. 5.7, respectively, versus 0.9 from
Nefiodov [49], while all other trials were found to be in disagreement with Nefiodov.
FIG. 5.7. Analysis trials for RDEC showing the normalized spectra of x rays associated with F8+ (in red) superimposed on the spectra of x rays associated with F7+ (in black) in the left panels. The right panels show the leftover counts after subtraction of the normalized F8+ spectra from the F7+ spectra. Trials are shown in ascending order from the lower limit of 17 leftover counts after subtraction [panel (a,aʹ)] to the upper limit of 59 counts [panel (e,eʹ)].
(cʹ)
(aʹ) Ca Kα 1s12s1 - RDEC 1s2 - RDEC
1s12s1 - RDEC 1s2 - RDEC
Leftover counts = 17
Leftover counts = 28
Leftover counts = 38
Leftover counts = 48
Leftover counts = 59
K Kα
(bʹ) (b)
(a)
(dʹ)
(eʹ)
(c)
(d)
(e)
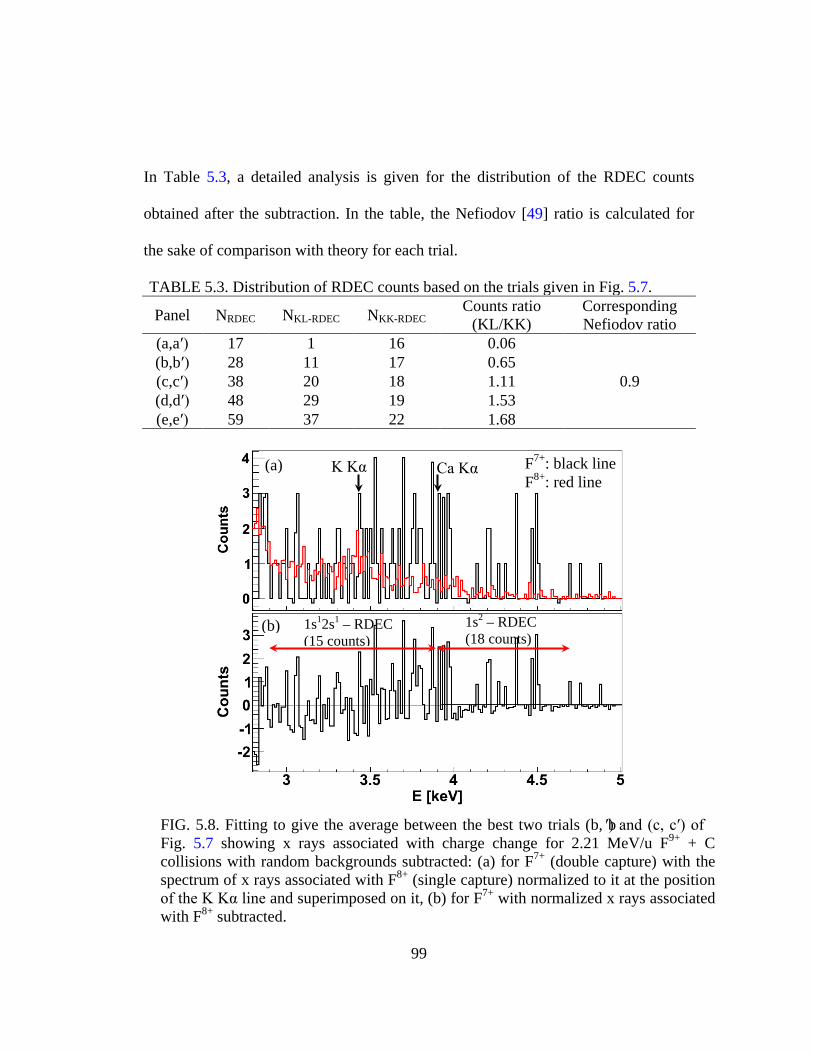
99
In Table 5.3, a detailed analysis is given for the distribution of the RDEC counts
obtained after the subtraction. In the table, the Nefiodov [49] ratio is calculated for
the sake of comparison with theory for each trial.
TABLE 5.3. Distribution of RDEC counts based on the trials given in Fig. 5.7.
Panel NRDEC NKL-RDEC NKK-RDEC Counts ratio (KL/KK)
Corresponding Nefiodov ratio
(a,aʹ) 17 1 16 0.06
0.9 (b,bʹ) 28 11 17 0.65 (c,cʹ) 38 20 18 1.11 (d,dʹ) 48 29 19 1.53 (e,eʹ) 59 37 22 1.68
FIG. 5.8. Fitting to give the average between the best two trials (b, bʹ) and (c, cʹ) of Fig. 5.7 showing x rays associated with charge change for 2.21 MeV/u F9+ + C collisions with random backgrounds subtracted: (a) for F7+ (double capture) with the spectrum of x rays associated with F8+ (single capture) normalized to it at the position of the K Kα line and superimposed on it, (b) for F7+ with normalized x rays associated with F8+ subtracted.
(b)
F7+: black line F8+: red line
1s12s1 – RDEC (15 counts)
1s2 – RDEC (18 counts)
(a) K Kα Ca Kα
100
5.5 Analysis for Background Processes
In ion-atom collisions, several background processes are likely to contribute
to the singles x rays and may overlap with the desired x rays due to REC and RDEC.
In the current analysis, the most significant background processes as possible
mechanisms of x-ray emission are considered [62] to be radiative electron capture to
continuum (RECC), secondary electron bremsstrahlung (SEB), the two-step process
of independent double radiative electron capture (DREC), as well as REC combined
with nonradiative electron capture (NRC).
The current experiment was conducted with a beam of bare fluorine at
a collision energy of 2.21 MeV/u on a thin carbon foil, corresponding to an energy of
1204 eV for a captured target valence electron in the projectile frame. The maximum
photon energy emitted due to QFEB is rT given by Eq. (3.6), which is the kinetic
energy of the captured target electron in the projectile frame, while SEB is
characterized by a range of photon energies up to mT owing to Eq. (3.12), which is
the maximum energy transferred from the projectile to a free electron at rest. The two
characterizing energies rT and mT are found to be 1.2 and 4.8 keV, respectively [62].
The REC and RDEC energy ranges are calculated to be 1.8–2.5 and 2.9–4.7 keV,
respectively, which do not overlap with QFEB (≤1.2 keV), while SEB was found to
be of negligible contribution to x rays [138,139] in the energy range r mT Tω< < for
low-Z targets such as the C target used in the current work., i.e., 1.2–4.8 keV.
101
In the case of high-beam intensities, the rate of the collisions increases,
allowing for an increase in the pileup probability, i.e., the probability to have two ions
emitting REC photons and detected as a single photon of double energy in the single
capture channel. The rate of photons detected for the current measurements was
found to be 4 counts/s as a result of the low beam intensity used of 1< pA. Based on
the total REC cross section and the target thickness values of 525 b/atom and
(7.7± 1.1)×1017 atom/cm2, respectively, the probability of pileup from REC photons
was found to be 1.3×10⁻¹² [62]. Comparing this result to the K-REC probability of
4.1×10⁻⁴, this implies a negligible loss of REC photons due to pileup.
As discussed in Sec 3.2 and Ref [62], it is possible that REC counts appear in
the spectrum of x rays associated with double capture if two target electrons are
captured independently to the same projectile, one radiatively (REC) and the other
nonradiatively (NRC). The probability of having NRC and REC accompanying each
other was found to be 2.1×10⁻⁵ based on a K-REC probability of 4.1×10⁻⁴ and under
the experimental conditions of the current work, which caused 5.2% of the total REC
counts to be associated with double capture [84].
As discussed in Sec. 3.3 and Ref. [62], DREC contributes at the energy region
of REC in the spectrum of x rays associated with double capture (F7+) when two
independent REC photons are emitted due to the separate capture of two target
electrons by the same projectile. Making use of Eq. (3.29), where RECσ is the total
K-REC cross section calculated from Bethe-Salpeter [67], the KK-DREC cross
102
section is found to be 0.0031 b/atom, which corresponds to a probability of 2.4×10⁻⁹
compared to three and six orders of magnitude higher values for the calculated
K-REC and the measured KK-RDEC total cross sections, respectively [61]. Thus, this
represents a negligible contribution of DREC to REC as well as RDEC energy ranges
in the F7+ channel.
5.6 RDEC Cross Sections
5.6.1 Total RDEC Cross Sections
The x-rays counts registered from the gated LGS were found to be 2.3 times
greater than those obtained by summing up all the coincidence spectra within the
RDEC energy range, meaning that about 57% of the x-ray counts were lost and thus
those coincidences are never seen. Based also on the negligible contribution of DREC
to the RDEC energy domain, the measured differential KL-RDEC and KK-RDEC
cross sections for the current system of collision (2.21 MeV/u F9+ + C) were found to
be 0.20 ± 0.12 and 0.23 ± 0.14 b/sr.atom, respectively, for a net differential RDEC
cross section of 0.43 ± 0.26 b/sr.atom. The corresponding total RDEC cross sections
1 11 2s sRDECσ ,
21sRDECσ , and RDECσ are 1.6 ± 1.0, 1.9 ± 1.2, and 3.6 ± 2.1 b/atom, respectively.
For the sake of comparison with the collision system 2.38 MeV/u O8+ + C [54], the
total RDEC cross sections measured for this system were found to be 2.3 ± 1.3,
3.2 ± 1.9, and 5.5 ± 3.2 b/atom for 1 11 2s s
RDECσ , 21s
RDECσ , and RDECσ , respectively, which are
in excellent compatibility with the F9+ results. The total KK-RDEC cross section
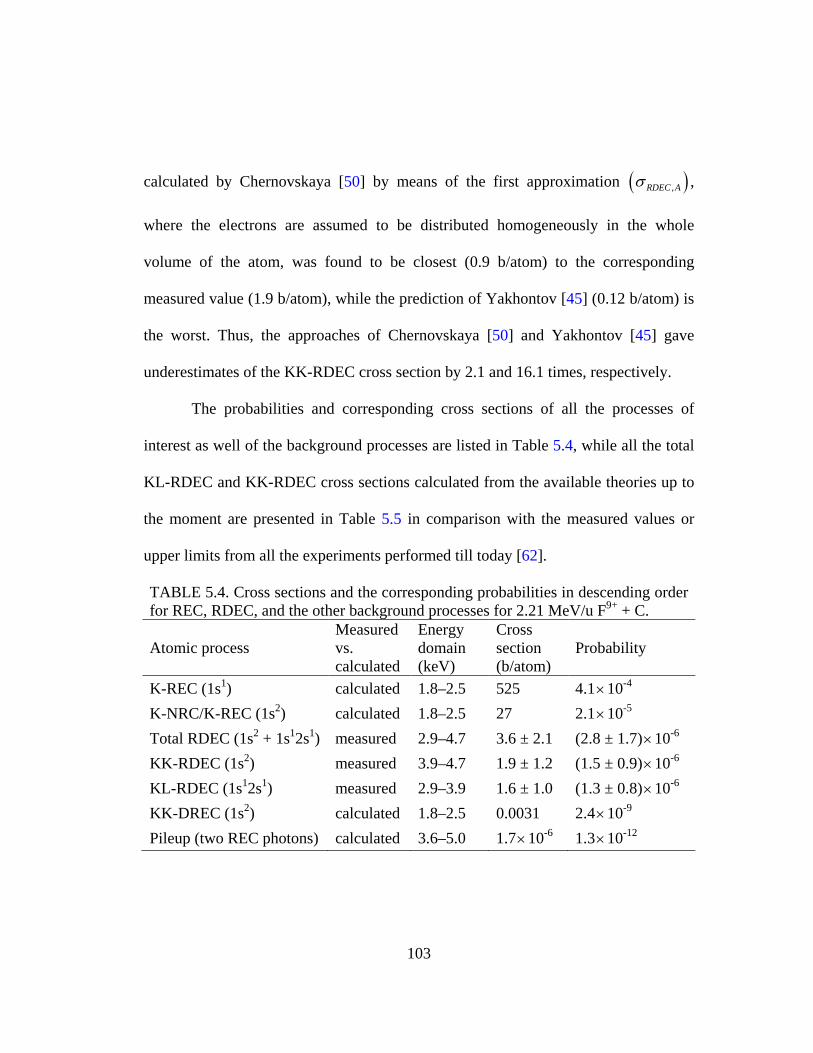
103
calculated by Chernovskaya [50] by means of the first approximation ( ),RDEC Aσ ,
where the electrons are assumed to be distributed homogeneously in the whole
volume of the atom, was found to be closest (0.9 b/atom) to the corresponding
measured value (1.9 b/atom), while the prediction of Yakhontov [45] (0.12 b/atom) is
the worst. Thus, the approaches of Chernovskaya [50] and Yakhontov [45] gave
underestimates of the KK-RDEC cross section by 2.1 and 16.1 times, respectively.
The probabilities and corresponding cross sections of all the processes of
interest as well of the background processes are listed in Table 5.4, while all the total
KL-RDEC and KK-RDEC cross sections calculated from the available theories up to
the moment are presented in Table 5.5 in comparison with the measured values or
upper limits from all the experiments performed till today [62].
TABLE 5.4. Cross sections and the corresponding probabilities in descending order for REC, RDEC, and the other background processes for 2.21 MeV/u F9+ + C.
Atomic process Measured vs. calculated
Energy domain (keV)
Cross section (b/atom)
Probability
K-REC (1s1) calculated 1.8–2.5 525 4.1×10⁻⁴ K-NRC/K-REC (1s2) calculated 1.8–2.5 27 2.1×10⁻⁵ Total RDEC (1s2 + 1s12s1) measured 2.9–4.7 3.6 ± 2.1 (2.8 ± 1.7)×10-6 KK-RDEC (1s2) measured 3.9–4.7 1.9 ± 1.2 (1.5 ± 0.9)×10-6 KL-RDEC (1s12s1) measured 2.9–3.9 1.6 ± 1.0 (1.3 ± 0.8)×10-6 KK-DREC (1s2) calculated 1.8–2.5 0.0031 2.4×10⁻⁹ Pileup (two REC photons) calculated 3.6–5.0 1.7×10⁻⁶ 1.3×10⁻¹²
104
5.6.2 The Ratio 21 1s s
RDEC RECR σ σ=
The KK-RDEC/K-REC cross section ratio 21 1s s
RDEC RECR σ σ= is found to be
0.0037 ± 0.0022, which is a factor of 2.0 smaller than the measured value in the case
of the O8+ experiment and factors of 7.4, 20.6, and 32.2 greater than the values
calculated from Mikhailov [47], the principle of detailed balance [12], and Yakhontov
[45], as given by Eqs. (2.36), (2.37), and (2.41), respectively. The comparison with
the measured O8+ result of R [54] shows good consistency, while the Mikhailov
prediction [47] is in fair agreement with the measured value and Yakhontov [45] is
about 3 times worse. The underestimation of the value given by Mikhailov of 7.6
times is attributed to the assumption in Eq. (2.41) of the capture of only the K-shell
electrons. However, adding the contribution of the KK-RDEC cross section due to the
capture of two valence target electrons (0.19 mb/atom) to the value of the KK-RDEC
cross section due to the capture of two K-shell electrons (221 mb/atom) does not
improve the ratio R, which implies a disagreement of Eq. (2.42) with the current
measurements. The slight difference between the κ values of the two compared
systems was an origin of the disagreement of the Yakhontov prediction [45], where
Eq. (2.37) was used to calculate RF based on RAr=3.6×10⁻⁶. This equation has
a restriction that the two compared systems must have similar or very close
Sommerfeld parameters. The system to which this work is compared has a κ value of
0.84 versus 0.96 for this work. All the cross-section ratios of KK-RDEC/K-REC are
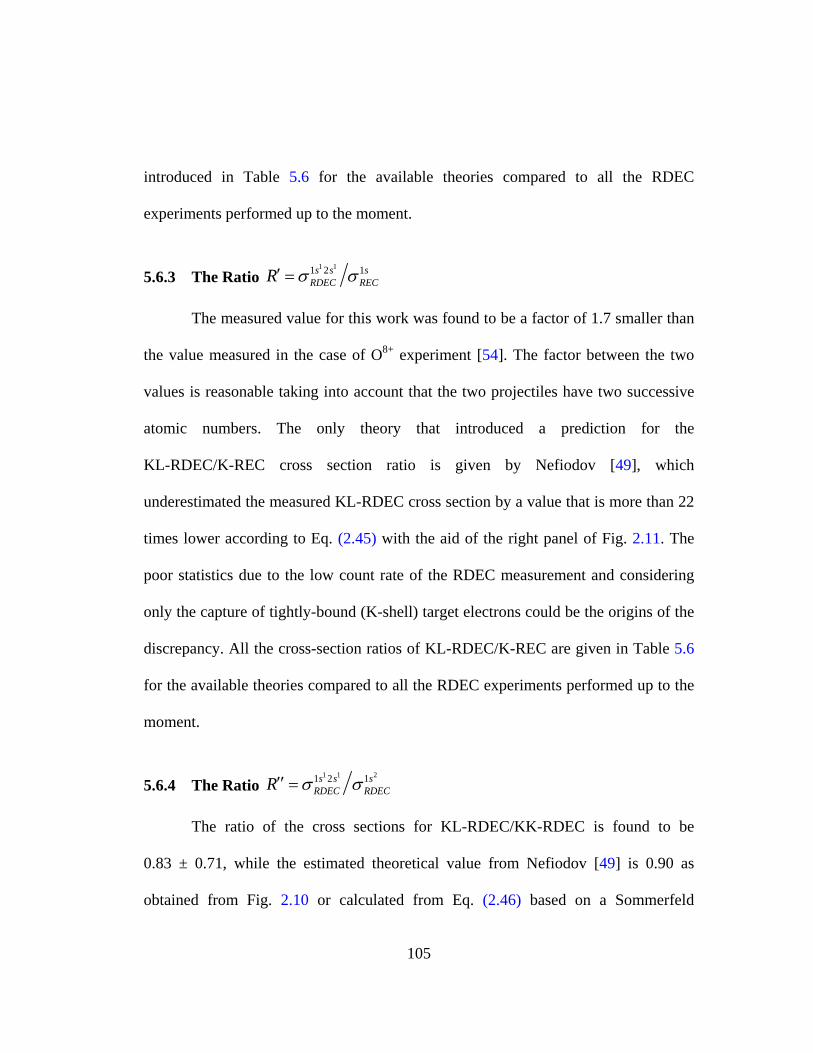
105
introduced in Table 5.6 for the available theories compared to all the RDEC
experiments performed up to the moment.
5.6.3 The Ratio 1 11 2 1s s s
RDEC RECR σ σ′ =
The measured value for this work was found to be a factor of 1.7 smaller than
the value measured in the case of O8+ experiment [54]. The factor between the two
values is reasonable taking into account that the two projectiles have two successive
atomic numbers. The only theory that introduced a prediction for the
KL-RDEC/K-REC cross section ratio is given by Nefiodov [49], which
underestimated the measured KL-RDEC cross section by a value that is more than 22
times lower according to Eq. (2.45) with the aid of the right panel of Fig. 2.11. The
poor statistics due to the low count rate of the RDEC measurement and considering
only the capture of tightly-bound (K-shell) target electrons could be the origins of the
discrepancy. All the cross-section ratios of KL-RDEC/K-REC are given in Table 5.6
for the available theories compared to all the RDEC experiments performed up to the
moment.
5.6.4 The Ratio 1 1 21 2 1s s s
RDEC RDECR σ σ′′ =
The ratio of the cross sections for KL-RDEC/KK-RDEC is found to be
0.83 ± 0.71, while the estimated theoretical value from Nefiodov [49] is 0.90 as
obtained from Fig. 2.10 or calculated from Eq. (2.46) based on a Sommerfeld
106
parameter κ of 0.96. For the sake of comparison, the ratio R′′ in the case of fully-
stripped oxygen at an energy of 2.38 MeV/u [54] was found to be 0.50 ± 0.07
compared to the value of 0.7 from Nefiodov [49] based on κ = 0.82. As seen, the
prediction of Nefiodov [49] for the KL-RDEC/KK-RDEC cross-section ratio as the
only available approach to predict such a ratio is in good agreement with the
corresponding measured ratio. The relatively-small discrepancy between his
prediction and the measured value might be attributed to the poor statistics due to the
low count rate of RDEC measurement. However, Fig. 2.10 predicts that the cross
section of RDEC into the excited state 1s12s1 is enhanced drastically for slow
collisions ( 1κ ) compared to the cross section of RDEC into the projectile K-shell.
This was the motivation for Nefiodov to predict the RDEC cross section into the
projectile excited state 1s12s1 as given by Eq. (2.46). Hence, the theory is expected to
work fine in the domain 1κ versus 0.96κ = for this work, which is very close to
the slow-collision domain, which in turn accounts for this small discrepancy between
the calculated (0.90) and the measured (0.83) values of KL-RDEC/KK-RDEC ratios.
The values obtained for the KL-RDEC/KK-RDEC cross-section ratio are indicated in
Table 5.6 for the available theories compared to all the RDEC experiments conducted
up to the moment.
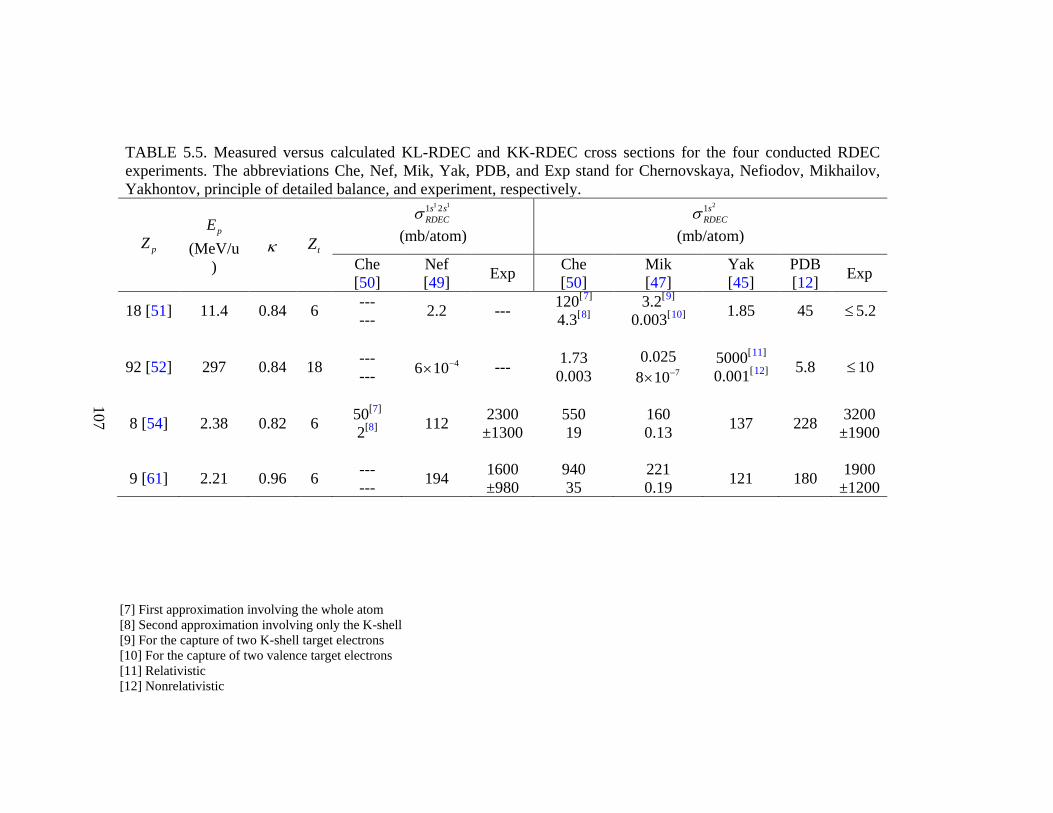
TABLE 5.5. Measured versus calculated KL-RDEC and KK-RDEC cross sections for the four conducted RDEC experiments. The abbreviations Che, Nef, Mik, Yak, PDB, and Exp stand for Chernovskaya, Nefiodov, Mikhailov, Yakhontov, principle of detailed balance, and experiment, respectively.
pZ pE
(MeV/u)
κ tZ
1 11 2s sRDECσ
(mb/atom)
21sRDECσ
(mb/atom)
Che [50]
Nef [49] Exp Che
[50] Mik [47]
Yak [45]
PDB [12] Exp
18 [51]
11.4
0.84
6
--- ---
2.2
---
120[7
4.3[
] 8
]
3.2[9
0.003[
] 10
] 1.85
45
≤5.2
92 [52]
297
0.84
18
--- ---
46 10−×
---
1.73 0.003
0.025 78 10−×
5000[11
0.001[
] 12
] 5.8
≤10
8 [54]
2.38
0.82
6
50[7] 2[8]
112
2300 ±1300
550 19
160 0.13
137
228
3200 ±1900
9 [61] 2.21 0.96 6 --- --- 194 1600
±980 940 35
221 0.19 121 180 1900
±1200
[7] First approximation involving the whole atom [8] Second approximation involving only the K-shell [9] For the capture of two K-shell target electrons [10] For the capture of two valence target electrons [11] Relativistic [12] Nonrelativistic
107
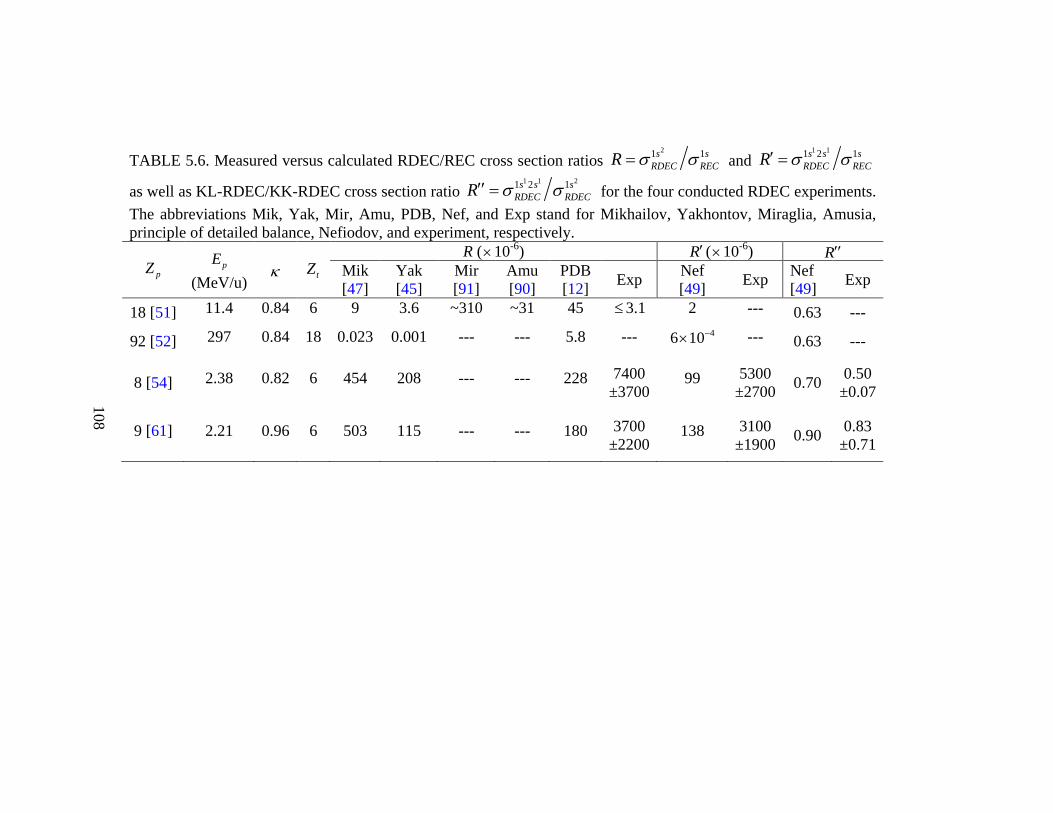
TABLE 5.6. Measured versus calculated RDEC/REC cross section ratios 21 1s s
RDEC RECR σ σ= and 1 11 2 1s s s
RDEC RECR σ σ′ =
as well as KL-RDEC/KK-RDEC cross section ratio 1 1 21 2 1s s s
RDEC RDECR σ σ′′ = for the four conducted RDEC experiments. The abbreviations Mik, Yak, Mir, Amu, PDB, Nef, and Exp stand for Mikhailov, Yakhontov, Miraglia, Amusia, principle of detailed balance, Nefiodov, and experiment, respectively.
pZ pE (MeV/u)
κ tZ R (×10-6) R′ (×10-6) R′′
Mik [47]
Yak [45]
Mir [91]
Amu [90]
PDB [12] Exp Nef
[49] Exp Nef [49] Exp
18 [51] 11.4 0.84 6 9 3.6 ~310 ~31 45 ≤3.1 2 --- 0.63 ---
92 [52] 297 0.84 18 0.023 0.001 --- --- 5.8 --- 46 10−× --- 0.63 ---
8 [54] 2.38 0.82 6 454 208 --- --- 228 7400 ±3700
99 5300 ±2700 0.70 0.50
±0.07
9 [61] 2.21 0.96 6 503 115 --- --- 180 3700 ±2200
138 3100 ±1900 0.90 0.83
±0.71
108
109
CHAPTER VI
CONCLUSION
In the current work, the process of RDEC was observed in collisions of fully-
stripped fluorine ions with a thin carbon foil at a collision energy of 2.21 MeV/u.
Analysis for the C target foil showed evidence for contamination with Si, causing
overlapping between Si Kα line and the structure dedicated to K-REC. The total
number of REC counts corresponding to the Bethe-Salpeter [67] value was found and
utilized to determine how the Si Kα line had to be normalized and then subtracted so
that the counts leftover give the REC cross section obtained from Bethe-Salpeter [67].
The measured RDEC cross sections for this work showed excellent
consistency with the first observation of RDEC for fully-stripped oxygen ions in 2010
[54], as well as fair agreement with the theoretical approach introduced by
Chernovskaya [50]. The measured ratios 21 1s s
RDEC RECR σ σ= and 1 11 2 1s s s
RDEC RECR σ σ′ =
for this work were found to be factors of 2.0 and 1.7, respectively, smaller than the
measured values in the case of the O8+ experiment [54], which can also be considered
good consistency. The predicted value of 21 1s s
RDEC RECR σ σ= by Mikhailov [47] was
found to be in fair agreement with the current measurements, while the value of
1 11 2 1s s sRDEC RECR σ σ′ = predicted by Nefiodov [49] was found to be three times worse.
110
Normalization of REC to the Bethe-Salpeter [67] enabled to obtain 21 1s s
RDEC RECR σ σ=
more in agreement with Mikhailov [47] than with the values calculated from the
principle of detailed balance [12] and Yakhontov [45].
The current work gives a ratio for 1 1 21 2 1s s s
RDEC RDECR σ σ′′ = that is compatible with
the measured value in case of fully-stripped oxygen ions [54] and in fair agreement
with Nefiodov [49]. The main origin of discrepancy between theory and experiment
is attributed to the validity of the theory in only a certain domain of collision energies
as well as to the poor statistics of the collected RDEC counts.
NRC was found to accompany REC as independent processes where two
target electrons are captured to a projectile bound state, one radiatively (REC) and the
other nonradiatively (NRC), which caused about 5.2% of the total REC counts to be
associated with double capture. On the other hand, a crossover of 33.4% of the total
REC counts was found from the single capture channel to the no capture channel,
which was the origin of REC counts in the x rays associated with no capture. The
leftover of 61.4% of the total REC counts had to appear in the single capture channel
as the normal channel of REC. Contributions from all the background processes
including DREC and pileup were found to be negligible.
Foils free of contaminations are preferred to be used in upcoming
experiments, and also more experiments are needed to determine accurately the best
experimental conditions to observe RDEC using different systems of collisions.

111
Clearly, experimental conditions and longer beam times of data collection that yield
better statistics are desirable in order to conclusively test theoretical predictions.
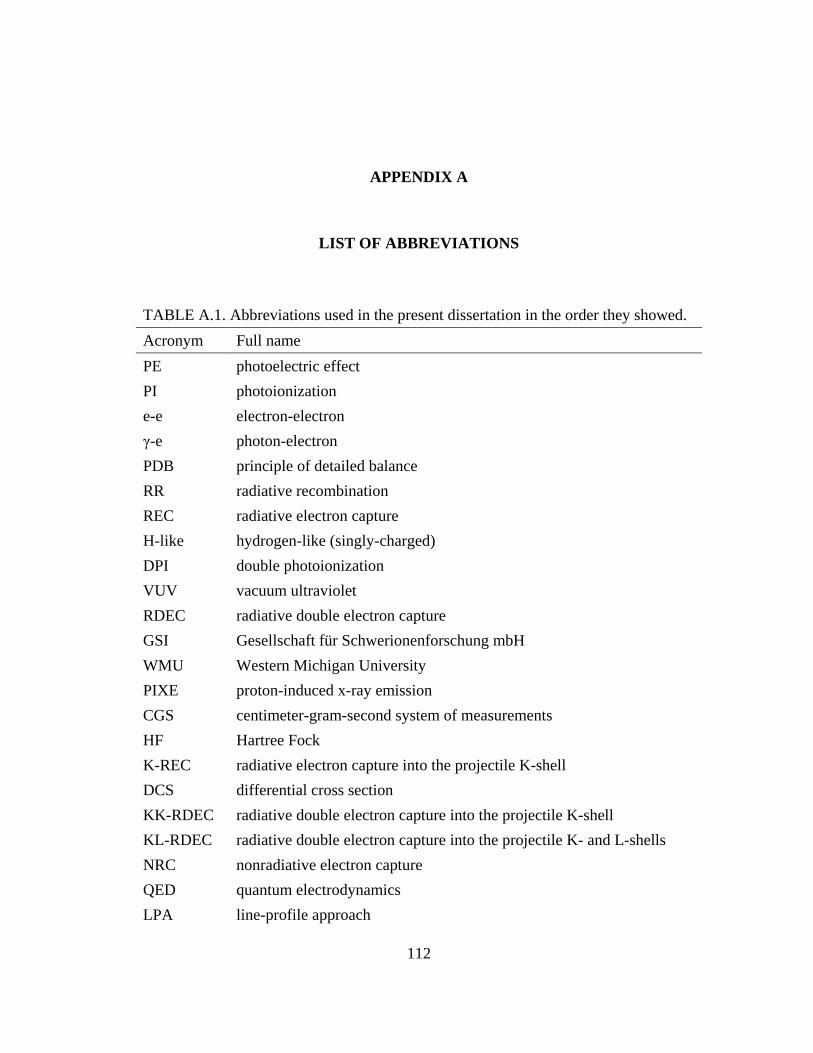
112
APPENDIX A
LIST OF ABBREVIATIONS
TABLE A.1. Abbreviations used in the present dissertation in the order they showed. Acronym Full name PE photoelectric effect PI photoionization e-e electron-electron γ-e photon-electron PDB principle of detailed balance RR radiative recombination REC radiative electron capture H-like hydrogen-like (singly-charged) DPI double photoionization VUV vacuum ultraviolet RDEC radiative double electron capture GSI Gesellschaft für Schwerionenforschung mbH WMU Western Michigan University PIXE proton-induced x-ray emission CGS centimeter-gram-second system of measurements HF Hartree Fock K-REC radiative electron capture into the projectile K-shell DCS differential cross section KK-RDEC radiative double electron capture into the projectile K-shell KL-RDEC radiative double electron capture into the projectile K- and L-shells NRC nonradiative electron capture QED quantum electrodynamics LPA line-profile approach
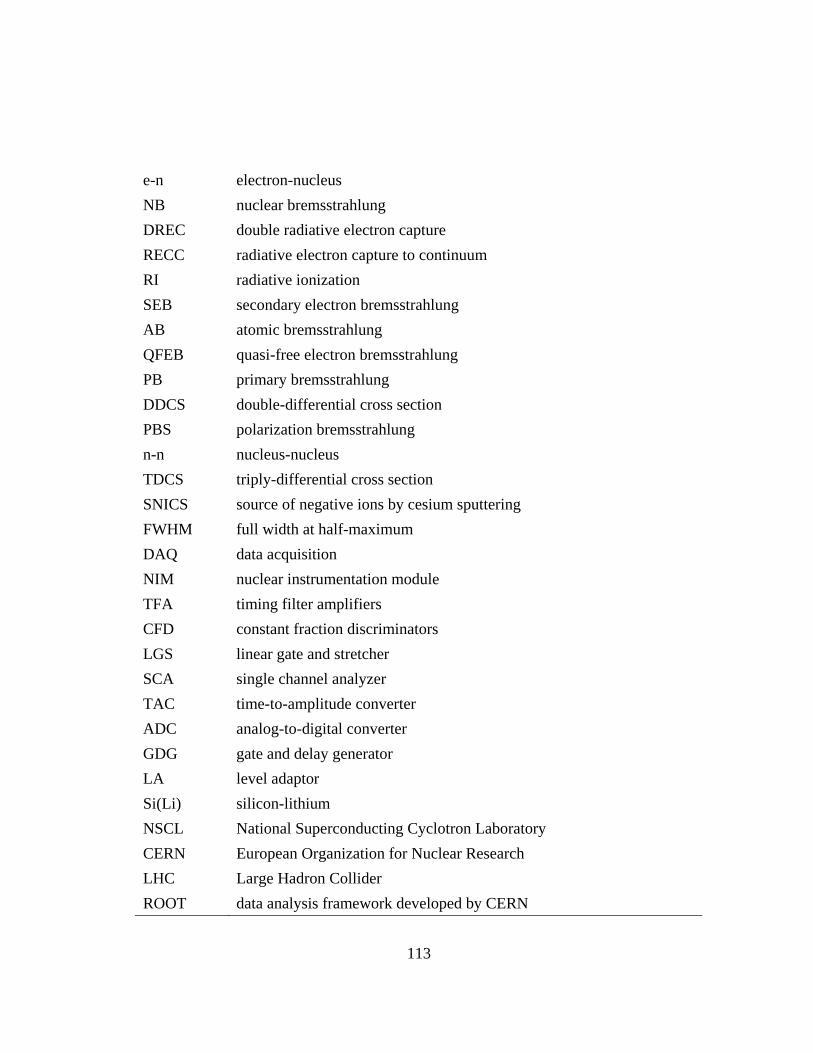
113
e-n electron-nucleus NB nuclear bremsstrahlung DREC double radiative electron capture RECC radiative electron capture to continuum RI radiative ionization SEB secondary electron bremsstrahlung AB atomic bremsstrahlung QFEB quasi-free electron bremsstrahlung PB primary bremsstrahlung DDCS double-differential cross section PBS polarization bremsstrahlung n-n nucleus-nucleus TDCS triply-differential cross section SNICS source of negative ions by cesium sputtering FWHM full width at half-maximum DAQ data acquisition NIM nuclear instrumentation module TFA timing filter amplifiers CFD constant fraction discriminators LGS linear gate and stretcher SCA single channel analyzer TAC time-to-amplitude converter ADC analog-to-digital converter GDG gate and delay generator LA level adaptor Si(Li) silicon-lithium NSCL National Superconducting Cyclotron Laboratory CERN European Organization for Nuclear Research LHC Large Hadron Collider ROOT data analysis framework developed by CERN
114
BIBLIOGRAPHY
[1] H. Hertz, Ann. Phys. 267, 983 (1887).
[2] R. H. Pratt, Akiva Ron, and H. K. Tseng, Rev. Mod. Phys. 45, 273 (1973).
[3] Hughes, Bull. Nat. Res. Coun. 2, 86 (1921).
[4] R. C. Williamson, Phys. Rev. 21, 107 (1923).
[5] D. W. Missavage, S. T. Manson, and G. R. Daum, Phys. Rev. A 15, 1001 (1977).
[6] G. B. Pradhan, J. Jose, P. C. Deshmukh, V. Radojevic, and S. T. Manson, Phys. Rev. A 80, 053416 (2009).
[7] M. S. Pindzola, J. A. Ludlow, and J. Colgan, Phys. Rev. A 81, 063431 (2010).
[8] A. M. Covington, A. Aguilar, I. R. Covington, M. Gharaibeh, C. A. Shirley, R. A. Phaneuf, I. Alvarez, C. Cisneros, G. Hinojosa, J. D. Bozek, I. Dominguez, M. M. Sant'Anna, A. S. Schlachter, N. Berrah, S. N. Nahar, and B. M. McLaughlin, Phys. Rev. Lett. 87, 243002 (2001).
[9] G. A. Alna’washi, M. Lu, M. Habibi, R. A. Phaneuf, A. L. D. Kilcoyne, A. S. Schlachter, C. Cisneros, and B. M. McLaughlin, Phys. Rev. A 81, 053416 (2010).
[10] V. B. Berestetskii, E. M. Lifshitz, L. P. Pitaevskii, Relativistic Quantum Theory, Part 1, Pergamon, Oxford (1971).
[11] L. D. Landau and E. M. Lifszyc, Mechanika kwantowa and Teoria nierelatywistyczna, PWN Warszawa (1979).
[12] H. F. Beyer and V. P. Shevelko, Introduction to the Physics of Highly Charged Ions, IoP Publishing, Boston, Philadelphia (2003).
[13] A. Kramers, Philos. Mag. 46, 836 (1923).
[14] H. W. Schnopper, H. D. Betz, J. P. Delvaille, K. Kalata, A. R. Sohval, K. W. Jones, and H. E. Wegner, Phys. Rev. Lett. 29, 898 (1972).
[15] A. Ichihara, T. Shirai, and J. Eichler, Phys. Rev. A 49, 1875 (1994).
115
[16] R. Shakeshaft, Phys. Rev. A 20, 779 (1979).
[17] H. Tawara, P. Richard, and K. Kawatsura, Phys. Rev. A 26, 154 (1982).
[18] T. Stöhlker, C. Kozhuharov, A. E. Livingston, P. H. Mokler, Z. Stachura, and A. Warczak, Z. Phys. D 23, 121 (1992).
[19] T. Stöhlker, H. Giessel, H. Irnich, T. Kandler, C. Kozhuharov, P. Mokler, G. Muenzenberg, F. Nickel, C. Scheidenberger, T. Suzuki, M. Kucharski, A. War- czak, P. Rymuza, Z. Stachura, A. Kriessbach, and T. Shirai, Phys. Rev. Lett. 73, 3520 (1994).
[20] C. Blancard, Ph. Cosse, G. Faussurier, J.-M. Bizau, D. Cubaynes, N. El Hassan, S. Guilbaud, M. M. Al Shorman, E. Robert, X.-J. Liu, C. Nicolas, and C. Miron, Phys. Rev. A 85, 043408 (2012).
[21] Z. Smit, M. Kregar, and D. Glavic-Cindro, Phys. Rev. A 40, 6303 (1989).
[22] P. Lablanquie, J. H. D. Eland, I. Nenner, P. Morin, J. Delwiche, and M. J. Huhin-Franskin, Phys. Rev. Lett. 58, 992 (1987).
[23] H. Kossmann, V. Schmidt, and T. Andersen, Phys. Rev. Lett. 60, 1266 (1988).
[24] S. D. Price and J. H. D. Eland, J. Phys. B 22, L153 (1989).
[25] S. L. Carter and H. P. Kelly, Phys. Rev. A 24, 170 (1981).
[26] S. N. Tiwary, J. Phys. B 15, L323 (1982).
[27] O. Schwarzkopf, B. Krassig, J. Elminger, and V. Schmidt, Phys. Rev. Lett. 70, 3008 (1993).
[28] N. Berrah, F. Heiser, R. Wehlitz, J. Levin, S. B. Witfield, J. Viefhaus, I. A. Sellin, and U. Becker, Phys. Rev. A 48, R1733 (1993).
[29] J. A. R. Samson, Z.-X. He, Y. Lin, and G. N. Haddad, J. Phys. B 27, 887 (1994).
[30] J. A. R. Samson, W. C. Stolte, Z. X. He, J. N. Cutler, Y. Lu, and R. J. Bartlett, Phys. Rev. A 57, 1906 (1998).
116
[31] G. Turri, L. Avaldi, P. Bolognesi, R. Camilloni, M. Coreno, J. Berakdar, A. S. Kheifets, and G. Stefani, Phys. Rev. A 65, 034702 (2002).
[32] S. L. Carter and H. P. Kelly, Phys. Rev. A 16, 1525 (1977).
[33] N. Saito and I. H. Suzuki, Phys. Scr. 45, 253 (1992).
[34] K.-H. Schartner, G. Mentzel, B. Magel, B. Moebus, A. Ehresmann, F. Vollweiler, and H. Schmoranzer, J. Phys. B 26, L445 (1993).
[35] P. Lablanquie, J. H. D. Eland, I. Nenner, P. Morin, J. Delwiche, and M. -J. Hubin-Franskin, Phys. Rev. Lett. 58, 992 (1987).
[36] H. Le Roum and C. Dal Cappello, Phys. Rev. A 43, 318 (1991).
[37] A. Dalgarno and H. R. Sadeghpour, Comments At. Mol. Phys. 30, 143(1994).
[38] J. Briggs and V. Schmidt, J. Phys. B 33, R1 (2000).
[39] V. A. Yerokhin and A. Surzhykov, Phys. Rev. A 84, 032703 (2011).
[40] A. Huetz, P. Selles, D. Waymel, and J. Mazeau, J. Phys. B 24, 1917 (1991).
[41] D. Chattarji and C. Sur, Phys. Rev. A 65, 012702 (2001).
[42] H. R. Sadeghpour and A. Dalgarno, Phys. Rev. A 47, R2458 (1993).
[43] A. S. Kheifets, Igor Bray, and J. Hoszowska, Phys. Rev. A 79, 042504 (2009).
[44] V. L. Yakhontov and M. Y. Amusia, Phys. Lett. A 221, 328 (1996).
[45] V. L. Yakhontov and M. Y. Amusia, Phys. Rev. A 55, 1952 (1997).
[46] E. G. Drukarev, A. I. Mikhailov, I. A. Mikhailov, and W. Scheid, Phys. Rev. A 76, 062701 (2007).
[47] A. I. Mikhailov, I. A. Mikhailov, A. Nefiodov, G. Plunien, and G. Soff, Phys. Lett. A 328, 350 (2004).
117
[48] A. I. Mikhailov, I. A. Mikhailov, A. N. Moskalev, A. V. Nefiodov, G. Plunien, and G. Soff, Phys. Rev. A 69, 032703 (2004).
[49] A. V. Nefiodov, A. I. Mikhailov, and G. Plunien, Phys. Lett. A 346, 158 (2005).
[50] E. A. Chernovskaya, O. Yu. Andreev, and L. N. Labzowsky, Phys. Rev. A 84, 062515 (2011).
[51] A. Warczak, M. Kucharski, Z. Stachura, H. Giessel, H. Irnich, T. Kandler, C. Kozhuharov, P. Mokler, G. Muenzenberg, F. Nickel, C. Scheidenberger, T. Stöhlker, T. Suzuki, and P. Rymuza, Nucl. Instr. Meth. Phys. Res. B 98, 303 (1995).
[52] G. Bednarz, D. Sierpowski, T. Stöhlker, A. Warczak, H. B. b, F. Bosch, A. Braeuning-Demian, H. Braeuning, X. Cai, A. Gumberidze, S. Hagmann, C. Kozhuharov, D. Liesen, X. Ma, P. Mokler, A. Muthig, Z. Stachura, and S. Toleikis, Nucl. Instr. Meth. Phys. Res. B 205, 573 (2003).
[53] A. Simon, J. A. Tanis, T. Elkafrawy, and A. Warczak, J. Phys.: Conf. Ser. 194, 082044 (2009).
[54] A. Simon, A. Warczak, T. Elkafrawy, and J. A. Tanis, Phys. Rev. Lett. 104, 123001 (2010).
[55] A. Simon, A. Warczak, and J. A. Tanis, AIP Conf. Proc. 1336, 87 (2011).
[56] A. Simon, A. Warczak, and J. A. Tanis, Phys. Scr. T144, 014024 (2011).
[57] A. Simon, J. A. Tanis, T. Elkafrawy, and A. Warczak, J. Phys.: Conf. Ser. 388, 012034 (2012).
[58] T. Elkafrawy, J. A. Tanis, A. Simon, and A. Warczak, Bull. Am. Phys. Soc. 56(5), 182 (2011).
[59] T. Elkafrawy, J. A. Tanis, A. Simon, and A. Warczak, Bull. Am. Phys. Soc. 57(5), 46 (2012).
[60] T. Elkafrawy, A. Warczak, A. Simon, and J. A. Tanis, J. Phys.: Conf. Ser. 388, 082012 (2012).
118
[61] T. Elkafrawy, A. Warczak, A. Simon, and J. A. Tanis, AIP Conf. Proc., accepted in 2012.
[62] T. Elkafrawy, A. Warczak, A. Simon, and J. A. Tanis, Phys. Scr. T, accepted in 2012.
[63] F. Biggs, L. B. Mendelsohn, and J. B. Mann, At. Data Nucl. Data Tables 16, 201 (1975).
[64] P. Kienle, M. Kleber, B. Povh, R. M. Diamond, F. S. Stephens, E. Grosse, M. R. Maier, and D. Proetel, Phys. Rev. Lett. 31, 1099 (1973).
[65] H. W. Schnopper, J. P. Delavaille, K. Kalato, A. R. Sohval, M. Abdulwahab, K. W. Jones, and H. E. Wagner, Phys. Lett. A 47, 61 (1974).
[66] M. Stobbe, Ann. Phys. 7, 661 (1930).
[67] H. A. Bethe and E. E. Salpeter, Handbuch der Physik, edited by S. Flugge, Springer, Berlin Vol. 35, (1957).
[68] D. R. Bates and R. McCarroll, Adv. Phys. 11, 39 (1962).
[69] J. S. Briggs and K. Dettmann, Phys. Rev. Lett. 33, 1123 (1974).
[70] A. R. Sohval, J. P. Delvaille, K. Kalata, K. Kirby-Docken, and H. W. Schnopper, J. Phys. B 9, L25 (1976).
[71] E. Spindler, H. -D. Betz, and F. Bell, Phys. Rev. Lett. 42, 832 (1979).
[72] D. H. Jakubassa-Amundsen, R. Hoppler, and H. -D. Betz, J. Phys. B 17, 3943 (1984).
[73] S. Andriamonje, M. Chevallier, C. Cohen, J. Dural, M. J. Gaillard, R. Genre, M. Hage-Ali, R. Kirsch, A. L’Hoir, D. Mazuy, J. Mory, J. Moulin, J. C. Poizat, J. Remillieux, D. Schmaus, and M. Toulemonde, Phys. Rev. Lett. 59, 2271 (1987).
[74] J. A. Tanis and S. M. Shafroth, Phys. Rev. Lett. 40, 1174 (1978).
[75] E. Spindler, H. -D. Betz, and F. Bell, Phys. Rev. Lett. 42, 832 (1979).
119
[76] J. A. Tanis, W. W. Jacobs, and S. M. Shafroth, Phys. Rev. A 22, 483 (1980).
[77] J. A. Tanis, S. M. Shafroth, J. E. Willis, and J. R. Mowat, Phys. Rev. A 23, 366 (1981).
[78] R. Anholt, S. A. Andriamonje, E. Morenzoni, Ch. Stoller, J. D. Molitoris, W. E. Meyerhof, H. Bowman, J. -S. Xu, Z. -Z. Xu, J. O. Rasmussen, and D. H. H. Hoffmann, Phys. Rev. Lett. 53, 234 (1984).
[79] T. Stöhlker, C. Kozhuharov, P. H. Mokler, A. Warczak, F. Bosch, H. Geissel, R. Moshammer, C. Scheidenberger, J. Eichler, A. Ichihara, T. Shirai, Z. Stachura, and P. Rymuza, Phys. Rev. A 51, 2098 (1995).
[80] M. Kleber and D. H. Jakubassa, Nucl. Phys. A 252, 15242 (1975).
[81] R. Anholt, Ch. Stoller, J. D. Molitoris, D. W. Spooner, E. Morenzoni, S. A. Andriamonje, W. E. Meyerhof, H. Bowman, J. -S. Xu, Z. -Z. Xu, J. O. Rasmussen, and D. H. H. Hoffmann, Phys. Rev. A 33, 2270 (1986).
[82] J. C. Slater, Quantum Theory of Atomic Structure, McGraw–Hill, New York Vol. I (1960).
[83] D. J. McLaughlin and Y. Hahn, Phys. Rev. A 43, 1313 (1991).
[84] T. Stöhlker, T. Ludziejewski, H. Reich, F. Bosch, R. W. Dunford, J. Eichler, B. Franzke, C. Kozhuharov, G. Menze, P. H. Mokler, F. Nolden, P. Rymuza, Z. Stachura, M. Steck, P. Swiat, A. Warczak, and T. Winkler, Phys. Rev. A 58, 2043 (1998).
[85] A. Gojska, D. Chmielewska, P. Rymuza, J. Rzadkiewicz, Z. Sujkowski, T. Adachi, H. Fujita, Y. Fujita, Y. Shimbara, K. Hara, Y. Shimizu, H. P. Yoshida, Y. Haruyama, J. Kamiya, H. Ogawa, M. Saito, and M. Tanaka, Eur. Phys. J. A 27, s01, 181 (2006).
[86] H. Tawara, T. Azuma, T. Ito, K. Komaki, Y. Yamazaki, T. Matsuo, T. Tonuma, K. Shima, A. Kitagawa, and E. Takada, Phys. Rev. A 55, 808 (1997).
[87] R. Schule, H. Schmidt-Bocking, and I. Tserruya, J. Phys. B 10, 889 (1977).
120
[88] J. Eichler, A. Ichihara, and T. Shirai, Phys. Rev. A 51, 3027 (1995).
[89] K. Hino and T. Watanabe, Phys. Rev. A 36, 5862 (1987).
[90] M. Ya. Amusia, E. G. Drukarev, V. G. Gorshkov, and M. O. Kazachkov, J. Phys. B 8, 1248 (1975).
[91] J. E. Miraglia and M. S. Gravielle, XVI ICPEAC, Brighton, Book of Abstracts, pp. 517 (1987).
[92] Wm. J. Veigele, At. Data Nucl. Data Tables 5, 51 (1973).
[93] K. Zaharakis, R. L. Watson, and V. Horvat, at Texas A&M (2001), unpublished.
[94] N. Winters, A. Warczak, J. A. Tanis, A. Gumberidze, C. Kozhuharov, S. Hagmann, P. M. Hillenbrand, N. Petridis, R. Reuschl, M. Schwemlein, R. Strzalka, D. Sierpowski, U. Spillmann, S. Trotsenko, G. Weber, D. F. A. Winters, Z. Yin, and T. Stöhlker, HCI Conference Book of Abstracts, pp. A-b33 (2012).
[95] A. I. Akhiezer and V. B. Berestetskii, Quantum Electrodynamics, Wiley, New York, (1974).
[96] S. A. Boman, E. M. Bernstein, and J. A. Tanis, Phys. Rev. A 39, 4423 (1989).
[97] J. A. Tanis, E. M. Bernstein, M. W. Clark, S. M. Ferguson, and R. N. Price, Phys. Rev. A 43, 4723 (1991).
[98] O. Yu. Andreev, L. N. Labzowsky, G. Plunien, and D. A. Solovyev, Phys. Rep. 455, 135 (2008).
[99] M. Komma and W. Nakel, J. Phys. B 15, 1433 (1982).
[100] F. Folkmann, K. O. Groeneveld, R. Mann, G. Nolte, S. Schumann, and R. Spohr, Z. Phys. A 275, 229 (1975).
[101] H. W. Koch and J. W. Motz, Rev. Mod. Phys. 31, 920 (1959).

121
[102] E. Haug and W. Nakel, “The Elementary process of bremsstrahlung”, World Scientific Lecture Notes in Physics Vol. 73, (2004).
[103] W. C. Roentgen, Nature 53, 274 (1896).
[104] F. Folkmann, C. Gaarde, T. Huus, and K. Kemp, Nucl. Instr. Meth. 116, 487 (1974).
[105] F. Folkmann, K. Cramon, and N. Hertel, Nucl. Instr. Meth. Phys. Res. B 3, 11 (1984).
[106] K. W. Rothe, P. F. M. Koehler, and E. H. Thorndike, Phys. Rev. Lett. 16, 1118 (1966).
[107] H. A. Bethe and W. Heitler, Proc. R. Soc. (London) Ser. A 146, 83 (1934).
[108] W. Duane and F. L. Hunt, Phys. Rev. 6, 166 (1915).
[109] H. A. Kramers, Phil. Mag. 46, 836 (1923).
[110] C. T. Ulrey, Phys. Rev. 11, 401 (1918).
[111] D. Jakubassa-Amundsen, J. Phys. B 16, 1767 (1983).
[112] D. Jakubassa-Amundsen, J. Phys. B 20, 325 (1987).
[113] G. Bednarz, A. Warczak, H. Tawara, T. Azuma, K. Komaki, and E. Takada, Eur. Phys. J. D 4, 271 (1998).
[114] D. Jakubassa-Amundsen, J. Phys. B 36, 1971 (2003).
[115] D. Jakubassa-Amundsen, Rad. Phys. Chem. 75, 1319 (2006).
[116] D. Jakubassa-Amundsen, Eur. Phys. J. D 41, 267 (2007).
[117] M. Nofal, S. Hagmann, T. Stöhlker, D. H. Jakubassa-Amundsen, Ch. Kozhuharov, X. Wang, A. Gumberidze, U. Spillmann, R. Reuschl, S. Hess, S. Trotsenko, D. Banas, F. Bosch, D. Liesen, R. Moshammer, J. Ullrich, R.
122
Dorner, M. Steck, F. Nolden, P. Beller, H. Rothard, K. Beckert, and B. Franczak, Phys. Rev. Lett. 99, 163201 (2007).
[118] R. Anholt and T. K. Saylor, Phys. Lett. A 56, 455 (1976).
[119 ] K. Ishii, Rad. Phys. Chem. 75, 1135 (2006).
[120] K. Ishii, S. Morita, and H. Tawara, Phys. Rev. A 13, 131 (1976).
[121] M. Ya. Amusia, Comments At. Mol. Phys. 11, 123 (1982).
[122] K. Ishii and S. Morita, Phys. Rev. A 30, 2278 (1984).
[123] R. Anholt and H. Gould, Adv. At. Mol. Phys. 22, 315 (1986).
[124] C. R. Vane, S. Datz, P. F. Dittner, J. Giese, N. L. Jones, H. F. Krause, T. M. Rosseel, and R. S. Peterson, Phys. Rev. A 49, 147 (1994).
[125] A. Yamadera, K. Ishii, K. Sera, M. Sebata, and S. Morita, Phys. Rev. A 23, 24 (1981).
[126] T. C. Chu, K. Ishii, A. Yamadera, M. Sebata, and S. Morita, Phys. Rev. A 24, 1720 (1981).
[127] P. Kienle, M. Kleber, B. Povh, R. M. Diamond, F. S. Stephens, E. Grosse, M. R. Maier, and D. Proetel, Phys. Rev. Lett. 31, 1099 (1973).
[128] H. W. Schnopper, J. P. Delvaille, K. Kalata, A. R. Sohval, M. Abdulwahab, K. W. Jones, and H. E. Wegner, Phys. Lett. A 47, 61 (1974).
[129] K. Ishii and S. Morita, Nucl. Instr. Meth. Phys. Res. B 22, 68 (1987).
[130] K. Dettmann, K. G. Harrison, and M. W. Lucas, J. Phys. B 7, 269 (1974).
[131] R. Shakeshaft and L. Spruch, Rev. Mod. Phys. 51, 369 (1979).
[132] A. Salin, J. Phys. B 2, 631 (1969).
[133] G. B. Crooks and M. E. Rudd, Phys. Rev. Lett. 25, 1599 (1970).
123
[134] J. Macek, Phys. Rev. A 1, 235 (1970).
[135] Y. Ning, B. He, C. L. Liu, J. Yan, and J. G. Wang, Phys. Rev. A 72, 022702 (2005).
[136] E. Merzbacher and H. W. Lewis, In: S. Flugge, (Ed.), Ecyclopedia of Physics, Springer, Berlin Vol. 34, 166 (1958).
[137] M. Inukoti, Rev. Mod. Phys. 43, 297 (1971).
[138] H. Tawara, T. Azuma, T. Ito, K. Komaki, Y. Yamazaki, T. Matsuo, T. Tonuma, K. Shima, A. Kitagawa, and E. Takada, Phys. Rev. A 55, 808 (1997).
[139] T. Azuma, T. Ito, K. Komaki, H. Tawara, T. Matsuo, T. Tonuma, K. Murakami, and A. Warczak, Phys. Scr. T73, 250 (1997).
[140] K. Ishii, M. Kamiya, K. Sera, S. Morita, and H. Tawara, Phys. Rev. A 15, 2126 (1976).
[141] K. Ishii, Nucl. Instr. Meth. Phys. Res. B 99, 163 (1995).
[142] E. V. Gnatchenko, A. N. Nechay, V. N. Samovarov, and A. A. Tkachenko, Phys. Rev. A 82, 012702 (2010).
[143] V. M. Buimistrov and L. I. Trakhtenberg, Sov. Phys.-JETP 42, 55 (1975).
[144] M. Ya. Amusia, A. S. Baltenkov, A. A. Paiziev, Sov. Phys.-JETP Lett. 24, 332 (1976).
[145] M. S. Pindzola and H. P. Kelly, Phys. Rev. A 14, 204 (1976).
[146] B. A. Zon, Sov. Phys.-JETP 46, 65 (1977).
[147] G. Wendin and K. Nuroh, Phys. Rev. Lett. 39, 48 (1977).
[148] M. C. Pacher and J. E. Miraglia, Phys. Rev. A 41, 2574 (1990).
[149] K. Ishii and S. Morita, Phys. Rev. A 30, 2278 (1984).
124
[150] K. Alder, A. Bohr, T. Huus, B. Mottelson, and A. Winther, Rev. Mod. Phys. 28, 432 (1956).
[151] D. H. Jakubassa and M. Kleber, Z. Phys. A 273, 29 (1975).
[152] H. P. Trautvetter, J. S. Greenberg, and P. Vincent, Phys. Rev. Lett. 37, 202 (1976).
[153] S. Jeon, J. Kapusta, A. Chikanian, and J. Sandweiss, Phys. Rev. C 58, 1666 (1999).
[154] W. Heitler, The Quantum Theory of Radiation, Clarendon, Oxford (1954).
[155] K. Ishii and S. Morita, Phys. Rev. A 30, 2278 (1984).
[156] K. Ishii, T. Satoh, S. Matsuyama, H. Yamazaki, Y. Tokai, A. Sugimoto, K. Yamamoto, Int. J. PIXE 9, 1 (1999).
[157] J. W. Motz, Phys. Rev. 100, 1560 (1955).
[158] D. H. Rester, Nucl. Phys. A 118, 129 (1968).
[159] E. Haug, Phys. Lett. A 54, 339 (1975).
[160] W. Nakel and E. Pankau, Phys. Lett. A 38, 307 (1972).
[161] W. Nakel and E. Pankau, Phys. Lett. A 44, 65 (1973).
[162] O. Scherzer, Ann. Phys. (Leipzig) 13, 137 (1932).
[163] I. Hodes, Ph.D. Thesis, University of Chicago (1953), unpublished.
[164] W. Nakel, Phys. Lett. 22, 614 (1966).
[165] W. Nakel, Phys. Lett. A 25, 569 (1967).
[166] W. Nakel, Z. Physik A 214, 168 (1968).
[167] E. Haug and M. Keppler, J. Phys. B 17, 2075 (1984).
125
[168] M. Komma and W. Nakel, J. Phys. B 15, 1433 (1982).
[169] L. H. Lanzl and A. O. Hanson, Phys. Rev. 83, 959 (1951).
[170] J. Eichler and T. Stöhlker, Phys. Rep. 439, 1 (2007).
[171] A. S. Schlachter, J. W. Stearns, W. G. Graham, K. H. Berkner, R. V. Pyle, and J. A. Tanis, Phys. Rev. A 27, 3372 (1983).
[172] W. E. Meyerhof, Phys. Rev. A 32, 3291 (1985).
[173] J. H. McGuire and L. Weaver, Phys. Rev. A 16, 41 (1977).
[174] P. Gombas, Statistische Theorie des Atoms, Springer, Wien (1949).
[175] G. Bednarz, D. Sierpowski, T. Stöhlker, A. Warczak, H. Beyer, F. Bosch, A. Brauning-Demian, H. Brauning, X. Cai, A. Gumberidze, S. Hagmann, C. Kozhuharov, D. Liesen, X. Ma, P. H. Mokler, A. Muthig, Z. Stachura, S. Toleikis, Nucl. Instr. Meth. Phys. Res. B 205, 573 (2003).
[176] E. B. Saloman, J. H. Hubbell, and J. H. Scofield, At. Data Nucl. Data Tables 38, 1 (1988).
[177] R. J. Van de Graaff, J. G. Trump, and W. W. Buechner, Rep. Prog. Phys. 11, 1 (1948).
[178] R. J. Van de Graaff, Phys. Rev. 38, 1919 (1931).
[179] Particle Accelerator Physics I: Basic Principles and Linear Beam Dynamics, H. Wiedermann, Springer, Verlag, Berlin (1999), ISBN 3540565507.
[180] D. A. Edwards and M. J. Syphers, An introduction to the physics of high energy accelerators, Wiley series in beam physics and accelerator technology (1993), ISBN 0471551635.
[181] http://tesla.physics.wmich.edu/acceleratorlab/pic/accelerator/Accelerator_map.jpg
[182] http://tesla.physics.wmich.edu/ResearchFacilities.php?PG=1&SC=1
126
[183] W. H. Trzaska, V. Lyapin, T. Alanko, M. Mutterer, J. Raisanen, G. Tjurin, and M. Wojdyr, Nucl. Inst. Meth. Phys. Res. B 195, 147 (2002).
[184] SRIM, http://www.srim.org/
[185] ORTEC, www.ortec-online.com/download/SLP.pdf
[186] ORTEC, http://www.ortec-online.com/download/Overview-of-Semiconductor-Photon-Detectors.pdf
[187] ORTEC, http://www.ortec-online.com/download/ULTRA.pdf
[188] ORTEC, http://www.ortec-online.com/Solutions/RadiationDetectors/si-charged-particle-detectors-data-summary-selection-chart.aspx
[189] http://www-esd.fnal.gov/esd/catalog/main/egg/ad811-spec.htm
[190] NSCL, http://docs.nscl.msu.edu/daq/spectcl/
[191] http://spectcl.sourceforge.net/
[192] ROOT data analysis framework developed by CERN, http://root.cern.ch/drupal/
[193] http://na49info.web.cern.ch/na49info/
[194] R. L. Kauffman, J. H. McGuire, and P. Richard, Phys. Rev. A 8, 1233 (1973).
[195] J. McWherter, D. K. Olsen, H. H. Wolter, and C. Fred Moore, Phys. Rev. A 10, 200 (1974).
[196] http://physics.nist.gov
[197] Handbook of Chemistry & Physics, ed. 72nd. http://www.hbcpnetbase.com/.