Embed Size (px)
Citation preview
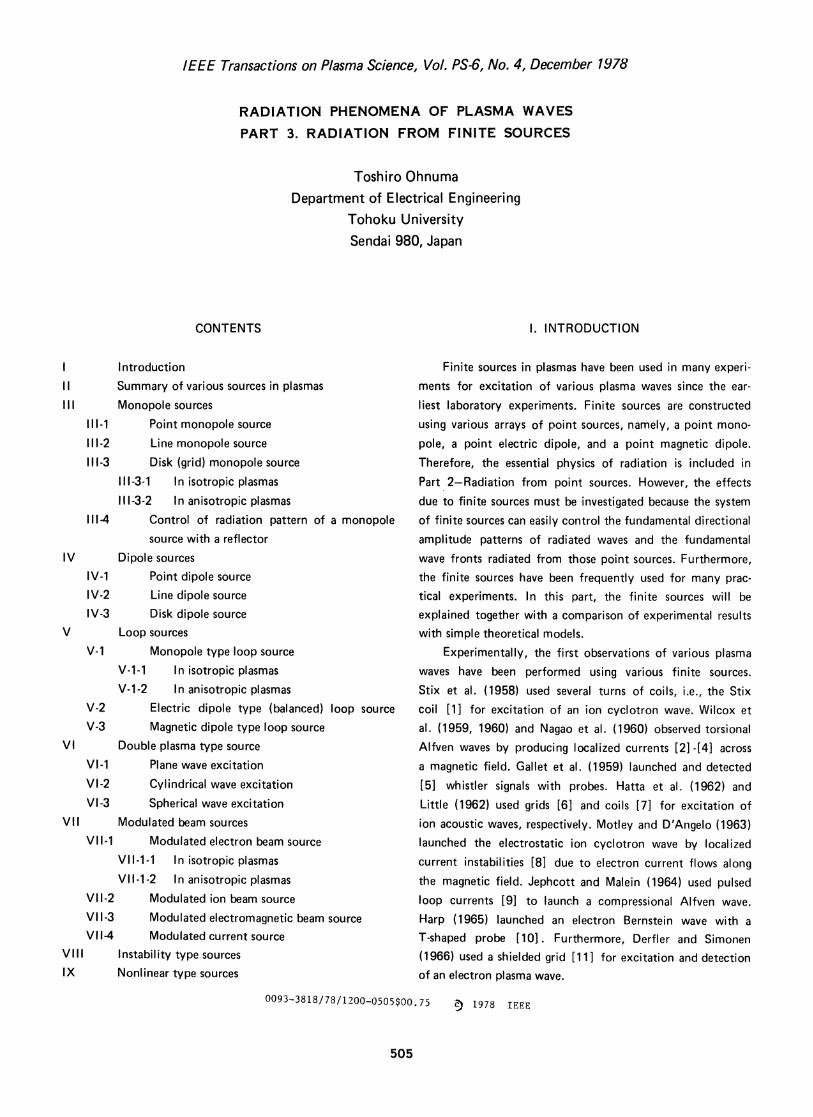
IEEE Transactions on Plasma Science, Vol. PS-6, No. 4, December 1971
RADIATION PHENOMENA OF PLASMA WAVESPART 3. RADIATION FROM FINITE SOURCES
Toshiro OhnumaDepartment of Electrical Engineering
Tohoku UniversitySendai 980, Japan
CONTENTS 1. INTRODUCTION
I IIntroduction11 Summary of various sources in plasmasIII Monopole sources
Il1-1 Point monopole source
111-2 Line monopole source111-3 Disk (grid) monopole source
111-3-1 In isotropic plasmas111-3-2 In anisotropic plasmas
111-4 Control of radiation pattern of a monopolesource with a reflector
IV Dipole sourcesIV-1 Point dipole sourceIV-2 Line dipole sourceIV-3 Disk dipole source
V Loop sourcesV-1 Monopole type loop source
V-1-1 In isotropic plasmasV-1-2 In anisotropic plasmas
V-2 Electric dipole type (balanced) loop sourceV-3 Magnetic dipole type loop source
VI Double plasma type sourceVI-1 Plane wave excitationVI-2 Cylindrical wave excitationVI-3 Spherical wave excitation
VII Modulated beam sourcesVII-1 Modulated electron beam source
VII-1-1 In isotropic plasmasVII-1-2 In anisotropic plasmas
VI 1-2 Modulated ion beam sourceVI 1-3 Modulated electromagnetic beam sourceVI 1-4 Modulated current source
VIII Instability type sourcesIX Nonlinear type sources
Finite sources in plasmas have been used in many experi-ments for excitation of various plasma waves since the ear-
liest laboratory experiments. Finite sources are constructedusing various arrays of point sources, namely, a point mono-
pole, a point electric dipole, and a point magnetic dipole.Therefore, the essential physics of radiation is included inPart 2-Radiation from point sources. However, the effectsdue to finite sources must be investigated because the systemof finite sources can easily control the fundamental directionalamplitude patterns of radiated waves and the fundamentalwave fronts radiated from those point sources. Furthermore,the finite sources have been frequently used for many prac-tical experiments. In this part, the finite sources will beexplained together with a comparison of experimental resultswith simple theoretical models.
Experimentally, the first observations of various plasmawaves have been performed using various finite sources.Stix et al. (1958) used several turns of coils, i.e., the Stixcoil [1] for excitation of an ion cyclotron wave. Wilcox etal. (1959, 1960) and Nagao et al. (1960) observed torsionalAlfven waves by producing localized currents [2]-[4] acrossa magnetic field. Gallet et al. (1959) launched and detected[5] whistler signals with probes. Hatta et al. (1962) andLittle (1962) used grids [6] and coils [7] for excitation ofion acoustic waves, respectively. Motley and D'Angelo (1963)launched the electrostatic ion cyclotron wave by localizedcurrent instabilities [8] due to electron current flows alongthe magnetic field. Jephcott and Malein (1964) used pulsedloop currents [9] to launch a compressional Alfven wave.Harp (1965) launched an electron Bernstein wave with aT-shaped probe [10] . Furthermore, Derfler and Simonen(1966) used a shielded grid [11] for excitation and detectionof an electron plasma wave.
0093-3818/78/1200-0505$00.75 c- 1978 IEEE
505
As for the observation of radiation patterns of plasmawaves, Shen et al. (1970) reported for the first time radia-tion [12] of ion acoustic waves from a disk plate. Since theirreport, radiation patterns of various plasma waves fromcircular grids, dipoles, and loops in isotropic plasmas havebeen investigated by many authors [13]-[16]. Furthermore,radiation patterns of ion acoustic waves have been controlledwith the use of a reflector [17] . In anisotropic plasmas,lower hybrid waves have been launched with the use of a ringloop [18] by Briggs et al. (1972) and multi rings [19] byBelan and Porkolab (1975). Furthermore, radiation from aring loop by Gekelman et al. [20] (1975), Colestock et al.[21] (1976) and by Ohnuma (1977, Sec. V-1-2) has been re-ported with respect to the resonance cone. Radiation from acircular grid in an isotropic plasma has also been investigatedby Ohnuma (1977, Sec. 111-3-2). Typical data will be presentedin detail in the following sections.
In the 1970's, Taylor et al. (1970) developed a doubleplasma method [22] for large amplitude ion wave excitation.Alexeff and co-workers (1972) investigated in detail the ionwave excitation from a grid [23] in relation to the pseudowave. Schmidt (1973) launched pure ion Bernstein waveswith a long monopole source [24] along a magnetic field.Ohnuma et al. (1973) launched ion acoustic waves withmodulated sheet ion beams [25]. Furthermore, by usingmodulated thin electron beams, Ohnuma et al. excited theelectron plasma wave [26] (1974), the electron Bernsteinwave [27] (1975), the ion acoustic wave [28] in anisotropicplasmas and the ion Bernstein wave (Sec. VII-1-2). Modulatedelectromagnetic beams [29] have been used by Yamamotoet al. to launch the ion acoustic wave. During those investiga-tions, nonlinear phenomena and instabilities in plasmas havebeen investigated in detail by many authors [30]-[34].The various nonlinearities and instabilities in plasmas can
be used for excitation of plasma waves. In addition to theradiation problems, reception characterisitcs of plasma waveshave also been investigated by many authors [16],[35]-[38].Because the reception characteristics are very similar to
the radiation characteristics due to the reciprocity theorem,the author does not further discuss characteristics in thisreport.
II. SUMMARY OF VARIOUS SOURCES IN PLASMAS
The excitation of plasma waves is essentially classifiedinto two fundamental methods; 1) An electrostatic excitationand 2) An electromagnetic excitation. Many various typesof sources for the fundamental methods have been investi-gated up to the present. These can be classified as follows:
A. Monopole sources
1. Point monopole source2. Line monopole source3. Plate (disk) monopole source4. Grid monopole source
B. Dipole sources1. Point dipole source2. Line dipole source3. Plate dipole source4. Grid dipole source
C. Loop sou rces1. Monopole-type loop source2. Electric dipole-type loop source3. Magnetic dipole-type loop source
D. Double plasma-type sources1. For plane wave excitation2. For cylindrical wave excitation3. For spherical wave excitation
E. Modulated beam sources1. Modulated electron beam source2. Modulated ion beam source3. Modulated electromagnetic beam source4. Modulated current source
F. Instability-type sourcesG. Nonlinear-type sources
Those various sources will be presented in the followingsections with many experimental examples.
111. MONOPOLE SOURCES
The point monopole, the line monopole, and the diskor grid monopole source have been used as monopole excitersfor plasma waves. The essential behavior can be easily inter-preted in isotropic plasmas, in which they are investigated.Therefore, the effects of the finite monopoles will be explain-ed mainly in isotropic plasmas with an additional presentationfor anisotropic plasmas. In such isotropic plasmas, the fieldsof plasma waves have been following form as shown in Eqs.1-(19)(23) of Part 1 of this series;
) ex(ir eikl ir )AOr) V,I r iIi'I dV', (1)
wnere Pex(Ir') is the external charge distributions. For finitesize problems, various charge distributions are introduced into
pex(r').
I1-1. Point monopole sourceThe behavior for point sources has been presented in
detail in isotropic and anisotropic plasmas in Part 2-Radiation
506
from point sources. Therefore, the explanation on point
sources will be neglected in this section.
111-2. Line monopole source
As the simplest finite source, a line source with a lengthI can be considered [39]. For this charge distribution, the farfield of the plasma waves radiated from the line source can beobtained easily from Eq. 1 as follows:
(R P1sink1sin 2 ( Si (2)
where p and k are the charge density and the wave number ofthe electron or ion plasma wave. The angle 0 = 0° is perpen-
dicular to the line source. Because of the essential property
of the line source in isotropic plasmas is very similar to thecircular disk source, the details of the radiation patterns
and the experimental facts are presented in the case of the cir-cular disk (Section 111-3).
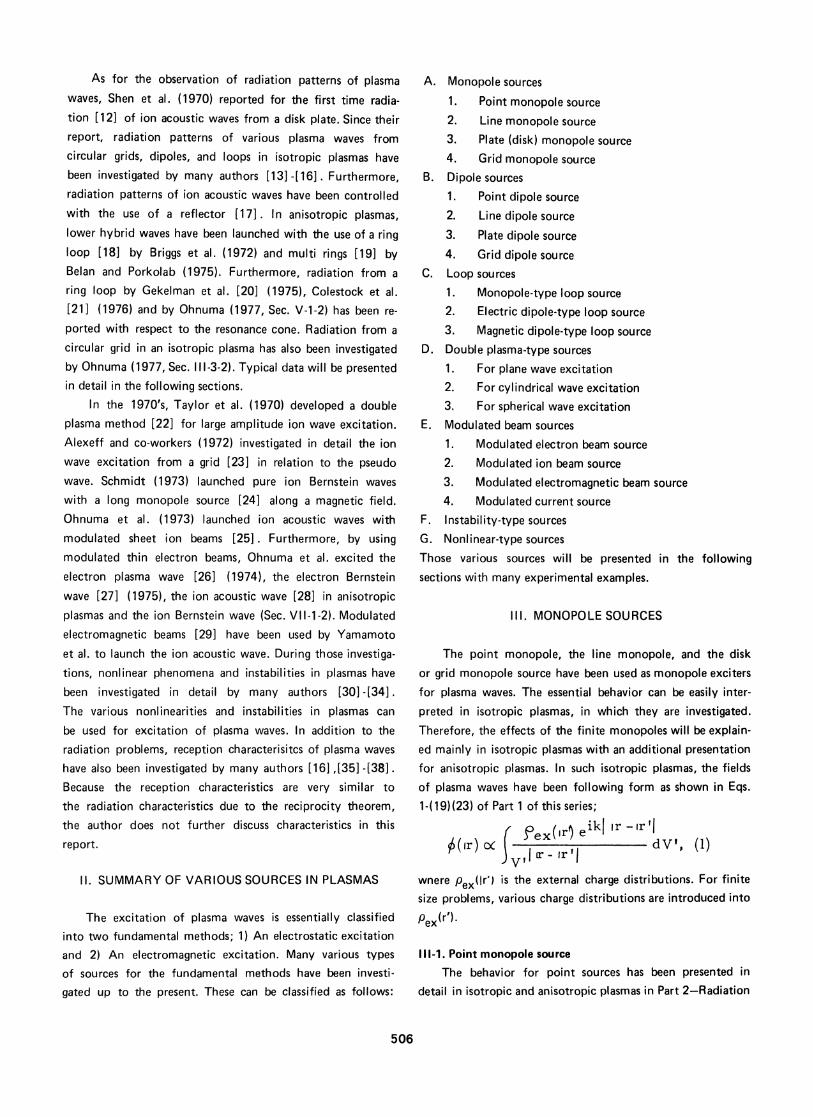
In anisotropic plasmas, Schmidt observed the pure ionBernstein wave [24] by using a long line monopole source
along the magnetic field as shown in Figure 1. Typical para-
x
-4
z
I ... I . A . 3I..a 1 2 3 c
*IZ10ocC
f9oc
800
- P07A-IL,V B,
1IH-
PROELE' |
Figure 1. Long line monopole source as a
ion Bernstein waves [24].
70C
60C
SOC
40Clauncher of pure
30C
meter values were No0 108 - 109 cm-', Te = Ti = 0.2 eVand Bo = 6k -11 kgauss. Typical wave patterns and the disper-
sion curves are indicated in Figure 2. The observed wave pat-
tern indicates a geometrical damping proportional to R /2
111-3. Disk (grid) monopole source111-3-1 In isotropic plasmas. A circular disk, plate, or
grid has been frequently used for excitation of plasma waves.If a uniform charge distribution on a circular plate with radius
a is assumed, the far field approximation for Eq. 1 gives the
following expression:
2a JI(kasinE) ei(kR Wt)kasinO R (3)
where Jiis the Bessel function of the first kind. This equa-
0
'012
722
506
. .........
I-W46
* 4~KS
e.s.
2 K em)
Figure 2. Wave patterns of cylindrical pure ion Bernsteinwaves and the typical dispersion curves [24].
tion indicates a spherical wave with a geometrical damping
factor of R -1. The wave amplitude radiated from the circu-lar plate has a directional pattern proportional to J1 (kasin0)/kasin0.
Experimentally, Shen et al. observed the radiation pattern
[12] of ion waves from a circular disk for the first time.Their observation of radiation patterns of ion wave amplitudeis indicated in Figure 3 for two cases of 2a/\ (2a: the diameter
of the disk, X: The wavelength of ion waves). The plasma
parameter values were No = 108 _ 1 ol0 cmr3 and Te t 1 eV.
507
I

'900
24i v 0*
-90-
+90-
. 2 a/ 2.5
THEORY*I**0*EXPERIMENT
-90
Figure 3. Amplitude patterns of ion waves radiated from a
circular plate. 2a: The diameter of the plate and X. Thewavelength of the ion wave [12].
The disk size was 4.5 cm in diameter. The theoretical radiationpatterns from Eq. 3 are shown with solid curves in the figure.This observation may be the first clear experiment which con-
firmed the radiated pattern of plasma waves from a finite
sou rce.111-3-2. In anisotropic plasmas. As an example in aniso-
tropic plasmas, radiation of the high frequency resonance
cone from a circular grid is presented. The experimentalresults are obtained in the same machine as that in Section
V-2, 3 of Part 2-Radiation from point sources. Figure 4
indicates the spatial potential patterns of the high frequencyresonance cone which are radiated from a circular grid 7 cm
in diameter. Figure 5 shows the plot of the experimentalbroad peak potential of the resonancV cone in three dimen-
sions. The solid line indicates the theoretical resonance cone
angle with respect to the edge of the circular grid. Broadresonance cones which increase with the grid size are clearlyindicated in the figure.
f /fce =0.4152~~~~~~~~~~~~~~ 11 9
Z 8cm
7cmf mesh (Z=O)
Figure 4. Experimental spatial potential patterns of the high
frequency resonance cone radiated from a circular mesh.
fpe fee = 97 MHz.
1f/fce=0.41
Z(cm)
60
20 10 0 10 20R(cm)
Figure 5. Experimental behavior of the high frequency reso-
nance cone radiated from a circular mesh. Solid lines are the
theoretical cone trajectory from the edge of the mesh.
508
111-4. Control of radiation pattern of a monopole source witha reflector
Radiation patterns of plasma waves can be easily control-led by using a reflector. The wave amplitude can be effective-ly directed to one direction by the reflector. This kind ofexperiment was performed for an ion wave by Ohnuma et al.[151. Such double circular grids shown in Figure 6 were
'DPI In
l 2a0
Figure 6. Ion wave mesh-radiator with a mesh-reflector.
used. One is the monopole-type radiator of the ion wave
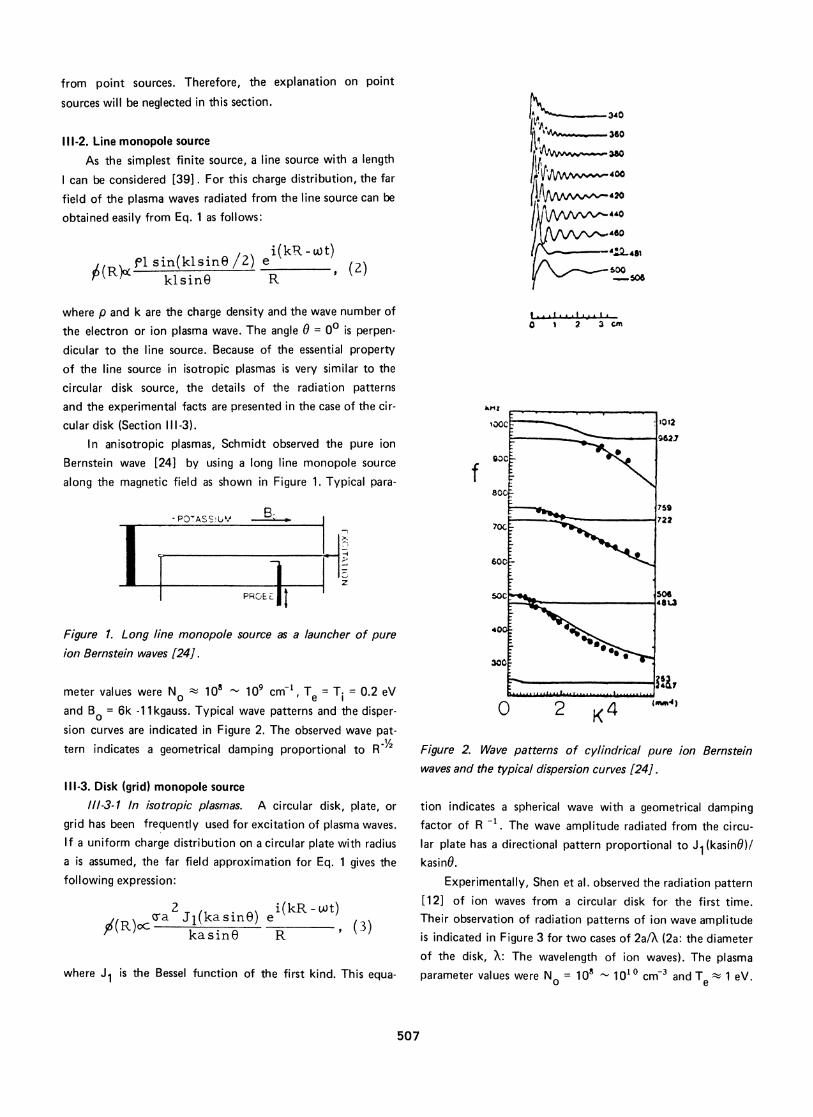
and the other is used as a reflector of the ion wave which islaunched by the first grid and propagates toward the reflector.The plasma parameter values were No = ll_- 90 cmr3,Te = 1 - 2 eV and f = 50 - 100 kHz. Figure 7 indicates theradiated amplitude patterns of the ion wave from the circulargrids given in Figure 6. The closed and open circles are theexperimental results for reflector bias voltages VR = 40 Vand 0 V, respectively. Total reflection of the ion wave is ob-served from the electron-rich sheath boundary of VR = 40 Vand no reflection is observed for VR = 0 V. The dotted curvesare the theoretical radiation patterns which are given by thesame equation as Eq. 3:
JI(ka sinG)
ka sine
Solid curves are the theoretical radiation patterns for the caseof total in-phase reflection from the sheath boundary and aregiven by
i( J1(ka sin@)(l+ e ) kasinG I (4)
ttk2DcosO +g
2a/,- 2
f =lOOkHz
0*
0'.*- -
, 0 0
1 f
V: Vv vR E
Figure 7. Experimental and theoretical amplitude patternsof ion waves radiated from double meshes of Figure 6. Solidand dotted curves are the theoretical patterns with and with-out the reflection of ion waves, respectively.
where D is the distance from the radiator to the reflectionpoint. The value 6 becomes zero for in-phase reflection.In the figure, the wave amplitude is amplified about twiceby an in-phase reflection from the electron-rich sheath. Thisfact indicates that one can launch unidirectional plasma waveseffectively by using the reflector.
IV. DIPOLE SOURCES
IV-1. Point dipole sourceEssential points of the point dipole sources are included
in Part 1 and Part 2 in this series of reports.
IV-2. Line dipole sourceLine dipole sources have been sometimes used for plasma
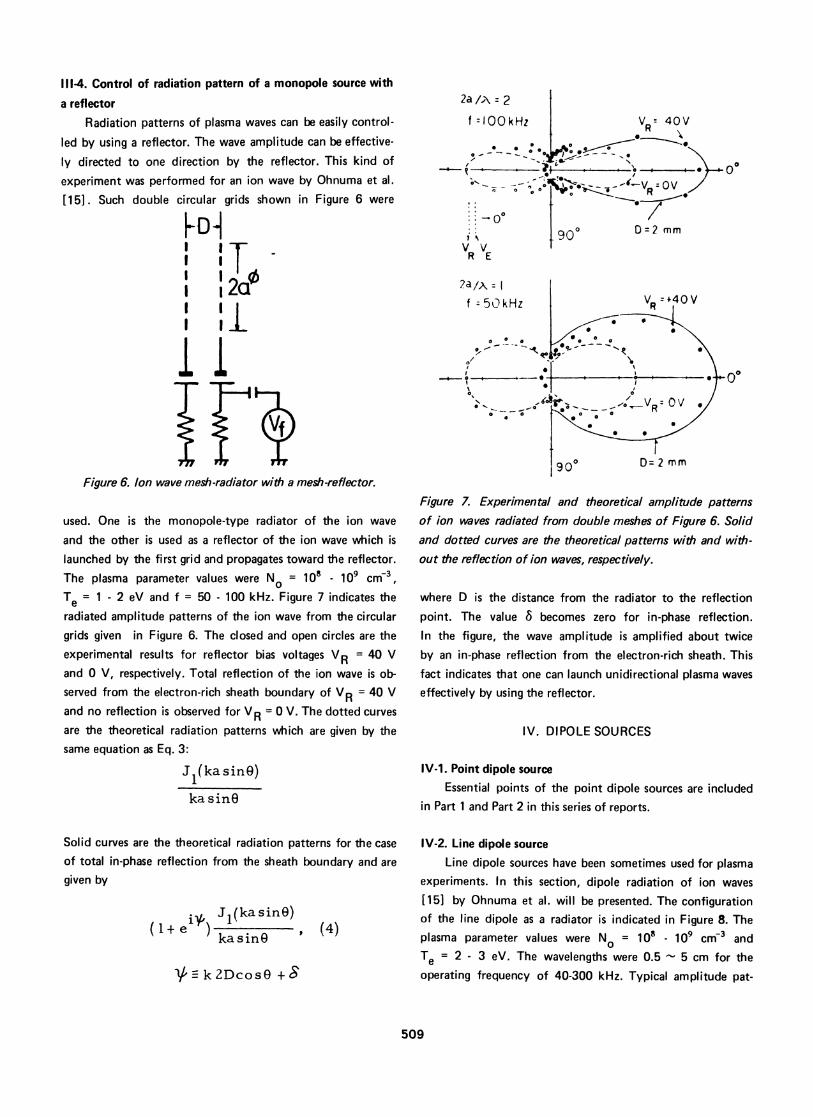
experiments. In this section, dipole radiation of ion waves[151 by Ohnuma et al. will be presented. The configurationof the line dipole as a radiator is indicated in Figure 8. Theplasma parameter values were No = 108 - 109 cmr3 and
Te = 2 - 3 eV. The wavelengths were 0.5 5 cm for theoperating frequency of 40-300 kHz. Typical amplitude pat-
509
9Q0
2L0
0
Figure 8. Line dipole radiator of plasma waves with a length2L.
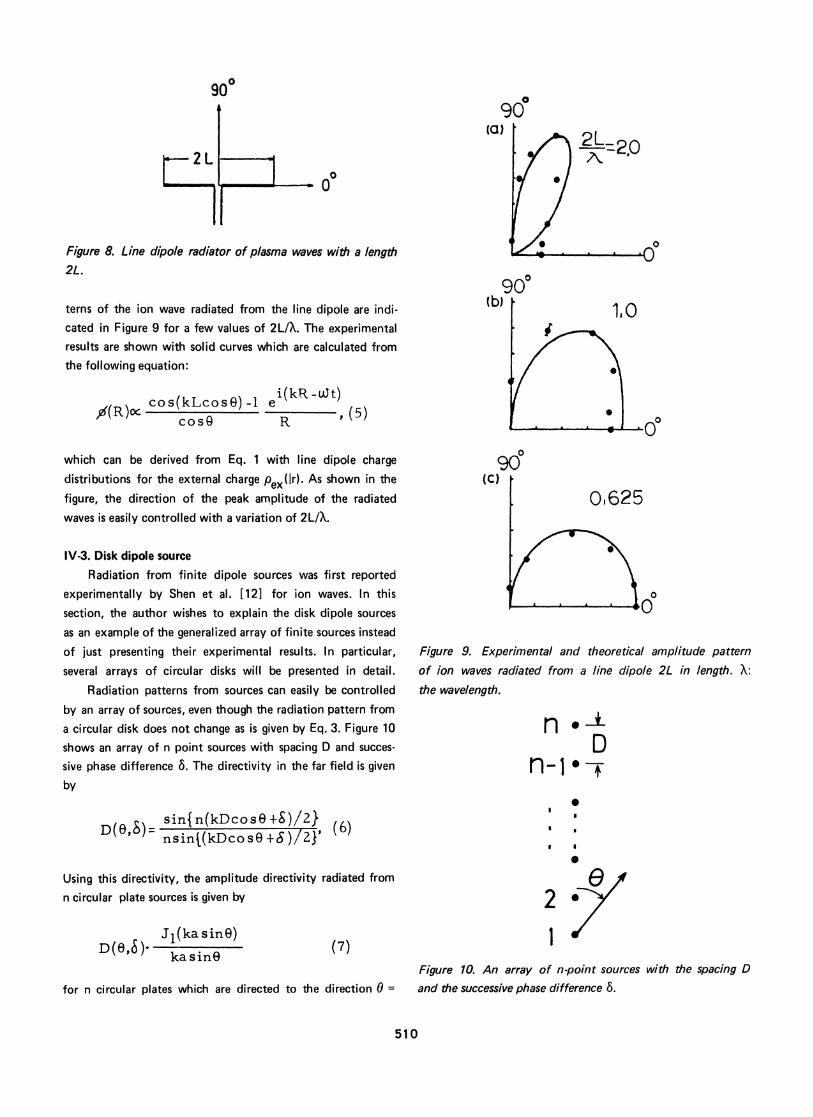
terns of the ion wave radiated from the line dipole are indi-cated in Figure 9 for a few values of 2L/X. The experimentalresults are shown with solid curves which are calculated fromthe following equation:
cos(kLcosO)-1 ei(kR - u) t)AR)Oc ~ cosO R ' 5
which can be derived from Eq. 1 with line dipole charge
distributions for the external charge Pex(1r). As shown in the
figure, the direction of the peak amplitude of the radiated
waves is easily controlled with a variation of 2L/A.
IV-3. Disk dipole source
Radiation from finite dipole sources was first reported
experimentally by Shen et al. [12] for ion waves. In this
section, the author wishes to explain the disk dipole sources
as an example of the generalized array of finite sources insteadof just presenting their experimental results. In particular,
several arrays of circular disks will be presented in detail.
Radiation patterns from sources can easily be controlled
by an array of sources, even though the radiation pattern from
a circular disk does not change as is given by Eq. 3. Figure 10
shows an array of n point sources with spacing D and succes-
sive phase difference 6. The directivity in the far field is givenby
D(O ~S) nsin{n(kDco s E±+8)/2}nsinJ(kDcos9+&5)721'
Using this directivity, the amplitude directivity radiated from
n circular plate sources is given by
D(6, c)) JI(kasinO)kasine
(7)
for n circular plates which are directed to the direction 0 =
0
90o(c)
0,625
00
Figure 9. Experimental and theoretical amplitude pattern
of ion waves radiated from a line dipole 2L in length. X:
the wavelength.
n * -AD
n-I
2 *1
Figure 10. An array of n-point sources with the spacing Dand the successive phase difference 6.
510
9Q0(a) 1
2LK.20
90cb) E
O0, and
D(7-O .8). J1(kasin)2 kasinO
(8)
for n circular plates which face in the direction 0 = 90°.For the case of the double circular grids, Eqs. 7 and 8 become
Co(kDcose+5 .
Jl(kasinO) 9cos(- 2 kasin ' (9)
and
CskDsin()+5 Jj(kasinO) (0cos( 2 kasing (10)
respectively. Equations 9 and 10 are explained in detailfor the following experimental results for ion waves.
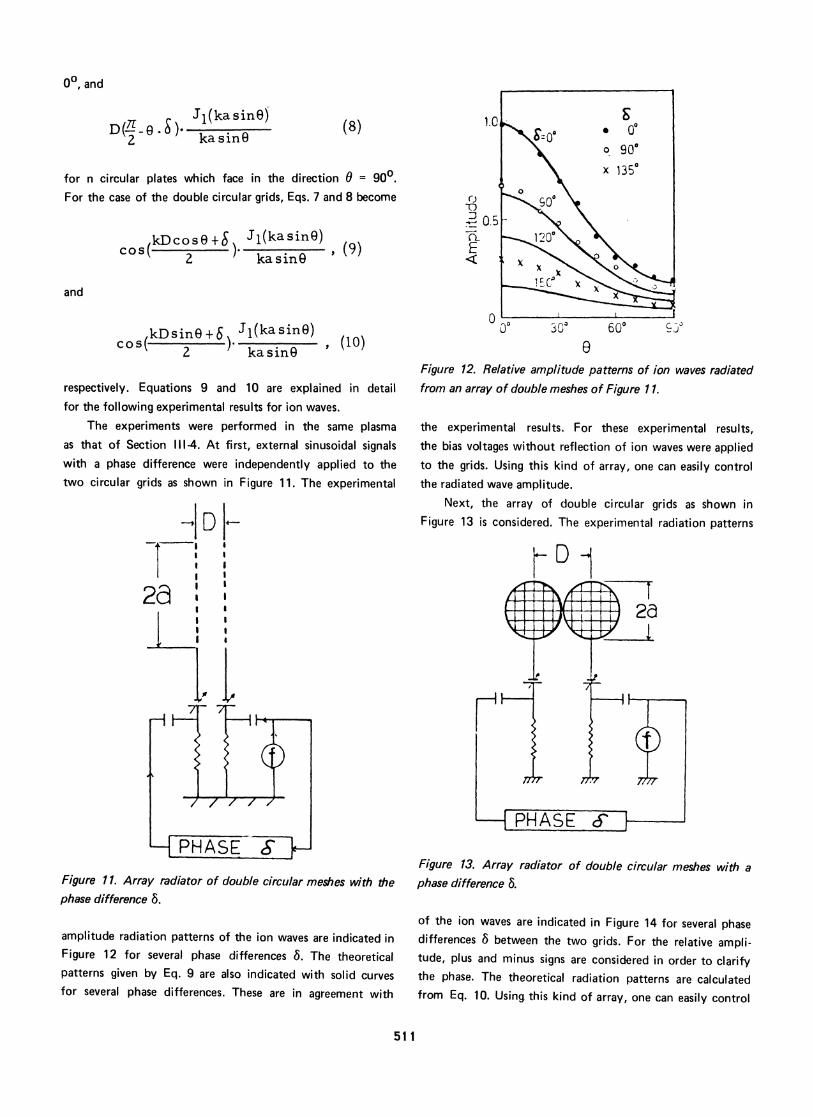
The experiments were performed in the same plasmaas that of Section 111-4. At first, external sinusoidal signalswith a phase difference were independently applied to thetwo circular grids as shown in Figure 11. The experimental
-D|l l
2a::I ,
l l,
Figure 11. Array radiator of double circular meshes with h7ephase difference 6.
amplitude radiation patterns of the ion waves are indicated inFigure 12 for several phase differences 6. The theoreticalpatterns given by Eq. 9 are also indicated with solid curvesfor several phase differences. These are in agreement with
E
0 300 600
Figure 12. Relative amplitude patterns of ion waves radiatedfrom an array of double meshes of Figure 11.
the experimental results. For these experimental results,the bias voltages without reflection of ion waves were appliedto the grids. Using this kind of array, one can easily controlthe radiated wave amplitude.
Next, the array of double circular grids as shown inFigure 13 is considered. The experimental radiation patterns
2a-1I
-I
Figure 13. Array radiator of double circular meshes with aphase difference 6.
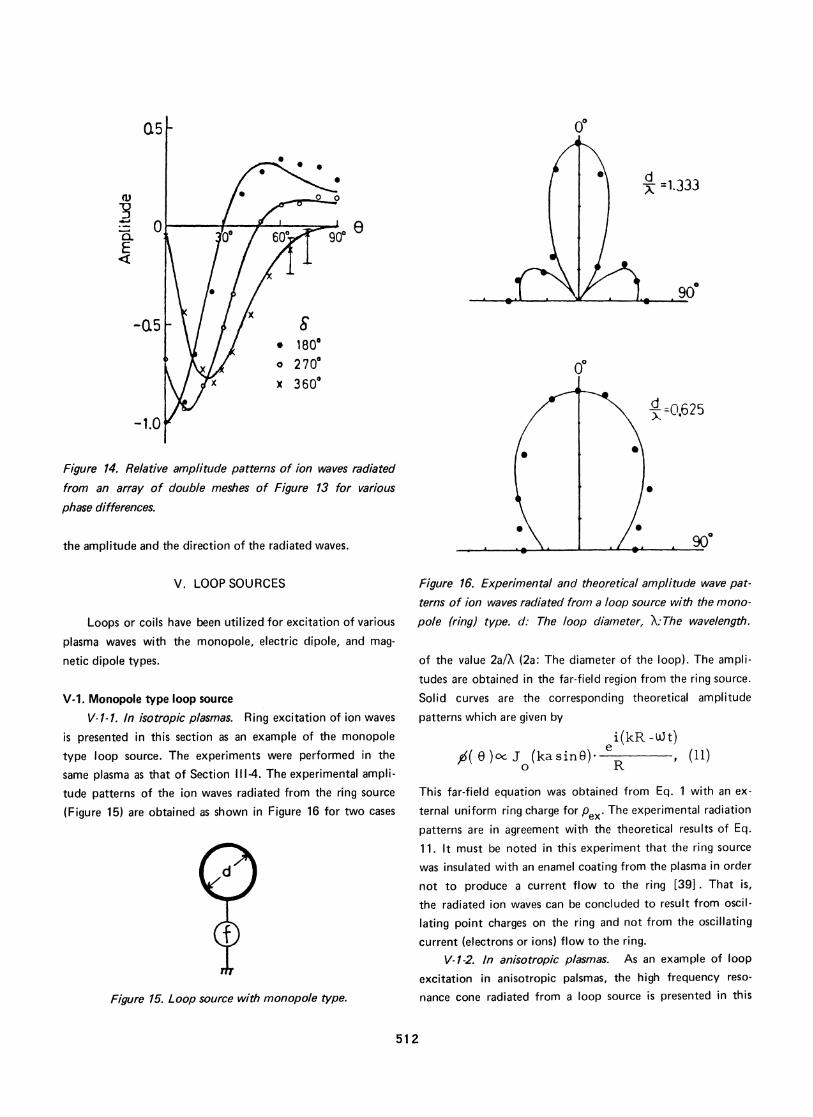
of the ion waves are indicated in Figure 14 for several phasedifferences 6 between the two grids. For the relative ampli-tude, plus and minus signs are considered in order to clarifythe phase. The theoretical radiation patterns are calculatedfrom Eq. 10. Using this kind of array, one can easily control
511
-1
i'l
D "
05
C',
-05
-1.0
00 *
0
£
0
x
180°2 70°360°
Figure 14. Relative amplitude patterns of ion waves radiated
from an array of double meshes of Figure 13 for various
phase differences.
the amplitude and the direction of the radiated waves.
V. LOOP SOURCES
Loops or coils have been utilized for excitation of various
plasma waves with the monopole, electric dipole, and mag-
netic dipole types.
V-1. Monopole type loop source
V-1-1. In isotropic plasmas. Ring excitation of ion waves
is presented in this section as an example of the monopole
type loop source. The experiments were performed in the
same plasma as that of Section 111-4. The experimental ampli-
tude patterns of the ion waves radiated from the ring source
(Figure 15) are obtained as shown in Figure 16 for two cases
d
Figure 15. Loop source with monopole type.
Figure 16. Experimental and theoretical amplitude wave pat-
terns of ion waves radiated from a loop source with the mono-
pole (ring) type. d: The loop diameter, X-The wavelength.
of the value 2a/X (2a: The diameter of the loop). The ampli-
tudes are obtained in the far-field region from the ring source.
Solid curves are the corresponding theoretical amplitude
patterns which are given by
i(kR -Ut),(e )co J (kasin 9) -R (I11)
RI
This far-field equation was obtained from Eq. 1 with an ex-
ternal uniform ring charge for pex* The experimental radiation
patterns are in agreement with the theoretical results of Eq.
1 1. It must be noted in this experiment that the ring source
was insulated with an enamel coating from the plasma in order
not to produce a current flow to the ring [39]. That is,
the radiated ion waves can be concluded to result from oscil-
lating point charges on the ring and not from the oscillating
current (electrons or ions) flow to the ring.V-1-2. In anisotropic plasmas. As an example of loop
excitation in anisotropic palsmas, the high frequency reso-
nance cone radiated from a loop source is presented in this
512
d =1.333
d =0.625x1
90°
section. Gekelman and Stenzel used this loop excitation [201for the resonance cone in order to focus the high frequencyfields to one point position. Several other authors have usedthis kind of loop excitation as introduced in Section I.
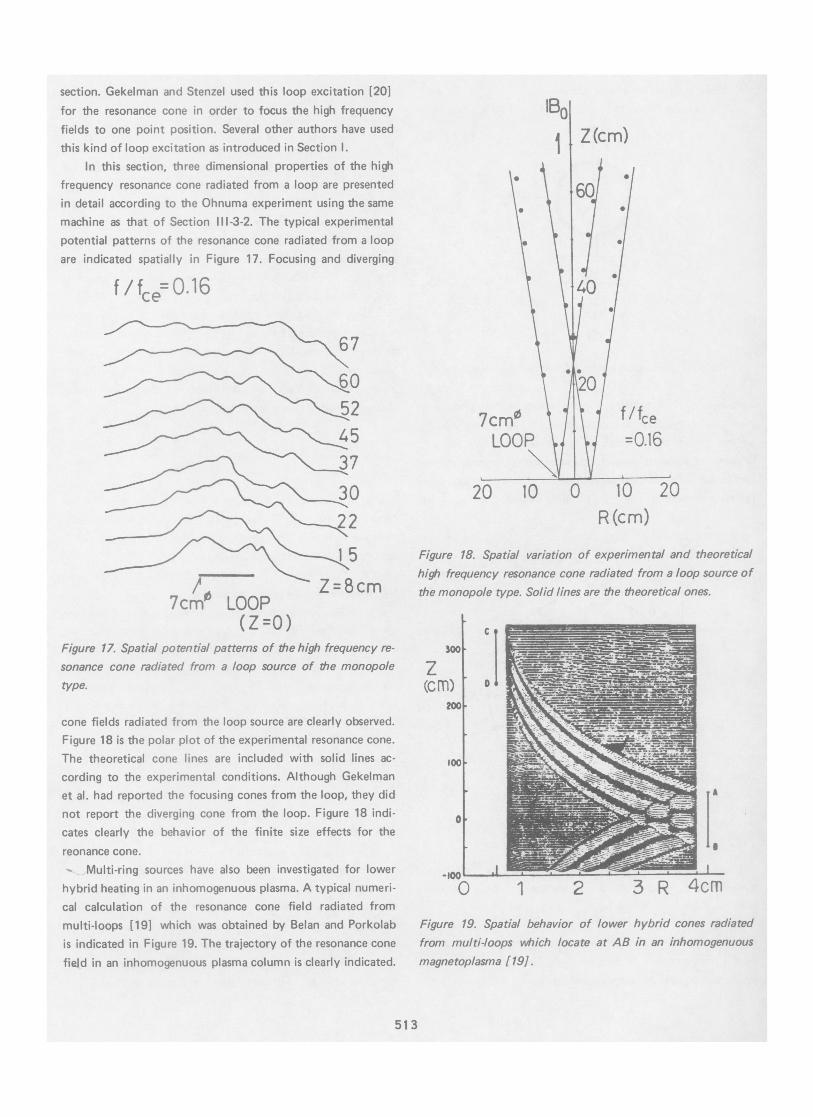
In this section, three dimensional properties of the highfrequency resonance cone radiated from a loop are presentedin detail according to the Ohnuma experiment using the samemachine as that of Section 111-3-2. The typical experimentalpotential patterns of the resonance cone radiated from a loopare indicated spatially in Figure 17. Focusing and diverging
f /fce=0.16
67
60524537302
/ Z=8cm7cm° LOOP
(Z=0)Figure 17. Spatial potential patterns of the high frequency re-sonance cone radiated from a loop source of the monopoletype.
cone fields radiated from the loop source are clearly observed.Figure 18 is the polar plot of the experimental resonance cone.The theoretical cone lines are included with solid lines ac-cording to the experimental conditions. Although Gekelmanet al. had reported the focusing cones from the loop, they didnot report the diverging cone from the loop. Figure 18 indi-cates clearly the behavior of the finite size effects for the
reonance cone.- Multi-ring sources have also been investigated for lowerhybrid heating in an inhomogenuous plasma. A typical numeri-cal calculation of the resonance cone field radiated frommulti-loops (19] which was obtained by Belan and Porkolabis indicated in Figure 19. The trajectory of the resonance cone
field in an inhomogenuous plasma column is clearly indicated.
l
7cm0LOOP
Z(cm)
f /fce=0.16
20 10 0 10 20R(cm)
Figure 18. Spatial variation of experimental and theoreticalhigh frequency resonance cone radiated from a loop source ofthe monopole type. Solid lines are the theoretical ones.
300
z(Cm)
20
0oot
a
0.0
A
I
_ 2 .-mI1 2 3 R 4cm
Figure 19. Spatial behavior of lower hybrid cones radiatedfrom multi-loops vwhich locate at AB in an inhomogenuousmagnetoplasma [19].
513
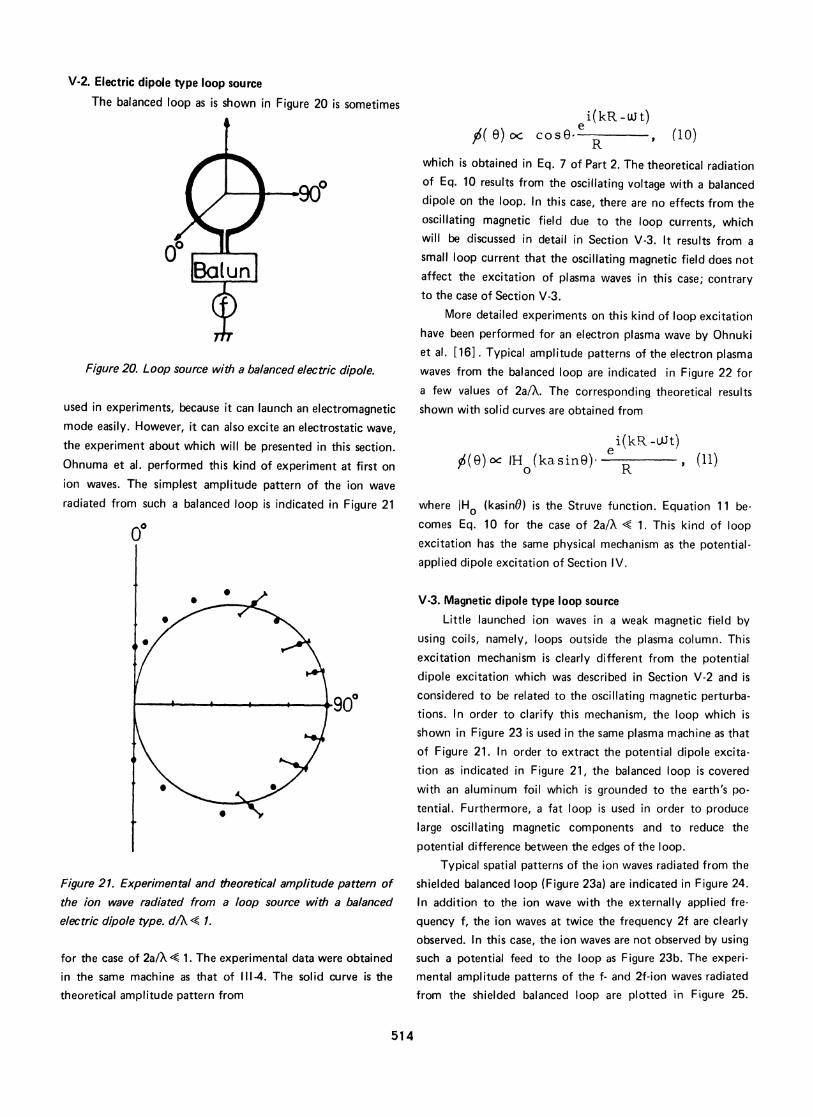
V-2. Electric dipole type loop source
The balanced loop as is shown in Figure 20 is sometimes
Figure 20. Loop source with a balanced electric dipole.
used in experiments, because it can launch an electromagneticmode easily. However, it can also excite an electrostatic wave,the experiment about which will be presented in this section.Ohnuma et al. performed this kind of experiment at first onion waves. The simplest amplitude pattern of the ion waveradiated from such a balanced loop is indicated in Figure 21
00
Figure 21. Experimental and theoretical amplitude pattern ofthe ion wave radiated from a loop source with a balancedelectric dipole type. dA< 1.
for the case of 2a/X< 1. The experimental data were obtainedin the same machine as that of 111-4. The solid curve is thetheoretical amplitude pattern from
i(kR -uJ t)(e)oc cose0- R (10)
which is obtained in Eq. 7 of Part 2. The theoretical radiationof Eq. 10 results from the oscillating voltage with a balanceddipole on the loop. In this case, there are no effects from theoscillating magnetic field due to the loop currents, whichwill be discussed in detail in Section V-3. It results from asmall loop current that the oscillating magnetic field does notaffect the excitation of plasma waves in this case; contraryto the case of Section V-3.
More detailed experiments on this kind of loop excitationhave been performed for an electron plasma wave by Ohnukiet al. [16]. Typical amplitude patterns of the electron plasmawaves from the balanced loop are indicated in Figure 22 fora few values of 2a/X. The corresponding theoretical resultsshown with solid curves are obtained from
i(kR -L.t)2d(9) oC IH (kasin9) (I11)
where IHO (kasinO) is the Struve function. Equation 11 be-comes Eq. 10 for the case of 2a/X1 < 1. This kind of loopexcitation has the same physical mechanism as the potential-applied dipole excitation of Section IV.
V-3. Magnetic dipole type loop source
Little launched ion waves in a weak magnetic field byusing coils, namely, loops outside the plasma column. Thisexcitation mechanism is clearly different from the potentialdipole excitation which was described in Section V-2 and isconsidered to be related to the oscillating magnetic perturba-tions. In order to clarify this mechanism, the loop which isshown in Figure 23 is used in the same plasma machine as thatof Figure 21. In order to extract the potential dipole excita-tion as indicated in Figure 21, the balanced loop is coveredwith an aluminum foil which is grounded to the earth's po-tential. Furthermore, a fat loop is used in order to producelarge oscillating magnetic components and to reduce thepotential difference between the edges of the loop.
Typical spatial patterns of the ion waves radiated from theshielded balanced loop (Figure 23a) are indicated in Figure 24.In addition to the ion wave with the externally applied fre-quency f, the ion waves at twice the frequency 2f are clearlyobserved. In this case, the ion waves are not observed by usingsuch a potential feed to the loop as Figure 23b. The experi-mental amplitude patterns of the f- and 2f-ion waves radiatedfrom the shielded balanced loop are plotted in Figure 25.
514

(a)
(0) 68
Ic)
kpa :1.12
E3 d° f :6 6MHZ2a 5cm
0 .
: ' 900
0
80W
S, ta) § b~~~~~~~~~~~~~~fFigure 23. (a) Shielded loop source with a magnetic dipoletype for ion waves; (b) Shielded loop source with a monopole
potential type (i.e., potential feeding).kpa =1,85
0cr f -~80MHZ2a 5 cm
-S
9Q
l o*---lb
* ko a 3.31f = 7 2MHz
Figure 22. Experimental and theoretical amplitude patterns
of an electron plasma wave radiated from a loop source
with a balanced electric dipole type.
potential feeding
b
2 cm
Figure 24. Spatial wave patterns of ion waves (f and 2f)radiated from the shielded balanced loop with the applied
frequency f (Figure 23a). Front and back signals indicate
signals detected in the direction of 0 = 0" and 180°, respec-
tively. Bottom figure of potential feeding is a signal for theloop of Figure 23b.
515
front f = 50 kHz
f -signalback
front
back 2f - signal
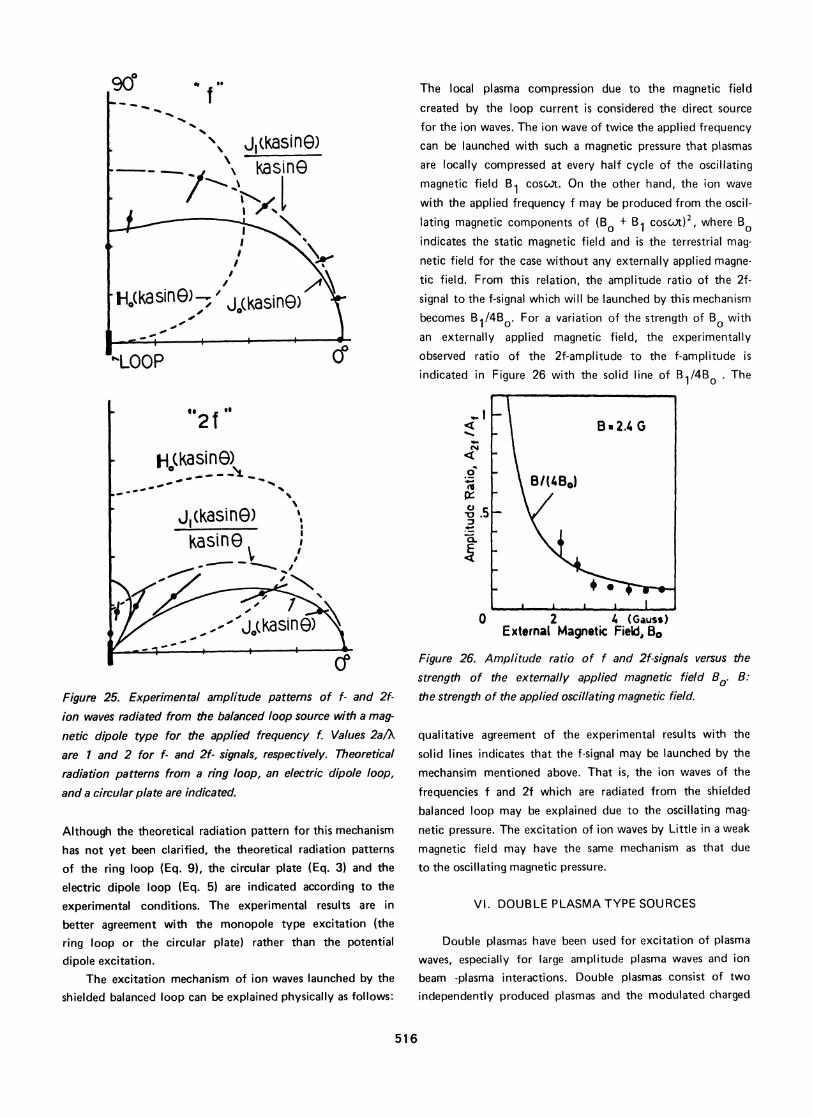
aThe local plasma compression due to the magnetic field
created by the loop current is considered the direct source
for the ion waves. The ion wave of twice the applied frequencycan be launched with such a magnetic pressure that plasmasare locally compressed at every half cycle of the oscillatingmagnetic field B1 coscot. On the other hand, the ion wave
with the applied frequency f may be produced from the oscil-
lating magnetic components of (Bo + B1 coscuA)2, where Boindicates the static magnetic field and is the terrestrial mag-
netic field for the case without any externally applied magne-
tic field. From this relation, the amplitude ratio of the 2f-
signal to the f-signal which will be launched by this mechanismbecomes B1/4BO. For a variation of the strength of Bo with
an externally applied magnetic field, the experimentallyobserved ratio of the 2f-amplitude to the f-amplitude is
indicated in Figure 26 with the solid line of B1/4B0 The
Figure 25. Experimental amplitude patterns of f- and 2f-
ion waves radiated from the balanced loop source with a mag-
netic dipole type for the applied frequency f. Values 2aAare 1 and 2 for f- and 2f- signals, respectively. Theoreticalradiation patterns from a ring loop, an electric dipole loop,and a circular plate are indicated.
Although the theoretical radiation pattern for this mechanismhas not yet been clarified, the theoretical radiation patternsof the ring loop (Eq. 9), the circular plate (Eq. 3) and the
electric dipole loop (Eq. 5) are indicated according to the
experimental conditions. The experimental results are in
better agreement with the monopole type excitation (thering loop or the circular plate) rather than the potentialdipole excitation.
The excitation mechanism of ion waves launched by theshielded balanced loop can be explained physically as follows:
< -l ~~~B.2.L GC~4
oi' B/(4Bo)
0 2 4 (Gauss)External Magnetic Field, Bo
Figure 26. Amplitude ratio of f and 2f-signals versus thestrength of the externally applied magnetic field BO B:
the strength of the applied oscillating magnetic field.
qualitative agreement of the experimental results with the
solid lines indicates that the f-signal may be launched by the
mechansim mentioned above. That is, the ion waves of the
frequencies f and 2f which are radiated from the shielded
balanced loop may be explained due to the oscillating mag-
netic pressure. The excitation of ion waves by Little in a weakmagnetic field may have the same mechanism as that due
to the oscillating magnetic pressure.
VI. DOUBLE PLASMA TYPE SOURCES
Double plasmas have been used for excitation of plasmawaves, especially for large amplitude plasma waves and ion
beam -plasma interactions. Double plasmas consist of two
independently produced plasmas and the modulated charged
516
particles of the "driver" plasma are injected into the "target"plasma for an excitation of plasma waves.
VI-1. Plane wave excitation
As an example of excitation of plane waves, double
plasmas used by Taylor et al. is indicated in Figure 27. Two
1~~~~k A
mesh i
Probe
FilamentLm,
Figure 27. Double plasma source for a plane wave excitation.
plasmas are separated by a mesh biased to a negative potentialwith respect to the plasma potential. They used this machine
for an ion wave experiment by injecting density-modulatedion charges. Large amplitude ion waves have been easilylaunched in this kind of machine. Approximate plane waves
can be launched if the machine size, namely, the central
mesh size, is much larger than the wavelength of the plasmawaves [40].
VI-2. Cylindrical wave excitationModifying the double plasmas of Figure 27, one can
easily launch cylindrical plasma waves [41] [42]. The excita-tion of cylindrical waves will be explained in detail in SectionVII-Modulated beam sources.
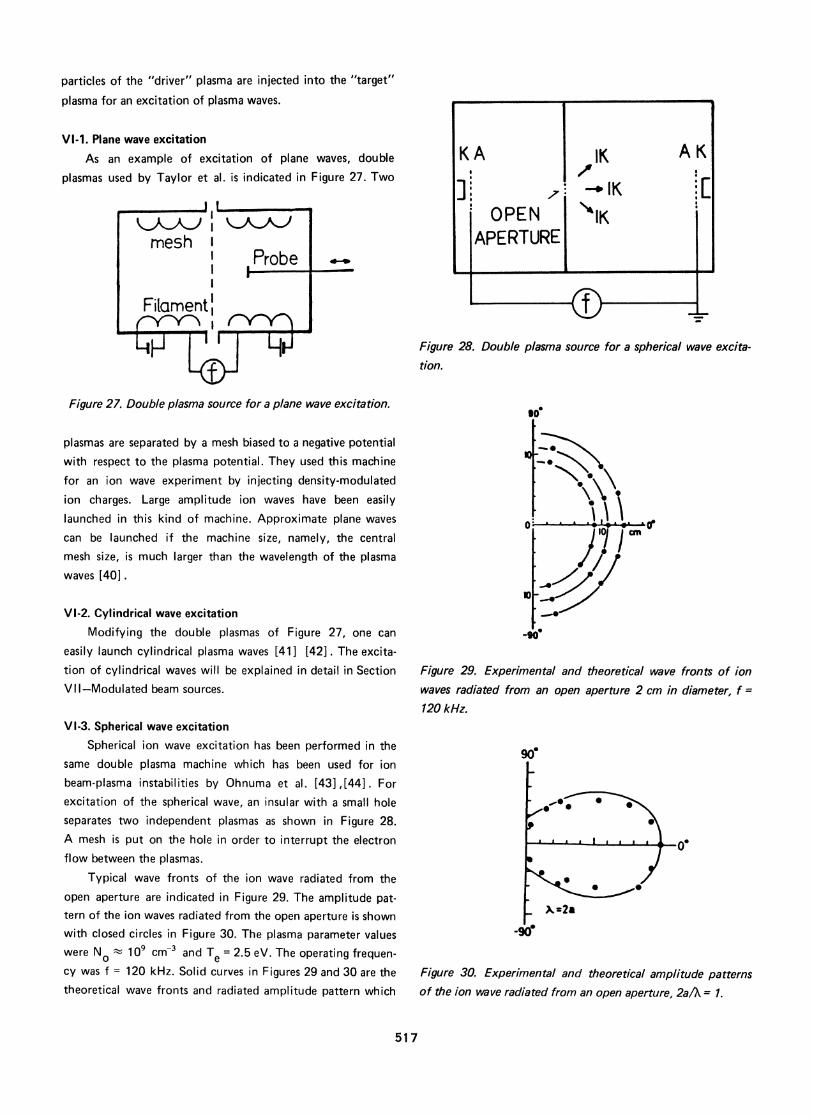
VI-3. Spherical wave excitationSpherical ion wave excitation has been performed in the
same double plasma machine which has been used for ionbeam-plasma instabilities by Ohnuma et al. [43],[44] . Forexcitation of the spherical wave, an insular with a small holeseparates two independent plasmas as shown in Figure 28.A mesh is put on the hole in order to interrupt the electronflow between the plasmas.
Typical wave fronts of the ion wave radiated from theopen aperture are indicated in Figure 29. The amplitude pat-
tern of the ion waves radiated from the open aperture is shownwith closed circles in Figure 30. The plasma parameter valueswere No 1 09 cm-3 and Te = 2.5 eV. The operating frequen-cy was f = 120 kHz. Solid curves in Figures 29 and 30 are thetheoretical wave fronts and radiated amplitude pattern which
Figure 28. Double plasma source for a spherical wave excita-tion.
*0
1010
Figure 29. Experimental and theoretical wave fronts of ionwaves radiated from an open aperture 2 cm in diameter, f =120 kHz.
9g0l
.0 0
0~~~~~
. . . . I ,- I I a ~0-
X_=2a
Figure 30. Experimental and theoretical amplitude patterns
of the ion wave radiated from an open aperture, 2aA = 1.
517
KA IK A K
].~ ~ 7--_IK .
OPEN "IKAPERTUREi~~~~~~~~~~~~~~~~~~~~~~~~~~~~~~~~~~~~~~
are given by
Jj(kasinO) ei(kR-1t)kasinO R (
The experimental and theoretical results in Figures 29 and
30 are those in the far-field region. Near field effects havebeen investigated theoretically [45] and experimentally[40] with a use of a double plasma machine.
VII. MODULATED BEAM SOURCES
vbszoov ' lz
50
t -2 St
r 2
orZ B0cr0
i ~~~BEAM CENTER
Plasma waves can be launched with an injection of loca-
lized modulated beams into plasmas. This method has the
advantage that there is no need of inserting objects into theplasma for excitation of plasma waves.
VII-1. Modulated electron beam sourceVII- 1-1. In isotropic plasmas. The experimental setup
for excitation of plasma waves with modulated charged par-ticle beams is indicated in Figure 31. For the beams, circular
LASMA\%IWAVE
BE
SOURCE Tza
DETECTOR
Figure 31. Experimental setup for an excitation of plasmawaves by modulated beams.
circular and sheet density modulated beams are easily treated.
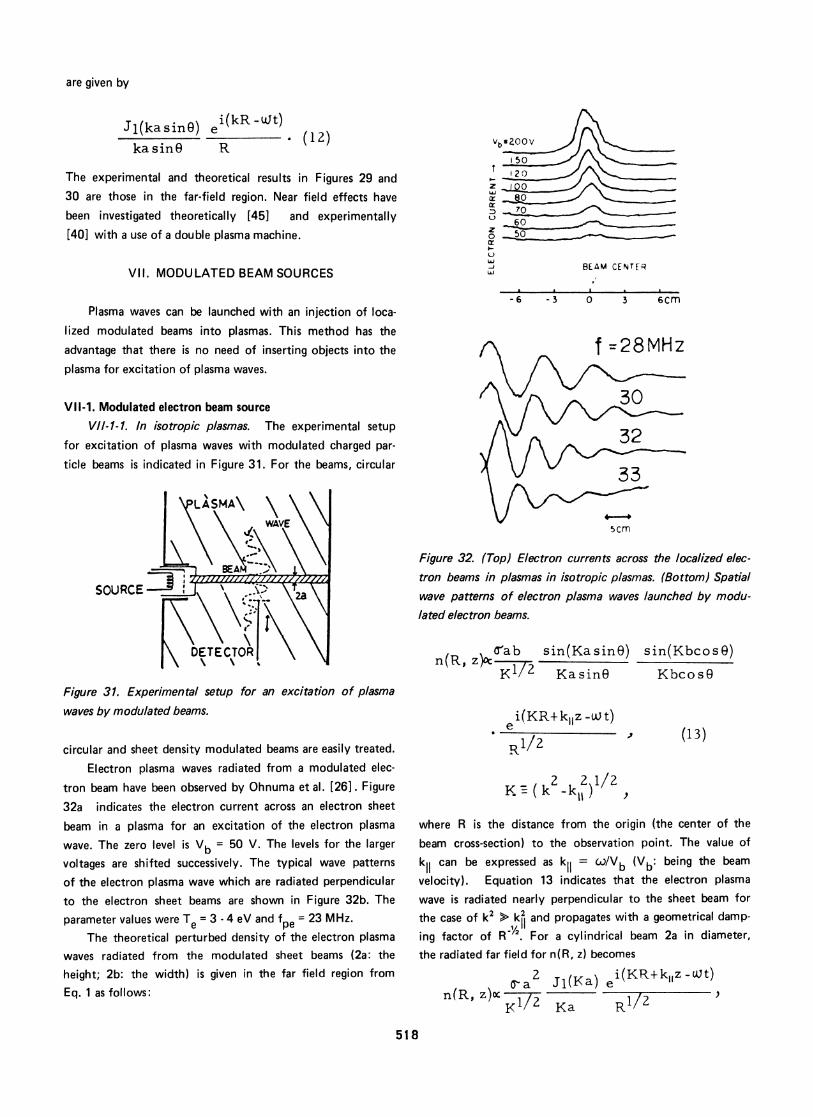
Electron plasma waves radiated from a modulated elec-
tron beam have been observed by Ohnuma et al. [26]. Figure32a indicates the electron current across an electron sheet
beam in a plasma for an excitation of the electron plasmawave. The zero level is Vb = 50 V. The levels for the largervoltages are shifted successively. The typical wave patternsof the electron plasma wave which are radiated perpendicularto the electron sheet beams are shown in Figure 32b. The
parameter values were Te =3 -4 eV and fpe = 23 MHz.The theoretical perturbed density of the electron plasma
waves radiated from the modulated sheet beams (2a: the
height; 2b: the width) is given in the far field region fromEq. 1 as follows:
-6 -3 0 3 6CM
5cm
Figure 32. (Top) Electron currents across the localized elec-tron beams in plasmas in isotropic plasmas. (Bottom) Spatialwave patterns of electron plasma waves launched by modu-lated electron beams.
n(R, zaab sin(Kasine) sin(KbcosO9)
KasinO KbcosO
i(KR+klz -ctt)e /
RI/2(13)
K (k2 k2)1/2
where R is the distance from the origin (the center of thebeam cross-section) to the observation point. The value of
ki can be expressed as kll = /Vb (Vb: being the beam
velocity). Equation 13 indicates that the electron plasmawave is radiated nearly perpendicular to the sheet beam for
the case of k2 > k2 and propagates with a geometrical damp-ing factor of R-/. For a cylindrical beam 2a in diameter,the radiated far field for n(R, z) becomes
a2 JI(Ka) e i(KR+kl,z -tWJt)K'72 Ka R1 2
518

(14)where J1 (Ka) is the Bessel function of the first kind.
In Figure 33, wave fronts of plasma waves radiated from
a) 4/lvvi1°
b) V/Vb10
(ilzlI77 171 T
C) yVt,0.5
Figure 33. Wave fronts of plasma waves radiated from modu-lated beams for various values of Vp/Vb. Vp: the phasevelocity, Vb: the beam velocity.
the modulated cylindrical beams are indicated for severalvalues of Vp/Vb, where Vp and Vb are the phase velocityand the beam velocity, respectively. These wave fronts are ob-tained from Eq. 14, and are the same fronts as the case ofsheet beams in the far field region. For a large beam velocity,Vp/Vb < 1, the plasma waves are found to be radiated nearlyperpendicular to the beams. For the slow beam velocity,Vp/Vb - 1, the plasma waves are radiated obliquely to thebeams.
VII-1-2. In anisotropic plasmas. In a magnetized plasma,the excitation of plasma waves with modulated thin electronbeams has been performed by Ohnuma et al. for ion waves[28], electron Berntein waves [27], and ion Bernstein waves.
In this section, radiation of cylindrical ion Bernsteinwaves from modulated thin cylindrical electron beams willbe described. In Figure 34a, the experimental setup for theneutralized ion Bernstein waves is shown. The plasma sourceon the right-hand side can produce a uniform plasma within
(a)
.. . . ..I I .-Ptasma ':.. .. . . .-
Electron beam .Gun ..... .
A K(b)
Je
-2 -1 0 1 2R(cm)
Figure 34. (a) Experimental setup for an excitation ofplasmawaves by modulated thin electron beams in anisotropic plas-mas. (b) Spatial distribution of electron currents across theelectron beams in anisotropic plasmas.
5 cm in diameter. Density-modulated electron beams 2 mmin diameter are injected into plasmas along the magnetic field.The plasma parameter values were No = 3 x 10⁸ cmr3, Te =5 eV for Bo =550 gauss. The radial distribution of electroncurrents in Figure 34 is for the case of Vb = 100 V, Ib =500 A, and Bo = 550 gauss. Typical wave patterns for theradial propagation of the neutralized ion Bernstein waveswhich are launched by the modulated electron beams are indi-cated in Figure 35a. Figure 35b is the experimental dispersioncurve with the theoretical one of the neutralized ion Bern-stein wave (solid curve). The dotted curve is that of a pureion Bernstein wave. The experimental results can be confirmedto be those of the neutralized ion Bernstein wave due to theexperimental conditions of the beam velocity Vb(= w/k 11)and the plasma length. Radiation of neutralized ion Bernsteinwaves radiated from modulated electron beams is confirmedexperimentally in this experiment.
The theoretical potential field radiated from a line sourcealong the magnetic field can be derived as follows:
519
i rir-
4 -L-
2 2 112K =(k -kil )
50 cmL I
I I
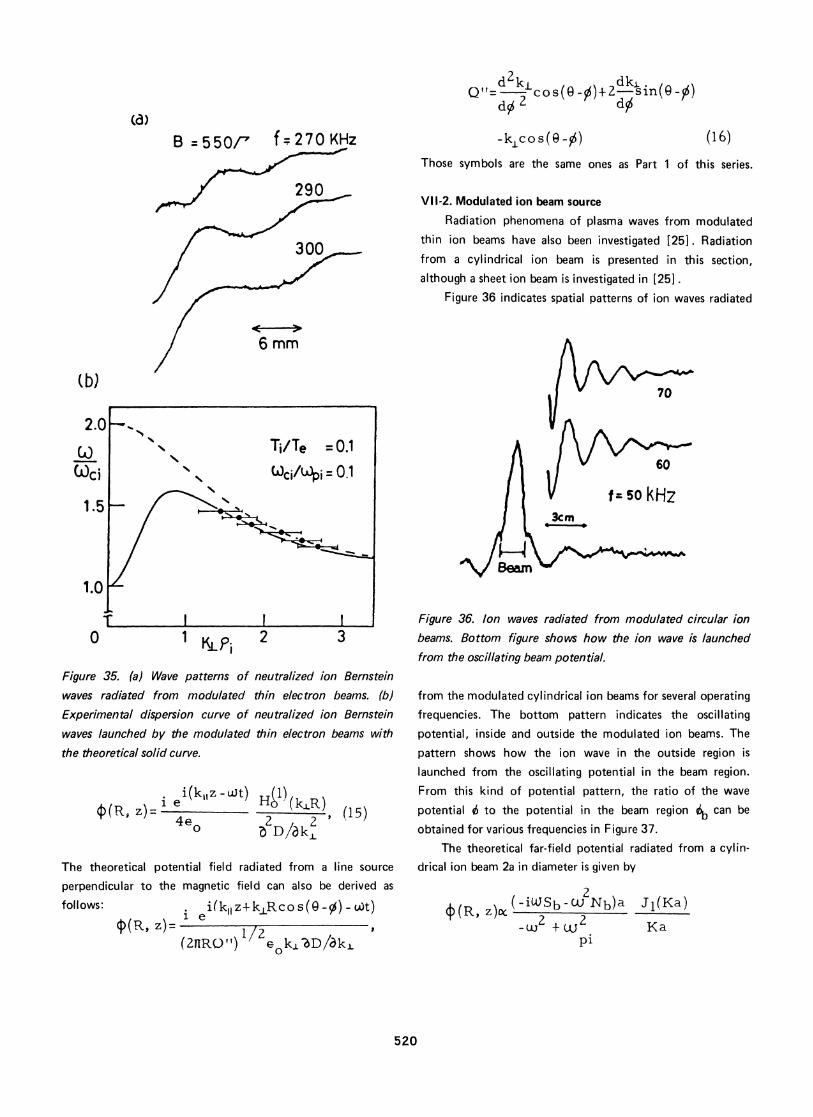
d2ko dk) .Q"=-7cos(9-0)±2-in(9-~)
(d)B =550/" f 270KHz
290
6 mm
(b)
(A)Oci
0 1 KLp. 2 3
Figure 35. (a) Wave patterns of neutralized ion Bernsteinwaves radiated from modulated thin electron beams. (b)Experimental dispersion curve of neutralized ion Bernsteinwaves launched by the modulated thin electron beams withthe theoretical solid curve.
z)= 4e2 2
, (15)
The theoretical potential field radiated from a line source
perpendicular to the magnetic field can also be derived as
follows: i(kIz+kLRcos(9-d)-u_t)(R, z)=
(21rRO") 1 kjL D/3kL0
(16)
Those symbols are the same ones as Part 1 of this series.
VII-2. Modulated ion beam sourceRadiation phenomena of plasma waves from modulated
thin ion beams have also been investigated [251. Radiationfrom a cylindrical ion beam is presented in this section,although a sheet ion beam is investigated in [25].
Figure 36 indicates spatial patterns of ion waves radiated
70
60
t=sokHz3cm
Figure 36. Ion waves radiated from modulated circular ionbeams. Bottom figure shows how the ion wave is launchedfrom the oscillating beam potential.
from the modulated cylindrical ion beams for several operatingfrequencies. The bottom pattern indicates the oscillatingpotential, inside and outside the modulated ion beams. The
pattern shows how the ion wave in the outside region is
launched from the oscillating potential in the beam region.From this kind of potential pattern, the ratio of the wave
potential 6 to the potential in the beam region e% can be
obtained for various frequencies in Figure 37.The theoretical far-field potential radiated from a cylin-
drical ion beam 2a in diameter is given by
2(R, z)or (-i4Sb-cW Nb)a JI(Ka)
-(Rz) + c 2 Kapi
520
-k,co s(O -.)
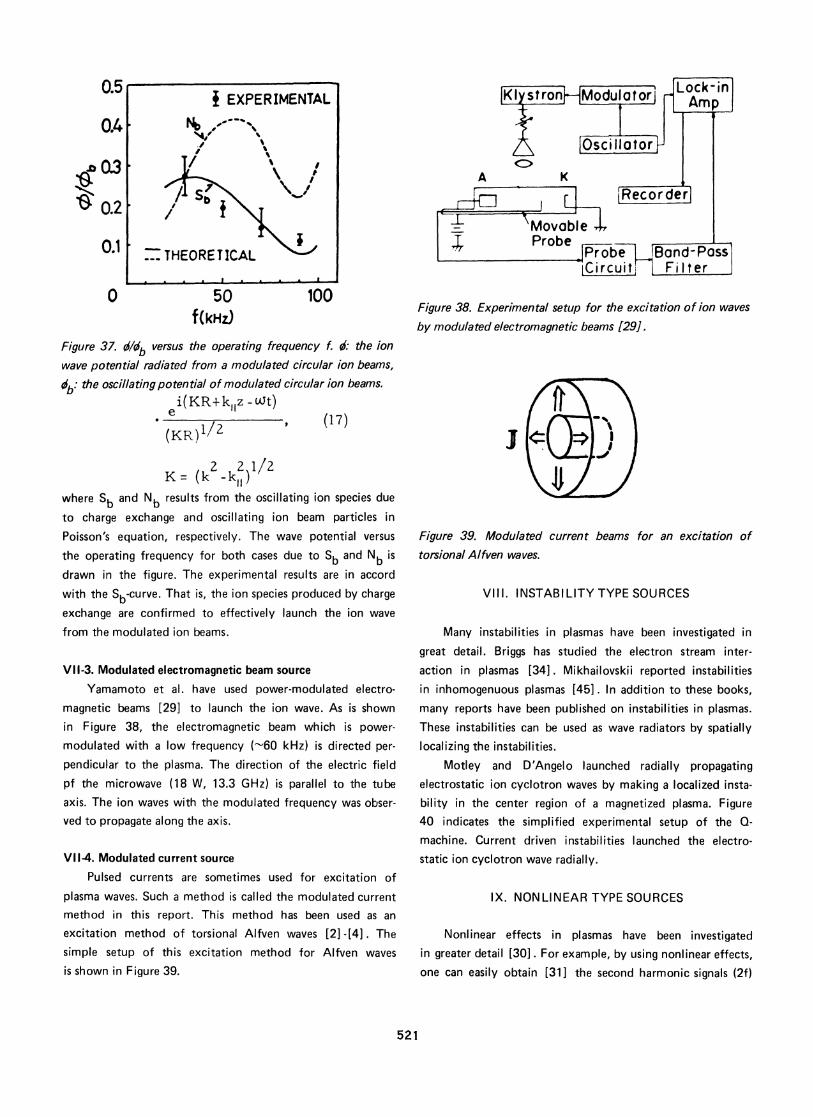
Figure 38. Experimental setup for the excitation of ion waves
by modulated electromagnetic beams [29].Figure 37 61db versus the operating frequency f. d: the ion
wave potential radiated from a modulated circular ion beams,
ab: the oscillating potential of modulated circular ion beams.i(KR±kllz - ijt)
(KR)12 (17)
K =(k2 k2)1/2~~~11where Sb and Nb results from the oscillating ion species due
to charge exchange and oscillating ion beam particles in
Poisson's equation, respectively. The wave potential versus
the operating frequency for both cases due to Sb and Nb is
drawn in the figure. The experimental results are in accord
with the Sb-curve. That is, the ion species produced by charge
exchange are confirmed to effectively launch the ion wave
from the modulated ion beams.
VII-3. Modulated electromagnetic beam source
Yamamoto et al. have used power-modulated electro-
magnetic beams [29] to launch the ion wave. As is shownin Figure 38, the electromagnetic beam which is power-
modulated with a low frequency (-60 kHz) is directed per-
pendicular to the plasma. The direction of the electric field
pf the microwave (18 W, 13.3 GHz) is parallel to the tubeaxis. The ion waves with the modulated frequency was obser-ved to propagate along the axis.
VI1-4. Modulated current source
Pulsed currents are sometimes used for excitation of
plasma waves. Such a method is called the modulated current
method in this report. This method has been used as an
excitation method of torsional Alfven waves [2] -[4]. Thesimple setup of this excitation method for Alfven waves
is shown in Figure 39.
Figure 39. Modulated current beams for an excitation oftorsional Alfven waves.
VIII. INSTABILITY TYPE SOURCES
Many instabilities in plasmas have been investigated in
great detail. Briggs has studied the electron stream inter-
action in plasmas [34]. Mikhailovskii reported instabilitiesin inhomogenuous plasmas [45]. In addition to these books,
many reports have been published on instabilities in plasmas.These instabilities can be used as wave radiators by spatiallylocalizing the instabilities.
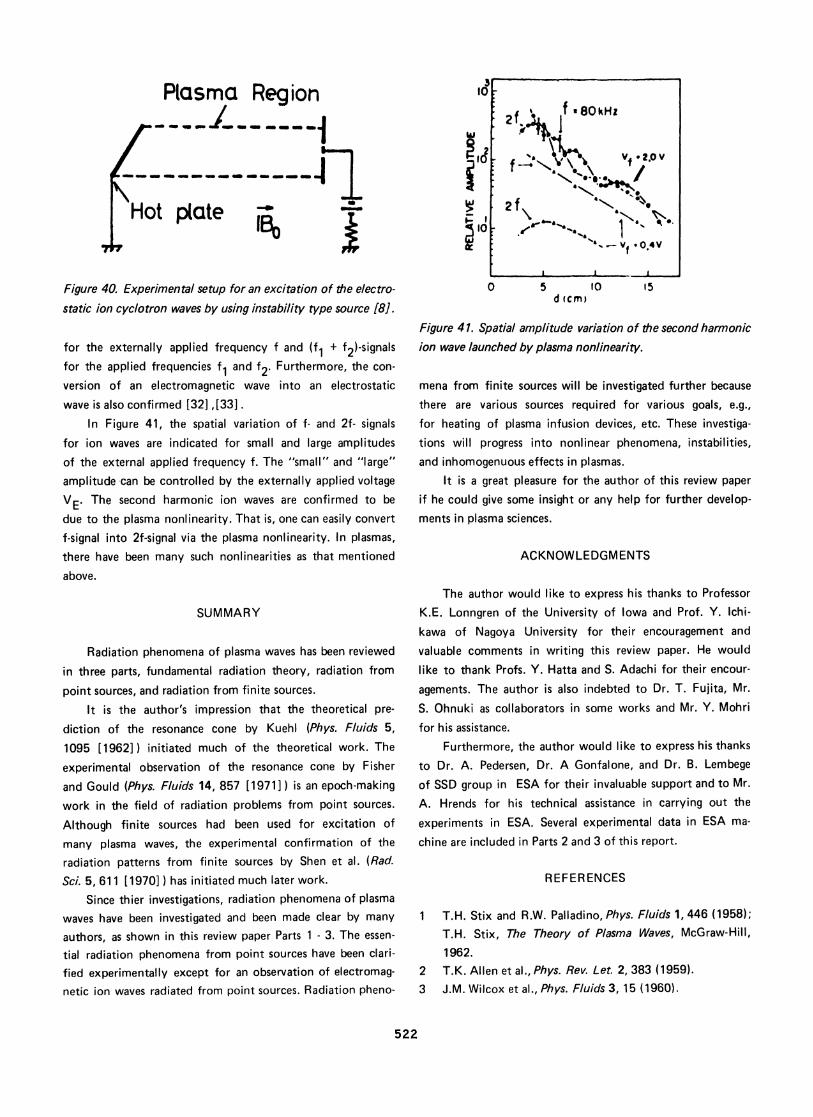
Motley and D'Angelo launched radially propagatingelectrostatic ion cyclotron waves by making a localized insta-bility in the center region of a magnetized plasma. Figure40 indicates the simplified experimental setup of the Q-
machine. Current driven instabilities launched the electro-
static ion cyclotron wave radially.
IX. NONLINEAR TYPE SOURCES
Nonlinear effects in plasmas have been investigated
in greater detail [30]. For example, by using nonlinear effects,
one can easily obtain [31] the second harmonic signals (2f)
521
0.5
0.41
031'
0.2
0.1
0
i EXPERIMENTAL
I
b. \' I
THEORETICAL
50f(kHz)
100. A- 1-- . . a
Plasma Regionwe Om u urn a urnm a m uG n
lot pate gBo
Figure 40. Experimental setup for an excitation of the electro-
static ion cyclotron waves by using instability type source [8].
for the externally applied frequency f and (f1 + f2)-signalsfor the applied frequencies f1 and f2. Furthermore, the con-
version of an electromagnetic wave into an electrostatic
wave is also confirmed [32],[33] .
In Figure 41, the spatial variation of f- and 2f- signals
for ion waves are indicated for small and large amplitudesof the external applied frequency f. The "small" and "large"
amplitude can be controlled by the externally applied voltage
VE. The second harmonic ion waves are confirmed to be
due to the plasma nonlinearity. That is, one can easily convert
f-signal into 2f-signal via the plasma nonlinearity. In plasmas,
there have been many such nonlinearities as that mentionedabove.
SUMMARY
Radiation phenomena of plasma waves has been reviewed
in three parts, fundamental radiation theory, radiation from
point sources, and radiation from finite sources.
It is the author's impression that the theoretical pre-
diction of the resonance cone by Kuehl (Phys. Fluids 5,1095 [1962] ) initiated much of the theoretical work. The
experimental observation of the resonance cone by Fisher
and Gould (Phys. Fluids 14, 857 [1971] ) is an epoch-makingwork in the field of radiation problems from point sources.
Although finite sources had been used for excitation of
many plasma waves, the experimental confirmation of the
radiation patterns from finite sources by Shen et al. (Rad.Sci. 5, 611 [1970] ) has initiated much later work.
Since thier investigations, radiation phenomena of plasmawaves have been investigated and been made clear by many
authors, as shown in this review paper Parts 1 - 3. The essen-
tial radiation phenomena from point sources have been clari-
fied experimentally except for an observation of electromag-netic ion waves radiated from point sources. Radiation pheno-
0 5 10 15d (cm)
Figure 41. Spatial amplitude variation of the second harmonicion wave launched by plasma nonlinearity.
mena from finite sources will be investigated further because
there are various sources required for various goals, e.g.,
for heating of plasma infusion devices, etc. These investiga-
tions will progress into nonlinear phenomena, instabilities,and inhomogenuous effects in plasmas.
It is a great pleasure for the author of this review paper
if he could give some insight or any help for further develop-ments in plasma sciences.
ACKNOWLEDGMENTS
The author would like to express his thanks to ProfessorK.E. Lonngren of the University of Iowa and Prof. Y. Ichi-
kawa of Nagoya University for their encouragement and
valuable comments in writing this review paper. He wouldlike to thank Profs. Y. Hatta and S. Adachi for their encour-
agements. The author is also indebted to Dr. T. Fujita, Mr.
S. Ohnuki as collaborators in some works and Mr. Y. Mohrifor his assistance.
Furthermore, the author would like to express his thanksto Dr. A. Pedersen, Dr. A Gonfalone, and Dr. B. Lembegeof SSD group in ESA for their invaluable support and to Mr.
A. Hrends for his technical assistance in carrying out the
experiments in ESA. Several experimental data in ESA ma-
chine are included in Parts 2 and 3 of this report.
REFERENCES
1 T.H. Stix and R.W. Palladino, Phys. Fluids 1, 446 (1958);T.H. Stix, The Theory of Plasma Waves, McGraw-Hill,1962.
2 T.K. Allen et al., Phys. Rev. Let. 2, 383 (1959).3 J.M. Wilcox et al., Phys. Fluids 3, 15 (1960).
522

4 S. Nagao and T. Sato, J. Phys. Soc. Jpn. 15, 735 (1960).5 R.M. Gallet et al., Phys. Rev. Let. 4, 347 (1960).6 Y. Hatta and N. Sato, Proc. 5th Int. Con. on Ionization
Phenomena in Gases, Munich, 1961, p. 478.7 P.F. Little, ibid, p. 1440.8 R.W. Motley and N. D'Angelo, Phys. Fluids 6, 296
(1963).9 D.F. Jephcott and A. Malein, Proc. Roy. Soc. A 278,
243 (1964).10 R.S. Sharp, Appl. Phys. Let. 6, 51 (1965).11 H. Derfler and T.C. Simonen, Phys. Rev. Let. 17, 172
(1966).12 K. Shen et al., Rad. Sci. 5, 611 (1960).13 T. Ishizone et al., Summaries of 1971 I.S.A.P., IECEJ.14 Y. Nakamura and T. Itoh, J. Plasma Phys. 11, 131 (1974).15 T. Ohnuma et al., IEEE Trans. AP-24, 901 (1976).16 S. Ohnuki et al., IEEE Trans. AP-25, 524 (1977).17 T. Ohnuma et al., Rad. Sci. 9, 697 (1974).18 R.J. Briggs and R.R. Parker, Phys. Rev. Let. 29, 852
(1972).19 P. Belan and M. Porkolab, Phys. Rev. Let 34, 857 (1975);
Phys. Fluids 17, 1592 (1974).20 W. Gekelman and R.L. Stenzel, Phys. Rev. Let. 35,
1708 (1975); R.L. Stenzel and W. Gekelman, Phys.Fluids 20, 108 (1977).
21 P.L. Colestock and W.D. Getty, Phys. Fluids 19, 1229(1976).
22 R.J. Taylor et al., Phys. Rev. Let. 25, 11 (1970); T.Fujita et al., Plasma Phys. 19, 875 (1977).
23 K. Estabrook and 1. Alexeff, Phys. Rev. Let. 29, 573(1972); Phys. Fluids 15, 2026 (1972).
24 J.P.M. Schmidt, Phys. Rev. Let. 31, 982 (1973).25 T. Ohnuma et al., Phys. Rev. Let. 31, 1177 (1973).26 T. Ohnuma et al., Phys. Rev. Let. 32, 820 (1974).
APPENDIXThe theoretical far-potential field radiated from a circular
disk source in anisotropic plasmas can be derived as follows
27 T. Ohnuma et al., Rad. Sci. 10, 1071 (1975).28 T. Ohnuma et al., Phys. Fluids 18, 1818 (1976).29 T. Yamamoto et al., Phys. Fluids 19, 483 (1976).30 R.C. Davidson, Methods in Nonlinear Plasma Theory,
Academic Press, 1972.31 T. Ohnuma et al., Phys. Fluids 13, 1416 (1970); Phys.
Rev. A 8, 1002 (1973).32 H.C. Kim et al., Phys. Rev. Let. 33, 886 (1974).33 H. Ikezi et al., J. Phys. Soc. Jpn. 37, 766 (1974).34 R. Briggs, Electron Stream Interactions with Plasmas,
MIT Press, 1964.35 Y. Nakamura et al., IEEE Trans. on Plasma Sci. PS-1,
100 (1975).36 C.M. Burde, 1975 IEEE Int Con. Plasma Sci., 6C3,
Michigan.37 T. Ohnuam et al., Proc. IEEE 64, 1733 (1976).38 T. Christensen et al., Rad. Sci. 12, 935 (1977).39 T. Chen and L. Schott, Phys. Fluids 20, 844 (1977).40 1.B. Bernstein et al., Phys. Fluids 14, 628 (1971).41 N. Hershkowitz and T. Romesser, Phys. Rev. Let. 32,
581 (1974).42 T. Chen and L. Schott, Plasma Phys. 19, 249 (1977).43 T. Ohnuma et al., Phys. Rev. Let. 36, 471 (1976).44 T. Romesser and N. Hershkowitz, Phys. Let. 53A, 180
(1975).
FURTHER REFERENCES
1 T. Ohnuma, Kakuyugo Kenkyu 38, 1 (1977) (circularin Japanese).
2 T. Christensen and N. Hershkowitz, Phys. Fluids 20,840 (1977).
3 A.B. Mikhailovskii, Review of Plasma Physics Vol. 3,(edited by A.M.A. Leontovich).
(D(R,O) = Q J0(ka cos(6-O)cos(e-o)
*40o (R,9) , (A-2)JI [kacos (6-O) cos (e-¢)]
kacos (6-O)cos (e-4)
* ¢ o (R, 0) , (A -1)
where Q and indicate total charge on the circular disk source
and the angle which the disk-plane makes with the direction ofthe magnetic field, respectively. The theoretical radiation fieldfrom a point source in anisotropic plasmas is indicated by
bo(R,0)-The theoretical far-potential field radiated from a ring
source in anisotropic plasmas can be given by
where Q and 8 indicate the total charge on the ring source andan angle which the ring-plane makes with the direction of themagnetic field, respectively. The direction of the wave normalis denoted by /, and the theoretical field radiated from a pointsource in a magnetic field is included by qO(R, 0) which wasexpressed in Part 1 on this series.
In anisotropic plasmas, the theoretical potential radiatedfrom such a balanced loop in far-field and quasi-static approx-imations can be derived as follows
O(R,O)=Q Ho(ka cos(6-e)cos(O-fl))q0(R,O)
where the symbols mean the same as in Eq.(A-2).(A -3)
523
(R,e) = 2Q