Embed Size (px)
Citation preview
AFRC 2015 Industrial Combustion Symposium September 9--11, 2015
Historic Fort Douglas Officers Club University of Utah, Salt Lake City, Utah
Radiation Effects on Surrounding Structures from Multi-Point
Ground Flares
Joseph D. Smith, Ph.D., Robert Jackson and Ahti Suo-Anttila, Ph.D., Systems Analyses and Solutions, Owasso, Oklahoma, USA
Kerby Hefley, Zach Smith, Doug Wade, Doug Allen and Scot Smith Zeeco Inc. Broken Arrow, Oklahoma, USA
ABSTRACT
A Multi-Point Ground Flare (MPGF) was modeled at various flow conditions with a 9 m/s
wind. This MPGF consists of 15 stages and 341 flare tips and is capable of flaring in excess of
2x10⁶ lb/hr of vented gas. The detailed computational fluid dynamics (CFD) model of this MPGF
was developed using a proprietary flare modeling tool called C3d. This study emphasized the flare
plume and its effects on nearby structures. A low-flow unignited case was also run to examine the
size of the flammability cloud that would form. The simulation predicted that for the unignited
case the flammability cloud comes close to some nearby structures. The MPGF fence does perform
well in shielding structures from radiation, reducing radiation levels by a factor of 3 or more but
with the wind forcing the plume in their direction closer structures are still receiving radiation
fluxes of as high as 3000 BTU/hr◦ft2. The results of this MPGF CFD study have been used to help
finalize design of the MPGF in general and the fence specifically.
INTRODUCTION
Low profile multipoint flares represent a special class of flares capable of safely processing
significant quantities of flare gas in an environmentally responsible fashion. Systems Analyses
and Solutions (SAS) engineers have developed a detailed computational fluid dynamics (CFD)
model of a low-profile multi-point ground flare using SAS’s proprietary flare modeling tool called
C3d. This tool has been used to simulate many other flares including air and steam assisted flares,
enclosed flares, and other multi-tip low profile ground flares. The present flare system supports
the ExxonMobile Facility in Baytown, Texas. The flare system includes one flare field with 15
stages. This flare system is designed to process approximately 2 million lb/hr of vented gas from
the operation. An important factor for any flare is the impacts on surrounding structures and
personnel. Computational Fluid Dynamics simulations have been used to analyze the expected
impact of the flare plume on surrounding structures under a variety of relief conditions.
The multi-point ground flare (MPGF) configuration consists of one flare field firing mostly
ethylene and ethane. The field is approximately 85 m x 135 m and consists of a total of 341 flare
tips for the 15 stages. Four cases were analyzed in this study representing flow conditions ranging
from 550,000 lb/hr up to 2.8 million lb/hr. One of the conditions analyzed was of an unignited
condition to determine dispersion and the size of flammable clouds that would develop. Wind
fences surrounding the flare fields are approximately 18 m (60 ft) high with special configurations
to block line of sight view of the flame while allowing sufficient wind (air) into the flare field for
smokeless operation. The structures to be included in the study where those on the general down-
Radiation Effects on Surrounding Structures from Multi-Point Ground Flares September 9--11, 2015
University of Utah, Salt Lake City, Utah AFRC 2015: Industrial Combustion Symposium
Page 2 of 12
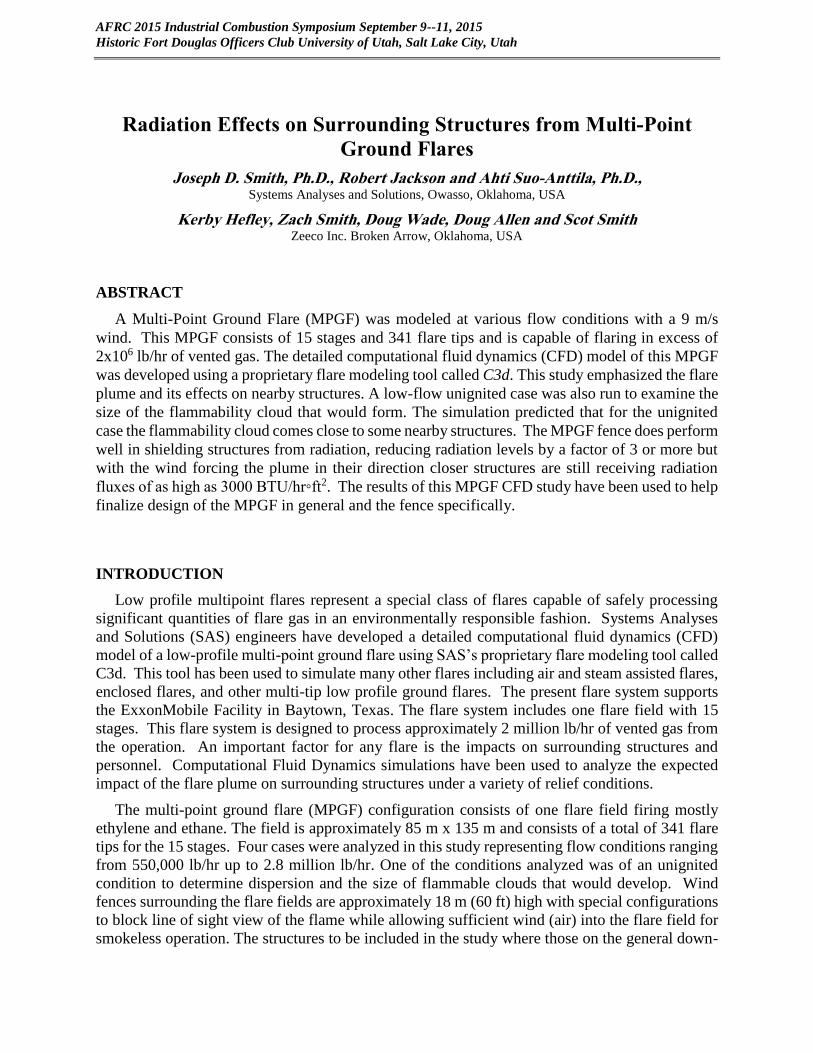
wind side of the MPGF: an elevated flare support tower, a knock-out drum, a platform, and
furnaces (see Figure 1).
Figure 1 - Plan view of MPGF and structures included in the CFD model
Previous work reported earlier has been done to validate the flare CFD model in general [1] and
the combustion model used in this analysis [2]. The main focus of this paper is the use of CFD
analysis to assess the impact of the flare plume on surrounding structures. The information
presented below describes this work and presents results and conclusions for large ground flare
operation.
THE FLARE MODEL
The CFD tool used in this work simulates turbulent reaction chemistry coupled with radiative
transport between buoyancy driven fires (i.e., pool fires, gas flares, etc.) and surrounding objects
(i.e., wind fence, process equipment, etc.). The code provides “reasonably” accurate estimates of
various risk scenarios including wind, % flame coverage, and thermal fatigue for a given geometry.
Typical simulations generally require CPU times on the order of hours to a few days on a
“standard” windows (or LINUX) desktop workstation. Large Eddy Simulation (LES) is used to
approximate turbulent mixing. The code used in this work is based on an earlier CFD tool called
ISIS-3D [3-5]. ISIS-3D was previously validated for simulating pool fires to predict the thermal
performance of nuclear transport packages [6-9]. ISIS-3D, originally developed at Sandia
National Laboratory, has been commercialized into a new CFD tool called C3d which is
specifically tailored to analyze large gas flare performance. C3d has previously been applied to
large multipoint ground flares, air-assisted flares, and utility flares [1, 2] with new combustion
models developed, implemented, and tested for various flare gas compositions including methane,
Elevated Flare
Pipe Rack Platform
Knockout-drum
MPGF
Furnaces Wind
Radiation Effects on Surrounding Structures from Multi-Point Ground Flares September 9--11, 2015
University of Utah, Salt Lake City, Utah AFRC 2015: Industrial Combustion Symposium
Page 3 of 12
ethane, ethylene, propane, propylene and xylene. C3d has been used to predict flare flame size
and shape, estimate the smoking potential for a given flare design firing typical flare gas, and to
estimate the radiation flux from the flare flame to surrounding objects. C3d simulations of flame
height and flame-to-ground radiation have been validated by direct comparison to measured flame
size, shape, and radiation measurements taken during single-burner and multi-burner tests
conducted under no-wind and low-wind ambient conditions [10].
For the flare shown above, C3d predictions were made for low-flow unignited, low-flow,
partially-ignited and at two conditions near maximum flare flow. The analysis was done with a
wind speed of 9 m/s directed from the flare field towards the furnaces as shown in Figure 1. Wind
fences can restrict wind flow to the flames and/or create unexpected flow profiles inside the flare
field both of which could affect combustion performance of the MPGF and the resulting plumes.
TECHNICAL APPROACH
Due to the size of the flare field, modeling the exact fence geometry for the full simulation was
not practical since it would require excessive computational cells and the associated CPU time to
perform the analysis. The same approach of using porous plates to simulate the actual fence
geometry described previously [11] was also used in this study.
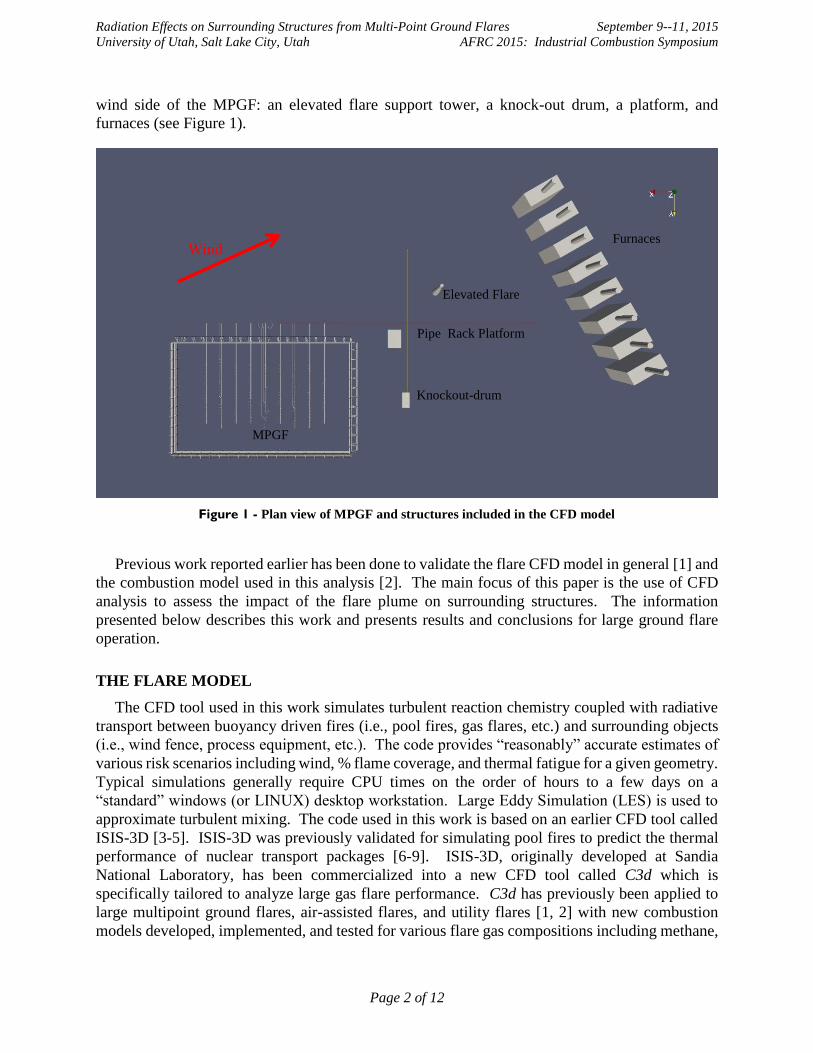
During the analysis, the grid was refined several times to improve calculation results and to
assure grid independent results. The final grid used was a structured grid with of 4.5 million cells.
As shown in Figure 2 the cells were clustered around areas of high flow gradients which existed
near the flare tips.
Figure 2 – Final grid structure used in the flare analysis with fine grid in regions near flare tips to resolve
ignition/combustion phenomena
Radiation Effects on Surrounding Structures from Multi-Point Ground Flares September 9--11, 2015
University of Utah, Salt Lake City, Utah AFRC 2015: Industrial Combustion Symposium
Page 4 of 12
COMBUSTION MODEL
The combustion model in C3d is a variant of Said et.al. [13]. The relevant species included in
the hybrid combustion model are Fuel vapor (F) from flare tip, oxygen (O2), products of
combustion (PC) which include water vapor and carbon dioxide, radiating carbon soot (C), and
non-radiating intermediate species (IS). The general combustion reactions involving these species
include:
1kg F + (2.87-2.6S1) kg O2 → S1 kg C + (3.87-3.6S1) kg PC + (50-32S1) MJ Eq. 1
Eq. 1 describes incomplete fuel (F) combustion that produces soot (S) and products of
combustion (PC) plus energy. The standard combustion soot stoichiometric parameter (S1) is set
as 0.05 but can be adjusted based on fuel type. For natural gas a value of 0.005 was used.
The endothermic fuel pyrolysis or cracking reaction (soot producing) consumes fuel (F) and
energy and produces radiating carbon (C) plus the intermediate species (IS):
1kg F + 0.3 MJ → S2 kg C + (1-S2) kg IS Eq. 2
Eq. 2 includes the Cracking Parameter (S2) which is set as 0.15 but can also be adjusted based
on fuel type. Soot combustion is described by:
1kg C + 2.6 kg O2 → 3.6 kg CO2 + 32 MJ Eq. 3
which consumes soot (C) and oxygen and produces carbon dioxide plus some energy. The
Combustion of Intermediate Species (IS) is described by:
MJS-1
S3250 kg
S-1
S 6.387.3 kg
S1
S6.287.2 kg 1
2
2
2
2
2
2
2
PCOIS Eq. 4
where the coefficients are selected so that complete combustion of soot (C) and intermediate
species (IS) produce the same species and thermal energy as direct combustion of the fuel. The
coefficients in the formula are mass weights (not moles).
The advantage of the three-step reaction is that the first reaction has a low activation energy,
which allows the partial burning and heat release of the flare gas. This maintains combustion since
the partial heat released allows the second reaction, which produces most of the heat and all of the
soot, to occur. As in the previous combustion models developed for flare simulations [1, 2], the
flare gas Arrhenius combustion time scale is combined with the turbulence time scale to yield an
overall time scale for the reaction rate. The characteristic time from the kinetics equation was
combined with the characteristic turbulence time scale as:
tturb=C x2 / diff Eq. 5
Radiation Effects on Surrounding Structures from Multi-Point Ground Flares September 9--11, 2015
University of Utah, Salt Lake City, Utah AFRC 2015: Industrial Combustion Symposium
Page 5 of 12
where x is the characteristic cell size, C is a user input constant (0.2E-04), diff is the eddy
diffusivity from the turbulence model, and tturb is the turbulence time scale, i.e. characteristic time
required to mix the contents of a computational cell. The reaction rates are combined by simple
addition of the time scales. This combustion model captures the eddy dissipation effects and local
equivalence ratio effects. The reactions are all based on Arrhenius kinetics with:
Eq. 6
where coefficients C and Activation Temperatures TA are supplied for all reactions. The Arrhenius
kinetics and turbulent mixing are from the commonly used Eddy-Breakup (EBU) type combustion
model.
The kinetics and turbulence models are combined by summing the characteristic time scales. In
addition to these dynamic models, sequences of irreversible chemical reactions that describe the
combustion chemistry are required. To minimize computational load, a minimum number of
chemical reactions are used that fulfill the requirements of total energy yield and species
consumption and production. From the basis of heat transfer, flame size, and air demand the details
of the chemical reactions are not critical as long as the oxygen consumption is correctly balanced
for a given fuel type. To this end, a multi-step chemical reaction model for natural gas was used
to approximate the global reaction mechanism as shown in the equation below:
DX1/dt = Ak*Tb*X1c*X2d Exp(-Ea/T) Eq. 7
where Ak is the pre exponential coefficient, X1 is the mole fraction of natural gas, X2 is the mole
fraction of oxygen, Ea is an activation temperature, T is the local gas temperature, and b, c and d
are global exponents.
Global reaction kinetics are often used to model combustion as a single step in CFD combustion
simulations. The coefficients and powers are fit to existing experimental data. Although it is
possible to use a global reaction mechanism with the same coefficients as those which have been
published elsewhere, this could be misleading because the coefficients were originally fit to
experimental data chosen by other authors for a specific combustion experiment being modeled
and it is well known that simulation results are very sensitive to both the computational grid (cell
structure and density) and the experimental data chosen by the original authors. A different
computational grid or experiment would likely require a different set of reaction coefficients.
In the present work, the global reaction mechanism described by Smith, et. al., 2010 [2] was
used. This work relied on work by Duterque et. al. [15] and Kim [16] as starting points. However,
since these authors adjusted their global reaction coefficients to match “laminar” flame speed data
and since the combustion occurring in gas flares is governed by turbulent mixing, the original
coefficients had limited applicability. The coefficients associated with the activation temperature
and the exponents for mole fractions were based on the physics of the reaction mechanism thus
TTR
N
i
RA
iefC
dt
df/1
Radiation Effects on Surrounding Structures from Multi-Point Ground Flares September 9--11, 2015
University of Utah, Salt Lake City, Utah AFRC 2015: Industrial Combustion Symposium
Page 6 of 12
were not expected to be affected by local grid structure. However, this is not the case for the pre-
exponential coefficient. To match reaction rates to measured combustion rates, the pre-exponential
coefficient was varied to develop the validated combustion model. Also, since the combustion
model depended upon turbulent mixing of flare gas, the combustion was also governed by
turbulent mixing with air. Since the C3d code uses an LES formulation to approximate turbulent
mixing, and since that formulation uses two proportionality coefficients, these were also varied as
parameters to determine the appropriate turbulent combustion model for natural gas. Using this
approach, the required parameters shown in Eq. 7 were determined to establish the combustion
model for the present work.
MODELING ASSUMPTIONS
The following assumptions were utilized in modeling the MPGF flare:
1. Combustion of the flare gas was approximated by the appropriate irreversible chemical
reaction mechanism with specified kinetics (see above).
2. Thermal radiation was calculated using standard radiation models.
3. Ambient wind condition, flare gas inlet temperature and pressure, were set to match as
closely as possible the conditions provided.
Boundary Conditions
The Boundary conditions used were hydrostatic pressure on all boundaries except the ground
boundary (z-axis minimum) which was set as a zero mass-flux wall. A 9 m/s wind was set with
appropriate velocity vectors imposed upon all flux boundaries. The thermal and species boundary
conditions were set to 300 K (27˚C) and air composition respectively, with ambient air set to 23˚C.
Physical and Numerical Sub-model Selection
To simulate fluid flow, the momentum solver was the C3d LES turbulence model as described
above. The energy equation was utilized to capture the temperature changes due to combustion
and mixing. The energy equation also included radiation effects.
The species equations were solved to keep track of the distribution and concentration of fuel,
oxygen, intermediate species, soot, and products of combustion (CO2 and H2O). The combustion
model was used to provide the species equations source and sink terms as a function of species
concentrations, local gas temperature, and turbulent diffusivity.
C3d includes a series of models to predict flame emissivity as a function of molecular gas
composition, soot volume fraction, flame size, shape and temperature distribution. In turn these
variables depend upon solutions to the mass, momentum, energy and species equations. The
radiation transport model is used not only to predict radiation flux on external (and internal)
surfaces, but it also provides source and sink terms to the energy equation so that flame temperature
distribution can be predicted.
Transient Calculation and Post-Processing Results
To set up the steady wind profile, the transient simulation was run for approximately 10 to15
seconds before turning on the flare gas flow. Once the wind profile was established and the flare

Radiation Effects on Surrounding Structures from Multi-Point Ground Flares September 9--11, 2015
University of Utah, Salt Lake City, Utah AFRC 2015: Industrial Combustion Symposium
Page 7 of 12
gas was turned on and ignited, it was allowed to burn for about 17 seconds to capture the
fluctuations caused by interactions with the wind. The 17 second burn time provided essentially
a “steady-state” burning condition of about 10 to 12 seconds.
Since a transient solver was used, all field variables fluctuate in time due to turbulence and the
other non-linearity’s in the equation system. However when examining any field variable, no
gradual slope was observed - just short term fluctuations as expected in turbulent flows.
The convergence criteria chosen for the simulations were that the equation of state was always
satisfied to within 0.1% or less at any location in the computational domain. Typically the
convergence criteria was better than the maximum allowable since the time step constraint was
limited by Courant conditions, which allows the flow field to be solved to a higher degree of
accuracy.
RESULTS
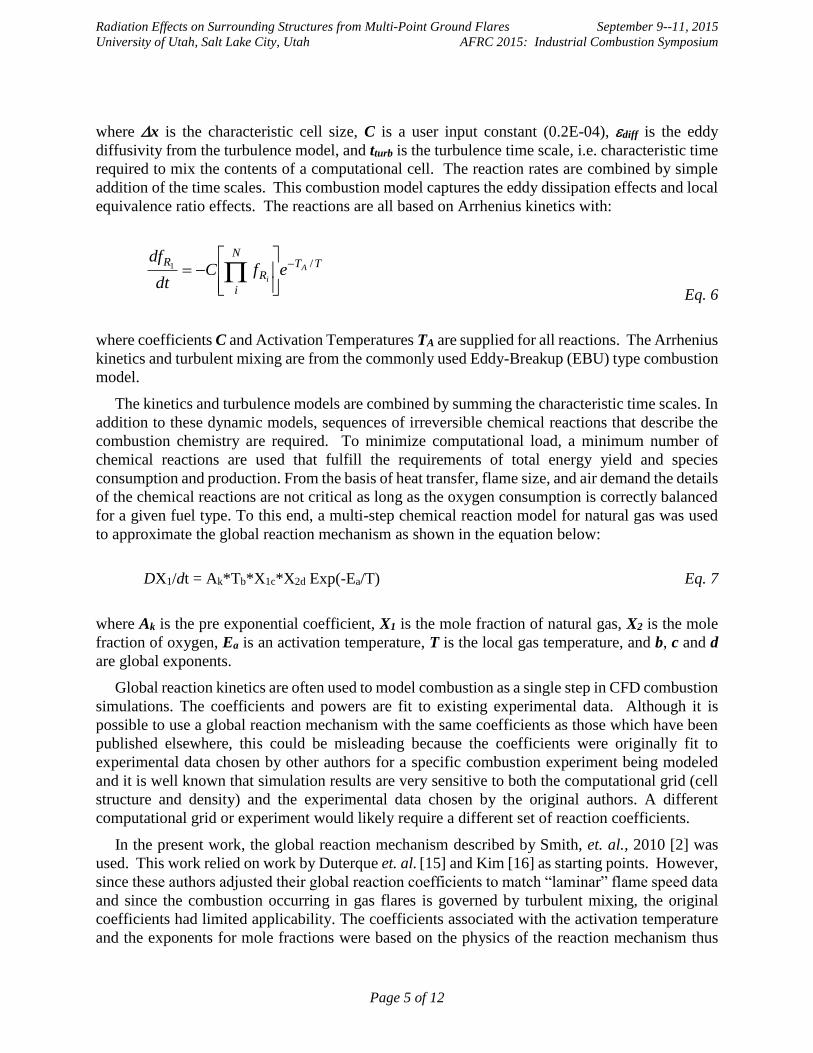
The unignited case was run to determine the dispersion of the fuel cloud and to evaluate the
size of the flammability envelope that was generated. For this case, one-third of the 341 tips from
9 of the 15 stages were venting at a rate of 541,000 lb/hr and were not ignited. The size of this
vapor cloud is illustrated by examining the resulting iso-surface representing 25% of the LEL for
the fuel (see Figure 3). The fuel cloud is being forced towards the structures by the wind, reaching
approximately the pipe rack platform and the knock-out drum before dispersing.
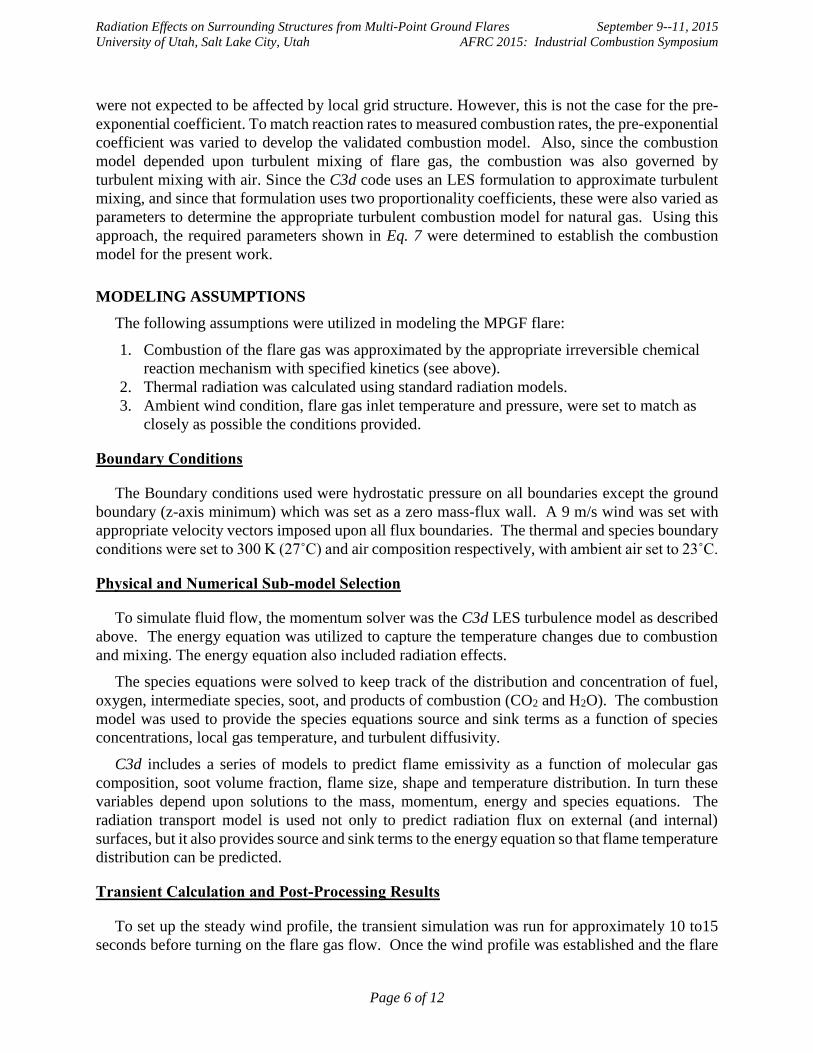
The partially-ignited case had the same stages and tips venting at the same 541,000 lb/hr rate
but 3 of the flare tips on each of the 9 venting stages were ignited and allowed to burn while the
other venting tips were left unignited. The LEL cloud results for this case are shown in Figure 4.
In comparison to the unignited case the cloud is forced up by the buoyant effects of the 27 tips that
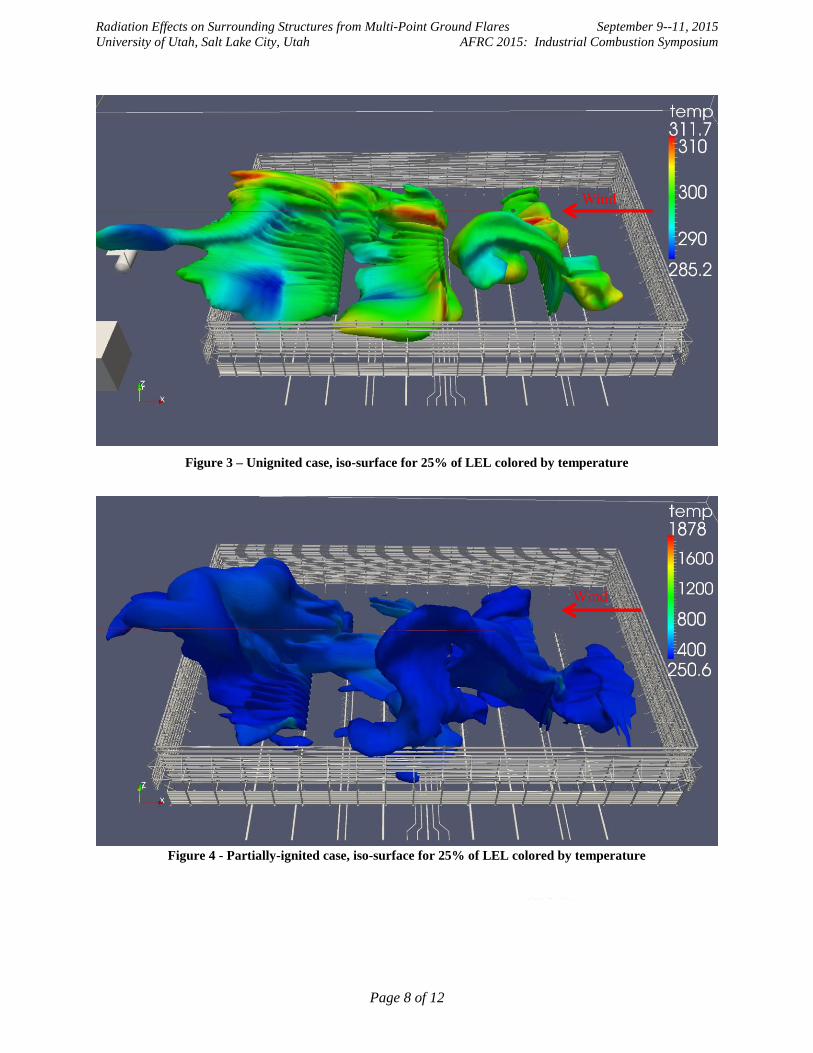
are burning. The radiation flux and the temperatures in the plume near the wind fence are shown
in Figure 5. As shown, the temperatures are very low and as a result the radiation levels on the
fences is negligible. As would be expected, the temperatures and radiation levels are even lower
at the structures downwind of the flare field and wind fence.
.
Radiation Effects on Surrounding Structures from Multi-Point Ground Flares September 9--11, 2015
University of Utah, Salt Lake City, Utah AFRC 2015: Industrial Combustion Symposium
Page 8 of 12
Figure 3 – Unignited case, iso-surface for 25% of LEL colored by temperature
Figure 4 - Partially-ignited case, iso-surface for 25% of LEL colored by temperature
Wind
Wind
Radiation Effects on Surrounding Structures from Multi-Point Ground Flares September 9--11, 2015
University of Utah, Salt Lake City, Utah AFRC 2015: Industrial Combustion Symposium
Page 9 of 12
Figure 5 – Contour plot of temperatures shown on planes located just beyond the fence
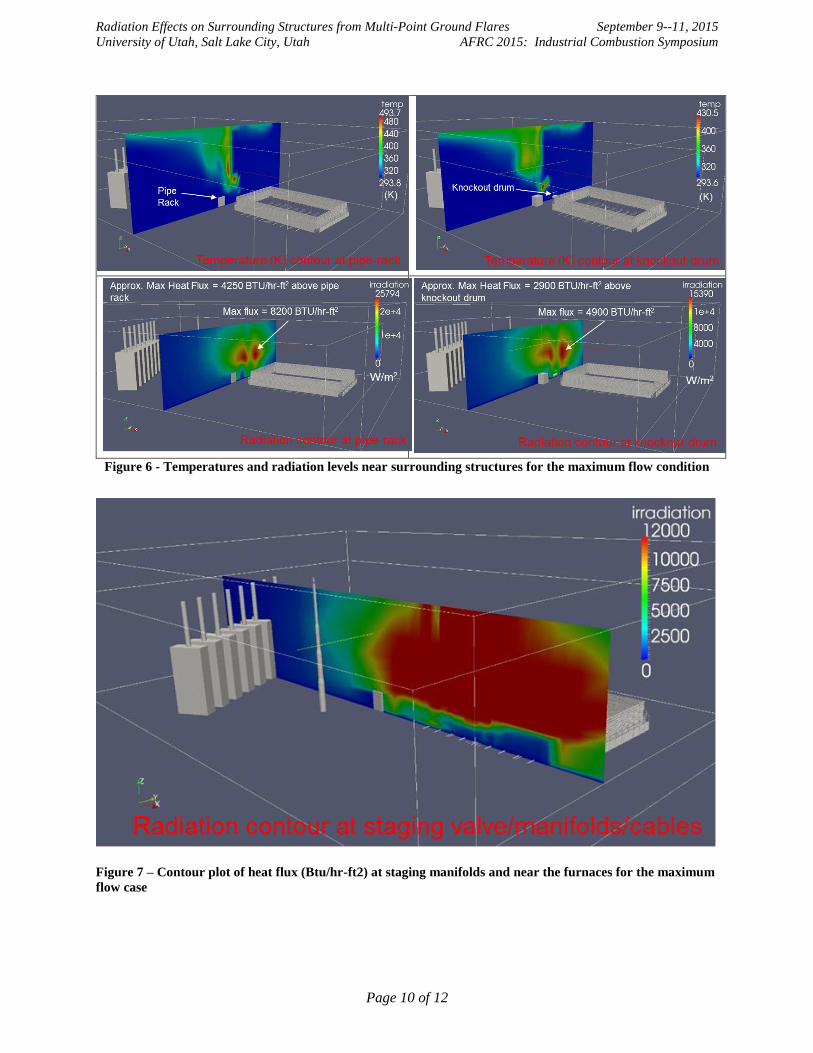
In contrast to the low temperatures of the partially-ignited case (Figure 5) the maximum flow
cases showed higher temperatures and radiation levels near the structures adjacent to the flare field
(see Figure 6). Comparing the temperatures on the vertical planes near the pipe rack and the knock-
out drum (slightly further from MPGF), it is evident that the plume is rising quickly from the flare
even in a 9 m/s wind. The impact of the fence as a radiation shield can be seen in both the
temperature and radiation contours. Temperatures several meters above the pipe rack and knock-
out drum are about 100°C but closer to the structures the temperatures are near ambient. The
radiation levels are more telling, with peaks reaching over 8000 BTU/hr◦ft2 near the structures
which decreases to below 3000 BTU/hr◦ft2at the structures themselves. The effect of the fence is
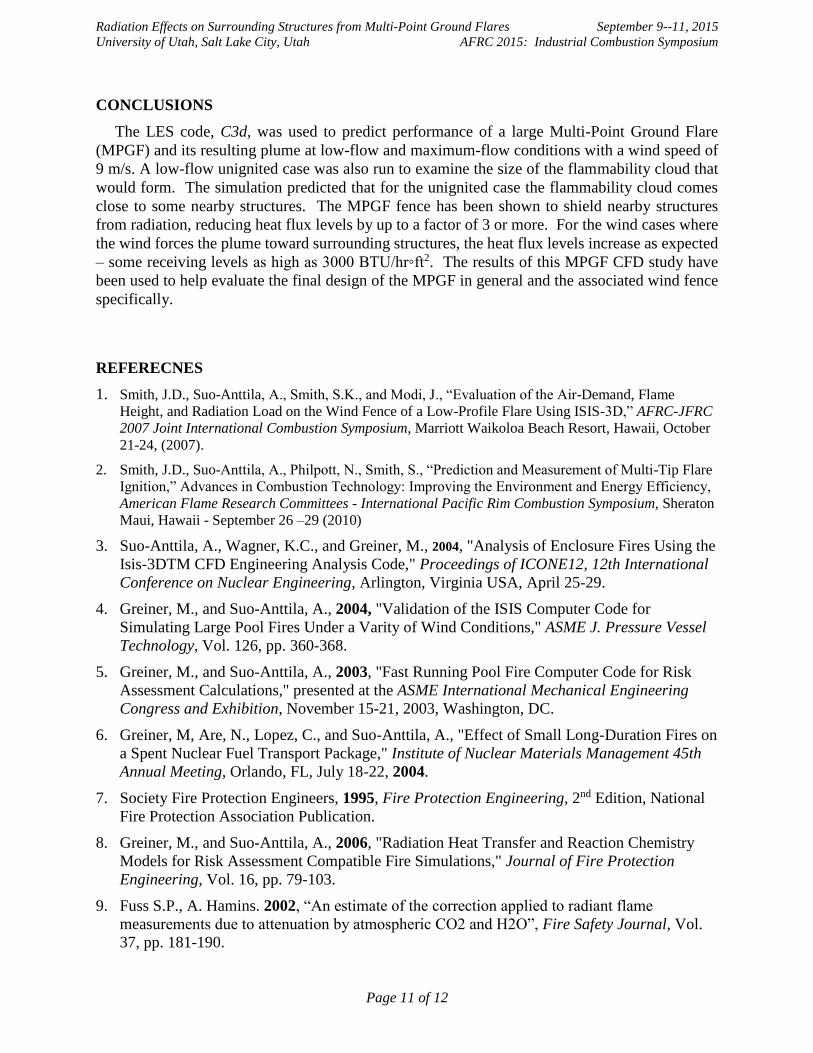
shown more dramatically at the manifold location (see Figure 7). The radiation levels on this plane
above the fence are approximately 4000 BTU/hr◦ft2while the levels below the fence are closer to
1250 BTU/hr◦ft2. Also, as shown in Figure 7, the radiation levels drop very rapidly downwind of
the closest structures to the flare field. The maximum heat flux predicted on the elevated flare
structure is 1550 BTU/hr◦ft2 while the maximum heat flux on the furnaces is only 215 BTU/hr◦ft2.
Fence temperatures are also predicted which is useful in evaluating the final fence design.
Wind
Radiation Effects on Surrounding Structures from Multi-Point Ground Flares September 9--11, 2015
University of Utah, Salt Lake City, Utah AFRC 2015: Industrial Combustion Symposium
Page 10 of 12
Figure 6 - Temperatures and radiation levels near surrounding structures for the maximum flow condition
Figure 7 – Contour plot of heat flux (Btu/hr-ft2) at staging manifolds and near the furnaces for the maximum
flow case
Radiation Effects on Surrounding Structures from Multi-Point Ground Flares September 9--11, 2015
University of Utah, Salt Lake City, Utah AFRC 2015: Industrial Combustion Symposium
Page 11 of 12
CONCLUSIONS
The LES code, C3d, was used to predict performance of a large Multi-Point Ground Flare
(MPGF) and its resulting plume at low-flow and maximum-flow conditions with a wind speed of
9 m/s. A low-flow unignited case was also run to examine the size of the flammability cloud that
would form. The simulation predicted that for the unignited case the flammability cloud comes
close to some nearby structures. The MPGF fence has been shown to shield nearby structures
from radiation, reducing heat flux levels by up to a factor of 3 or more. For the wind cases where
the wind forces the plume toward surrounding structures, the heat flux levels increase as expected
– some receiving levels as high as 3000 BTU/hr◦ft2. The results of this MPGF CFD study have
been used to help evaluate the final design of the MPGF in general and the associated wind fence
specifically.
REFERECNES
1. Smith, J.D., Suo-Anttila, A., Smith, S.K., and Modi, J., “Evaluation of the Air-Demand, Flame
Height, and Radiation Load on the Wind Fence of a Low-Profile Flare Using ISIS-3D,” AFRC-JFRC
2007 Joint International Combustion Symposium, Marriott Waikoloa Beach Resort, Hawaii, October
21-24, (2007).
2. Smith, J.D., Suo-Anttila, A., Philpott, N., Smith, S., “Prediction and Measurement of Multi-Tip Flare
Ignition,” Advances in Combustion Technology: Improving the Environment and Energy Efficiency, American Flame Research Committees - International Pacific Rim Combustion Symposium, Sheraton
Maui, Hawaii - September 26 –29 (2010)
3. Suo-Anttila, A., Wagner, K.C., and Greiner, M., 2004, "Analysis of Enclosure Fires Using the
Isis-3DTM CFD Engineering Analysis Code," Proceedings of ICONE12, 12th International
Conference on Nuclear Engineering, Arlington, Virginia USA, April 25-29.
4. Greiner, M., and Suo-Anttila, A., 2004, "Validation of the ISIS Computer Code for
Simulating Large Pool Fires Under a Varity of Wind Conditions," ASME J. Pressure Vessel
Technology, Vol. 126, pp. 360-368.
5. Greiner, M., and Suo-Anttila, A., 2003, "Fast Running Pool Fire Computer Code for Risk
Assessment Calculations," presented at the ASME International Mechanical Engineering
Congress and Exhibition, November 15-21, 2003, Washington, DC.
6. Greiner, M, Are, N., Lopez, C., and Suo-Anttila, A., "Effect of Small Long-Duration Fires on
a Spent Nuclear Fuel Transport Package," Institute of Nuclear Materials Management 45th
Annual Meeting, Orlando, FL, July 18-22, 2004.
7. Society Fire Protection Engineers, 1995, Fire Protection Engineering, 2nd Edition, National
Fire Protection Association Publication.
8. Greiner, M., and Suo-Anttila, A., 2006, "Radiation Heat Transfer and Reaction Chemistry
Models for Risk Assessment Compatible Fire Simulations," Journal of Fire Protection
Engineering, Vol. 16, pp. 79-103.
9. Fuss S.P., A. Hamins. 2002, “An estimate of the correction applied to radiant flame
measurements due to attenuation by atmospheric CO2 and H2O”, Fire Safety Journal, Vol.
37, pp. 181-190.
Radiation Effects on Surrounding Structures from Multi-Point Ground Flares September 9--11, 2015
University of Utah, Salt Lake City, Utah AFRC 2015: Industrial Combustion Symposium
Page 12 of 12
10. Suo-Anttila, A., Smith, J.D., “Application of ISIS Computer Code to Gas Flares Under Varying Wind
Conditions,” 2006 American Flame Research Committee International Symposium, Houston, TX,
October 16-18 (2006).
11. Smith, J.D., Jackson,R, Suo-Anttila, A., Hefley, K., Wade, D., Allen, D., Smith, S “Prediction
and Measurement of Multi-Tip Flare Ignition” American Flame Research Committees 2013 –
Industrial Combustion Symposium, Safe and Responsible Development in the 21st Century,
Sheraton Kauai, Hawaii - September 22 –25, 2013
12. Wilkins B. “Statoil Flare Ignition Tests,” Kollsnes, 26/8-09. CMR Gexcon Technical Note
November (2009).
13. Said, R., Garo, A., and Borghi, R., “Soot Formation Modeling for Turbulent Flames,”
Combustion and Flame, Vol 108, pp. 71-86 (1997).
14. Monnot, G. Principles of Turbulent Fired Heat. Edition Technips, Paris (1985).
15. Duterque J., Roland B., Helene T., “Study of Quasi-Global Schemes for Hydrocarbon
Combustion,” Combustion Science and Technology, 26 (1-2), 1-15 (1981).
16. Kim I. K., Maruts K. “A Numerical Study on Propagation of Premix Flames in Small
Tubes,” Combustion and Flame, 146, 283-301 (2006).
.