Embed Size (px)
Citation preview
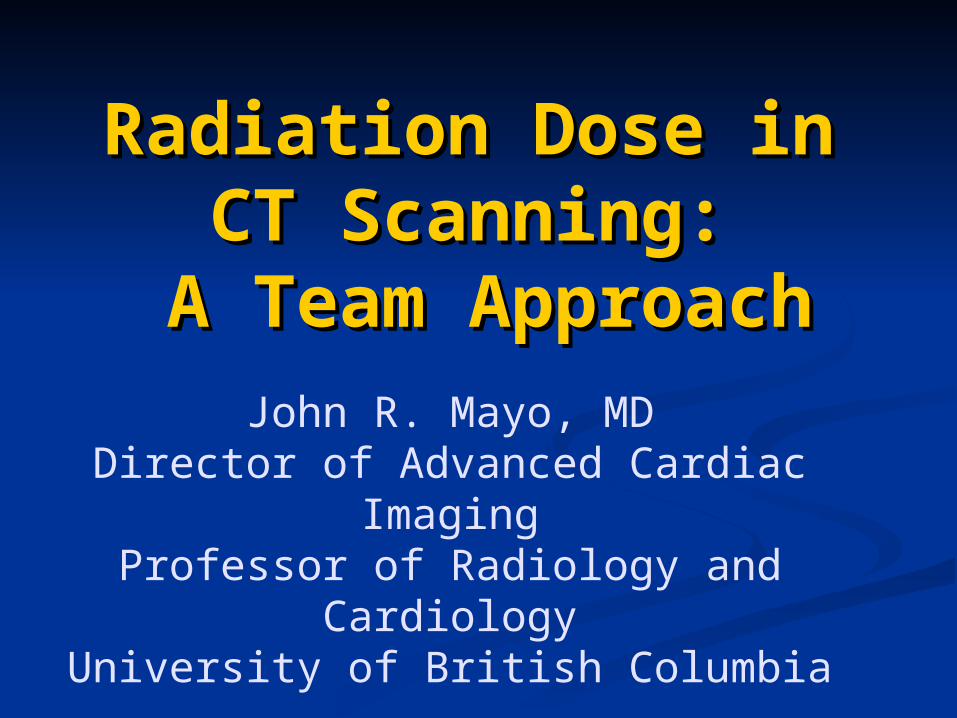
Radiation Dose in Radiation Dose in CT Scanning:CT Scanning:
A Team Approach A Team ApproachJohn R. Mayo, MD
Director of Advanced Cardiac ImagingProfessor of Radiology and Cardiology
University of British Columbia
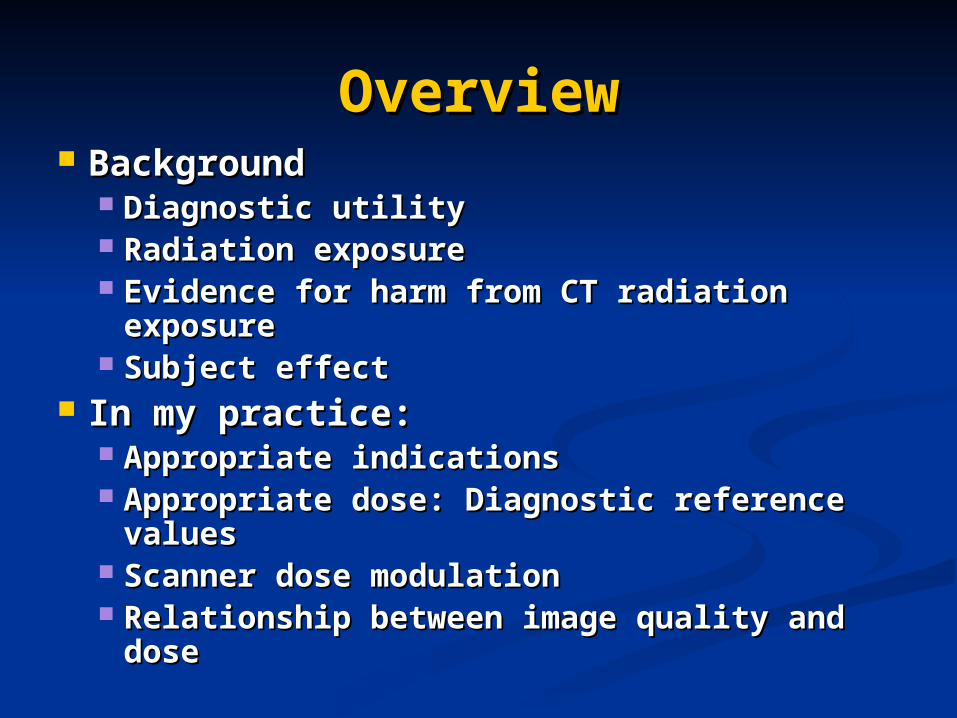
OverviewOverview BackgroundBackground
Diagnostic utilityDiagnostic utility Radiation exposureRadiation exposure Evidence for harm from CT radiation Evidence for harm from CT radiation
exposureexposure Subject effectSubject effect
In my practice:In my practice: Appropriate indicationsAppropriate indications Appropriate dose: Diagnostic reference Appropriate dose: Diagnostic reference
valuesvalues Scanner dose modulationScanner dose modulation Relationship between image quality and Relationship between image quality and
dosedose
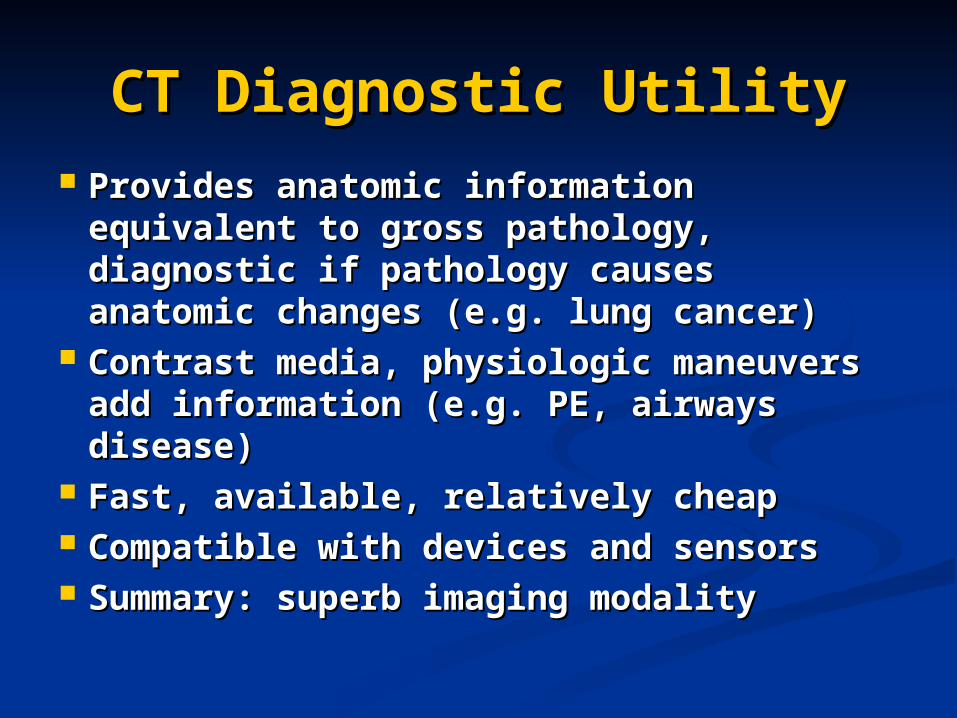
CT Diagnostic UtilityCT Diagnostic Utility Provides anatomic information Provides anatomic information
equivalent to gross pathology, equivalent to gross pathology, diagnostic if pathology causes anatomic diagnostic if pathology causes anatomic changes (e.g. lung cancer)changes (e.g. lung cancer)
Contrast media, physiologic maneuvers Contrast media, physiologic maneuvers add information (e.g. PE, airways add information (e.g. PE, airways disease)disease)
Fast, available, relatively cheapFast, available, relatively cheap Compatible with devices and sensorsCompatible with devices and sensors Summary: superb imaging modalitySummary: superb imaging modality
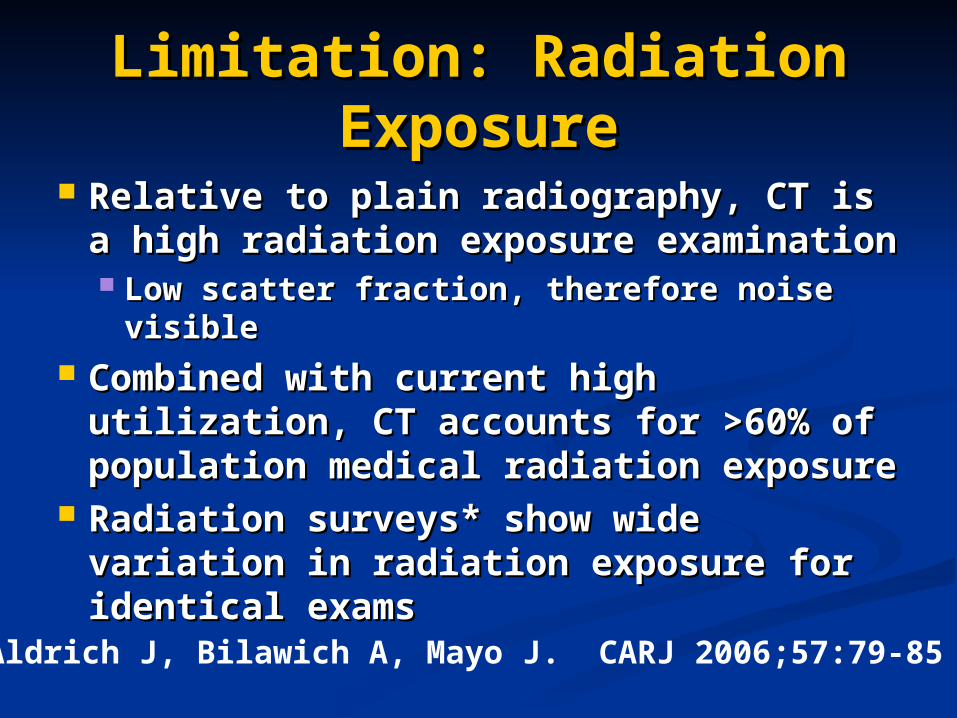
Limitation: Radiation Limitation: Radiation ExposureExposure
Relative to plain radiography, CT is a Relative to plain radiography, CT is a high radiation exposure examinationhigh radiation exposure examination Low scatter fraction, therefore noise Low scatter fraction, therefore noise
visiblevisible Combined with current high Combined with current high
utilization, CT accounts for >60% of utilization, CT accounts for >60% of population medical radiation exposurepopulation medical radiation exposure
Radiation surveys* show wide Radiation surveys* show wide variation in radiation exposure for variation in radiation exposure for identical examsidentical exams
*Aldrich J, Bilawich A, Mayo J. CARJ 2006;57:79-85
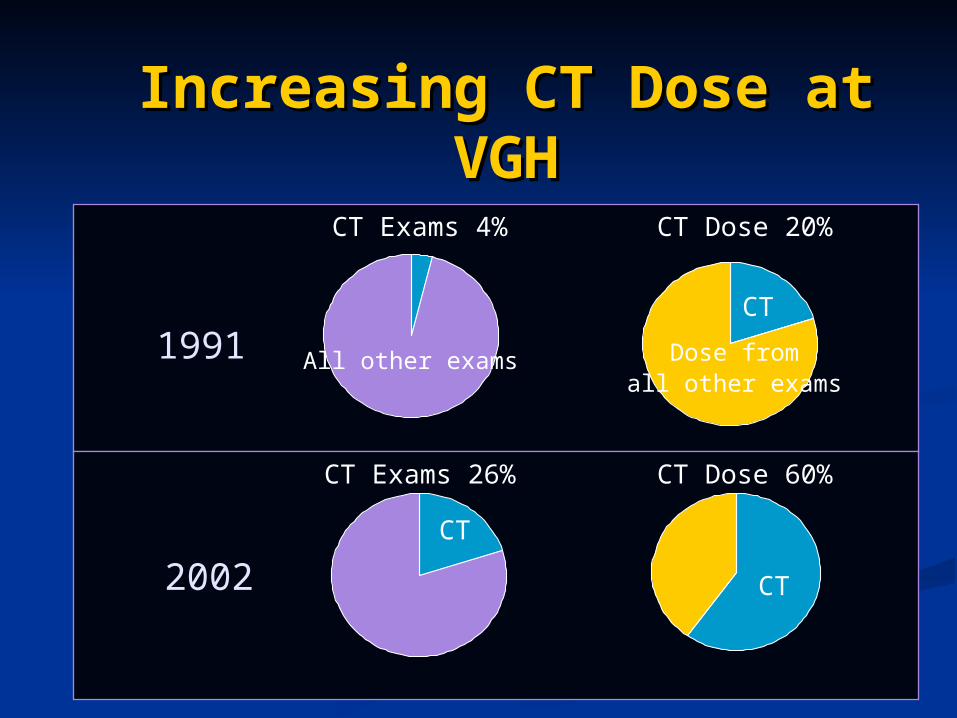
Increasing CT Dose at Increasing CT Dose at VGHVGH
1991
2002
CT Exams 4%
CT Exams 26%
CT Dose 20%
CT Dose 60%
CT
Dose fromall other exams
All other exams
CT
CT
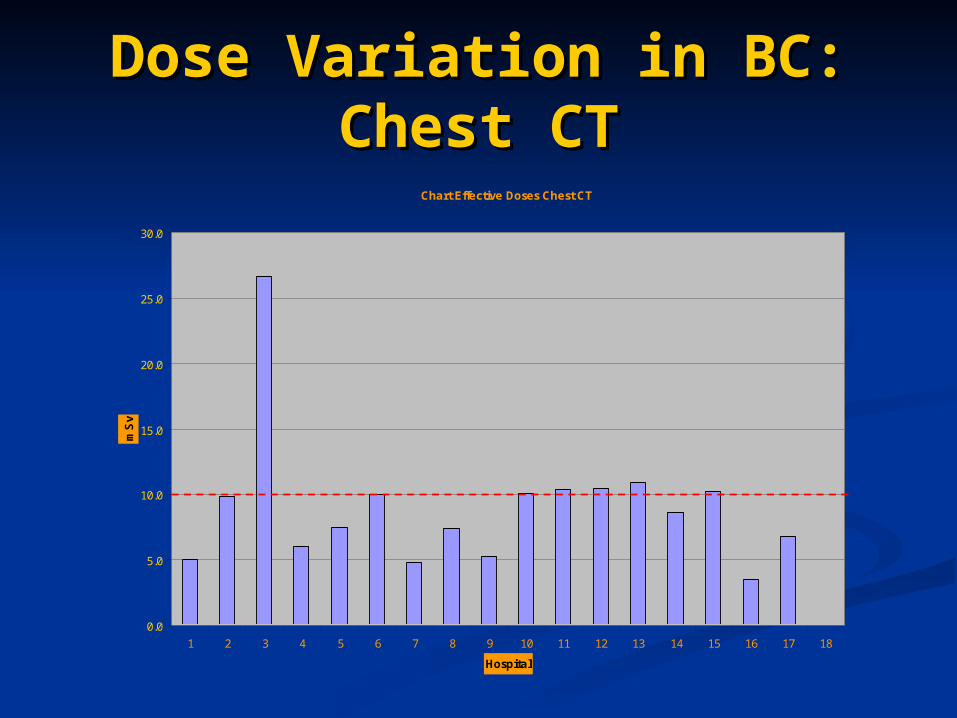
Dose Variation in BC: Dose Variation in BC: Chest CTChest CT
Chart Effective Doses Chest CT
0.0
5.0
10.0
15.0
20.0
25.0
30.0
1 2 3 4 5 6 7 8 9 10 11 12 13 14 15 16 17 18
Hospital
mS
v
BC Reference Level
Is CT Radiation Exposure Is CT Radiation Exposure Harmful?Harmful?
Debate about harm from exposures <20 Debate about harm from exposures <20 mSvmSv
Limitations in Atomic Bomb data:Limitations in Atomic Bomb data: Limited dosimetry Limited dosimetry Particulate as well as x-ray, gamma exposureParticulate as well as x-ray, gamma exposure Environmental toxinsEnvironmental toxins Mono-ethnic exposure (Japanese)Mono-ethnic exposure (Japanese) War time stressed populationWar time stressed population
Advantages of Atomic Bomb dataAdvantages of Atomic Bomb data Population cross section with point exposure Population cross section with point exposure
New Low Level Radiation New Low Level Radiation StudyStudy
15 country study* of low level radiation exposure15 country study* of low level radiation exposure Outcome: cancer incidence, fatal cancer rateOutcome: cancer incidence, fatal cancer rate Cohort: 407,000 atomic industry workers, >5 Cohort: 407,000 atomic industry workers, >5
million person years follow-up, 90% males, million person years follow-up, 90% males, average exposure 19 mSv, excellent dosimetryaverage exposure 19 mSv, excellent dosimetry
Results: Increased risk of cancer, dose response Results: Increased risk of cancer, dose response effect, risk not dominated by high level exposureeffect, risk not dominated by high level exposure
Conclusion: supports concept of small but Conclusion: supports concept of small but measurable cancer risk at low exposure (<20 measurable cancer risk at low exposure (<20 mSv)mSv)
*Cardis E et al. Radiation Research 2007;167:396-416.
New Low Level Radiation New Low Level Radiation StudyStudy
Limitation:Limitation: No data on childrenNo data on children Limited data on females, 98% of the Limited data on females, 98% of the
dose was received by malesdose was received by males The study loses significance if lung The study loses significance if lung
cancer in Canadian workers is cancer in Canadian workers is excludedexcluded
This may indicate inadequate control This may indicate inadequate control for smoking in Canadian cohortfor smoking in Canadian cohort
CT scanner dose CT scanner dose modifiersmodifiers
The cancer inducing effect of low dose The cancer inducing effect of low dose radiation varies according to:radiation varies according to: The subject (age, sex)The subject (age, sex) The exposed region’s radiation sensitivityThe exposed region’s radiation sensitivity The CT scanner radiation distribution:The CT scanner radiation distribution:
Position in scannerPosition in scanner Bow tie filtrationBow tie filtration Dose modulationDose modulation Position of arms, subcutaneous fat, radio-Position of arms, subcutaneous fat, radio-
opaque objectsopaque objects CT has highly asymmetric dose, (high CT has highly asymmetric dose, (high
surface, low central) which causes surface, low central) which causes problems in dosimetryproblems in dosimetry
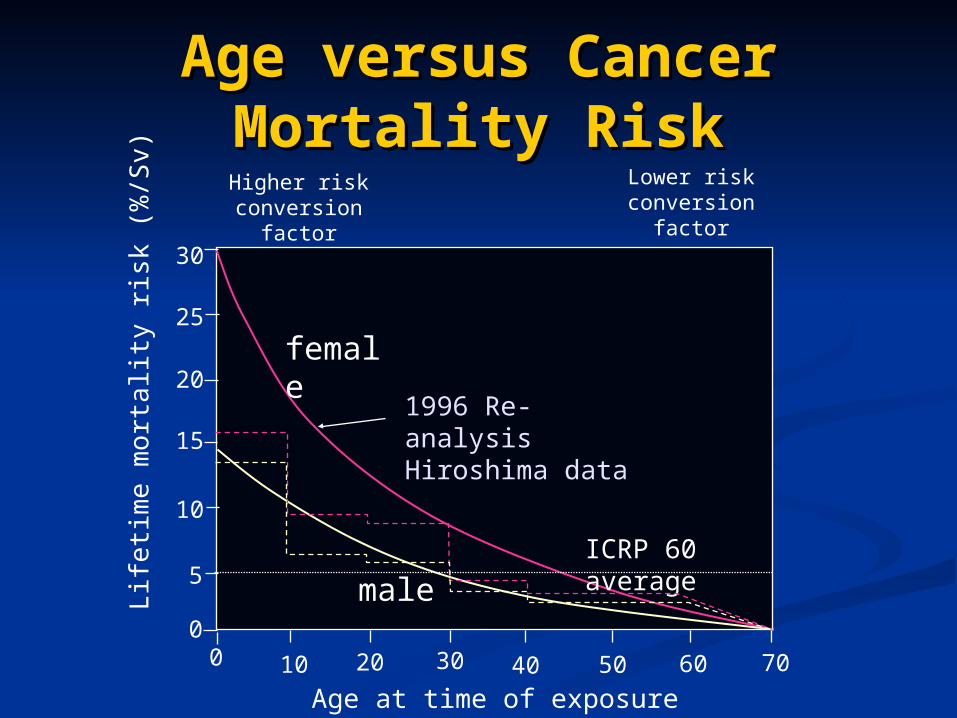
Age versus Cancer Age versus Cancer Mortality RiskMortality Risk
Lif
etim
e m
orta
lity
risk
(%
/Sv)
10 706040 503020
15
30
10
5
0
20
25
0
Age at time of exposure
female
maleICRP 60 average
1996 Re-analysis Hiroshima data
Higher risk conversion
factor
Lower risk conversion
factor
Estimation of risk: Estimation of risk: Equivalent DoseEquivalent Dose
For the reference subject, a 30 year old For the reference subject, a 30 year old hermaphrodite, the risk is 50 excess hermaphrodite, the risk is 50 excess fatal cancers per million exposed to 1 fatal cancers per million exposed to 1 mSvmSv
This compares to the natural cancer This compares to the natural cancer risk of 250,000 cancer deaths per risk of 250,000 cancer deaths per millionmillion
Risk is strongly influenced by age Risk is strongly influenced by age (lower in older patients (mobile (lower in older patients (mobile fossils)), and gender (higher in females) fossils)), and gender (higher in females)
SummarySummary
Since there appears to be a risk, we Since there appears to be a risk, we should only perform “indicated” examsshould only perform “indicated” exams
Unfortunately, the evidence base for Unfortunately, the evidence base for “indicated” imaging investigations is “indicated” imaging investigations is minimalminimal
Radiologists should minimize CT Radiologists should minimize CT radiation exposure without radiation exposure without compromising diagnostic accuracycompromising diagnostic accuracy
Special consideration: children, young Special consideration: children, young adultsadults
Appropriate UseAppropriate Use All CT examinations must have appropriate All CT examinations must have appropriate
indications with supportive:indications with supportive: HistoryHistory Clinical findingsClinical findings Laboratory findingsLaboratory findings When evidence based, appropriate clinical When evidence based, appropriate clinical
decision making support (e.g. Well’s criteria for decision making support (e.g. Well’s criteria for PE)PE)
Screening exams (e.g. lung cancer Screening exams (e.g. lung cancer screening) should be evidence basedscreening) should be evidence based
Follow up exams should affect managementFollow up exams should affect management
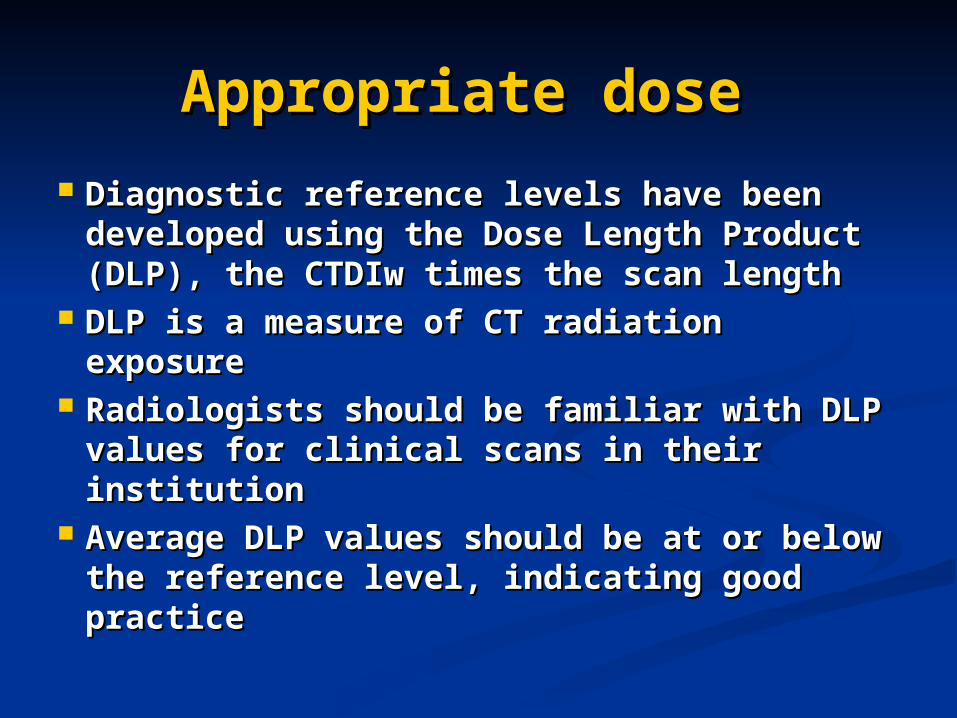
Appropriate dose Appropriate dose
Diagnostic reference levels have been Diagnostic reference levels have been developed using the Dose Length Product developed using the Dose Length Product (DLP), the CTDIw times the scan length(DLP), the CTDIw times the scan length
DLP is a measure of CT radiation exposureDLP is a measure of CT radiation exposure Radiologists should be familiar with DLP Radiologists should be familiar with DLP
values for clinical scans in their institutionvalues for clinical scans in their institution Average DLP values should be at or below Average DLP values should be at or below
the reference level, indicating good the reference level, indicating good practicepractice
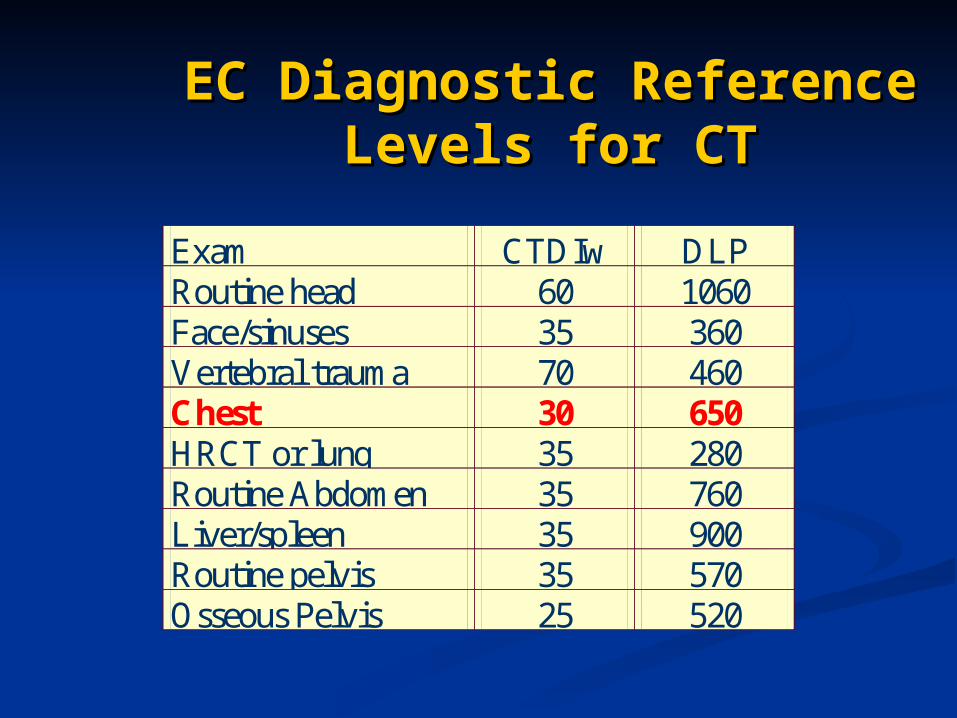
EC Diagnostic Reference EC Diagnostic Reference Levels for CTLevels for CT
Exam CTDIw DLP Routine head 60 1060 Face/sinuses 35 360 Vertebral trauma 70 460 Chest 30 650 HRCT or lung 35 280 Routine Abdomen 35 760 Liver/spleen 35 900 Routine pelvis 35 570 Osseous Pelvis 25 520
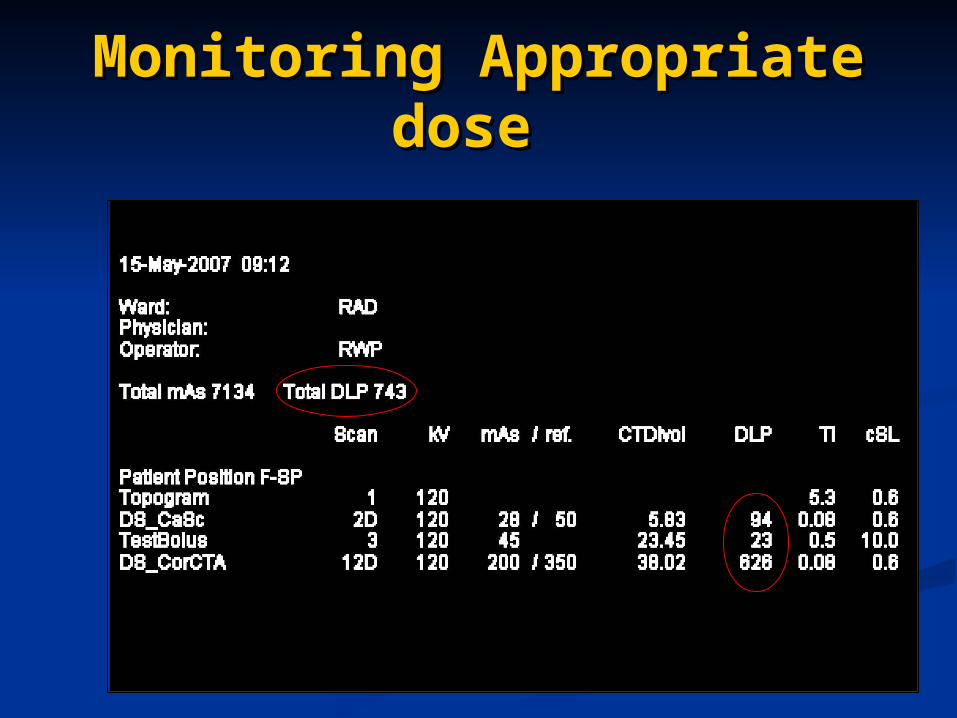
Monitoring Appropriate Monitoring Appropriate dose dose
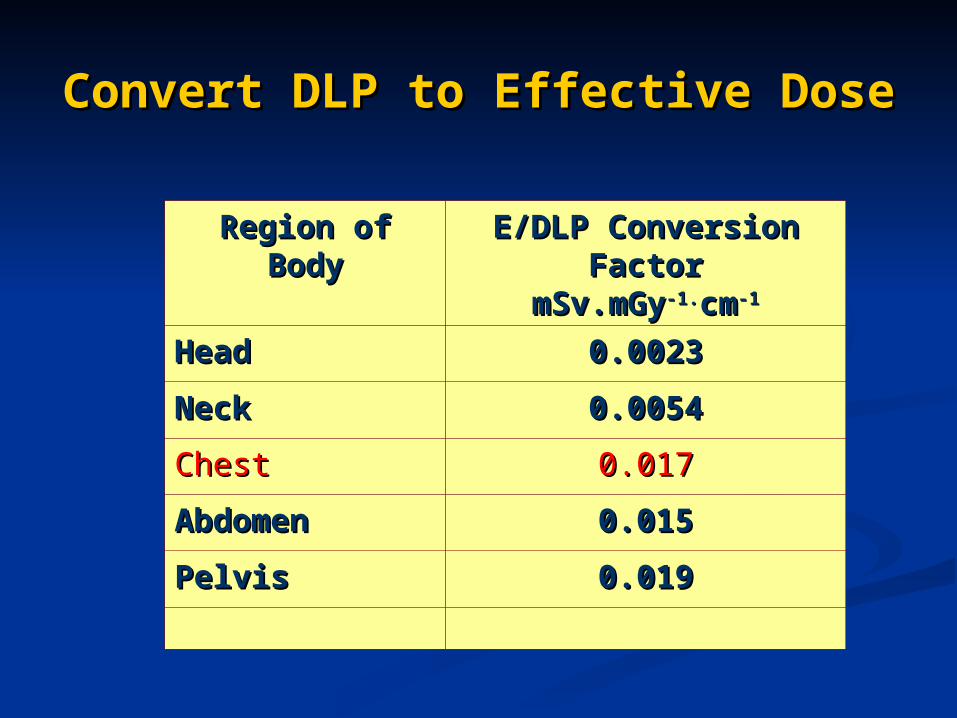
Convert DLP to Effective DoseConvert DLP to Effective Dose
Region of Region of BodyBody
E/DLP Conversion E/DLP Conversion FactorFactor
mSv.mGymSv.mGy-1.-1.cmcm-1-1
HeadHead 0.00230.0023
NeckNeck 0.00540.0054
ChestChest 0.0170.017
AbdomenAbdomen 0.0150.015
PelvisPelvis 0.0190.019
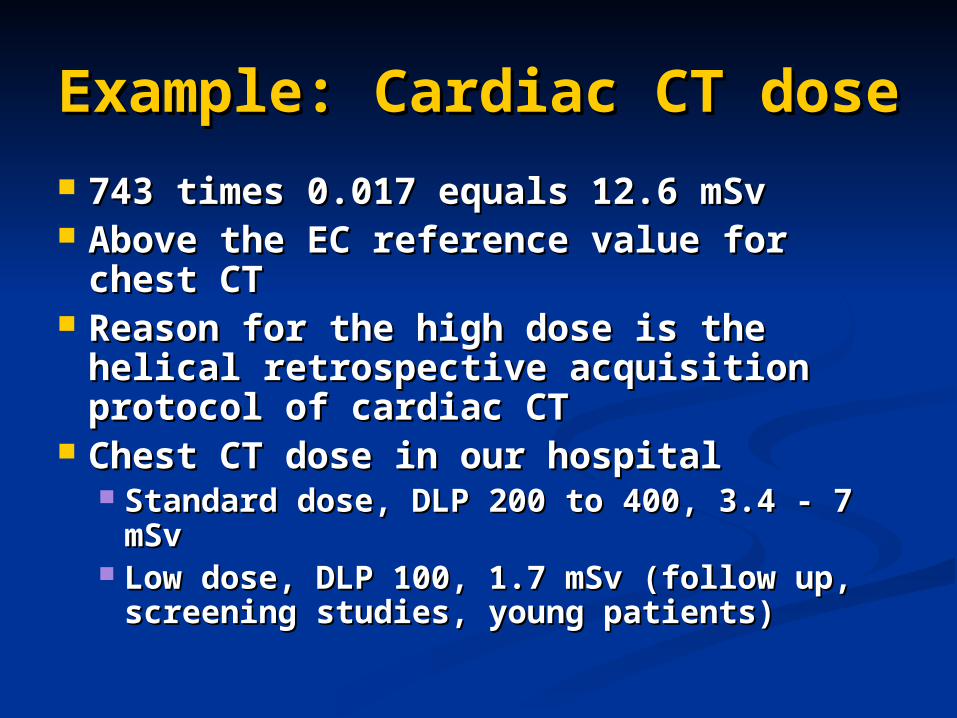
Example: Cardiac CT Example: Cardiac CT dosedose
743 times 0.017 equals 12.6 mSv743 times 0.017 equals 12.6 mSv Above the EC reference value for Above the EC reference value for
chest CTchest CT Reason for the high dose is the Reason for the high dose is the
helical retrospective acquisition helical retrospective acquisition protocol of cardiac CTprotocol of cardiac CT
Chest CT dose in our hospital Chest CT dose in our hospital Standard dose, DLP 200 to 400, 3.4 - 7 Standard dose, DLP 200 to 400, 3.4 - 7
mSvmSv Low dose, DLP 100, 1.7 mSv (follow up, Low dose, DLP 100, 1.7 mSv (follow up,
screening studies, young patients) screening studies, young patients)
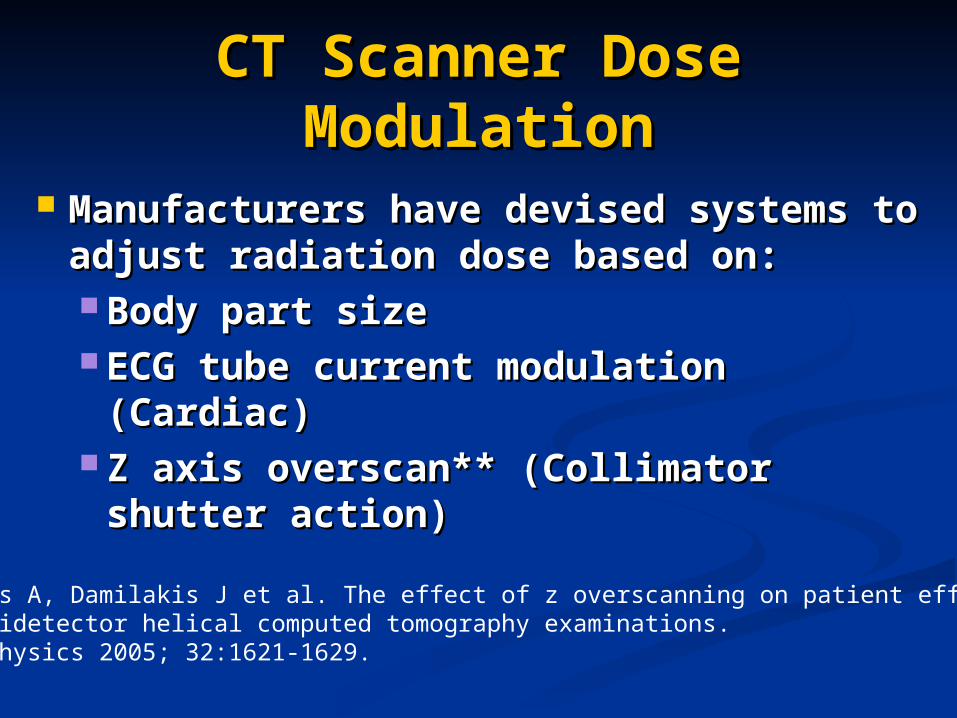
CT Scanner Dose CT Scanner Dose ModulationModulation
Manufacturers have devised systems Manufacturers have devised systems to adjust radiation dose based on:to adjust radiation dose based on: Body part sizeBody part size ECG tube current modulation ECG tube current modulation
(Cardiac)(Cardiac) Z axis overscan** (Collimator shutter Z axis overscan** (Collimator shutter
action)action)
* Tzedakis A, Damilakis J et al. The effect of z overscanning on patient effective dose from multidetector helical computed tomography examinations. Medical Physics 2005; 32:1621-1629.
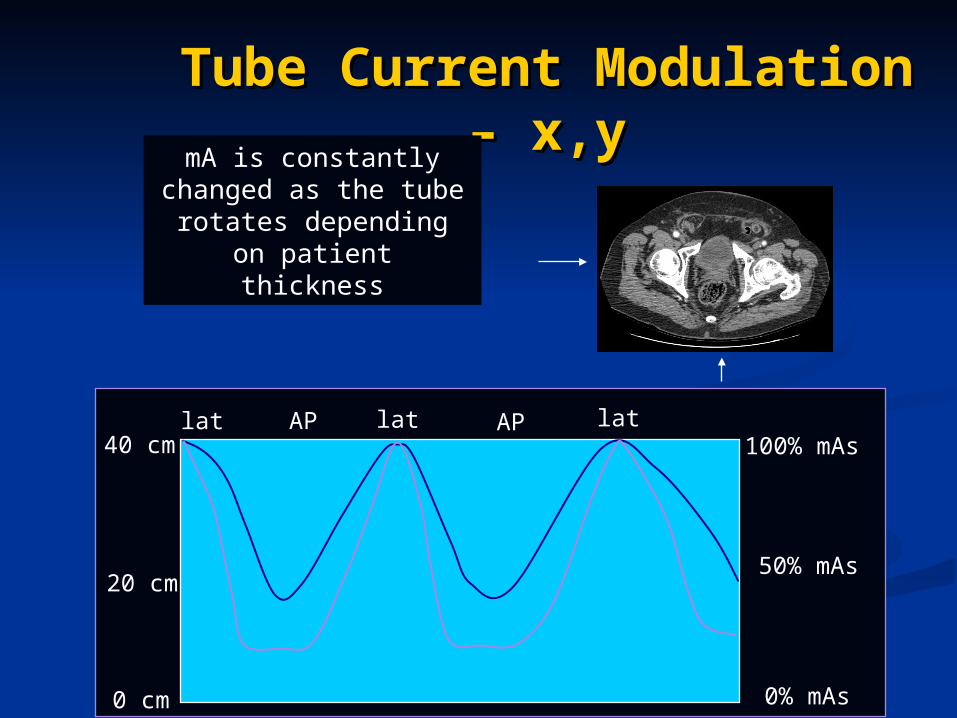
Tube Current Modulation Tube Current Modulation – x,y– x,y
40 cm
20 cm
0 cm
100% mAs
50% mAs
0% mAs
mA is constantly changed as the tube rotates depending on
patient thickness
latlat latAPAP
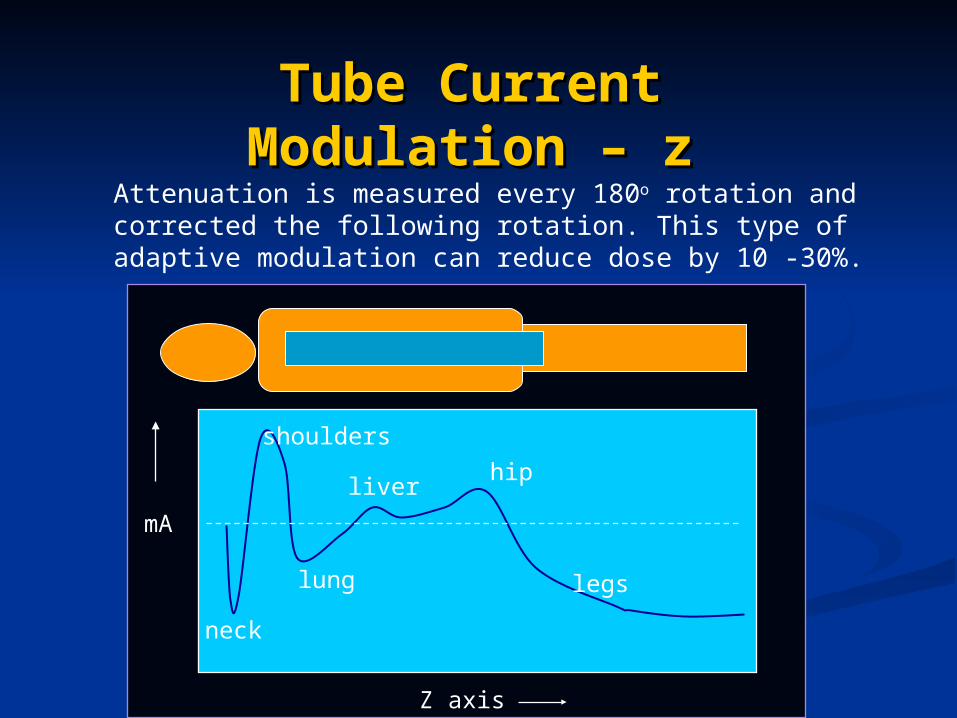
Tube Current Tube Current Modulation – zModulation – z
neck
mA
lung
shoulders
hipliver
legs
Attenuation is measured every 180o rotation and corrected the following rotation. This type of adaptive modulation can reduce dose by 10 -30%.
Z axis
Combined tube current Combined tube current modulation (x,y,z)modulation (x,y,z)
Provides acceptable noise and Provides acceptable noise and diagnostic informationdiagnostic information
Substantial reduction in Substantial reduction in radiation dose, up to 42%*radiation dose, up to 42%*
Should be used in most patientsShould be used in most patients
* Rizzo S et al, AJR 2006; 186:673-679
Technologist trainingTechnologist training
Radiologists must ensure that Radiologists must ensure that technologists are minimizing technologists are minimizing exposure by:exposure by: Ensuring the minimum patient Ensuring the minimum patient
volume is scannedvolume is scanned Ensuring all dose modulation Ensuring all dose modulation
techniques are consistently usedtechniques are consistently used Ensuring patients are centered in Ensuring patients are centered in
the gantrythe gantry
Image quality and doseImage quality and dose
Radiologists consistently correlate Radiologists consistently correlate increased image quality with increased image quality with increased doseincreased dose
However, little research into the However, little research into the impact of radiation dose on impact of radiation dose on diagnostic accuracydiagnostic accuracy
Computer simulated dose Computer simulated dose reduction is a useful experimental reduction is a useful experimental technique for this research*technique for this research**Mayo JR et al. Radiology 1997;202:453-457
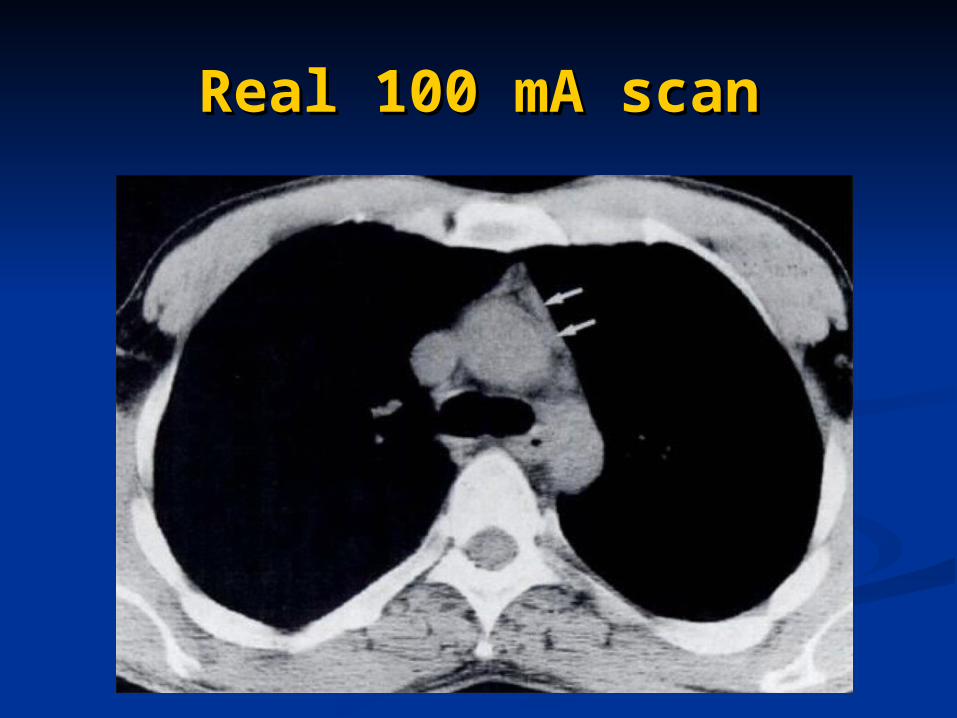
Real 100 mA scanReal 100 mA scan
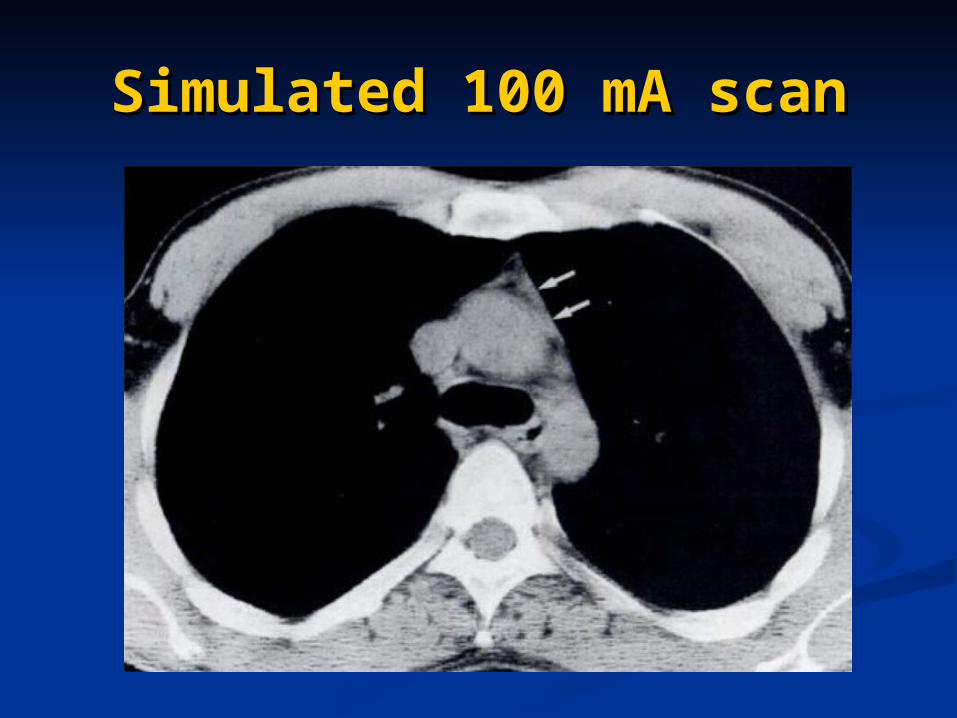
Simulated 100 mA scanSimulated 100 mA scan
Computer simulated Computer simulated reduced dose scansreduced dose scans
In a side by side trial of real In a side by side trial of real versus simulated reduced dose versus simulated reduced dose scans the real scan was correctly scans the real scan was correctly identified 50.1% of the timeidentified 50.1% of the time
AdvantagesAdvantages No additional radiation doseNo additional radiation dose Reduced dose scans have identical Reduced dose scans have identical
location, level of inspiration and location, level of inspiration and artifactartifact
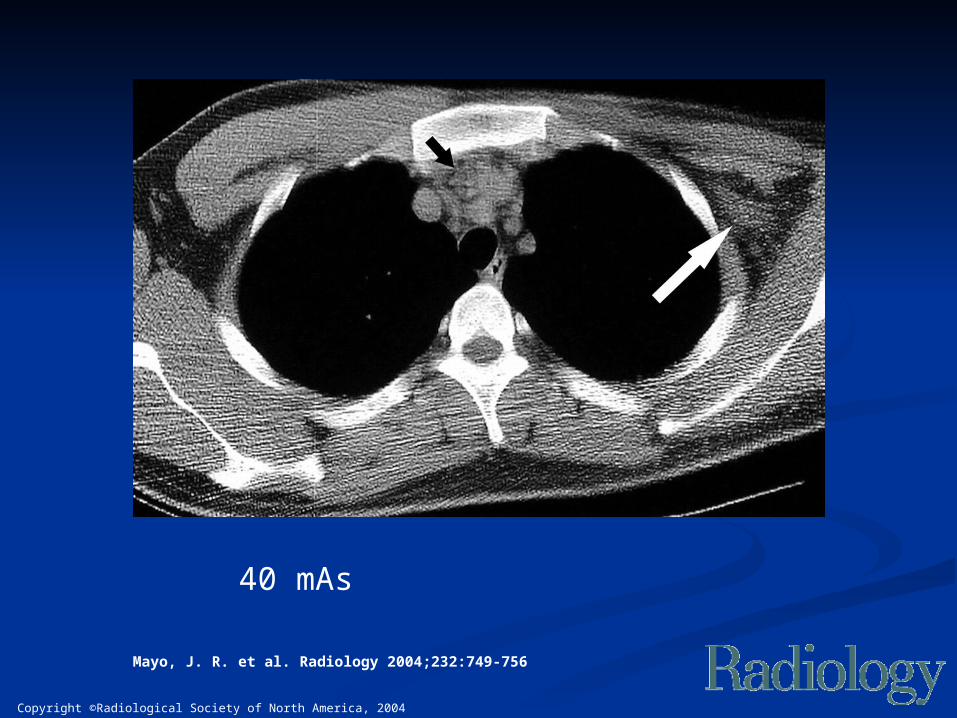
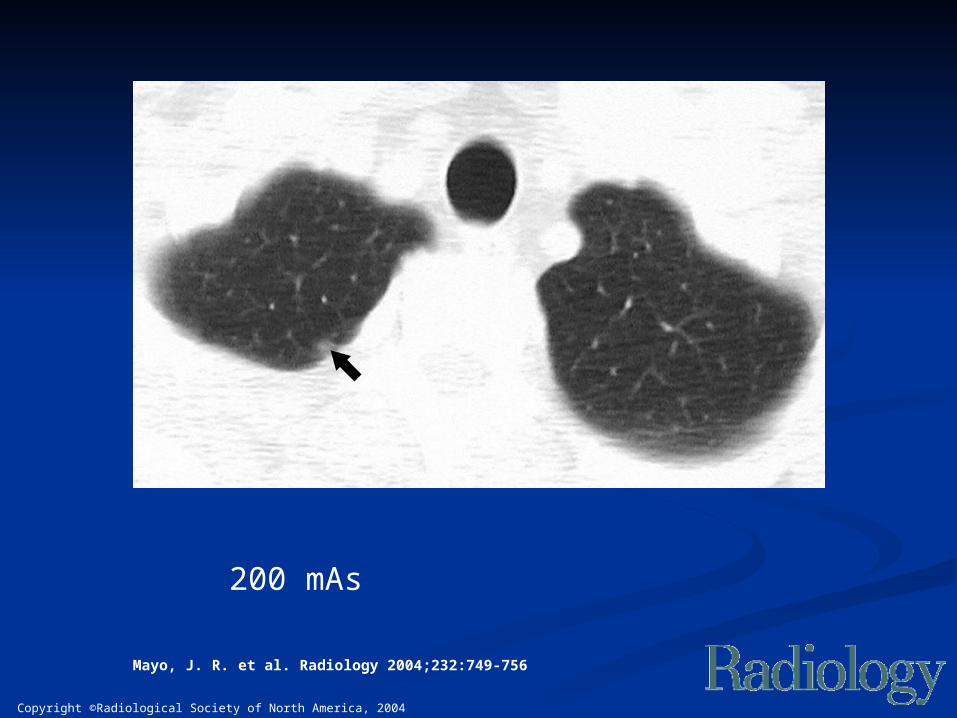
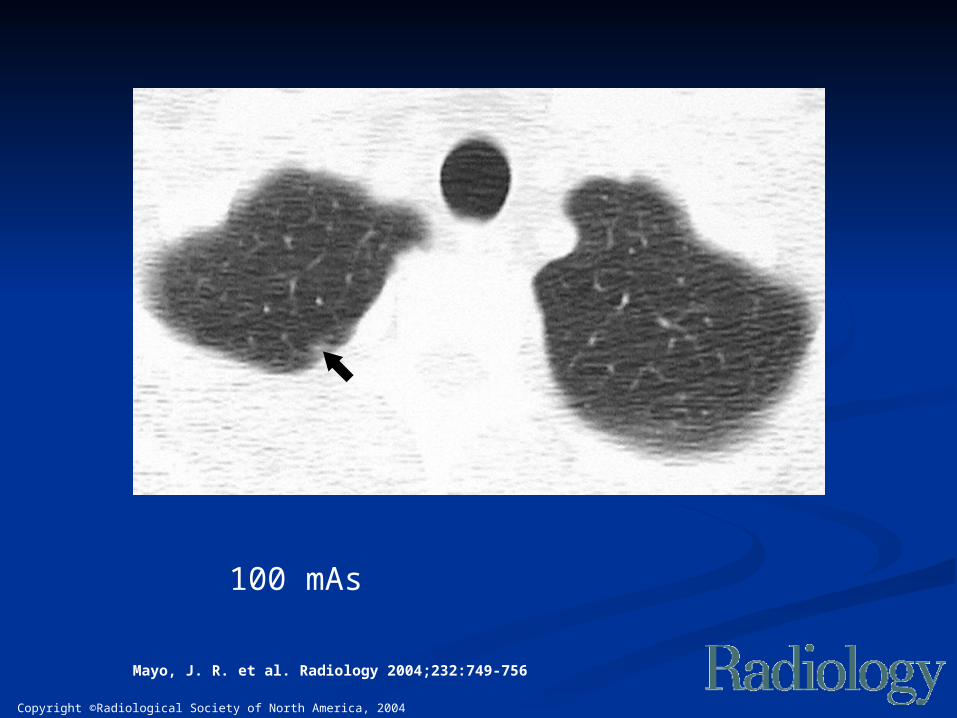
Investigated simulated Investigated simulated dose reduction on chest dose reduction on chest
CT findingsCT findings Repeated measures experimental Repeated measures experimental
designdesign 150 clinical chest CT scans (200 – 350 150 clinical chest CT scans (200 – 350
mA)mA) Computer simulated 100 and 40 mA Computer simulated 100 and 40 mA
scansscans 4 chest radiologists interpreted the 4 chest radiologists interpreted the
complete chest CT scans in random complete chest CT scans in random order assessing 14 mediastinal order assessing 14 mediastinal structures and lung findings structures and lung findings
Mayo, J. R. et al. Radiology 2004;232:749-756
Copyright ©Radiological Society of North America, 2004
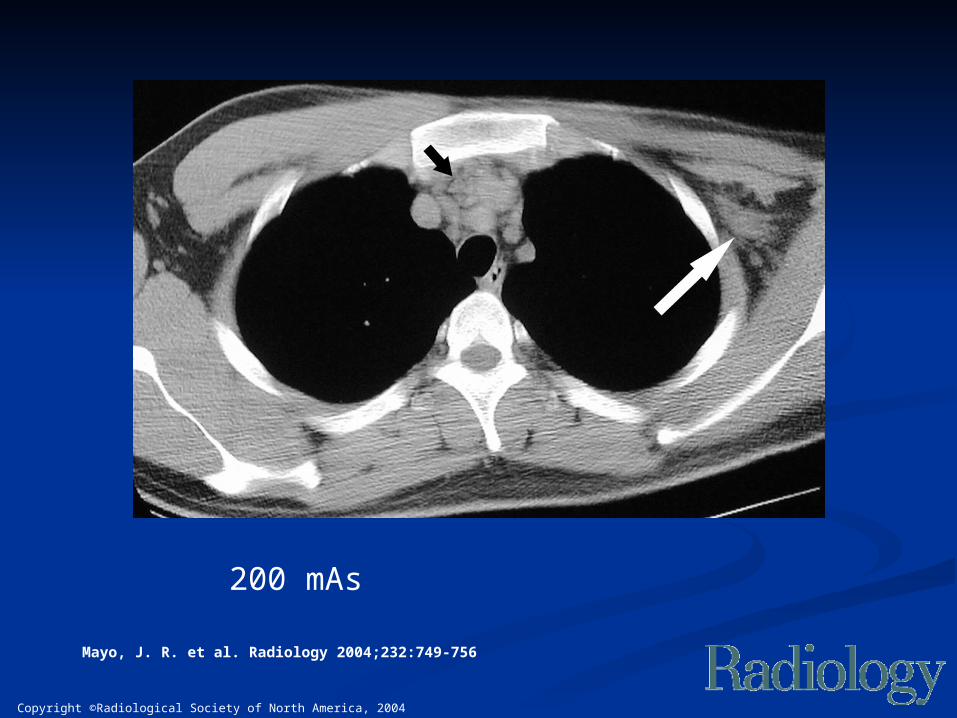
Mayo, J. R. et al. Radiology 2004;232:749-756
200 mAs

Copyright ©Radiological Society of North America, 2004
Mayo, J. R. et al. Radiology 2004;232:749-756
100 mAs
Copyright ©Radiological Society of North America, 2004
Mayo, J. R. et al. Radiology 2004;232:749-756
40 mAs
Copyright ©Radiological Society of North America, 2004
Mayo, J. R. et al. Radiology 2004;232:749-756
200 mAs
Copyright ©Radiological Society of North America, 2004
Mayo, J. R. et al. Radiology 2004;232:749-756
100 mAs
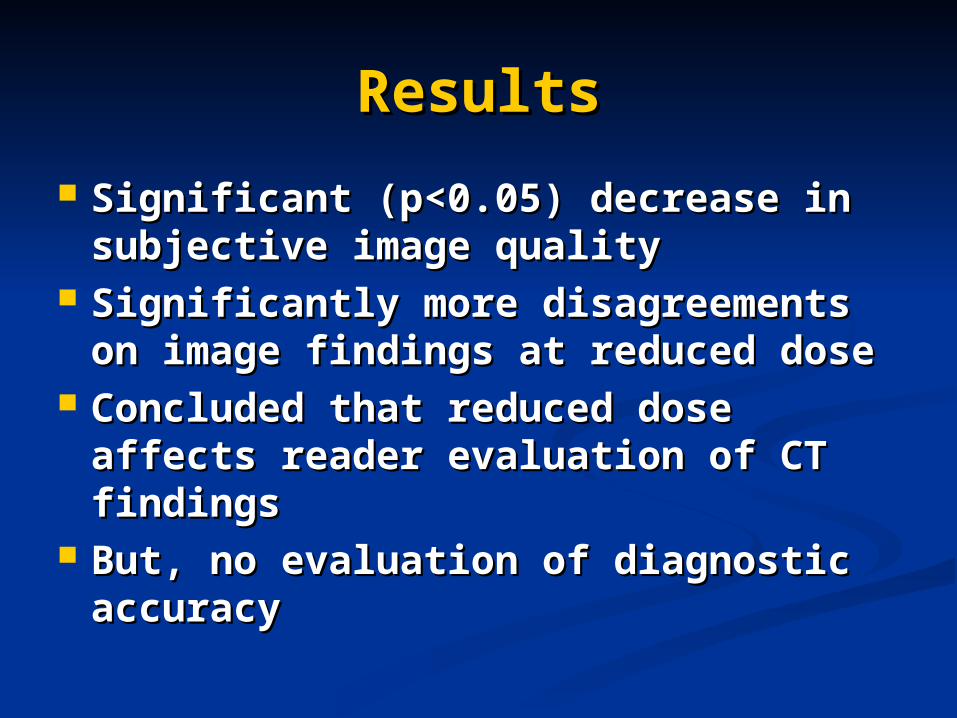
ResultsResults
Significant (p<0.05) decrease in Significant (p<0.05) decrease in subjective image qualitysubjective image quality
Significantly more disagreements Significantly more disagreements on image findings at reduced doseon image findings at reduced dose
Concluded that reduced dose Concluded that reduced dose affects reader evaluation of CT affects reader evaluation of CT findingsfindings
But, no evaluation of diagnostic But, no evaluation of diagnostic accuracyaccuracy
SummarySummary Do the obvious first:Do the obvious first:
Create a team approach to radiation dose Create a team approach to radiation dose minimization and quality optimization minimization and quality optimization between radiologists, technologists, between radiologists, technologists, technical support and medical physiciststechnical support and medical physicists
Eliminate unnecessary examinations Eliminate unnecessary examinations Monitor the actual dose delivered in practice Monitor the actual dose delivered in practice
and compare to reference dose levels and compare to reference dose levels Utilize all available dose reduction toolsUtilize all available dose reduction tools
Encourage further research into the Encourage further research into the relationship between CT dose, image relationship between CT dose, image quality and diagnostic accuracyquality and diagnostic accuracy

Thank youThank you