Embed Size (px)
Citation preview
sustainability
Article
Radiant Floors versus Radiant Walls Using Ceramic ThermalPanels in Mediterranean Dwellings: Annual Energy Demandand Cost-Effective Analysis
Víctor Echarri-Iribarren 1,* , Wong Nyuk Hien 2 and Ana Sánchez-Ostiz 3
�����������������
Citation: Echarri-Iribarren, V.; Hien,
W.N.; Sánchez-Ostiz, A. Radiant
Floors versus Radiant Walls Using
Ceramic Thermal Panels in
Mediterranean Dwellings: Annual
Energy Demand and Cost-Effective
Analysis. Sustainability 2021, 13, 588.
https://doi.org/10.3390/su13020588
Received: 12 November 2020
Accepted: 6 January 2021
Published: 9 January 2021
Publisher’s Note: MDPI stays neu-
tral with regard to jurisdictional clai-
ms in published maps and institutio-
nal affiliations.
Copyright: © 2021 by the authors. Li-
censee MDPI, Basel, Switzerland.
This article is an open access article
distributed under the terms and con-
ditions of the Creative Commons At-
tribution (CC BY) license (https://
creativecommons.org/licenses/by/
4.0/).
1 Department of Building Construction, University of Alicante, 03690 San Vicente del Raspeig, Spain2 Department of Building, National University of Singapore, Singapore 119077, Singapore; [email protected] Department of Construction, Installations and Structures, University of Navarre, 31009 Pamplona, Spain;
[email protected]* Correspondence: [email protected]; Tel.: +34-965-903677
Abstract: The present study focuses on the application of large-format thermal ceramic conditioningpanels (TCPs) containing polypropylene (PPR) capillary tube mats in dwellings on the Mediterraneancoast. The thermal and energy behaviours were examined once the underfloor heating was installed,and they were compared with an alternative wall application. The system was implemented ina single-family house located on the Spanish Mediterranean coast. After having monitored thehouse during a complete one-year cycle, the annual energy demand was quantified using the DesignBuilder tool. TCP panels applied to radiant floors reduced energy demand by 5.15% compared tothe wall-layout alternative. Significant reductions in CO2 emissions were also achieved, as wellas a 25.19% reduction in energy demand compared to convection systems. The incorporation of24 m2 of solar thermal panels into the system, combined with solar cooling systems based on lithiumchloride, was also analysed. A reduction in energy demand of 57.46% was obtained compared toall-air convection systems. Finally, the amortisation periods of the investments in TCP panels andsolar panels were calculated and compared to a convection system. Underfloor TCP panels proved tobe more cost-effective than a wall installation. The additional cost of EUR 21,844 could be amortisedover approximately 14 years with the radiant underfloor TCP system, while the wall TCP would beamortised over 17.4 years.
Keywords: integration energy and architecture; thermal ceramic panel; capillary tube mats; solarthermal panels; energy saving; renewable energy; investment amortisation
1. Introduction
Conditioning systems using radiant surfaces—floors, ceilings, or walls—provide highstandards of comfort and can lead to significant energy savings. They have been used sinceancient times, mainly underfloor, through hot air distribution. Today’s solutions consist ofvarious systems of production and distribution of air, water through thermoplastic tubes,copper wires, or radiant panels. Radiant heating systems are different from usual HVACsystems [1] because they heat or cool surfaces instead of propelling treated primary air tocounteract internal and external thermal loads [2]. In addition, as pointed out by Feng et al.,the size of the cooling loads varies substantially between both systems [3]. Underfloorsystems based on hot water circulation through thick tubes, usually made of crosslinkedpolyethylene, have proliferated in recent decades because of the high standards of usercomfort they offer [4]. Furthermore, this solution saves energy and allows incorporatingalternative energies into the system, such as solar energy from solar thermal panels, orgeothermal systems [5,6]. When distributing cold water from a chiller—a heat pump or aLiCl lithium chloride solar cold system—healthy cooling is achieved [7]. In humid climates,an additional dehumidification system is required.
Sustainability 2021, 13, 588. https://doi.org/10.3390/su13020588 https://www.mdpi.com/journal/sustainability
Sustainability 2021, 13, 588 2 of 26
A number of recent research projects have been conducted with hydronic radiantsystems, in order to quantify hygrothermal comfort improvements [8,9] and the energysavings entailed by radiant systems [10]. Following a rigorous study, Lin et al. concludedthat underfloor heating systems provide greater comfort while presenting a lower risk ofairflows and reducing local user discomfort [11]. Mustakallio et al. compared chilled beamsystems, chilled beam systems combined with radiant panels, and chilled ceiling installedmixing ventilation. They concluded that radiant systems also provide substantial energysaving and user-perceived comfort improvements [12]. Krzaczek et al. proposed an inter-esting pipe-embedded wall heating/cooling system in residential buildings which extractsheat from external enclosures and incorporates pipes through which water circulates [13].Catalina et al. carried out an interesting study of radiant ceiling panels, concluding thatthey present higher comfort levels and consume less energy [14]. Sun et al. designed a flatheat pipe encapsulated within an aluminium panel used as a radiant surface, providinghigh thermal response speed and good thermal uniformity, together with low energyconsumption [15].
When radiant system surfaces operate under humid climates, it is usually necessaryto add a fan coil dehumidification system [16], or other efficient systems. Not only dosuch systems clearly improve user comfort, they also avoid moisture from condensingon cold surfaces. The challenge then becomes that of reducing energy consumption andlimiting the costs of installation [17]. Sun et al. explored the possibility of couplingoutdoor air cooling with underfloor cooling under a warm and humid climate, suchas that of Korea; they achieved cooling energy savings of over 20% compared to usualcooling systems [18]. Fernández Hernández et al. proposed a prototype of hydronicunderfloor heating integrating radiant floor cooling and an underfloor air distributionsystem (UFAD). The floor’s cooling capacity increased, while the risk of floor surfacecondensation was averted [19]. Latest studies focus on combinations of these systems withphase change materials (PCMs) [20], which provide significant energy savings and reduceCO2 emissions [21,22].
1.1. Radiant Surface Conditioning Systems Based on Capillary Tube Mats
The mid-1980s saw the development of radiant surface conditioning systems thatwere an alternative to thick tube systems: systems of mats of capillary tubes made ofpolypropylene (PPR). They are made with return manifolds of 20 mm in diameter, fromwhich PPR tubes of about 3 mm diameter are laid out, approximately 10 mm apart [23].Hot or cold water circulates through these mats, thus conditioning the buildings both inwinter and summer. An added fan coil dehumidification system is required is summer.These mats can be applied to any surface indoors—floors, walls, ceilings—through variousplasterboard, false ceilings, false walls or gypsum projection techniques and they procurehealthy, quiet, and comfortable air conditioning. These systems function mainly by radia-tion, and secondarily by convection [24], as indicated by authors, such as Zhou and He,in their studies on surface temperature distribution [25]. Sound levels drop dramatically,because only low flows of indoor air are moved to dehumidify through low-power fan coils.When applied to cold floors, the impact of direct solar radiation significantly increases theactual cooling capacity, i.e., up to 1.44 times more than with the ISO 11855 method [26], asshown by Tang et al. [27] and Feng et al. [28]. This leads to a much greater level of usercomfort [29], and save substantial amounts of energy [30]. Zhao et al. show that by incor-porating solar energy via solar panels, the underfloor heating system can save significantamounts of energy and the investments made can be amortised over a short period oftime [31]. Satisfactory results are being obtained from the application of chemical energyaccumulation systems using solar thermal panels, functioning with lithium chloride: theirfuture is promising [32,33]. The same applies to absorption systems based on solar thermalpanels and geothermal energy systems [34] in which the mats act as ground exchangers atshallow depth [35]. Other studies propose applications on landscaped roofs [36] or usingseawater [37,38].
Sustainability 2021, 13, 588 3 of 26
Radiant systems using hot or cold water distribution have also been designed usingprefabricated panels incorporating capillary tube mats. The most widespread finishingmaterials consist of laminated plaster, plasterboard, aluminium, steel sheets as shown instudies conducted by Tian et al. [39], and concrete [40], linoleum or high-density woodboards. Smoothed concrete solutions have also been developed for flooring. Mikeska et al.developed radiant concrete panels that incorporate capillary tube mats: they are proving tobe a remarkable solution for high-occupancy areas because they eliminate the most sensibleloads and significantly reduce ventilation airflow requirements [41]. Choi et al. proposeda vertical radiant panel for hospital room heating which have an impact on convectioncurrents; they thus demonstrate the panels’ best location for human health and to removeunpleasant odours [42]. Rucevskis et al. proposed panels or storage units containingcapillary mats with PCMs, which accumulate energy by means of a night cooling systemthrough natural air currents. The system is capable of absorbing daily thermal loads insidethe room [43]. Ning et al. experimented with panels containing a thin layer of air, obtaininghigh efficiency when applying cooler water [44].
1.2. Description of TCP Ceramic Thermal Panels
In recent years, major technical improvements have been made to ceramic materialsregarding mechanical strength and extremely low water absorption, especially with thetechnological development of porcelain stoneware, regarding both compression and ex-trusion manufacturing. The recent production of large format and low thickness panelsmakes them very light and easy to assemble. Pieces measuring up to 320 cm × 160 cm and3 to 9 mm thick are obtained.
To solve the problem of uncomfortability due to its high effusivity and thermalconductivity values, multilayer solutions have been proposed, applied on site or usingprefabricated panels, capable of offering more comfortable ceramic materials. For exam-ple, joule underfloor heating solutions with copper wire sheets have been patented [45].Koschenz and Lehmann developed an interesting multilayer roofing system, incorporatingcapillary tube mats and PCMs, with a possible ceramic finish [46]. However, no applicationsolutions had been combined to achieve capillary mat conditioning systems, using newlarge-format and low-thickness porcelain stoneware on floors, walls or ceilings [47].
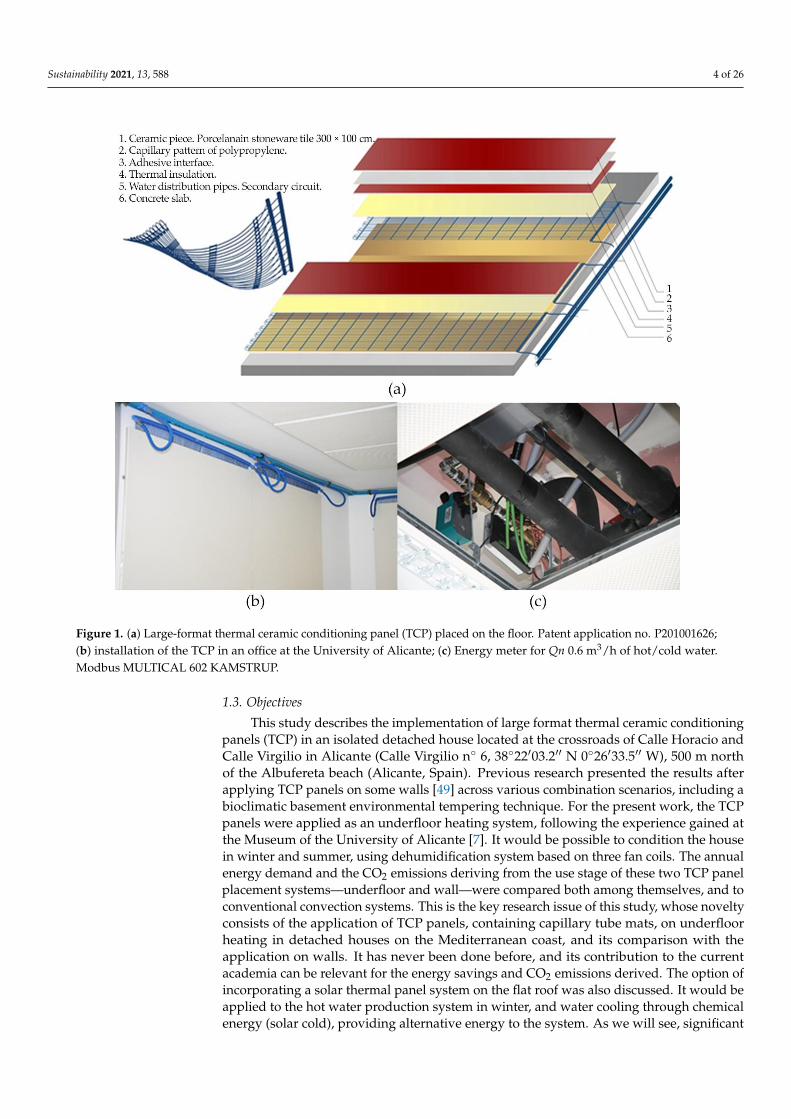
One of the most recent initiatives has come from the research group “Technologyand Sustainability in Architecture”, of the University of Alicante. Together with SpanishCeramic Tile Manufacturer’s Association (ASCER) and the Institute of Ceramic Technology(ITC), the group developed and patented a large-format thermal ceramic conditioningpanel (TCP) in 2010 [48]. It consists of: one or two pieces of large-format and low-thicknessporcelain stoneware with fiberglass on one side; a capillary mat of PPR polypropylenetubes 3.5 mm in diameter and 10 mm apart; and conductive paste to adhere the capillarytube mat and ensure good thermal conductivity from the capillary mats to the ceramic(Figure 1a). The panel could also be made with two ceramic pieces on each face, ensuringthe emission of energy by radiation on both surfaces. It thus allows it, for example, tobe hanged vertically from the ceiling in a baffle-like solution. The solution is ideal forflooring, floating floors, false modular ceramic ceilings, large-format pieces of wall orceiling plasterboard, as well as ceiling coverings generally.
Prototypes of TCP panels were recently made and installed on two adjacent walls, intwo offices belonging to two different buildings of the University of Alicante. In one ofthem, which operates with an all-water air conditioning installation, a specific circuit hasbeen channelled to serve a small 12 m2 office and a management substation was installed.The existing connections to the fan coil have been directed towards the distribution tofour radiant panels measuring 2.5 × 1 m. (Figure 1b). Home automation was applied tothe installation and the system can be controlled remotely. Modbus EIM3155 63A electricconsumption meters and Modbus MULTICAL 602 KAMSTRUP hot or cold water energymeters for a nominal flow rate of Qn 0.6 m3/h (Figure 1c) were set up.
Sustainability 2021, 13, 588 4 of 26
Sustainability 2021, 13, x FOR PEER REVIEW 4 of 26
installation and the system can be controlled remotely. Modbus EIM3155 63A electric con-
sumption meters and Modbus MULTICAL 602 KAMSTRUP hot or cold water energy me-
ters for a nominal flow rate of Qn 0.6 m3/h (Figure 1c) were set up.
Figure 1. (a) Large-format thermal ceramic conditioning panel (TCP) placed on the floor. Patent
application no. P201001626; (b) installation of the TCP in an office at the University of Alicante; (c)
Energy meter for Qn 0.6 m3/h of hot/cold water. Modbus MULTICAL 602 KAMSTRUP.
1.3. Objectives
This study describes the implementation of large format thermal ceramic condition-
ing panels (TCP) in an isolated detached house located at the crossroads of Calle Horacio
and Calle Virgilio in Alicante (Calle Virgilio n° 6, 38°22’03.2” N 0°26’33.5” W), 500 m north
of the Albufereta beach (Alicante, Spain). Previous research presented the results after
applying TCP panels on some walls [49] across various combination scenarios, including
a bioclimatic basement environmental tempering technique. For the present work, the
TCP panels were applied as an underfloor heating system, following the experience
gained at the Museum of the University of Alicante [7]. It would be possible to condition
the house in winter and summer, using dehumidification system based on three fan coils.
The annual energy demand and the CO2 emissions deriving from the use stage of these
two TCP panel placement systems—underfloor and wall—were compared both among
themselves, and to conventional convection systems. This is the key research issue of this
study, whose novelty consists of the application of TCP panels, containing capillary tube
mats, on underfloor heating in detached houses on the Mediterranean coast, and its com-
parison with the application on walls. It has never been done before, and its contribution
to the current academia can be relevant for the energy savings and CO2 emissions derived.
Figure 1. (a) Large-format thermal ceramic conditioning panel (TCP) placed on the floor. Patent application no. P201001626;(b) installation of the TCP in an office at the University of Alicante; (c) Energy meter for Qn 0.6 m3/h of hot/cold water.Modbus MULTICAL 602 KAMSTRUP.
1.3. Objectives
This study describes the implementation of large format thermal ceramic conditioningpanels (TCP) in an isolated detached house located at the crossroads of Calle Horacio andCalle Virgilio in Alicante (Calle Virgilio n◦ 6, 38◦22′03.2′′ N 0◦26′33.5′′ W), 500 m northof the Albufereta beach (Alicante, Spain). Previous research presented the results afterapplying TCP panels on some walls [49] across various combination scenarios, including abioclimatic basement environmental tempering technique. For the present work, the TCPpanels were applied as an underfloor heating system, following the experience gained atthe Museum of the University of Alicante [7]. It would be possible to condition the housein winter and summer, using dehumidification system based on three fan coils. The annualenergy demand and the CO2 emissions deriving from the use stage of these two TCP panelplacement systems—underfloor and wall—were compared both among themselves, and toconventional convection systems. This is the key research issue of this study, whose noveltyconsists of the application of TCP panels, containing capillary tube mats, on underfloorheating in detached houses on the Mediterranean coast, and its comparison with theapplication on walls. It has never been done before, and its contribution to the currentacademia can be relevant for the energy savings and CO2 emissions derived. The option ofincorporating a solar thermal panel system on the flat roof was also discussed. It would beapplied to the hot water production system in winter, and water cooling through chemicalenergy (solar cold), providing alternative energy to the system. As we will see, significant
Sustainability 2021, 13, 588 5 of 26
energy savings can be achieved, with adequate amortisation periods of the investmentsrequired. We also sought to test the hypothesis that the amortisation period of underfloorTCP panels would be shorter than that of wall TCP panels.
The area around Albufereta beach in Alicante is under a Mediterranean climate.It receives high levels of solar radiation on most summer and winter days, reaching anaverage value in August of 380 W/m2 during daylight, and can exceed 600 W/m2 atcertain times during the month. According to the classification of Köpen-Geiger [50], itcorresponds to BSh: a warm semi-arid climate with hot or very hot summers, and mildwinters with little rainfall [51]. During the months of September and October, the cold drop(gota fría) phenomena can occur, i.e., abundant rainfall at specific times.
2. TCP Panels Used as Underfloor Heating in a Detached House
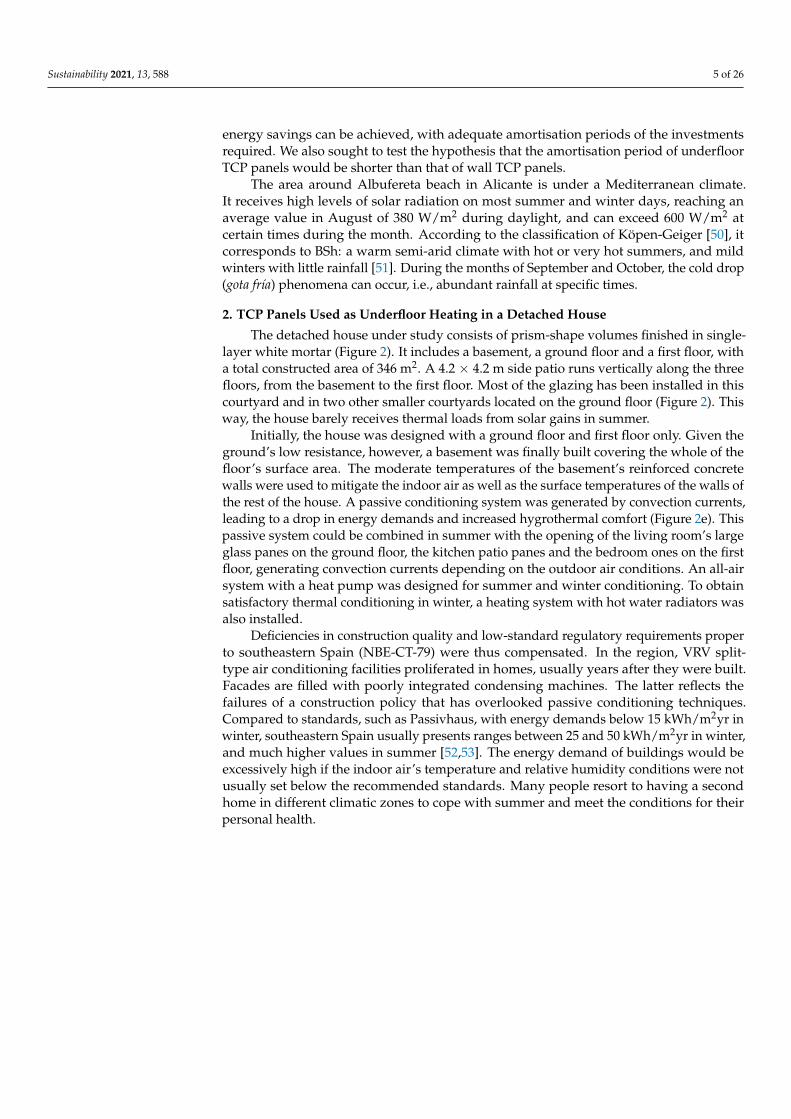
The detached house under study consists of prism-shape volumes finished in single-layer white mortar (Figure 2). It includes a basement, a ground floor and a first floor, witha total constructed area of 346 m2. A 4.2 × 4.2 m side patio runs vertically along the threefloors, from the basement to the first floor. Most of the glazing has been installed in thiscourtyard and in two other smaller courtyards located on the ground floor (Figure 2). Thisway, the house barely receives thermal loads from solar gains in summer.
Initially, the house was designed with a ground floor and first floor only. Given theground’s low resistance, however, a basement was finally built covering the whole of thefloor’s surface area. The moderate temperatures of the basement’s reinforced concretewalls were used to mitigate the indoor air as well as the surface temperatures of the walls ofthe rest of the house. A passive conditioning system was generated by convection currents,leading to a drop in energy demands and increased hygrothermal comfort (Figure 2e). Thispassive system could be combined in summer with the opening of the living room’s largeglass panes on the ground floor, the kitchen patio panes and the bedroom ones on the firstfloor, generating convection currents depending on the outdoor air conditions. An all-airsystem with a heat pump was designed for summer and winter conditioning. To obtainsatisfactory thermal conditioning in winter, a heating system with hot water radiators wasalso installed.
Deficiencies in construction quality and low-standard regulatory requirements properto southeastern Spain (NBE-CT-79) were thus compensated. In the region, VRV split-type air conditioning facilities proliferated in homes, usually years after they were built.Facades are filled with poorly integrated condensing machines. The latter reflects thefailures of a construction policy that has overlooked passive conditioning techniques.Compared to standards, such as Passivhaus, with energy demands below 15 kWh/m2yr inwinter, southeastern Spain usually presents ranges between 25 and 50 kWh/m2yr in winter,and much higher values in summer [52,53]. The energy demand of buildings would beexcessively high if the indoor air’s temperature and relative humidity conditions were notusually set below the recommended standards. Many people resort to having a secondhome in different climatic zones to cope with summer and meet the conditions for theirpersonal health.
Sustainability 2021, 13, 588 6 of 26Sustainability 2021, 13, x FOR PEER REVIEW 6 of 26
Figure 2. Description and distribution of the detached house. (a) View of the house on its north-
east facade. Outdoor porch of the living room and pool; (b) basement; (c) ground floor; (d) first
floor; (e) longitudinal section through the courtyard. The basement acts as a passive bioclimatic
system.
Figure 2. Description and distribution of the detached house. (a) View of the house on its northeastfacade. Outdoor porch of the living room and pool; (b) basement; (c) ground floor; (d) first floor;(e) longitudinal section through the courtyard. The basement acts as a passive bioclimatic system.
Sustainability 2021, 13, 588 7 of 26
2.1. Constructive Solutions of the Project at Its First Stage
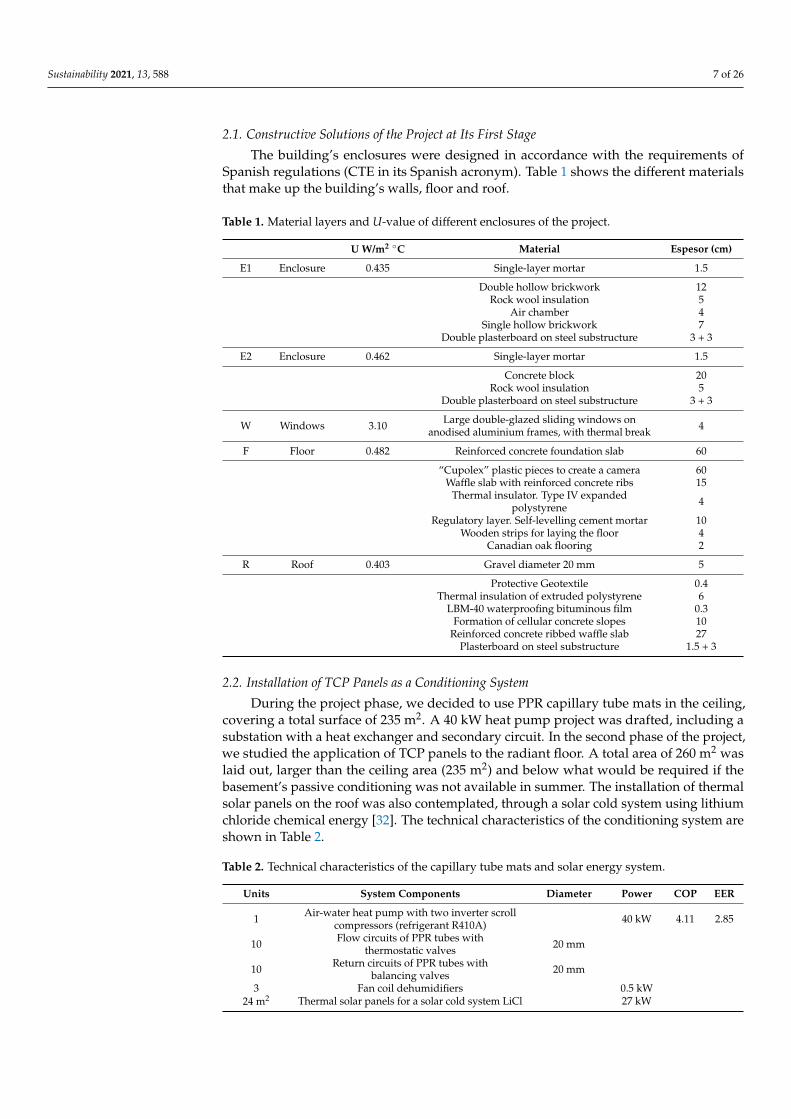
The building’s enclosures were designed in accordance with the requirements ofSpanish regulations (CTE in its Spanish acronym). Table 1 shows the different materialsthat make up the building’s walls, floor and roof.
Table 1. Material layers and U-value of different enclosures of the project.
U W/m2 ◦C Material Espesor (cm)
E1 Enclosure 0.435 Single-layer mortar 1.5
Double hollow brickwork 12Rock wool insulation 5
Air chamber 4Single hollow brickwork 7
Double plasterboard on steel substructure 3 + 3
E2 Enclosure 0.462 Single-layer mortar 1.5
Concrete block 20Rock wool insulation 5
Double plasterboard on steel substructure 3 + 3
W Windows 3.10 Large double-glazed sliding windows onanodised aluminium frames, with thermal break 4
F Floor 0.482 Reinforced concrete foundation slab 60
“Cupolex” plastic pieces to create a camera 60Waffle slab with reinforced concrete ribs 15
Thermal insulator. Type IV expandedpolystyrene 4
Regulatory layer. Self-levelling cement mortar 10Wooden strips for laying the floor 4
Canadian oak flooring 2
R Roof 0.403 Gravel diameter 20 mm 5
Protective Geotextile 0.4Thermal insulation of extruded polystyrene 6
LBM-40 waterproofing bituminous film 0.3Formation of cellular concrete slopes 10
Reinforced concrete ribbed waffle slab 27Plasterboard on steel substructure 1.5 + 3
2.2. Installation of TCP Panels as a Conditioning System
During the project phase, we decided to use PPR capillary tube mats in the ceiling,covering a total surface of 235 m2. A 40 kW heat pump project was drafted, including asubstation with a heat exchanger and secondary circuit. In the second phase of the project,we studied the application of TCP panels to the radiant floor. A total area of 260 m2 waslaid out, larger than the ceiling area (235 m2) and below what would be required if thebasement’s passive conditioning was not available in summer. The installation of thermalsolar panels on the roof was also contemplated, through a solar cold system using lithiumchloride chemical energy [32]. The technical characteristics of the conditioning system areshown in Table 2.
Table 2. Technical characteristics of the capillary tube mats and solar energy system.
Units System Components Diameter Power COP EER
1 Air-water heat pump with two inverter scrollcompressors (refrigerant R410A) 40 kW 4.11 2.85
10 Flow circuits of PPR tubes withthermostatic valves 20 mm
10 Return circuits of PPR tubes withbalancing valves 20 mm
3 Fan coil dehumidifiers 0.5 kW24 m2 Thermal solar panels for a solar cold system LiCl 27 kW
Sustainability 2021, 13, 588 8 of 26
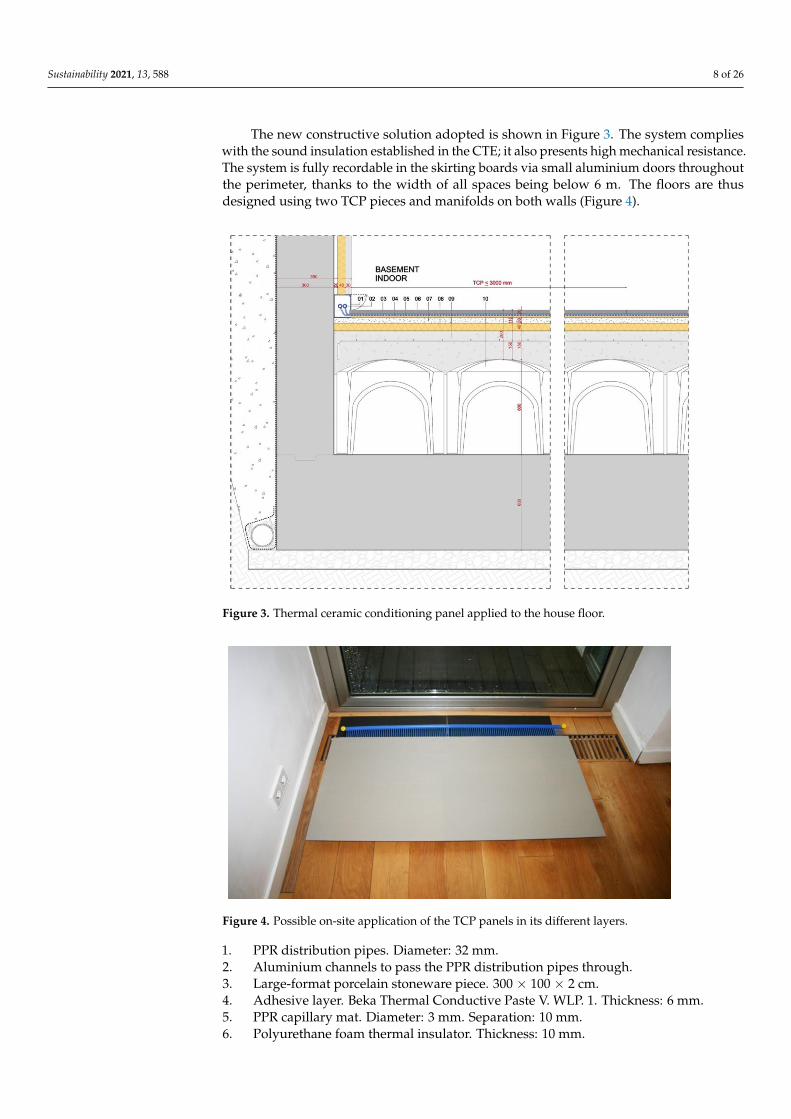
The new constructive solution adopted is shown in Figure 3. The system complieswith the sound insulation established in the CTE; it also presents high mechanical resistance.The system is fully recordable in the skirting boards via small aluminium doors throughoutthe perimeter, thanks to the width of all spaces being below 6 m. The floors are thusdesigned using two TCP pieces and manifolds on both walls (Figure 4).
Sustainability 2021, 13, x FOR PEER REVIEW 8 of 26
Figure 3. Thermal ceramic conditioning panel applied to the house floor.
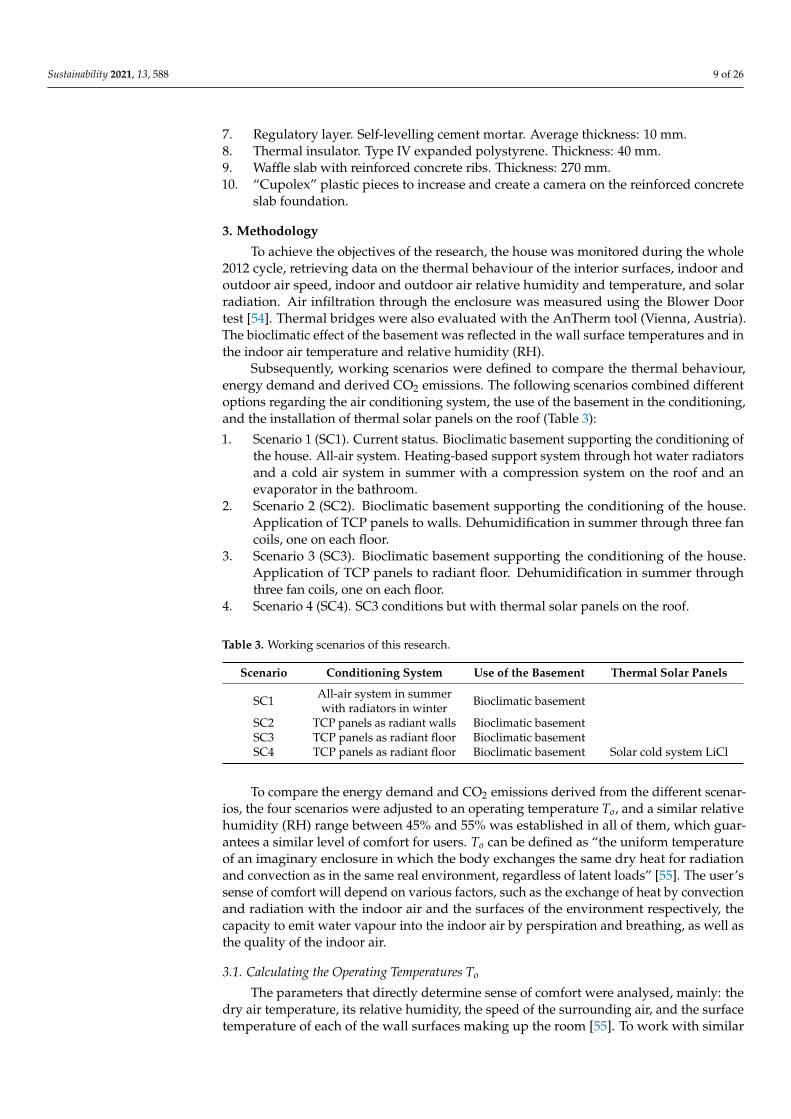
Figure 4. Possible on-site application of the TCP panels in its different layers.
1. PPR distribution pipes. Diameter: 32 mm.
2. Aluminium channels to pass the PPR distribution pipes through.
3. Large-format porcelain stoneware piece. 300 × 100 × 2 cm.
4. Adhesive layer. Beka Thermal Conductive Paste V. WLP. 1. Thickness: 6 mm.
5. PPR capillary mat. Diameter: 3 mm. Separation: 10 mm.
6. Polyurethane foam thermal insulator. Thickness: 10 mm.
7. Regulatory layer. Self-levelling cement mortar. Average thickness: 10 mm.
8. Thermal insulator. Type IV expanded polystyrene. Thickness: 40 mm.
9. Waffle slab with reinforced concrete ribs. Thickness: 270 mm.
10. “Cupolex” plastic pieces to increase and create a camera on the reinforced concrete
slab foundation.
Figure 3. Thermal ceramic conditioning panel applied to the house floor.
Sustainability 2021, 13, x FOR PEER REVIEW 8 of 26
Figure 3. Thermal ceramic conditioning panel applied to the house floor.
Figure 4. Possible on-site application of the TCP panels in its different layers.
1. PPR distribution pipes. Diameter: 32 mm.
2. Aluminium channels to pass the PPR distribution pipes through.
3. Large-format porcelain stoneware piece. 300 × 100 × 2 cm.
4. Adhesive layer. Beka Thermal Conductive Paste V. WLP. 1. Thickness: 6 mm.
5. PPR capillary mat. Diameter: 3 mm. Separation: 10 mm.
6. Polyurethane foam thermal insulator. Thickness: 10 mm.
7. Regulatory layer. Self-levelling cement mortar. Average thickness: 10 mm.
8. Thermal insulator. Type IV expanded polystyrene. Thickness: 40 mm.
9. Waffle slab with reinforced concrete ribs. Thickness: 270 mm.
10. “Cupolex” plastic pieces to increase and create a camera on the reinforced concrete
slab foundation.
Figure 4. Possible on-site application of the TCP panels in its different layers.
1. PPR distribution pipes. Diameter: 32 mm.2. Aluminium channels to pass the PPR distribution pipes through.3. Large-format porcelain stoneware piece. 300 × 100 × 2 cm.4. Adhesive layer. Beka Thermal Conductive Paste V. WLP. 1. Thickness: 6 mm.5. PPR capillary mat. Diameter: 3 mm. Separation: 10 mm.6. Polyurethane foam thermal insulator. Thickness: 10 mm.
Sustainability 2021, 13, 588 9 of 26
7. Regulatory layer. Self-levelling cement mortar. Average thickness: 10 mm.8. Thermal insulator. Type IV expanded polystyrene. Thickness: 40 mm.9. Waffle slab with reinforced concrete ribs. Thickness: 270 mm.10. “Cupolex” plastic pieces to increase and create a camera on the reinforced concrete
slab foundation.
3. Methodology
To achieve the objectives of the research, the house was monitored during the whole2012 cycle, retrieving data on the thermal behaviour of the interior surfaces, indoor andoutdoor air speed, indoor and outdoor air relative humidity and temperature, and solarradiation. Air infiltration through the enclosure was measured using the Blower Doortest [54]. Thermal bridges were also evaluated with the AnTherm tool (Vienna, Austria).The bioclimatic effect of the basement was reflected in the wall surface temperatures and inthe indoor air temperature and relative humidity (RH).
Subsequently, working scenarios were defined to compare the thermal behaviour,energy demand and derived CO2 emissions. The following scenarios combined differentoptions regarding the air conditioning system, the use of the basement in the conditioning,and the installation of thermal solar panels on the roof (Table 3):
1. Scenario 1 (SC1). Current status. Bioclimatic basement supporting the conditioning ofthe house. All-air system. Heating-based support system through hot water radiatorsand a cold air system in summer with a compression system on the roof and anevaporator in the bathroom.
2. Scenario 2 (SC2). Bioclimatic basement supporting the conditioning of the house.Application of TCP panels to walls. Dehumidification in summer through three fancoils, one on each floor.
3. Scenario 3 (SC3). Bioclimatic basement supporting the conditioning of the house.Application of TCP panels to radiant floor. Dehumidification in summer throughthree fan coils, one on each floor.
4. Scenario 4 (SC4). SC3 conditions but with thermal solar panels on the roof.
Table 3. Working scenarios of this research.
Scenario Conditioning System Use of the Basement Thermal Solar Panels
SC1 All-air system in summerwith radiators in winter Bioclimatic basement
SC2 TCP panels as radiant walls Bioclimatic basementSC3 TCP panels as radiant floor Bioclimatic basementSC4 TCP panels as radiant floor Bioclimatic basement Solar cold system LiCl
To compare the energy demand and CO2 emissions derived from the different scenar-ios, the four scenarios were adjusted to an operating temperature To, and a similar relativehumidity (RH) range between 45% and 55% was established in all of them, which guar-antees a similar level of comfort for users. To can be defined as “the uniform temperatureof an imaginary enclosure in which the body exchanges the same dry heat for radiationand convection as in the same real environment, regardless of latent loads” [55]. The user’ssense of comfort will depend on various factors, such as the exchange of heat by convectionand radiation with the indoor air and the surfaces of the environment respectively, thecapacity to emit water vapour into the indoor air by perspiration and breathing, as well asthe quality of the indoor air.
3.1. Calculating the Operating Temperatures To
The parameters that directly determine sense of comfort were analysed, mainly: thedry air temperature, its relative humidity, the speed of the surrounding air, and the surfacetemperature of each of the wall surfaces making up the room [55]. To work with similar
Sustainability 2021, 13, 588 10 of 26
user comfort levels in this study, in addition to the operating temperature To, the valuesof heat loss by radiation and convection were quantified and unified. The usual values ofuser sensitive heat emission are around 105 W. Heat losses from convection and radiation(qrdi and qcvi) were obtained through the Expressions (1) and (2):
qcvi = hc(Ti − Ta)(
W/m2)
(1)
qrdi = hr(Ti − Trm)(
W/m2)
(2)
The convection factor hc is directly related to air velocity. It usually has an averagevalue of 3.5 W/m2 ◦C, with an air speed of 0.1 m/s. The air speed was set to 5 cm persecond for TCP panels, obtained on site in the monitored offices, and 15 cm/s in the all-airinstallation, as the average value of the area of occupancy obtained on site. Values offactor hc were obtained through Expression (3). The coefficient of loss by radiation hr hadapproximate values of 4.7 W/m2 ◦C with an estimated human body temperature Ti of30 ◦C.
hc = 14.11× v0.24 (W/◦C) (3)
The values of operating comfort temperature To were calculated according to theExpression (4), with values of mean radiant temperature Trm according to the Expression (5):
To =hrTrm + hcTa
hr + hc(4)
Trm = T1 × FP−1 + T2 × FP−2 + · · ·+ TN × FP−N (5)
3.2. Thermal Loads
The sensible and latent thermal loads were mainly calculated using the Design Buildertool (Stroud, UK). Some of them, such as the U-value of the enclosures and the loads dueto air infiltration, were carefully calculated with some previous data taken on site.
3.2.1. U-Values: Thermal Transmittance of the Enclosures
Fourier’s law, which applies to parallel layers of materials, of an unlimited surface,in steady state indoor Ti and exterior Te air temperatures, establishes the temperaturegradient reached by multi-layer enclosures when there is a thermal gap between outdoorand indoor air temperatures (Equation (6)).
U − value =1
RT=
11hi+ ∑n
0eiλi
+ 1he
(6)
where:
RT Total thermal resistance to the passage of heat.1/hi Interior surface thermal resistance.1/he External surface thermal resistance.e Thickness of each layer.λ Each layer material’s thermal conductivity.
The usual values of thermal conductivity λ of the materials used in the enclosure,according to UNE-EN-ISO 10456: 2012 [56]. The thermal inertia of the materials making upthe enclosure alters the linear Fourier process as a function of time, since the thermal gapbetween exterior and interior air temperature, the solar radiation that affects the exteriorsurface, or the interior air conditioning systems vary according to the weather. Heat flowthus becomes a dynamic and complex process, which can be solved by specific tools asDesign Builder.
Sustainability 2021, 13, 588 11 of 26
To perform building behaviour simulations in terms of energy demand and interiorcomfort parameters, and to quantify the energetic impact, the transmittance U-values of allthe enclosures obtained through Equation (6) were introduced into the Design Builder tool.
3.2.2. Air Infiltration through the Envelope
The air infiltration value through the enclosure was forecast to be very low thanks tothe construction’s quality, the seals used, and the joinery quality. It was evaluated by meansof the Blower Door test conducted in accordance with the European Standard EN 13829,using the BlowerDoor GMBH MessSysteme für Luftdichtheit equipment. The impact ofannual energy demand due to air infiltration was evaluated using a simplified model(Equation (7)), applying the concept of degree-day, which relates the average temperatureoutside the house under study and the interior comfort temperature (21 ◦C for heating and24 ◦C for cooling).
Qinf = Cp × Gt × Vinf, (7)
where:
Qinf Annual energy loss (kWh/yr) due to air infiltration for heating Qinf-H and coolingQinf-C.Cp Air’s specific heat capacity, which is 0.34 Wh/m3K.Gt Annual degrees-days (kWh/yr), both for heating and cooling.Vinf Air leakage rate (m3/h).
Sensible and latent heats were quantified by means of the following Equations (8)and (9):
Qs = Vinf × Ce × ρ × (Te − Ti) (8)
where:
Qs Energy impact value of the sensible heat of the air leak rate Vinf (W).Vinf Air leakage rate (m3/h).Ce Specific heat of the air under normal conditions 0.349 Wh/kgK.ρ Density of air (kg/m3).Te Outside air temperature in degrees Kelvin (K).Ti Air temperature inside the house (21 ◦C in winter and 24 ◦C in summer).
Ql = Vinf × Cv × ρ × (We −Wi) (9)
where:
Ql Energetic impact value of the latent heat of the air leak rate Vinf (W).Cv Heat of water vaporization (0.628 W/gvapour).We Specific humidity of the external air taken as the annual average value (gvapour/kg).Wi Specific humidity of the indoor air (gvapour/kg).
3.3. Simulations of Thermal Behaviour: Annual Energy Demand
Energy behaviour simulations and energy demand calculations were performed inthe Design Builder tool for the four scenarios SC1–SC4. The following parameters were set:
1. The winter period covers 1 December to 30 April, and the summer period 1 May to30 November. These are the usual weather conditions in Alicante.
2. Indoor air set temperatures were 21 ◦C in winter and 24 ◦C in summer. Relativehumidity (RH) remained at 50%.
3. Occupancy, according to the CTE’s regulatory calculation for air renewal, is six people.Since the interior volume is 302 m3, the requirement for forced air renewal is 0.32 airchanges per hour (ACH), equivalent to 12 L per second per person.
4. Air infiltration through the enclosure was measured using the Blower Door test. Theresult was 0.342 ACH, a low value for a detached house [57], far from the Passivhausstandard (<0.6 ACH).
Sustainability 2021, 13, 588 12 of 26
5. We estimated load gains or losses due to thermal bridges at 3.5% of total thermalloads [58] by thermal transmittance U of the enclosures [59,60].
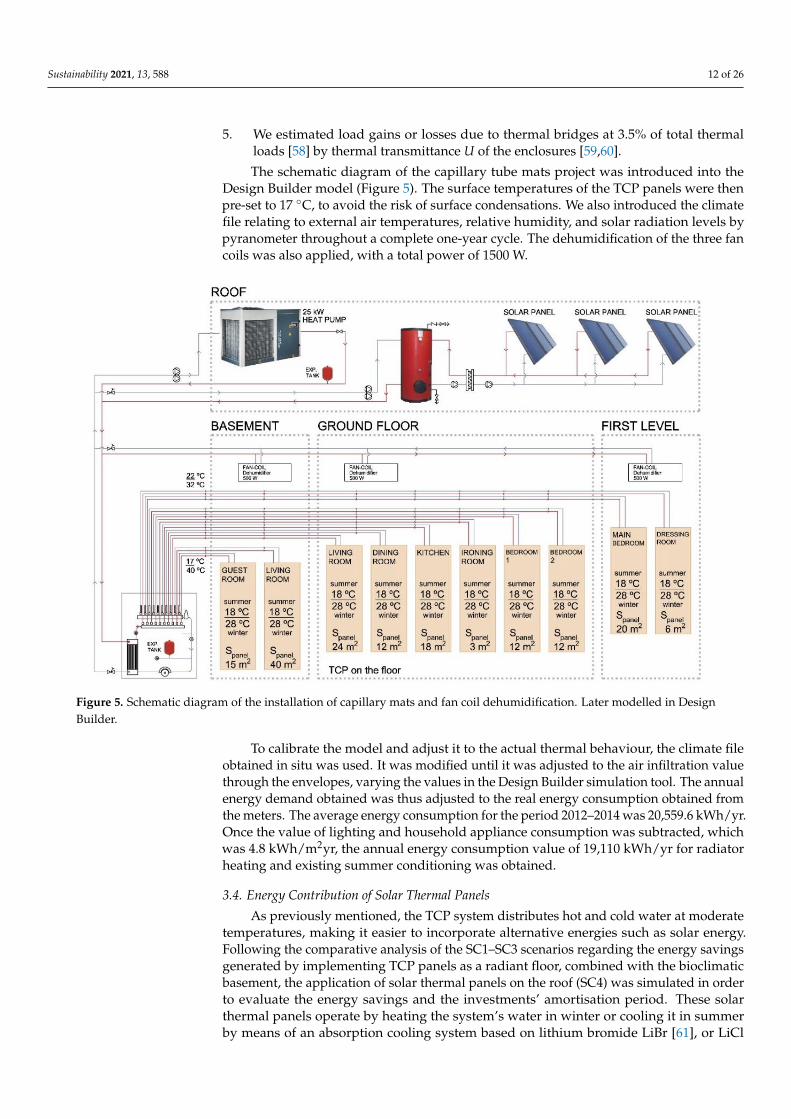
The schematic diagram of the capillary tube mats project was introduced into theDesign Builder model (Figure 5). The surface temperatures of the TCP panels were thenpre-set to 17 ◦C, to avoid the risk of surface condensations. We also introduced the climatefile relating to external air temperatures, relative humidity, and solar radiation levels bypyranometer throughout a complete one-year cycle. The dehumidification of the three fancoils was also applied, with a total power of 1500 W.
Sustainability 2021, 13, x FOR PEER REVIEW 12 of 26
Figure 5. Schematic diagram of the installation of capillary mats and fan coil dehumidification. Later modelled in Design
Builder.
To calibrate the model and adjust it to the actual thermal behaviour, the climate file
obtained in situ was used. It was modified until it was adjusted to the air infiltration value
through the envelopes, varying the values in the Design Builder simulation tool. The an-
nual energy demand obtained was thus adjusted to the real energy consumption obtained
from the meters. The average energy consumption for the period 2012–2014 was 20,559.6
kWh/yr. Once the value of lighting and household appliance consumption was sub-
tracted, which was 4.8 kWh/m2yr, the annual energy consumption value of 19,110 kWh/yr
for radiator heating and existing summer conditioning was obtained.
3.4. Energy Contribution of Solar Thermal Panels
As previously mentioned, the TCP system distributes hot and cold water at moderate
temperatures, making it easier to incorporate alternative energies such as solar energy.
Following the comparative analysis of the SC1–SC3 scenarios regarding the energy sav-
ings generated by implementing TCP panels as a radiant floor, combined with the biocli-
matic basement, the application of solar thermal panels on the roof (SC4) was simulated
in order to evaluate the energy savings and the investments’ amortisation period. These
solar thermal panels operate by heating the system’s water in winter or cooling it in sum-
mer by means of an absorption cooling system based on lithium bromide LiBr [61], or LiCl
chemical energy (solar cold) [62,63]. The solar radiation power data on the roof of the
detached home was collected for the whole 2012 cycle, through a pyranometer (KIPP
Model CMP3 pyranometer ISO second class). The results obtained in August varied be-
tween 150 and 600 W/m2 and those obtained in February between 100 and 300 W/m2.
These values bear similarities with the results reported in other recent studies—e.g., the
Museum of the University of Alicante [7]—sources and publications, which include these
values for the Mediterranean and southeast Spain [64]. The performance of an installation
Figure 5. Schematic diagram of the installation of capillary mats and fan coil dehumidification. Later modelled in DesignBuilder.
To calibrate the model and adjust it to the actual thermal behaviour, the climate fileobtained in situ was used. It was modified until it was adjusted to the air infiltration valuethrough the envelopes, varying the values in the Design Builder simulation tool. The annualenergy demand obtained was thus adjusted to the real energy consumption obtained fromthe meters. The average energy consumption for the period 2012–2014 was 20,559.6 kWh/yr.Once the value of lighting and household appliance consumption was subtracted, whichwas 4.8 kWh/m2yr, the annual energy consumption value of 19,110 kWh/yr for radiatorheating and existing summer conditioning was obtained.
3.4. Energy Contribution of Solar Thermal Panels
As previously mentioned, the TCP system distributes hot and cold water at moderatetemperatures, making it easier to incorporate alternative energies such as solar energy.Following the comparative analysis of the SC1–SC3 scenarios regarding the energy savingsgenerated by implementing TCP panels as a radiant floor, combined with the bioclimaticbasement, the application of solar thermal panels on the roof (SC4) was simulated in orderto evaluate the energy savings and the investments’ amortisation period. These solarthermal panels operate by heating the system’s water in winter or cooling it in summerby means of an absorption cooling system based on lithium bromide LiBr [61], or LiCl
Sustainability 2021, 13, 588 13 of 26
chemical energy (solar cold) [62,63]. The solar radiation power data on the roof of thedetached home was collected for the whole 2012 cycle, through a pyranometer (KIPP ModelCMP3 pyranometer ISO second class). The results obtained in August varied between 150and 600 W/m2 and those obtained in February between 100 and 300 W/m2. These valuesbear similarities with the results reported in other recent studies—e.g., the Museum ofthe University of Alicante [7]—sources and publications, which include these values forthe Mediterranean and southeast Spain [64]. The performance of an installation of solarthermal panels, at a 38◦ latitude of location and 45◦ inclination, can be obtained from otherprevious studies [65], as well as the overall performance of the installation [66].
3.5. Investment Amortisation Approach
The last section of this comparative analysis focuses on the feasibility of implementingthe TCP panel system and combining it with solar thermal panels in the real estate market.These technical installations based on capillary tube mats could be introduced into thesame type of single-family homes as those in the Albufereta area. We thus estimated thesystem’s return on investments over a building’s life cycle. To make this estimation, weapplied the methodology used in previous studies [7], which could serve as a reference forother buildings on the Spanish Mediterranean coast. The tool used is the Life Cycle Cost(LCC), which was applied in accordance with the standard UNE-EN 15459-1:2017 [67]. Theprotocol was followed for the four scenarios—SC1, SC2, SC3 and SC4—designed for thisstudy. The most complex parameter to quantify was the Global Cost, which was obtainedthrough the following expressions:
Cg(t) = Cl + ∑j
[t
∑i=1
(Ca,i(j)·Rdisc(i))−ValF,t(j)
](10)
RR =Rint − Ri
1 + Ri/100(11)
Rdisc(i) =(
11 + RR/100
)i(12)
where:
Cg Global cost.Cl Initial investment costs including indirect cost too.Ca,i Annual costs including maintenance, energy and replacement costs.Rdisc Discount rate. Depends on the real interest rate (RR) and the cost period considered(number of years from the initial year). Calculated according to expression 3i years.ValF,t Residual value of components at the end of the calculation period, consideringdepreciation of their initial investment.RR Real interest rate. Depends on the market interest rate (R) and the inflation rate (Ri),both may depend on year i, but here they will be considered constant.Ri Inflation rate.Rint Interest rate.
The investment costs of building the whole house, including installations and exe-cution, indirect costs, costs due to periodic maintenance, and replacement costs, over a30-year period as established by the UNE-EN 15459-1:2017, were obtained from variousdatabases of companies in the sector in Alicante.
4. House Monitoring
The house was monitored in two stages. The first monitoring system consistedof sensors (wall temperature, indoor air temperature, outdoor air temperature, relativehumidity (RH), air speed and solar radiation using a pyranometer on the roof) placed atstrategic points of the enclosures. The data collected by the sensors were sent to a data
Sustainability 2021, 13, 588 14 of 26
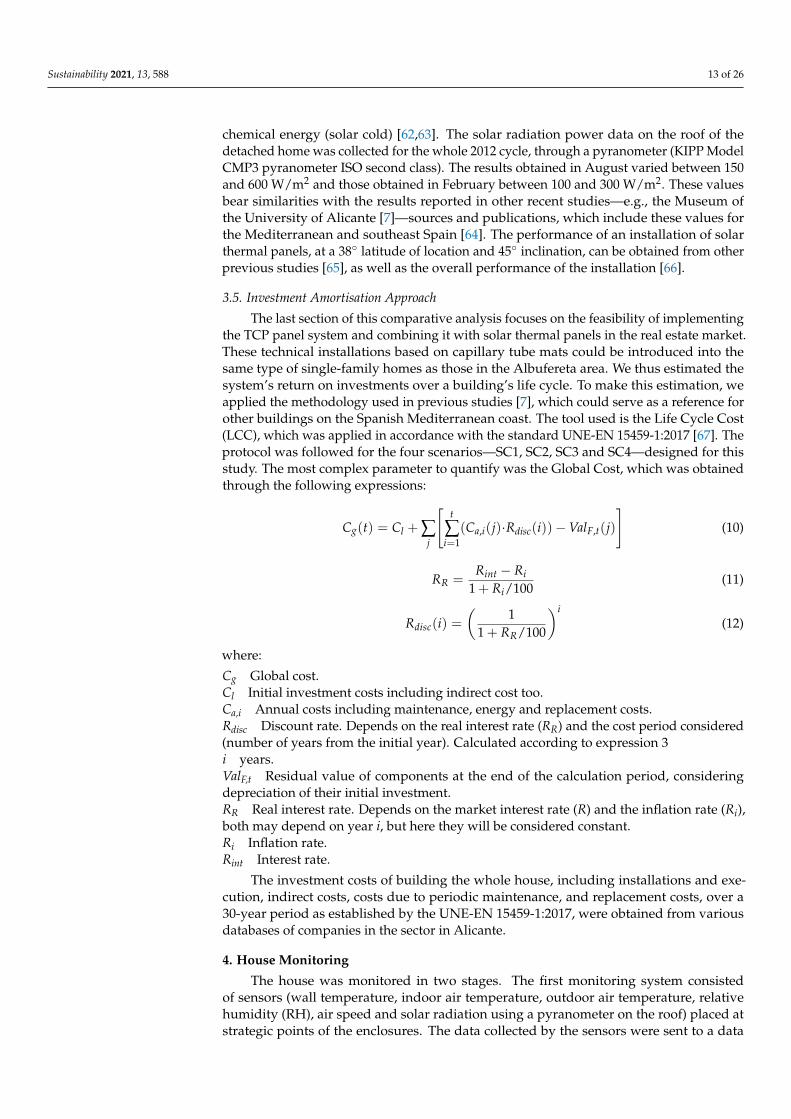
logger (analyser), which transmits the signal via General Packet Radio Service (GPRS)to a database (Figure 6). This information is accessible from a web platform. The GRDGSM/GPRS data logger allows data to be recorded via analogue or digital channels. Usingits GSM/GPRS modem, data is sent to a server and can be consulted on the web in chartand table formats. They are downloaded as a comma-separated values (CSV) file. Datawere collected for the whole 2012 cycle.
Sustainability 2021, 13, x FOR PEER REVIEW 14 of 26
Figure 6. Analyser and sensors located on the wall.
In a second phase, monitoring was carried out using a wireless system. Temperature
sensors were connected to small analysers, model “EL-WiFi-TC-Thermocouple Probe
Data logger”. The analysers “EL-WiFi-TH, Temperature and humidity data logger”, with
built-in temperature and relative humidity probes, interpret the recorded data and send
WiFi signals to a laptop. By installing the software “EasyLog WiFi Software”, the data are
received and stored on the computer. Through a custom code you can access the infor-
mation from any computer over the network. This second monitoring operation was car-
ried out during the week of 1 to 7 February, 2012, and from 1 to 7 August, 2012. Surface
temperature, indoor air temperature, and RH data were taken elsewhere in the house al-
lowing a faster and more adjusted calibration of the model in Design Builder.
Flyr’s ThermaCam P 25 thermal imaging camera was used to detect thermal bridges.
U thermal transmittance and Ψ linear thermal transmittance values were obtained in
joints, singular points and structural points [68]. They were quantified using the AnTherm
software, and load gains or losses due to thermal bridges were estimated at 3.5% of total
thermal loads due to thermal transmittance U of the enclosures [69], i.e., similar values to
those obtained in previous studies [49].
5. Results
The application of TCP thermal ceramic panels on some of the house’s walls (SC2)
had been simulated in previous studies and the results were published in 2017 [49]. The
application of TCP panels together with the effect of the bioclimatic basement reduced
annual energy demand by 12%. Results of this parameter were obtained with set operat-
ing temperatures To of 20 °C in winter and 24 °C in summer, an occupancy of 1 person per
50 m2, ventilation airflow of 0.63 ACH, and infiltration airflow of 0.342 ACH. The appli-
cation of wall ceramic thermal panels was also compared to the all-air conditioning system
in summer, and hot water radiators in winter. The results for user thermal comfort were
equally satisfactory in summer and winter regimes, as the radiant system was capable of
Figure 6. Analyser and sensors located on the wall.
In a second phase, monitoring was carried out using a wireless system. Temperaturesensors were connected to small analysers, model “EL-WiFi-TC-Thermocouple ProbeData logger”. The analysers “EL-WiFi-TH, Temperature and humidity data logger”, withbuilt-in temperature and relative humidity probes, interpret the recorded data and sendWiFi signals to a laptop. By installing the software “EasyLog WiFi Software”, the dataare received and stored on the computer. Through a custom code you can access theinformation from any computer over the network. This second monitoring operation wascarried out during the week of 1 to 7 February 2012, and from 1 to 7 August 2012. Surfacetemperature, indoor air temperature, and RH data were taken elsewhere in the houseallowing a faster and more adjusted calibration of the model in Design Builder.
Flyr’s ThermaCam P 25 thermal imaging camera was used to detect thermal bridges.U thermal transmittance and Ψ linear thermal transmittance values were obtained injoints, singular points and structural points [68]. They were quantified using the AnThermsoftware, and load gains or losses due to thermal bridges were estimated at 3.5% of totalthermal loads due to thermal transmittance U of the enclosures [69], i.e., similar values tothose obtained in previous studies [49].
5. Results
The application of TCP thermal ceramic panels on some of the house’s walls (SC2)had been simulated in previous studies and the results were published in 2017 [49]. Theapplication of TCP panels together with the effect of the bioclimatic basement reduced
Sustainability 2021, 13, 588 15 of 26
annual energy demand by 12%. Results of this parameter were obtained with set operatingtemperatures To of 20 ◦C in winter and 24 ◦C in summer, an occupancy of 1 personper 50 m2, ventilation airflow of 0.63 ACH, and infiltration airflow of 0.342 ACH. Theapplication of wall ceramic thermal panels was also compared to the all-air conditioningsystem in summer, and hot water radiators in winter. The results for user thermal comfortwere equally satisfactory in summer and winter regimes, as the radiant system was capableof dissipating, by means of radiation and convection, around 60 W of heat per square metreof body surface in the summer regime [55].
5.1. Calculation of Operating Temperatures To
The indoor air temperature data Ti obtained through the monitoring were obtainedwith and without the air conditioning system turned on. The Design Builder tool was usedto simulate indoor air temperature data for the SC3 with underfloor TCP panels with PPRcapillary mats (Figure 7).
Sustainability 2021, 13, x FOR PEER REVIEW 15 of 26
dissipating, by means of radiation and convection, around 60 W of heat per square metre
of body surface in the summer regime [55].
5.1. Calculation of Operating Temperatures To
The indoor air temperature data Ti obtained through the monitoring were obtained
with and without the air conditioning system turned on. The Design Builder tool was used
to simulate indoor air temperature data for the SC3 with underfloor TCP panels with PPR
capillary mats (Figure 7).
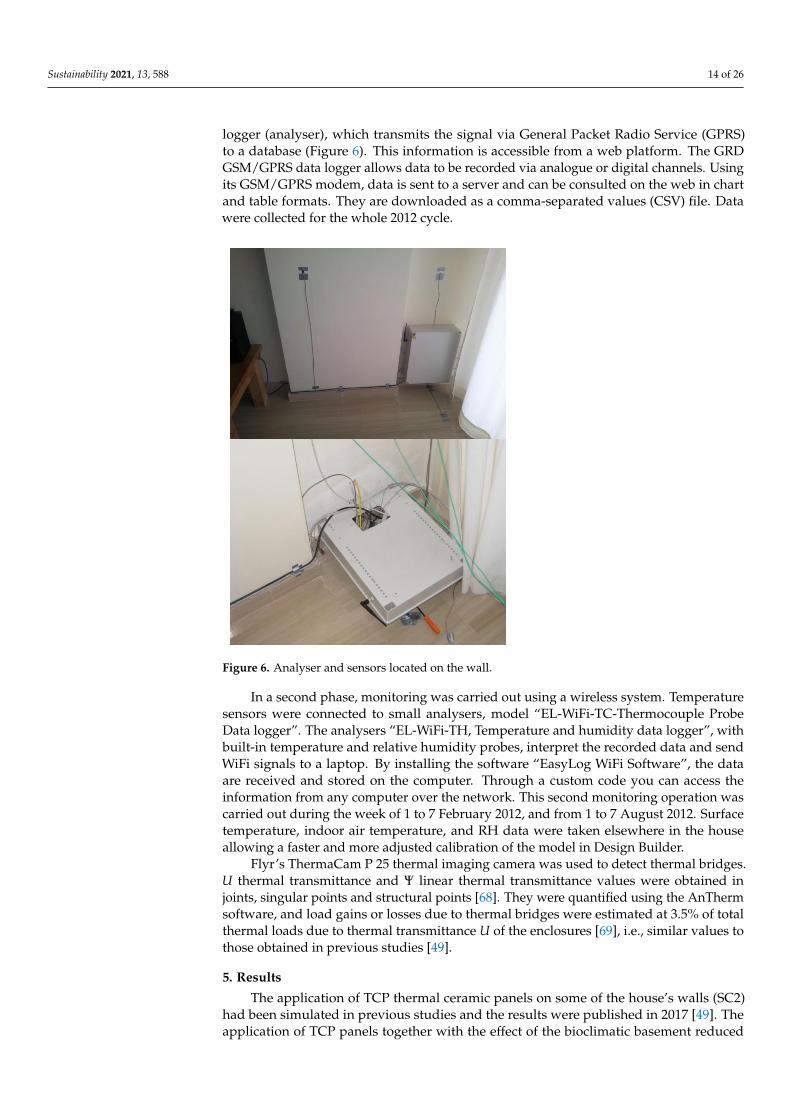
Figure 7. Outdoor and indoor air temperatures (Ti,Te) and relative humidity (RH) in summer. All-air system (SC1), and
TCP panels on the floor (SC3).
As can be observed in Table 4, the operating temperatures To for the living room on
the ground floor are close to the values of 24 °C. In the case of the house under study, the
indoor air temperature in summer from 1 to 3 August 2012 was between 2 and 3 °C higher
with the radiant systems compared to the convective systems, and around 1.5 °C on 4–7
August.
Table 4. Calculation of operating temperatures To in summer for the 4 Scenarios.
v hc Ta hr Trm To
m/s W/°C °C W/m2 °C °C °C
SC1 0.160 9.088 24.07 4.70 23.98 24.035
SC2 0.082 7.742 26.11 4.70 19.45 23.598
SC3–SC4 0.085 7.759 26.24 4.70 19.28 23.617
5.2. The Value of Annual Energy Demand
Spanish regulations on energy efficiency in buildings, i.e., the technical document
DB-HE on energy saving, which is part of the Technical Building Code (or CTE by its
Spanish acronym) makes it mandatory to apply the standardised tool Lider–Calener
HULC [70] to architectural projects. The instrument, however, presents notable shortcom-
ings compared to other simulation instruments, such as Design Builder or TRNSYS. For
Figure 7. Outdoor and indoor air temperatures (Ti,Te) and relative humidity (RH) in summer. All-air system (SC1), andTCP panels on the floor (SC3).
As can be observed in Table 4, the operating temperatures To for the living room onthe ground floor are close to the values of 24 ◦C. In the case of the house under study,the indoor air temperature in summer from 1 to 3 August 2012 was between 2 and 3 ◦Chigher with the radiant systems compared to the convective systems, and around 1.5 ◦C on4–7 August.
Table 4. Calculation of operating temperatures To in summer for the 4 Scenarios.
v hc Ta hr Trm To
m/s W/◦C ◦C W/m2 ◦C ◦C ◦C
SC1 0.160 9.088 24.07 4.70 23.98 24.035SC2 0.082 7.742 26.11 4.70 19.45 23.598
SC3–SC4 0.085 7.759 26.24 4.70 19.28 23.617
Sustainability 2021, 13, 588 16 of 26
5.2. The Value of Annual Energy Demand
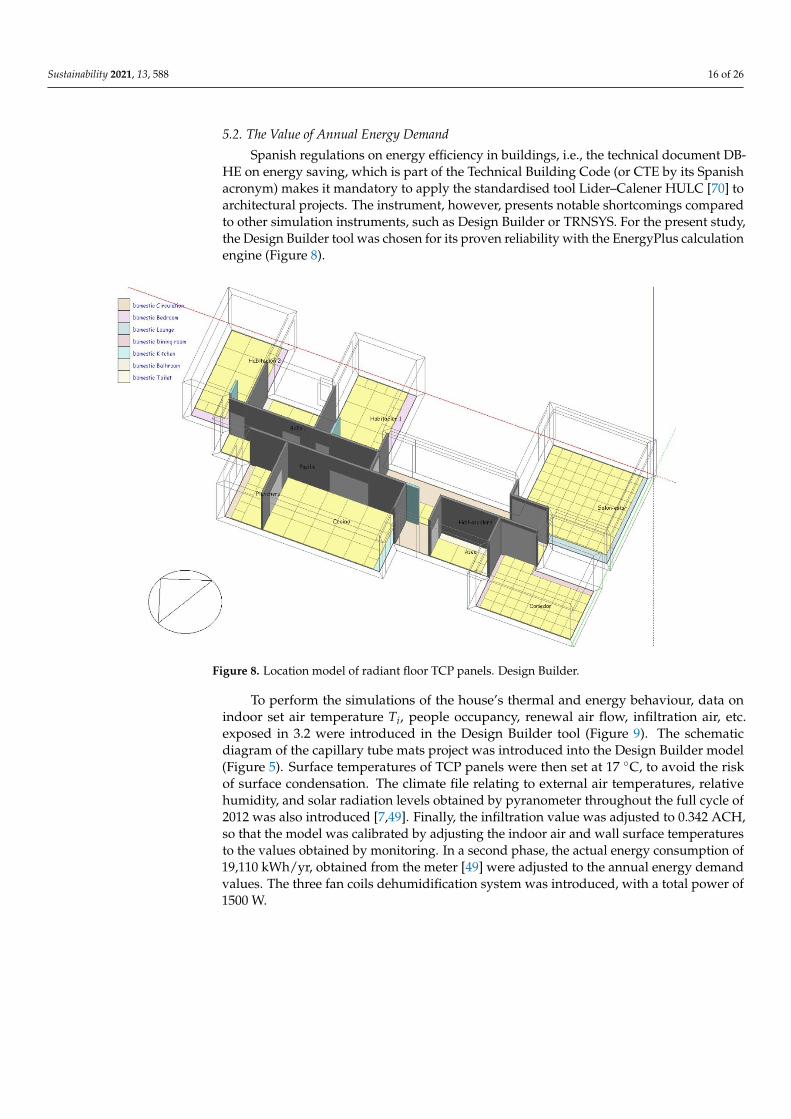
Spanish regulations on energy efficiency in buildings, i.e., the technical document DB-HE on energy saving, which is part of the Technical Building Code (or CTE by its Spanishacronym) makes it mandatory to apply the standardised tool Lider–Calener HULC [70] toarchitectural projects. The instrument, however, presents notable shortcomings comparedto other simulation instruments, such as Design Builder or TRNSYS. For the present study,the Design Builder tool was chosen for its proven reliability with the EnergyPlus calculationengine (Figure 8).
Sustainability 2021, 13, x FOR PEER REVIEW 16 of 26
the present study, the Design Builder tool was chosen for its proven reliability with the
EnergyPlus calculation engine (Figure 8).
Figure 8. Location model of radiant floor TCP panels. Design Builder.
To perform the simulations of the house’s thermal and energy behaviour, data on
indoor set air temperature Ti, people occupancy, renewal air flow, infiltration air, etc. ex-
posed in 3.2 were introduced in the Design Builder tool (Figure 9). The schematic diagram
of the capillary tube mats project was introduced into the Design Builder model (Figure
5). Surface temperatures of TCP panels were then set at 17 °C, to avoid the risk of surface
condensation. The climate file relating to external air temperatures, relative humidity, and
solar radiation levels obtained by pyranometer throughout the full cycle of 2012 was also
introduced [7,49]. Finally, the infiltration value was adjusted to 0.342 ACH, so that the
model was calibrated by adjusting the indoor air and wall surface temperatures to the
values obtained by monitoring. In a second phase, the actual energy consumption of
19,110 kWh/yr, obtained from the meter [49] were adjusted to the annual energy demand
values. The three fan coils dehumidification system was introduced, with a total power of
1500 W.
Figure 8. Location model of radiant floor TCP panels. Design Builder.
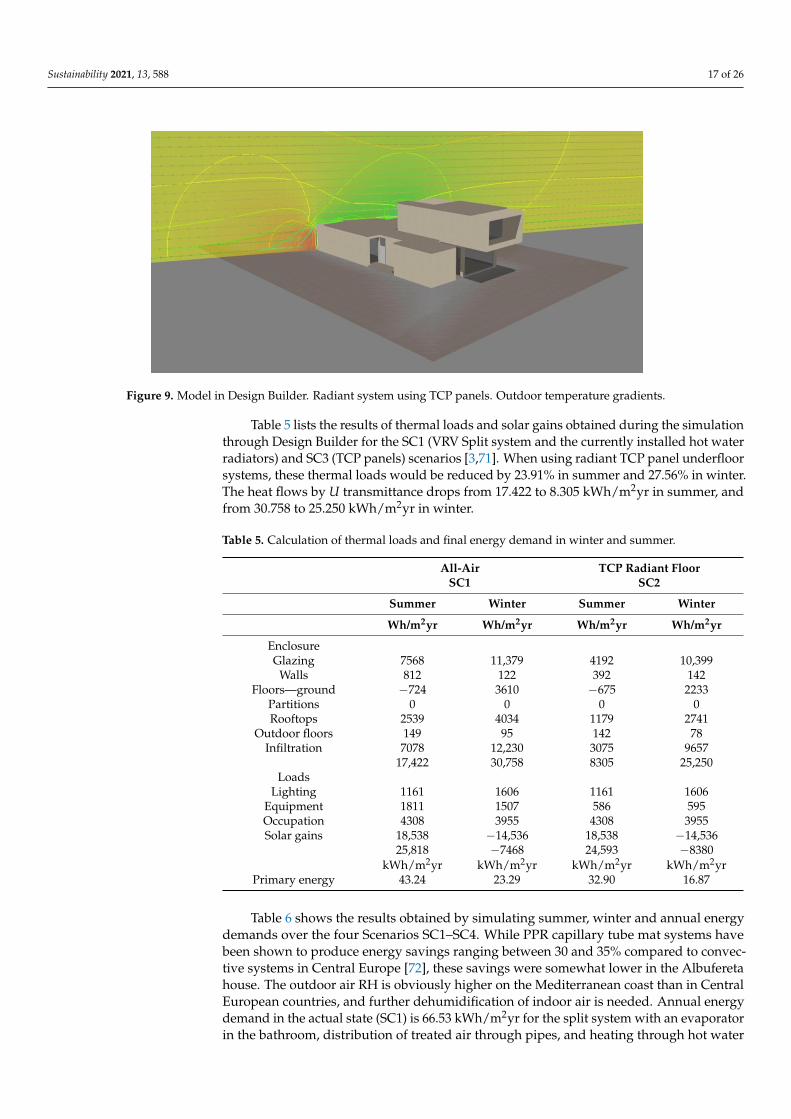
To perform the simulations of the house’s thermal and energy behaviour, data onindoor set air temperature Ti, people occupancy, renewal air flow, infiltration air, etc.exposed in 3.2 were introduced in the Design Builder tool (Figure 9). The schematicdiagram of the capillary tube mats project was introduced into the Design Builder model(Figure 5). Surface temperatures of TCP panels were then set at 17 ◦C, to avoid the riskof surface condensation. The climate file relating to external air temperatures, relativehumidity, and solar radiation levels obtained by pyranometer throughout the full cycle of2012 was also introduced [7,49]. Finally, the infiltration value was adjusted to 0.342 ACH,so that the model was calibrated by adjusting the indoor air and wall surface temperaturesto the values obtained by monitoring. In a second phase, the actual energy consumption of19,110 kWh/yr, obtained from the meter [49] were adjusted to the annual energy demandvalues. The three fan coils dehumidification system was introduced, with a total power of1500 W.
Sustainability 2021, 13, 588 17 of 26Sustainability 2021, 13, x FOR PEER REVIEW 17 of 26
Figure 9. Model in Design Builder. Radiant system using TCP panels. Outdoor temperature gradi-
ents.
Table 5 lists the results of thermal loads and solar gains obtained during the simula-
tion through Design Builder for the SC1 (VRV Split system and the currently installed hot
water radiators) and SC3 (TCP panels) scenarios [3,71]. When using radiant TCP panel
underfloor systems, these thermal loads would be reduced by 23.91% in summer and
27.56% in winter. The heat flows by U transmittance drops from 17.422 to 8.305 kWh/m2yr
in summer, and from 30.758 to 25.250 kWh/m2yr in winter.
Table 5. Calculation of thermal loads and final energy demand in winter and summer.
All-Air
SC1
TCP Radiant Floor
SC2
Summer Winter Summer Winter
Wh/m2y Wh/m2y Wh/m2y Wh/m2y
Enclosure
Glazing 7568 11,379 4192 10,399
Walls 812 122 392 142
Floors—ground −724 3610 −675 2233
Partitions 0 0 0 0
Rooftops 2539 4034 1179 2741
Outdoor floors 149 95 142 78
Infiltration 7078 12,230 3075 9657
17,422 30,758 8305 25,250
Loads
Lighting 1161 1606 1161 1606
Equipment 1811 1507 586 595
Occupation 4308 3955 4308 3955
Solar gains 18,538 −14,536 18,538 −14,536
25,818 −7468 24,593 −8380
kWh/m2y kWh/m2y kWh/m2y kWh/m2y
Primary energy 43.24 23.29 32.90 16.87
Table 6 shows the results obtained by simulating summer, winter and annual energy
demands over the four Scenarios SC1–SC4. While PPR capillary tube mat systems have
been shown to produce energy savings ranging between 30 and 35% compared to convec-
tive systems in Central Europe [72], these savings were somewhat lower in the Albufereta
house. The outdoor air RH is obviously higher on the Mediterranean coast than in Central
European countries, and further dehumidification of indoor air is needed. Annual energy
demand in the actual state (SC1) is 66.53 kWh/m2yr for the split system with an evaporator
Figure 9. Model in Design Builder. Radiant system using TCP panels. Outdoor temperature gradients.
Table 5 lists the results of thermal loads and solar gains obtained during the simulationthrough Design Builder for the SC1 (VRV Split system and the currently installed hot waterradiators) and SC3 (TCP panels) scenarios [3,71]. When using radiant TCP panel underfloorsystems, these thermal loads would be reduced by 23.91% in summer and 27.56% in winter.The heat flows by U transmittance drops from 17.422 to 8.305 kWh/m2yr in summer, andfrom 30.758 to 25.250 kWh/m2yr in winter.
Table 5. Calculation of thermal loads and final energy demand in winter and summer.
All-AirSC1
TCP Radiant FloorSC2
Summer Winter Summer Winter
Wh/m2yr Wh/m2yr Wh/m2yr Wh/m2yr
EnclosureGlazing 7568 11,379 4192 10,399
Walls 812 122 392 142Floors—ground −724 3610 −675 2233
Partitions 0 0 0 0Rooftops 2539 4034 1179 2741
Outdoor floors 149 95 142 78Infiltration 7078 12,230 3075 9657
17,422 30,758 8305 25,250Loads
Lighting 1161 1606 1161 1606Equipment 1811 1507 586 595Occupation 4308 3955 4308 3955Solar gains 18,538 −14,536 18,538 −14,536
25,818 −7468 24,593 −8380kWh/m2yr kWh/m2yr kWh/m2yr kWh/m2yr
Primary energy 43.24 23.29 32.90 16.87
Table 6 shows the results obtained by simulating summer, winter and annual energydemands over the four Scenarios SC1–SC4. While PPR capillary tube mat systems havebeen shown to produce energy savings ranging between 30 and 35% compared to convec-tive systems in Central Europe [72], these savings were somewhat lower in the Albuferetahouse. The outdoor air RH is obviously higher on the Mediterranean coast than in CentralEuropean countries, and further dehumidification of indoor air is needed. Annual energydemand in the actual state (SC1) is 66.53 kWh/m2yr for the split system with an evaporatorin the bathroom, distribution of treated air through pipes, and heating through hot water
Sustainability 2021, 13, 588 18 of 26
radiators in winter. In the case of SC3, with the application of floor TCP panels, annualenergy demand drops to 49.77 kWh/m2yr. The resulting energy savings amount to 25.19%.These reductions are greater than those obtained in previous studies [47] for SC2 whereTCP panels were applied to the wall, which had amounted to 21.13%.
Table 6. Summer, winter, and annual energy demand over the four scenarios SC1–SC4.
SC1 SC2TCP Walls
SC3TCP Floor
SC4TCP + SOLAR
Energy demand in summerkWh/m2 37.15 28.63 26.95 17.09
Energy demand in winterkWh/m2 29.38 23.84 22.82 11.21
Annual energy demandkWh/m2yr 66.53 52.47 49.77 28.30
Annual CO2 emissions inuse stage 7835.10 kg 6179.28 kg 5861.13 kg 3332.73 kg
Percentage 100.00% 78.87% 74.81% 42.54%
Results shown in Table 6 allow us to conclude that the energy demand of the all-airsystem with air-to-air heat pump for air distribution in SC1 is 126.8% higher than waterdistribution to TCP panels in radiant walls in SC2, and 133.7% higher than in SC3 withunderfloor TCP panels. If the TCP panels are installed as a radiant floor (SC3), the annualenergy demand is reduced by 5.15% compared to the TCP solution on the wall (SC2). Theradiant floor’s convection currents produce a better temperature gradient in the indoor airand a slightly lower Trm in summer and somewhat higher in winter, as well as a slightlyhigher Ta in summer and somewhat lower in winter, with a To similar to SC2. This bringsabout a reduction in heat losses by transmission through opaque and glass enclosures.Consumption due to dehumidification, with the two 1500 W fan coils in the TCP panels,is 1547 kWh/yr, a high value that would make these systems a priori less favourable insummer. However, the savings derived from the much lower amount of energy needed totransport water compared to air, as well as the thermal load drop thanks to the reducedthermal gap of the heat flow through the enclosures, means the system as a whole leads tosubstantial energy savings compared to SC1. The indoor air temperature Ti in summer isaround 2–3 ◦C higher in SC3 than in SC1.
Furthermore, annual CO2 emissions were quantified during the stage of home use,in accordance with Spain’s current management of the electrical mix. It was also possibleto make a first estimation of the environmental impacts deriving from the use of theair conditioning systems analysed in the study. The European Life Cycle Data Network(LCDN) database was used [73]. We considered that 0.41 kgCO2, 0.00122 kgCH4 and0.0000465 kgN2O are released to produce 1 kWh of electricity. The annual CO2 emissionsduring the home’s use stage could be evaluated by quantifying the simulations of annualfinal energy demand in the four scenarios SC1–SC4 set out in Table 6. The system’s finalenergy demand and resulting CO2 emissions were calculated using the factors provided bythe Institute for Diversification and Energy Savings (IDAE by its Spanish acronym) [74],specifically: 2.21 MWhp/MWhf and 0.27 tCO2eq/MWh. The reduction in annual CO2emissions resulting from these energy savings in the use phase was 4502.37 kg of CO2(Table 6). If we compare the wall and underfloor application of TCP panels, the annualCO2 emissions in SC3 are 318.15 kg lower than in SC2, which represents a 5.15% reductionwhen TCP panels are used underfloor. These proven benefits of capillary tube mat radiantsystems, such as TCP panels, combined with solar thermal energy production should betaken into account by public administrations. Pilot implementation support schemes or taxexemptions could be launched to reduce CO2 emissions and other environmental impacts.
Sustainability 2021, 13, 588 19 of 26
5.3. Incorporation of Solar Thermal Panels
The installation of solar thermal panels was dimensioned based on loads calculatedusing Design Builder. An annual energy demand for conditioning of 49.77 kWh/m2yr,with a heat pump using 40 kW in a cold regime in summer requires an installation of 24 m2
of thermal solar panels on the roof. The market cost of the installation is EUR 10,889 (euros).According to previous estimates, these panels contribute 57.5% during energy demandpeaks in summer, with maximum sunshine. In winter, it would be possible to achieve avalue of 68.5%. The performance of an installation with 24 m2 of solar thermal panels,at a 38◦ latitude and 45◦ inclination, is 71.4%. Given that the overall performance of theinstallation is 84.5%, the total power contribution to the TCP panel system is 4508 kWh/yr.
The results obtained by simulation with Design Builder were calibrated and correctedbased on these solar energy results obtained in situ. They were contrasted with previousresearch on thermal energy in similar climates [75]. If we compare the two underfloorTCP panel scenarios SC3 and SC4, annual energy demand drops from 49.77 kWh/m2yrin SC3 to 28.30 kWh/m2yr in SC4, i.e., an energy saving of 43.14%. In winter, hot wateris distributed to the capillary tube mats from the installation’s accumulation tanks, whilein summer, cold water is sent to the primary circuit distribution network at 7 ◦C–12 ◦Cbased on a lithium chloride solar cold system (LiCl), with chemical energy storage [76]. Incases of insufficient thermal leap, the water can be later cooled in the heat pump, until theset temperature of distribution to fan coil dehumidification is reached in the heat pump(7 ◦C). These results support the viability of these underfloor systems through TCP panelsand a thermal solar panel system on the roof, with results similar to those obtained inprevious research.
5.4. Breakdown of the Energy Consumption of the Various Installation Components
To determine the factors that contribute most to reducing the house’s energy con-sumption, a disaggregated quantification of the energy consumption of each installationcomponent was performed.
The energy consumption of the three systems analysed is disaggregated in Table 7,for all equipment, pumps, circulators, fans, fan coils, etc., and elements of the installations,as well as the solar panel energy contributions. The most significant reductions occurin the air-supply ventilators in SC1. When TCP panels function with water distribution,small circulation pumps are needed, not the ventilators. Their consumption amounts to10.09 MWh/yr (4.82 + 5.27) in SC1, while in SC3 it is 3.066 MWh/yr (1.096 + 1.97). Theequipment also requires greater power and energy consumption when operating with agreater thermal leap between the outdoor air temperature Te and the indoor air temperatureTi, in addition to performing air dehumidification. The latter accounts for 13.83 MWh/yrin SC1 versus 10.02 MWh/yr in SC2 and 9.48 MWh/yr in SC3. These differences arepartly offset by fan coil consumption in SC3 (4.81 MWh/yr), but the final balance is highlypositive, presenting an energy saving of 25.19%.
Sustainability 2021, 13, 588 20 of 26
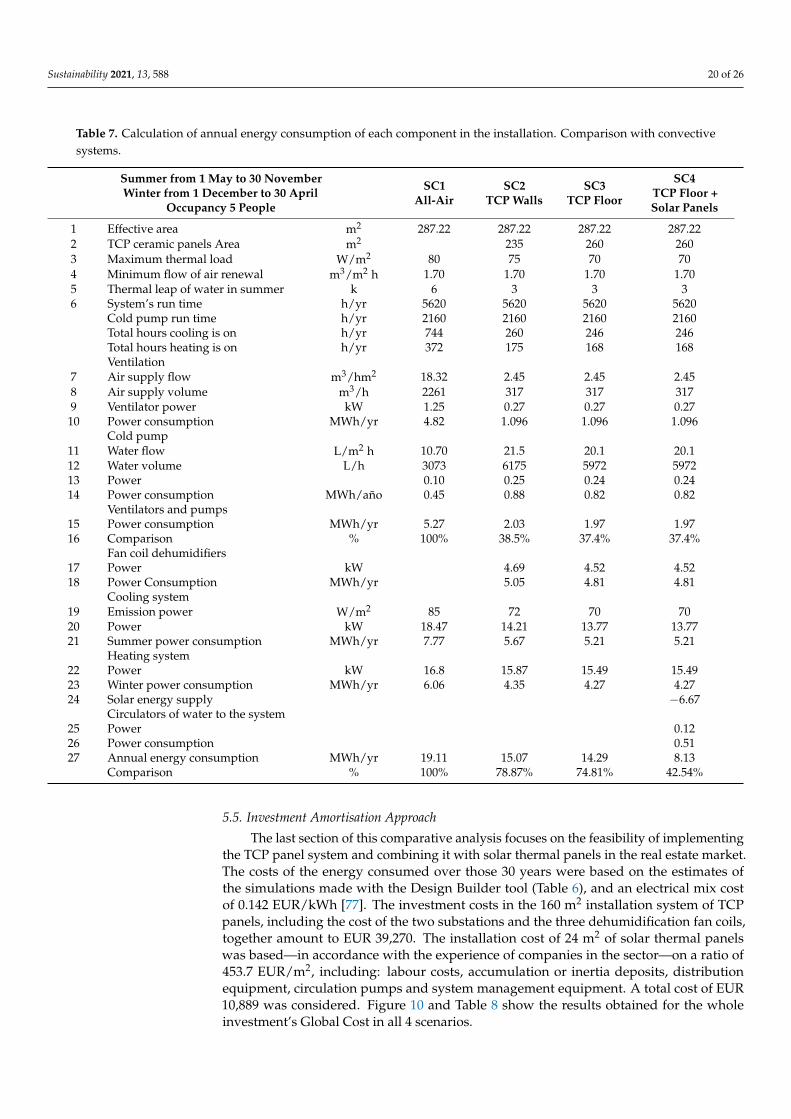
Table 7. Calculation of annual energy consumption of each component in the installation. Comparison with convectivesystems.
Summer from 1 May to 30 NovemberWinter from 1 December to 30 April
Occupancy 5 People
SC1All-Air
SC2TCP Walls
SC3TCP Floor
SC4TCP Floor +Solar Panels
1 Effective area m2 287.22 287.22 287.22 287.222 TCP ceramic panels Area m2 235 260 2603 Maximum thermal load W/m2 80 75 70 704 Minimum flow of air renewal m3/m2 h 1.70 1.70 1.70 1.705 Thermal leap of water in summer k 6 3 3 36 System’s run time h/yr 5620 5620 5620 5620
Cold pump run time h/yr 2160 2160 2160 2160Total hours cooling is on h/yr 744 260 246 246Total hours heating is on h/yr 372 175 168 168Ventilation
7 Air supply flow m3/hm2 18.32 2.45 2.45 2.458 Air supply volume m3/h 2261 317 317 3179 Ventilator power kW 1.25 0.27 0.27 0.2710 Power consumption MWh/yr 4.82 1.096 1.096 1.096
Cold pump11 Water flow L/m2 h 10.70 21.5 20.1 20.112 Water volume L/h 3073 6175 5972 597213 Power 0.10 0.25 0.24 0.2414 Power consumption MWh/año 0.45 0.88 0.82 0.82
Ventilators and pumps15 Power consumption MWh/yr 5.27 2.03 1.97 1.9716 Comparison % 100% 38.5% 37.4% 37.4%
Fan coil dehumidifiers17 Power kW 4.69 4.52 4.5218 Power Consumption MWh/yr 5.05 4.81 4.81
Cooling system19 Emission power W/m2 85 72 70 7020 Power kW 18.47 14.21 13.77 13.7721 Summer power consumption MWh/yr 7.77 5.67 5.21 5.21
Heating system22 Power kW 16.8 15.87 15.49 15.4923 Winter power consumption MWh/yr 6.06 4.35 4.27 4.2724 Solar energy supply −6.67
Circulators of water to the system25 Power 0.1226 Power consumption 0.5127 Annual energy consumption MWh/yr 19.11 15.07 14.29 8.13
Comparison % 100% 78.87% 74.81% 42.54%
5.5. Investment Amortisation Approach
The last section of this comparative analysis focuses on the feasibility of implementingthe TCP panel system and combining it with solar thermal panels in the real estate market.The costs of the energy consumed over those 30 years were based on the estimates ofthe simulations made with the Design Builder tool (Table 6), and an electrical mix costof 0.142 EUR/kWh [77]. The investment costs in the 160 m2 installation system of TCPpanels, including the cost of the two substations and the three dehumidification fan coils,together amount to EUR 39,270. The installation cost of 24 m2 of solar thermal panelswas based—in accordance with the experience of companies in the sector—on a ratio of453.7 EUR/m2, including: labour costs, accumulation or inertia deposits, distributionequipment, circulation pumps and system management equipment. A total cost of EUR10,889 was considered. Figure 10 and Table 8 show the results obtained for the wholeinvestment’s Global Cost in all 4 scenarios.
Sustainability 2021, 13, 588 21 of 26Sustainability 2021, 13, x FOR PEER REVIEW 21 of 26
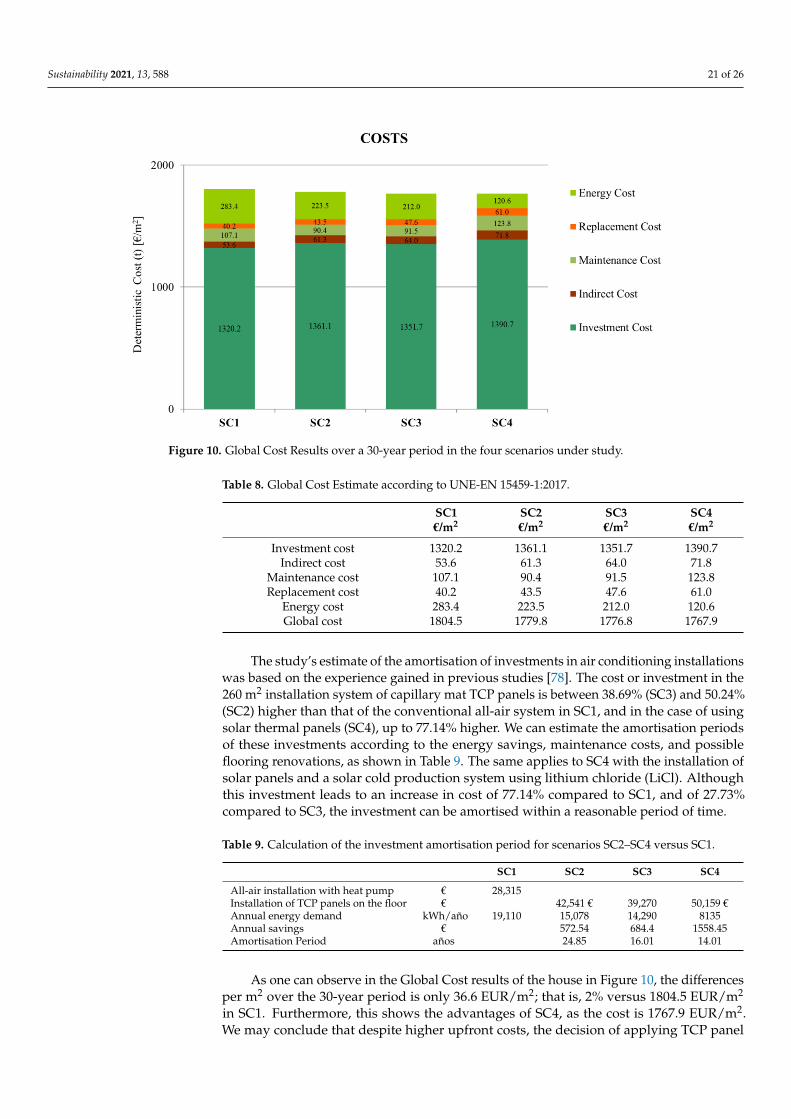
Figure 10. Global Cost Results over a 30-year period in the four scenarios under study.
The study’s estimate of the amortisation of investments in air conditioning installations
was based on the experience gained in previous studies [78]. The cost or investment in the
260 m2 installation system of capillary mat TCP panels is between 38.69% (SC3) and 50.24%
(SC2) higher than that of the conventional all-air system in SC1, and in the case of using
solar thermal panels (SC4), up to 77.14% higher. We can estimate the amortisation periods
of these investments according to the energy savings, maintenance costs, and possible floor-
ing renovations, as shown in Table 9. The same applies to SC4 with the installation of solar
panels and a solar cold production system using lithium chloride (LiCl). Although this in-
vestment leads to an increase in cost of 77.14% compared to SC1, and of 27.73% compared
to SC3, the investment can be amortised within a reasonable period of time.
Table 9. Calculation of the investment amortisation period for scenarios SC2–SC4 versus SC1.
SC1 SC2 SC3 SC4
All-air installation with heat pump € 28,315
Installation of TCP panels on the floor € 42,541 € 39,270 50,159 €
Annual energy demand kWh/año 19,110 15,078 14,290 8135
Annual savings € 572.54 684.4 1558.45
Amortisation Period años 24.85 16.01 14.01
As one can observe in the Global Cost results of the house in Figure 10, the differences
per m2 over the 30-year period is only 36.6 EUR/m2; that is, 2% versus 1804.5 EUR/m2 in
SC1. Furthermore, this shows the advantages of SC4, as the cost is 1767.9 EUR/m2. We
may conclude that despite higher upfront costs, the decision of applying TCP panel sys-
tems combined with solar panels on the roof is ultimately cost-effective over a 30-year
period. If we focus exclusively on radiant underfloor TCP panels (SC3), investments made
compared to the all-air system (SC1) could a priori be amortised within 16 years, while
the wall panel installation (SC2) would be amortised over 24 years, an excessively long
period. If we compare the positioning of TCP panels underfloor (SC3) versus on the wall
(SC2), we can conclude that radiant TCP floors are more cost-effective. The execution costs
were reduced by EUR 3271, while the annual energy demand dropped by 5.15%. When
incorporating solar thermal panels in both systems, the SC3 is more cost-effective. The
investment would be amortised in 14 years, while the TCP wall would be amortised in
17.4 years.
Figure 10. Global Cost Results over a 30-year period in the four scenarios under study.
Table 8. Global Cost Estimate according to UNE-EN 15459-1:2017.
SC1€/m2
SC2€/m2
SC3€/m2
SC4€/m2
Investment cost 1320.2 1361.1 1351.7 1390.7Indirect cost 53.6 61.3 64.0 71.8
Maintenance cost 107.1 90.4 91.5 123.8Replacement cost 40.2 43.5 47.6 61.0
Energy cost 283.4 223.5 212.0 120.6Global cost 1804.5 1779.8 1776.8 1767.9
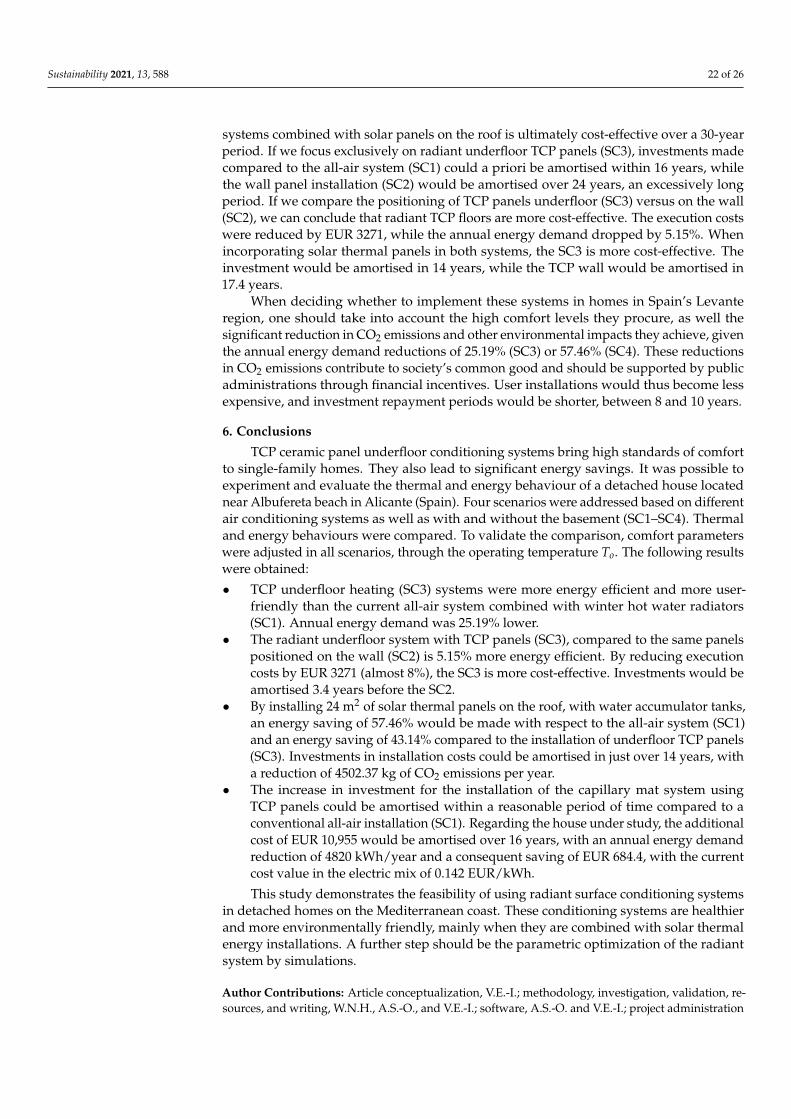
The study’s estimate of the amortisation of investments in air conditioning installationswas based on the experience gained in previous studies [78]. The cost or investment in the260 m2 installation system of capillary mat TCP panels is between 38.69% (SC3) and 50.24%(SC2) higher than that of the conventional all-air system in SC1, and in the case of usingsolar thermal panels (SC4), up to 77.14% higher. We can estimate the amortisation periodsof these investments according to the energy savings, maintenance costs, and possibleflooring renovations, as shown in Table 9. The same applies to SC4 with the installation ofsolar panels and a solar cold production system using lithium chloride (LiCl). Althoughthis investment leads to an increase in cost of 77.14% compared to SC1, and of 27.73%compared to SC3, the investment can be amortised within a reasonable period of time.
Table 9. Calculation of the investment amortisation period for scenarios SC2–SC4 versus SC1.
SC1 SC2 SC3 SC4
All-air installation with heat pump € 28,315Installation of TCP panels on the floor € 42,541 € 39,270 50,159 €Annual energy demand kWh/año 19,110 15,078 14,290 8135Annual savings € 572.54 684.4 1558.45Amortisation Period años 24.85 16.01 14.01
As one can observe in the Global Cost results of the house in Figure 10, the differencesper m2 over the 30-year period is only 36.6 EUR/m2; that is, 2% versus 1804.5 EUR/m2
in SC1. Furthermore, this shows the advantages of SC4, as the cost is 1767.9 EUR/m2.We may conclude that despite higher upfront costs, the decision of applying TCP panel
Sustainability 2021, 13, 588 22 of 26
systems combined with solar panels on the roof is ultimately cost-effective over a 30-yearperiod. If we focus exclusively on radiant underfloor TCP panels (SC3), investments madecompared to the all-air system (SC1) could a priori be amortised within 16 years, whilethe wall panel installation (SC2) would be amortised over 24 years, an excessively longperiod. If we compare the positioning of TCP panels underfloor (SC3) versus on the wall(SC2), we can conclude that radiant TCP floors are more cost-effective. The execution costswere reduced by EUR 3271, while the annual energy demand dropped by 5.15%. Whenincorporating solar thermal panels in both systems, the SC3 is more cost-effective. Theinvestment would be amortised in 14 years, while the TCP wall would be amortised in17.4 years.
When deciding whether to implement these systems in homes in Spain’s Levanteregion, one should take into account the high comfort levels they procure, as well thesignificant reduction in CO2 emissions and other environmental impacts they achieve, giventhe annual energy demand reductions of 25.19% (SC3) or 57.46% (SC4). These reductionsin CO2 emissions contribute to society’s common good and should be supported by publicadministrations through financial incentives. User installations would thus become lessexpensive, and investment repayment periods would be shorter, between 8 and 10 years.
6. Conclusions
TCP ceramic panel underfloor conditioning systems bring high standards of comfortto single-family homes. They also lead to significant energy savings. It was possible toexperiment and evaluate the thermal and energy behaviour of a detached house locatednear Albufereta beach in Alicante (Spain). Four scenarios were addressed based on differentair conditioning systems as well as with and without the basement (SC1–SC4). Thermaland energy behaviours were compared. To validate the comparison, comfort parameterswere adjusted in all scenarios, through the operating temperature To. The following resultswere obtained:
• TCP underfloor heating (SC3) systems were more energy efficient and more user-friendly than the current all-air system combined with winter hot water radiators(SC1). Annual energy demand was 25.19% lower.
• The radiant underfloor system with TCP panels (SC3), compared to the same panelspositioned on the wall (SC2) is 5.15% more energy efficient. By reducing executioncosts by EUR 3271 (almost 8%), the SC3 is more cost-effective. Investments would beamortised 3.4 years before the SC2.
• By installing 24 m2 of solar thermal panels on the roof, with water accumulator tanks,an energy saving of 57.46% would be made with respect to the all-air system (SC1)and an energy saving of 43.14% compared to the installation of underfloor TCP panels(SC3). Investments in installation costs could be amortised in just over 14 years, witha reduction of 4502.37 kg of CO2 emissions per year.
• The increase in investment for the installation of the capillary mat system usingTCP panels could be amortised within a reasonable period of time compared to aconventional all-air installation (SC1). Regarding the house under study, the additionalcost of EUR 10,955 would be amortised over 16 years, with an annual energy demandreduction of 4820 kWh/year and a consequent saving of EUR 684.4, with the currentcost value in the electric mix of 0.142 EUR/kWh.
This study demonstrates the feasibility of using radiant surface conditioning systemsin detached homes on the Mediterranean coast. These conditioning systems are healthierand more environmentally friendly, mainly when they are combined with solar thermalenergy installations. A further step should be the parametric optimization of the radiantsystem by simulations.
Author Contributions: Article conceptualization, V.E.-I.; methodology, investigation, validation, re-sources, and writing, W.N.H., A.S.-O., and V.E.-I.; software, A.S.-O. and V.E.-I.; project administration
Sustainability 2021, 13, 588 23 of 26
and funding acquisition, V.E.-I. All authors have read and agreed to the published version of themanuscript.
Funding: This research has been funded by the projects “Generation of knowledge on the multisen-sory interaction of human beings with the environments for the development of new products andservices in the ceramics sector (4SENSES)” (ACOMP/2010/040). Complementary aid for R + D + iprojects. Generalitat Valenciana. Ministry of Education. Spain, 2010; and “Research on sustainablearchitectural and bioclimatic conditioning solutions using ceramic materials (ASCER1-18I)”. SpanishAssociation of Manufacturers of Ceramic Tiles and Flooring (ASCER). 2017–2018.
Institutional Review Board Statement: Not applicable.
Informed Consent Statement: Not applicable.
Data Availability Statement: The monitoring data contained in the article are not available forreasons of confidentiality. The data presented in this study, derived from the Design Builder tool, areavailable upon request from the corresponding author.
Acknowledgments: Our thanks to Almudena Espinosa for his help in monitorization of the house; toJosé Luis Sanjuan for the Design Builder simulations; and to Francisco José Aldea and Ginés Gómezfor their help with the TCP panel mounting.
Conflicts of Interest: The funders had no role in the design of the study; in the collection, analyses,or interpretation of data; in the writing of the manuscript, or in the decision to publish the results.
References1. Karmann, C.; Schiavon, S.; Bauman, F. Thermal comfort in buildings using radiant vs. all-air systems: A critical literature review.
Build. Environ. 2017, 111, 123–131. [CrossRef]2. Cacabelos, C.; Eguía, P.; Míguez, J.L.; Granada, E.; Arce, M.E. Calibrated simulation of a public library HVAC system with
aground-source heat pump and a radiant floor using TRNSYS and GenOpt. Energy Build. 2015, 108, 114–126. [CrossRef]3. Feng, J.; Schiavon, S.; Bauman, F. Cooling load differences between radiant and air systems. Energy Build. 2013, 65, 310–321.
[CrossRef]4. Acikgoz, O.; Karakoyun, Y.; Yumurtaci, Z.; Dukhan, N.; Dalkılıç, A.S. Realistic experimental heat transfer characteristics of
radiant floor heating using sidewalls as heat sinks. Energy Build. 2019, 183, 515–526. [CrossRef]5. Wang, D.; Lu, L.; Cui, P. A new analytical solution for horizontal geothermal heat exchangers with vertical spiral coils. Int. J. Heat
Mass Transf. 2016, 100, 111–120. [CrossRef]6. Kim, M.J.; Lee, S.-R.; Yoon, S.; Jeon, J.-S. An applicable design method for horizontal spiral-coil-type ground heat exchangers.
Geothermics 2018, 72, 338–347. [CrossRef]7. Echarri-Iribarren, V. Conditioning using ceramic floor panels with capillary tube mats and solar thermal panels on the Mediter-
ranean coast: Energy savings and investment amortization. Energy Build. 2019, 202, 109334. [CrossRef]8. Zhang, C.; Pomianowski, M.; Heiselberg, P.K.; Yu, T. A review of integrated radiant heating/cooling with ventilation systems-
Thermal comfort and indoor air quality. Energy Build. 2020, 223, 110094. [CrossRef]9. Obrecht, T.P.; Kunic, R.; Jordan, S.; Dovjak, M. Comparison of Health and Well-Being Aspects in Building Certification Schemes.
Sustainability 2019, 11, 2616. [CrossRef]10. Rhee, K.-N.; Olesen, B.W.; Kim, K.W. Ten questions about radiant heating and cooling systems. Build. Environ. 2017, 112, 367–381.
[CrossRef]11. Lin, B.; Wang, Z.; Sun, H.; Zhu, Y.; Ouyang, Q. Evaluation and comparison of thermal comfort of convective and radiant heating
terminals in office buildings. Build. Environ. 2016, 106, 91–102. [CrossRef]12. Mustakallio, P.; Bolashikov, Z.D.; Rezgals, L.; Lipczynska, A.; Melikov, A.K.; Kosonen, R. Thermal environment in a simulated
double office room with convective and radiant cooling systems. Build. Environ. 2017, 123, 88–100. [CrossRef]13. Krzaczek, M.; Florczuk, J.; Tejchman, J. Improved energy management technique in pipe-embedded wall heating/cooling system
in residential buildings. Appl. Energy 2019, 254, 113711. [CrossRef]14. Catalina, T.; Virgone, J.; Kuznik, F. Evaluation of thermal comfort using combined CFD and experimentation study in a test room
equipped with a cooling ceiling. Build. Environ. 2009, 44, 1740–1750. [CrossRef]15. Sun, H.; Wu, Y.; Lin, B.; Duan, M.; Lin, Z.; Li, H. Experimental investigation on the thermal performance of a novel radiant
heating and cooling terminal integrated with a flat heat pipe. Energy Build. 2020, 208, 109646. [CrossRef]16. Yeom, G.; Jung, D.E.; Do, S.L. Improving a Heating Supply Water Temperature Control for Radiant Floor Heating Systems in
Korean High-Rise Residential Buildings. Sustainability 2019, 11, 3926. [CrossRef]17. Márquez, A.A.; López, J.M.C.; Hernández, F.F.; Muñoz, F.D.; Andres, A.C. A comparison of heating terminal units: Fan-coil
versus radiant floor, and the combination of both. Energy Build. 2017, 138, 621–629. [CrossRef]18. Seo, J.-M.; Song, D.; Lee, K.H. Possibility of coupling outdoor air cooling and radiant floor cooling under hot and humid climate
conditions. Energy Build. 2014, 81, 219–226. [CrossRef]
Sustainability 2021, 13, 588 24 of 26
19. Hernández, F.F.; López, J.M.C.; Fernández-Gutiérrez, A.; Muñoz, F.D.; Fernandez, F. A new terminal unit combining a radiantfloor with an underfloor air system: Experimentation and numerical model. Energy Build. 2016, 133, 70–78. [CrossRef]
20. Ansuini, R.; Larghetti, R.; Giretti, A.; Lemma, M. Radiant floors integrated with PCM for indoor temperature control. EnergyBuild. 2011, 43, 3019–3026. [CrossRef]
21. Sun, W.; Zhang, Y.; Ling, Z.; Fang, X.; Zhang, Z. Experimental investigation on the thermal performance of double-layer PCMradiant floor system containing two types of inorganic composite PCMs. Energy Build. 2020, 211, 109806. [CrossRef]
22. Zhou, Y.; Zheng, S.; Zhang, G. A review on cooling performance enhancement for phase change materials integrated systems—flexible design and smart control with machine learning applications. Build. Environ. 2020, 174, 106786. [CrossRef]
23. Movinord Climatización. Manual de Climatización Tranquila. Available online: http://www.movinord.com/descargas/Climatizacion%202008.pdf (accessed on 11 March 2019).
24. Mikeska, T.; Svendsen, S. Dynamic behavior of radiant cooling system based on capillary tubes in walls made of high performanceconcrete. Energy Build. 2015, 108, 92–100. [CrossRef]
25. Zhou, G.; He, J. Thermal performance of a radiant floor heating system with different heat storage materials and heating pipes.Appl. Energy 2015, 138, 648–660. [CrossRef]
26. ISO. ISO-11855: 2012, Building Environment Design—Design, Dimensioning, Installation and Control of Embedded Radiant Heating andCooling Systems; International Organization for Standardization: Geneva, Switzerland, 2012.
27. Tang, H.; Zhang, T.; Liu, X.; Li, C. A novel approximate harmonic method for the dynamic cooling capacity prediction of radiantslab floors with time variable solar radiation. Energy Build. 2020, 223, 110117. [CrossRef]
28. Feng, J.; Schiavon, S.; Bauman, F. New method for the design of radiant floor cooling systems with solar radiation. Energy Build.2016, 125, 9–18. [CrossRef]
29. De Dear, R.J.; Akimoto, T.; Arens, E.A.; Brager, G.; Candido, C.; Cheong, K.W.D.; Li, B.; Nishihara, N.; Sekhar, S.C.; Tanabe, S.;et al. Progress in thermal comfort research over the last twenty years. Indoor Air 2013, 23, 442–461. [CrossRef]
30. Beka. Capillary Tube Systems. Product Data Sheets. Technical Information G0; Beka Heiz-und Külmatten: Berlín, Germany, 2008.Available online: https://www.beka-klima.de/en/heating-cooling/capillary-tube-technology/ (accessed on 5 March 2019).
31. Zhao, M.; Gu, Z.; Kang, W.; Liu, X.; Zhang, L.Y.; Jin, L.; Zhang, Q. Experimental investigation and feasibility analysis on acapillary radiant heating system based on solar and air source heat pump dual heat source. Appl. Energy 2017, 185, 2094–2105.[CrossRef]
32. Climate WellTM 10. Design Guidelines. Available online: http://www.solarcombiplus.eu/docs/SolarCombi_ClimateWell_trainingmaterial5.pdf (accessed on 12 March 2019).
33. Patel, J.; Pandya, B.; Mudgal, A. Exergy Based Analysis of LiCl-H2O Absorption Cooling System. Energy Procedia 2017, 109,261–269. [CrossRef]
34. Widiatmojo, A.; Gaurav, S.; Ishihara, T.; Yasukawa, K.; Uchida, Y.; Yoshioka, M.; Tomigashi, A. Using a capillary mat as a shallowheat exchanger for a ground source heat pump system. Energy Build. 2020, 209, 109684. [CrossRef]
35. Zamora, M. Proyecto Geocool: Empleo de Bombas de Calor Acopladas A Intercambiadores Geotérmicos. Available online:http://blog.energesis.es/wp-content/uploads/2008_03_ENERGETICA_XXI_.pdf (accessed on 9 March 2019).
36. Yeom, D.; La Roche, P. Investigation on the cooling performance of a green roof with a radiant cooling system. Energy Build. 2017,149, 26–37. [CrossRef]
37. Haiwen, S.; Lin, D.; Xiangli, L.; Yingxin, Z. Quasi-dynamic energy-saving judgment of electric-driven seawater source heat pumpdistrict heating system over boiler house district heating system. Energy Build. 2010, 42, 2424–2430. [CrossRef]
38. Li, Z.; Songtao, H. Research on the heat pump system using seawater as heat source or sink. Build. Energy Environ. 2006, 25,34–38.
39. Tian, Z.; Yin, X.; Ding, Y.; Zhang, C. Research on the actual cooling performance of ceiling radiant panel. Energy Build. 2012, 47,636–642. [CrossRef]
40. Zhao, R.; Tuan, C.Y.; Luo, B.; Xu, A. Radiant heating utilizing conductive concrete tiles. Build. Environ. 2019, 148, 82–95. [CrossRef]41. Mikeska, T.; Fan, J.; Svendsen, S. Full scale measurements and CFD investigations of a wall radiant cooling system integrated in
thin concrete walls. Energy Build. 2017, 139, 242–253. [CrossRef]42. Choi, N.; Yamanaka, T.; Sagara, K.; Momoi, Y.; Suzuki, T. Displacement ventilation with radiant panel for hospital wards:
Measurement and prediction of the temperature and contaminant concentration profiles. Build. Environ. 2019, 160, 106197.[CrossRef]
43. Rucevskis, S.; Akishin, P.; Korjakins, A. Parametric analysis and design optimisation of PCM thermal energy storage system forspace cooling of buildings. Energy Build. 2020, 224, 110288. [CrossRef]
44. Ning, B.; Chen, Y.; Liu, H.; Zhang, S. Cooling capacity improvement for a radiant ceiling panel with uniform surface temperaturedistribution. Build. Environ. 2016, 102, 64–72. [CrossRef]
45. Cantavella, V.; Bannier, E.; Silva, G.; Muñoz, S.; Portolés, J.; Algora, E.; Garcia, M.A. Dynamics of termal performance of anelectric radiant floor with removable ceramic tiles. In Proceedings of the 2010 11th World Congress on Ceramic Tile Quality,Castellon, Spain, 15–16 February 2010.
46. Koschenz, M.; Lehmann, B. Development of a thermally activated ceiling panel with PCM for application in lightweight andretrofitted buildings. Energy Build. 2004, 36, 567–578. [CrossRef]
Sustainability 2021, 13, 588 25 of 26
47. Echarri Iribarren, V.; Galiano Garrigós, A.L.; González Avilés, A.B. Ceramics and healthy heating and cooling systems: Thermalceramic panels in buildings. Conditions of comfort and energy demand versus convective systems. Inf. Construcción 2016, 68,19–32.
48. Echarri, V.; Oviedo, E.; Lázaro, V. Panel de Acondicionamiento Térmico Cerámico. Patent P201001626 28 December 2010.INVENES, OEPM –Oficina Española de Patentes y Marcas. Available online: http://invenes.oepm.es/InvenesWeb/detalle?referencia=P201001626 (accessed on 10 March 2019).
49. Echarri-Iribarren, V. Thermal Ceramic Panels and Passive Systems in Mediterranean Housing: Energy Savings and EnvironmentalImpacts. Sustainability 2017, 9, 1613. [CrossRef]
50. Kottek, M.; Grieser, J.; Beck, C.; Rudolf, B.; Rubel, F. World Map of the Köppen-Geiger climate classification updated. Meteorol. Z.2006, 15, 259–263. [CrossRef]
51. Kottek, M.; Grieser, J.; Beck, C.; Rudolf, B.; Rubel, F. World Map of the Köppen-Geiger Climate Classification Updated. High ResolutionMap and Data (Version March 2017); KMZ File for Google Earth (high res): Global_1986-2010_KG_5m.kmz; Climate Change &Infectious Diseases: Wien, Austria, 2017. Available online: http://koeppen-geiger.vu-wien.ac.at (accessed on 13 April 2019).
52. Orden FOM/1635/2013, de 10 de Septiembre, por la que se Actualiza el Documento Básico DB-HE Ahorro de Energía, del Código Técnicode la Edificación, Aprobado por Real Decreto 314/2006, de 17 de marzo; (Publicado en: <BOE> núm. 219, de 12 de Septiembrede 2013, Páginas 67137–67209); Spanish Ministry of Public Works and Transport: Madrid, Spain, 2013. Available online:https://www.codigotecnico.org/index.php/menu-ahorro-energia.html (accessed on 16 April 2019).
53. Bojic, M.; Cvetkovic, D.; Miletic, M.; Maleševic, J.; Boyer, H. Energy, cost, and CO2 emission comparison between radiant wallpanel systems and radiator systems. Energy Build. 2012, 54, 496–502. [CrossRef]
54. International Organization for Standardization. ISO 9972:2015 Thermal Performance of Buildings—Determination of AirPermeability of Buildings—Fan Pressurization Method. (ISO 9972:1996, Modified). 2002. Available online: https://www.iso.org/standard/55718.html (accessed on 9 March 2019).
55. 2017 ASHRAE Handbook—Fundamentals; American Society of Heating, Refrigeration and Air Conditioning Engineers: Atlanta, GA,USA, 2017; ISBN 9781939200587. Available online: https://www.ashrae.org/technical-resources/ashrae-handbook/description-2017-ashrae-handbook-fundamentals (accessed on 20 March 2019).
56. UNE EN ISO 10456:2012. Materiales y Productos Para la Edificación. Propiedades Higrotérmicas. Valores Tabulados de Diseño yProcedimientos Para la Determinación de los Valores Térmicos Declarados. 2012. Available online: http://www.aenor.es/aenor/normas/normas/fichanorma.asp?tipo=N&codigo=N0049362#.Wgbq4tThCmw (accessed on 9 October 2017).
57. Feijó-Muñoz, J.; Pardal, C.; Echarri-Iribarren, V.; Fernández-Agüera, J.; De Larriva, R.A.; Calderín, M.M.; Poza-Casado, I.;Padilla-Marcos, M.Á.; Meiss, A. Energy impact of the air infiltration in residential buildings in the Mediterranean area of Spainand the Canary islands. Energy Build. 2019, 188–189, 226–238. [CrossRef]
58. Andújar Márquez, J.M.; Martínez Bohórquez, M.Á.; Gómez Melgar, S. A New Metre for Cheap, Quick, Reliable and SimpleThermal Transmittance (U-Value) Measurements in Buildings. Sensors 2017, 17, 2017. [CrossRef]
59. Nardi, I.; Ambrosini, D.; De Rubeis, T.; Sfarra, S.; Perilli, S.; Pasqualoni, G. A comparison between thermographic and flow-metermethods for the evaluation of thermal transmittance of different wall constructions. J. Phys. Conf. Ser. 2015, 655, 012007. [CrossRef]
60. Thermal Insulation. Building Elements. In-Situ Measurement of Thermal Resistance and Thermal Transmittance. Part 1: Heat FlowMetre Method; ISO 9869-1:2014; International Organization for Standardization: Geneva, Switzerland, 2014. Available online:https://www.iso.org/standard/59697.html (accessed on 15 March 2019).
61. Balghouthi, M.; Chahbani, M.; Guizani, A. Investigation of a solar cooling installation in Tunisia. Appl. Energy 2012, 98, 138–148.[CrossRef]
62. Sarbu, I.; Sebarchievici, C. Review of solar refrigeration and cooling systems. Energy Build. 2013, 67, 286–297. [CrossRef]63. Bataineh, K.; Taamneh, Y. Review and recent improvements of solar sorption cooling systems. Energy Build. 2016, 128, 22–37.
[CrossRef]64. Sancho Ávila, J.M.; Riesco Martín, J.; Jiménez Alonso, C.; Sánchez de Cos, M.D.; Montero Cadalso, J.; López Bartolomé,
M. Atlas de Radiación Solar en España Utilizando Datos del SAF de Clima de Eumetsat; AEMET: Madrid, Spain, 2005. Avail-able online: http://www.aemet.es/documentos/es/serviciosclimaticos/datosclimatologicos/atlas_radiacion_solar/atlas_de_radiacion_24042012.pdf (accessed on 10 March 2019).
65. González-Roubaud, E.; Pérez-Osorio, D.; Prieto, C. Review of commercial thermal energy storage in concentrated solar powerplants: Steam vs. molten salts. Renew. Sustain. Energy Rev. 2017, 80, 133–148. [CrossRef]
66. Li, H.; Bi, Y.; Qin, L.; Zang, G. Absorption solar-ground source heat pump: Life cycle environmental profile and comparisons.Geothermics 2020, 87, 101850. [CrossRef]
67. Energy Performance of Buildings—Economic Evaluation Procedure for Energy Systems in Buildings—Part 1: Calculation Procedures;UNE-EN 15459-1:2017; Module M1-14; European Committee for Standardization (CEN): Brussels, Belgium, 2017. Availableonline: https://standards.cen.eu/dyn/www/f?p=204:110:0::::FSP_PROJECT,FSP_ORG_ID:40932,6209&cs=110690DD8F9BE238B61D722D035C11CAE (accessed on 11 June 2019).
68. Theodosiou, T.G.; Tsikaloudaki, A.G.; Kontoleon, K.J.; Bikas, D.K. Thermal bridging analysis on cladding systems for buildingfacades. Energy Build. 2015, 109, 377–384. [CrossRef]
69. Bienvenido-Huertas, D.; Moyano, J.; Marin, D.; Fresco-Contreras, R. Review of in situ methods for assessing the thermaltransmittance of walls. Renew. Sustain. Energy Rev. 2019, 102, 356–371. [CrossRef]
Sustainability 2021, 13, 588 26 of 26
70. Herramienta Unificada Lider-Calener (HULC). Orden FOM/1635/2013, de 10 de Septiembre (BOE de 12 de septiembre), por la quese Actualiza el Documento Básico DB HE «Ahorro de Energía», del CTE; Ministerio de Ciencia e Innovación: Madrid, Spain, 2013.Available online: https://www.codigotecnico.org/index.php/menu-recursos/menu-aplicaciones/282-herramientaunificada-lider-calener.html (accessed on 9 March 2019).
71. Domínguez-Muñoz, F.; Cejudo-López, J.M.; Carrillo-Andrés, A. Uncertainty in peak cooling load calculations. Energy Build. 2010,42, 1010–1018. [CrossRef]
72. Stetiu, C. Energy and peak power savings potential of radiant cooling systems in US commercial buildings. Energy Build. 1999,30, 127–138. [CrossRef]
73. European Comission. LCDN—The Life Cycle Data Network. Available online: https://eplca.jrc.ec.europa.eu/LCDN/ (accessedon 9 March 2019).
74. Instituto para la Diversificación y Ahorro de Energía (IDAE). Informe de Balance de Consumo de Energía Final. 1990–2018; Institutopara la Diversificación y Ahorro de Energía: Madrid, Spain, 2018. Available online: http://sieeweb.idae.es/consumofinal/(accessed on 30 October 2020).
75. Corona, B.; de la Rúa, C.; San Miguel, G. Socio-economic and environmental effects of concentrated solar power in Spain: Amultiregional input output analysis. Sol. Energy Mater. Sol. Cells 2016, 156, 112–121. [CrossRef]
76. Wang, R.Z.; Xia, Z.Z.; Wang, L.W.; Lu, Z.S.; Li, S.L.; Li, T.X.; Wu, J.Y.; He, S. Heat transfer design in adsorption refrigerationsystems for efficient use of low-grade thermal energy. Energy 2011, 36, 5425–5439. [CrossRef]
77. IDAE. Informe de Precios Energéticos Regulados. 2017. Available online: http://www.idae.es/sites/default/files/estudios_informes_y_estadisticas/tarifas_reguladas_julio_2017.pdf (accessed on 7 March 2019).
78. Al Ajmi, A.; Abou-Ziyan, H.; Ghoneim, A. Achieving annual and monthly net-zero energy of existing building in hot climate.Appl. Energy 2016, 165, 511–521. [CrossRef]