Embed Size (px)
Citation preview
EPJ Nuclear Sci. Technol. 3, 24 (2017)© M. Marzo et al., published by EDP Sciences, 2017DOI: 10.1051/epjn/2017016
NuclearSciences& Technologies
Available online at:http://www.epj-n.org
REGULAR ARTICLE
RadFET dose response in the CHARM mixed-field: FLUKAMC simulationsMatteo Marzo*, Stefano Bonaldo, Markus Brugger, Salvatore Danzeca, Ruben Garcia Alia,Angelo Infantino, and Adam Thornton
CERN, European Organization for Nuclear Research, Geneva, Switzerland
* e-mail: m
This is an O
Received: 18 January 2017 / Received in final form: 16 May 2017 / Accepted: 19 June 2017
Abstract. This paper focuses on Monte Carlo simulations aimed at calculating the dose response of theRadFET dosimeter, when exposed to the complex CHARM mixed-fields, at CERN. We study how the dosedeposited in the gate oxide (SiO2) of the RadFET is affected by the energy threshold variation in the MonteCarlo simulations as well as the materials and sizes of scoring volumes. Also the characteristics of the inputspectra will be taken into account and their impact on the final simulated dose will be studied. Dose variation as afunction of the position of the RadFET in the test facility will be then examined and comparisons withexperimental results will be shown. The contribution to the total dose due to all particles of the mixed-field,under different target-shielding configurations, is finally presented, aiming at a complete characterization of theRadFETs dose response in the CHARM mixed-fields.
1 Introduction
We present Monte Carlo calculations of the dose responseof the RADiation sensing Field Effect Transistors(RadFET) [1–4], when they are exposed to the radiationenvironment at the CERN High Energy AcceleratorMixed-field (CHARM) test facility [5,6].
The main purpose of the facility is to replicate differentradiation environments (space, atmospheric, acceleratorcomplexes, for instance) for radiation effects testing onelectronic components and systems. RadFETs at CHARMare then used as online dosimeters during the radiationtests, to characterize the complex mixed-fields reproducedin the test area.
In this regard, we are interested in investigating thedose deposited in the gate oxide (GO) of the RadFET. TheGO is a very small sensitive volume where the increase ofthe accumulated charge dQtot, as a consequence of theexposure to the radiation fields of interest, implies a changeof the source–drain channel thickness of the MOSFET.This causes a drift in the threshold voltage dVth of thedevice and a modification of its electric response, which cantherefore be correlated to the deposited dose.
Measurements and FLUKA [7,8] simulations of thedose response of RadFETs in the mixed-field at CHARMhad been already performed to understand the radiationfield in the test area. However discrepancies in the 25–45%
pen Access article distributed under the terms of the Creative Comwhich permits unrestricted use, distribution, and reproduction
range had been identified between simulated and experi-mental values. In this paper we want to set up moreaccurate simulations to investigate this mismatch.
2 CHARM and its mixed-field: measurementsvs. FLUKA simulations
The CHARM test facility is located in the Meyrin site ofCERN, specifically in the Proton Synchrotron (PS) EastArea hall. The main source of the radiation fieldreproduced at CHARM is in fact the particleshower developing from the interaction between the24 GeV/c proton beam extracted from the PS and ametallic target [5,6].
2.1 Facility variables
Due to the high energetic particles treated at CHARM,particular attention is given to the protection of thepersonnel. Concrete, marble and iron are used to separatethe irradiation chamber from the technical area. Theirradiation chamber is a 7� 7� 3m3 room, available forthe irradiation tests.
The most relevant variables needed to obtain and tunethe facility's mixed-field, are:
–min
the 24 GeV/c beam from the PS;
– a target placed along the beam direction (Fig. 1). It ismade of copper (cp), aluminum (al) or aluminum withholes (alh), depending on the desired mixed-fieldintensity and composition;ons Attribution License (http://creativecommons.org/licenses/by/4.0),any medium, provided the original work is properly cited.
Fig. 1. CHARM test facility model, top view.
2 M. Marzo et al.: EPJ Nuclear Sci. Technol. 3, 24 (2017)
–
13 rack test locations in lateral and downstream positionswith respect to the beam direction, 3� 5m far from thetarget (Fig. 1);–
Fig. 2. Mixed-field: simulated spectra (lethargy), position 1,cp_0000 and cp_CIIC configurations.
1 Characterized by particles transport thresholds at 10MeV,except for neutrons at 10�5 eV and delta ray production withthreshold at 1MeV.
a shielding between the target and the lateral positions,created by using 4 movable blocks of concrete (C) andiron (I) (Fig. 1).
The 24 GeV/c proton beam enters the CHARM facilityand impinges on the target described above. From theinteraction between the two, a shower of particles takesplace. This shower can further interact with the shielding(if any), possibly generating other secondaries andconsequently producing (or stopping) other particles: thisis the way we create and tune the mixed-field at CHARM.
In particular, in this paper, two target-shielding layoutsare examined: copper target and no shielding (movableplates in OFF position), namely cp_0000, and coppertarget and concrete–iron–iron–concrete shielding, i.e.cp_CIIC. Other mixed-fields can be produced usingdifferent shielding configurations and target materials.
FLUKA Monte Carlo simulations have already beenperformed to characterize the different radiation fields: theknowledge of the field at any rack test locations in terms ofparticles spectra is the first, preliminary step to run thededicated simulations on the RadFET (first simulationstep).
2.2 FLUKA simulations settings to calculate themixed-field at CHARM
AFLUKAmodel of CHARMwas built in the recent past tosimulate the radiation field inside the test facility andretrieve all the most relevant quantities for radiation toelectronics testing.
The NEWDEFA1 FLUKA default was used as a firstapproximation to reduce the computational time, given thelarge geometry model of the facility: the higher thethresholds for production and transport of particles, thelower the computational time.
For the same reasons, a 20 cm side air cube was chosenas sensitive volume: to score the physical quantities ofinterest (dose, energy, fluences, etc.). Scoring, for instance,dose inside a the gate oxide (GO) of the RadFET – whosecharacteristic dimensions are several order of magnitudelower than the CHARM's size –, would have led to adisproportional increase of the CPU time (a larger amountof primaries to get the same statistics).
An example of the characterization of the mixed-fieldat CHARM in terms of simulated particle energy spectra(lethargy), for the cp_0000 and cp_CIIC configurations ispresented – for the position 1 – in Figure 2. It is clear howthe field is populated by secondary electrons, positrons,muons (m±), photons, neutrons and charged hadrons(protons, kaons (k±) and pions (p±)). Those spectra have
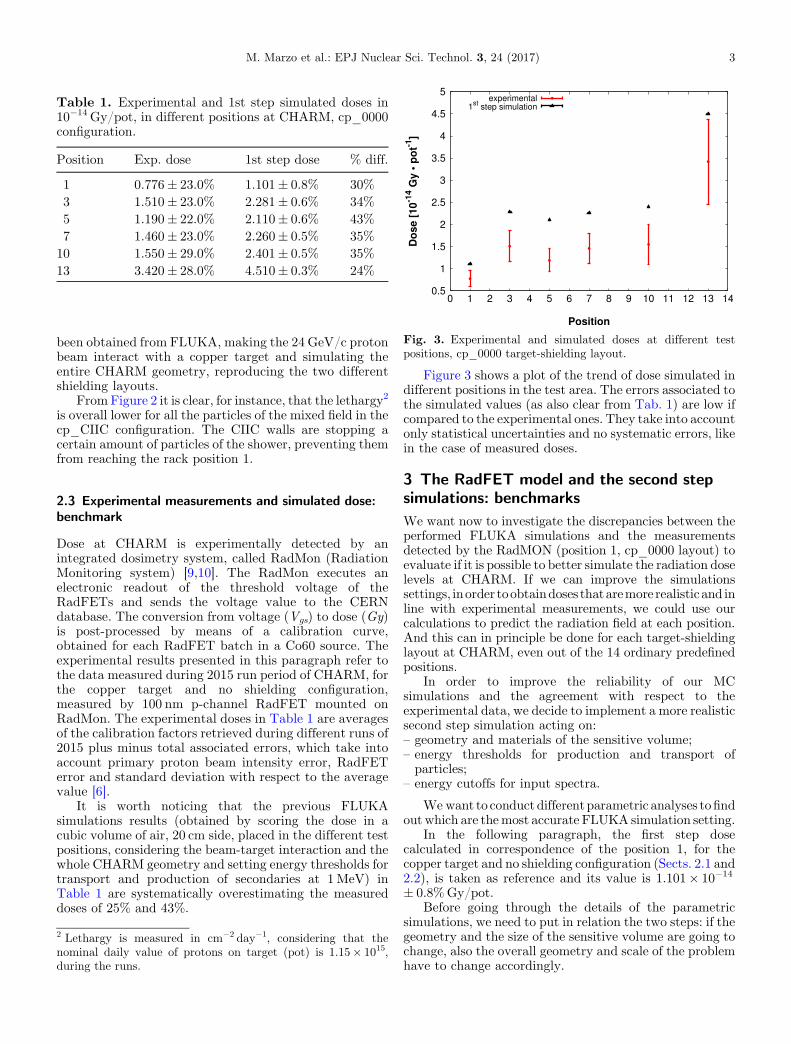
Table 1. Experimental and 1st step simulated doses in10�14 Gy/pot, in different positions at CHARM, cp_0000configuration.
Position Exp. dose 1st step dose % diff.
1 0.776 ± 23.0% 1.101 ± 0.8% 30%3 1.510 ± 23.0% 2.281 ± 0.6% 34%5 1.190 ± 22.0% 2.110 ± 0.6% 43%7 1.460 ± 23.0% 2.260 ± 0.5% 35%
10 1.550 ± 29.0% 2.401 ± 0.5% 35%13 3.420 ± 28.0% 4.510 ± 0.3% 24%
Fig. 3. Experimental and simulated doses at different testpositions, cp_0000 target-shielding layout.
M. Marzo et al.: EPJ Nuclear Sci. Technol. 3, 24 (2017) 3
been obtained from FLUKA, making the 24 GeV/c protonbeam interact with a copper target and simulating theentire CHARM geometry, reproducing the two differentshielding layouts.
From Figure 2 it is clear, for instance, that the lethargy2
is overall lower for all the particles of the mixed field in thecp_CIIC configuration. The CIIC walls are stopping acertain amount of particles of the shower, preventing themfrom reaching the rack position 1.
2.3 Experimental measurements and simulated dose:benchmark
Dose at CHARM is experimentally detected by anintegrated dosimetry system, called RadMon (RadiationMonitoring system) [9,10]. The RadMon executes anelectronic readout of the threshold voltage of theRadFETs and sends the voltage value to the CERNdatabase. The conversion from voltage (Vgs) to dose (Gy)is post-processed by means of a calibration curve,obtained for each RadFET batch in a Co60 source. Theexperimental results presented in this paragraph refer tothe data measured during 2015 run period of CHARM, forthe copper target and no shielding configuration,measured by 100 nm p-channel RadFET mounted onRadMon. The experimental doses in Table 1 are averagesof the calibration factors retrieved during different runs of2015 plus minus total associated errors, which take intoaccount primary proton beam intensity error, RadFETerror and standard deviation with respect to the averagevalue [6].
It is worth noticing that the previous FLUKAsimulations results (obtained by scoring the dose in acubic volume of air, 20 cm side, placed in the different testpositions, considering the beam-target interaction and thewhole CHARM geometry and setting energy thresholds fortransport and production of secondaries at 1MeV) inTable 1 are systematically overestimating the measureddoses of 25% and 43%.
2 Lethargy is measured in cm�2 day�1, considering that thenominal daily value of protons on target (pot) is 1.15� 1015,during the runs.
Figure 3 shows a plot of the trend of dose simulated indifferent positions in the test area. The errors associated tothe simulated values (as also clear from Tab. 1) are low ifcompared to the experimental ones. They take into accountonly statistical uncertainties and no systematic errors, likein the case of measured doses.
3 The RadFET model and the second stepsimulations: benchmarksWe want now to investigate the discrepancies between theperformed FLUKA simulations and the measurementsdetected by the RadMON (position 1, cp_0000 layout) toevaluate if it is possible to better simulate the radiation doselevels at CHARM. If we can improve the simulationssettings, inorder toobtaindoses thataremore realisticand inline with experimental measurements, we could use ourcalculations to predict the radiation field at each position.And this can in principle be done for each target-shieldinglayout at CHARM, even out of the 14 ordinary predefinedpositions.
In order to improve the reliability of our MCsimulations and the agreement with respect to theexperimental data, we decide to implement a more realisticsecond step simulation acting on:
– geometry and materials of the sensitive volume; – energy thresholds for production and transport ofparticles;–
energy cutoffs for input spectra.We want to conductdifferentparametric analyses tofindout which are themost accurate FLUKA simulation setting.
In the following paragraph, the first step dosecalculated in correspondence of the position 1, for thecopper target and no shielding configuration (Sects. 2.1 and2.2), is taken as reference and its value is 1.101� 10�14
± 0.8%Gy/pot.Before going through the details of the parametric
simulations, we need to put in relation the two steps: if thegeometry and the size of the sensitive volume are going tochange, also the overall geometry and scale of the problemhave to change accordingly.
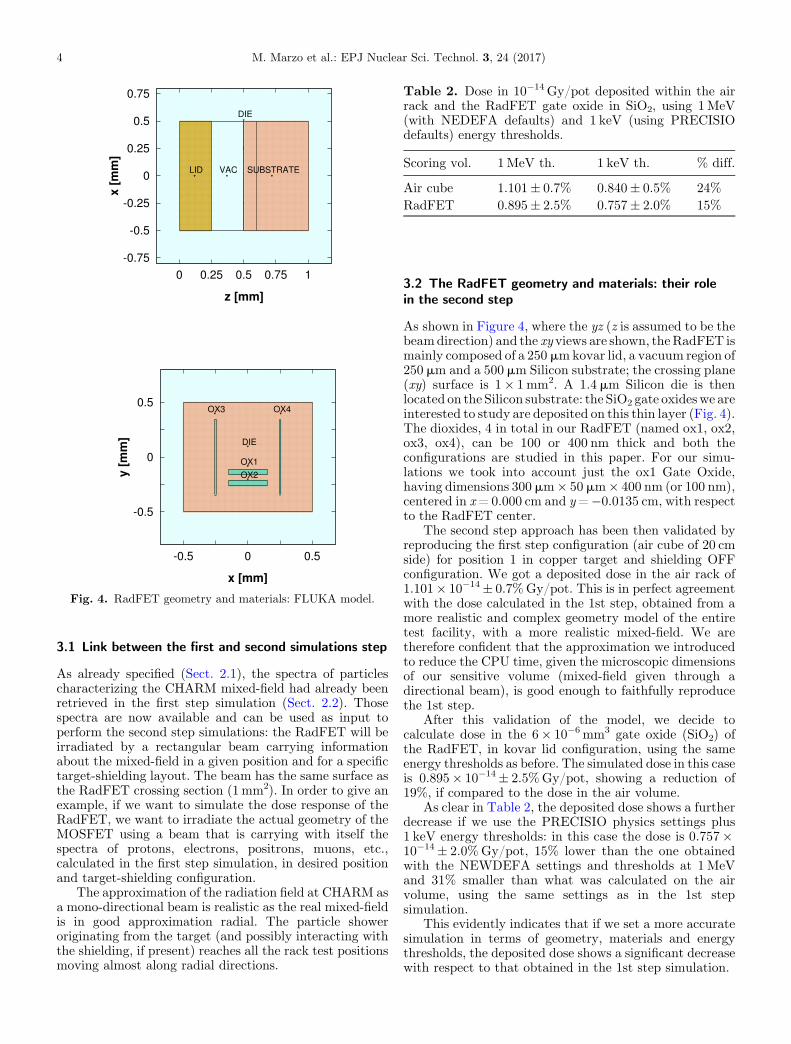
Fig. 4. RadFET geometry and materials: FLUKA model.
Table 2. Dose in 10�14 Gy/pot deposited within the airrack and the RadFET gate oxide in SiO2, using 1MeV(with NEDEFA defaults) and 1 keV (using PRECISIOdefaults) energy thresholds.
Scoring vol. 1MeV th. 1 keV th. % diff.
Air cube 1.101 ± 0.7% 0.840 ± 0.5% 24%RadFET 0.895 ± 2.5% 0.757 ± 2.0% 15%
4 M. Marzo et al.: EPJ Nuclear Sci. Technol. 3, 24 (2017)
3.1 Link between the first and second simulations step
As already specified (Sect. 2.1), the spectra of particlescharacterizing the CHARM mixed-field had already beenretrieved in the first step simulation (Sect. 2.2). Thosespectra are now available and can be used as input toperform the second step simulations: the RadFET will beirradiated by a rectangular beam carrying informationabout the mixed-field in a given position and for a specifictarget-shielding layout. The beam has the same surface asthe RadFET crossing section (1mm2). In order to give anexample, if we want to simulate the dose response of theRadFET, we want to irradiate the actual geometry of theMOSFET using a beam that is carrying with itself thespectra of protons, electrons, positrons, muons, etc.,calculated in the first step simulation, in desired positionand target-shielding configuration.
The approximation of the radiation field at CHARM asa mono-directional beam is realistic as the real mixed-fieldis in good approximation radial. The particle showeroriginating from the target (and possibly interacting withthe shielding, if present) reaches all the rack test positionsmoving almost along radial directions.
3.2 The RadFET geometry and materials: their rolein the second step
As shown in Figure 4, where the yz (z is assumed to be thebeamdirection) and the xy views are shown, theRadFET ismainly composed of a 250 mmkovar lid, a vacuum region of250 mm and a 500 mm Silicon substrate; the crossing plane(xy) surface is 1� 1 mm2. A 1.4 mm Silicon die is thenlocated on the Silicon substrate: the SiO2 gate oxideswe areinterested to study are deposited on this thin layer (Fig. 4).The dioxides, 4 in total in our RadFET (named ox1, ox2,ox3, ox4), can be 100 or 400 nm thick and both theconfigurations are studied in this paper. For our simu-lations we took into account just the ox1 Gate Oxide,having dimensions 300 mm� 50 mm� 400 nm (or 100 nm),centered in x= 0.000 cm and y=�0.0135 cm, with respectto the RadFET center.
The second step approach has been then validated byreproducing the first step configuration (air cube of 20 cmside) for position 1 in copper target and shielding OFFconfiguration. We got a deposited dose in the air rack of1.101� 10�14 ± 0.7%Gy/pot. This is in perfect agreementwith the dose calculated in the 1st step, obtained from amore realistic and complex geometry model of the entiretest facility, with a more realistic mixed-field. We aretherefore confident that the approximation we introducedto reduce the CPU time, given the microscopic dimensionsof our sensitive volume (mixed-field given through adirectional beam), is good enough to faithfully reproducethe 1st step.
After this validation of the model, we decide tocalculate dose in the 6� 10�6 mm3 gate oxide (SiO2) ofthe RadFET, in kovar lid configuration, using the sameenergy thresholds as before. The simulated dose in this caseis 0.895� 10�14 ± 2.5%Gy/pot, showing a reduction of19%, if compared to the dose in the air volume.
As clear in Table 2, the deposited dose shows a furtherdecrease if we use the PRECISIO physics settings plus1 keV energy thresholds: in this case the dose is 0.757�10�14 ± 2.0%Gy/pot, 15% lower than the one obtainedwith the NEWDEFA settings and thresholds at 1MeVand 31% smaller than what was calculated on the airvolume, using the same settings as in the 1st stepsimulation.
This evidently indicates that if we set a more accuratesimulation in terms of geometry, materials and energythresholds, the deposited dose shows a significant decreasewith respect to that obtained in the 1st step simulation.
Table 3. Parametric analysis changing the energy thresh-olds of the simulations (PRECISIO defaults): dose in theSiO2 GO of the RadFET, in 10�14 Gy/pot.
Energy threshold Dose
1MeV 0.895 ± 2.5%100 keV 0.768 ± 1.5%10 keV 0.787 ± 1.7%1 keV 0.757 ± 2.0%
Table 4. Effect of gate oxide thickness and input spectrathresholds on the RadFETdose response: simulated dose in10�14 Gy/pot (PRECISIO defaults set).
Thickness 1MeV input 100 keV input % diff.
400 nm 0.757 ± 2.0% 0.820 ± 4.3% 8%100 nm 0.719 ± 3.8% 0.816 ± 2.4% 12%
M. Marzo et al.: EPJ Nuclear Sci. Technol. 3, 24 (2017) 5
3.3 Update of the energy thresholds
As already discussed, the use of the NEWDEFA default inthe first step simulation was crucial to reduce the CPUtime, given the large geometry of the CHARM test facility.On the other hand, considering that the range of secondaryelectrons in air is 376 cm [11] and that the characteristicdimension of the air scoring volume we are using is 20 cm,lowering thresholds represents an improvement of theaccuracy of our simulations (first row in Tab. 2). It isimportant to point out, in fact, that in the case of 1MeVthresholds, we are clearly overestimating the energydeposited, introducing an artifact: all the particles havingenergies lower than 1MeV are treated by the FLUKAMonte Carlo algorithm as depositing their energy on spot,without producing other particles and being transported.
Following the previous considerations, the second stepsimulations can be then mostly conducted using thePRECISIO default, mainly characterized by particlestransport thresholds set at 100 keV (except for neutrons,10�5 eV) and delta ray production threshold at 100 keV. Inaddition, by using the EMF-CUT and DELTARAY cards,thresholds for transport and production of secondaryelectrons, positrons and photons and delta ray generatedby muons and charged hadrons will be set at 1MeV,100 keV, 10 keV and 1 keV. The PART-THR card isinstead employed to lower energy transport cut-offs forprotons, pions, muons, kaons and a particles to 1 keV.
Given the 15% difference in the dose deposited in theRadFET gate oxide, going from 1MeV to 1 keV (last row inTab. 2), it is worth investigating now in which thresholdsenergy range this main change occurs. The results of thisparametric analysis can be found in Table 3.
The main change in dose occurs between 1MeV and100 keV, showing a decrease of 14%. Going down to 10 keVand 1 keV does not considerably change the scenario, andthe differences are in the range of the statisticaluncertainties. This behavior can be explained consideringthe range of electrons in SiO2: 1MeV electrons have a rangeof 1.96 mm, 100 keV electrons have a range of 66.15 mm,while 10 keV electrons have a range of 1.23mm. Bycomparing these ranges of secondary electrons with thecharacteristic lateral dimensions of the gate oxide of theRadFET (300 mm� 50mm), it is evident that thresholdslower than 100 keV are the most appropriate to simulateand faithfully reproduce the energy deposition in the gateoxide of the RadFET.
In this specific case, since the beam surface has the samesize as the crossing surface of the RadFET and the ox1sensitive volume is completely irradiated by the beamitself, we have a good statistics using a reasonable numberof primaries: we decide to lower the thresholds down to1 keV to have most precise simulated doses, without losingbig amounts of CPU time.
3.4 Input spectra cutoffs and oxides thickness
After evaluating the dose dependency on materials, scoringvolume sizes and energy thresholds, we decide now to studywhat is the impact of the oxide thickness and how inputspectra cutoffs could affect the final dose.
We simulate RadFET having 100 nm and 400 nm thickgate oxides. We reproduce, on the other hand, inputspectra characterizing the mixed-field, through a dedicatedand independent first step simulation, by cutting them at1MeV and 100 keV, to see how lower energy particles of thespectra could affect the final deposited dose. Going down toenergies lower than 100 keV is counterproductive: thelower the thresholds, the lower the ranges and thatparticles can be stopped by the kovar lid of the RadFET.From Table 4, the oxide thickness does not have a largeimpact on the simulated deposited dose. On the other hand,using spectra cut at 1MeV or 100 keV makes a differencethat is of the order of 10%.
4 Second step simulations: the cp_0000target-shielding configuration
The analyses conducted in Section 3 led us to identify thefollowing simulation settings as the most suitable for oursecond step simulations:
– 400 nm thick oxide; – PRECISIO default in FLUKA; – energy thresholds at 1 keV; – input spectra cutoffs at 100 keV.This is the starting point to test the second step algorithmon other relevant positions inside the test area, concerningthe cp_0000 target-shielding configuration.
4.1 Doses simulated and measured in differentpositions at CHARM
We set the RadFET to positions 3, 5, 7, 10 and 13, by usingas input the spectra of the 1st step simulations, calculatedfor the new locations of interest, as described in Section 2.2.
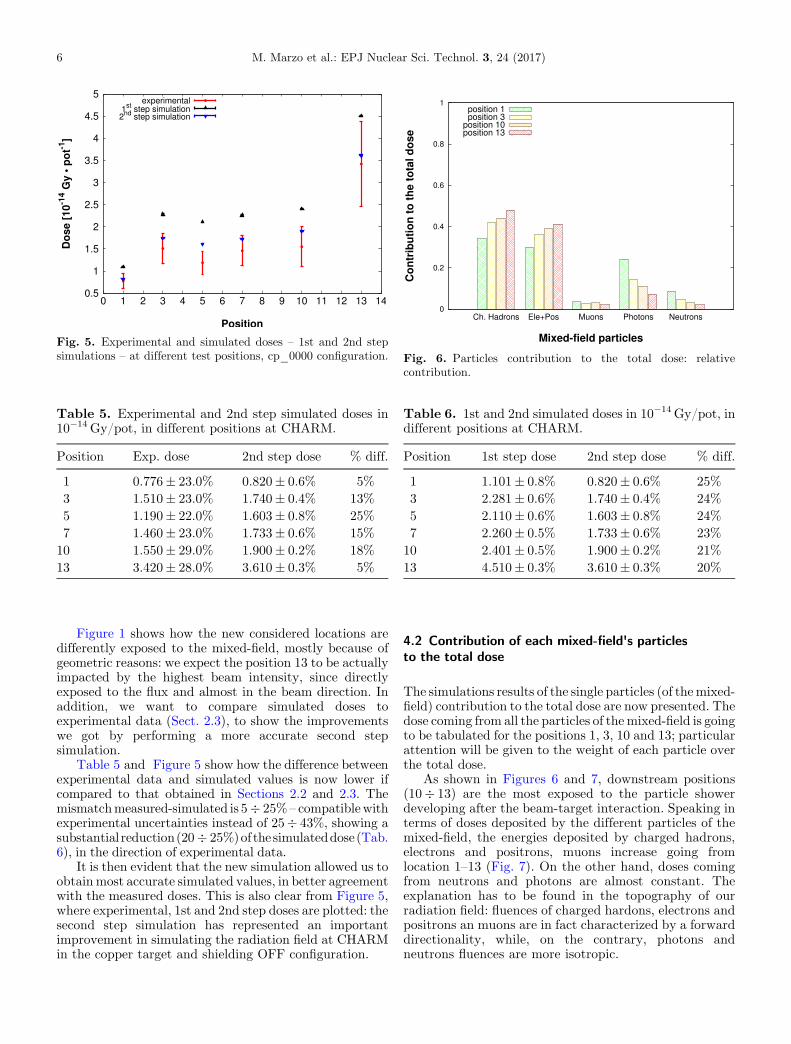
Fig. 5. Experimental and simulated doses – 1st and 2nd stepsimulations – at different test positions, cp_0000 configuration.
Table 5. Experimental and 2nd step simulated doses in10�14 Gy/pot, in different positions at CHARM.
Position Exp. dose 2nd step dose % diff.
1 0.776 ± 23.0% 0.820 ± 0.6% 5%3 1.510 ± 23.0% 1.740 ± 0.4% 13%5 1.190 ± 22.0% 1.603 ± 0.8% 25%7 1.460 ± 23.0% 1.733 ± 0.6% 15%
10 1.550 ± 29.0% 1.900 ± 0.2% 18%13 3.420 ± 28.0% 3.610 ± 0.3% 5%
Fig. 6. Particles contribution to the total dose: relativecontribution.
Table 6. 1st and 2nd simulated doses in 10�14 Gy/pot, indifferent positions at CHARM.
Position 1st step dose 2nd step dose % diff.
1 1.101 ± 0.8% 0.820 ± 0.6% 25%3 2.281 ± 0.6% 1.740 ± 0.4% 24%5 2.110 ± 0.6% 1.603 ± 0.8% 24%7 2.260 ± 0.5% 1.733 ± 0.6% 23%
10 2.401 ± 0.5% 1.900 ± 0.2% 21%13 4.510 ± 0.3% 3.610 ± 0.3% 20%
6 M. Marzo et al.: EPJ Nuclear Sci. Technol. 3, 24 (2017)
Figure 1 shows how the new considered locations aredifferently exposed to the mixed-field, mostly because ofgeometric reasons: we expect the position 13 to be actuallyimpacted by the highest beam intensity, since directlyexposed to the flux and almost in the beam direction. Inaddition, we want to compare simulated doses toexperimental data (Sect. 2.3), to show the improvementswe got by performing a more accurate second stepsimulation.
Table 5 and Figure 5 show how the difference betweenexperimental data and simulated values is now lower ifcompared to that obtained in Sections 2.2 and 2.3. Themismatchmeasured-simulated is 5� 25% – compatiblewithexperimental uncertainties instead of 25� 43%, showing asubstantial reduction(20� 25%)of thesimulateddose(Tab.6), in the direction of experimental data.
It is then evident that the new simulation allowed us toobtainmost accurate simulated values, in better agreementwith the measured doses. This is also clear from Figure 5,where experimental, 1st and 2nd step doses are plotted: thesecond step simulation has represented an importantimprovement in simulating the radiation field at CHARMin the copper target and shielding OFF configuration.
4.2 Contribution of each mixed-field's particlesto the total dose
The simulations results of the single particles (of themixed-field) contribution to the total dose are now presented. Thedose coming from all the particles of themixed-field is goingto be tabulated for the positions 1, 3, 10 and 13; particularattention will be given to the weight of each particle overthe total dose.
As shown in Figures 6 and 7, downstream positions(10� 13) are the most exposed to the particle showerdeveloping after the beam-target interaction. Speaking interms of doses deposited by the different particles of themixed-field, the energies deposited by charged hadrons,electrons and positrons, muons increase going fromlocation 1–13 (Fig. 7). On the other hand, doses comingfrom neutrons and photons are almost constant. Theexplanation has to be found in the topography of ourradiation field: fluences of charged hardons, electrons andpositrons an muons are in fact characterized by a forwarddirectionality, while, on the contrary, photons andneutrons fluences are more isotropic.
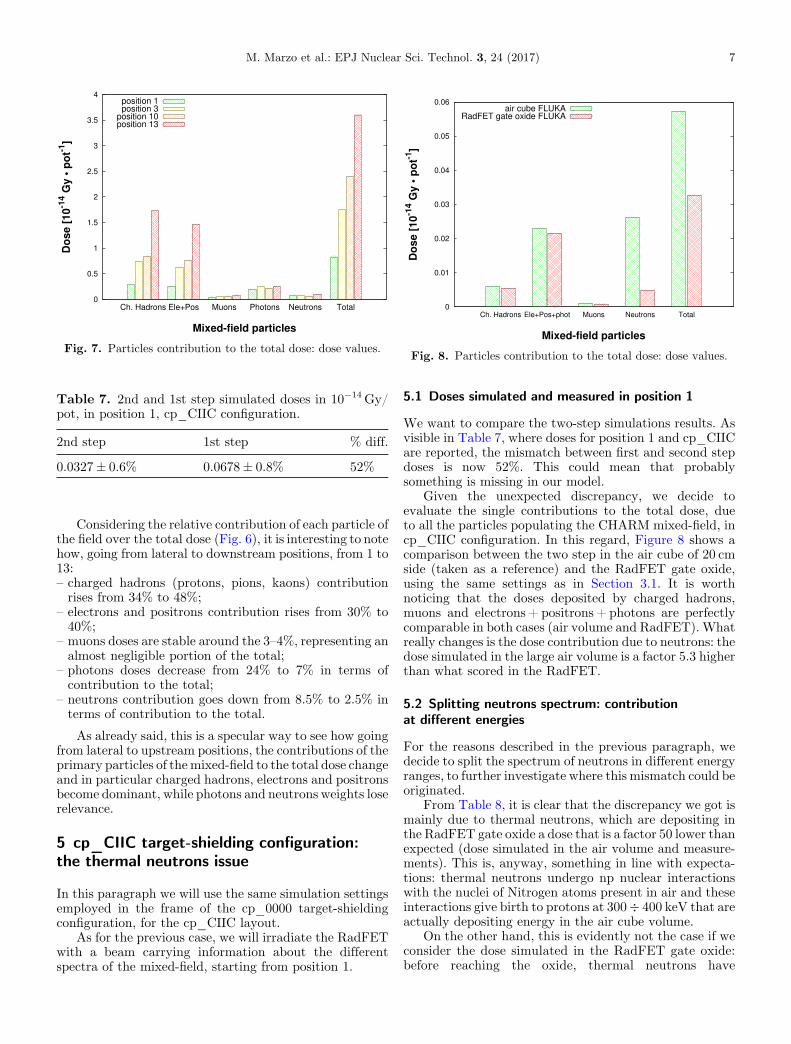
Fig. 7. Particles contribution to the total dose: dose values.
Table 7. 2nd and 1st step simulated doses in 10�14 Gy/pot, in position 1, cp_CIIC configuration.
2nd step 1st step % diff.
0.0327 ± 0.6% 0.0678 ± 0.8% 52%
Fig. 8. Particles contribution to the total dose: dose values.
M. Marzo et al.: EPJ Nuclear Sci. Technol. 3, 24 (2017) 7
Considering the relative contribution of each particle ofthe field over the total dose (Fig. 6), it is interesting to notehow, going from lateral to downstream positions, from 1 to13:
– charged hadrons (protons, pions, kaons) contributionrises from 34% to 48%;–
electrons and positrons contribution rises from 30% to40%;–
muons doses are stable around the 3–4%, representing analmost negligible portion of the total;–
photons doses decrease from 24% to 7% in terms ofcontribution to the total;–
neutrons contribution goes down from 8.5% to 2.5% interms of contribution to the total.As already said, this is a specular way to see how goingfrom lateral to upstream positions, the contributions of theprimary particles of themixed-field to the total dose changeand in particular charged hadrons, electrons and positronsbecome dominant, while photons and neutrons weights loserelevance.
5 cp_CIIC target-shielding configuration:the thermal neutrons issue
In this paragraph we will use the same simulation settingsemployed in the frame of the cp_0000 target-shieldingconfiguration, for the cp_CIIC layout.
As for the previous case, we will irradiate the RadFETwith a beam carrying information about the differentspectra of the mixed-field, starting from position 1.
5.1 Doses simulated and measured in position 1
We want to compare the two-step simulations results. Asvisible in Table 7, where doses for position 1 and cp_CIICare reported, the mismatch between first and second stepdoses is now 52%. This could mean that probablysomething is missing in our model.
Given the unexpected discrepancy, we decide toevaluate the single contributions to the total dose, dueto all the particles populating the CHARM mixed-field, incp_CIIC configuration. In this regard, Figure 8 shows acomparison between the two step in the air cube of 20 cmside (taken as a reference) and the RadFET gate oxide,using the same settings as in Section 3.1. It is worthnoticing that the doses deposited by charged hadrons,muons and electrons + positrons + photons are perfectlycomparable in both cases (air volume and RadFET). Whatreally changes is the dose contribution due to neutrons: thedose simulated in the large air volume is a factor 5.3 higherthan what scored in the RadFET.
5.2 Splitting neutrons spectrum: contributionat different energies
For the reasons described in the previous paragraph, wedecide to split the spectrum of neutrons in different energyranges, to further investigate where this mismatch could beoriginated.
From Table 8, it is clear that the discrepancy we got ismainly due to thermal neutrons, which are depositing inthe RadFET gate oxide a dose that is a factor 50 lower thanexpected (dose simulated in the air volume and measure-ments). This is, anyway, something in line with expecta-tions: thermal neutrons undergo np nuclear interactionswith the nuclei of Nitrogen atoms present in air and theseinteractions give birth to protons at 300� 400 keV that areactually depositing energy in the air cube volume.
On the other hand, this is evidently not the case if weconsider the dose simulated in the RadFET gate oxide:before reaching the oxide, thermal neutrons have
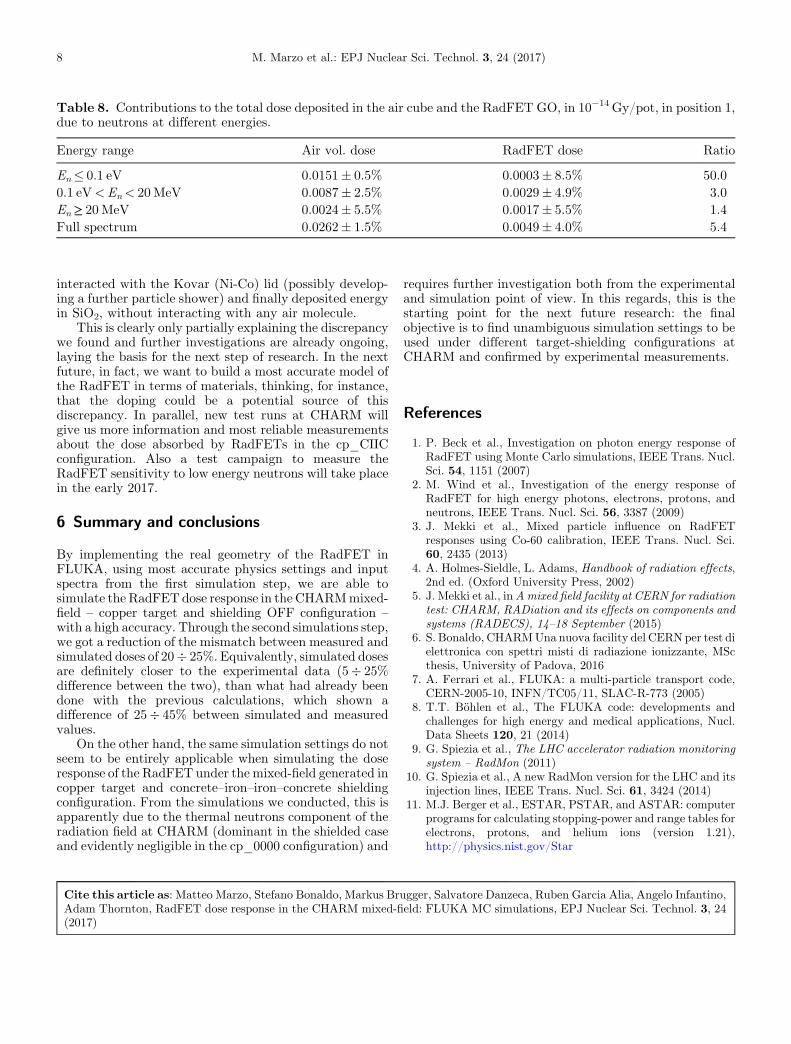
Table 8. Contributions to the total dose deposited in the air cube and the RadFET GO, in 10�14 Gy/pot, in position 1,due to neutrons at different energies.
Energy range Air vol. dose RadFET dose Ratio
En� 0.1 eV 0.0151 ± 0.5% 0.0003 ± 8.5% 50.00.1 eV<En< 20MeV 0.0087 ± 2.5% 0.0029 ± 4.9% 3.0En≥ 20MeV 0.0024 ± 5.5% 0.0017 ± 5.5% 1.4Full spectrum 0.0262 ± 1.5% 0.0049 ± 4.0% 5.4
8 M. Marzo et al.: EPJ Nuclear Sci. Technol. 3, 24 (2017)
interacted with the Kovar (Ni-Co) lid (possibly develop-ing a further particle shower) and finally deposited energyin SiO2, without interacting with any air molecule.
This is clearly only partially explaining the discrepancywe found and further investigations are already ongoing,laying the basis for the next step of research. In the nextfuture, in fact, we want to build a most accurate model ofthe RadFET in terms of materials, thinking, for instance,that the doping could be a potential source of thisdiscrepancy. In parallel, new test runs at CHARM willgive us more information and most reliable measurementsabout the dose absorbed by RadFETs in the cp_CIICconfiguration. Also a test campaign to measure theRadFET sensitivity to low energy neutrons will take placein the early 2017.
6 Summary and conclusions
By implementing the real geometry of the RadFET inFLUKA, using most accurate physics settings and inputspectra from the first simulation step, we are able tosimulate the RadFETdose response in the CHARMmixed-field – copper target and shielding OFF configuration –with a high accuracy. Through the second simulations step,we got a reduction of the mismatch between measured andsimulated doses of 20� 25%. Equivalently, simulated dosesare definitely closer to the experimental data (5� 25%difference between the two), than what had already beendone with the previous calculations, which shown adifference of 25� 45% between simulated and measuredvalues.
On the other hand, the same simulation settings do notseem to be entirely applicable when simulating the doseresponse of the RadFET under the mixed-field generated incopper target and concrete–iron–iron–concrete shieldingconfiguration. From the simulations we conducted, this isapparently due to the thermal neutrons component of theradiation field at CHARM (dominant in the shielded caseand evidently negligible in the cp_0000 configuration) and
requires further investigation both from the experimentaland simulation point of view. In this regards, this is thestarting point for the next future research: the finalobjective is to find unambiguous simulation settings to beused under different target-shielding configurations atCHARM and confirmed by experimental measurements.
References
1. P. Beck et al., Investigation on photon energy response ofRadFET using Monte Carlo simulations, IEEE Trans. Nucl.Sci. 54, 1151 (2007)
2. M. Wind et al., Investigation of the energy response ofRadFET for high energy photons, electrons, protons, andneutrons, IEEE Trans. Nucl. Sci. 56, 3387 (2009)
3. J. Mekki et al., Mixed particle influence on RadFETresponses using Co-60 calibration, IEEE Trans. Nucl. Sci.60, 2435 (2013)
4. A. Holmes-Sieldle, L. Adams, Handbook of radiation effects,2nd ed. (Oxford University Press, 2002)
5. J. Mekki et al., inAmixed field facility at CERN for radiationtest: CHARM, RADiation and its effects on components andsystems (RADECS), 14–18 September (2015)
6. S. Bonaldo, CHARMUna nuova facility del CERN per test dielettronica con spettri misti di radiazione ionizzante, MScthesis, University of Padova, 2016
7. A. Ferrari et al., FLUKA: a multi-particle transport code,CERN-2005-10, INFN/TC05/11, SLAC-R-773 (2005)
8. T.T. Böhlen et al., The FLUKA code: developments andchallenges for high energy and medical applications, Nucl.Data Sheets 120, 21 (2014)
9. G. Spiezia et al., The LHC accelerator radiation monitoringsystem – RadMon (2011)
10. G. Spiezia et al., A new RadMon version for the LHC and itsinjection lines, IEEE Trans. Nucl. Sci. 61, 3424 (2014)
11. M.J. Berger et al., ESTAR, PSTAR, and ASTAR: computerprograms for calculating stopping-power and range tables forelectrons, protons, and helium ions (version 1.21),http://physics.nist.gov/Star
Cite this article as: Matteo Marzo, Stefano Bonaldo, Markus Brugger, Salvatore Danzeca, Ruben Garcia Alia, Angelo Infantino,Adam Thornton, RadFET dose response in the CHARM mixed-field: FLUKA MC simulations, EPJ Nuclear Sci. Technol. 3, 24(2017)