Embed Size (px)
Citation preview
Radar-only Localization and Mapping for Ground Vehicle at HighSpeed and for Riverside Boat
Damien Vivet, Paul Checchin, Roland Chapuis
Abstract— The use of a rotating range sensor in high speedrobotics creates distortions in the collected data. Such aneffect is, in the majority of studies, ignored or considered asnoise and then corrected, based on proprioceptive sensors orlocalization systems. In this study we consider that distortioncontains the information about the vehicle’s displacement. Wepropose to extract this information from distortion withoutany other information than exteroceptive sensor data. The onlysensor used for this work is a panoramic Frequency ModulatedContinuous Wave (FMCW) radar called K2Pi. No odometer,gyrometer or other proprioceptive sensor is used. The ideais to resort to velocimetry by analyzing the distortion of themeasurements. As a result, the linear and angular velocitiesof the mobile robot are estimated and used to build, withoutany other sensor, the trajectory of the vehicle and then theradar map of outdoor environments. In this paper, radar-onlylocalization and mapping results are presented for a groundvehicle and a riverbank application. This work can easily beextended to other slow rotating range sensors.
I. INTRODUCTION
In robotic applications, it is usually assumed that the scan ofa range sensor is a collection of depth measurements takenfrom a single robot position. This can be done when workingwith lasers that are much faster than radar sensors and can beconsidered instantaneous when compared with the dynamicsof the vehicle. But, when the robot is moving at high speed,most of the time this assumption is unacceptable. Importantdistortion phenomena appear and cannot be ignored. Forexample, in a radar mapping application [1], the sensordelivers one panoramic radar image per second. When therobot is going straight ahead, at a low speed of 5 m/s, thepanoramic image includes a 5-meter distortion. In the caseof a laser range finder with a 75 Hz scanning rate, distortionexists but is ignored. This assumption is valid for low speedapplications, nevertheless still moving straight ahead at aspeed of 5 m/s, a 7− cm distortion effect appears. Atclassical road vehicle speeds (in cities, on roads or highways)more important distortions can be observed. Of course,the rotation of the vehicle itself during the measurementacquisition is another source of disturbance which cannot beneglected for high speed displacement or with slow sensors(cf. Fig. 1). Finally, let us note that when the sensor is tooslow, a ”stop & scan” method is often applied [2].
This work was supported by the Agence Nationale de la Recherche (ANR- the French national research agency) (ANR Impala PsiRob – ANR-06-ROBO-0012).
Authors are with Clermont Universite, Universite Blaise Pascal, INSTI-TUT PASCAL, BP 10448, F-63000 CLERMONT-FERRAND, FRANCE –CNRS, UMR 6602, INSTITUT PASCAL, F-63171 AUBIERE, [email protected]
In previous work [3] we proposed an On-The-Fly SLAMmethod which compensates the distortion phenomenon withproprioceptive sensors by integrating this effect into theobservation model. In this paper the idea is to develop aninverse approach, a radar-based odometry which does not useany proprioceptive sensors but only distortion formulation.Most of the applications use accurate proprioceptive sensors(odometer, gyrometer, IMU, DGPS, etc.) in order to correctthe successive scans. By estimating the pose of each beam,a virtual scan taken from a single position is computed andused in the application. In fact distortion is considered asa noise and filtered out. In this study, we use distortion asa source of information regarding the displacement of thevehicle. The objective here is not to remove distortion but toextract information from it.
The problem statement is described in a schematic way inSection II. In Section III, a review of articles related to ourresearch interests is carried out. Section IV briefly presentsthe microwave radar scanner developed by a Cemagrefresearch team (in the field of agricultural and environmentalengineering research) [4]. Section V gives the formulationof the principle used in this paper. Finally Section VI showsexperimental results of this work. Section VII concludes.
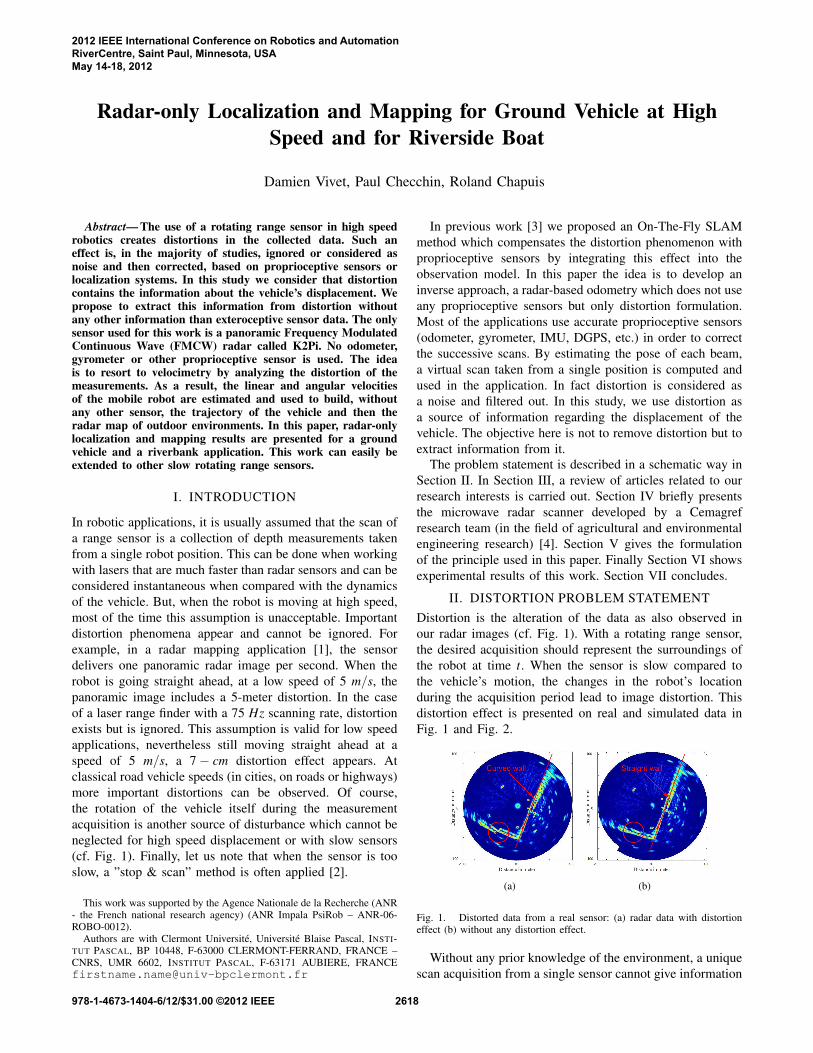
II. DISTORTION PROBLEM STATEMENTDistortion is the alteration of the data as also observed inour radar images (cf. Fig. 1). With a rotating range sensor,the desired acquisition should represent the surroundings ofthe robot at time t. When the sensor is slow compared tothe vehicle’s motion, the changes in the robot’s locationduring the acquisition period lead to image distortion. Thisdistortion effect is presented on real and simulated data inFig. 1 and Fig. 2.
(a) (b)
Fig. 1. Distorted data from a real sensor: (a) radar data with distortioneffect (b) without any distortion effect.
Without any prior knowledge of the environment, a uniquescan acquisition from a single sensor cannot give information
2012 IEEE International Conference on Robotics and AutomationRiverCentre, Saint Paul, Minnesota, USAMay 14-18, 2012
978-1-4673-1404-6/12/$31.00 ©2012 IEEE 2618
about distortion. This is one of the reasons why distortion isusually considered as a noise and corrected by proprioceptivesensors.
(a)
(b) (c)
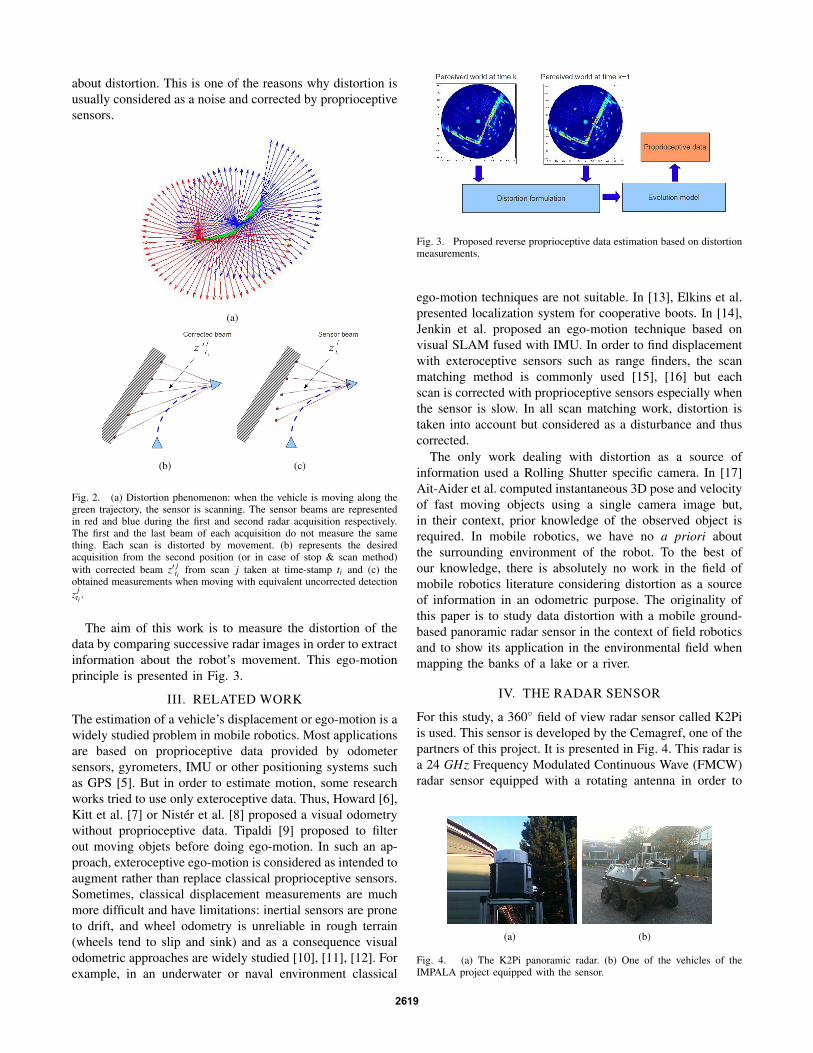
Fig. 2. (a) Distortion phenomenon: when the vehicle is moving along thegreen trajectory, the sensor is scanning. The sensor beams are representedin red and blue during the first and second radar acquisition respectively.The first and the last beam of each acquisition do not measure the samething. Each scan is distorted by movement. (b) represents the desiredacquisition from the second position (or in case of stop & scan method)with corrected beam z′ jti from scan j taken at time-stamp ti and (c) theobtained measurements when moving with equivalent uncorrected detectionz jti .
The aim of this work is to measure the distortion of thedata by comparing successive radar images in order to extractinformation about the robot’s movement. This ego-motionprinciple is presented in Fig. 3.
III. RELATED WORKThe estimation of a vehicle’s displacement or ego-motion is awidely studied problem in mobile robotics. Most applicationsare based on proprioceptive data provided by odometersensors, gyrometers, IMU or other positioning systems suchas GPS [5]. But in order to estimate motion, some researchworks tried to use only exteroceptive data. Thus, Howard [6],Kitt et al. [7] or Nister et al. [8] proposed a visual odometrywithout proprioceptive data. Tipaldi [9] proposed to filterout moving objets before doing ego-motion. In such an ap-proach, exteroceptive ego-motion is considered as intended toaugment rather than replace classical proprioceptive sensors.Sometimes, classical displacement measurements are muchmore difficult and have limitations: inertial sensors are proneto drift, and wheel odometry is unreliable in rough terrain(wheels tend to slip and sink) and as a consequence visualodometric approaches are widely studied [10], [11], [12]. Forexample, in an underwater or naval environment classical
Fig. 3. Proposed reverse proprioceptive data estimation based on distortionmeasurements.
ego-motion techniques are not suitable. In [13], Elkins et al.presented localization system for cooperative boots. In [14],Jenkin et al. proposed an ego-motion technique based onvisual SLAM fused with IMU. In order to find displacementwith exteroceptive sensors such as range finders, the scanmatching method is commonly used [15], [16] but eachscan is corrected with proprioceptive sensors especially whenthe sensor is slow. In all scan matching work, distortion istaken into account but considered as a disturbance and thuscorrected.
The only work dealing with distortion as a source ofinformation used a Rolling Shutter specific camera. In [17]Ait-Aider et al. computed instantaneous 3D pose and velocityof fast moving objects using a single camera image but,in their context, prior knowledge of the observed object isrequired. In mobile robotics, we have no a priori aboutthe surrounding environment of the robot. To the best ofour knowledge, there is absolutely no work in the field ofmobile robotics literature considering distortion as a sourceof information in an odometric purpose. The originality ofthis paper is to study data distortion with a mobile ground-based panoramic radar sensor in the context of field roboticsand to show its application in the environmental field whenmapping the banks of a lake or a river.
IV. THE RADAR SENSOR
For this study, a 360◦ field of view radar sensor called K2Piis used. This sensor is developed by the Cemagref, one of thepartners of this project. It is presented in Fig. 4. This radar isa 24 GHz Frequency Modulated Continuous Wave (FMCW)radar sensor equipped with a rotating antenna in order to
(a) (b)
Fig. 4. (a) The K2Pi panoramic radar. (b) One of the vehicles of theIMPALA project equipped with the sensor.
2619
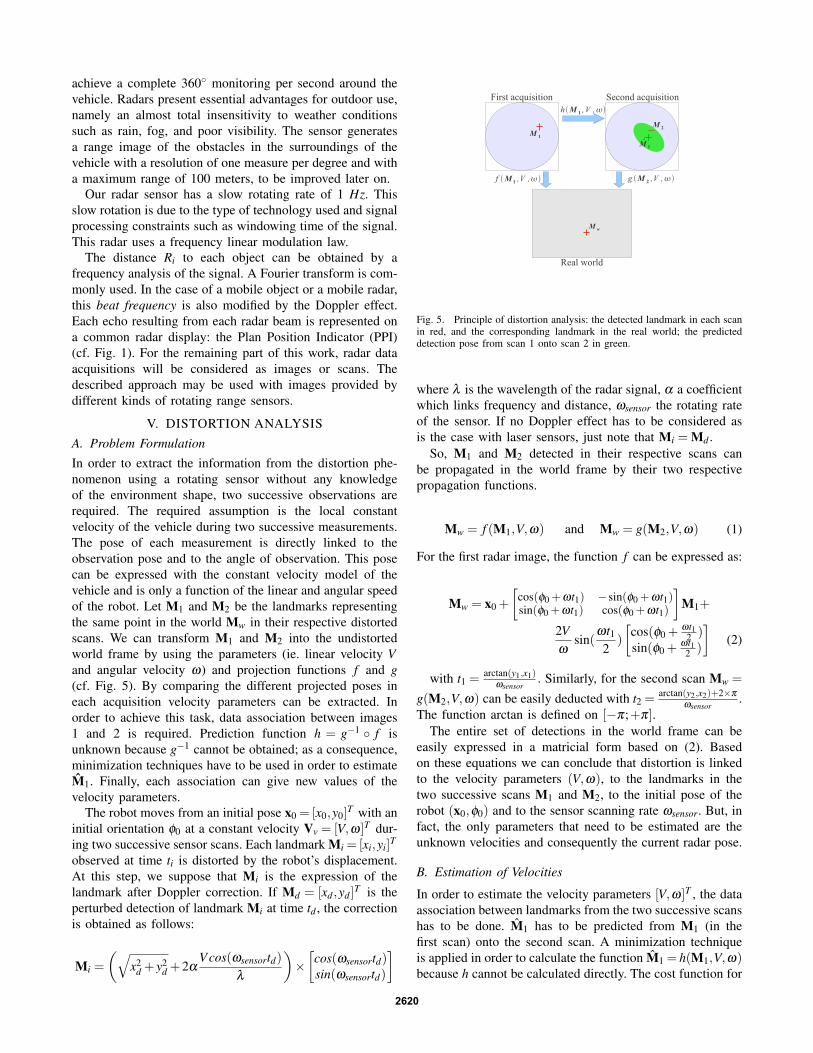
achieve a complete 360◦ monitoring per second around thevehicle. Radars present essential advantages for outdoor use,namely an almost total insensitivity to weather conditionssuch as rain, fog, and poor visibility. The sensor generatesa range image of the obstacles in the surroundings of thevehicle with a resolution of one measure per degree and witha maximum range of 100 meters, to be improved later on.
Our radar sensor has a slow rotating rate of 1 Hz. Thisslow rotation is due to the type of technology used and signalprocessing constraints such as windowing time of the signal.This radar uses a frequency linear modulation law.
The distance Ri to each object can be obtained by afrequency analysis of the signal. A Fourier transform is com-monly used. In the case of a mobile object or a mobile radar,this beat frequency is also modified by the Doppler effect.Each echo resulting from each radar beam is represented ona common radar display: the Plan Position Indicator (PPI)(cf. Fig. 1). For the remaining part of this work, radar dataacquisitions will be considered as images or scans. Thedescribed approach may be used with images provided bydifferent kinds of rotating range sensors.
V. DISTORTION ANALYSISA. Problem FormulationIn order to extract the information from the distortion phe-nomenon using a rotating sensor without any knowledgeof the environment shape, two successive observations arerequired. The required assumption is the local constantvelocity of the vehicle during two successive measurements.The pose of each measurement is directly linked to theobservation pose and to the angle of observation. This posecan be expressed with the constant velocity model of thevehicle and is only a function of the linear and angular speedof the robot. Let M1 and M2 be the landmarks representingthe same point in the world Mw in their respective distortedscans. We can transform M1 and M2 into the undistortedworld frame by using the parameters (ie. linear velocity Vand angular velocity ω) and projection functions f and g(cf. Fig. 5). By comparing the different projected poses ineach acquisition velocity parameters can be extracted. Inorder to achieve this task, data association between images1 and 2 is required. Prediction function h = g−1 ◦ f isunknown because g−1 cannot be obtained; as a consequence,minimization techniques have to be used in order to estimateM1. Finally, each association can give new values of thevelocity parameters.
The robot moves from an initial pose x0 = [x0,y0]T with an
initial orientation φ0 at a constant velocity Vv = [V,ω]T dur-ing two successive sensor scans. Each landmark Mi = [xi,yi]
T
observed at time ti is distorted by the robot’s displacement.At this step, we suppose that Mi is the expression of thelandmark after Doppler correction. If Md = [xd ,yd ]
T is theperturbed detection of landmark Mi at time td , the correctionis obtained as follows:
Mi =
(√x2
d + y2d +2α
V cos(ωsensortd)λ
)×[
cos(ωsensortd)sin(ωsensortd)
]
First acquisition Second acquisition
Real world
f M 1 ,V , g M 2 ,V ,
M 1
M 2
M w
h M 1 ,V ,
M 1
Fig. 5. Principle of distortion analysis: the detected landmark in each scanin red, and the corresponding landmark in the real world; the predicteddetection pose from scan 1 onto scan 2 in green.
where λ is the wavelength of the radar signal, α a coefficientwhich links frequency and distance, ωsensor the rotating rateof the sensor. If no Doppler effect has to be considered asis the case with laser sensors, just note that Mi = Md .
So, M1 and M2 detected in their respective scans canbe propagated in the world frame by their two respectivepropagation functions.
Mw = f (M1,V,ω) and Mw = g(M2,V,ω) (1)
For the first radar image, the function f can be expressed as:
Mw = x0 +
[cos(φ0 +ωt1) −sin(φ0 +ωt1)sin(φ0 +ωt1) cos(φ0 +ωt1)
]M1+
2Vω
sin(ωt12
)
[cos(φ0 +
ωt12 )
sin(φ0 +ωt12 )
](2)
with t1 =arctan(y1,x1)
ωsensor. Similarly, for the second scan Mw =
g(M2,V,ω) can be easily deducted with t2 =arctan(y2,x2)+2×π
ωsensor.
The function arctan is defined on [−π;+π].The entire set of detections in the world frame can be
easily expressed in a matricial form based on (2). Basedon these equations we can conclude that distortion is linkedto the velocity parameters (V,ω), to the landmarks in thetwo successive scans M1 and M2, to the initial pose of therobot (x0,φ0) and to the sensor scanning rate ωsensor. But, infact, the only parameters that need to be estimated are theunknown velocities and consequently the current radar pose.
B. Estimation of Velocities
In order to estimate the velocity parameters [V,ω]T , the dataassociation between landmarks from the two successive scanshas to be done. M1 has to be predicted from M1 (in thefirst scan) onto the second scan. A minimization techniqueis applied in order to calculate the function M1 = h(M1,V,ω)because h cannot be calculated directly. The cost function for
2620
one landmark is given by S = (Mw2−Mw1)2 or:
S(x1, y1) = (g(M1,V,ω)− f (M1,V,ω))2 (3)
A gradient method with adaptive step-sizes is used tominimize this cost function. As a result, the prediction offirst radar image landmarks can be computed in the secondimage as well as its uncertainty ellipsis. Data associationbetween prediction M1 and landmark M2 is then calculatedbased on Mahalanobis distance criteria by taking into accountuncertainties of measurements and predictions.
As radar data is very noisy, both landmark extraction anddata association can be false. For example, the speckle effectcan lead to ghost detections or false disappearances due to thedifferent possible combinations of radar signals. Moreoverdue to multiple reflections radar data is not as accurate aslaser data. Thus, all possible data associations have to beconsidered.
Two assumptions are made at this point. First, more than50 % of the detections in the environment are static objects inorder to obtain a reliable estimation of the distortion. Second,the vehicle equipped with the radar sensor is supposed to bemoving during two consecutive acquisitions at a constantvelocity (V and ω). Actually, when the vehicle acceleratesor decelerates, the estimated velocity obtained will be themean speed of the vehicle.
For each data association allowed by the Mahalanobisdistance, a new estimate of the robot’s velocity is computedand sent over to an Extended Kalman Filter process. Then,updated speeds are projected into the velocity space withtheir respective uncertainties. In this space, the global coher-ence of the scene is researched by fusing all the consistentestimates. This fusion process is done after removing theoutliers (ie. wrong detections and associations) using aRANSAC process. Indeed, we suppose that the majority ofthe detection are static and well associated. The fusion usesthe Covariance Intersection (CI) [18] method in order to bemore pessimistic in case of the presence of any residualwrong vote during fusion. The entire process is brieflysummarized in Algo. 1.
Algorithm 1 Rotating-range-sensor-based odometry algo-rithm.
INPUT: 2 radar scans and the last estimated robot velocitiesM1← detection from scan 1M2← detection from scan 2M1← argmin{(g(M1,V,ω)− f (M1,V,ω))2}Asso← Data association phase between M2 and M1for k : Asso do
Vv(k)← Extended Kalman Filter update (V,ω)end forVinlier← RANSAC (Vv)Vv← CI Fusion (Vinlier)OUTPUT: new estimated robot velocities
VI. EXPERIMENTSIn order to validate this method and the distortion formula-tion, a simulation was first done in an environment of beacon
landmarks and with a vehicle moving at constant velocity.The same algorithm was then applied on real radar data withvarying speed and automatic selection of landmarks.
A. Simulation
As a first step, the constant velocity displacement of thevehicle was simulated. This virtual vehicle was equippedwith a rotating range sensor and was made to move in asimulated world. In this world, 25 beacon landmarks wererandomized. The vehicle’s linear speed was 15 m/s with anangular velocity of 6◦/s. The rotating range sensor had ascanning rate of 1 Hz and a maximum range of 200 m.
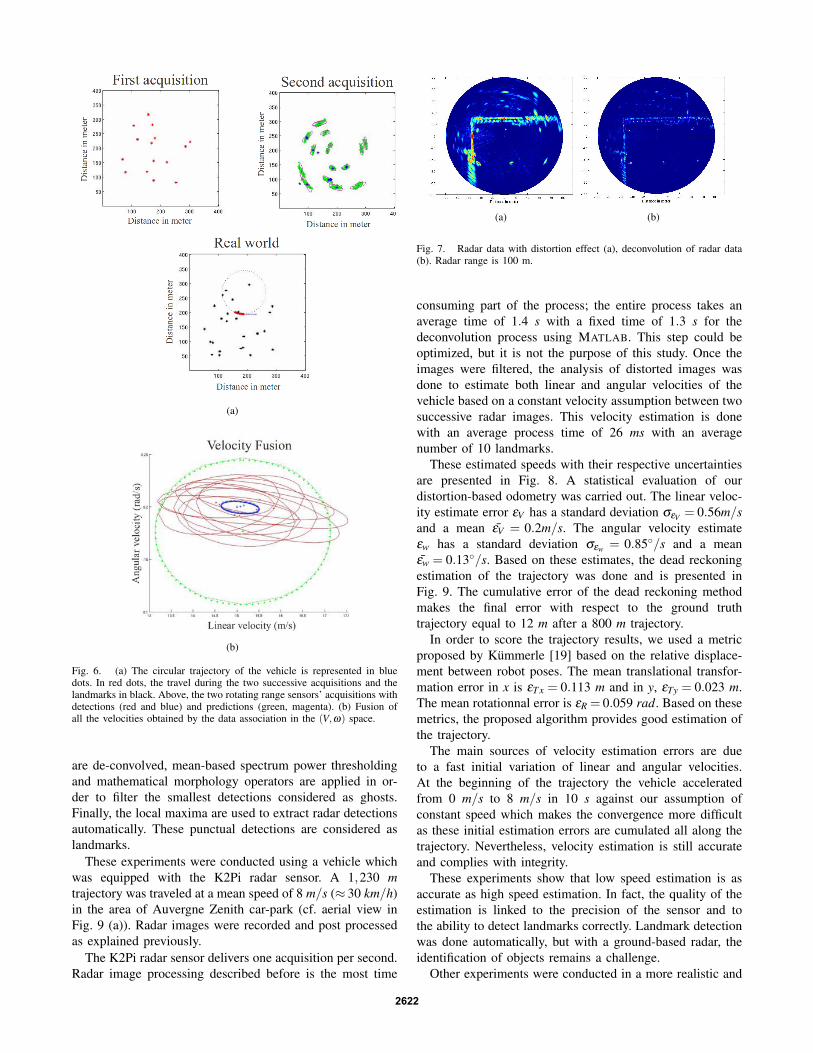
Two successive acquisitions were simulated with a con-stant speed displacement. In Fig. 6(a), the circular trajectoryof the vehicle is represented in red dots. Both acquisitionsof the two rotating range sensors are presented. Red andblue stars represent the detections from scan 1 and scan2 respectively. The predicted poses with their respectiveuncertainties are also presented.
The pose of each detection in image 1 is predicted inimage 2 based on distortion and evolution formulations byusing minimization techniques. As the function of predictioncannot be calculated, uncertainties are based on a simplifiedtransfer function. The conformity of the uncertainty resultshas been checked by comparing our method with the particleclouds propagated by the minimization method. Particleclouds, represented in green, are used to check the accuracyof the computed uncertainty (in magenta).
Figure 6(b) represents the final fusion of the speedsobtained by data association. Real speed is represented bythe black square. Initial speed estimates with their 3 σ
uncertainty bound are represented in green while in red thevotes of each data association with their 3 σ bounds. Inorder to reduce over-convergence, the initially used Kalman-based fusion was replaced with a CI-based fusion [18]. Thefusion of the different speeds by CI is in blue with its1 σ bound. This simulation shows that by comparing twosuccessive acquisitions, linear and angular velocities can beestimated. Once this principle was validated on simulateddata, this distortion-based odometry was also applied on realradar data in order to evaluate the approach.
B. Validation on Real Data
In order to validate this method, an estimation of the vehicle’svelocities equipped with our K2Pi panoramic radar sensorwas done on a trajectory in realistic conditions. Examples ofimages provided by the radar are presented in Fig. 7. Radardata was processed in order to filter noise and extract thedetections. This processing is composed of a thresholdingand a deconvolution by a Gaussian mask, tuned accordingto the sensor’s properties, in particular its angular resolutionand antenna aperture at 3 dB. Image processing of radardata is done on a polar image. The antenna aperture is themain cause of data deterioration for a given distance. Asa consequence, deconvolution based on Lucy-Richardson isapplied to each vector containing detections at a constantrelative distance from the acquisition system. Once images
2621
(a)
(b)
Fig. 6. (a) The circular trajectory of the vehicle is represented in bluedots. In red dots, the travel during the two successive acquisitions and thelandmarks in black. Above, the two rotating range sensors’ acquisitions withdetections (red and blue) and predictions (green, magenta). (b) Fusion ofall the velocities obtained by the data association in the (V,ω) space.
are de-convolved, mean-based spectrum power thresholdingand mathematical morphology operators are applied in or-der to filter the smallest detections considered as ghosts.Finally, the local maxima are used to extract radar detectionsautomatically. These punctual detections are considered aslandmarks.
These experiments were conducted using a vehicle whichwas equipped with the K2Pi radar sensor. A 1,230 mtrajectory was traveled at a mean speed of 8 m/s (≈ 30 km/h)in the area of Auvergne Zenith car-park (cf. aerial view inFig. 9 (a)). Radar images were recorded and post processedas explained previously.
The K2Pi radar sensor delivers one acquisition per second.Radar image processing described before is the most time
(a) (b)
Fig. 7. Radar data with distortion effect (a), deconvolution of radar data(b). Radar range is 100 m.
consuming part of the process; the entire process takes anaverage time of 1.4 s with a fixed time of 1.3 s for thedeconvolution process using MATLAB. This step could beoptimized, but it is not the purpose of this study. Once theimages were filtered, the analysis of distorted images wasdone to estimate both linear and angular velocities of thevehicle based on a constant velocity assumption between twosuccessive radar images. This velocity estimation is donewith an average process time of 26 ms with an averagenumber of 10 landmarks.
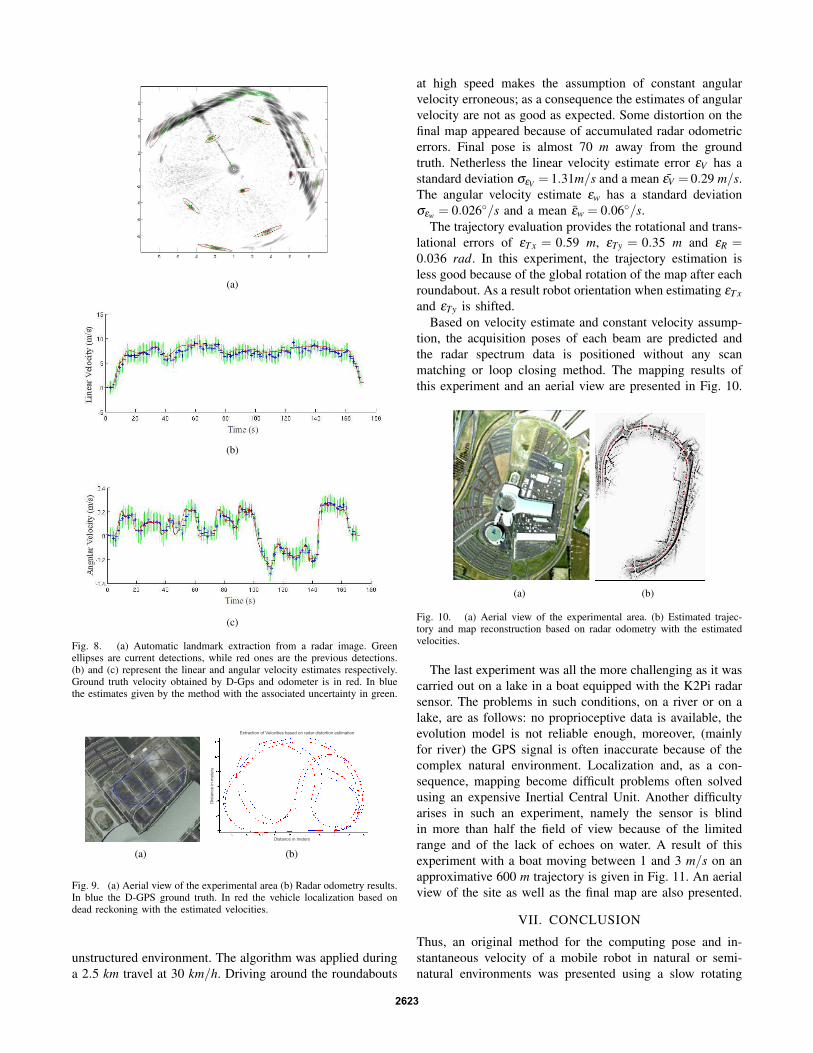
These estimated speeds with their respective uncertaintiesare presented in Fig. 8. A statistical evaluation of ourdistortion-based odometry was carried out. The linear veloc-ity estimate error εV has a standard deviation σεV = 0.56m/sand a mean εV = 0.2m/s. The angular velocity estimateεw has a standard deviation σεw = 0.85◦/s and a meanεw = 0.13◦/s. Based on these estimates, the dead reckoningestimation of the trajectory was done and is presented inFig. 9. The cumulative error of the dead reckoning methodmakes the final error with respect to the ground truthtrajectory equal to 12 m after a 800 m trajectory.
In order to score the trajectory results, we used a metricproposed by Kummerle [19] based on the relative displace-ment between robot poses. The mean translational transfor-mation error in x is εT x = 0.113 m and in y, εTy = 0.023 m.The mean rotationnal error is εR = 0.059 rad. Based on thesemetrics, the proposed algorithm provides good estimation ofthe trajectory.
The main sources of velocity estimation errors are dueto a fast initial variation of linear and angular velocities.At the beginning of the trajectory the vehicle acceleratedfrom 0 m/s to 8 m/s in 10 s against our assumption ofconstant speed which makes the convergence more difficultas these initial estimation errors are cumulated all along thetrajectory. Nevertheless, velocity estimation is still accurateand complies with integrity.
These experiments show that low speed estimation is asaccurate as high speed estimation. In fact, the quality of theestimation is linked to the precision of the sensor and tothe ability to detect landmarks correctly. Landmark detectionwas done automatically, but with a ground-based radar, theidentification of objects remains a challenge.
Other experiments were conducted in a more realistic and
2622
(a)
(b)
(c)
Fig. 8. (a) Automatic landmark extraction from a radar image. Greenellipses are current detections, while red ones are the previous detections.(b) and (c) represent the linear and angular velocity estimates respectively.Ground truth velocity obtained by D-Gps and odometer is in red. In bluethe estimates given by the method with the associated uncertainty in green.
(a)
Extraction of Velocities based on radar distortion estimation
Distance in meters
Dis
tanc
e in
me t
e rs
(b)
Fig. 9. (a) Aerial view of the experimental area (b) Radar odometry results.In blue the D-GPS ground truth. In red the vehicle localization based ondead reckoning with the estimated velocities.
unstructured environment. The algorithm was applied duringa 2.5 km travel at 30 km/h. Driving around the roundabouts
at high speed makes the assumption of constant angularvelocity erroneous; as a consequence the estimates of angularvelocity are not as good as expected. Some distortion on thefinal map appeared because of accumulated radar odometricerrors. Final pose is almost 70 m away from the groundtruth. Netherless the linear velocity estimate error εV has astandard deviation σεV = 1.31m/s and a mean εV = 0.29 m/s.The angular velocity estimate εw has a standard deviationσεw = 0.026◦/s and a mean εw = 0.06◦/s.
The trajectory evaluation provides the rotational and trans-lational errors of εT x = 0.59 m, εTy = 0.35 m and εR =0.036 rad. In this experiment, the trajectory estimation isless good because of the global rotation of the map after eachroundabout. As a result robot orientation when estimating εT xand εTy is shifted.
Based on velocity estimate and constant velocity assump-tion, the acquisition poses of each beam are predicted andthe radar spectrum data is positioned without any scanmatching or loop closing method. The mapping results ofthis experiment and an aerial view are presented in Fig. 10.
(a) (b)
Fig. 10. (a) Aerial view of the experimental area. (b) Estimated trajec-tory and map reconstruction based on radar odometry with the estimatedvelocities.
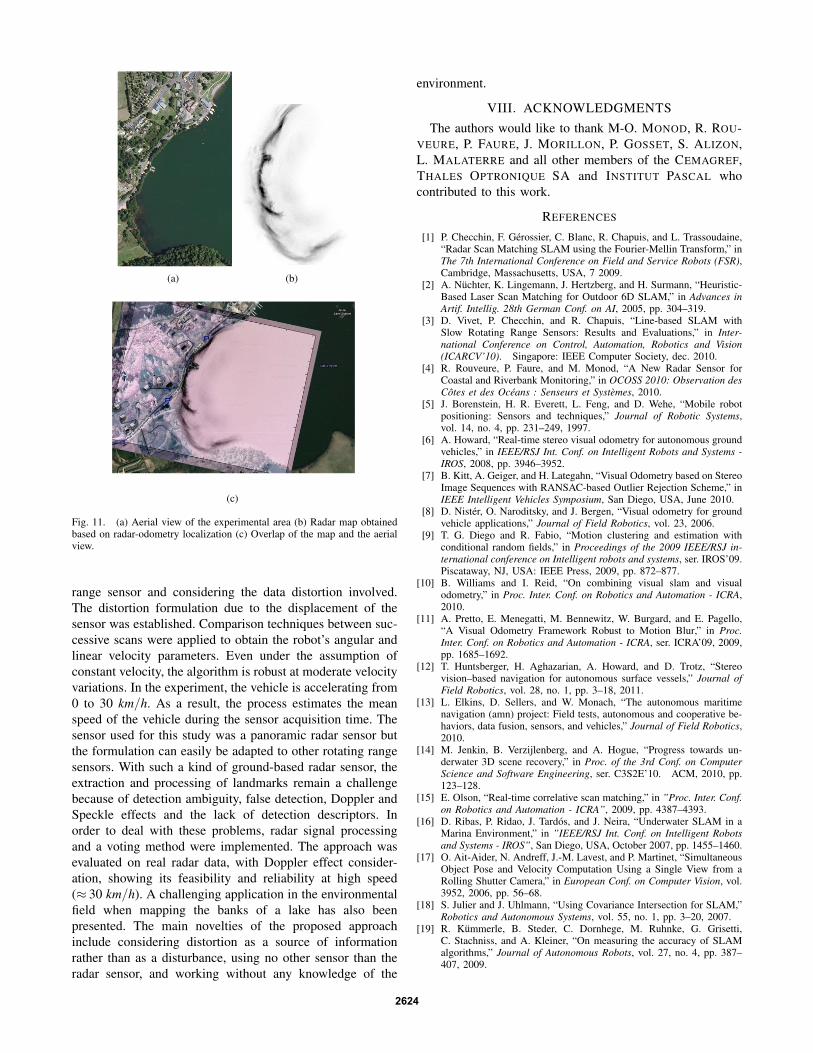
The last experiment was all the more challenging as it wascarried out on a lake in a boat equipped with the K2Pi radarsensor. The problems in such conditions, on a river or on alake, are as follows: no proprioceptive data is available, theevolution model is not reliable enough, moreover, (mainlyfor river) the GPS signal is often inaccurate because of thecomplex natural environment. Localization and, as a con-sequence, mapping become difficult problems often solvedusing an expensive Inertial Central Unit. Another difficultyarises in such an experiment, namely the sensor is blindin more than half the field of view because of the limitedrange and of the lack of echoes on water. A result of thisexperiment with a boat moving between 1 and 3 m/s on anapproximative 600 m trajectory is given in Fig. 11. An aerialview of the site as well as the final map are also presented.
VII. CONCLUSION
Thus, an original method for the computing pose and in-stantaneous velocity of a mobile robot in natural or semi-natural environments was presented using a slow rotating
2623
(a) (b)
(c)
Fig. 11. (a) Aerial view of the experimental area (b) Radar map obtainedbased on radar-odometry localization (c) Overlap of the map and the aerialview.
range sensor and considering the data distortion involved.The distortion formulation due to the displacement of thesensor was established. Comparison techniques between suc-cessive scans were applied to obtain the robot’s angular andlinear velocity parameters. Even under the assumption ofconstant velocity, the algorithm is robust at moderate velocityvariations. In the experiment, the vehicle is accelerating from0 to 30 km/h. As a result, the process estimates the meanspeed of the vehicle during the sensor acquisition time. Thesensor used for this study was a panoramic radar sensor butthe formulation can easily be adapted to other rotating rangesensors. With such a kind of ground-based radar sensor, theextraction and processing of landmarks remain a challengebecause of detection ambiguity, false detection, Doppler andSpeckle effects and the lack of detection descriptors. Inorder to deal with these problems, radar signal processingand a voting method were implemented. The approach wasevaluated on real radar data, with Doppler effect consider-ation, showing its feasibility and reliability at high speed(≈ 30 km/h). A challenging application in the environmentalfield when mapping the banks of a lake has also beenpresented. The main novelties of the proposed approachinclude considering distortion as a source of informationrather than as a disturbance, using no other sensor than theradar sensor, and working without any knowledge of the
environment.
VIII. ACKNOWLEDGMENTS
The authors would like to thank M-O. MONOD, R. ROU-VEURE, P. FAURE, J. MORILLON, P. GOSSET, S. ALIZON,L. MALATERRE and all other members of the CEMAGREF,THALES OPTRONIQUE SA and INSTITUT PASCAL whocontributed to this work.
REFERENCES
[1] P. Checchin, F. Gerossier, C. Blanc, R. Chapuis, and L. Trassoudaine,“Radar Scan Matching SLAM using the Fourier-Mellin Transform,” inThe 7th International Conference on Field and Service Robots (FSR),Cambridge, Massachusetts, USA, 7 2009.
[2] A. Nuchter, K. Lingemann, J. Hertzberg, and H. Surmann, “Heuristic-Based Laser Scan Matching for Outdoor 6D SLAM,” in Advances inArtif. Intellig. 28th German Conf. on AI, 2005, pp. 304–319.
[3] D. Vivet, P. Checchin, and R. Chapuis, “Line-based SLAM withSlow Rotating Range Sensors: Results and Evaluations,” in Inter-national Conference on Control, Automation, Robotics and Vision(ICARCV’10). Singapore: IEEE Computer Society, dec. 2010.
[4] R. Rouveure, P. Faure, and M. Monod, “A New Radar Sensor forCoastal and Riverbank Monitoring,” in OCOSS 2010: Observation desCotes et des Oceans : Senseurs et Systemes, 2010.
[5] J. Borenstein, H. R. Everett, L. Feng, and D. Wehe, “Mobile robotpositioning: Sensors and techniques,” Journal of Robotic Systems,vol. 14, no. 4, pp. 231–249, 1997.
[6] A. Howard, “Real-time stereo visual odometry for autonomous groundvehicles,” in IEEE/RSJ Int. Conf. on Intelligent Robots and Systems -IROS, 2008, pp. 3946–3952.
[7] B. Kitt, A. Geiger, and H. Lategahn, “Visual Odometry based on StereoImage Sequences with RANSAC-based Outlier Rejection Scheme,” inIEEE Intelligent Vehicles Symposium, San Diego, USA, June 2010.
[8] D. Nister, O. Naroditsky, and J. Bergen, “Visual odometry for groundvehicle applications,” Journal of Field Robotics, vol. 23, 2006.
[9] T. G. Diego and R. Fabio, “Motion clustering and estimation withconditional random fields,” in Proceedings of the 2009 IEEE/RSJ in-ternational conference on Intelligent robots and systems, ser. IROS’09.Piscataway, NJ, USA: IEEE Press, 2009, pp. 872–877.
[10] B. Williams and I. Reid, “On combining visual slam and visualodometry,” in Proc. Inter. Conf. on Robotics and Automation - ICRA,2010.
[11] A. Pretto, E. Menegatti, M. Bennewitz, W. Burgard, and E. Pagello,“A Visual Odometry Framework Robust to Motion Blur,” in Proc.Inter. Conf. on Robotics and Automation - ICRA, ser. ICRA’09, 2009,pp. 1685–1692.
[12] T. Huntsberger, H. Aghazarian, A. Howard, and D. Trotz, “Stereovision–based navigation for autonomous surface vessels,” Journal ofField Robotics, vol. 28, no. 1, pp. 3–18, 2011.
[13] L. Elkins, D. Sellers, and W. Monach, “The autonomous maritimenavigation (amn) project: Field tests, autonomous and cooperative be-haviors, data fusion, sensors, and vehicles,” Journal of Field Robotics,2010.
[14] M. Jenkin, B. Verzijlenberg, and A. Hogue, “Progress towards un-derwater 3D scene recovery,” in Proc. of the 3rd Conf. on ComputerScience and Software Engineering, ser. C3S2E’10. ACM, 2010, pp.123–128.
[15] E. Olson, “Real-time correlative scan matching,” in ”Proc. Inter. Conf.on Robotics and Automation - ICRA”, 2009, pp. 4387–4393.
[16] D. Ribas, P. Ridao, J. Tardos, and J. Neira, “Underwater SLAM in aMarina Environment,” in ”IEEE/RSJ Int. Conf. on Intelligent Robotsand Systems - IROS”, San Diego, USA, October 2007, pp. 1455–1460.
[17] O. Ait-Aider, N. Andreff, J.-M. Lavest, and P. Martinet, “SimultaneousObject Pose and Velocity Computation Using a Single View from aRolling Shutter Camera,” in European Conf. on Computer Vision, vol.3952, 2006, pp. 56–68.
[18] S. Julier and J. Uhlmann, “Using Covariance Intersection for SLAM,”Robotics and Autonomous Systems, vol. 55, no. 1, pp. 3–20, 2007.
[19] R. Kummerle, B. Steder, C. Dornhege, M. Ruhnke, G. Grisetti,C. Stachniss, and A. Kleiner, “On measuring the accuracy of SLAMalgorithms,” Journal of Autonomous Robots, vol. 27, no. 4, pp. 387–407, 2009.
2624


![Applications Using IR-UWB Radar - Semantic Scholar · 2017. 9. 2. · sensors and communications, localization, tracking and biomedical research [17]. IR-UWB sensor has been used](https://img.pdfslide.us/doc/110x75/5fea91a51909dd6a0655009a/applications-using-ir-uwb-radar-semantic-scholar-2017-9-2-sensors-and-communications.jpg)