Embed Size (px)
Citation preview
Radar Evidence Of High Velocity Debris Near TWA 800And The National Transportation Safety Board's Explanation Of It
DRAFT COPY
This report reviews the National Transportation Safety Board's (NTSB's) explanation of high velocity debris indicated on radar near where TWA 800 crashed. The NTSB questioned the quality of the radar data representing this debris by citing information such as ½ nautical mile “scatter” between multiple FAA radar facilities. However, this scatter does not affect the referenced debris velocities since they were calculated with data from a single radar facility. This and other problems leave the Safety Board's explanation of the calculated debris velocities without merit. A new statistical analysis of the relevant radar data confirms the validity of those calculations.
Background
In 2000, the NTSB released its final report on the crash of TWA Flight 800 concluding that a low velocity fuel-air explosion was the most likely and sole cause. Thirteen years later, an investigative team led by senior NTSB investigator (Ret.) Hank Hughes submitted a petition to the NTSB disputing this probable cause determination. By analyzing radar data recorded early in the crash sequence, Hughes determined that debris traveled up to half a nautical mile due south of (and nearly perpendicular to) the aircraft's flight path at an average speed “relative to the accident aircraft [of] between 463 and 495 knots.” He also explained how wreckage items from the officially determined crash sequence cannot account for this fast-moving debris because the maximum speed of the official fuel-air explosion's wave front relative to TWA 800 (194 knots) was half the speed of the aircraft itself. Therefore according to Hughes, no items from that explosion would have reached the area where the FAA’s Islip and White Plainsradar sites began recording the high-speed debris—an area hereinafter referred to as the “southern debris cluster” (see Figure 1).
Figure 1: Maximum deflagration wave expansion at three points in time in TWA Flight 800's referenceframe. Air resistance is neglected outside the aircraft to provide a best-case scenario for the NTSB crash sequence. The red arrows point to hypothetical debris ejected by the fuel-air deflagration. The 747 and debris icons are not to scale.
The Islip primary radar data used in the petitioners' calculations is displayed in Figure 2.
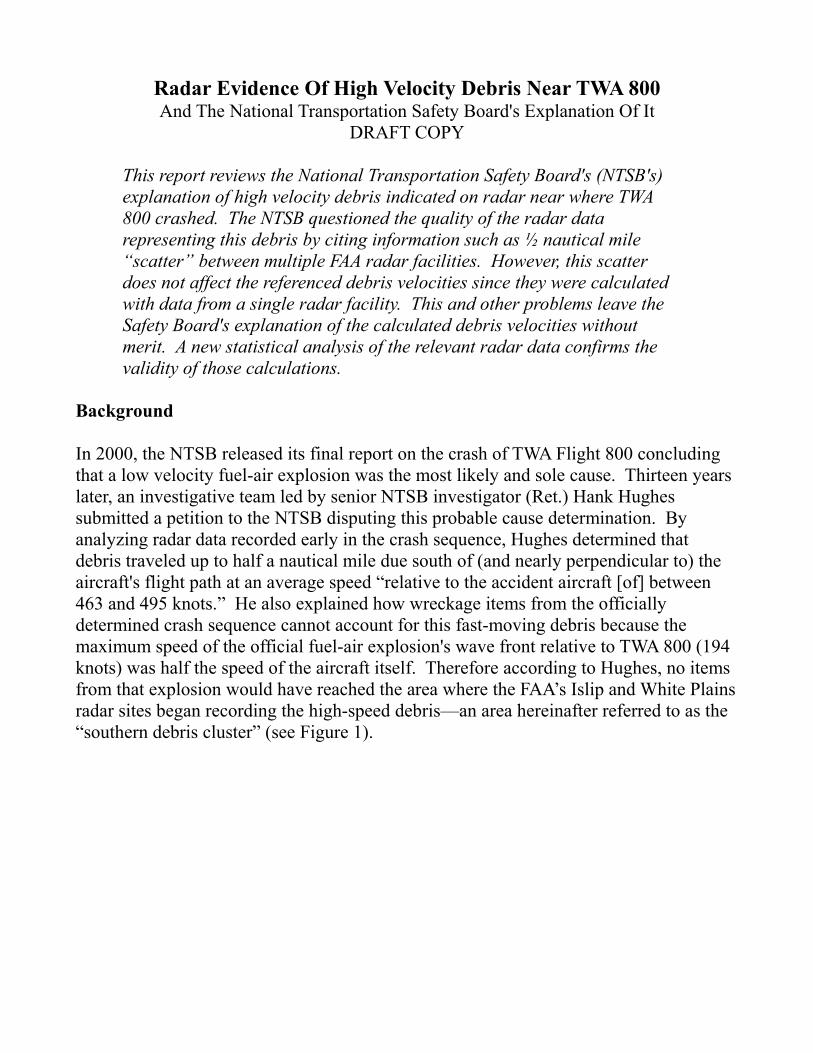
Figure 2: Secondary and primary radar returns from the crash of TWA 800. The speed shown above is average ground speed over 8.5 seconds and is based on Islip data. The average velocity of item(s) represented by that Islip radar return relative to TWA 800 is close to 500 knots. Note that the arrows show the approximate ground track of the debris; the arrows are not velocity vectors.
Figure 2 shows Islip primary radar returns (black triangles) soon after TWA 800 lost electrical power and dozens more (small black data points) representing debris drifting downwind later. The many Islip radar returns and corroborating information from other radar sites, together with a proper consideration of relative position uncertainty, show that actual debris items traversed the area encompassing the southern debris cluster (identified by a dashed circle in Figure 2) early in the crash sequence.
The petitioners also fit ballistics curves to the data, indicating that the debris in question exited the area of the aircraft at supersonic speeds. With this information, the petitionersconcluded that a “far more powerful and sideways projected explosion [was needed to send]...debris perpendicular to the...flight path, traveling approximately ½ mile due south.”1
1 Petition for the Reconsideration and Modification of the National Transportation Safety Board’s Findings and Determination of the Probable Cause for the Crash of TWA Flight 800, Henry F. Hughes, 2013, https://twa800project.files.wordpress.com/2013/06/petition-final.pdf
In its 2014 petition response, the NTSB agreed that the petitioners' “ground speed calculations, vector analysis, and ballistics analysis...would be appropriate if the desired input data were of sufficient quality to enable such calculations”. But after listing certain types of radar uncertainties, the NTSB claimed that the petitioners' analyses suffer “from a lack of accurate input data to enable such calculations.”
Results
This report separately considers each issue the NTSB raised that challenges the accuracyof the input data. After considering all of these challenges, the NTSB's conclusion that the petitioners' analyses suffer from a “lack of accurate input data” was found to be without merit.
A new statistical analysis discussed herein determined that a relative radar uncertainty inISP secondary radar data is consistent with the results of a referenced MIT radar study2 and conflicts with larger uncertainties listed by the NTSB. The analysis also showed that: 1) ISP primary radar uncertainties result in a total “north-south”3 accuracy that is close to the accuracy cited by the petitioners; and 2) when ISP secondary data is mixed with ISP primary data, the secondary data falls within this same uncertainty. As a result, the quality of the radar data (the input data) was found to be significantly higher than the NTSB indicated and was sufficient to enable the petitioners' velocity calculations.
Discontinuities
The NTSB stated that since “the primary and secondary radar data are acquired by different antennas, there are likely to be discontinuities in the transition from secondary radar returns to primary radar returns after the breakup.” The NTSB, however, did not quantify these discontinuities or mention that the two antennas are “co-located”4 on the same rotating frame.
2 In 2011, Mayer and Tzanos published the report “Comparison of ASR-11 and ASR-9 Surveillance Radar Azimuth Error”, which determined and compared the azimuth error of two different secondary radars. This study is available here: http://www.dtic.mil/dtic/tr/fulltext/u2/a576683.pdf
3 The petitioners relied on error in the “north-south” direction since the debris cluster appeared nearly due south of the position where TWA 800 lost electrical power, and therefore the east-west error hada negligible effect on ground speed calculations. East-west error had an approximately 3% effect onthe calculated speeds of this debris relative to TWA 800. That effect, which was not considered by the petitioners, would add approximately +/- 14 knots error to the calculated relative velocities, which were on the order of 500 knots.
4 See page 2 of the referenced MIT study, which can be found here: http://www.dtic.mil/dtic/tr/fulltext/u2/a576683.pdf
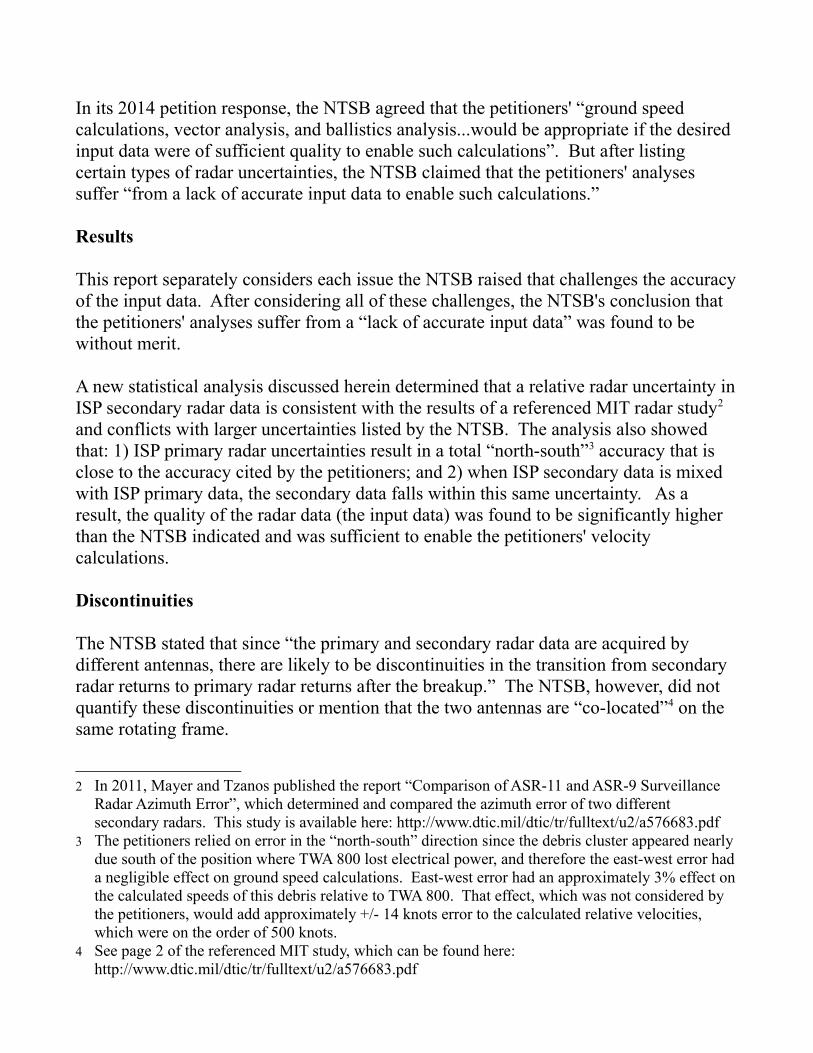
The NTSB plots comparing simulations of the main wreckage with radar tracking of thatwreckage indicate smooth transitions from secondary to primary radar returns that are within the data tolerances of each data type (see Figure 5A below). Nevertheless, to check the validity of the NTSB's inference that the southern debris cluster may have been the result of discontinuities between secondary and primary radar data “after the breakup”, one can correct the data to account for this alleged discontinuity and review the effects. Since these discontinuities would be a form of systematic error, the error canbe corrected by applying the same adjustment to all primary radar data points, including those that the NTSB determined represents the aircraft itself. This correction would shift all of the post-event data approximately one half-mile to the north (see Figure 3 below).
Figure 3: Shifting of the Primary radar returns northward to test the hypothesis that the southern debriscluster was a result of discontinuities between Secondary and Primary radar data sets.
While shifting the radar data sets north brings the southern debris cluster closer to the
flight path, such a shift creates larger problems, including showing an immediate shift ofthe aircraft northward, off of its pre-event flight path, and showing the simulated aircraftcrashing into the ocean far north of where it was actually recovered (note the main wreckage recovery location marked by the NTSB with a red X in Figure 3 above). It is therefore clear that the large discontinuities inferred by the NTSB did not exist.
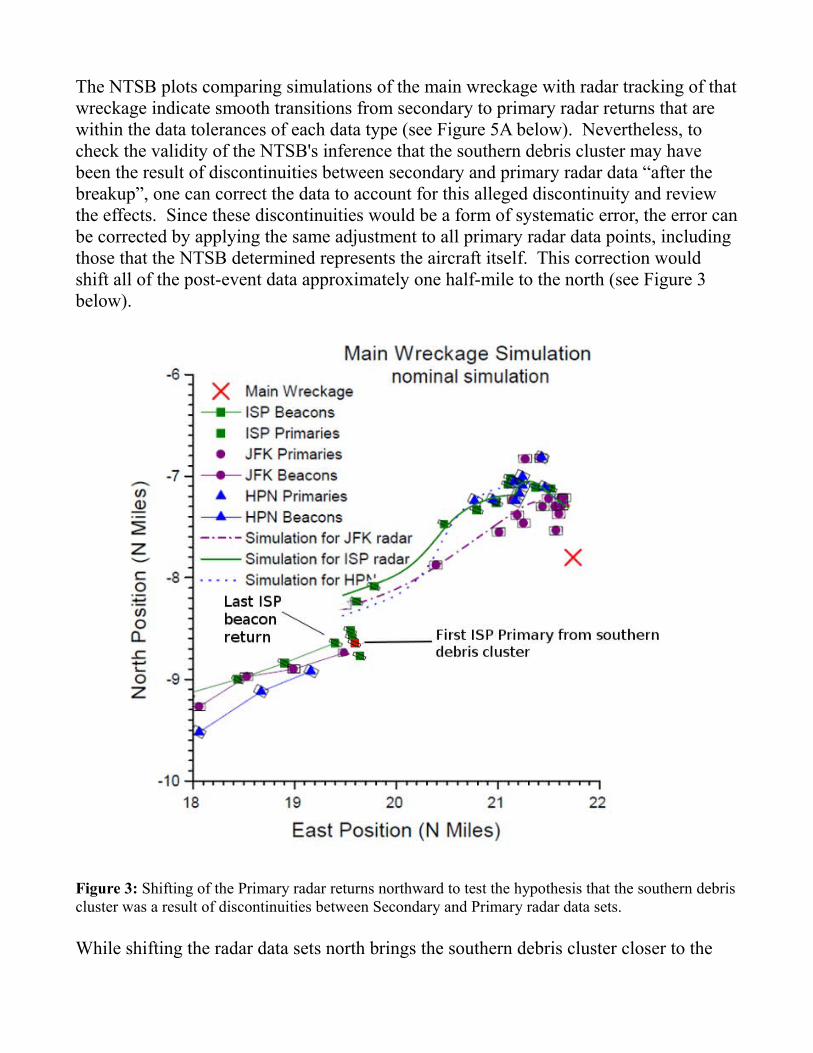
For thoroughness, the Islip radar site's primary and secondary radar files were reviewed for any signs of smaller discontinuities. The files show an aircraft with transponder code 1320 flying south-southwest at 6,000 feet approximately fifty miles east northeast of the airport and around thirty minutes after the crash of TWA 800. Two legs of this aircraft's flight path were relatively straight and level, and linear fits to the secondary radar returns were made (see the green and red lines in Figure 4 below).
Figure 4: Two linear fits to ISP secondary data from an aircraft are displayed, along with ISP primary and secondary radar returns from that aircraft.
Twenty-five primary returns from this aircraft were recorded during these two legs. These primary returns matched closely with both secondary data fits, with an average displacement of 0.04 and 0.07 nm. When a second order curve is fit to all of the primaryand secondary data together, displacement error from the flight path is 0.104 nautical miles, which is consistent with the 0.11 degrees of relative azimuth error for ISP primaryreturns determined from the statistical analysis described below.
This confirms that there were no significant discontinuities between ISP primary and secondary radar data either during the transition between data types or several seconds after any transition. Further, these results and the statistical analysis validate the petitioners' calculations5 and are consistent with the Addendum to the NTSB simulation report (Exhibit 22C) that displays identical radar tolerance limits over data points for both primary and secondary data sets (see Figure 5A below).
Absolute and Relative Radar Position Accuracy
Radar sites measure two values to establish an object's position relative to the radar antenna: range and azimuth. Range is a straight-line distance to an object, and azimuth is the angle to that object from north.
Absolute position accuracy refers to the accuracy of the radar-recorded position when compared to the object's precise location, which can be determined by other means. Two types of error can affect absolute position accuracy: measurement error and systematic error. Measurement error can appear as random fluctuations in position values that are created by environmental or other factors. Systematic error can result from a misalignment or improper calibration of the radar equipment. Systematic errors are not random, but affect every data point equally. To understand this, consider a clock running twenty minutes fast. Every moment in time displayed on that clock throughout the day would be equally affected by that twenty-minute error, which is why one could still reference this clock as a timer for boiling an egg. When subtracting the start time from the end time, the twenty minutes of systematic error would cancel out, leaving an accurate time span for when the egg was boiling. Similarly, systematic radar errors cancel out in separation and velocity measurements when relying on data from the same radar antenna6 or on data from two properly calibrated antennas that share the same
5 The northern position of TWA 800 when it lost electrical power relative to the high speed debris due south of that position was derived from a fit to many ISP secondary data points, which make that position more accurate than a single data point. The petitioners applied an error for this position thatwas close to the error of a single data point, which is an overestimate for error. As a result, the petitioners' calculations were likely more precise than stated in the petition.
6 Radar azimuth error is a “combination of...azimuth measurement error and radar azimuth bias”, and “azimuth bias is a systematic error...[which is] canceled out in any separation measurements”. See
systematic errors.7
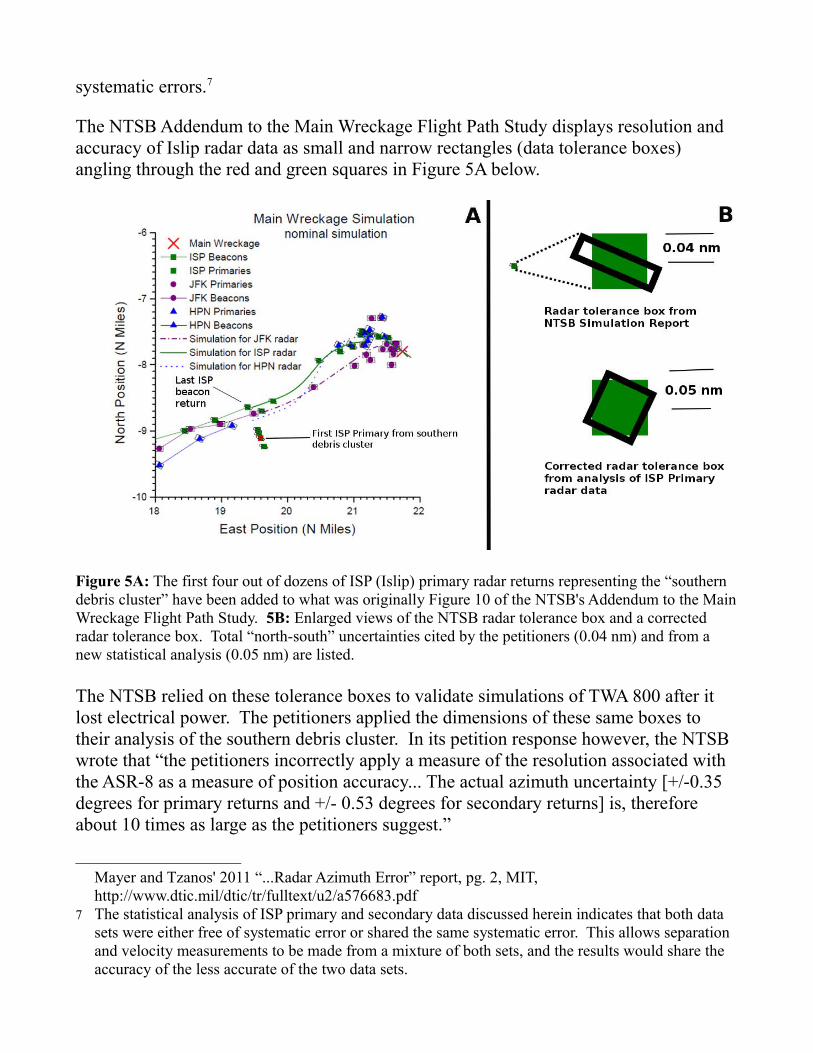
The NTSB Addendum to the Main Wreckage Flight Path Study displays resolution and accuracy of Islip radar data as small and narrow rectangles (data tolerance boxes) angling through the red and green squares in Figure 5A below.
Figure 5A: The first four out of dozens of ISP (Islip) primary radar returns representing the “southern debris cluster” have been added to what was originally Figure 10 of the NTSB's Addendum to the MainWreckage Flight Path Study. 5B: Enlarged views of the NTSB radar tolerance box and a corrected radar tolerance box. Total “north-south” uncertainties cited by the petitioners (0.04 nm) and from a new statistical analysis (0.05 nm) are listed.
The NTSB relied on these tolerance boxes to validate simulations of TWA 800 after it lost electrical power. The petitioners applied the dimensions of these same boxes to their analysis of the southern debris cluster. In its petition response however, the NTSB wrote that “the petitioners incorrectly apply a measure of the resolution associated with the ASR-8 as a measure of position accuracy... The actual azimuth uncertainty [+/-0.35 degrees for primary returns and +/- 0.53 degrees for secondary returns] is, therefore about 10 times as large as the petitioners suggest.”
Mayer and Tzanos' 2011 “...Radar Azimuth Error” report, pg. 2, MIT, http://www.dtic.mil/dtic/tr/fulltext/u2/a576683.pdf
7 The statistical analysis of ISP primary and secondary data discussed herein indicates that both data sets were either free of systematic error or shared the same systematic error. This allows separation and velocity measurements to be made from a mixture of both sets, and the results would share the accuracy of the less accurate of the two data sets.

While azimuth resolution (0.044 degrees) is not the same as azimuth accuracy, for separation measurements such as those made by the petitioners, it is a closer estimate than the significantly larger values listed by the NTSB. The azimuth uncertainty values (0.35 and 0.53 degrees) that the NTSB cites as being “about 10 times as large as the petitioners suggest” apparently include systematic errors that are canceled out in separation measurements and are irrelevant to the petitioners' calculations.8
An analysis of the ISP secondary radar data shows that relative azimuth accuracy is 0.06degrees, which agrees with values determined in an MIT radar study (see Figure 6 below) and is close to the value used to generate the respective dimensions of the NTSB's radar tolerance boxes. Relative azimuth accuracy for ISP primary data was determined to be approximately 0.11 degrees and is reflected in the corrected radar tolerance box in Figure 5B above.9
In 2011, researchers from MIT's Lincoln Laboratory published a detailed study of azimuth error in secondary radar data from ASR-9 and ASR-11 radar systems.
8 The +/- 0.53 nm error cited by the NTSB for ISP secondary data appears to inaccurately reference systematic and measurement error affecting data measured by a “sliding window” technique, insteadof the more accurate monopulse technique apparently used by at the Islip facility. The sliding window technique contains 0.3 degrees of azimuth bias and 0.23 degrees of azimuth error, according to S.D. Thompson's 2006 report 'Required Surveillance Performance Accuracy to Support3-Mile and 5-Mile Separation in the National Airspace System' published by MIT's Lincoln Laboratory. The Mode S system with its monopulse technique has a total of 0.368 degrees of error, of which 0.3 degrees is the irrelevant azimuth bias. As discussed below, the September 23rd, 1992 Mode S Project Implementation Plan and a new statistical analysis of the relevant data indicates thata Mode Select (Mode S) Beacon Sensor System was installed and operational at Islip's radar facility between August of 1994 and July of 1996. At the time of the crash, both ISP primary and secondaryantennas appeared to have been properly calibrated and shared the same systematic errors, which makes those errors cancel out and become irrelevant to the petitioners' calculations.
9 A statistical analysis of the ISP radar data from MacArthur Islip Airport, described in more detail below, extracted one standard deviation of relative range error to be +/- 0.035 nautical miles (nm) and a standard deviation of relative azimuth arc error to be 0.04 nm near where TWA 800 lost electrical power. The 2013 petition and the NTSB's Addendum to the Main Wreckage Flight Path Study relied on a range error of +/- 0.128 nm and an azimuth arc resolution of approximately +/- 0.0154 nm. The new values result in a corrected “north-south” error from +/- 0.04 nm listed in the 2013 petition to +/- 0.05 nm. See Figure 5B above.
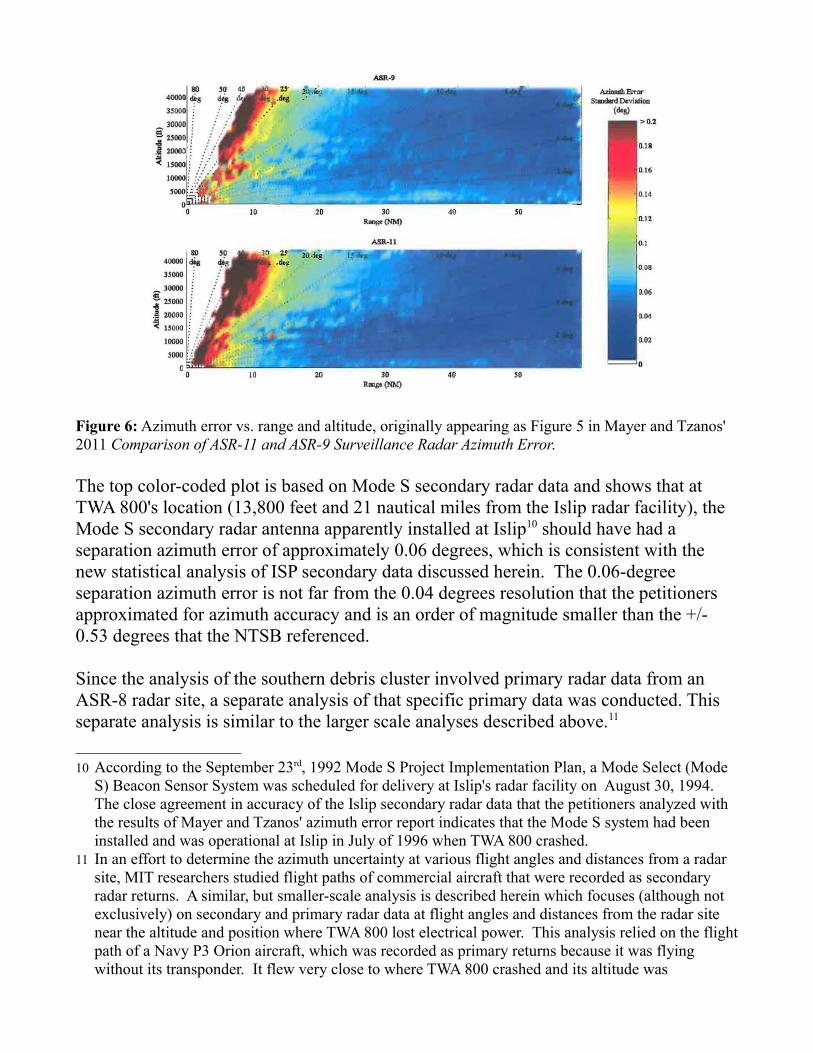
Figure 6: Azimuth error vs. range and altitude, originally appearing as Figure 5 in Mayer and Tzanos' 2011 Comparison of ASR-11 and ASR-9 Surveillance Radar Azimuth Error.
The top color-coded plot is based on Mode S secondary radar data and shows that at TWA 800's location (13,800 feet and 21 nautical miles from the Islip radar facility), the Mode S secondary radar antenna apparently installed at Islip10 should have had a separation azimuth error of approximately 0.06 degrees, which is consistent with the new statistical analysis of ISP secondary data discussed herein. The 0.06-degree separation azimuth error is not far from the 0.04 degrees resolution that the petitioners approximated for azimuth accuracy and is an order of magnitude smaller than the +/-0.53 degrees that the NTSB referenced.
Since the analysis of the southern debris cluster involved primary radar data from an ASR-8 radar site, a separate analysis of that specific primary data was conducted. This separate analysis is similar to the larger scale analyses described above.11
10 According to the September 23rd, 1992 Mode S Project Implementation Plan, a Mode Select (Mode S) Beacon Sensor System was scheduled for delivery at Islip's radar facility on August 30, 1994. The close agreement in accuracy of the Islip secondary radar data that the petitioners analyzed with the results of Mayer and Tzanos' azimuth error report indicates that the Mode S system had been installed and was operational at Islip in July of 1996 when TWA 800 crashed.
11 In an effort to determine the azimuth uncertainty at various flight angles and distances from a radar site, MIT researchers studied flight paths of commercial aircraft that were recorded as secondary radar returns. A similar, but smaller-scale analysis is described herein which focuses (although not exclusively) on secondary and primary radar data at flight angles and distances from the radar site near the altitude and position where TWA 800 lost electrical power. This analysis relied on the flightpath of a Navy P3 Orion aircraft, which was recorded as primary returns because it was flying without its transponder. It flew very close to where TWA 800 crashed and its altitude was
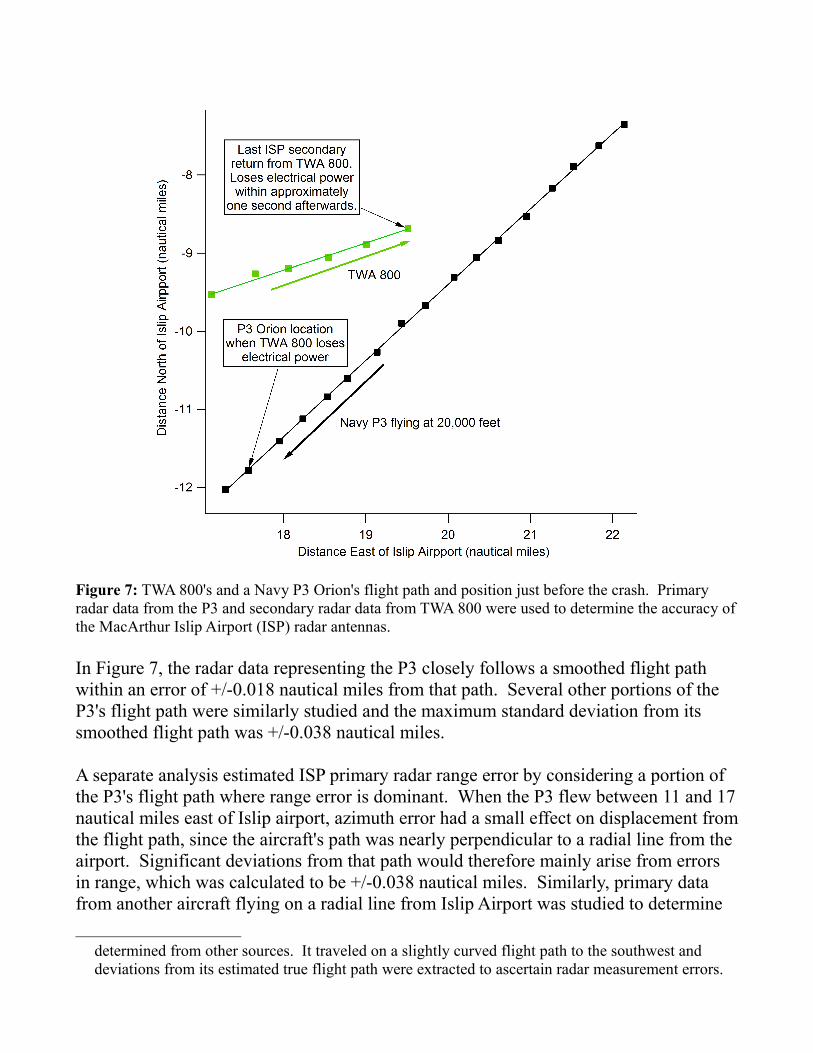
Figure 7: TWA 800's and a Navy P3 Orion's flight path and position just before the crash. Primary radar data from the P3 and secondary radar data from TWA 800 were used to determine the accuracy ofthe MacArthur Islip Airport (ISP) radar antennas.
In Figure 7, the radar data representing the P3 closely follows a smoothed flight path within an error of +/-0.018 nautical miles from that path. Several other portions of the P3's flight path were similarly studied and the maximum standard deviation from its smoothed flight path was +/-0.038 nautical miles.
A separate analysis estimated ISP primary radar range error by considering a portion of the P3's flight path where range error is dominant. When the P3 flew between 11 and 17nautical miles east of Islip airport, azimuth error had a small effect on displacement fromthe flight path, since the aircraft's path was nearly perpendicular to a radial line from the airport. Significant deviations from that path would therefore mainly arise from errors in range, which was calculated to be +/-0.038 nautical miles. Similarly, primary data from another aircraft flying on a radial line from Islip Airport was studied to determine
determined from other sources. It traveled on a slightly curved flight path to the southwest and deviations from its estimated true flight path were extracted to ascertain radar measurement errors.
azimuth accuracy. Displacements from that flight path were mainly due to relative azimuth accuracy, which was found to be 0.11 degrees.
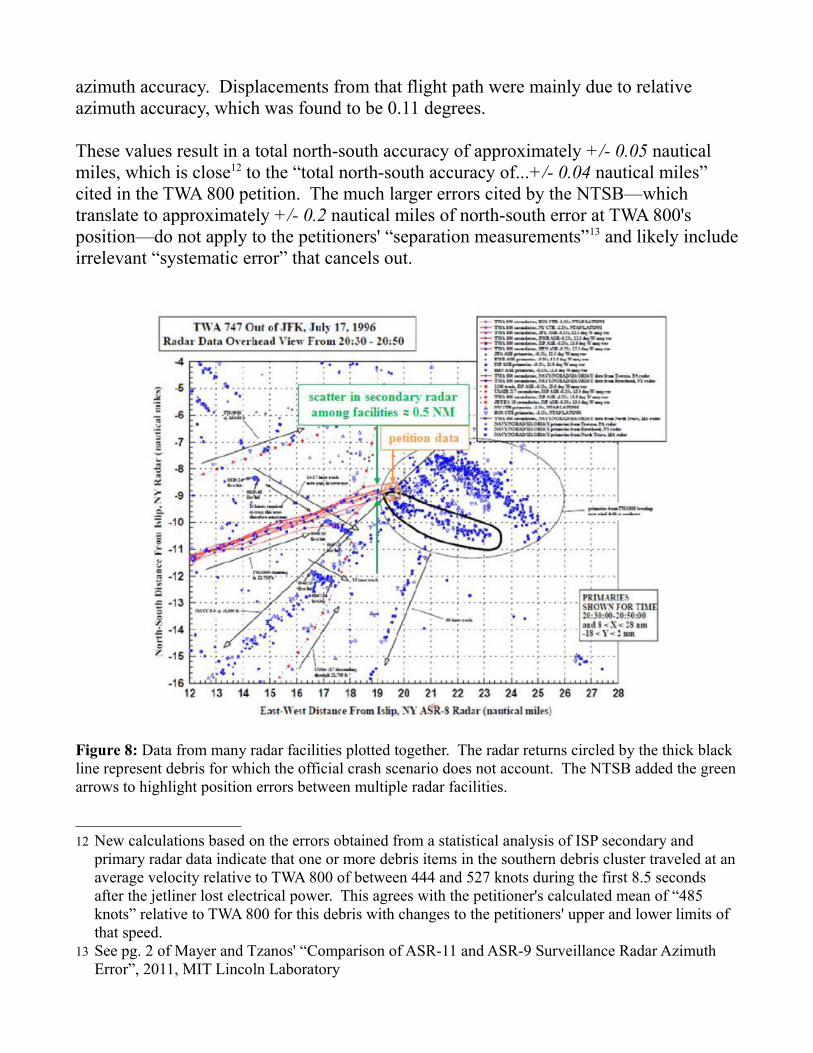
These values result in a total north-south accuracy of approximately +/- 0.05 nautical miles, which is close12 to the “total north-south accuracy of...+/- 0.04 nautical miles” cited in the TWA 800 petition. The much larger errors cited by the NTSB—which translate to approximately +/- 0.2 nautical miles of north-south error at TWA 800's position—do not apply to the petitioners' “separation measurements”13 and likely includeirrelevant “systematic error” that cancels out.
Figure 8: Data from many radar facilities plotted together. The radar returns circled by the thick black line represent debris for which the official crash scenario does not account. The NTSB added the greenarrows to highlight position errors between multiple radar facilities.
12 New calculations based on the errors obtained from a statistical analysis of ISP secondary and primary radar data indicate that one or more debris items in the southern debris cluster traveled at anaverage velocity relative to TWA 800 of between 444 and 527 knots during the first 8.5 seconds after the jetliner lost electrical power. This agrees with the petitioner's calculated mean of “485 knots” relative to TWA 800 for this debris with changes to the petitioners' upper and lower limits of that speed.
13 See pg. 2 of Mayer and Tzanos' “Comparison of ASR-11 and ASR-9 Surveillance Radar Azimuth Error”, 2011, MIT Lincoln Laboratory
The NTSB also indicated that ½ nm scatter applied to the petitioners' calculations, whichconflicts with their earlier indication of a +/- 0.18 nm and +/- 0.20 nm uncertainty14. This larger uncertainty refers to “scatter...among [separate radar] facilities”, which the NTSB highlighted with two green arrows in its radar printout of the accident in Figure 8.Such scatter is from combining position errors (including systematic error) between separate facilities, and it is not relevant to the petition since the petitioners' calculations are based strictly on data from a single radar facility with adequately calibrated radar antennas.
However according to the NTSB,
“[s]uch scatter in the secondary returns shows that any radar-based location of the airplane is not nearly as precise as assumed by the petitioners...[and] any returns that appear to be located less than about ½ nm apart (in two sequential returns) overlap in their areas of uncertainty...Contrary to the petitioners’ claims, the precise location and movement of the pieces of debriscannot be accurately determined within the areas of uncertainty.”
This NTSB passage could mislead readers into believing that the ½ nm scatter between multiple facilities was relevant to the petitioner's analyses, but as explained above, it wasnot. The petitioners did not mix data from multiple facilities together in their separation measurements. They considered uncertainties from a single facility for each analysis in a manner consistent with NTSB's Addendum to Exhibit 22C (the Main Wreckage Flight Path Study). Neither the simulations from that NTSB study nor the petitioners' analyses were affected by such scatter.
14 The indicated +/- 0.18 and +/- 0.20 nm uncertainties would be in the north-south direction. The span of position uncertainty indicated by the NTSB at TWA 800's position was between 0.128 and 0.18 nm for primary data and between 0.064 and 0.20 nm for secondary data, which are attributed toseparate or combined contributions of the respective azimuth and range uncertainties at that location.
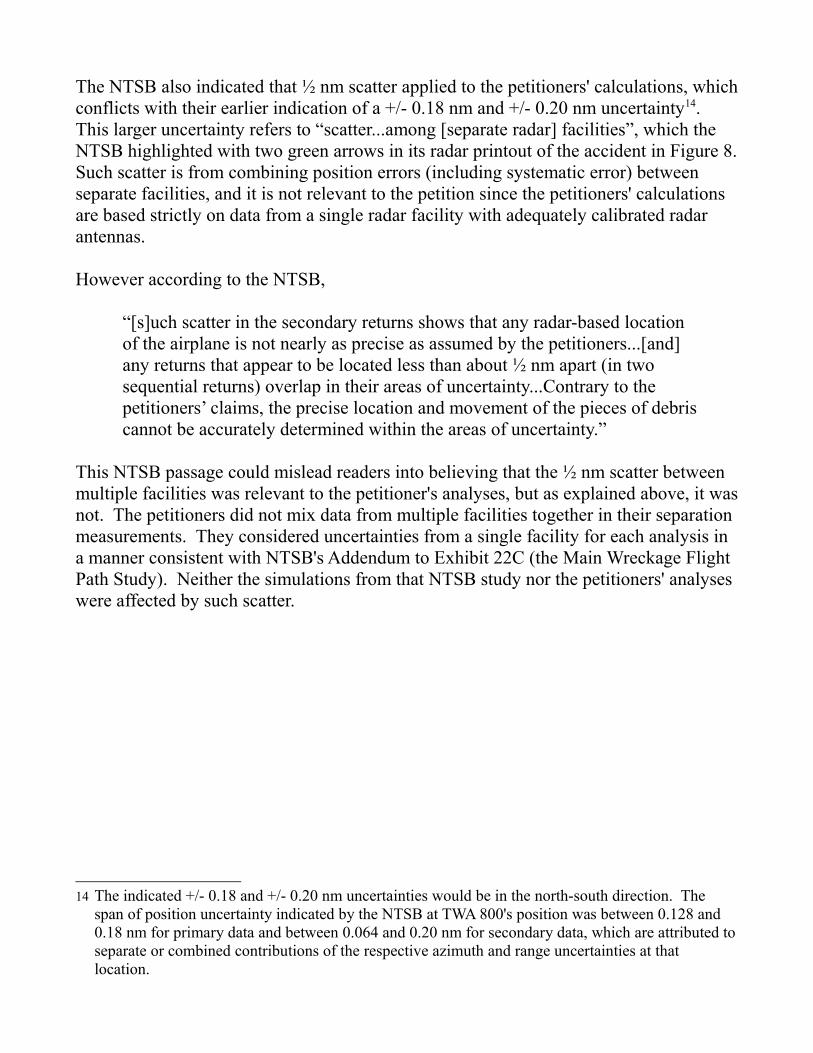
Figure 9: Four misleading ½ nm uncertainty circles have been added around each data point within thesouthern debris cluster to illustrate the NTSB's potentially misleading statement that “any returns that appear to be located less than about ½ nm apart (in two sequential returns) overlap in their areas of uncertainty”.
The above graphic illustrates how the NTSB effectively conflated inter-facility “scatter” with relative position uncertainty from the single Islip radar facility. Compare the large and irrelevant “½ nm” uncertainty circles with the “radar data tolerances”15 that the NTSB used in its simulation report and that were displayed as small and narrow rectangles angling through each ISP data point. When relying on the more relevant and smaller uncertainty rectangles (or the relevant uncertainty boxes from Figure 5B), the data is shown to be of sufficient quality to both track the main wreckage as it traveled to where it was recovered (symbolized by a red X in Figure 9 above) and to calculate the position and average speed of debris that appeared in the southern debris cluster.
15 The NTSB's reference to “radar data tolerances” appears on page 14 of that agency's Addendum I to the Main Wreckage Flight Path Study, 2000, NTSB.
Radar Reflections
The NTSB stated that:
“the chaotic nature of an in-flight explosion and breakup could lead to errors in the calculated radar positions as the radar energy is reflected from more than one object...; yet the petitioners' debris position and velocity calculations assume that, following the explosion, the primary radar returnsrepresented individual objects tracked as they fell to the ocean. Such an assumption is inappropriate.”
Although not entirely clear, the NTSB is apparently arguing that radar returns from objects in the southern debris cluster may be the result of two or more objects reflecting radar energy like multiple mirrors in the same room. This argument can be dismissed here because several radar sites recorded the same pattern in the same area, relegating the idea that debris was not actually in this area but reflected to only appear to be in this area as extremely unlikely. If the NTSB is making such a claim, the following discussion addresses it.
If these types of multiple reflections had affected the positions of radar returns in the southern debris cluster, the triangular geometry between TWA 800, the Islip radar antenna, and the cluster itself would result in calculated increases in debris velocities relative to TWA 800 and would therefore strengthen the petitioners' argument that debrismoved “too fast, and in the wrong direction to have resulted from the officially proposedfuel-air deflagration.”16
16 See page 14 of the referenced petition, which can be found online here: https://twa800project.files.wordpress.com/2013/06/petition-final.pdf
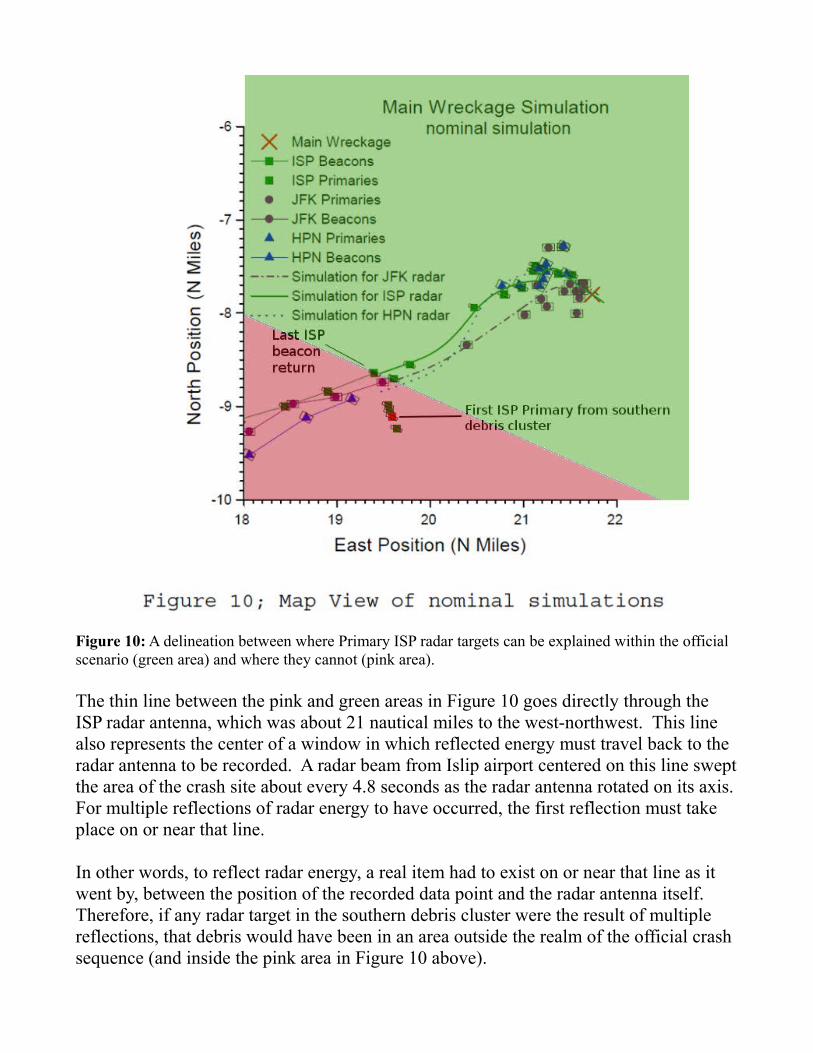
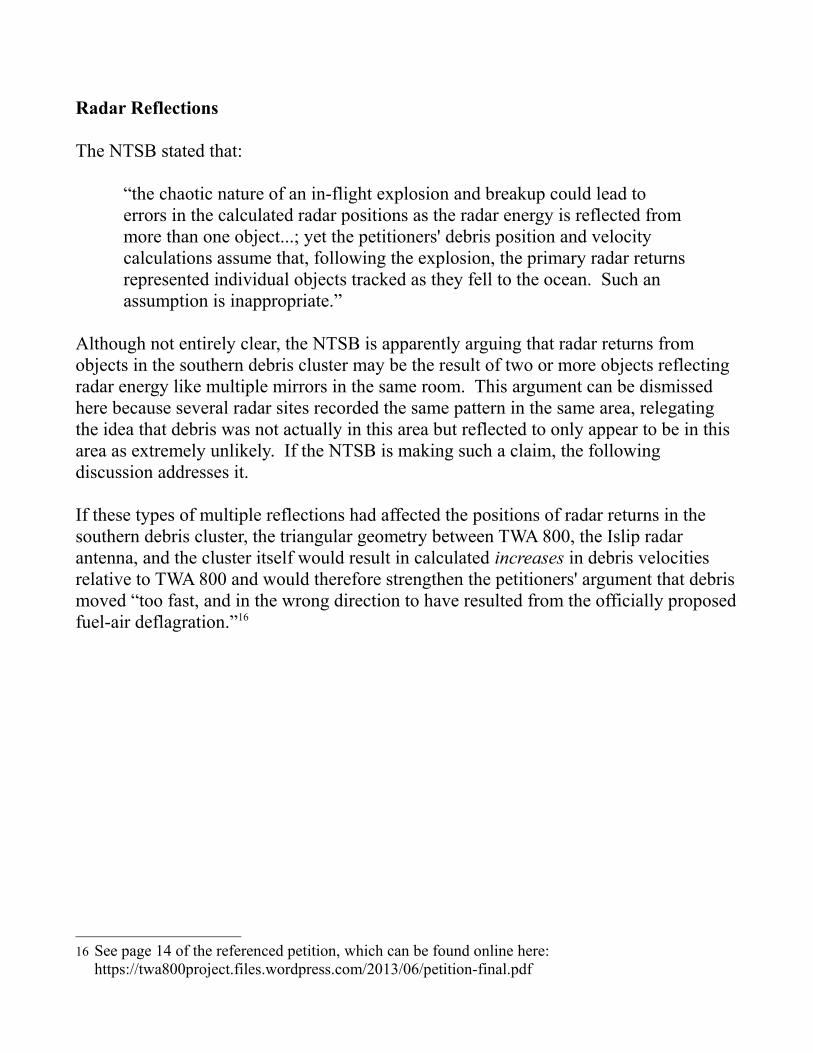
Figure 10: A delineation between where Primary ISP radar targets can be explained within the official scenario (green area) and where they cannot (pink area).
The thin line between the pink and green areas in Figure 10 goes directly through the ISP radar antenna, which was about 21 nautical miles to the west-northwest. This line also represents the center of a window in which reflected energy must travel back to the radar antenna to be recorded. A radar beam from Islip airport centered on this line sweptthe area of the crash site about every 4.8 seconds as the radar antenna rotated on its axis. For multiple reflections of radar energy to have occurred, the first reflection must take place on or near that line.
In other words, to reflect radar energy, a real item had to exist on or near that line as it went by, between the position of the recorded data point and the radar antenna itself. Therefore, if any radar target in the southern debris cluster were the result of multiple reflections, that debris would have been in an area outside the realm of the official crash sequence (and inside the pink area in Figure 10 above).
Also, the alleged inaccurate position would be recorded as a point on the same line, going through and beyond the object that first reflected the radar energy. This straight-line requirement is similar to being confused by a mirror in an unfamiliar room. One may incorrectly believe object(s) exist beyond the mirror, on a straight line that goes through the mirror itself, when those object(s) really exist elsewhere. In this analogy, the mirror is the first reflector and the confused person's line of site is the radar beam.
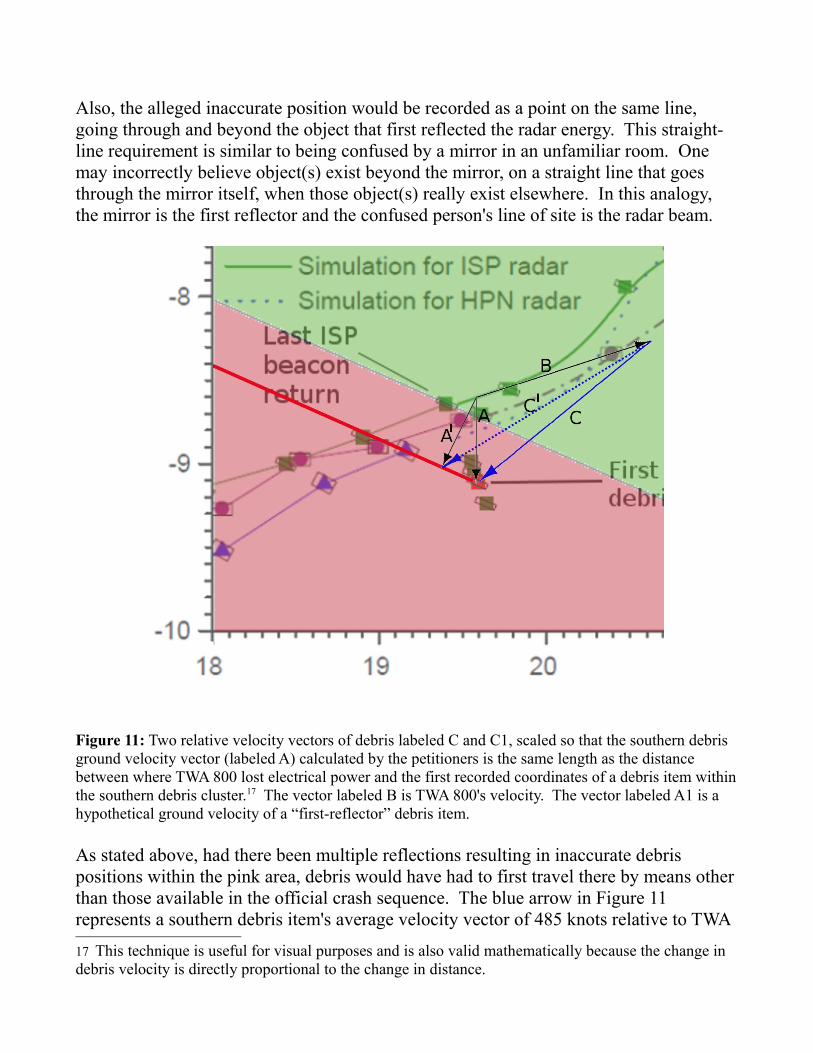
Figure 11: Two relative velocity vectors of debris labeled C and C1, scaled so that the southern debris ground velocity vector (labeled A) calculated by the petitioners is the same length as the distance between where TWA 800 lost electrical power and the first recorded coordinates of a debris item withinthe southern debris cluster.17 The vector labeled B is TWA 800's velocity. The vector labeled A1 is a hypothetical ground velocity of a “first-reflector” debris item.
As stated above, had there been multiple reflections resulting in inaccurate debris positions within the pink area, debris would have had to first travel there by means otherthan those available in the official crash sequence. The blue arrow in Figure 11 represents a southern debris item's average velocity vector of 485 knots relative to TWA
17 This technique is useful for visual purposes and is also valid mathematically because the change in debris velocity is directly proportional to the change in distance.
800 over a period of 8.5 seconds, which was calculated in Figure 2 of the petition. The blue dashed-line arrow represents the relative velocity vector of a debris item arbitrarily located on the thick red line—that red line representing the allowable positions for an item that first reflects radar energy in a scenario where the radar-recorded position of this debris item was inaccurate due to multiple reflections. As can be seen, such radar reflection(s) result in higher debris velocities relative to the aircraft. Therefore, the petitioners' arguments would be strengthened had such radar reflections been responsiblefor radar returns in the area of the southern debris cluster.
High Velocities
The petitioners' calculations indicated that debris traveled at an average speed of approximately 485 knots relative to TWA 800 over an 8.5 second period. Simulations conducted to determine the initial exit velocity of this debris showed that exit velocities of Mach 4 (four times the speed of sound) or higher fit the data best.
The NTSB claimed that it “did account for pieces of wreckage that may have traveled at high velocity...[including] a section of the right wing and a portion of the front spar”. The NTSB also said that the “high velocities are the result of the initial velocity (due to the breakup) and the aerodynamic forces that can develop from lift and rotation”. The NTSB further asserted that “high velocity” items “would be expected in a CWT [center wing tank] explosion”.
While these statements create the impression that the NTSB’s proposed fuel-air explosion caused the referenced wing and front spar sections to be ejected at high velocities, the NTSB itself determined that those sections actually remained with the aircraft for a period of time after the initial event (see below). This shows that in fact, neither item was ejected at high velocity in the official scenario.
In the official scenario, all “section[s] of the right wing” remained with the aircraft, since the right wing “remained intact” and attached to the aircraft18 as debris began appearing in the southern debris cluster. Here, the NTSB was likely inaccurately describing “a section of the right side of the fuselage with windows” (RF35)19. This RF35 fuselage section did not depart the aircraft from the CWT explosion. In the official scenario, RF35 had an initial velocity of zero relative to TWA 800 as it peeled away from other fuselage sections and was swept behind the jetliner after the CWT explosion.
18 See page 29 of the NTSB's Sequencing Study, Exhibit 18A, 1997, NTSB.19 According to the NTSB Sequencing Study, the “wings and aft fuselage remained intact” during the
early crash sequence, although there is evidence of damage to the left wing during that time. (see NTSB Sequencing Study, Exhibit 18A, pg. 29) The NTSB concluded that “flying is the most probable reason for the position of RF35”. (see NTSB Trajectory Study, Exhibit 22A, pg. 11)
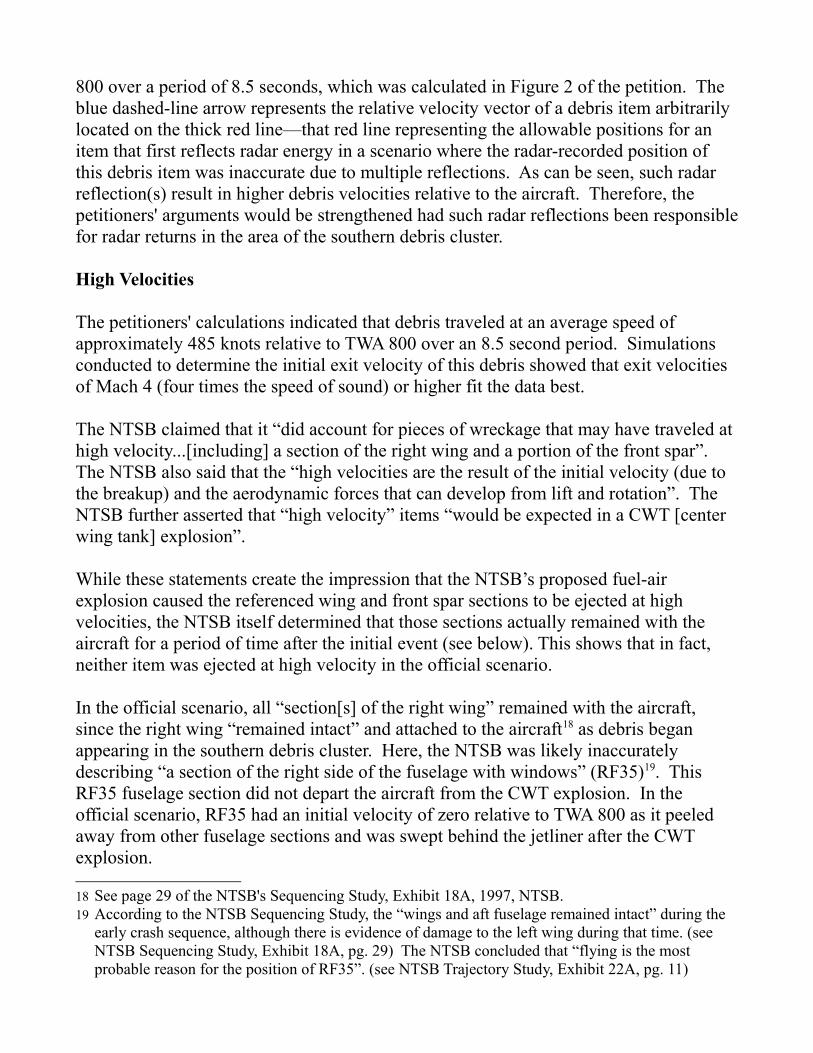
The referenced “portion of the front spar” (CW504) was on the north side of the aircraft—the side facing away from the southern debris cluster—and the official scenario “does not support a conclusion that the front spar piece CW504 departed the airplane substantially before”20 parts that landed in the same debris field and left the aircraft after the CWT explosion. And although CW504's recovery location is, as the NTSB put it, a “case in point of an apparent conflict”21 with the NTSB fuel-air explosion scenario, its trajectory from TWA 800 to where it was recovered does not pass through the southern debris cluster area.
Figure 12: The NTSB's simulated trajectory debris item CW504 (red line) and a best fit trajectory of the main wreckage (blue line) are displayed. Note CW504's initial velocity vector to the northwest.
20 See page 25 of the NTSB's Sequencing Study, Exhibit 18A, 1997, NTSB21 On page 30 of the NTSB Sequencing Study, the NTSB concluded that CW504's recovery location
conflicts with the official crash scenario because it was recovered too far west (“in the earliest part of the red area”) to be explained by the official crash sequence. Items in the southern debris cluster represented debris that remained significantly further away from all other debris than CW504, and therefore the data representing this debris cluster is a stronger “case in point of an apparent conflict” with the official crash sequence.

During the investigation into the crash, the NTSB never suggested that parts CW504 or RF35 exited the aircraft at high velocity toward the southern debris cluster. The recovery location of CW504 suggested that it left the aircraft on a northward trajectory and initially traveled on a heading away from the southern debris cluster (see Figure 12 above). The highest average southward velocity for either debris item over a period of eight seconds after separation from the aircraft was ten knots,22 as indicated by data usedin the NTSB Trajectory Study Supporting Material (Exhibit 22B). This is far less than the approximately 200 knots average ground speed for items(s) in the southern debris cluster during the same time period.
The NTSB is incorrect when stating, in reference to CW504 and RF35, that “high velocities are the result of the initial velocity...and the aerodynamic forces”. The initial velocity of RF35 (TWA 800's speed) and the simulated initial velocity of CW504 were slower than the speed of sound, which by most definitions is low velocity. When RF35 and CW504 departed the aircraft, their speed would not increase from aerodynamic forces, but would decrease as each moved through the air. Indeed, the only NTSB simulation available that ascribed a non-zero initial velocity to either component relativeto TWA 800 shows CW504's ground speed quickly diminishing until its average ground speed over eight seconds dropped to 34 knots (see Figure 12 above).
Conclusion
All of the NTSB's attempts to explain the southern debris cluster by citing radar uncertainties, radar reflections, radar discontinuities, and two debris items have failed. The radar uncertainties cited were irrelevant to the analyses in question because those uncertainties pertain to a different type of radar measurement, contain systematic errors that cancel out in “separation measurements”23 such as the petitioners', or because they represent irrelevant “scatter” among separate radar facilities when the petitioners' measurements were made from a single facility's data. Radar reflections, if they occurred, would have resulted in higher velocities for the respective debris items relativeto the accident aircraft and therefore would have strengthened the petitioners' arguments.No significant discontinuity existed between the ISP radar site's primary and secondary radar data sets to affect the petitioners' conclusions or significantly change the results of their calculations. The debris items that the NTSB suggested to have reached “high velocity” never actually achieved high velocities in NTSB trajectory simulations. Compared to the southern debris cluster, each item had an order of magnitude lower
22 See the Red Zone Fuselage Skin Trajectories which is Attachment 3 to the NTSB's Trajectory Study Supporting Material (Exhibit 22B, 1997). That study plots RF35's position after separating from theaircraft with markers on its trajectory line spaced at ten seconds intervals.
23 See page 2 of the referenced MIT radar study, which can be found online here: http://www.dtic.mil/dtic/tr/fulltext/u2/a576683.pdf
average ground velocity over a period of eight seconds. Those items also remained close to (or north of) the flight path when radar sites began recording actual high velocity debris within an area significantly south of TWA 800's flight path.
This report has confirmed the petitioners' conclusions that the high velocity debris existed near TWA 800 close when it lost electrical power. The NTSB has not yet provided a scientifically valid explanation for this debris, its speed, or its location. Further, the NTSB has not identified any debris item from the TWA 800 aircraft that could conceivably represent it.