Embed Size (px)
DESCRIPTION
Radar data from cold air outbreak during Constrain. Kirsty McBeath, Paul Field. Introduction. Looking at cases of cold air outbreak in the Northwest approaches 4 flights during Constrain examined these conditions during January 2010 - PowerPoint PPT Presentation
Citation preview

© Crown copyright Met Office
Radar data from cold air outbreak during ConstrainKirsty McBeath, Paul Field

© Crown copyright Met Office
• Looking at cases of cold air outbreak in the Northwest approaches
• 4 flights during Constrain examined these conditions during January 2010
• Radar data from these cases used for comparisons with UKV model
•This data is from a case on January 31st 2010 which coincides with flight b507 of the BAe-146 research aircraft
MODIS 31st Jan 2010
Introduction

© Crown copyright Met Office
Overview of Radar Observations

© Crown copyright Met Office
Composite radar data
• Data available every 5 minutes for 24 hour period
•Scans performed at a range of elevation angles: 0.5°, 1.0°, 1.5°, 2.5°
• 4 scan angles intercept cells at different distances from radar
• Data from 4 scan angles combined to produce one dataset which captures all cells
• 0.5°: 75-150km
• 1.0°: 54-85km
• 1.5°: 32-64km
• 2.5°: 30-42km
150km
1.91 ±0.36km

© Crown copyright Met Office
Model data

© Crown copyright Met Office
Radar Model
Reflectivity values for UM computed using model microphysics data, this reduces processing done on radar data and removes assumptions used when converting reflectivity to rain-rate

© Crown copyright Met Office
• Shear dominated boundary layer• Local Richardson number used as indicator of shear dominating
convection: if so then boundary layer diagnoses stratocumulus topped boundary layer (see Bodas-Salcedo et al. 2011)
• Reducing ice nucleation temperature (Tnuc=-18°C)
• Changing the primary hetrogemeous ice nucleation temperature from -10°C to -18°C. This inhibits ice production until the boundary layer top approaches 4km
• Reducing autoconversion efficiency (AcE = 0.1)
• The autoconversion efficiency is usually set to 0.55 (using the Cotton formulation of autoconversion), this is reduced to 0.1 to reduce the transfer if cloud water to precipitation
Changes made to model

© Crown copyright Met Office
• No ice• All ice processes switched off by setting Tnuc=-50°C and
converting any existing ice to liquid
• Field PSD• Snow representation changed from standard exponential (Wilson
and Ballard 1999) to representation of Field et al. (2007)
• 3D Smagorinsky• Vertical mixing done explicitly using 3D Smagorinsky approach
rather than boundary layer scheme
Changes made to model

© Crown copyright Met Office
Model variations
Job Sh. Dom. B.L.
Tnuc = -18C AcE = 0.1 No Ice Field P.S.D 3D Smag.
dimsh
dimsp X
dimsq X
dimsn X
dimsk X
dimsi X X
dimsz X X
dimsy X X X
dimsu X X X X
dimsw X X X

© Crown copyright Met Office
Cluster analysis

© Crown copyright Met Office
Cluster Analysis
10dBz (~4mm/day) threshold used to select regions of precipitation in both datasets
© Crown copyright Met Office
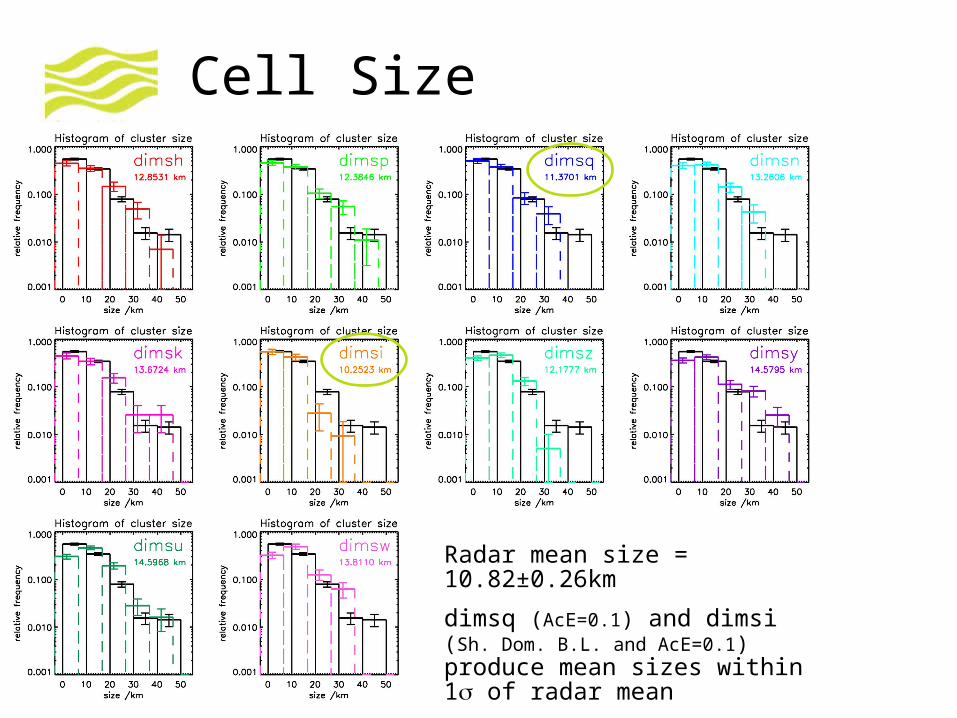
Cell Size
Radar mean size = 10.82±0.26km
dimsq (AcE=0.1) and dimsi (Sh. Dom. B.L. and AcE=0.1) produce mean sizes within 1 of radar mean
© Crown copyright Met Office
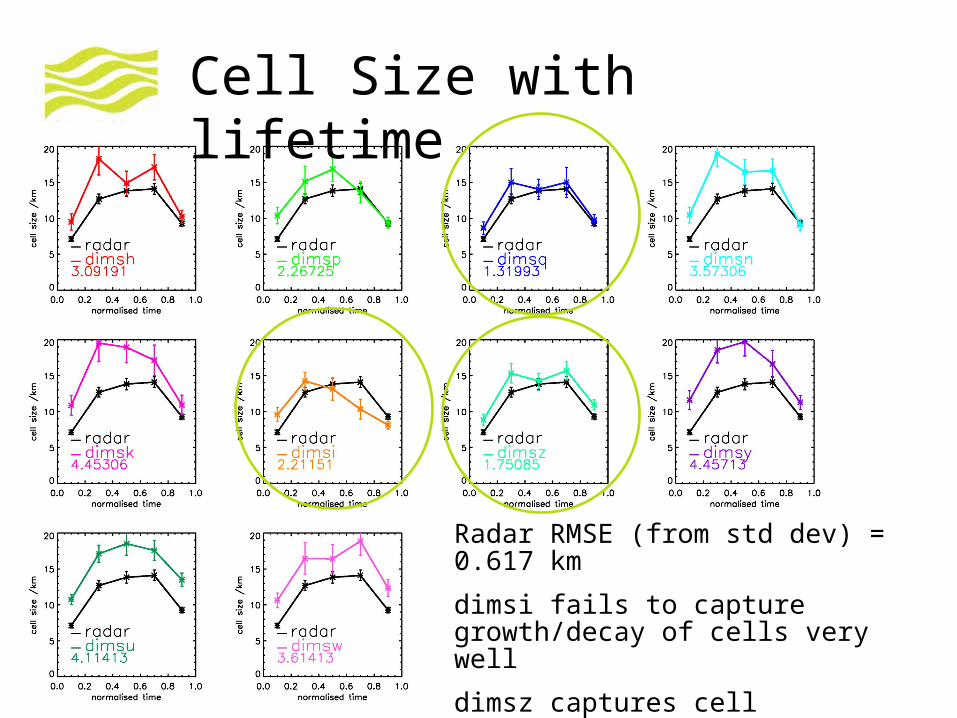
Cell Size with lifetime
Radar RMSE (from std dev) = 0.617 km
dimsi fails to capture growth/decay of cells very well
dimsz captures cell growth/decay quite well (has low RMSE value)

© Crown copyright Met Office
Cell lifetime
Radar mean lifetime = 69±3mins
dimsu (Sh. Dom. B.L., Tnuc=-18°C, AcE=0.1 & Field P.S.D.) has mean lifetime within 1of radar
Other runs with all do worse than control run for mean cell lifetime values

© Crown copyright Met Office
Cell reflectivity
Radar mean reflectivity = 16.9±1.4 dBz
dimsh (ctrl), dimsq (AcE=0.1) and dimsz (Sh. Dom. B.L. and Tnuc=-18°C) produce mean reflectivity within 1 of radar mean
None of the variation runs produce mean cell reflectivity values closer to the radar mean than the control run

© Crown copyright Met Office
Cell reflectivity with lifetime
Radar RMSE (from std dev) = 1.42 dBz
Runs which do well for mean reflectivity, also do well when examining reflectivity with cell lifetime
dimsq and dimsz both out-perform control when looking at RMSE over cell lifetime

© Crown copyright Met Office
Job Better than control Worse than control
dimsp mean cluster size
size with lifetime
mean cluster lifetime
mean cluster reflectivity
reflectivity with lifetime
dimsq mean cluster size*
size with lifetime
reflectivity with lifetime
mean cluster reflectivity†
mean cluster lifetime
mean cluster reflectivity
dimsi mean cluster size*
size with lifetime
mean cluster lifetime
mean cluster reflectivity
reflectivity with lifetime
dimsz mean cluster size
size with lifetime
reflectivity with lifetime
mean cluster reflectivity†
mean cluster lifetime
mean cluster reflectivity
dimsy reflectivity with lifetime
mean cluster lifetime
mean cluster lifetime
mean cluster reflectivity
size with lifetime
dimsu mean cluster lifetime* mean cluster reflectivity
reflectivity with lifetime
mean cluster size
size with lifetime
dimsq (AcE = 0.1) and dimsz (Sh. Dom. B.L. and Tnuc= -18°C) out-perform the control run over 3 variables
dimsk (Sh. Dom. B.L.), dimsn (3D Smag.) and dimsw (Tnuc= -18°C) all perform worse than the control run across all variables examined here
* Within 1 of radar mean and better than control† Within 1 of radar mean but worse than control

© Crown copyright Met Office
Questions


![[0.94]Task Scheduling to Constrain Peak Current](https://img.pdfslide.us/doc/110x75/626e279cc1717a0a2577d3e5/094task-scheduling-to-constrain-peak-current-.jpg)