Embed Size (px)
Citation preview
Sensor Update
Rachelle Duvall, PhD
U.S. Environmental Protection Agency
Office of Research and Development
2014 National Ambient Air Monitoring Conference
Atlanta, GA
August 11-14, 2014
August 13, 2014
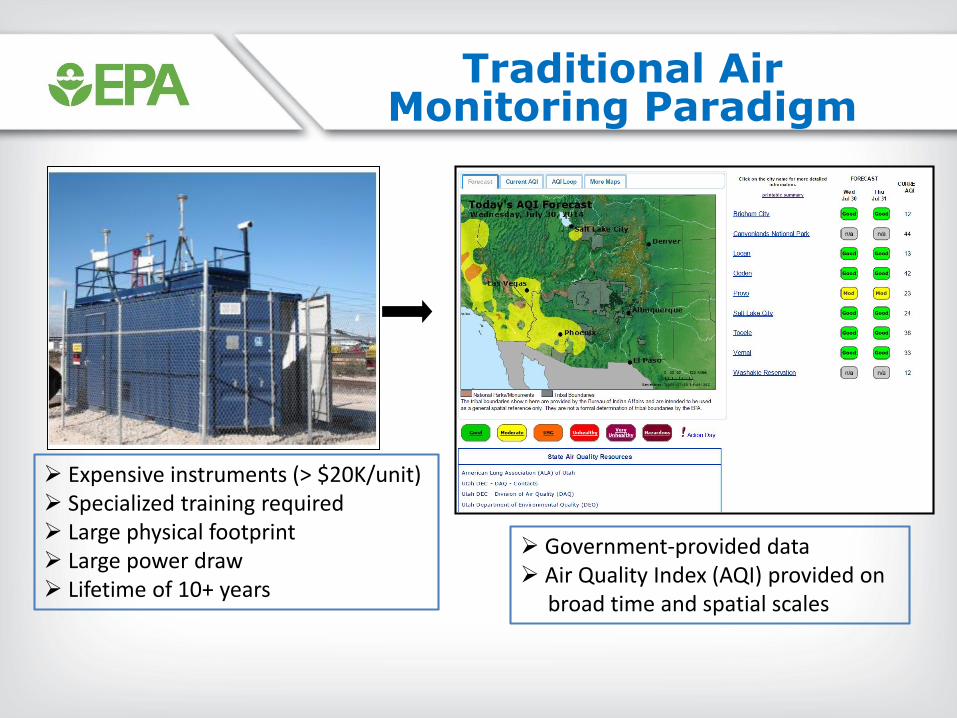
Traditional Air Monitoring Paradigm
Expensive instruments (> $20K/unit) Specialized training required Large physical footprint Large power draw Lifetime of 10+ years
Government-provided data Air Quality Index (AQI) provided on
broad time and spatial scales
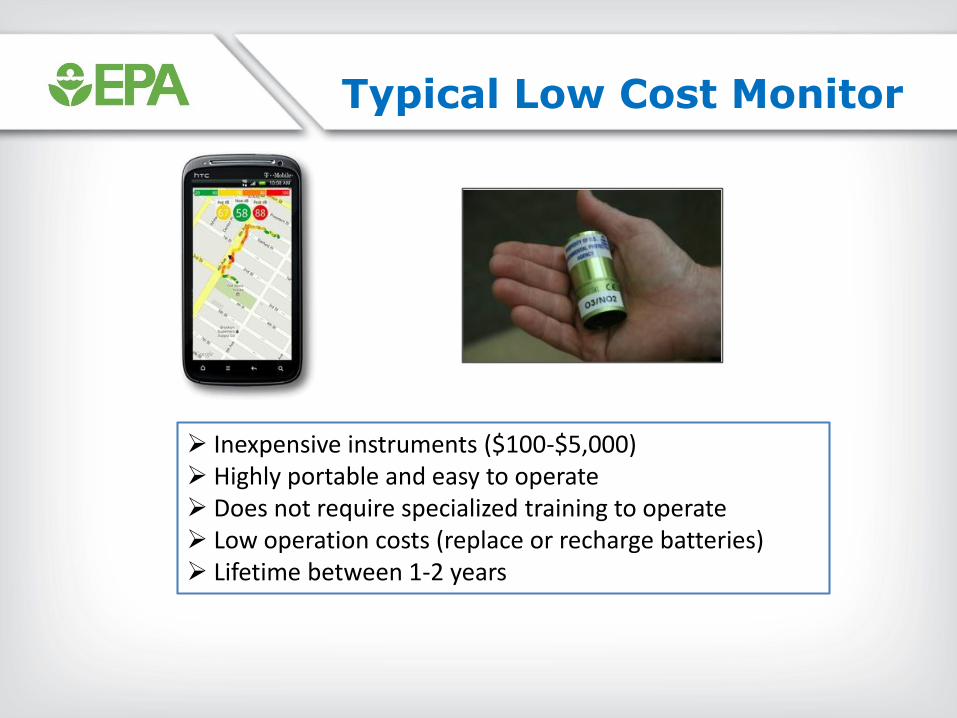
Typical Low Cost Monitor
Inexpensive instruments ($100-$5,000) Highly portable and easy to operate Does not require specialized training to operate Low operation costs (replace or recharge batteries) Lifetime between 1-2 years
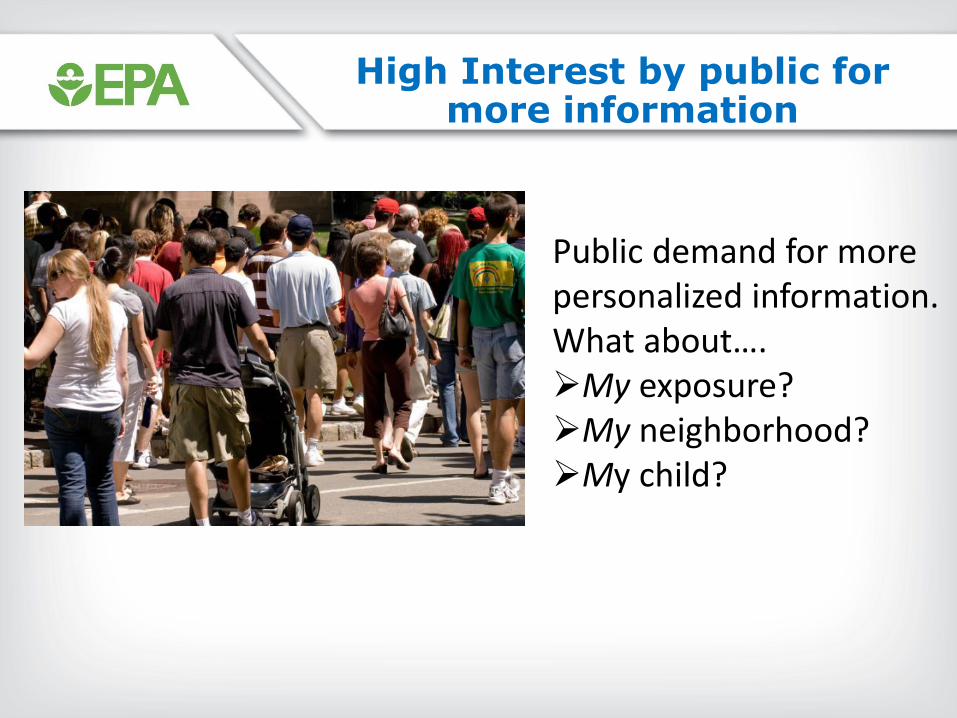
High Interest by public formore information
Public demand for more personalized information. What about…. My exposure?My neighborhood?My child?
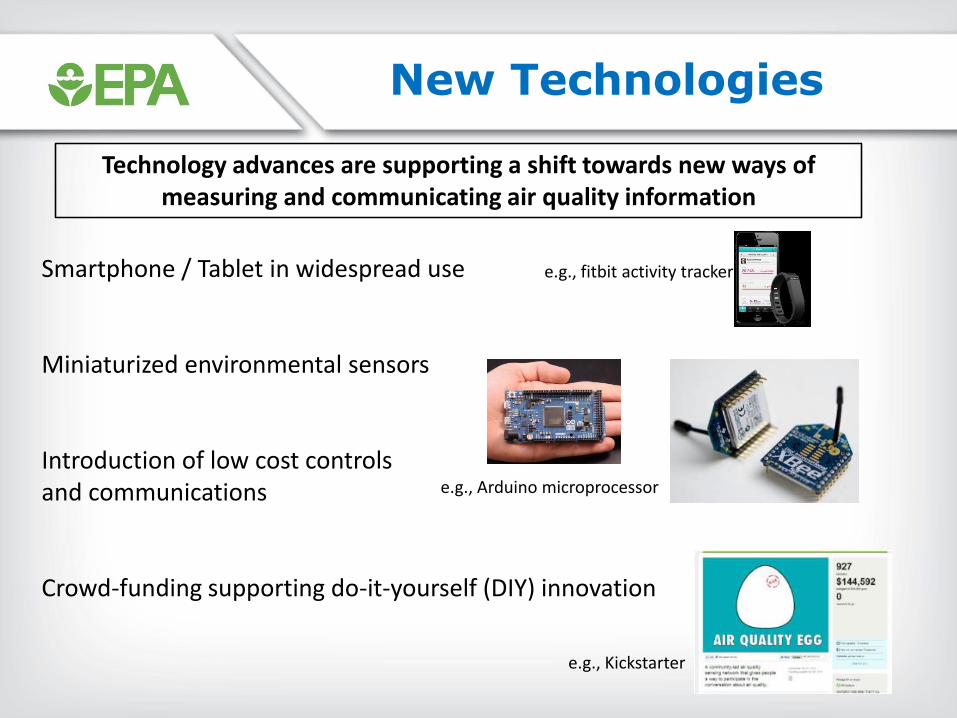
New Technologies
Technology advances are supporting a shift towards new ways of measuring and communicating air quality information
Smartphone / Tablet in widespread use
Miniaturized environmental sensors
Introduction of low cost controls and communications
Crowd-funding supporting do-it-yourself (DIY) innovation
e.g., fitbit activity tracker
e.g., Arduino microprocessor
e.g., Kickstarter
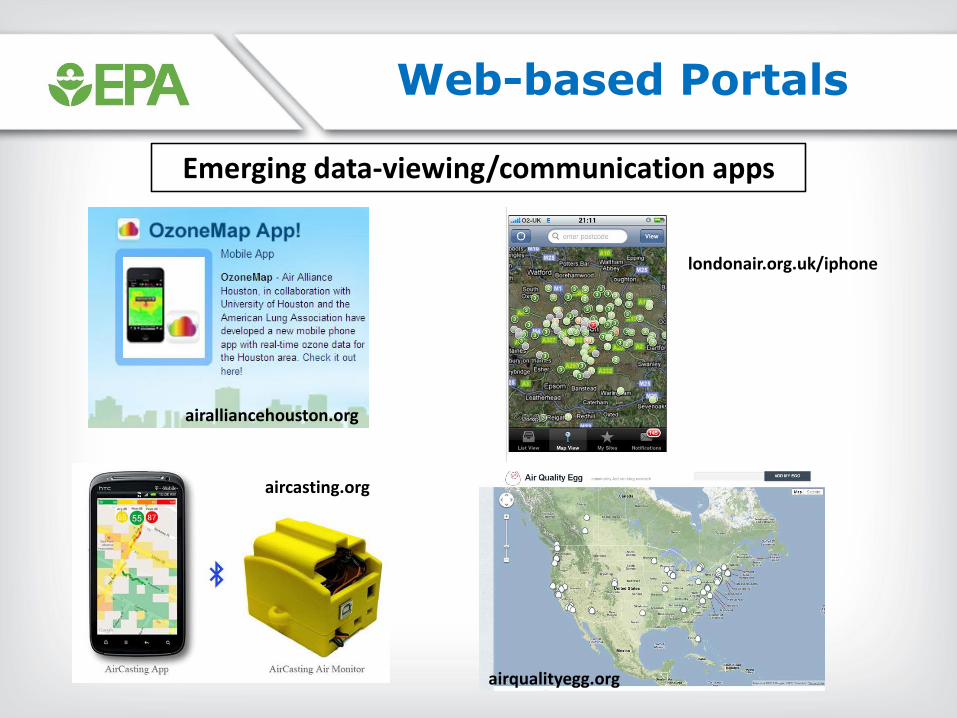
Web-based Portals
Emerging data-viewing/communication apps
airalliancehouston.org
aircasting.org
londonair.org.uk/iphone
airqualityegg.org
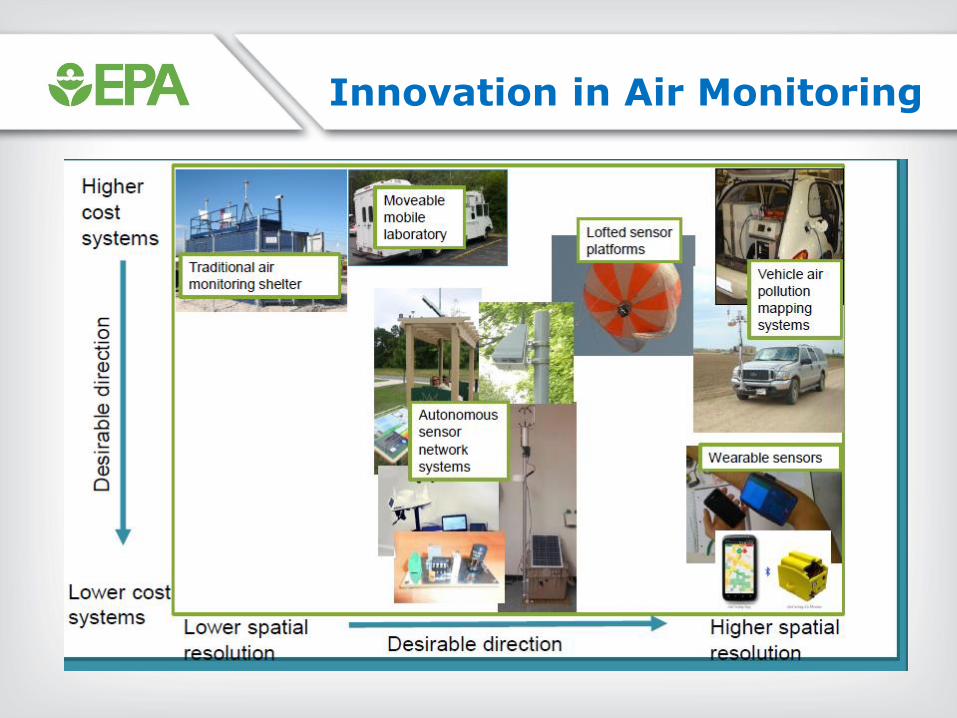
Innovation in Air Monitoring
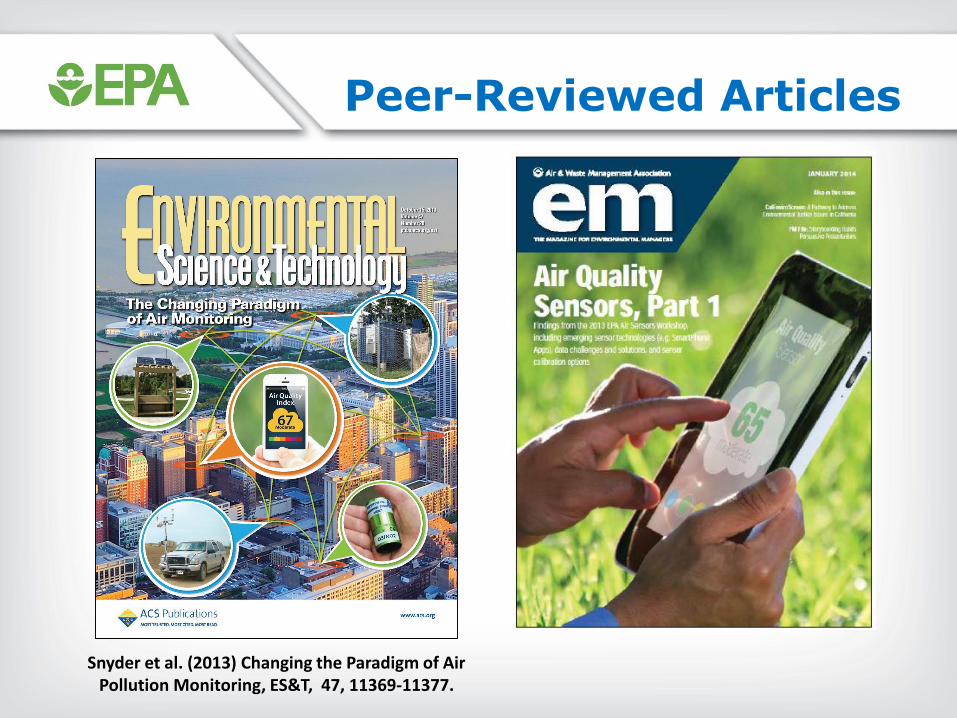
Peer-Reviewed Articles
Snyder et al. (2013) Changing the Paradigm of Air Pollution Monitoring, ES&T, 47, 11369-11377.
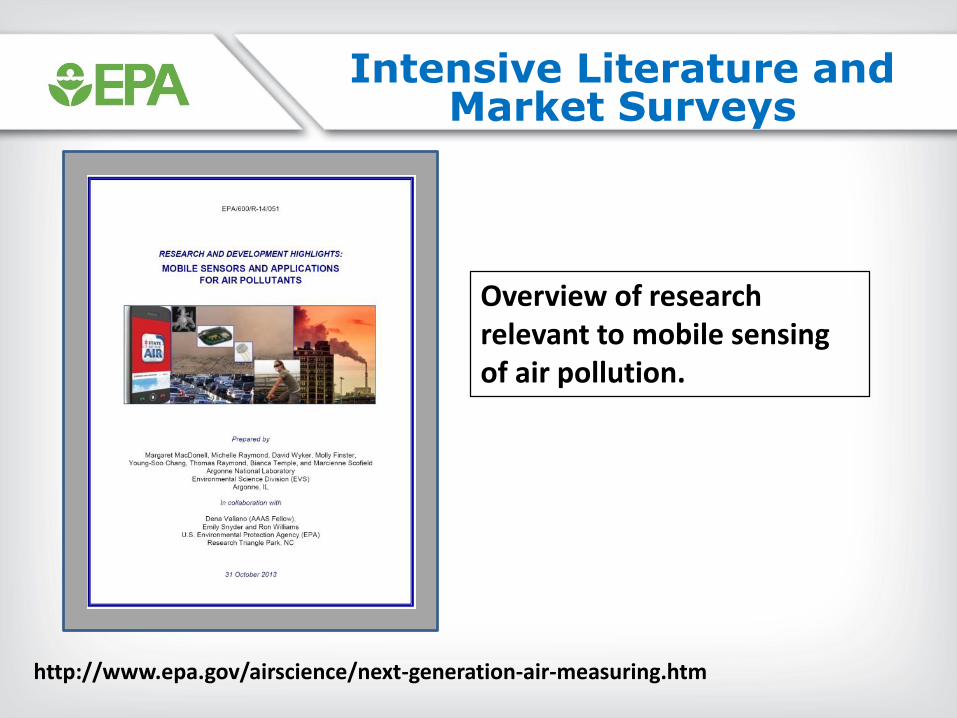
Intensive Literature and Market Surveys
http://www.epa.gov/airscience/next-generation-air-measuring.htm
Overview of research relevant to mobile sensing of air pollution.
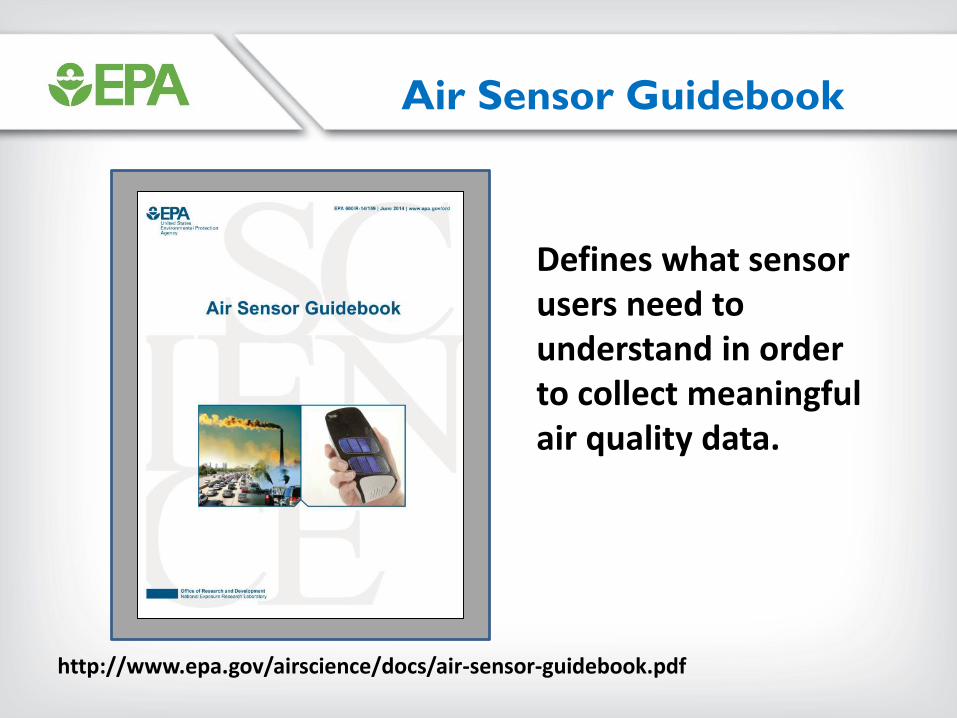
Air Sensor Guidebook
http://www.epa.gov/airscience/docs/air-sensor-guidebook.pdf
Defines what sensor users need to understand in order to collect meaningful air quality data.
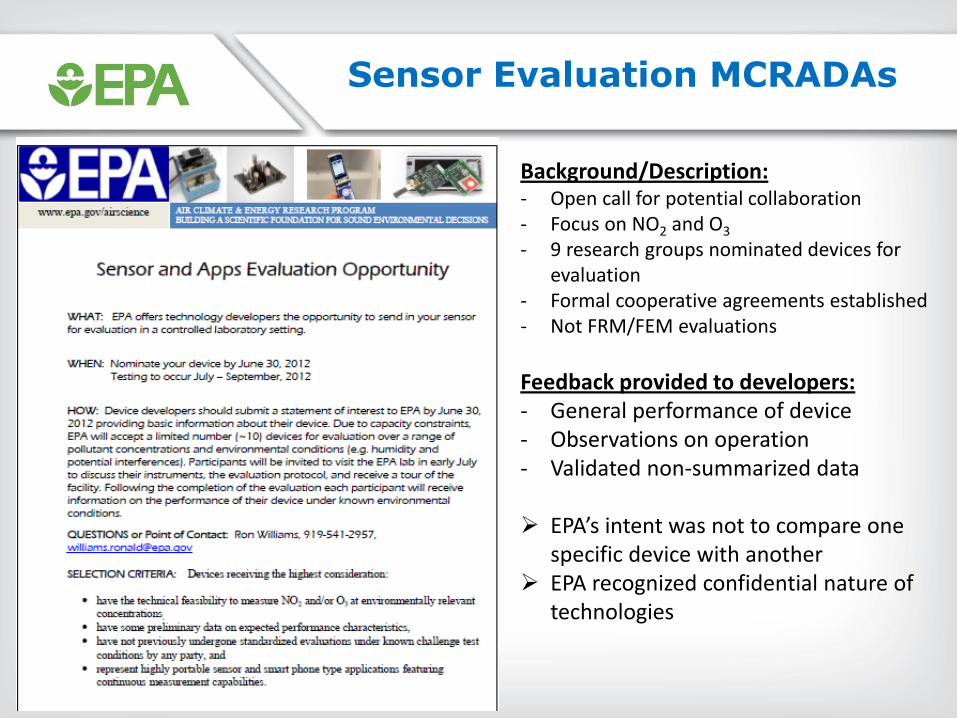
Sensor Evaluation MCRADAs
Background/Description:- Open call for potential collaboration- Focus on NO2 and O3
- 9 research groups nominated devices for evaluation
- Formal cooperative agreements established- Not FRM/FEM evaluations
Feedback provided to developers:- General performance of device- Observations on operation- Validated non-summarized data
EPA’s intent was not to compare one specific device with another
EPA recognized confidential nature of technologies
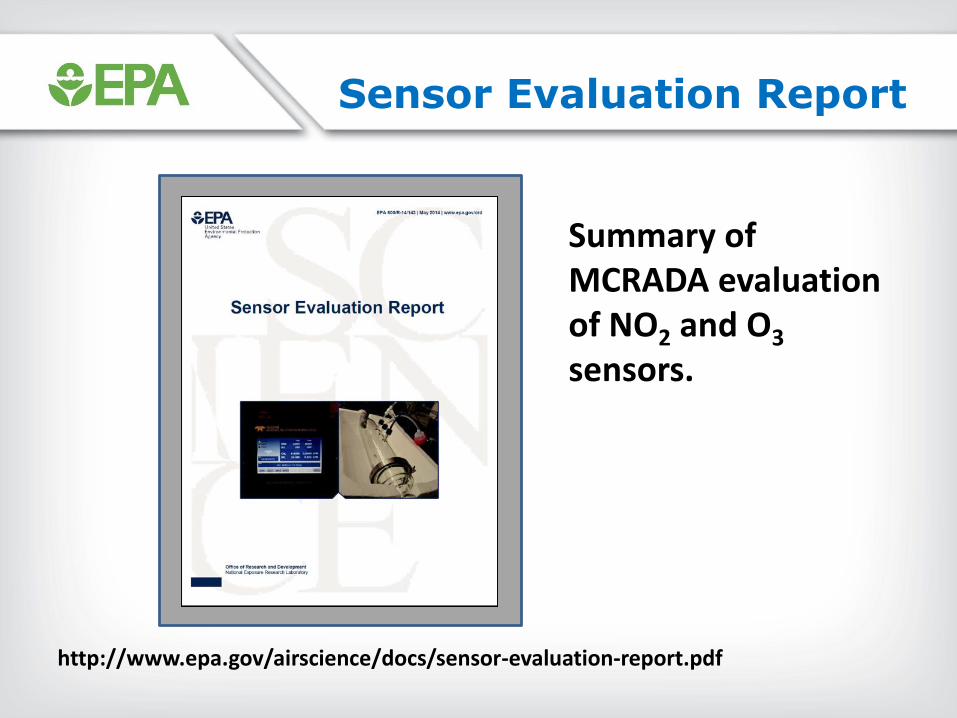
Sensor Evaluation Report
http://www.epa.gov/airscience/docs/sensor-evaluation-report.pdf
Summary of MCRADA evaluation of NO2 and O3
sensors.
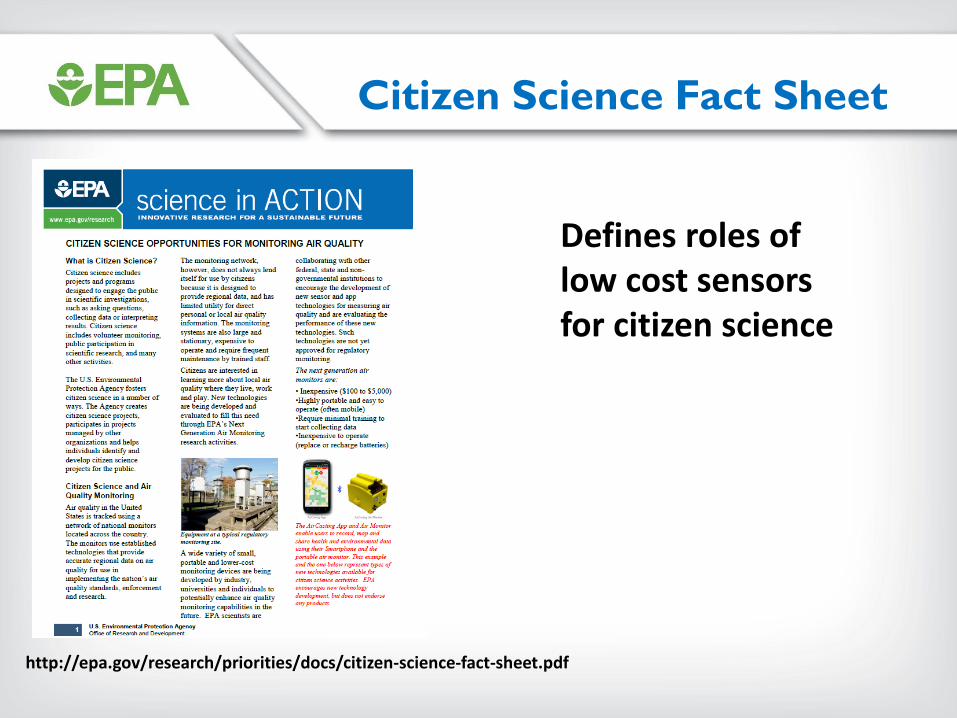
Citizen Science Fact Sheet
Defines roles of low cost sensors for citizen science
http://epa.gov/research/priorities/docs/citizen-science-fact-sheet.pdf
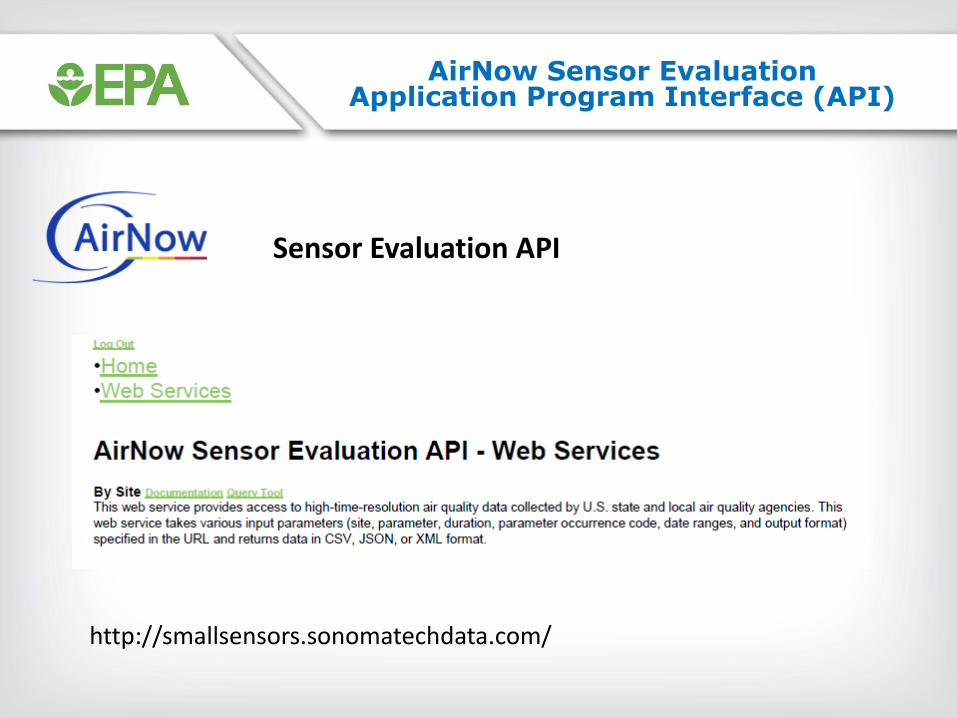
AirNow Sensor Evaluation Application Program Interface (API)
Sensor Evaluation API
http://smallsensors.sonomatechdata.com/
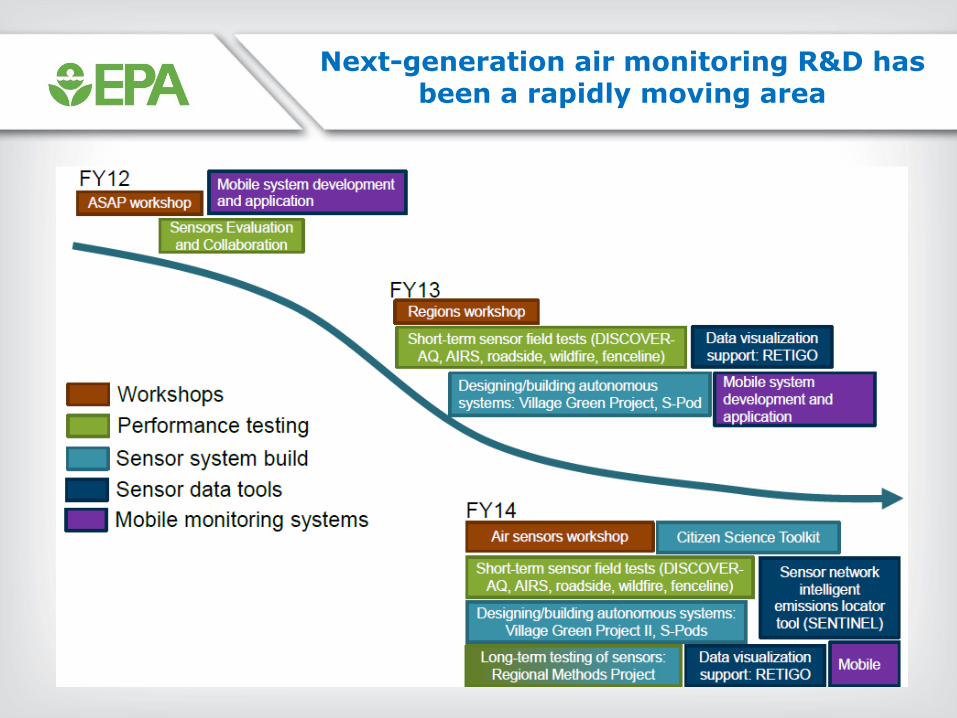
Next-generation air monitoring R&D has been a rapidly moving area
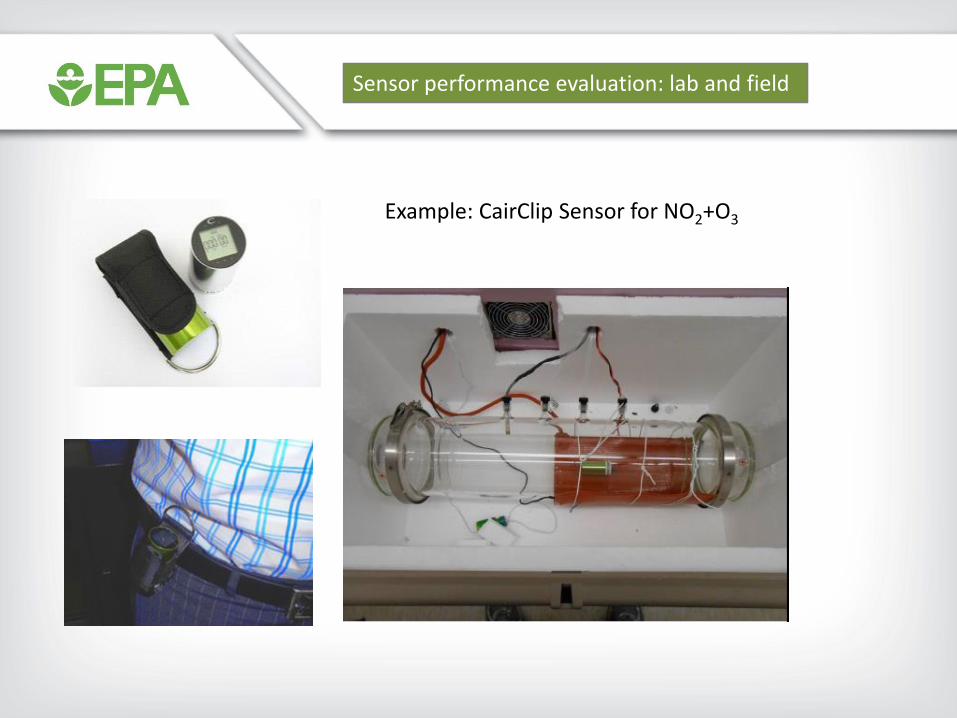
Sensor performance evaluation: lab and field
Example: CairClip Sensor for NO2+O3
Sensor performance evaluation: lab and field
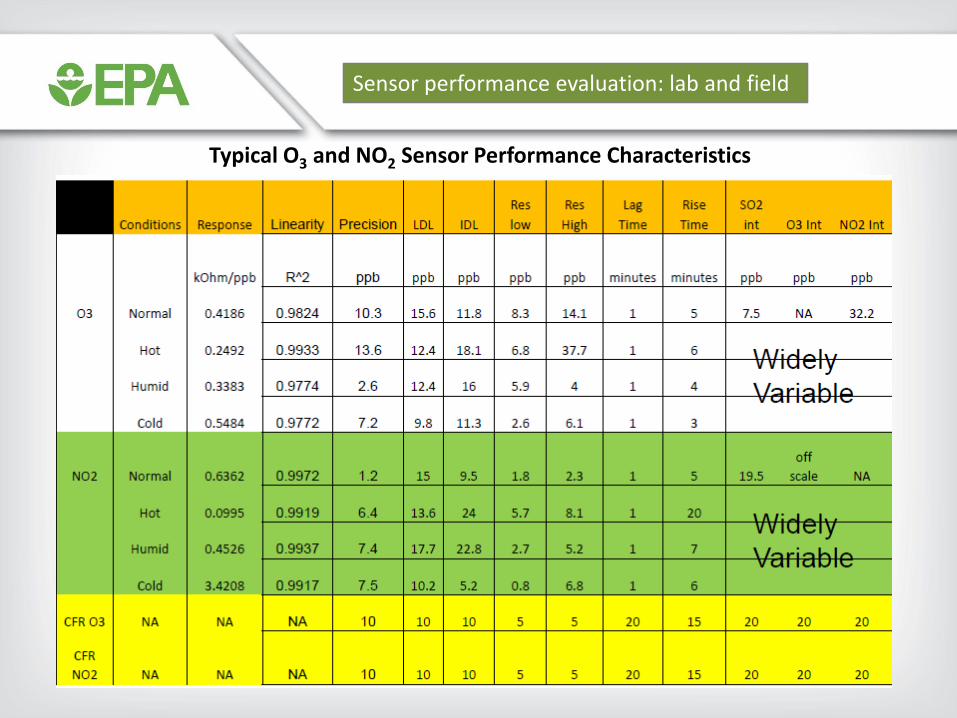
Typical O3 and NO2 Sensor Performance Characteristics
Sensor performance evaluation: lab and field
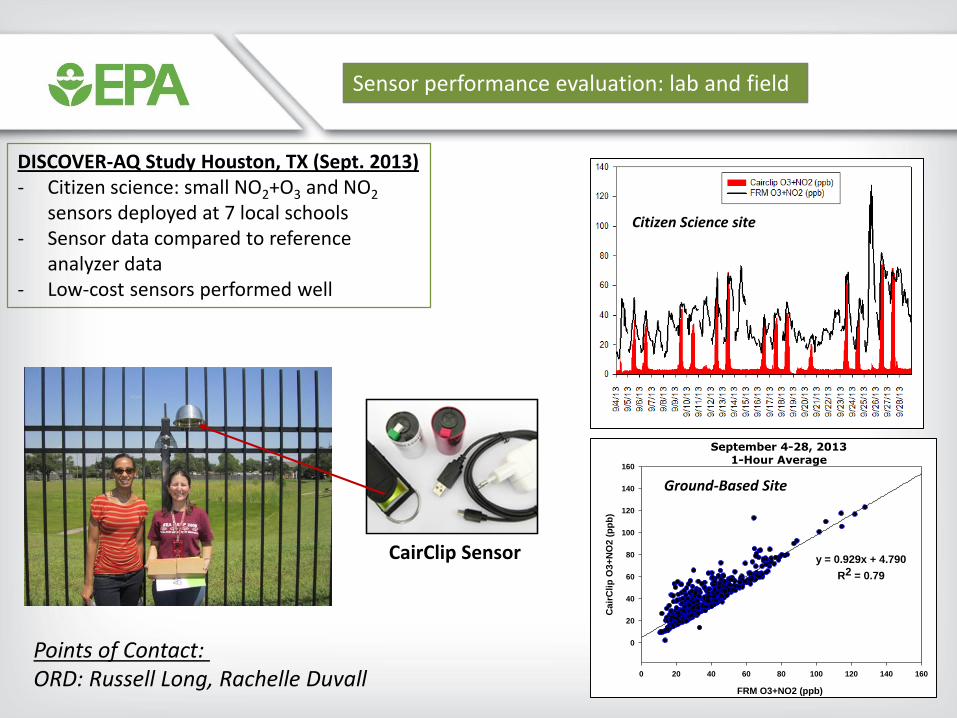
DISCOVER-AQ Study Houston, TX (Sept. 2013)- Citizen science: small NO2+O3 and NO2
sensors deployed at 7 local schools- Sensor data compared to reference
analyzer data- Low-cost sensors performed well
CairClip Sensor
September 4-28, 20131-Hour Average
FRM O3+NO2 (ppb)
0 20 40 60 80 100 120 140 160
Ca
irC
lip
O3
+N
O2
(p
pb
)
0
20
40
60
80
100
120
140
160
y = 0.929x + 4.790
R2 = 0.79
Citizen Science site
Ground-Based Site
Points of Contact: ORD: Russell Long, Rachelle Duvall
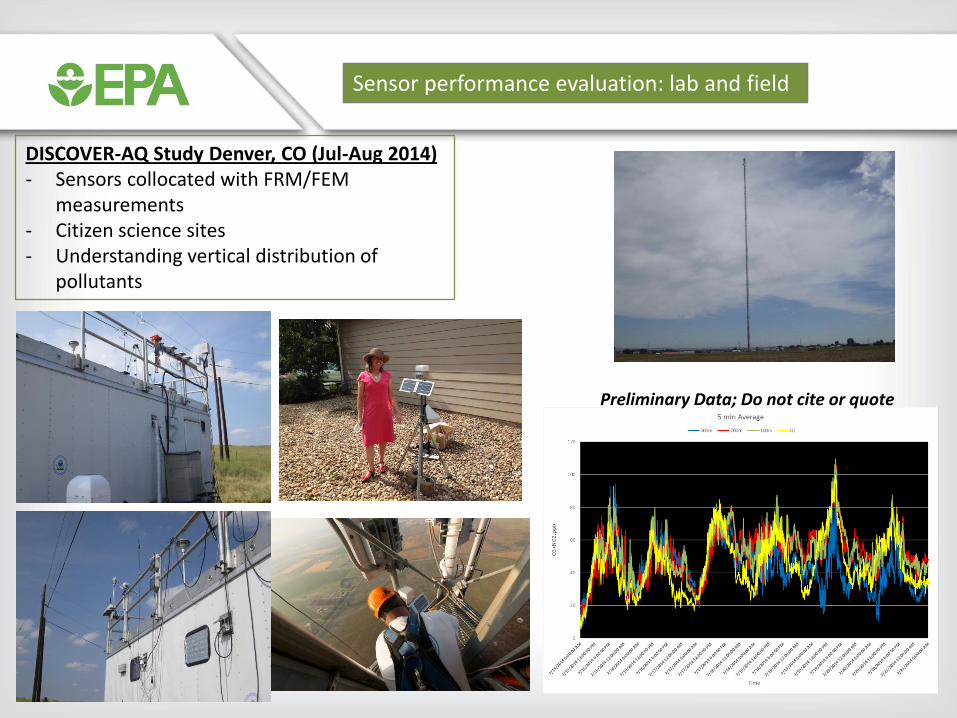
Sensor performance evaluation: lab and field
DISCOVER-AQ Study Denver, CO (Jul-Aug 2014)- Sensors collocated with FRM/FEM
measurements- Citizen science sites- Understanding vertical distribution of
pollutants
Preliminary Data; Do not cite or quote
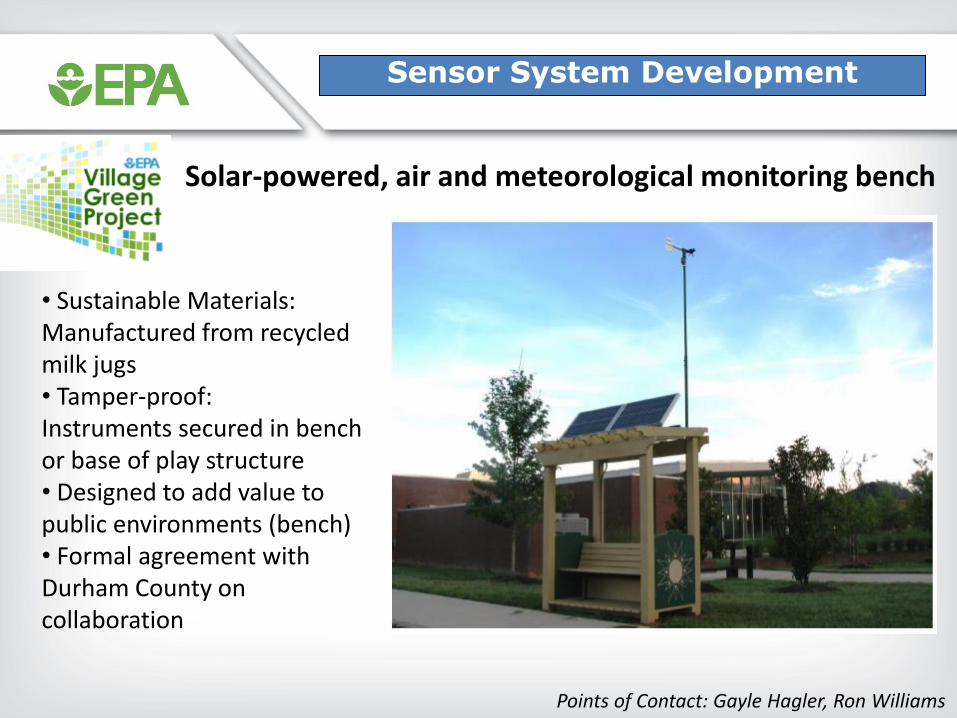
Sensor System Development
• Sustainable Materials: Manufactured from recycled milk jugs• Tamper-proof: Instruments secured in bench or base of play structure• Designed to add value to public environments (bench)• Formal agreement with Durham County on collaboration
Solar-powered, air and meteorological monitoring bench
Points of Contact: Gayle Hagler, Ron Williams
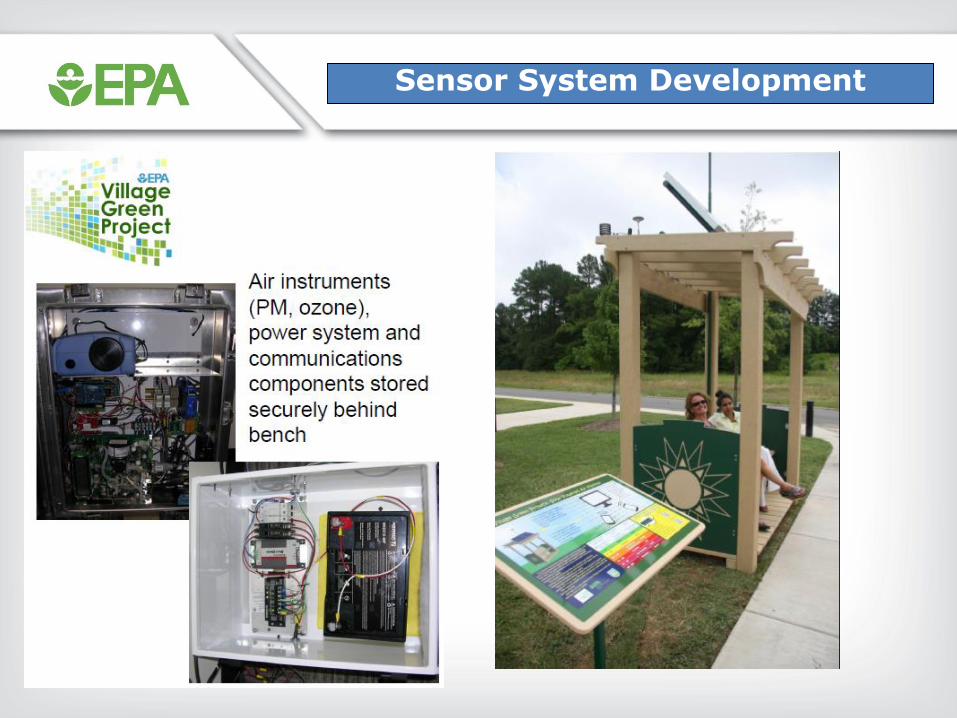
Sensor System Development
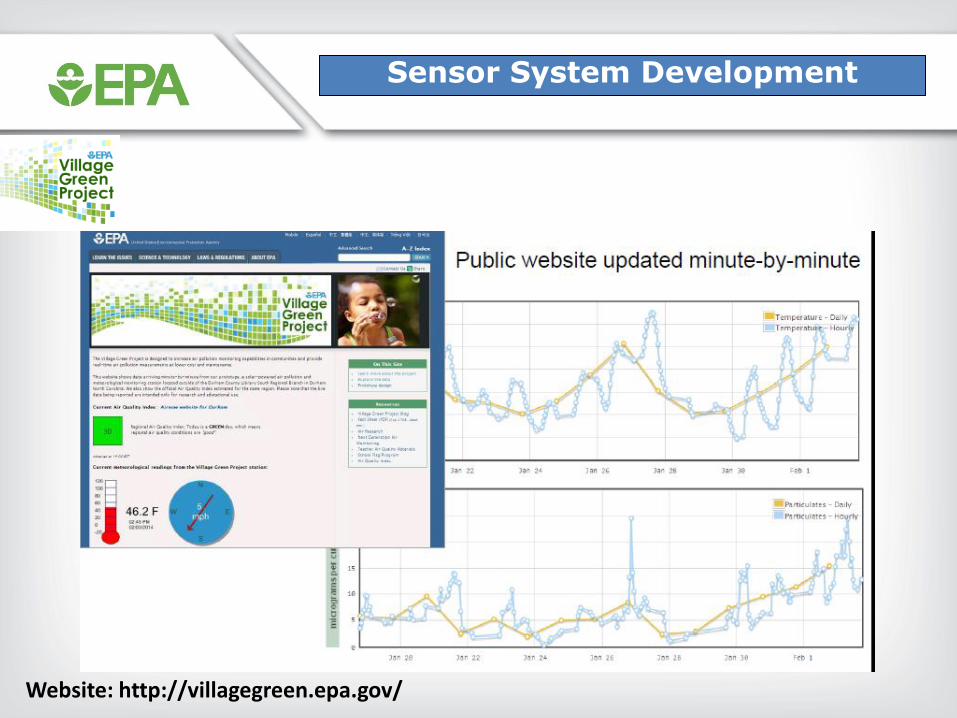
Website: http://villagegreen.epa.gov/
Sensor System Development
Sensor System Development
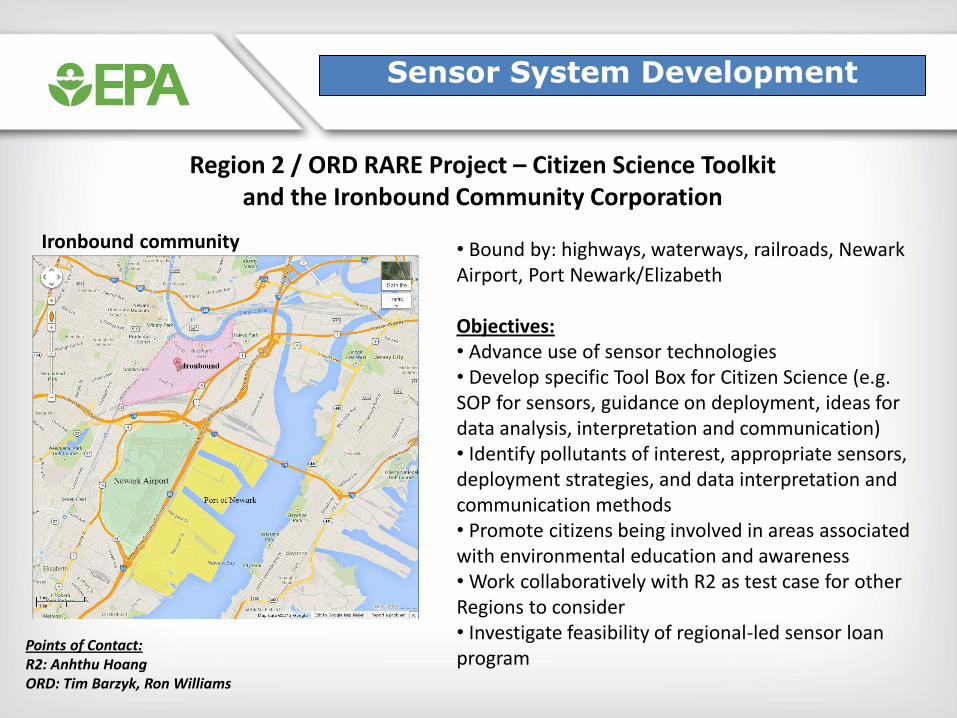
Region 2 / ORD RARE Project – Citizen Science Toolkit and the Ironbound Community Corporation
Ironbound community • Bound by: highways, waterways, railroads, Newark Airport, Port Newark/Elizabeth
Objectives:• Advance use of sensor technologies• Develop specific Tool Box for Citizen Science (e.g. SOP for sensors, guidance on deployment, ideas for data analysis, interpretation and communication)• Identify pollutants of interest, appropriate sensors, deployment strategies, and data interpretation and communication methods• Promote citizens being involved in areas associated with environmental education and awareness• Work collaboratively with R2 as test case for other Regions to consider• Investigate feasibility of regional-led sensor loan program
Points of Contact:R2: Anhthu HoangORD: Tim Barzyk, Ron Williams
Sensor System Development
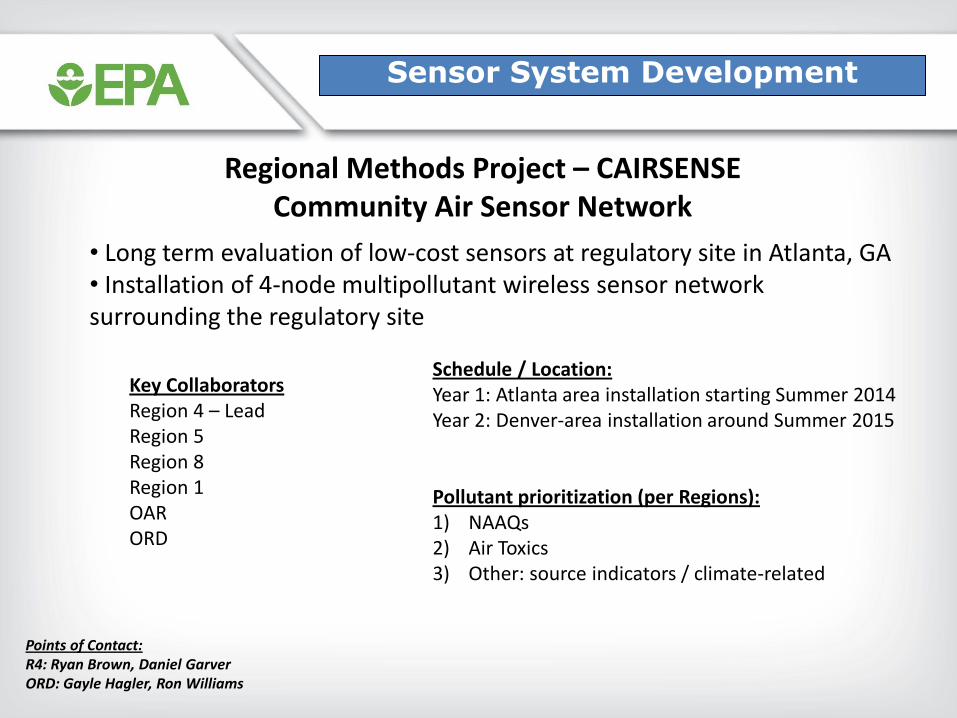
Regional Methods Project – CAIRSENSE Community Air Sensor Network
Key CollaboratorsRegion 4 – LeadRegion 5Region 8Region 1OARORD
• Long term evaluation of low-cost sensors at regulatory site in Atlanta, GA• Installation of 4-node multipollutant wireless sensor network surrounding the regulatory site
Points of Contact:R4: Ryan Brown, Daniel GarverORD: Gayle Hagler, Ron Williams
Schedule / Location:Year 1: Atlanta area installation starting Summer 2014Year 2: Denver-area installation around Summer 2015
Pollutant prioritization (per Regions):1) NAAQs2) Air Toxics3) Other: source indicators / climate-related
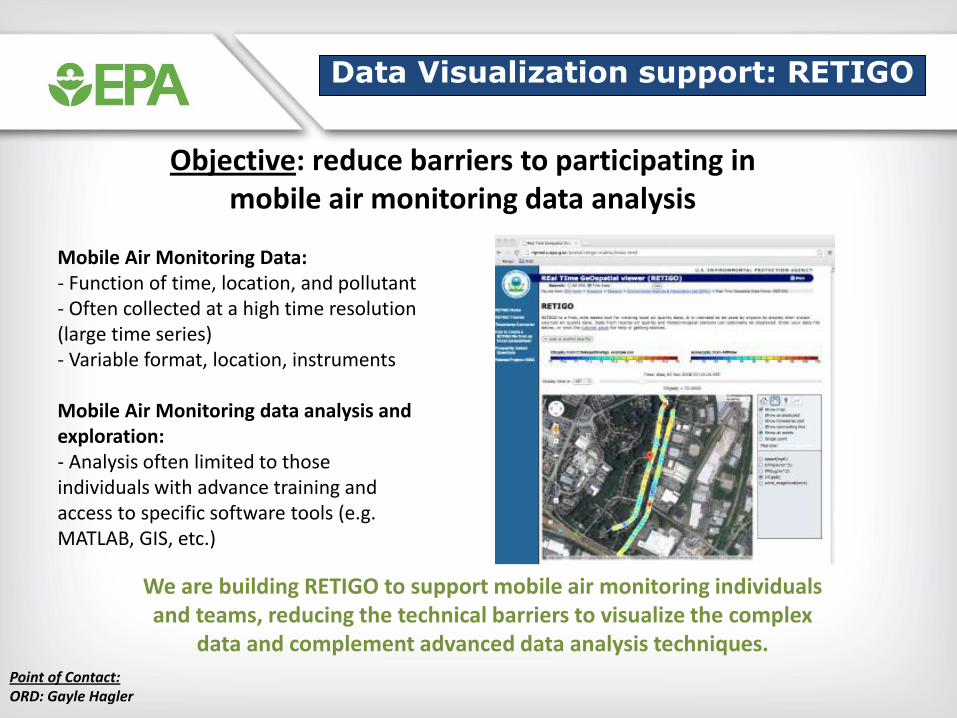
Data Visualization support: RETIGO
Objective: reduce barriers to participating in mobile air monitoring data analysis
Mobile Air Monitoring Data:- Function of time, location, and pollutant- Often collected at a high time resolution (large time series)- Variable format, location, instruments
Mobile Air Monitoring data analysis and exploration:- Analysis often limited to those individuals with advance training and access to specific software tools (e.g. MATLAB, GIS, etc.)
We are building RETIGO to support mobile air monitoring individuals and teams, reducing the technical barriers to visualize the complex
data and complement advanced data analysis techniques.
Point of Contact:ORD: Gayle Hagler
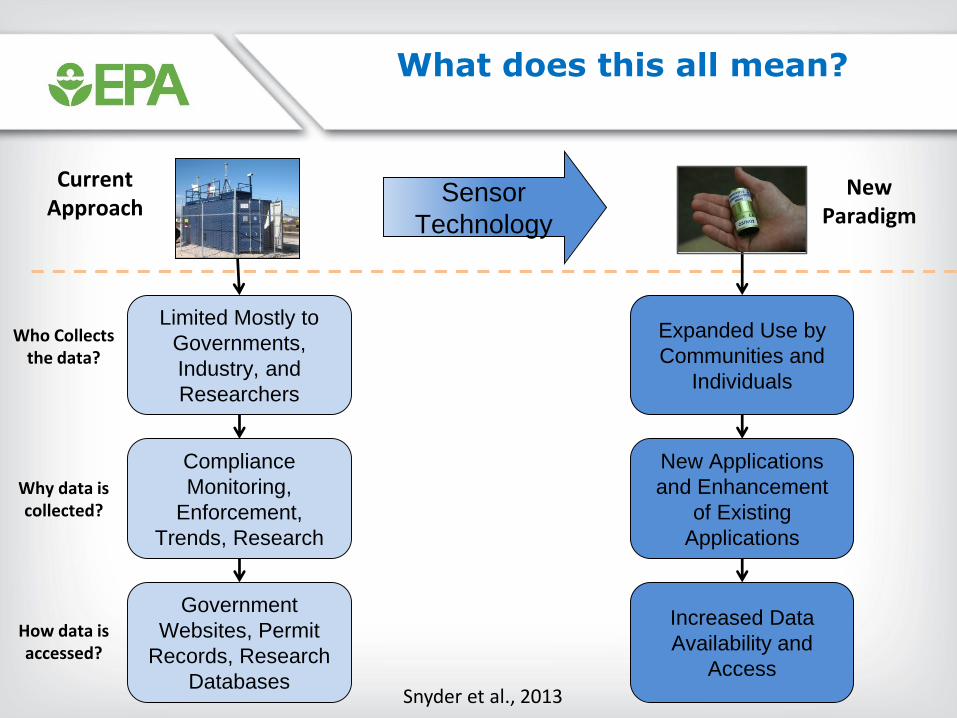
What does this all mean?
26
Current Approach
Who Collects the data?
How data is accessed?
Limited Mostly to
Governments,
Industry, and
Researchers
Government
Websites, Permit
Records, Research
Databases
Compliance
Monitoring,
Enforcement,
Trends, Research
Why data is collected?
Expanded Use by
Communities and
Individuals
Increased Data
Availability and
Access
New Applications
and Enhancement
of Existing
Applications
Sensor
Technology
Snyder et al., 2013
NewParadigm
Ongoing and FutureWork at EPA
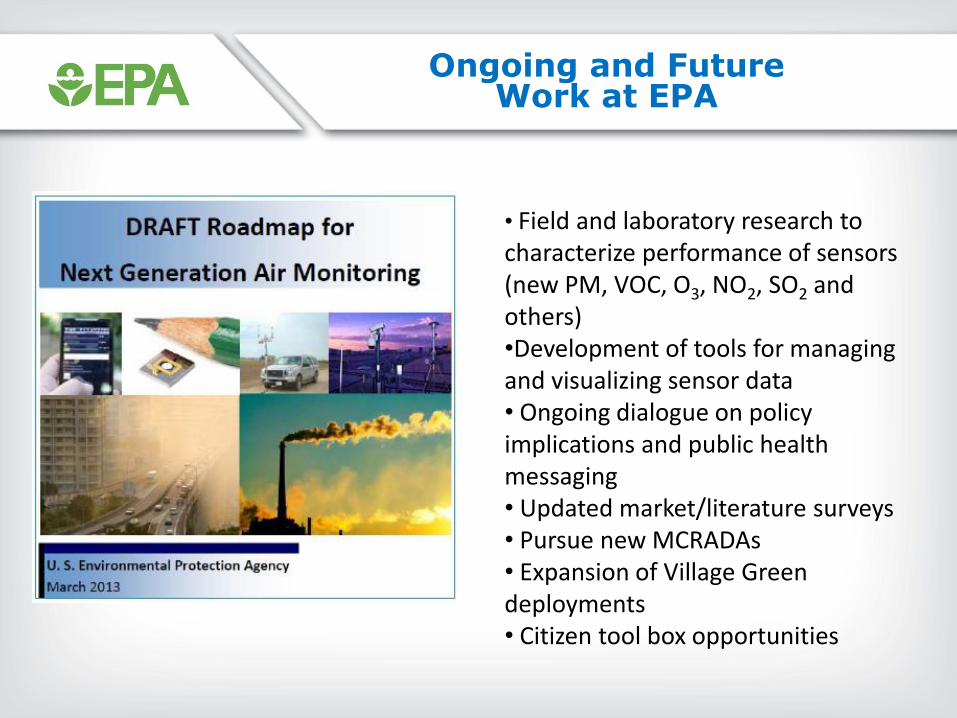
• Field and laboratory research to characterize performance of sensors (new PM, VOC, O3, NO2, SO2 and others)•Development of tools for managing and visualizing sensor data• Ongoing dialogue on policy implications and public health messaging• Updated market/literature surveys• Pursue new MCRADAs• Expansion of Village Green deployments• Citizen tool box opportunities
Acknowledgments
EPA ORD staff: Gayle Hagler, Ron Williams, Eben Thoma, Brian Gullet, Russell Long, Melinda Beaver, Eric Hall, Bill Mitchell, Bill Squier, Tim Watkins, Lindsay Stanek, VasuKilaru, Paul Solomon, Stacey Katz, Gail Robarge, Peter Preuss, Emily Snyder, Ann Brown, Kelly Leovic
Postdocs, student service contractors and interns: Wan Jiao, Xiaochi Zhou, Dana Buchbinder*, Rachel Clark*, Amanda Kaufman, Karoline Johnson* (*now in new positions)
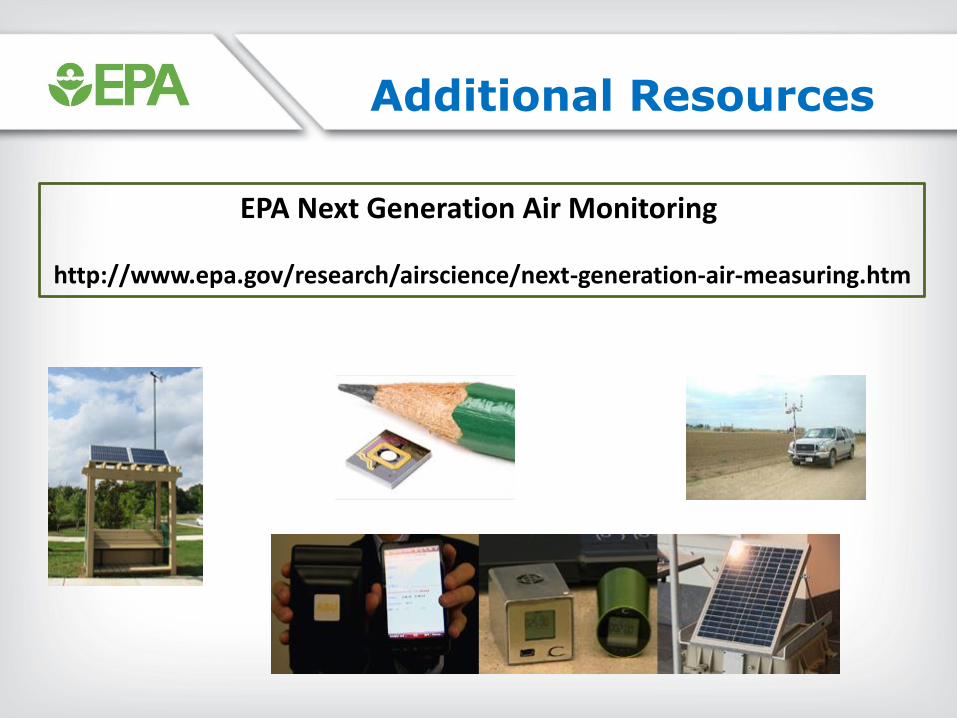
Additional Resources
EPA Next Generation Air Monitoring
http://www.epa.gov/research/airscience/next-generation-air-measuring.htm