Embed Size (px)
Citation preview

Sociological Perspectives, Volume 47, Number 2, pages 161–187.Copyright © 2004 by Pacific Sociological Association. All rights reserved.Send requests for permission to reprint to: Rights and Permissions, University of California Press, Journals Division, 2000 Center St., Ste. 303, Berkeley, CA 94704-1223.ISSN: 0731-1214; online ISSN: 1533-8673
RACE, FAMILY STRUCTURE, AND WEALTH:THE EFFECT OF CHILDHOOD FAMILY ON
ADULT ASSET OWNERSHIP
LISA A. KEISTER*
The Ohio State University
ABSTRACT:
Racial differences in wealth ownership are among themost extreme and persistent forms of stratification in the United States,but the factors that contribute to this inequality are unclear. One poten-tially important contributing factor is family background. It is a criticaldeterminant of attainment, and both childhood family resources and fam-ily structure vary racially. This article reports that family size duringchildhood contributes significantly to racial differences in adult wealth. Ifind that siblings strain material and nonmaterial resources duringchildhood and decrease adult home ownership, stock ownership, and totalassets. Having extended family in the home also decreases wealth forthose from intact families, but an extended family minimizes the nega-tive effect of divorce and separation and increases wealth in disruptedfamilies. I also find that childhood family size and family structure arerelated to racial differences in adult wealth accumulation trajectories,allowing whites to begin accumulating high-yield assets earlier in life.The results provide insight into the role of family background in creatingand maintaining inequality, particularly racial stratification in wealthownership.
Racial inequality in wealth ownership is among the most extreme and persis-tent forms of stratification in the United States, and although there is abundantevidence of this, the processes that create these racial disparities continue toelude researchers (Conley 1999; Keister 2000a; Oliver and Shapiro 1995). Blacksand Hispanics, in particular, own considerably less wealth than do whites. In1992, while median black income was about 60 percent of median whiteincome, median net worth for blacks was only 8 percent of that for whites. Inthe same year, 25 percent of white families had zero or negative assets, butmore than 60 percent of black families had no wealth (Oliver and Shapiro1995). Longitudinal estimates suggest that between 1960 and 1995, whites were
* Direct all correspondence to: Lisa A. Keister, Department of Sociology, The Ohio State University, 300 Bricker Hall,
190 North Oval Mall, Columbus, OH 43210;

162 SOCIOLOGICAL PERSPECTIVES Volume 47, Number 2, 2004
twice as likely as minorities to have more wealth than income and nearly threetimes as likely to experience wealth mobility (Keister 2000b). Minorities arealso underrepresented among the very wealthy. In 1995, 95 percent of thosein the top 1 percent of wealth holders were white, while only 1 percent wereblack (Keister 2000b; Wolff 1998). The wealth position of other minorities hasattracted less attention, but there is evidence that the wealth of whites alsoexceeds that of Hispanics and Asians (Campbell and Kaufman 2000; Wolff1998).
Racial differences in family background are a potentially important cause ofdisparities in wealth ownership. However, research on wealth seldom considersfamily processes or family structure in its efforts to explain racial differences inwealth accumulation. There are clear racial differences in family structure. Notably,fertility, overall family size, and marital disruption are significantly greater amongracial minorities than among whites (Horton and Thomas 1998; Ruggles 1994;Wilson 1987). There is also evidence that family structure during childhood shapeswell-being and attainment both during childhood and in adulthood. Sibship size(number of siblings) and the occurrence of parental marital disruptions, for ex-ample, decrease educational and occupational attainment and increase the like-lihood of poverty (McLanahan 1985; Sandefur and Wells 1999). In large families,resources are diluted, and children subsequently do not perform well in schooland later life (Downey 1995b). Similarly, family disruptions interrupt educationand learning, distract parents, dilute resources, and ultimately decrease children’sattainment (Hanson and McLanahan 1998). Family size and disruptions are likelyto affect adult wealth accumulation in similar ways, and research on wealth occa-sionally references this possibility. Yet efforts to explain racial inequality in wealthownership focus almost exclusively on the role of income, investment behavior,and inheritance, without systematically examining the importance of family back-ground (Blau and Graham 1990; Chiteji and Stafford 1999; Menchik and Jianakoplos1997).
This article investigates the relationship between childhood family structureand racial differences in adult wealth ownership. I argue that family backgroundis a critically important, albeit often overlooked, determinant of adult wealth. Ipropose that family size, the presence of extended family, and family disruptionduring childhood all contribute to adult wealth ownership and racial wealth in-equality. Parental resources and human capital improve a child’s adult wealth,while siblings and extended family dilute family resources and reduce wealthattainment. Similarly, I argue that family disruption during childhood reducesadult wealth, although extended family can minimize the negative impact ofdivorce and separation. Because family structure traits that are negatively relatedto wealth ownership occur more frequently in minority families, family structureis likely to be an important cause of racial differences in wealth ownership. I usethe National Longitudinal Survey of Youth 1979 cohort (NLS-Y) to explore theseideas empirically. Results of standard regression analyses and sequence analysesof savings trajectories provide new insight into the role of family processes andfamily background in creating and maintaining inequality, particularly racial in-equality in wealth ownership.

Race, Family Structure, and Wealth
163
FAMILY BACKGROUND AND WEALTH
From Individual Traits to Family Background
Previous research on wealth inequality focuses on the role of adult human cap-ital and historic discrimination in shaping asset accumulation. The study ofwealth has largely been the purview of economists, who emphasize the effect ofeducation, current income, and work behavior (Danziger and Gottschalk 1993;Kennickell and Kwast 1997; Wolff 1998). Typical of human capital arguments, thetheoretical basis for these claims is that individual traits improve decision makingregarding saving, investment, and the acquisition of debt (Wolff 1995a, 1998).Research in this tradition does consider racial differences in wealth, but race isconceived of almost exclusively as fostering or impeding adult human capital(Wolff 1995b). Sociologists emphasize the importance of discrimination in housingand mortgage lending and differential appreciation of real estate (Oliver and Sha-piro 1995). While individual attributes and discrimination are important, researchon wealth has not moved beyond these to explore other processes that affectwealth inequality (Keister and Moller 2000).
Yet family background may be an important determinant of adult wealth andracial wealth inequality. Childhood financial family resources directly increasewealth in adulthood when parents make
inter-vivos
(while they are still living)transfers to their children and when they leave an inheritance. Similarly, nonmaterialresources such as parents’ time and attention can increase adult wealth by improv-ing human capital, social networks, and other important skills that translate intoadult wealth. Because family background varies considerably by race, racial differ-ences in wealth ownership may be attributable to family size and family structure.
Family Size
If financial resources in childhood increase adult wealth, it follows that pro-cesses that strain or dilute these resources will have the opposite effect on wealth.Family size, in particular, is likely to reduce the resources available to each familymember and to diminish the attainment these resources can produce. In largerfamilies, parents have fewer resources to invest in each child, and each child con-sequently fares worse both immediately and over time (Blake 1989). Research oneducational attainment demonstrates that as family size increases, material resources,parental attention and intervention, and opportunities are reduced (Blake 1981;Hill and Stafford 1978; Stafford 1996). There are fewer material resources such ashome quality, funds for education, space to study, and access to books and news-papers in larger families (Blake 1981; Teachman 1987). Children from larger fami-lies are also less likely to take dance and music lessons, to travel out of the UnitedStates, or to have other stimulating educational experiences (Blake 1989). Non-material resources are similarly diluted in larger families. Parental involvement,encouragement, intervention, and opportunities to engage the world are all vitalto well-being, and these are less available to children in larger families than tothose in smaller families. As a result, people from large families perform worse inschool and attain lower levels of education (Downey 1995b).

164 SOCIOLOGICAL PERSPECTIVES Volume 47, Number 2, 2004
For many of the same reasons that the dilution of material and nonmaterialresources in larger families reduces children’s attainment in other areas such aseducation, family size is likely to reduce adult wealth accumulation (Keister2003b). First, as family size increases, there will be fewer financial resources avail-able during childhood. Financial resources improve educational opportunities,make educational resources such as books and other materials more readily avail-able, provide support during college, and ease life transitions. Exposure to othereducational experiences, access to newspapers and books, space to study, thepresence of a computer in the home, music and dance lessons, foreign travel, andother experiences are also enhanced where financial resources are sufficient(Blake 1989; Downey 1995b). Financial resources make college more feasible andcan prevent children from having to acquire debt as they complete higher educa-tion. Other life transitions may also be easier for children whose parents have rel-atively high resources. If their resources are adequate, parents may aid their chil-dren in purchasing a first home, in establishing a household after marriage, and inpreparing for and taking care of children. To the extent to which these resourcesallow children to avoid debt and to begin accumulating assets, the starting pointin wealth accumulation and the rate at which wealth is amassed across the lifecourse will be lower in children from larger families.
Second, family size reduces inter-vivos transfers and inheritance (Keister 2003b).Any direct transfer of financial resources from parents to children has the poten-tial to provide a base for savings that can grow even if additional savings arenever added. In larger families, if there are any assets to be transferred, each childwill receive a smaller portion. Receiving fewer resources from parents postponesthe age at which wealth accumulation can begin and reduces overall wealth accu-mulation, because long-term compounding has less time to increase asset values.Children who receive fewer financial resources directly from their parents alsoown different assets and debts as adults. Inherited wealth is often used to make adown payment on a home, and a home is the most typical first investment forAmericans, who tend to postpone investing in stocks, mutual funds, and bondsuntil they have purchased a home (Keister 2000b). Those who receive assets fromtheir parents are therefore more likely to own both a home and other financialassets and, as a result, to accumulate wealth more quickly. Because even a rela-tively small inheritance can substantially increase the likelihood of home owner-ship, inheritance can create a stable base for saving across the life course. Pro-cesses that reduce or eliminate inheritance can have an equally negative effect onadult wealth.
Third, nonmaterial resources, including parents’ time, energy, and encourage-ment, will be reduced in larger families (Blake 1981, 1989). In large families, par-ents have less time to help children with homework, to create educational oppor-tunities, to provide encouragement, and to otherwise nurture and give positivereinforcement. Similarly, when there are more children competing in negativeways for attention (e.g., being rebellious, having problems at school), parentshave less time to intervene. Children’s opportunities to engage the world and tobecome involved in meaningful activities that feed into later life outcomes mayalso be fewer in large families. Similarly, educational experiences are more rare

Race, Family Structure, and Wealth
165
and the time parents have to reinforce the value of these experiences is less inlarge families (Keister 2003b). Researchers have shown that these nonmaterialresources are critical for children’s development and can shape adult attainment.In their absence, attainment is likely to be reduced (e.g., Blake 1981).
Of course, there are some important nuances to this argument that need to beconsidered. Economies of scale, for example, in the provision of educational mate-rials, might diminish the effect of siblings on adult outcomes. In families withmany children, sharing educational tools such as books and computer resourcesmight diminish the effect of family size. Likewise, it is possible for parents to pro-vide educational experiences such as library trips for several children as inexpen-sively as for one child. Another caveat to this argument is that low-income par-ents might be more likely to help with child care if their opportunities for doingso are not high. Moreover, previous research has found evidence that siblingsimprove adult outcomes (Chetiji and Hamilton 2001; Guo and VanWey 1999;Henretta 1984). These factors may indeed diminish the effect of family size onadult wealth. However, the bulk of previous research on family background andadult attainment suggests that, on balance, it is likely that siblings reduce adultattainment. Consistent with this argument, I propose that family size will reduceadult wealth. That is, I expect that
people from larger families will accumulate lesswealth as adults. Moreover, because blacks and Hispanics tend to come from larger fami-lies, family size is likely to contribute to racial differences in wealth ownership.
1
Family Size and Poverty
If the relationship between family size during childhood and adult wealth islargely a result of resource dilution, the effect of family size will be noticeable onlywhen the family has sufficient resources to strain. More precisely, the negativeeffect of siblings is likely to be evident where financial resources exceed familyneeds because it is not until this point that resource dilution can take effect. Atlower levels of family resources, there are insufficient resources to dilute, and theeffect of additional siblings will be a strain but is unlikely to reduce adult wealthaccumulation noticeably. The effect of family size in childhood on adult wealth isalso likely to diminish at high levels of financial resources where additionalstrains are more easily absorbed financially. Thus, I expect that the effect of familysize on adult wealth is likely to vary with the level of financial resources availablein the childhood family.
That is, the negative effect of family size on adult wealth willbe particularly severe for those whose financial resources exceed their needs but will bediminished at high levels of financial resources. Because blacks and Hispanics are morelikely to have grown up in poverty, this process is likely to account for an additional por-tion of racial differences in adult wealth.
Sibship size is also likely to be related to offspring attitudes toward consump-tion and to indirectly affect wealth accumulation even at constant levels of mate-rial and nonmaterial resources. By definition, people who save have a propensityto postpone consumption. In contrast, those with a low propensity to save exhibitother similar behaviors. For example, the strong positive relationship betweeneducational attainment and wealth accumulation has been partially attributed to

166 SOCIOLOGICAL PERSPECTIVES Volume 47, Number 2, 2004
this preference for delayed consumption, and those who are upwardly mobilehave been described as having a relatively strong preference for delayed gratifica-tion (Dynan 1993). Although the relationship is difficult to measure, couples withlarge numbers of children may have a preference for more immediate consump-tion (Friedman, Hechter, and Kanazawa 1994). In these families, children are lesslikely to learn to postpone consumption and to save, and their ability to accumu-late wealth as adults will be lower as a result.
Thus, it follows that family size will beassociated with adult wealth even at constant levels of family resources.
Family Disruption and Extended Family
There is evidence that parents’ separation or divorce decreases children’s well-being both during childhood and into adulthood (Baydar 1988; Cooksey 1997;Demo and Acock 1988; McLanahan and Sandefur 1994). Experiencing divorce orseparation decreases performance in school, reduces educational attainment(Downey 1995a; Houseknecht and Spanier 1980), and ultimately decreases occu-pational attainment and mobility (Biblarz and Raftery 1993). These children areless healthy both physically (Horwitz, White, and Howell-White 1996) and men-tally (Cherlin, Chase-Lansdale, and McRae 1998) than those from intact families.There are also economic costs of experiencing marital dissolution. Divorce increasespoverty rates (Duncan and Hoffman 1985; McLanahan and Sandefur 1994; Nestel,Mercier, and Shaw 1983) and decreases per capita income (Cherlin 1981; Mott andMoore 1978; Peterson 1996), labor force participation (Cherlin 1979), and the ratioof income-to-needs (Corcoran 1995), particularly for women (Holden and Smock1991; Stirling 1989).
Because divorce and separation reduce school performance, educational attain-ment, occupational mobility, and health, there is likely to be an indirect effect ofdivorce and separation on wealth through these other processes. Divorce and sep-aration are also likely to decrease direct transfers of assets from parents to chil-dren because financial resources will be spread across two households. If eitherparent does not remarry or marries a person with few independent financialresources, the resources available to that parent will be diluted. Resources mayalso be strained by settling financial disputes between parents, which can furtherreduce the resources that are devoted to raising children or transferred directly tothem as financial assets. In addition, parental divorce and separation are likelyto take an emotional toll on children that may decrease adult attainment, includ-ing wealth accumulation. Finally, family disruption may reduce the time parentshave available to nurture children, to create stimulating educational experiences,or to intervene when they have problems (Mechanic and Hansell 1989).
Thus, Ianticipate that experiencing parents’ divorce or separation as a child will be associatedwith lower adult wealth. Because black and Hispanic children are disproportionatelyaffected by family disruption, this is likely to affect race-based wealth inequality.
Research on poverty suggests, however, that the negative effect of a family cri-sis such as divorce or separation may be lessened when the child is part of a largerfamily network (Marks 1991). In intact families, extended family members living inthe home are likely to dilute resources and reduce children’s long-term attainment.

Race, Family Structure, and Wealth
167
Additional family members reduce the resources that can be devoted to eachchild and have a long-term negative effect on the child’s wealth. An importantexception is that extended family may provide emotional support and contributeadditional financial resources that lessen the negative long-term effect of divorceor separation. There is a tradition of qualitative research arguing that extendedfamily can alleviate the effects of poverty for these reasons, and quantitativeexplorations of the effect have provided some support for this argument (Stack1974). The effect of extended family on long-term wealth accumulation patternshas not been explored, but it is likely that extended family in the householdaffects asset accumulation in similar ways. Of course, extended family in nonin-tact families might also dilute resources. However, the positive effect of extendedfamily is likely to outweigh the negative effect they might have on resources(Stack 1974). Likewise, extended family members in intact households may have apositive effect, but the effect is less noticeable because the need for intervention islower.
For these reasons, I anticipate that the presence of extended family in the householdin intact families will decrease children’s adult wealth ownership, but extended family willincrease children’s adult wealth if there is a divorce or separation in the family. Once again,these processes are likely to contribute to racial inequality in adult wealth as black and His-panic children are more likely to spend time with extended family members in the home.
RESEARCH DESIGN
Data
I used the National Longitudinal Survey of Youth 1979 cohort to test theseideas. The NLS-Y is a nationally representative longitudinal survey that wasadministered eighteen times between 1979 and 1998 by the Bureau of Labor Sta-tistics (BLS). The initial NLS-Y sample contained 12,686 individuals age fourteento twenty-two in 1979 (i.e., born between 1957 and 1964). The sample had threecomponents: a nationally representative sample; a supplemental sample of poorwhite, black, and Hispanic youth; and a supplemental sample of military members.Nearly 10,000 of the respondents were successfully interviewed through 1998. Anextensive battery of wealth questions was added to the NLS-Y in 1985 when theyoungest respondents were twenty years old. I used data from 1985 through 1998,when the respondents were between the ages of thirty-one and thirty-eight, toestimate pooled cross-section time series models of wealth ownership. I also drewon earlier surveys to gather information about the respondents’ family backgrounds.Wealth questions were not asked in 1991, and the BLS began conducting the NLS-Yevery other year starting in 1994 to reduce costs and respondent burden. Simi-larly, the BLS reduced the size of the supplemental samples to reduce expenses.As a result of these issues and because of missing values, wealth data are avail-able for 3,053 respondents at eleven time points.
The NLS-Y is ideal for answering questions about family background and adultwealth because it combines broad longitudinal coverage of a large sample withdetailed information about wealth holdings, family background, life transitions,and adult status. In each survey year beginning in 1985, respondents reported

168 SOCIOLOGICAL PERSPECTIVES Volume 47, Number 2, 2004
whether they owned a comprehensive list of assets and debts and the value ofeach asset or debt if they owned it. Other sources of survey data on wealth owner-ship include wealthier individuals, those who own most assets. The Survey ofConsumer Finances, for example, is a cross-sectional data set (with panels in 1983,1986, and 1989) that oversamples high income households to more accurately esti-mate wealth distribution (Kennickell, Starr-McCluer, and Sunden 1997; Wolff1995a).
Because the NLS-Y does not oversample wealthy households, it may underesti-mate wealth concentration (Juster and Kuester 1991; Juster, Smith, and Stafford1999). However, my objective is to estimate longitudinal patterns (e.g., the effectof family background on adult outcomes) rather than cross-sectional levels of in-equality, and the NLS-Y data are consistent longitudinally with estimates fromsimilar surveys and other data sources (Keister and Moller 2000). Moreover, theNLS-Y has been successfully used to estimate long-term family processes becauseit contains detailed information about family structure and processes duringchildhood, life transitions, and adult behaviors and status (Sandefur and Wells1999). The Panel Study of Income Dynamics (PSID) is another longitudinal dataset that contains both family background and adult wealth information (wealthinformation is included in 1984, 1989, 1994, 1999, and 2001). The PSID contains aless restricted age group than the NLS-Y and has been used to successfully modelthe relationship between family background and adult wealth (see, e.g., Conley1999, 2001). After exploring both the NLS-Y and the PSID for these analyses, Iopted to use the NLS-Y because it contains detailed information on the compo-nents of net assets. Of course, I could also have selected the PSID.
Regression Models and Variables
I used estimated generalized least squares (EGLS) regression to model netassets because the error terms were both heteroskedastic and correlated overtime.
2
I first modeled total assets as a function of race and the control variables. Inthe next three models, I added measures of childhood family structure to observewhether the family background measures affected race differences in wealth own-ership. I then used logistic regression to model the likelihood of home ownershipand stock ownership in adulthood to explore the mechanisms by which assetownership varies by race.
3
In the logistic regression models of home and stockownership, I display only the first model (race and controls) and the last model(race, all family background indicators, and controls) to save space.
4
In the first set of analyses, I modeled the dollar value of the
net assets
(standard-ized and logged) in the respondent’s adult family, and I allowed this value to varyyearly between 1985 and 1998.
5
Net assets is calculated as the value of total assetsless the value of total liabilities. The financial assets included the value of stocks,bonds, and mutual funds; cash accounts such as checking accounts; trust accounts;Individual Retirement Accounts; 401K plans; and Certificates of Deposit. The realassets included the current market value of the primary residence or home; busi-nesses, farms, and investment real estate; cars and other vehicles; and other posses-sions. The debts included mortgages on the primary residence; debt on businesses,

Race, Family Structure, and Wealth
169
farms, and investment real estate; debt on automobiles; and other debt. I used theCPI to adjust all asset and debt values to 2000 dollars.
Ownership of a home or anystocks
for each survey year between 1985 and 1998 was the dependent variable forthe second set of models (see Table 5). Table 1 includes descriptive statistics forthe dependent variable with separate estimates for white, black, and Hispanicrespondents. Mean and median net assets in both 1985 and 1998 are significantlylower for blacks and Hispanics than for whites, and the estimates are consistentwith other estimates of household wealth (Keister 2000a). I include separate esti-mates for 1985 and 1998 for illustrative purposes in the table, but I use the valuefor each survey year in the analyses. Likewise, I report the value of four assets inTable 1 for illustrative purposes, but I calculate total assets from the full list ofassets and debts.
I included several measures to test ideas about childhood family structure andadult wealth. Table 2 reports means and standard deviations for the independentvariables for all families. I include dummy indicators that a respondent was
black
TABLE 1
Racial Differences in Wealth and Family Background
All(N
�
3,053)White(81%)
Black(13%)
Hispanic(6%)
Adult wealth ownershipNet assets, 1985
Mean $24.7 $28.5 $8.4 $13.7Median $5.1 $6.9 $0.8 $2.8
Net assets, 1998Mean $115.3 $136.9 $27.9 $52.9Median $39.1 $52.2 $3.8 $13.0
Asset ownership, 1998 (% owning)Home 60.0 66.3 30.8 46.1Stocks and bonds 21.3 24.4 8.7 11.1Business 12.7 14.7 3.8 7.1Cash savings 75.2 80.8 50.3 62.0
Childhood family environmentNumber of siblings 2
(2.92.25)
2(2
.69
.02)3
(2.81.71)
4(3
.03
.11)Above poverty line
(.85.35) (
.90
.27) (.59.49) (
.62
.48)Parents separated or divorced (%)
(.31.13) (
.29
.11) (.45.22) (
.32
.14)Extended family in home (%)
(.13.34) (
.11
.31) (.29.46) (
.18
.36)Mean family income in 1978
$38
($40.14
.07)
$41
($41.41
.86)
$24
($27.40
.01)
$25
($28.03
.93)
Notes
: Standard deviations are in parentheses. Net assets and family income are thousands of 2000 dollars (adjustedusing the Consumer Price Index). I use values for each year between 1979 and 1998 in the analyses, but I includemeans for single years in this table for illustrative purposes.
N
�
3,053.

170 SOCIOLOGICAL PERSPECTIVES Volume 47, Number 2, 2004
TABLE 2
Means and Standard Deviations for Independent Variables
Mean (SD)
Childhood family structureNumber of siblings 2.92 (2.25)Above poverty line .85 (.35)Parents separated or divorced (%) .31 (.13)Extended family in home (%) .13 (.34)
Control variablesIncome in 1978 $38.14 ($40.07)Father had advanced degree .16 (.36)Mother had advanced degree .09 (.29)Income in 1998 $62.39 ($51.08)Ever had children .80 (.40)Number of children born 1.69 (1.34)Married .53 (.49)Ever divorced .06 (.23)High school graduate .37 (.48)Some college .19 (.39)College graduate .11 (.31)Advanced degree .07 (.27)Age 37.35 (2.21)
Male
.50 (.50)
Notes
: Income is mean household income in thousands of 2000 dollars (adjusted using the Consumer Price Index). Iuse values for each year between 1979 and 1998 in the analyses, but I include means for single years in this table toease interpretation.
N
�
3,053.
or
Hispanic.
6
Number of siblings
is the total number of siblings ever born, reportedin 1998. To indicate whether the family’s income exceeded their needs, I includeda dummy variable indicating whether the total household income and family sizeplaced the family above the
poverty line.
I used the poverty indicator calculated bythe BLS, a measure that is consistent with those calculated using the census andstudied in previous research on income-to-needs ratios (Duncan and Rodgers1991). To test ideas about the joint effect of childhood family size and familyresources, I included an interaction term between number of siblings and thedummy variable indicating the family was above the poverty line. I also includedthe square of the interaction term to investigate the nonlinear relationship that Iproposed among resources, siblings, and wealth. To test the effect of
family disrup-tion
, I included a dummy variable indicating whether the respondent’s parentswere ever divorced or separated.
7
I also included a dummy variable indicatingwhether the respondent’s childhood family ever included
extended family.
8
Consis-tent with previous research, the estimates in Table 1 indicate that whites havefewer siblings than blacks and Hispanics on average, are less likely to have extendedfamily living in the home, and are less likely to have experienced a family disrup-tion during childhood.
Race, Family Structure, and Wealth
171
I controlled for various individual and family traits that are also likely to affectwealth.
Family income
is the logged value of total household income in 1978. Tocontrol for patterns that might be common to those with missing values on thiskey variable, I also included a dummy variable indicating that the respondent didnot provide information about childhood family income (Sandefur and Wells1999). I included separate dummy variables for
father’s education
and
mother’s edu-cation
that indicate whether the parents had completed college or more educa-tion.
9
I controlled for financial resources in the family of origin by including mea-sures of parents’ net family income and education. Together, these measuresprovide an excellent proxy for their wealth, which is not available in the NLS-Y.Previous research suggests that these measures account for most of the variancein parental wealth, and my preliminary exploration using imputation, simulation,and synthetic wealth measures for the parents produced identical substantiveoutcomes.
To explore the possibility that the model estimates are biased because of anomitted variable, I imputed parents’ wealth in three ways: I used Gary King’sAmelia software to impute wealth from other very detailed information on familystatus in childhood; I used SAS Multiple Imputation to impute wealth; and I usedthe Survey of Consumer Finances from 1983 to assign wealth based on parents’and family characteristics. Next, I used each estimate separately and an average ofthe three estimates to respecify the models. Finally, I conducted a Langrange Multi-plier test on each version of the model compared to the model without parents’wealth to test for the presence of omitted variable bias (Greene 2000:888). Theresults of the Langrange Multiplier test suggested that there was little if any biasfrom omitting the variable. The correlations ranged from .13 to .26. It is likely thatI find these low correlations because I have included many other control variablesfor family conditions during childhood. In effect, I am controlling for all the corre-lates of wealth, and the direct effect of family wealth is thus minimal at best.
To capture the effects of region and immigration, I included (but did not dis-play) indicators of region of birth, region of adult residence, and whether therespondent or her or his parents were
born in the United States
(three separate indi-cators). I also controlled for religious upbringing because religion affects many of thebehaviors and processes that indirectly shape wealth, such as divorce, fertility, earn-ings, and education (Sherkat and Ellison 1999), and wealth itself (Keister 2003b).
Finally, I controlled for the human capital traits and family processes that previ-ous research on wealth demonstrates can enhance or impede wealth accumula-tion.
Income
is total household income in the previous year (logged).
10
I includedincome to control for the effect of adult financial resources on wealth. I alsoincluded a dummy variable indicating whether the respondent
ever had children
and a continuous indicator of the
number of children
ever born (lagged one year) tocontrol for strains on adult financial resources. I included a dummy variable indi-cating whether the respondent was married (lagged one year) to measure theadditive effect of combining assets in marriage. I also included a dummy variableindicating whether the respondent was
ever divorced
and an interaction termbetween having been divorced and having children to capture the strain of divorceon wealth. I included four dummy variables indicating
educational attainment
(high

172 SOCIOLOGICAL PERSPECTIVES Volume 47, Number 2, 2004
school degree, some college, bachelor’s degree, or advanced degree) and a contin-uous indicator of
age
in all models to measure human capital.
11
I controlled for
gender
with a dichotomous variable equal to one for males. I controlled for regionalvariation with dummy variables indicating residence in an
urban
area and resi-dence in the
north central
,
southern
, or
western
United States. I controlled for racewith dichotomous variables indicating the respondent was
black
or
Hispanic
inmodels that included people of all races.
12
Sequence Analysis
Optimal matching, a method designed to identify common patterns or trajecto-ries, is based on the notion that we can measure how similar two sequences are bydetermining how difficult it is to transform one into the other (Abbott and Hrycak1990). Optimal matching has most commonly been used to identify and under-stand individual career patterns, but the method is equally suited for catalogingsequences in saving behavior. I used optimal matching to identify common pat-terns in the assets respondents owned over time. I included five assets with vary-ing degrees of risk associated with them: savings accounts, checking accounts, ahome, bonds, and stocks. If a person never owned an asset, the portfolio would berepresented as 00000. If the person then opened a savings account but purchasedno other assets, the portfolio would be represented as 10000.
Optimal matching would indicate that it would take one substitution, substitut-ing a one for a zero in the first column, to make the sequences identical. If eachchange (insertion, deletion, or substitution) “costs” the same, a simple count ofthe number of changes would indicate the complexity of the transformation; how-ever, some transformations are inherently more difficult than others. Underlyingthis strategy is the notion that ownership of relatively high-risk assets early in lifecan propel net worth forward in ways that more conservative investment strate-gies, or no investment at all, cannot. If each insertion, deletion, or substitutionrequired to transform one sequence to another had the same costs associated withit, a count of the number of changes would be sufficient representation of the dif-ficulty of the transformation. In reality, some transformations are more difficultthan others.
Consistent with previous applications of the approach (Abbott 1995; Abbottand Hrycak 1990), I derived my costs from a transition matrix that depicts pat-terns of financial behavior that appeared among respondents. The transition matrixallowed me to assess the likelihood of any given transition and assign an appropri-ate cost for that move relative to others. The substitution costs I used reflect theserankings such that unlikely changes are “expensive” and easier changes are lesscostly. Thus transitions from owning only a savings account to individual stocksare more costly than are transitions from owning only a savings account to owninga savings account and a checking account because the latter occur together moreoften in the complete matrix of options. The costs I used are similar in magnitudeto those used in other applications of optimal matching (Abbott and Hrycak1990). I experimented with alternative costs, including changing the magnitudeof the substitution costs (e.g., to as high as 8) and the range of costs. I discovered

Race, Family Structure, and Wealth
173
that even significant changes in the cost matrix produced only minor changes in thepatterns the emerged. The substitution costs I used are given in Table 3.
Using this strategy, I identified three dominant patterns in asset ownership overthe life course. Many respondents remained
permanently asset poor
: they neverowned an asset and always had a portfolio labeled 00000. A traditional sequence,and one that emerged as quite common, is a sequence that involves a
traditionalwealth accumulation path.
Those who followed this sequence typically acquired achecking or savings account (or both) during late adolescence, eventually boughta home as their first major investment, and may have eventually invested instocks and bonds. The third common sequence that emerged was an
early transi-tion to financial asset ownership.
Those who followed this type of pattern boughtfinancial assets, stocks and bonds, early in life. Most of these people also hadchecking and savings accounts, and some eventually owned homes as well, butthe dominant feature of this group was early entry into ownership of relativelyhigh-risk assets. I discuss the distribution of people across these groups and theimplications of each sequence for wealth accumulation below.
RESULTS: FAMILY BACKGROUND AND ADULT WEALTH
Family size Decreases Wealth Inequality
The findings in Table 4 support the hypothesis that family background is a crit-ically important component of the explanation for racial wealth stratification.Table 4 presents Generalized Least Squares models of net assets from 1985 to 1998.Model 1 includes only the race indicators, and model 2 introduces number ofsiblings. Both models show that as number of siblings increases, adult wealthdecreases. Adding measures of family size to the model also reduces the direct ofeffect of race and improves model fit slightly: the adjusted R-square increasesfrom .11 to .18, and Cox tests indicate that the change in the coefficient is signifi-cantly different from zero. This supports the argument that sibship size reducesadult wealth by diluting financial resources and the benefits associated with thoseresources. Ideally, the model would also control the amount of time parents spentwith their children or other indicators of nonmaterial support. Unfortunately,details of this sort are not available in the NLS. This shortcoming aside, the findingsin Table 4 suggest that to the extent to which blacks and Hispanics come fromlarger families, they will accumulate less wealth.
TABLE 3
Substitution Costs for Optimal Matching
Savings Checking Home Bonds Stocks
Savings — 2 2 2.5 3Checking 2 2.5 3Home 2 3Bonds 3
Stocks
—

174 SOCIOLOGICAL PERSPECTIVES Volume 47, Number 2, 2004
TABLE 4
EGLS Parameter Estimates: Total Adult Family Net Assets, 1985–1998
Model 1 Model 2 Model 3 Model 4
Black
�
36(3
.04***
.15)
�
31(3
.77***
.19)
�
31(3
.59***
.27)
�
29(3
.07***
.29)Hispanic
�
30(4
.90***
.27)
�
25(4
.91***
.29)
�
24(4
.43***
.35)
�
22(4
.64***
.35)
Childhood family structureNumber of siblings —
�
3(0
.76***
.45)
�
2(0
.10***
.90)
�
2(0
.10***
.90)Above poverty line — — 17
(5.54***.21)
16(5
.64***
.23)Above poverty * number siblings — —
�
6(1
.76***
.59)
�
6(1
.76***
.59)(Above poverty * number siblings)
2
— — 0(0
.57***
.15)0
(0.58***.15)
Parents separated or divorced — — —
�
16(4
.75***
.56)Extended family in home — — —
�
41(9
.94***
.91)Extended family * parents separated — — — 43
(10.33***.29)
Controls: childhood measuresFamily income in 1978 (log) 0
(0.31.27)
0(0
.22
.27)0
(0.16.28)
0(0
.97
.39)1978 income not reported 3
(3.43.34)
2(3
.38
.34)1
(3.98.37)
1(3
.82
.36)Father’s education 17
(2.17***.83)
16(2
.45***
.83)16(2
.07***
.84)15(2
.79***
.84)Mother’s education 25
(3.08***.48)
23(3
.85***
.49)23(3
.68***
.49)23(3
.32***
.49)
Controls: adult measuresIncome (log) 0
(0.10***.01)
0(0
.10***
.01)0
(0.10***.01)
0(0
.10***
.01)Ever had children �1
(2.93.68)
�1(2
.83
.68)�1(2
.66
.68)�1(2
.47
.68)Number of children born �0
(1.95.04)
�0(1
.05
.04)�0(1
.02
.05)�0(1
.13
.05)Married 35
(2.69***.13)
35(2
.47***
.13)35(2
.33***
.13)35(2
.10***
.13)Ever divorced �5
(5.65.67)
�5(5
.35
.66)�5(5
.24
.66)�5(5
.07
.66)Divorced * ever had children �2
(1.52*.30)
�2(1
.51*
.30)�2(1
.46*
.30)�2(1
.43*
.30)High school graduate 0
(2.48.73)
1(2
.06
.73)1
(2.97.75)
1(2
.58
.75)
(Continued)
Race, Family Structure, and Wealth 175
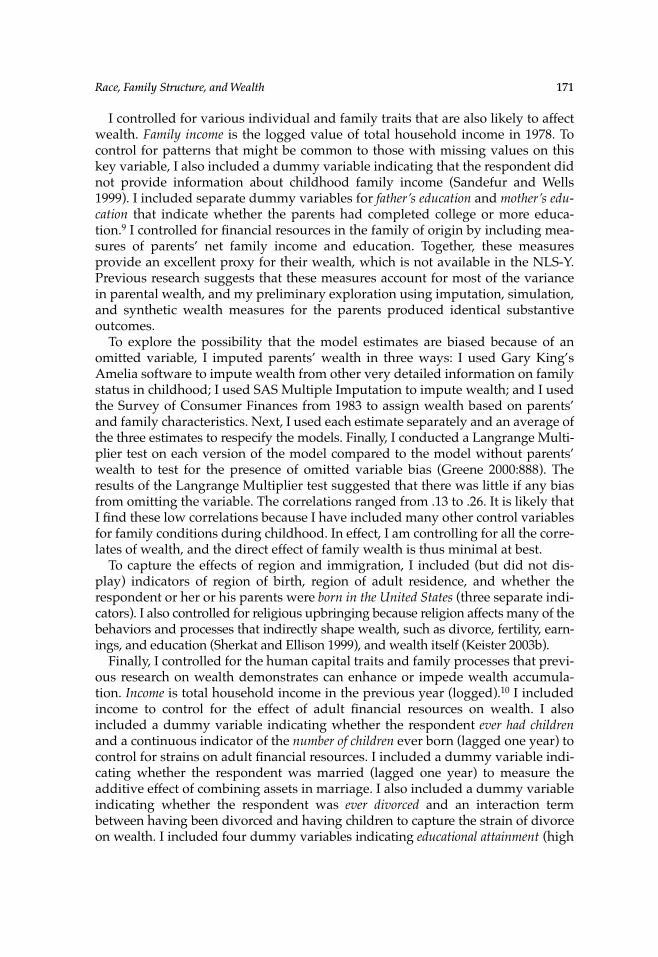
The race effect is also reduced by the degree to which family resources are suffi-cient to absorb additional siblings (again, model significance increases and Coxtests indicate that the change in the coefficient is significantly different from zero).To further explore the joint effect of childhood family size and resources on adultwealth, model 3 includes a dichotomous indicator of whether the family wasabove the poverty line, that is, whether the family’s needs exceeded their income.The model offers strong support for the conditional impact of siblings on adultwealth. Being above the poverty line during childhood increases wealth, but theinteraction between sibship size and being above the poverty line is negative. Inother words, the negative effect of siblings on adult wealth is particularly strongfor those whose families’ income exceeded their needs. This finding supports theidea that siblings reduce adult wealth by diluting childhood resources because itis those who have sufficient resources who are more strongly affected by addi-tional siblings. Those whose families did not have sufficient resources to be abovethe poverty line may have suffered at the addition of another child, but becausetheir resources were already so limited, the increase in family size did not furtherdilute resources that would otherwise have increased the children’s adult wealthaccumulation.
At higher levels of family resources, however, the joint effect of resources andsibship size begins to decline. Model 3 also includes a squared interaction term,and the coefficient estimate for this term is positive and significantly greater thanzero. At high levels of resources, the negative effect of siblings is still present, butit declines. One interpretation of this finding is that where family resources aregreater, the family is better able to absorb additional siblings and the effect of
TABLE 4 (Continued)
Model 1 Model 2 Model 3 Model 4
Controls: adult measures (continued)Some college 17
(3.06***.12)
17(3
.47***
.11)17(3
.33***
.13)17(3
.22***
.13)College graduate 34
(3.07***.58)
33(3
.70***
.57)33(3
.59***
.58)33(3
.23***
.59)Advanced degree 30
(3.80***.99)
29(3
.88***
.99)29(3
.45***
.99)29(3
.31***
.99)Age 7
(0.03.22)
7(0
.02
.22)7
(0.03.22)
7(0
.03
.22)Male 3
(1.21.87)
3(1
.04
.86)2
(1.93.86)
2(1
.95
.86)
Adjusted R2 0.11 0.18 0.22 0.25
N 3,053 3,053 3,053 3,053
Notes: Standard errors are in parentheses. Equations are pooled cross-section time series Generalized Least Squaresestimates, dependent variable is net assets (in thousands) in t, and independent variables are measured in t-1.Included in the models (but not displayed) are measures of childhood religious affiliation and church attendance,region and country of birth, immigrant status, and adult region of residence in the United States.* p � .05; ** p � .01; *** p � .001.

176 SOCIOLOGICAL PERSPECTIVES Volume 47, Number 2, 2004
sibship size on adult attainment is reduced. Where resources are greater, childrenhave access to opportunities and connections even if they have a large number ofsiblings. Because these models also control for race and other predictors of adultwealth, these effects are net of these other effects. Yet because the incidence ofpoverty is greater among blacks and Hispanics than among whites, the effectof childhood poverty status does account for racial differences in adult wealthownership (Corcoran 1995). Similarly, greater fertility rates among blacks andHispanics imply that minorities will be more likely to suffer the negative effect offamily size on adult wealth (Horton and Thomas 1998).
Family Disruptions Shape Racial Wealth Inequality
Status attainment literature linking family structure to adult outcomes demon-strates extensively and consistently that being raised in a nonintact family reduceseducational advancement, occupational attainment, and a host of other measuresof adult well-being (Corcoran 1995). Yet there is currently no research linking fam-ily disruption during childhood with adult wealth accumulation. To investigatewhether coming from a nonintact family impedes wealth accumulation, model 4adds an indicator of whether the respondent’s parents were ever divorced or sep-arated. The results demonstrate that family disruption reduces adult wealth accu-mulation and racial differences in adult wealth. The coefficient estimate is nega-tive, it is significantly different from zero, and its magnitude is substantial. Inpreliminary analyses, I explored controlling for various other indicators of familydisruption, using previous literature on family structure as a guide. Other mea-sures, including separate measures for divorce and separation, the number of sep-arations, timing of the separation, whether the parents remarried, and how soonthey remarried, did not improve model fit. For these reasons, I included only thedichotomous indicator that a family disruption occurred.
Model 4 also includes an indicator of whether members of the extended familyever lived in the home. The presence of extended family further reduces adult wealth,consistent with the argument that additional people in the household reduceaccess to material and nonmaterial resources. Yet the effect of extended family isreversed in nonintact families. The interaction between having extended family inthe home and the indicator of parental marital disruption is positive. What ismost striking is the degree to which model 4 demonstrates a reduced direct effectof race on wealth ownership. The family size and family structure variables are allquite strong and significant, and the direct effect of being black or Hispanic isreduced.
These results are largely consistent with previous research; however, they sug-gest relationships that are not evident in one set of previous work. Conley (1999)finds that number of siblings and years in a female-headed family do not affectadult wealth. Conley used the PSID to explore these relationships and reports afinding quite different from mine. Yet theoretical work on resource dilution (e.g.,Downey 1995a, 1995b) and other empirical work on the effect of siblings and child-hood family structure on adult wealth ownership (Keister 2003a) are consistent

Race, Family Structure, and Wealth 177
with the findings that I report. Theoretically, the effect of siblings is likely giventhe effect of larger families on the dilution of both material and nonmaterialresources in childhood. Similarly, Conley (1999) finds that ethnic differences dis-appear once education, income, and gender are controlled. Yet other research—consistent with the findings presented here—finds that the race effect remains inthe presence of these controls (Keister and Moller 2000). One possible explanationfor these differences may be found in the complexities involved in using large lon-gitudinal data sets. For instance, it is possible that nuances in model specificationand estimation are responsible for these differences, and an important directionfor future research would be to analyze the NLS and PSID simultaneously and tocompare results across these data sets.
Another possible explanation for these differences is the absence in my modelsof a control for family wealth during childhood. If family wealth is an importantpredictor of adult wealth, net entirely of the other childhood determinants of familywealth, it is possible that my models are misspecified. Because the NLS does notcontain wealth of parents, however, I am unable to include that control. Yet, as Iexplain in the discussion of my research methodology, extensive exploration sug-gested that there was little if any omitted variable bias in the models I report. Nat-urally, there is no way to be sure of this without adding information on parents’wealth to the NLS; thus this explanation remains possible. It is also possible thatthe findings I report are unique to early adult wealth accumulation. As the NLSsample ages, it will be important to continue to update this research to under-stand the effects of family background on outcomes throughout adulthood.
These findings are also robust in the presence of human capital and other con-trols. The effects of the control variables were consistent with previous researchon wealth ownership. Having highly educated parents increases adult wealth.The indicators of father’s and mother’s education increase adult wealth in eachmodel in Table 4. Consistent with research on status attainment (Corcoran 1995;Teachman 1987), this supports the argument that parents with higher educationshave a greater ability and inclination to create educational opportunities andother opportunities to engage the environment. These opportunities translate intogreater adult wealth both directly and indirectly through educational attainmentand adult earnings. Each model in this table also includes controls for the directeffect of respondent’s educational attainment and other indicators of individualattainment, and these are significant predictors of adult wealth. Given these con-trols, the effect of parents’ education reflects the direct effect of these measures onchildren’s adult wealth. Consistent with previous research on the importance ofparents’ education, mother’s education is a stronger predictor of adult wealththan is father’s education (Teachman 1987). Wald tests confirm that the coefficientestimates for mother’s education are significantly greater than those for father’seducation (Greene 2000). Consistent with previous wealth research, adult income,education, and age all increase wealth. Similarly, marriage increases wealth, whiledivorce reduces it particularly when the couple had children. In each model,parental immigrant status, religious affiliation, and religious participation are allsignificant predictors of wealth (to conserve space, these are not displayed). Bothindicators for having a mother and a father who were born outside the United

178 SOCIOLOGICAL PERSPECTIVES Volume 47, Number 2, 2004
TABLE 5Logistic Parameter Estimates: Home and Stock Ownership, 1985–1998
Home Ownership Stock Ownership
Model 1 Model 2 Model 3 Model 4
Black �1(0
.07***
.04)�0(0
.95***
.04)�0(0
.57***
.06)�0(0
.39***
.06)
Hispanic �0(0
.54***
.05)�0(0
.45***
.05)�0(0
.66***
.08)�0(0
.52***
.08)
Childhood family structureNumber of siblings — �0
(0.01***.00)
— �0(0
.09***
.02)Above poverty line — 0
(0.34***.02)
— 0(0
.25***
.01)Above poverty * number siblings — �0
(0.08***.02)
— �0(0
.08***
.01)(Above poverty * number siblings)2 — 0
(0.01***.00)
— 0(0
.01***
.00)Parents separated or divorced — �0
(0.23***.05)
— �0(0
.36***
.08)Extended family in home — �0
(0.41***.12)
— �0(0
.80***
.02)Extended family * parents separated — 0
(0.28**.12)
— 0(0
.60***
.02)
Controls: childhood measuresFamily income in 1978 (log) 0
(0.01***.00)
0(0
.01***
.00)0
(0.01***.00)
0(0
.03***
.01)1978 income not reported 0
(0.05.04)
0(0
.04
.05)0
(0.05.05)
0(0
.01
.05)Father’s education 0
(0.00.03)
0(0
.02
.03)0
(0.33***.04)
0(0
.30***
.04)Mother’s education 0
(0.02.04)
0(0
.04
.04)0
(0.24***.05)
0(0
.21***
.05)
Controls: adult measuresIncome (log) 0
(0.01***.00)
0(0
.01***
.00)0
(0.02***.00)
0(0
.02***
.00)Ever had children 0
(0.25***.03)
0(0
.25***
.03)�0(0
.20***
.04)�0(0
.21***
.04)Number of children born 0
(0.00.01)
0(0
.01
.01)�0(0
.14***
.02)�0(0
.12***
.02)Married 1
(0.95***.03)
1(0
.94***
.03)0
(0.61***.04)
0(0
.59***
.04)Ever divorced �0
(0.40***.07)
�0(0
.38***
.07)�0(0
.01
.10)�0(0
.03
.10)Divorced * ever had children �0
(0.09***.02)
�0(0
.08***
.02)�0(0
.08***
.02)�0(0
.08***
.02)
(Continued)

Race, Family Structure, and Wealth 179
States reduce wealth, a reflection of the wealth that immigrants in the samplebrought from their previous homes. The effect of being raised Jewish is among thestrongest predictors of adult wealth, consistent with literature that argues for acultural transmission of asset accumulation tools reflected in religious upbringing(Keister 2003b; Sherkat and Ellison 1999).
Race and Portfolio Behavior
Family background might affect adult wealth through portfolio behavior, or thecombinations of assets and debts that families own at a point in time. Those withgreater wealth in adulthood tended to buy real assets such as a home and financialassets such as stocks. Racial differences in ownership of these assets may contrib-ute to overall differences in asset levels among families. Table 5 presents modelsthat explore the effect of race and family background on the likelihood of adulthome and stock ownership in order to examine whether family structure medi-ates the relationship between race and the ownership of specific assets. Model 1demonstrates the effect of race and the control variables on home ownership, andmodel 2 introduces the full model, including all family background measures.Consistent with the results presented in Table 4, the direct effect of race is reduced
TABLE 5 (Continued)
Home Ownership Stock Ownership
Model 1 Model 2 Model 3 Model 4
Controls: adult measures (continued)High school graduate 0
(0.41***.03)
0(0
.40***
.03)0
(0.30***.05)
0(0
.28***
.05)Some college 0
(0.46***.04)
0(0
.44***
.04)0
(0.72***.06)
0(0
.69***
.06)College graduate 0
(0.53***.04)
0(0
.51***
.04)1
(0.31***.06)
1(0
.27***
.06)Advanced degree 0
(0.37***.05)
0(0
.33***
.05)1
(0.26***.06)
1(0
.21***
.06)Age 0
(0.16***.00)
0(0
.16***
.00)0
(0.04***.00)
0(0
.04***
.00)Male 0
(0.11***.02)
0(0
.12***
.02)0
(0.14***.03)
0(0
.14***
.03)
�2 Log likelihood 50,515.35 50,655.73 69,247.93 69,358.76
N 3,053 3,053 3,053 3,053
Notes: Entries are estimates of �; standard errors are in parentheses. These are not odds ratios. Equations are pooledcross-section time series estimates, dependent variable is a dummy variable indicating home ownership or stockownership in t, and independent variables are measured in t-1. Included in the models (but not displayed) are mea-sures of childhood religious affiliation and church attendance, region and country of birth, immigrant status, andadult region of residence in the United States.* p � .05; ** p � .01; *** p � .001.

180 SOCIOLOGICAL PERSPECTIVES Volume 47, Number 2, 2004
considerably and model fit improves when the family background measures areintroduced. The direction and significance of the family background measuresare also consistent with those reported in Table 4. These results document thatchildhood family size and family structure directly affect the likelihood of homeownership and account for at least part of the racial difference in home ownershiprates.
Similarly, the ownership of financial assets, such as stocks, contributes to totaladult wealth, and racial differences in the propensity to own financial assetsappears to underlie racial wealth inequality. Models 3 and 4 in Table 5 explore thedegree to which family background reduces the direct effect of race on the pro-pensity to own stocks. Model 3 documents severe racial differences in stock owner-ship with no family background controls. Model 4 introduces all family back-ground measures. Again, introduction of the family background variables reducesthe effect of race and improves model fit. In this model, the direction of the familybackground variables are once again in the predicted direction and statisticallysignificant.
Race, Family, and Savings Trajectories
Another way to identify the mechanisms underlying the relationship betweenfamily background and adult wealth is to explore the savings trajectories thatpeople follow during their lives. Those with greater adult wealth tend to beginaccumulating assets at an earlier age and tend to begin saving in higher-yieldassets earlier. Saving early in life can disproportionately affect adult wealthbecause of compounding. Naturally, early saving in high-return financial instru-ments can have an even more noticeable impact. An important part of the finan-cial repertoire that children learn, and that can be associated with the family’s reli-gious preferences, is a propensity to begin saving early or to save in particularways. Table 6 includes descriptive statistics that emerge from optimal matching.Using optimal matching on savings in five common assets at various levels of risk(savings accounts, checking accounts, home ownership, bonds, and stocks), I identi-fied three common financial trajectories. The first trajectory, permanently asset poor,includes those who never own any of the five assets. The second trajectory, tradi-tional wealth accumulation path, includes all trajectories that reflect some ownershipof these assets with a tendency to start by owning the low-risk assets (savings,checking) in early adulthood, moving to home ownership, and then perhaps buyingriskier financial assets (stocks, bonds) later in life. The third trajectory, early transi-tion to financial asset ownership, includes all trajectories that again involve someownership of these assets but that involve relatively early transitions to the owner-ship of financial assets (stocks, bonds).13
The results presented in Table 6 indicate that 23 percent of the full sampleremained permanently asset poor throughout their lives, while 44 percent fol-lowed the more traditional wealth accumulation path, and only 10 percent madean early transition to financial asset ownership. Not surprisingly, there are starkracial differences in the paths people followed. Considerably more blacks andHispanics than whites remained asset poor into adulthood, while considerably

Race, Family Structure, and Wealth 181
more whites followed traditional savings trajectories. Even more striking is thefinding that 21 percent of whites and fewer than 10 percent of either blacks or His-panics made an early transition to financial asset ownership, a path that is quitelikely to result in considerable savings. What is perhaps most remarkable is theeffect that family structure has on the trajectories taken. For all races but particu-larly for nonwhites, those with three or more siblings were much more likely toremain asset poor and much less likely to follow either of the other two (moredesirable) paths. Similarly, those who lived in poverty as children or whose par-ents were ever divorced or separated were much more likely to remain asset poorand much less likely to follow a traditional path or a path involving an early tran-sition to financial asset ownership. Although these findings do not directly answerquestions about mechanisms, they are strongly suggestive of the mechanism bywhich childhood family structure relates to adult wealth. Specifically, these resultssuggest that blacks and Hispanics begin saving more slowly if at all, that they arequite unlikely to follow paths that yield high savings, and that family size andfamily structure during childhood exacerbates these differences.14 These results sug-gest that the repertoire of skills and decision-making abilities learned in childhoodmay very well set a course of action that ultimately translates into high wealth.
TABLE 6Percent of People Following Three Typical Trajectories by Race and Family Background
PermanentlyAsset Poor
TraditionalWealth
AccumulationPath
Early Transitionto Financial
AssetOwnership
All .23 .44 .10
WhiteAll .16 .66 .21With more than 3 siblings .28 .49 .15Who lived in poverty as a child .45 .38 .10Whose parents were divorced .18 .41 .13
BlackAll .28 .32 .02With more than 3 siblings .35 .15 .00Who lived in poverty as a child .50 .18 .00Whose parents were divorced .33 .28 .01
HispanicAll .24 .33 .08With more than 3 siblings .32 .18 .03Who lived in poverty as a child .48 .25 .01Whose parents were divorced .29 .30 .01
Notes: “Permanently asset poor” families had not begun to accumulate savings by 1998. Those following a “tradi-tional path” typically started with few assets, bought a house, then began to invest in financial assets. Those whomade an “early transition to financial asset ownership” invested in financial assets early in life, before accumulatingmany real assets such as a home.

182 SOCIOLOGICAL PERSPECTIVES Volume 47, Number 2, 2004
CONCLUSION
My primary objective has been to examine the relationship between family back-ground and racial differences in adult wealth ownership. Previous research onwealth inequality emphasizes adult human capital effects (Kennickell 2000; Wolff1995b). Yet a long tradition of research on status attainment suggests that child-hood resources and family structure are likely to shape adult wealth both directlyand through their effect on adult human capital (Corcoran 1995). I drew on researchin this tradition to propose that because family background varies racially, racialdifferences in wealth accumulation may be a function of differences in childhoodresources and family structure. My results support this proposition. I found thatsibship size decreases adult wealth, consistent with the argument that additionalsiblings strain both material and nonmaterial resources. Sibship size was particu-larly salient for those whose families were above the poverty line, while the effectof additional siblings was reversed in families where resources far outpace needs.Some observers have downplayed the importance of sibship size (Guo and Van-Wey 1999). But the precise relationships that my results documented provide con-siderable support for the argument that siblings dilute resources. Moreover, giventhe strength of my findings, it is difficult to discount the importance of family sizein shaping adult wealth ownership.
Previous research also demonstrates that family disruption during childhoodimpedes adult well-being (McLanahan and Sandefur 1994). Although the utilityof extending this research to wealth outcomes is apparent, researchers had not yetexplored the possible connection between parental divorce or separation andadult wealth. My analyses indicate that family disruption decreases adult wealth,but I also find that having extended family in the home can reduce the negativeeffects of the disruption. Not surprisingly, when extended family are present inintact families, they dilute resources and decrease children’s wealth accumulation inmuch the same way that additional siblings do. Yet in nonintact families, extendedfamily may reduce the magnitude of the crisis by providing emotional support,financial intervention, and a sense of stability that is otherwise missing. This find-ing speaks to the importance of research on wealth accumulation and inequalitythat extends beyond the individual to include processes in both the immediateand the extended family. It is important to note that even when these processesare controlled, the race dummy variables remain significant. This is probablybecause there are important processes that are impossible to control with these (orany existing data) that also contribute to racial differences in wealth ownership.Informal education regarding saving and investment, for example, might accountfor accumulation differences. Yet there is no reliable way to test this possibilitywith current data.
I also found evidence that family background may reduce the effect of race onwealth via portfolio behavior and savings trajectories. Blacks and Hispanics areless likely than whites to own homes and stocks, two critical assets. Introducingfamily background into the equation, however, reduced the direct effect of raceand provided additional explanatory power. Similarly, results of sequence analy-ses provided support for the argument that the paths on which people save vary

Race, Family Structure, and Wealth 183
by race. I found that whites were much less likely than blacks or Hispanics toremain with little or no savings into adulthood and that whites were much morelikely to begin buying homes and financial assets earlier in life. These small differ-ences in sequencing can create important differences in overall wealth both in theearly years and across the life cycle. Family size and family structure duringchildhood exacerbated these effects and may contribute to racial differences inthese behaviors.
These results suggest that the extreme and persistent racial divide in wealthownership is at least partially traceable to family processes during childhood. It isimportant to note that in emphasizing the relationship between family back-ground and wealth ownership, I do not intend to reduce the complex process ofwealth accumulation or wealth inequality to a single set of inputs. Other researchclearly documents that wealth ownership is associated with a number of factors,including individual and family processes such as marital behavior, investmentpatterns, and union separation and aggregate processes such as demographictrends, market fluctuations, and policy shifts (Keister and Moller 2000). Theresults that I discuss in this article, however, highlight an important part of the pic-ture that has been neglected previously. Understanding that family background isrelated in critical ways to adult wealth accumulation, net of its indirect effects onother demographic behaviors, casts light on the importance of family processesthat shape the way people behave and, in this case, the way they accumulateassets. My results also identify the importance of longitudinal patterns of savingbehavior in shaping a person’s lifetime wealth ownership. The person who startslife without the knowledge or skills to save or the understanding of how to savestarts at a distinct disadvantage. Likewise, understanding that family structurecan facilitate this process suggests that providing incentives to change somebehaviors could enhance efforts to increase equality.
Acknowledgments: I am grateful to Emily Click and Claire Yang for researchassistance. I also gratefully acknowledge comments from participants at the JeromeLevy Economics Institute’s Conference on Saving, Intergenerational Transfers, andthe Distribution of Wealth. This research was supported by grants from the Amer-ican Sociological Association and the College of Social and Behavioral Sciencesat the Ohio State University.
NOTES
1. Because I explore differences in asset accumulation among whites, blacks, and Hispan-ics, I am really exploring racial and ethnic differences. I do not repeat the term “ethnic”throughout this article to simplify the text.
2. The White Test for heteroskedasticy was significant, and the Ordinary Durbin-WatsonTest (D-W) for first-order autocorrelation was significantly different from two. Becausethe Ordinary D-W was significant, it was not necessary to use the General D-W forhigh orders of autocorrelation. Practically, I used the Yule-Walker method, also knownas the two-step full transform method or Estimated Generalized Least Squares, in SASProc Autoreg to estimate the models (Judge et al. 1985).
184 SOCIOLOGICAL PERSPECTIVES Volume 47, Number 2, 2004
3. Models of other components of wealth suggest that similar patterns are present byrace. I opted to present home and stock ownership because home ownership is amongthe most common forms of asset ownership and stock ownership is suggestive ofinvestment behavior that has the potential to yield high returns.
4. With data that follow the same individuals over such a long period, it is common tohave some missing data. The NLS-Y is admirable in that it has retained a large samplesize. Of course, missing values are still a problem. To address this, I used multipleimputation separately for each major test variable and each control variable, and Ifound the same results. I opted to use the nonimputed data (using listwise deletion inthe regression analyses) because it is most standard and easiest to interpret.
5. Net assets is skewed as wealth ownership is concentrated in the hands of a relativelysmall portion of the population. Adding a constant to this variable (to eliminate nega-tive values) and logging it reduces the skew. I also explored how removing outliersaffects the results and found that given the large sample size, the results are robust tothe removal of outliers.
6. Whites are nonblack, non-Hispanic respondents. Omitting those who do not reportthat they are Caucasian and coding the race variables in other ways, including a cate-gory for other races, does not change the results in a substantively meaningful way.
7. Never-married single parents were included in the omitted category. Including theseparents as a separate category or with the separated and divorced parents did notchange the results substantively.
8. I did not measure this as the number of extended family in the home because prelimi-nary investigation suggested that the mere presence of extended family was the mostsalient measure of this variable.
9. Including a measure of number of years of education for the parents was less informa-tive than controlling for various levels of education completed. Because completion ofless than a college education was not significantly related to adult wealth, I includedonly one dummy variable.
10. I experimented with using a number of measures of income, including permanentincome, average cumulative income, family income decomposed into the incomes ofindividuals in the household, total income decomposed into earned income and assetincome. Yet I find no substantive difference in the results. The measure I chose toinclude, current income, lagged one year does change over time with the dependentvariable. I have chosen to include it because among the representations of income, it isthe simplest to interpret.
11. Consistent with previous research on wealth ownership, a squared age term did notsignificantly affect wealth in preliminary analyses.
12. I did not control for inheritance because including inheritance on the right side of aregression equation predicting wealth may be equivalent to including the dependentvariable on both sides of the equation. Moreover, preliminary analyses indicated thatcontrolling for inheritance did not change the substance of the results.
13. Each trajectory that I have grouped under these names includes multiple paths thatoptimal matching identified as relatively similar. These are not the only trajectoriesthat emerged, but they are the most common paths followed by those in the sample.
14. It is possible to conduct multivariate analyses with the paths as the dependent variabledefined as either dichotomous or multinomial. I do not report them here to conservespace and because the results do not add substantially to the results that are evident inthe simple descriptive statistics.

Race, Family Structure, and Wealth 185
REFERENCES
Abbott, Andrew. 1995. “Sequence Analysis: New Methods for Old Ideas.” Annual Review ofSociology 21:93–113.
Abbott, Andrew and Alexandra Hrycak. 1990. “Measuring Resemblance in Sequence Data:An Optimal Matching Analysis of Musicians’ Careers.” American Journal of Sociology96:144–85.
Angel, Ronald and Marta Tienda. 1982. “Determinants of Extended Household Structure:Cultural Pattern or Economic Need.” American Journal of Sociology 87:1360–83.
Baydar, Nazli. 1988. “Effects of Parental Separation and Reentry into Union on the Emo-tional Well-Being of Children.” Journal of Marriage and the Family 50:967–81.
Biblarz, Timothy J. and Adrian E. Raftery. 1993. “The Effects of Family Disruption on SocialMobility.” American Sociological Review 58:97–109.
Blake, Judith. 1981. “Family Size and the Quality of Children.” Demography 18:421–42.———. 1989. Family Size and Achievement. Berkeley: University of California Press.Blau, Francine D. and John W. Graham. 1990. “Black-White Differences in Wealth and Asset
Composition.” Quarterly Journal of Economics May:321–39.Campbell, Lori A. and Robert L. Kaufman. 2000. “Racial Differences in Household Wealth:
Beyond Black and White.” Working Paper. American Sociological Association.Cherlin, Andrew J. 1979. “Work Life and Marital Dissolution.” Pp. 23–38 in Divorce and
Marital Separation, edited by G. Levinger and O. C. Moles. New York: Basic Books———. 1981. Marriage, Divorce, Remarriage. Cambridge, MA: Harvard University
Press.Cherlin, Andrew J., P. Lindsay Chase-Lansdale, and Christine McRae. 1998. “Effects of
Parental Divorce on Mental Health throughout the Life Course.” American Sociologi-cal Review 63:239–49.
Chiteji, Ngina S. and Darrick Hamilton. 2001. “Inter-Family Connections and Race Differ-ences in Saving Behavior: Towards a New Direction in Research on Wealth Inequal-ity.” Working paper.
Chiteji, Ngina S. and Frank P. Stafford. 1999. “Portfolio Choices of Parents and Their Chil-dren as Young Adults: Asset Accumulation by African-American Families.” AmericanEconomic Review 89:377–80.
Conley, Dalton. 1999. Being Black, Living in the Red: Race, Wealth and Social Policy in America.Berkeley: University of California Press.
———. 2001. “Decomposing the Black-White Wealth Gap: The Role of Parental Resources,Inheritance, and Investment Dynamics.” Sociological Inquiry 71:39–66.
Cooksey, Elizabeth C. 1997. “Consequences of Young Mothers’ Marital Histories forChildren’s Cognitive Development.” Journal of Marriage and the Family 59:245–61.
Corcoran, M. 1995. “Rags to Rags: Poverty and Mobility in the United States.” AnnualReview of Sociology 21:237–67.
Danziger, Sheldon H. and Peter Gottschalk. 1993. Uneven Tides: Rising Inequality in America.New York: Russell Sage Foundation.
Demo, David H. and Alan C. Acock. 1988. “The Impact of Divorce on Children.” Journal ofMarriage and the Family 50:619–48.
Downey, Douglas B. 1995a. “Understanding Academic Achievement among Children inStephouseholds: The Role of Parental Resources, Sex of Stepparent, and Sex ofChild.” Social Forces 73:875–94.
———. 1995b. “When Bigger Is Not Better: Family Size, Parental Resources, and Children’sEducational Performance.” American Sociological Review 60:746–61.

186 SOCIOLOGICAL PERSPECTIVES Volume 47, Number 2, 2004
Duncan, Greg J. and Soul D. Hoffman. 1985. “Economic Consequences of Marital Instabil-ity.” Pp. 427–67 in Horizontal Equity, Uncertainty, and Economic Well-Being, edited byM. David and T. Smeeding. Chicago: University of Chicago Press.
Duncan, Greg J. and Willard Rodgers. 1991. “Has Children’s Poverty Become More Persis-tent?” American Sociological Review 56:538–50.
Dynan, Karen E. 1993. “The Rate of Time Preference and Shocks to Wealth: Evidence fromPanel Data.” Board of Governors of the Federal Reserve System Working Paper Series, No. 134.
Eggebeen, David J. and Daniel T. Lichter. 1991. “Race, Family Structure, and ChangingPoverty among American Children.” American Sociological Review 56:801–17.
Friedman, Debra, Michael Hechter, and Satoshi Kanazawa. 1994. “A Theory of the Value ofChildren.” Demography 31:375–401.
Greene, William. 2000. Econometric Analysis, 4th ed. New York: Macmillan.Guo, Guang and Leah K. VanWey. 1999. “Sibship Size and Intellectual Development: Is the
Relationship Causal?” American Sociological Review 64:169–87.Hanson, Thomas L. and Sara S. McLanahan. 1998. “Windows on Divorce: Before and
After.” Social Science Research 27:329–49.Henretta, John. 1984. “Parental Status and Child’s Homeownership.” American Sociological
Review 49:131–40.Hill, C. Russell and Frank P. Stafford. 1978. “Intergenerational Wealth Transfers and the
Educational Decisions of Male Youth: An Alternative Interpretation.” Quarterly Jour-nal of Economics 92:515–20.
Holden, Karen C. and Pamela J. Smock. 1991. “The Economic Costs of Marital Dissolution:Why Do Women Bear a Disproportionate Cost?” Annual Review of Sociology 17:51–78.
Horton, Hayward Derrick and Melvin E. Thomas. 1998. “Race, Class, and Family Struc-ture: Differences in Housing Values for Black and White Homeowners.” SociologicalInquiry 68:114–36.
Horwitz, Allan V., Helene Raskin White, and Sandra Howell-White. 1996. “The Use of Mul-tiple Outcomes in Stress Research: A Case Study of Gender Differences in Responsesto Marital Dissolution.” Journal of Health and Social Behavior 37:278–91.
Houseknecht, Sharon K. and Graham B. Spanier. 1980. “Marital Disruption and HigherEducation among Women in the United States.” Sociological Quarterly 21: 375–89.
Judge, George G., William E. Griffiths, R. Carter Hill, and Tsoung-Chao Lee. 1985. The The-ory and Practice of Econometrics. 2d ed. New York: Wiley.
Juster, Thomas F. and Kathleen A. Kuester. 1991. “Differences in the Measurement ofWealth, Wealth Inequality and Wealth Composition Obtained from Alternative U.S.Wealth Surveys.” Review of Income and Wealth 37:33–62.
Juster, Thomas F., James P. Smith, and Frank Stafford. 1999. “The Measurement and Struc-ture of Household Wealth.” Labour Economics 6:253–75.
Keister, Lisa A. 2000a. “Race and Wealth Inequality: The Impact of Racial Differences in AssetOwnership on the Distribution of Household Wealth.” Social Science Research 29:477–502.
———. 2000b. Wealth in America. New York: Cambridge University Press.———. 2003a. “Sharing the Wealth: The Impact of Siblings on Adult Wealth Ownership.”
Demography 40:521–42.———. 2003b. “Religion and Wealth: The Role of Religious Affiliation and Participation in
Early Adult Asset Accumulation.” Social Forces 82:173–205.Keister, Lisa A. and Stephanie Moller. 2000. “Wealth Inequality in the United States.”
Annual Review of Sociology 26:63–81.Kennickell, Arthur B. 2000. “An Examination of Changes in the Distribution of Wealth
from 1989–1998: Evidence from the Survey of Consumer Finances.” Federal ReserveBoard Working Paper.

Race, Family Structure, and Wealth 187
Kennickell, Arthur B. and Myron L. Kwast. 1997. “Who Uses Electronic Banking? Resultsfrom the 1995 Survey of Consumer Finances.” Unpublished manuscript.
Kennickell, Arthur B., Martha Starr-McCluer, and Annika E. Sunden. 1997. “FamilyFinances in the U.S.: Recent Evidence from the Survey of Consumer Finances.” Fed-eral Reserve Bulletin January:1–24.
Marks, Carole. 1991. “The Urban Underclass.” Annual Review of Sociology 17:445–66.McLanahan, Sara S. 1985. “Family Structure and the Reproduction of Poverty.” American
Journal of Sociology 90:873–901.McLanahan, Sara S. and Gary D. Sandefur. 1994. Growing Up with a Single Parent: What
Hurts, What Helps. Cambridge, MA: Harvard University Press.Mechanic, David and Stephen Hansell. 1989. “Divorce, Family Conflict, and Adolescents’
Well-Being.” Journal of Health and Social Behavior 30:105–16.Menchik, Paul and Nancy Ammon Jianakoplos. 1997. “Black-White Wealth Inequality: Is
Inheritance the Reason?” Economic Inquiry 35:428–42.Mott, Frank L. and S. F. Moore. 1978. “The Causes and Consequences of Marital Break-
down: Dimensions of Change in American Society.” Pp. 113–35 in Women, Work,and Family, edited by F. Mott and S. H. Sandell. Lexington, MA: Lexington Books.
Nestel, G., J. Mercier, and Lois Banfill Shaw. 1983. “Economic Consequences of MidlifeChange in Marital Status.” Pp. 113–35 in Unplanned Careers: The Working Lives ofMiddle-Aged Women, edited by L. B. Shaw. Lexington, MA: Lexington.
Oliver, Melvin O. and Thomas M. Shapiro. 1995. Black Wealth/White Wealth. New York:Routledge.
Peterson, Richard R. 1996. “A Re-Evaluation of the Economic Consequences of Divorce.”American Sociological Review 61:528–36.
Roschelle, Anne R. 1997. No More Kin: Exploring Race, Class, and Gender in Family Networks.Thousand Oaks, CA: Sage.
Ruggles, Richard. 1994. “The Origins of African-American Family Structure.” AmericanSociological Review 59:136–51.
Sandefur, Gary D. and Thomas Wells. 1999. “Does Family Structure Really Influence Edu-cational Attainment?” Social Science Research 28:331–57.
Sherkat, Darren E. and Christopher G. Ellison. 1999. “Recent Developments and CurrentControversies in the Sociology of Religion.” Annual Review of Sociology 25:363–94.
Stack, Carol. 1974. All Our Kin: Strategies for Survival in a Black Community. New York:Harper and Row.
Stafford, Frank P. 1996. “Early Education of Children in Families and Schools.” Pp. 219–46in Household and Family Economics: Recent Economic Thought, edited by P. Menchik.Boston: Kluwer Academic.
Stirling, Kate. 1989. “Women Who Remain Divorced: The Long-Term Economic Conse-quences.” Social Science Quarterly 70:549–61.
Teachman, Jay D. 1987. “Family Background, Educational Resources, and EducationalAttainment.” American Sociological Review 52:548–57.
Wilson, William J. 1987. The Truly Disadvantaged: The Inner City, the Underclass, and PublicPolicy. Chicago: University of Chicago Press.
Wolff, Edward N. 1995a. “The Rich Get Increasingly Richer: Latest Data on HouseholdWealth during the 1980s.” Pp. 33–68 in Research in Politics and Society, vol. 5, edited byR. E. Ratcliff, M. L. Oliver, and T. M. Shapiro. Greenwich, CT: JAI Press.
———. 1995b. Top Heavy: A Study of the Increasing Inequality of Wealth in America. New York:Twentieth Century Fund.
———. 1998. “Recent Trends in the Size Distribution of Household Wealth.” Journal of Eco-nomic Perspectives 12:131–50.