Embed Size (px)
Citation preview
7/13/2015
1
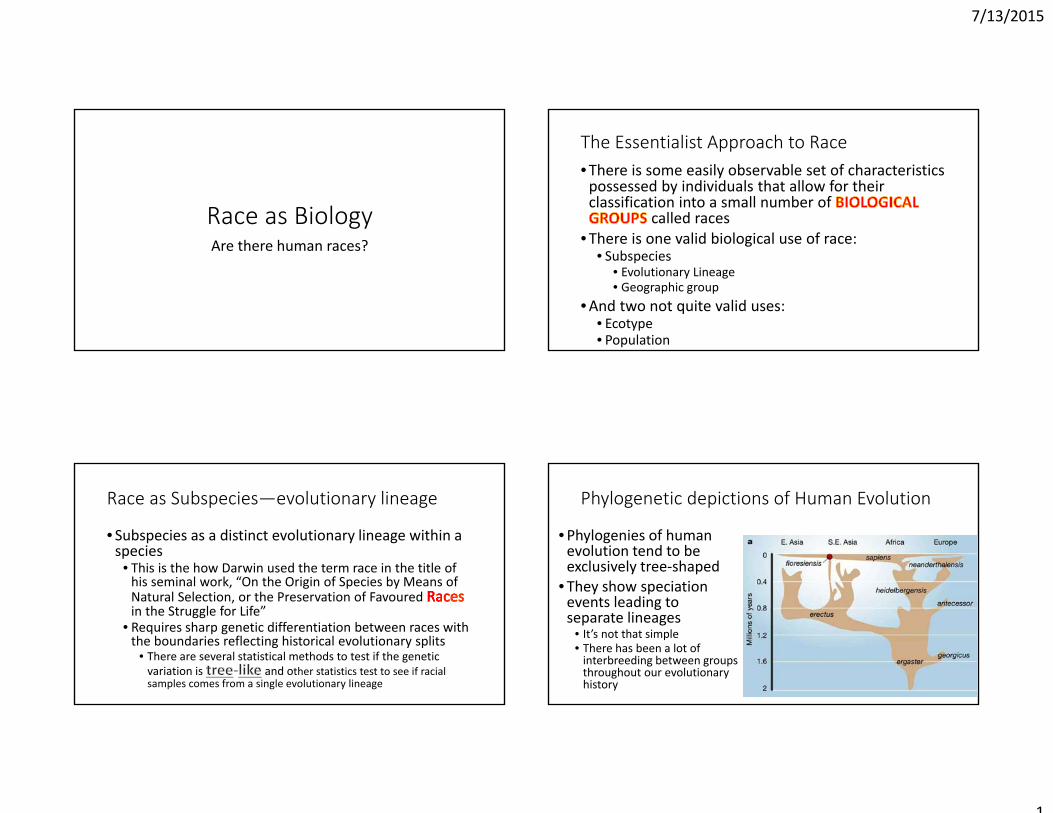
Race as BiologyAre there human races?
The Essentialist Approach to Race•There is some easily observable set of characteristics possessed by individuals that allow for their classification into a small number of
called races •There is one valid biological use of race:
• Subspecies• Evolutionary Lineage • Geographic group
•And two not quite valid uses:• Ecotype• Population
Race as Subspecies—evolutionary lineage
• Subspecies as a distinct evolutionary lineage within a species
• This is the how Darwin used the term race in the title of his seminal work, “On the Origin of Species by Means of Natural Selection, or the Preservation of Favoured in the Struggle for Life”
• Requires sharp genetic differentiation between races with the boundaries reflecting historical evolutionary splits
• There are several statistical methods to test if the genetic variation is and other statistics test to see if racial samples comes from a single evolutionary lineage
Phylogenetic depictions of Human Evolution
•Phylogenies of human evolution tend to be exclusively tree‐shaped
• They show speciation events leading to separate lineages
• It’s not that simple• There has been a lot of interbreeding between groups throughout our evolutionary history
7/13/2015
2
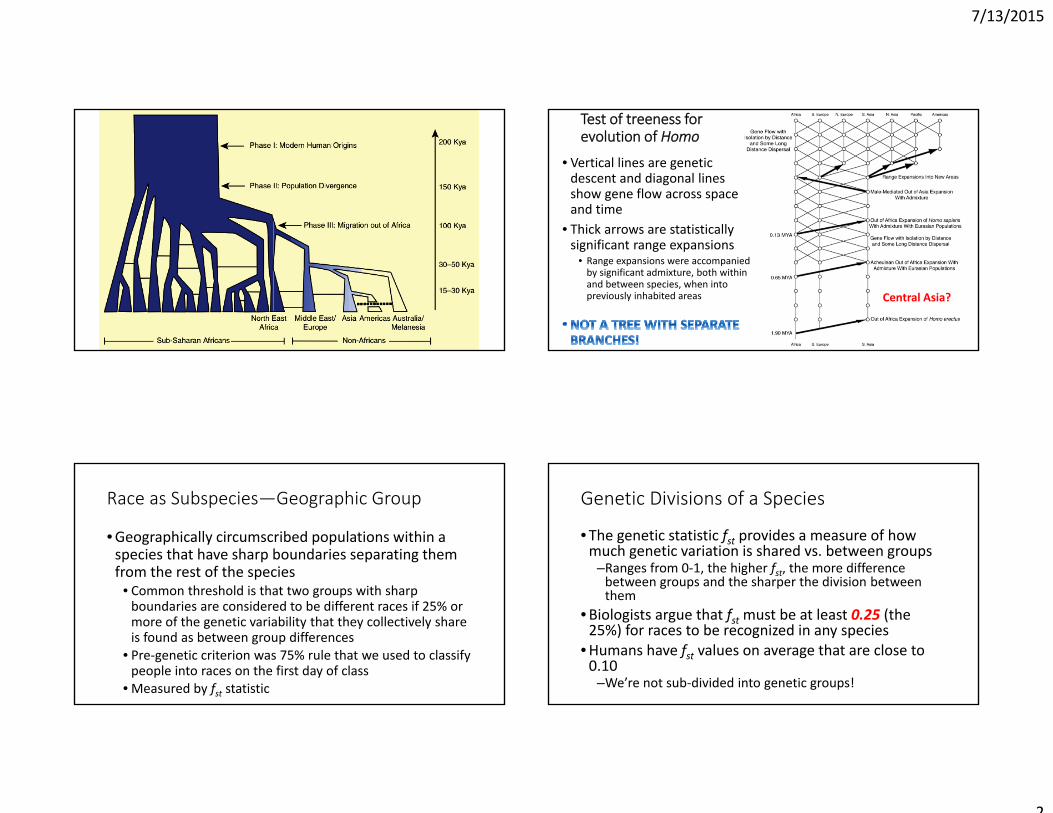
Test of treeness for evolution of Homo
• Vertical lines are genetic descent and diagonal lines show gene flow across space and time
• Thick arrows are statistically significant range expansions
• Range expansions were accompanied by significant admixture, both within and between species, when into previously inhabited areas Central Asia?
Race as Subspecies—Geographic Group
•Geographically circumscribed populations within a species that have sharp boundaries separating them from the rest of the species
• Common threshold is that two groups with sharp boundaries are considered to be different races if 25% or more of the genetic variability that they collectively share is found as between group differences
• Pre‐genetic criterion was 75% rule that we used to classify people into races on the first day of class
• Measured by fst statistic
Genetic Divisions of a Species
• The genetic statistic fst provides a measure of how much genetic variation is shared vs. between groups
–Ranges from 0‐1, the higher fst, the more difference between groups and the sharper the division between them
•Biologists argue that fst must be at least 0.25 (the 25%) for races to be recognized in any species
•Humans have fst values on average that are close to 0.10
–We’re not sub‐divided into genetic groups!
7/13/2015
3
0
0.1
0.2
0.3
0.4
0.5
0.6
0.7
0.8
0.9
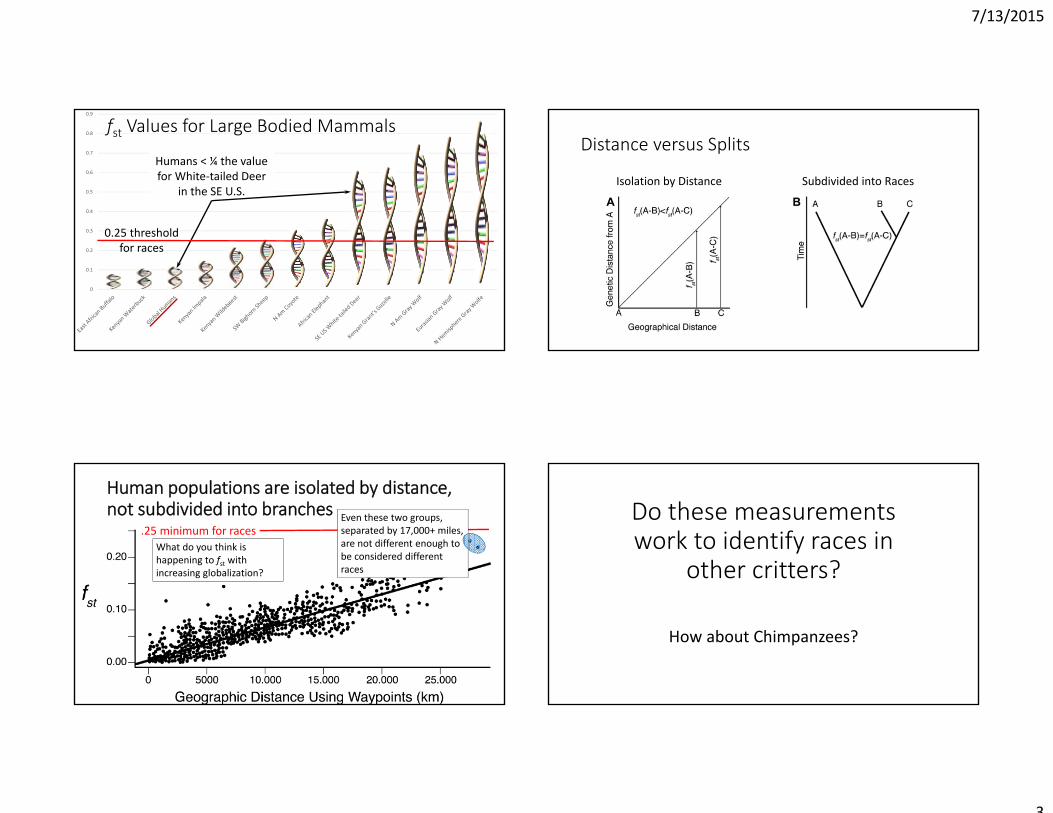
fst Values for Large Bodied Mammals
Humans < ¼ the value for White‐tailed Deer
in the SE U.S.
0.25 threshold for races
Distance versus Splits
Subdivided into RacesIsolation by Distance
Human populations are isolated by distance, not subdivided into branches
.25 minimum for racesEven these two groups, separated by 17,000+ miles, are not different enough to be considered different races
What do you think is happening to fst with increasing globalization?
Do these measurements work to identify races in
other critters?
How about Chimpanzees?
7/13/2015
4
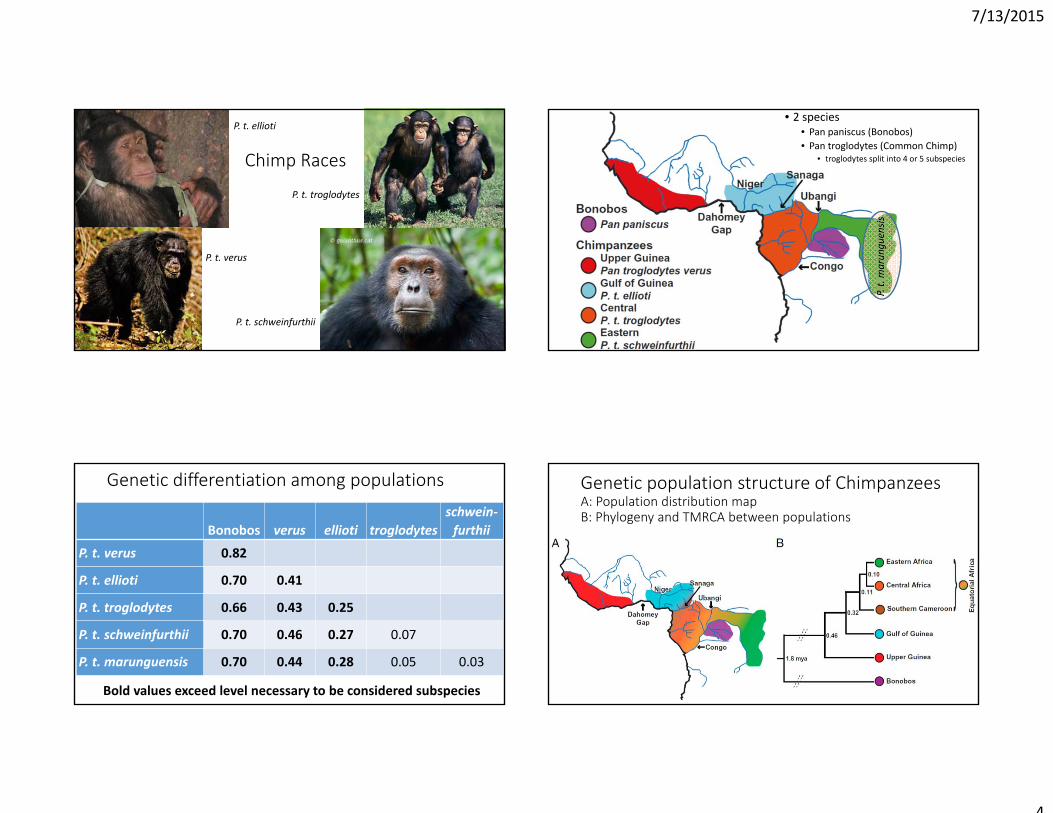
Chimp Races
P. t. ellioti
P. t. troglodytes
P. t. verus
P. t. schweinfurthii
Does this work in other species?Chimpanzee races
• 2 species• Pan paniscus (Bonobos)• Pan troglodytes (Common Chimp)
• troglodytes split into 4 or 5 subspecies
Genetic differentiation among populations
Bonobos verus ellioti troglodytesschwein‐furthii
P. t. verus 0.82
P. t. ellioti 0.70 0.41
P. t. troglodytes 0.66 0.43 0.25
P. t. schweinfurthii 0.70 0.46 0.27 0.07
P. t. marunguensis 0.70 0.44 0.28 0.05 0.03
Bold values exceed level necessary to be considered subspecies
Genetic population structure of ChimpanzeesA: Population distribution mapB: Phylogeny and TMRCA between populations
7/13/2015
5
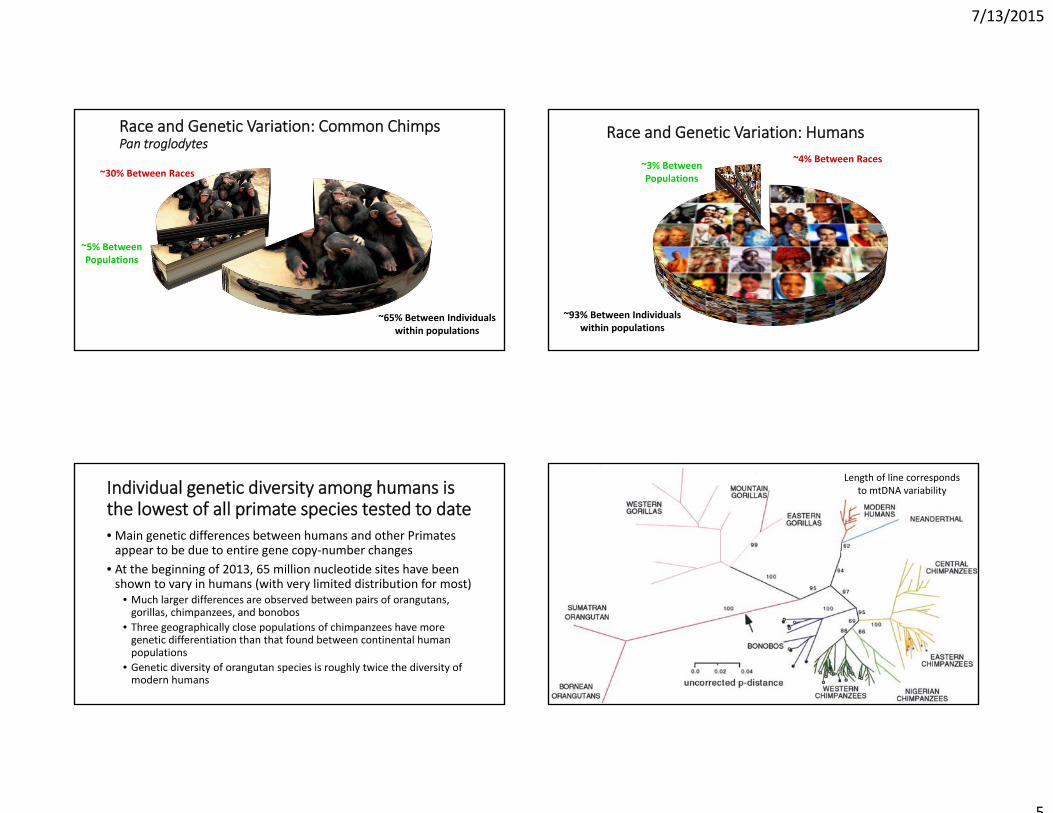
Race and Genetic Variation: Common ChimpsPan troglodytes
~65% Between Individualswithin populations
~30% Between Races
~5% BetweenPopulations
Race and Genetic Variation: Humans
~93% Between Individualswithin populations
~4% Between Races~3% BetweenPopulations
Individual genetic diversity among humans is the lowest of all primate species tested to date• Main genetic differences between humans and other Primates appear to be due to entire gene copy‐number changes
• At the beginning of 2013, 65 million nucleotide sites have been shown to vary in humans (with very limited distribution for most)
• Much larger differences are observed between pairs of orangutans, gorillas, chimpanzees, and bonobos
• Three geographically close populations of chimpanzees have more genetic differentiation than that found between continental human populations
• Genetic diversity of orangutan species is roughly twice the diversity of modern humans
mtDNA comparison of Hominoid variabilityLength of line corresponds
to mtDNA variability
7/13/2015
6
0
1,000,000
2,000,000
3,000,000
4,000,000
5,000,000
6,000,000
7,000,000
8,000,000
9,000,000
10,000,000
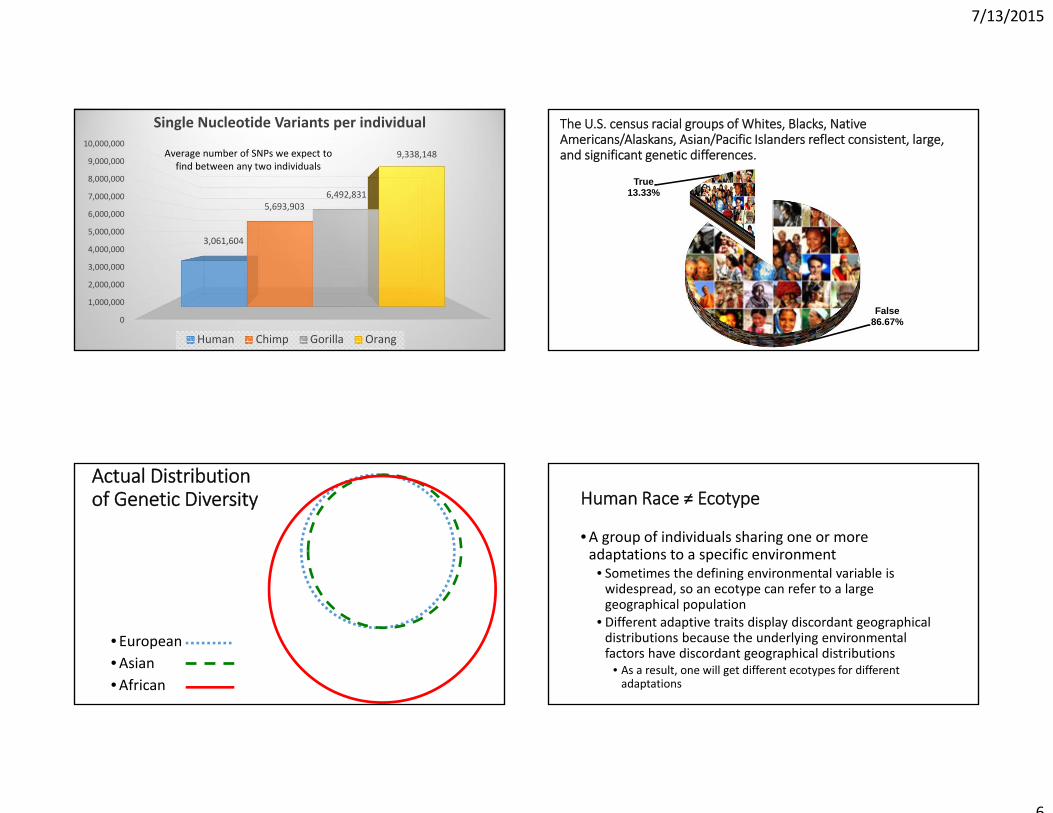
3,061,604
5,693,9036,492,831
9,338,148
Single Nucleotide Variants per individual
Human Chimp Gorilla Orang
Average number of SNPs we expect tofind between any two individuals
The U.S. census racial groups of Whites, Blacks, Native Americans/Alaskans, Asian/Pacific Islanders reflect consistent, large, and significant genetic differences.
False86.67%
True13.33%
Actual Distribution of Genetic Diversity
• European•Asian•African
Human Race ≠ Ecotype
•A group of individuals sharing one or more adaptations to a specific environment
• Sometimes the defining environmental variable is widespread, so an ecotype can refer to a large geographical population
• Different adaptive traits display discordant geographical distributions because the underlying environmental factors have discordant geographical distributions
• As a result, one will get different ecotypes for different adaptations
7/13/2015
7
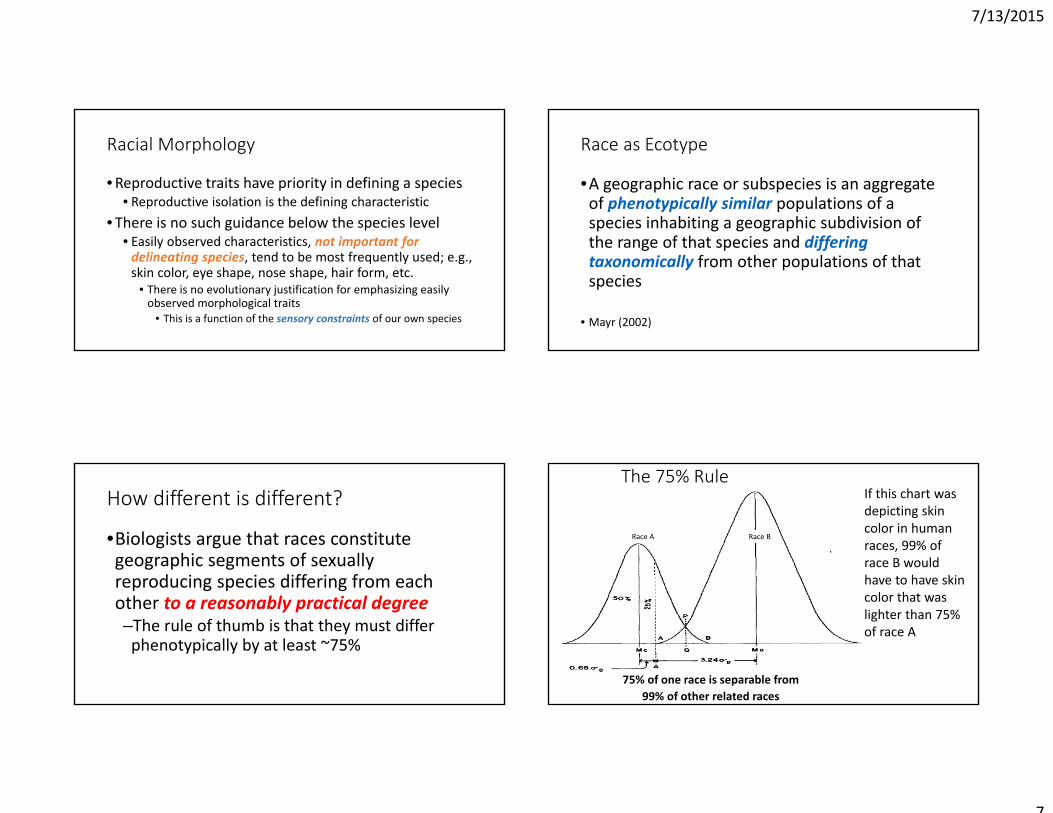
Racial Morphology
•Reproductive traits have priority in defining a species• Reproductive isolation is the defining characteristic
• There is no such guidance below the species level• Easily observed characteristics, not important for delineating species, tend to be most frequently used; e.g., skin color, eye shape, nose shape, hair form, etc.
• There is no evolutionary justification for emphasizing easily observed morphological traits
• This is a function of the sensory constraints of our own species
Race as Ecotype
•A geographic race or subspecies is an aggregate of phenotypically similar populations of a species inhabiting a geographic subdivision of the range of that species and differing taxonomically from other populations of that species
• Mayr (2002)
How different is different?
•Biologists argue that races constitute geographic segments of sexually reproducing species differing from each other to a reasonably practical degree–The rule of thumb is that they must differ phenotypically by at least ~75%
The 75% Rule
75% of one race is separable from 99% of other related races
Race A Race B
If this chart was depicting skin color in human races, 99% of race B would have to have skin color that was lighter than 75% of race A
7/13/2015
8
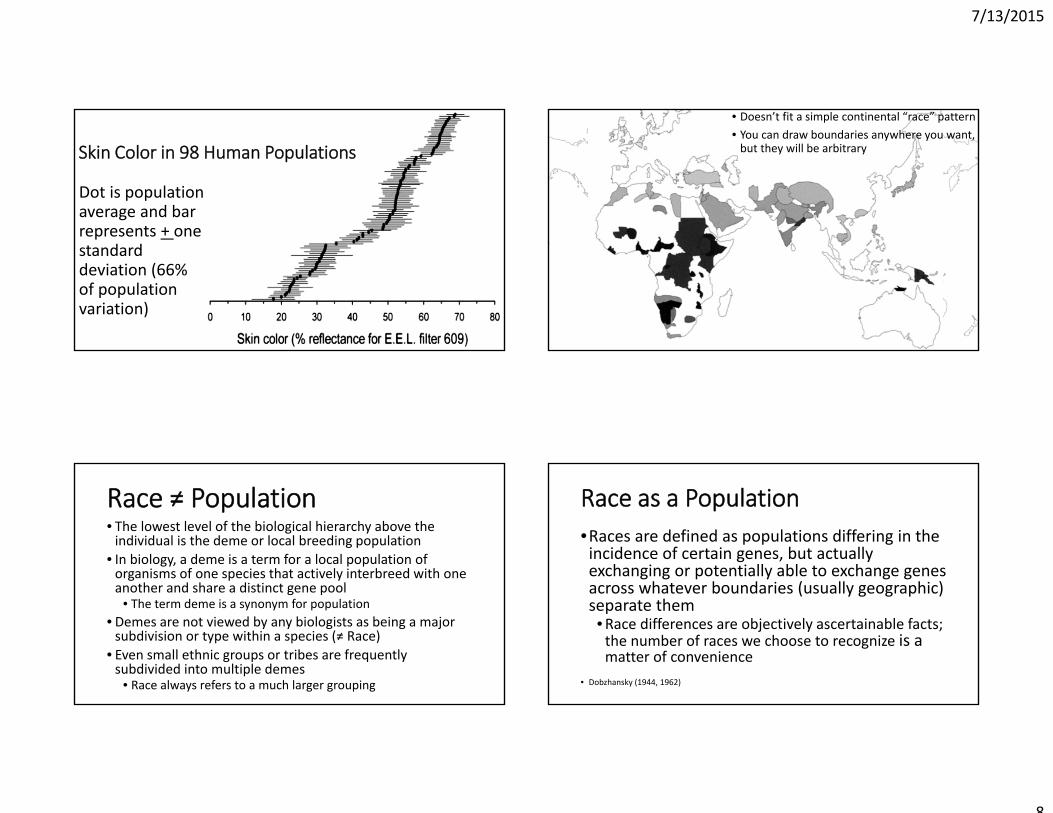
Skin Color in 98 Human Populations
Dot is population average and bar represents + one standard deviation (66% of population variation)
Skin color from reflectance
measured in 85 populations worldwide
• Doesn’t fit a simple continental “race” pattern• You can draw boundaries anywhere you want, but they will be arbitrary
Race ≠ Population • The lowest level of the biological hierarchy above the individual is the deme or local breeding population
• In biology, a deme is a term for a local population of organisms of one species that actively interbreed with one another and share a distinct gene pool
• The term deme is a synonym for population• Demes are not viewed by any biologists as being a major subdivision or type within a species (≠ Race)
• Even small ethnic groups or tribes are frequently subdivided into multiple demes
• Race always refers to a much larger grouping
Race as a Population•Races are defined as populations differing in the incidence of certain genes, but actually exchanging or potentially able to exchange genes across whatever boundaries (usually geographic) separate them•Race differences are objectively ascertainable facts; the number of races we choose to recognize is a matter of convenience
• Dobzhansky (1944, 1962)
7/13/2015
9
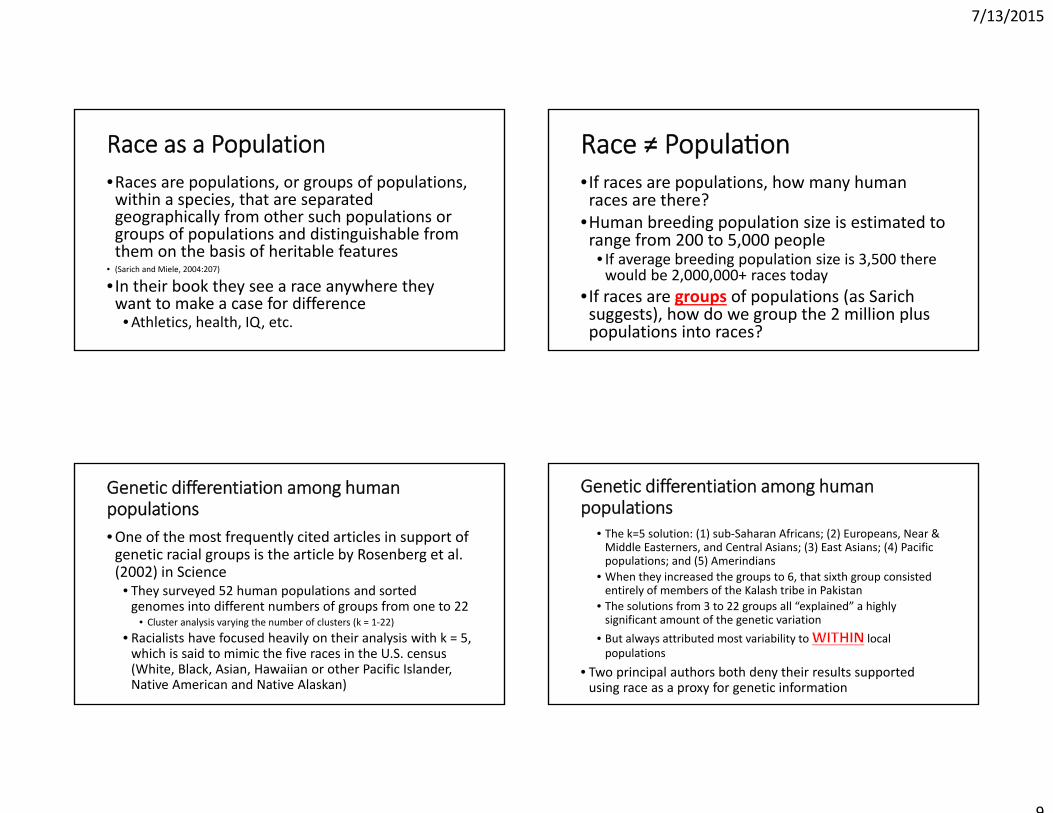
Race as a Population•Races are populations, or groups of populations, within a species, that are separated geographically from other such populations or groups of populations and distinguishable from them on the basis of heritable features
• (Sarich and Miele, 2004:207)
• In their book they see a race anywhere they want to make a case for difference•Athletics, health, IQ, etc.
Race ≠ Popula on • If races are populations, how many human races are there?
•Human breeding population size is estimated to range from 200 to 5,000 people• If average breeding population size is 3,500 there would be 2,000,000+ races today
• If races are groups of populations (as Sarich suggests), how do we group the 2 million plus populations into races?
Genetic differentiation among human populations•One of the most frequently cited articles in support of genetic racial groups is the article by Rosenberg et al. (2002) in Science
• They surveyed 52 human populations and sorted genomes into different numbers of groups from one to 22
• Cluster analysis varying the number of clusters (k = 1‐22)
• Racialists have focused heavily on their analysis with k = 5, which is said to mimic the five races in the U.S. census (White, Black, Asian, Hawaiian or other Pacific Islander, Native American and Native Alaskan)
Genetic differentiation among human populations
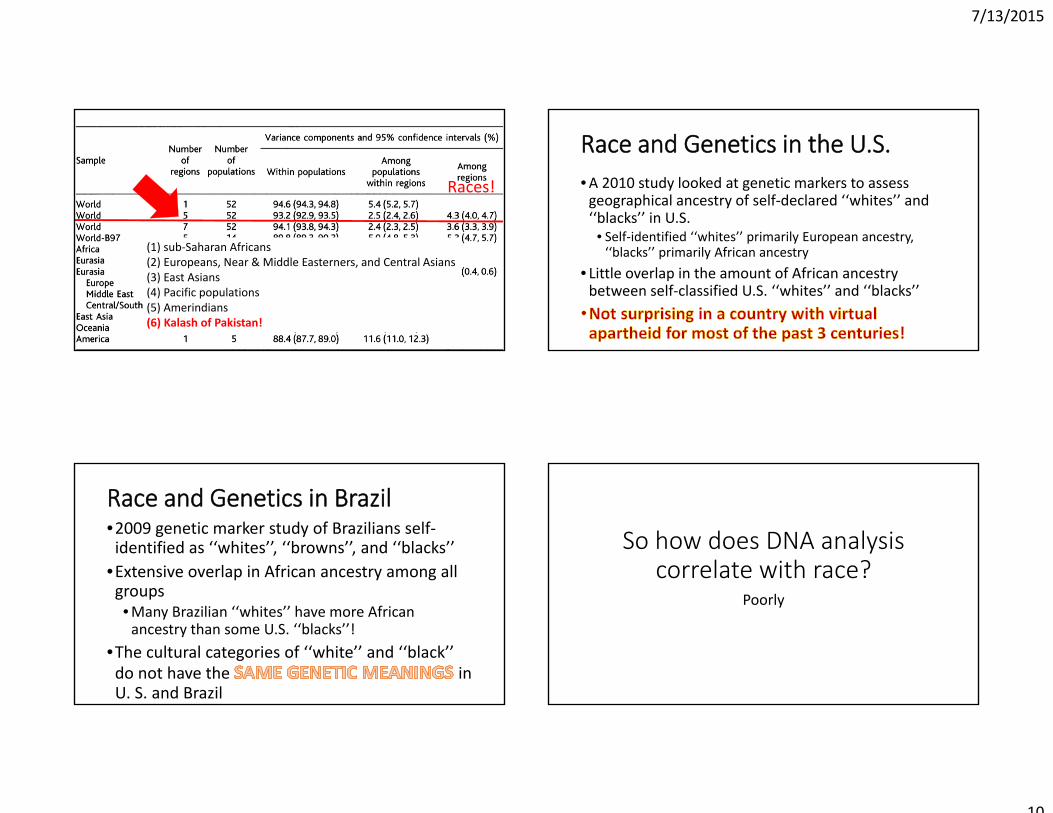
• The k=5 solution: (1) sub‐Saharan Africans; (2) Europeans, Near & Middle Easterners, and Central Asians; (3) East Asians; (4) Pacific populations; and (5) Amerindians
• When they increased the groups to 6, that sixth group consisted entirely of members of the Kalash tribe in Pakistan
• The solutions from 3 to 22 groups all “explained” a highly significant amount of the genetic variation
• But always attributed most variability to local populations
• Two principal authors both deny their results supported using race as a proxy for genetic information
7/13/2015
10
Races!
(1) sub‐Saharan Africans(2) Europeans, Near & Middle Easterners, and Central Asians(3) East Asians(4) Pacific populations(5) Amerindians
(1) sub‐Saharan Africans(2) Europeans, Near & Middle Easterners, and Central Asians(3) East Asians(4) Pacific populations(5) Amerindians(6) Kalash of Pakistan!
Race and Genetics in the U.S.•A 2010 study looked at genetic markers to assess geographical ancestry of self‐declared ‘‘whites’’ and ‘‘blacks’’ in U.S.
• Self‐identified ‘‘whites’’ primarily European ancestry, ‘‘blacks’’ primarily African ancestry
• Little overlap in the amount of African ancestry between self‐classified U.S. ‘‘whites’’ and ‘‘blacks’’
Race and Genetics in Brazil•2009 genetic marker study of Brazilians self‐identified as ‘‘whites’’, ‘‘browns’’, and ‘‘blacks’’
•Extensive overlap in African ancestry among all groups•Many Brazilian ‘‘whites’’ have more African ancestry than some U.S. ‘‘blacks’’!
•The cultural categories of ‘‘white’’ and ‘‘black’’ do not have the in U. S. and Brazil
So how does DNA analysis correlate with race?
Poorly
7/13/2015
11
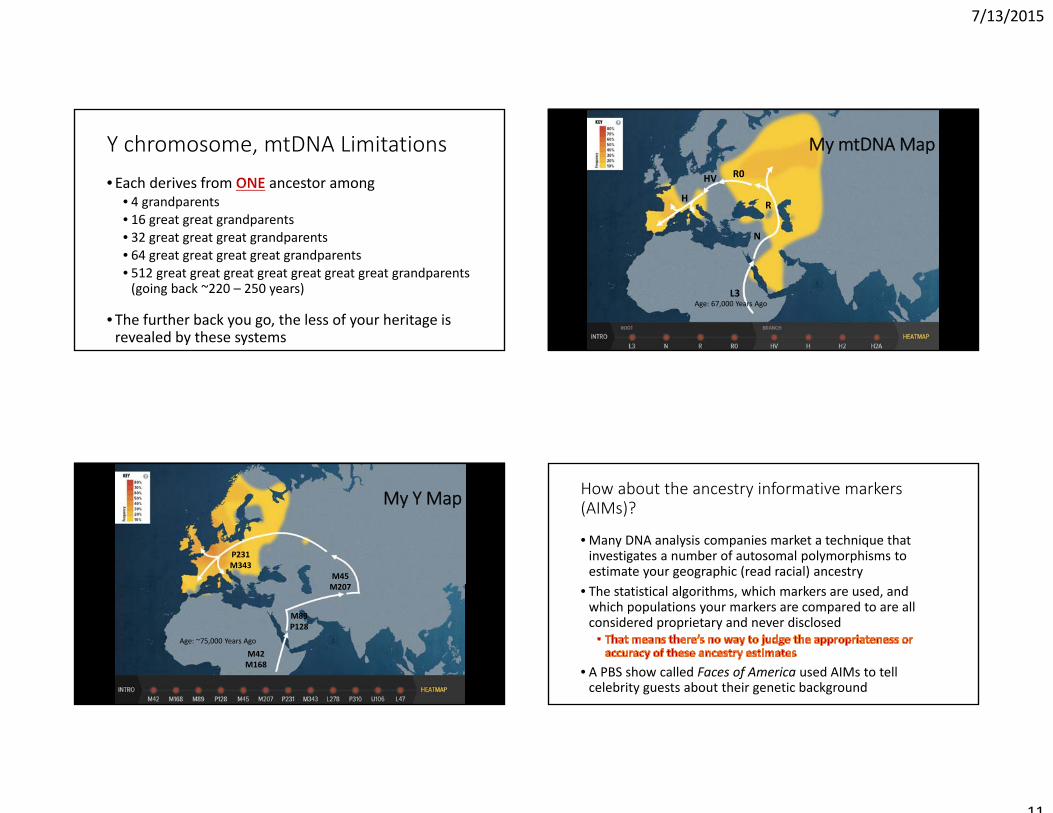
Y chromosome, mtDNA Limitations• Each derives from ancestor among
• 4 grandparents• 16 great great grandparents• 32 great great great grandparents• 64 great great great great grandparents• 512 great great great great great great great grandparents (going back ~220 – 250 years)
• The further back you go, the less of your heritage is revealed by these systems
My mtDNA Map
L3
N
R
R0HV
H
Age: 67,000 Years Ago
My Y Map
M42M168
M89P128
M45M207
P231M343
Age: ~75,000 Years Ago
How about the ancestry informative markers (AIMs)?
• Many DNA analysis companies market a technique that investigates a number of autosomal polymorphisms to estimate your geographic (read racial) ancestry
• The statistical algorithms, which markers are used, and which populations your markers are compared to are all considered proprietary and never disclosed
• A PBS show called Faces of America used AIMs to tell celebrity guests about their genetic background
7/13/2015
12
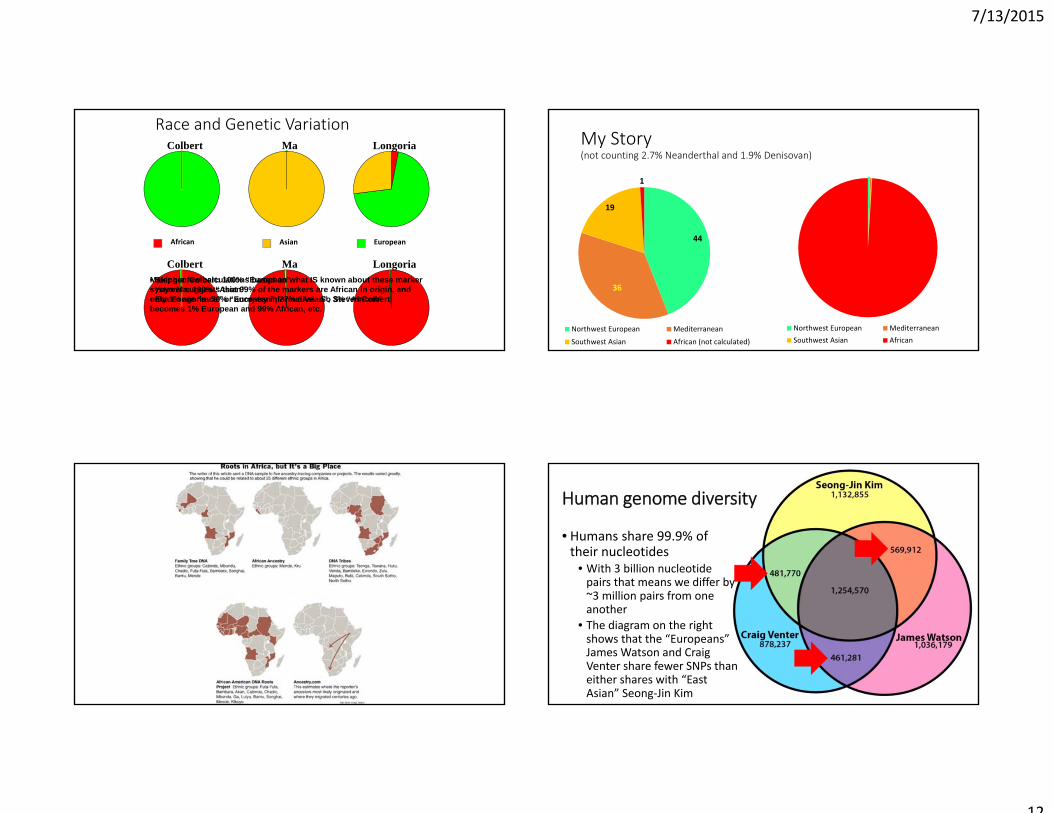
Race and Genetic Variation
Colbert Ma Longoria
Colbert Ma Longoria
African Asian European
• Stephen Colbert: 100% “European”• Yoyo Ma: 100% “Asian”• Eva Longoria: 70% “European”, 27% “Asian”, 3% “African”
Making a few calculations based on what IS known about these marker systems suggests that 99% of the markers are African in origin, and only 1% are “race” or ancestry informative. So Steven Colbert becomes 1% European and 99% African, etc.
My Story(not counting 2.7% Neanderthal and 1.9% Denisovan)
44
36
19
1
Northwest European Mediterranean
Southwest Asian African (not calculated)
Northwest European MediterraneanSouthwest Asian African
http://www.nytimes.com/2007/11/25/business/25dna.html?adxnnl=1&adxnnlx=1381948973‐Xws4rQN1JL1JeStQuxPirg
• Humans share 99.9% of their nucleotides
• With 3 billion nucleotide pairs that means we differ by ~3 million pairs from one another
• The diagram on the right shows that the “Europeans” James Watson and Craig Venter share fewer SNPs than either shares with “East Asian” Seong‐Jin Kim
Human genome diversity
7/13/2015
13
Jon Marks, Facebook post about genomic ancestry testing (3/10/2014)• [23andme] goes on about French and German, as if those were natural categories
• The size of the database, which determines the specificity of the match, is very important
• There’s also the related issue of representation: Which twenty Croatians represent Croatia in their database?
•The fact is that you don’t need a geneticist to tell a Dane from a Navajo; and a geneticist can’t tell a Dane from a German
In Conclusion
•Humans vary genetically from one another•That genetic variation is not racial in its patterning
•Race is cultural, not biological in humans