Embed Size (px)
Citation preview
Race and Stratification in College Enrollment over Time
We measure college enrollment-selectivity gaps by race/ethnicity using a novel method that
is sensitive to both the level (2- versus 4-year) and selectivity of the college in which students
enroll. We find that overall Hispanic-White and Black-White enrollment-selectivity gaps
closed in the U.S. between 1986 and 2014. This overall closing of gaps appears to be related
to the closing of high school graduation gaps. However, this contraction was driven almost
entirely by students at the margin between no college and college enrolling in non-degree
granting programs. Among students who enrolled in degree granting schools, Black students
have enrolled at increasingly less selective institutions than white students, while
Hispanic-White gaps remained relatively unchanged over the nearly 30 years of our study.
These gaps are concerning because of their implications for long-term economic inequality.
ABSTRACTAUTHORS
VERSION
November 2017
Suggested citation: Baker, R., Klasik, D., & Reardon, S.F. (Forthcoming). Race and Stratification in CollegeEnrollment over Time. AERA Open. Retrieved from Stanford Center for Education Policy Analysis: http://cepa.stanford.edu/wp16-14
CEPA Working Paper No. 16-14
Rachel BakerUniversity of California, Irvine
Daniel KlasikThe George Washington
University
Sean F. ReardonStanford University
Running Head: RACE AND STRATIFICATION IN COLLEGE ENROLLMENT
Race and Stratification in College Enrollment over Time
Rachel Baker*
Daniel Klasik**
Sean F. Reardon+
Version: November, 2017
Forthcoming, AERA Open
*Corresponding Author: Rachel B. Baker, School of Education, University of California, Irvine, 3200 Education, Irvine, CA 92697, [email protected], 949-824-2859 ** Graduate School of Education and Human Development, The George Washington University + Stanford University, Center for Education Policy Analysis
This work benefitted greatly from the thoughtful feedback of the faculty and students at Stanford University’s Center for Education Policy Analysis. Rachel Baker received support from the Stanford Predoctoral Training Program in Quantitative Education Policy Research, funded by the Institute of Education Sciences (IES Award R305B090016). The opinions expressed here do not represent those of the funding agencies. All errors are our responsibility.
RACE AND STRATIFICATION IN COLLEGE ENROLLMENT
2
Race and Stratification in College Enrollment over Time
Abstract
We measure college enrollment-selectivity gaps by race/ethnicity using a novel method that is sensitive
to both the level (2- versus 4-year) and selectivity of the college in which students enroll. We find that
overall Hispanic-White and Black-White enrollment-selectivity gaps closed in the U.S. between 1986 and
2014. This overall closing of gaps appears to be related to the closing of high school graduation gaps.
However, this contraction was driven almost entirely by students at the margin between no college and
college enrolling in non-degree granting programs. Among students who enrolled in degree granting
schools, Black students have enrolled at increasingly less selective institutions than white students, while
Hispanic-White gaps remained relatively unchanged over the nearly 30 years of our study. These gaps are
concerning because of their implications for long-term economic inequality.
Keywords: college enrollment gaps, college selectivity, race gaps
RACE AND STRATIFICATION IN COLLEGE ENROLLMENT
3
Race and Stratification in College Enrollment over Time
Americans have long recognized that education is one of the great drivers of social mobility; a
Bachelor’s degree provides one of the best chances for an economically secure life (Torche, 2011). And
the more selective the college a student attends, the higher the potential economic returns, particularly
for students from disadvantaged backgrounds (Dale & Krueger, 2011; Hoekstra, 2009). Yet we do not
have a clear view of access at these different levels of the higher education system. Although it has been
easy to track race-based gaps in overall college enrollment or at particular types of colleges (e.g. two-
versus four-year colleges), we lack a summary measure of racial disparities in college enrollment that
takes into account differences in both whether and where students enroll.
In other words, the level and selectivity of a student’s postsecondary destination is an important
predictor of later-life outcomes, but this nuance has not been fully accounted for in discussions of college
enrollment trends. Rather than tracking indicators of inequality by focusing on questions like, “did a
greater percentage of white students than black students enroll in college?” or even “did a greater
percentage of white students than Black students enroll in a selective college?” scholars and policymakers
need to attend to the full spectrum of postsecondary education destinations.
We regularly observe, for example, that access to selective colleges does not appear equal
between groups—minority and low-income students attend selective colleges at disproportionately low
rates (Reardon, Klasik & Baker, 2012; Alon & Tienda. 2007; Astin & Oseguera, 2004; Bowen & Bok, 1998;
Engberg, 2012; Posselt, Jaquette, Bielby, & Bastedo, 2012). However, these findings do not help us
understand the overall distribution of minority and low-income students in American higher education. If,
concurrent to downward trends at the most selective colleges, minority enrollment is increasing at
colleges that are moderately selective, then it may be that overall gaps in college destinations are closing,
indicating that progress is being made in college access for underrepresented groups, if not at the most
RACE AND STRATIFICATION IN COLLEGE ENROLLMENT
4
selective levels. Measuring these enrollment-selectivity gaps is difficult because the American higher
education system has a complex hierarchical structure, and access may increase at colleges of some
levels and decrease at others. As a result, it has been difficult to say succinctly whether disparities in
access have been increasing or decreasing over time.
We work to make such an assessment in this article. Specifically, we address four research
questions: (1) How big are the gaps in the selectivity of college attended by white and traditionally
underrepresented racial minority students? (2) Within which levels of college selectivity are these gaps
largest? And (3) How have these gaps changed over time? The ability to track changes in overall college
enrollment-selectivity gaps alongside other broad demographic and education trends—like changes race-
based income or high school graduation gaps—can help identify important correlates of the gaps. Thus,
we also ask: (4) How are trends in college enrollment-selectivity gaps related to trends in race-based gaps
in high school graduation, achievement, income, and parental education?
In answering these questions, we make three contributions to the understanding of racial
stratification in postsecondary schooling over time. First, our measurement of enrollment-selectivity gaps
succinctly quantifies the extent of racial stratification across all levels of postsecondary education. This
technique is helpful because it is difficult to simultaneously track changes in enrollment gaps across
multiple levels of postsecondary type and selectivity. Second, in contrast to earlier work that typically
examines enrollment gaps using national samples of high school students collected decades apart, we use
data that captures nearly the complete populations of students enrolled in postsecondary education
annually. Finally, we are among the first to look at macro-level trends in gaps other than college
enrollment to identify potential explanations for enrollment-selectivity gaps. In this endeavor, we update
and expand the work started by Kane (1994, 2004).

RACE AND STRATIFICATION IN COLLEGE ENROLLMENT
5
The Importance of College Choice
As college enrollment rates have grown, where—as opposed to if—a student attends college has
become increasingly important (Hoxby, 2004). U.S. higher education is distinctly hierarchical, with many
low-status, broad-access institutions at the bottom and relatively few high-status, exclusive-access
universities at the top (Labaree, 2017). Students who attend more selective colleges enjoy larger tuition
subsidies, more generous college resources, and more faculty attention (Hoxby, 2009; Hoxby & Avery,
2012). A growing body of research indicates that selective college attendance leads to higher average
earnings (Long, 2008; Black & Smith, 2004; Hoekstra, 2009), and the largest benefits may accrue to
minority and other disadvantaged students (Dale & Krueger, 2011).
But it is not only among the most prestigious schools that selectivity matters. Enrollment at less
competitive schools, even those that are marginally selective, affects several important outcomes.
College selectivity is related to the probability of completion both overall and for academically-marginal
and racial-minority students (Cohodes & Goodman, 2014; Goodman, Hurwitz, & Smith, 2017; Kurlaender,
Carrell, & Jackson, 2016; Long & Kurlaender, 2009; Melguizo, 2006; Smith & Stange, 2015) and the
probability of completing has implications for labor market outcomes and for the ability to manage
student loan debt (e.g. Dynarski, 2015). Selectivity, across the full distribution of schools, is also related to
initial earnings and earnings growth (MacLeod, Riehl, Saavedra, & Urquiola, 2015; Scott-Clayton, 2016),
and even provides a premium to already lucrative majors like business and the sciences (Eide, Hilmer, &
Showalter, 2016). However, racial minority students are less likely to choose high paying majors
(Carnevale, Strohl, & Melton, 2013), which—although we do not track majors in this article—suggests
that the economic implications of enrollment selectivity gaps are likely only exacerbated by differences in
major choice.
Thus, one step toward improving racial economic equality is to promote greater parity in
selectivity of college enrollment between race groups. Comparable levels of college enrollment between

RACE AND STRATIFICATION IN COLLEGE ENROLLMENT
6
race and ethnicity groups makes it more likely these groups will see comparable economic outcomes. For
this reason, it is important to track enrollment-selectivity gaps.
Improving on Prior Higher Education Student Stratification Research
Despite recent absolute increases in the percentage of Black and Hispanic students enrolling in
college (Perna, 2000), a greater share of white students than Black and Hispanic students attend college
(see for example, Berkner & Chavez, 1997; Kane, 1994, 2004; Perna, 2000). In addition to these general
enrollment gaps, Black and Hispanic students are also much less likely than white students to be enrolled
in four-year colleges in general (Bozick & Lauff, 2007; Dalton, Ingels, & Fritch, 2016) and more selective
colleges in particular (Reardon, Klasik & Baker, 2012; Bowen & Bok, 1998; Hearn 1991). Longitudinal
studies of admission to “very competitive” four-year colleges have shown increasing underrepresentation
of minority students (Alon & Tienda, 2007; Engberg, 2012; Karen, 2002; Posselt, et al., 2012). We aim to
add to this literature by measuring gaps in a way that it is sensitive to all college types and levels
simultaneously.
Most of these earlier studies have typically drawn conclusions about the racial composition of
colleges using samples of students from the National Longitudinal Survey of 1972, High School and
Beyond 1980, National Educational Longitudinal Study of 1988, and Educational Longitudinal Study of
2002. This data choice is problematic for two main reasons. First, these data sources are collected from
cohorts that are each almost a decade apart, limiting their precision in tracking trends over time. Second,
they are sampled to be representative of high school students, but not college students nor college
students at any particular level of selectivity. Thus, college enrollment analyses are sometimes supported
by sparse observations for specific racial groups at particular levels of higher education. In contrast, we
primarily use data from the Integrated Postsecondary Education Data System (IPEDS), which gives us a
nearly complete census of annual postsecondary enrollment. Although it has limitations that we note

RACE AND STRATIFICATION IN COLLEGE ENROLLMENT
7
below, IPEDS gives us a much more complete picture of postsecondary stratification and its evolution
over time, freeing us from the pitfalls of having to extrapolate from potentially small subsamples or
potentially anomalous cohorts of students.1
We analyze these data with a variation of the V-statistic methodology developed by Ho and
Reardon (2012). This method was first used to measure gaps on achievement tests in which only ordered,
categorical score thresholds (e.g. fail, low pass, pass, high pass), rather than continuous scores, were
available. Such data make it difficult to present easily digestible statistics that can be tracked over time
(such as, “white children score ten points higher than Black children, on average”). Ho and Reardon use
the V-statistic methodology to recover such test gaps by measuring the distribution of test scores implied
by the percentage of students of each race group that score above certain proficiency thresholds.
The V-statistic has also been used to describe income gaps (Reardon, Townsend, & Fox, 2017)
and differences in student test engagement (Soland, forthcoming). Here we use the method to quantify
enrollment-selectivity gaps using fixed, ordinal levels of selectivity rather than test thresholds. In effect,
the V-statistic approach quantifies the difference in the selectivity of college enrolled in by students from
different race/ethnicity groups (akin to the average difference in tests scores between groups), improving
upon prior approaches that examine group differences in the percentage of students who enrolled in any
one level of college (akin to difference in the percentage of students deemed proficient by a given test).
This technique is helpful because it is difficult to simultaneously track changes in enrollment
differences across multiple levels of postsecondary level and selectivity. As a basic example of this
challenge, consider a scenario in which 20 percent of college-age Black individuals enrolled in community
colleges, 15 percent in non-selective four-year colleges, and 3 percent in the most selective colleges, but
five years later these percentages were 22, 11, and 5, respectively. In this example, what should we
conclude about the relative representation of Black students relative to hypothetically unchanged white
enrollment patterns? The answer is difficult to give because Black students in this example gain ground in
RACE AND STRATIFICATION IN COLLEGE ENROLLMENT
8
some areas, but lose it in others. Additionally, in a more realistic example, the proportion of white
students enrolled in different levels would change too. The question becomes more complicated in the
present study because we examine nine different levels of postsecondary enrollment per race/ethnicity
over 28 years. The technique we use simplifies the enrollment-selectivity gap measurement to a single
number per year. To demonstrate the utility of such data simplification, consider the methods and figures
in Appendix A, which illustrate the difficulty of presenting the constituent data of our analysis an easily
interpretable way.
Although our primary interest is in describing overall enrollment-selectivity gaps, we also look at
how trends in enrollment-selectivity gaps change conditional on enrollment at certain levels of college.
Different trends in enrollment-selectivity gaps between different conditional analyses help determine the
postsecondary levels at which the change in gaps have been most dramatic.
Concurrent Trends
To the extent that we find trends in college enrollment-selectivity gaps over time, it is important
to understand why they change. We lay the foundation for future work in this area by considering
concurrent trends that may be related to observed changes in college enrollment-selectivity gaps.
Although there are many possible explanations for trends in enrollment-selectivity gaps, we focus on
academic and familial factors.
Academic factors. Both academic achievement and high school graduation likely play a role in
determining whether and where students enroll in college. Race-based academic achievement gaps have
been slowly closing over time (Jencks & Phillips, 1998; Reardon, Robinson-Cimpian, & Weathers, 2015). If
relative increases in academic performance by minority students are reflected in students’ postsecondary
enrollment choices, the narrowing of achievement gaps would predict the closing of enrollment-
selectivity gaps.

RACE AND STRATIFICATION IN COLLEGE ENROLLMENT
9
Although achievement plays a large role in selective colleges, most postsecondary institutions
have relatively minimal admissions criteria or accept the majority of students who apply (Klasik, Proctor,
& Baker, 2015). For students considering these options, high school graduation is the major academic
milestone they must reach. Although race-based high school graduation gaps have narrowed over the
past few decades (Murnane, 2015), as of 1999, the closing of these gaps, as well as the shrinking of gaps
in academic achievement, did not appear to be related to gaps in college enrollment (Kane, 2004).
Family factors. A student’s family plays many roles in the admissions process, but for our
exploratory purposes we focus on two: a family’s income and whether a student’s parents went to
college. These two factors have been found to be related to undermatching (Dillon & Smith, 2016; Smith,
Pender, & Howell, 2013) in which a student enrolls in a college that is less selective than one might expect
given the student’s academic background (Bowen & Bok, 1998; Roderick, Nagaoka, Coca, & Moeller,
2008) a phenomenon that itself may be related to enrollment-selectivity gaps.
In the U.S., postsecondary tuition/fees are positively correlated with admissions selectivity.2
Because Hispanic and Black families, on average, earn less than white families (Fryer, 2011; Patten, 2016),
some of the disparities in college destinations by race could therefore be the result of differences in
(perceived or actual) ability to pay, or other admissions benefits that are associated with coming from a
higher-income background (Reardon, Kasman, Klasik, & Baker, 2016). There is some evidence that income
gaps are slowly narrowing, especially for women (Kochhar & Fry, 2014; Patten, 2016), which may predict
increasing parity in college enrollment selectivity between groups.
We also focus on whether gaps in whether parents of college-age children attended college
themselves. Having a parent who went to college is a common indicator of social capital—sources of
information and support—and, in general, students with access to more sources of social capital are
more likely to enroll in college (Ellwood & Kane, 2000; Hossler, Schmit, & Vesper, 1999; McDonough,
1997; Perna 2006; Perna & Titus, 2005). There are notable differences by race in terms of access to social
RACE AND STRATIFICATION IN COLLEGE ENROLLMENT
10
capital (McDonough, 1997; Perna, 2006; Perna & Titus, 2005), so changes in access to social capital may
also explain trends in enrollment-selectivity gaps. Kane (1994) documented trends in Black-White gaps in
whether parents graduated from high school, noting that the closing of these gaps was associated with
the closing of college enrollment gaps into the late 1980s, but to our knowledge, race gaps in parental
postsecondary educational attainment have not previously been documented. Because parental
education strongly predicts the likelihood of college enrollment, we hypothesize that any closing of
parental educational attainment gaps would lead to closing college enrollment-selectivity gaps.
Other factors. We chose to look at academic and familial factors because they are supported by
theory and because they lend themselves to our primary goal of measuring and comparing nationwide
enrollment-selectivity gaps over time. Despite this focus, we note that these factors are not an exhaustive
account of the forces that shape students’ enrollment choices. Indeed, any policy or characteristic that
would lead students to make differential enrollment choices in ways that vary by race has the potential to
affect enrollment selectivity gaps. State-level policy is a particularly rich area for such policies: From
setting tuition to banning affirmative action, states engage in many activities that likely affect enrollment
choices differentially by race. It may also be that cohort sizes or relative changes in net tuition between
higher and lower selectivity institutions may also have a role to play, although it is unclear whether these
changes would lead to different enrollment choices by race. The variation in enrollment-selectivity gaps
that result from this extended list of explanations—either in terms of local, in-state gaps and broader,
national gaps—is not a topic we can do justice to in this study and is a limitation of our work. However,
we believe that our work is a useful starting point for thinking about state-specific issues and hope our
approach has value for future research in this area.
Data
The V-statistic approach requires data on the percentages of each race/ethnicity group enrolled
at each of the nine categories of level/selectivity of postsecondary destination that we consider. IPEDS,

RACE AND STRATIFICATION IN COLLEGE ENROLLMENT
11
our primary data source, gives the count of students by race at nearly every postsecondary institution.
Non-four-year colleges are classified by their level of offering (non-degree or two-year), while we classify
four-year colleges by their admissions competitiveness, as defined by the Barron’s Profile of American
Colleges. To convert the count of students enrolled at each level to percentages of the total cohort, we
use U.S. Census estimates of population size by race and age to calculate the total size of each
race/ethnicity group that is of college-going age (which also allows us to calculate the percent of each
cohort that is not enrolled in any post-secondary destination). We describe these data in detail below.
IPEDS
The enrollment data in the IPEDS database are collected annually by NCES from every college,
university, technical, and vocational institution that participates in federal student financial aid programs.
These data give enrollment rates by race from 1986 to 2014. Although IPEDS confers many important
advantages that allow us to fill gaps in prior work, it also presents notable challenges. These include
determining which students to include in our enrollment counts, unstable race categories, and a changing
population of schools. We outline these concerns, and our approach to addressing them, in brief below
and in detail in Appendix B. In short, each of the data complications does not appear to affect the
magnitude or trend of our estimated gaps in any appreciable way.
Count of students in each postsecondary destination. Our main analyses focus on full- and part-
time, first-time postsecondary students using IPEDS fall enrollment counts, which count first-time,
degree- or certificate-seeking students enrolled in the fall term. IPEDS did not include the “degree- or
certificate-seeking” qualifier in their 2000 survey, so we drop this year from our analysis. By capturing
only first-time students we avoid double counting students over time: if students were to transfer or
stop-out of college and then re-enter, their enrollment would count in the population proportions of two
cohorts of students.3 By focusing on full- and part-time students we avoid undercounting students in
RACE AND STRATIFICATION IN COLLEGE ENROLLMENT
12
community colleges and less-selective four-year colleges, where part-time enrollment is more common.
The trade-off to using all, rather than only full-time, students is the potential to double count students
who are enrolled at multiple institutions in their first term of attendance. We believe the prevalence of
double enrollment is relatively small and find little change in our results when we repeat the analysis
using only full-time students.
Institutions report the number of first-time students to IPEDS only in the fall. Because of this
schedule, students who enroll for the first time in the spring semester are not counted in our primary
data. If race groups first enroll in fall or spring at different rates, this could affect our estimated gaps. We
address this concern by re-estimating our gaps using 12-month enrollment counts (which include all
students, not just first-time enrollees) and find only minor changes in the magnitude, but not trend, of
our gaps.
Race groups. The race categories available in IPEDS are not constant across years. Between 2008
and 2010, IPEDS disaggregated Asian and Pacific Islanders and added a reporting category for students
who self-identified as being a member of two-or-more race groups. During the transition period,
institutions used either the original seven- or revised nine-category system, so we report gaps based on
total Black, Hispanic, and white students reported in either system and indicate the lack of categorical
clarity by a change of formatting in our figures. In Appendix B we bound the possible implications of the
race-category changes by re-estimating gaps after re-categorizing multi-racial students to different race
groups.
Population of colleges. Not all colleges are present in every year of IPEDS data. This irregularity is
due to two main factors. First, some schools did not exist for all years—there were many new entrants to
the postsecondary sector in this time and some schools closed. We are not concerned with this issue
because the opening and closing of schools, or even the expansion and contraction of enrollment at
individual institutions, represent changes in the supply of enrollment opportunities and may be an

RACE AND STRATIFICATION IN COLLEGE ENROLLMENT
13
important element of changes in enrollment-selectivity gaps. Indeed, we know that there was expansion
in the supply of seats in most sectors of higher education, but greater expansion at two-year colleges and
“competitive” four-year colleges over this time (Hurwitz & Kumar, 2015; Kelly, 2016). However, we
cannot say whether these changes happened in response to student demand or whether students altered
their enrollment choices to fill these newly-created seats. More importantly, it is not clear that these
capacity changes should differentially impact the enrollment choices of students by race or ethnicity.
A second concern about the irregular appearance of some institutions in the IPEDS data is that
reporting to IPEDS was not mandatory for all institutions that are eligible to receive federal Title IV funds
(the major source of federal student aid) until 1993 (Fuller, 2011). We indicate the potential
incompleteness of this population with special formatting in our figures and find in Appendix B that the
use of data from only institutions present in all years of data makes our gap estimates slightly larger.
Additionally, students who attend non-Title IV institutions are undercounted by IPEDS as data
reporting for these schools is voluntary (Cellini & Goldin, 2012). Non-Title IV institutions are
predominantly non-degree granting schools, and many are for-profit. Undercounting students in these
schools could bias our estimates of overall enrollment-selectivity gaps, as these non-counted students
would be attributed to the “no college” category. However, as this sector enrolls a relatively small
proportion of students, this bias should not dramatically affect our results. Additionally, this
undercounting is less of a problem at more selective colleges, so this bias will be reduced when we
condition our analyses on different levels of enrollment-selectivity.
While we cannot examine this issue directly using the IPEDS data, we investigate potential
implications two ways. First, in we measure enrollment-selectivity gaps with and without for-profit
schools. The differences between these two measures can give us a sense of the direction of the bias
induced by under-measurement of non-Title IV enrollment. Second, we compare gaps computed using
the longitudinal NCES longitudinal data sets popular in earlier research. These data include the

RACE AND STRATIFICATION IN COLLEGE ENROLLMENT
14
postsecondary destinations of all students in the sample, so undercounting enrollment at non-Title IV is
minimized.
Census Population Estimates
To examine the proportion of each cohort that does not enroll in a post-secondary destination,
we combined the IPEDS data with annual Census population estimates to determine the size of the entire
cohort of potential college students of each race/ethnicity group, regardless of their postsecondary
enrollment status. We use the estimated population size of 18-year-olds—the age of the traditional first-
year college student. Because of the increasingly varied age of students at their first college entry, the
decision to use 18-year-olds as the cohort denominator could affect measures of enrollment-selectivity
gaps. In Appendix B, we demonstrate that neither the size nor trend of our gaps qualitatively change
when we instead use an average of the size of the cohort of 18- to 24-year olds as our denominator.
Barron’s Admissions Competitiveness Data
The selectivity ratings of colleges and universities come from Barron’s Profiles of American
Colleges. Barron’s classifies four-year colleges and universities on a scale from 1-6, where 1 is the most
selective and 6 is the least selective.4 These ratings are based on the high school GPAs, high school class
ranks, and SAT/ACT scores of enrolled students, as well as on the proportion of applicants the schools
admit. Although Barron’s ratings have changed over time, the discussion of our results uses the 2008
rankings so that the group of colleges in each selectivity category is constant.5 We create separate
categories for two-year colleges and non-degree granting postsecondary institutions, which Barron’s does
not rate. Additionally, there are some (roughly 360) four-year colleges that are not rated by Barrons. In
our main analyses, we impute these ratings using publicly available data. In Appendix B we demonstrate
that our gap estimates do not qualitatively change when we drop these four-year institutions that do not
RACE AND STRATIFICATION IN COLLEGE ENROLLMENT
15
have Barron’s ratings rather than impute their selectivity .
Other Data Sources
We draw on data from numerous other sources to compare the trends we observe in college
enrollment-selectivity to gap trends in high school graduation, achievement, income, and parental
education.
High School Graduation. To examine gaps in high school graduation rates by race, we primarily
use data collected by Murnane (2015). He uses data from Census 1990, 2000, American Community
Survey 2010 and General Education Development (GED) Testing Service. These data, in combination,
address concerns in calculations of graduation rates (such as differences in coverage, categorization of
recent immigrants and treatment of students who earn a GED) that are present in a number of data
sources. These data include graduation rates by race for students who were 18 in 1986–2006.
We add data from the American Community Survey to track gaps in graduation rates for the
2007-2014 cohorts (Ruggles, Genadek, Goeken, Grove, & Sobek, 2016). In doing this, we replicated the
procedure described by Murnane (2015), adjusting for GED recipients and recent immigrants.
Achievement Gaps. Data on achievement gaps by race come from the National Assessment of
Educational Progress (NAEP). The NAEP Long-Term Trend tests are administered roughly every four years
in mathematics and reading to a national-representative sample of 9- 13- and 17-year old students. We
use data from 13-year olds (adjusted by 5 years to match age of college enrollment) because the
composition of the older cohort might be biased by differential high school drop-out rates by race.
Income. Data on income gaps by race come from the Current Population Survey (CPS) as
aggregated in the Integrated Public Use Data Series (Flood, King, Ruggles & Warren, 2016). Because the
CPS surveys individuals living in households, we look at the income of the parents of 14-17 year olds
(before students have moved out to enroll in college) from 1984 to 2012 and apply those gap estimates
to cohorts two years later, when those children could be enrolled in college. We use the seven income

RACE AND STRATIFICATION IN COLLEGE ENROLLMENT
16
categories reported in the CPS (<$15,000, $15,000-24,999, $25,000-34,999, $35,000-49,999, $50,000-
74,999, $75,000-99,999, and >$100,000).
Parental Education. Data on the parental education of college-age students also come from the
CPS (Flood, et al., 2016). As with income, we look at the education levels of the parents of 14-17 year olds
and apply those gap estimates to cohorts two years later, when those children could be enrolled in
college.
Method
The Measurement of Gaps with Ordinal Data
We quantify the disparities in enrollment by race across nine, ordinal categories of postsecondary
enrollment by type and selectivity. Specifically, we categorize enrollments according to whether students
are not enrolled in college, enrolled in a non-degree granting college, enrolled in a two-year college, or
enrolled in any of the six Barron’s selectivity levels of four-year colleges.
One useful measure to capture differences in the distribution of enrollments between two groups
of students using ordinal data is to look at the probability that a student from group a is enrolled at a
higher level than a student from group b (pa>b). An alternative to pa>b is the V statistic, a monotonic
transformation of pa>b that expresses the difference in selectivity as the standardized difference between
the mean enrollment selectivity of two groups (Cohen’s d) if the selectivity of colleges were transformed
into a metric in which both groups enrollment-selectivity pattern were normally distributed (Ho &
Reardon, 2012; Reardon, Kalogrides, & Shores, 2016). We use pa>b in our analysis because of its relative
ease of interpretability, but our results are largely unchanged if we use V.6
The calculation of pa>b is intuitively illustrated with a probability-probability (PP) plot, which
graphs the relative cumulative distribution functions of, for example, Black and white students enrolled at
a given level of education or lower. The area under the curve of a PP plot gives the probability that a
RACE AND STRATIFICATION IN COLLEGE ENROLLMENT
17
randomly chosen white student is enrolled in a post-secondary destination at a higher level of selectivity
than a randomly chosen Black student (pw>b) (Ho & Reardon, 2012). PP plots are analogous to the well-
established method for graphically displaying income inequality, the Lorenz curve.
An example of the PP plot for Black and white student college enrollment in 2010 is given in
Figure 1. Each point of the plot represents the percentage of students from each of the two race groups
that are enrolled in a given level of postsecondary education or lower. Note that if Black and white
students were equally represented at all levels of postsecondary education, the PP plot would trace a 45-
degree line and the area under the curve would be 0.5. That is, there would be a 50 percent chance that a
randomly chosen Black student would be enrolled in a lower level of selectivity than a randomly selected
white student.
While pa>b is equal to the area under a PP curve, and can be computed directly from these plots,
in this paper we use the methods described in Ho and Reardon (2012) and Reardon and Ho (2015) to
calculate V using maximum likelihood methods and then transform V to pa>b according to the function:
= Φ √ (1)
The calculation of V using the maximum likelihood method fits a smooth curve through the points
in the PP plot, which formalizes the assumption that there is some ordering of the two groups even within
an ordinal category (which, in this case, is akin to assuming that there is some ranking of colleges even
within a category). In contrast, directly computing the area under the curve from a PP plot assumes that
all people in a given category are tied in the ranking of their colleges.
pa>b is thus a single measure of college enrollment-selectivity gaps between students from
different race groups that accounts for differences in representation across ordinal categories of college
level and selectivity. In fact, only this ordinal property is important for determining pa>b; it does not rely
on any interval-scale properties of underlying college selectivity.

RACE AND STRATIFICATION IN COLLEGE ENROLLMENT
18
Conditional Gaps. Additionally, we limit our analysis to students who attend a college above a
given level of selectivity. Specifically, we examine enrollment-selectivity gaps conditional on enrollment
in: (1) any postsecondary education (between 41 and 53 percent of all 18-year-olds in the years of study),
(2) a degree-granting institution (between 41 and 50 percent), (3) a four-year college (between 28 and 33
percent), and (4) a very competitive (Barron’s 3) college (between 12 and 14 percent). These analyses
allow us to determine at which levels of college selectivity racial enrollment-selectivity gaps are the
largest or whether the trends differ by selectivity level. For example, small Black-White gaps for the entire
population coupled with large Black-White gaps conditional on enrollment in a four-year college would
indicate that Black and white students are attending college at similar rates but that they are attending
very different four-year schools.7
Concurrent trends
We use three methods to compute racial gaps in concurrent trends (high school graduation,
family income, parental education, and academic achievement). For data that are reported by category
(e.g. income), we calculate pa>b according to the method above. For binary measures, we computed a
standardized difference in means (akin to V) and then converted the result to probability units according
to equation (1), ensuring all gaps are on the same scale. We accomplish this either by direct calculation
(for graduation rates) or by estimating a probit regression of the outcome variable controlling only for
indicators of race, omitting the indicator for white students (for parental education). The coefficients on
each race/ethnicity indicator give the gap in parental education. Finally, for continuous data (NAEP
scores), we computed a standardized difference in group means, which we also converted to probability
units according to equation (1).
We calculate bivariate correlations between each of these concurrent gaps and our enrollment-
selectivity gaps (both the overall gap and each of the enrollment-selectivity gaps conditional on given

RACE AND STRATIFICATION IN COLLEGE ENROLLMENT
19
levels of enrollment). These correlations provide simple evidence of how changes in college enrollment-
selectivity gaps might be related to changes in gaps in pre-college measures. Because of the small
number of time points we observe each gap, we use α = 0.1 to assess statistical significance of these
correlations.
While these simple correlations provide a sense of which gaps tend do trend together, they could
be misleading; they do not account for the correlation between various concurrent trends (for example,
income gaps are likely related to both test score gaps and enrollment-selectivity gaps) and they do not
account for potentially spurious correlations because of underlying time trends (Granger & Newbold,
1974). To address these concerns, we also examine these relationships using more robust methods that
allow us to make explicit assumptions about which time series trends are related to each other.
Specifically, we use structural vector autoregressions (SVAR) (Sims, 1980) to predict enrollment-selectivity
gaps using all other concurrent trends, lagged versions of these trends, and the lagged dependent
variable. Our data greatly limit our ability to make robust conclusions from these analyses (namely, we
only have measured test gaps for 11 of the 28 years, reducing our already limited power), so we briefly
discuss where the results from these models align with our bivariate correlations in the results section
and present the full set of results in Appendix C. Whether interpreting our correlations or the SVAR
analyses, the results should be taken as descriptive rather than causal.
Results
Enrollment-Selectivity Gaps
Figure 2 gives the change in college enrollment-selectivity gaps from 1986-2014 for both Black
and Hispanic students relative to white students. This figure accounts for all possible postsecondary
destinations, including not enrolling in any further education. With some variation, both Black and
Hispanic students have seen their overall college enrollment-selectivity gaps shrink relative to white
RACE AND STRATIFICATION IN COLLEGE ENROLLMENT
20
students (recall that gaps closer to a probability of 0.50 indicate greater parity between race groups). The
Black-White gap has shrunk from pw>b=0.66 to 0.53. That is, in 1986 there was a 66% chance that a
randomly chosen white student was in a higher selectivity postsecondary destination than a randomly
chosen Black student. In 2014 this had dropped to a 53% chance, indicating that postsecondary
destinations for these groups have been increasingly similar over this period. Over the same time period,
the Hispanic-White gap shrunk from pw>h=0.72 to 0.58. White students on average still attend more
selective institutions, particularly relative to Hispanic students.
The story of an overall decrease in college enrollment-selectivity gaps for Black and Hispanic
students shifts when examine gaps that are conditional on enrollment at specified levels (for example,
gaps among students enrolled in four-year colleges). This change is seen in Figures 3 and 4, which give,
respectively, the Black-White and Hispanic-White college enrollment-selectivity gaps over time using only
(a) students enrolled in any postsecondary destination, (b) students enrolled in a degree granting college,
(c) students enrolled in four-year colleges and (d) students enrolled in very selective colleges.
First, in Figure 3 (Black-White gaps), enrollment-selectivity gaps conditional on attending any
post-secondary institution have grown over time; among students enrolled in any post-secondary
destination, the probability that a randomly chosen white student is attending a higher selectivity post-
secondary destination than a randomly chosen Black student has increased. This contrast from the
decrease in gaps seen in Figure 2 appears to be a consequence of the only population of students in
Figure 2 not included in Figure 3: students not enrolled in college. In other words, it appears that nearly
all the relative gains in Black postsecondary enrollment have occurred at the margin of attendance.
We see a similar marginal enrollment story when we condition on enrollment in a degree-
granting institution. As recently as 1990, the enrollment-selectivity gap between Black and white students
in this group was essentially zero (pw>b = 0.50). Since then, however, this gap has grown to where pw>b is
nearly 0.61. The fact that the Black-White gap among students attending degree granting schools is

RACE AND STRATIFICATION IN COLLEGE ENROLLMENT
21
consistently smaller than the gap among students attending any post-secondary institution (including
certificate programs) is a sign that Black students are increasingly more likely than white students to
enroll in non-degree granting programs and that Black and white students are likely enroll in two-year
colleges at similar rates to each other. Indeed, in 1990, among all white students enrolled in any post-
secondary institution, 3.6 percent attended a non-degree granting school. This had increased to 5.6
percent by 2010. The corresponding increase was much sharper for Black students; in 1990 5.6 percent of
all Black college attended a non-degree granting institution and by 2010 this had increased to over 11
percent.8
Black-White enrollment-selectivity gaps conditional on four-year college attendance are the
largest of the gaps we examine. This gap has hovered with pw>b around 0.64 for the past 30 years.
Enrollment-selectivity gaps have been similarly stable at the most selective colleges (Barron’s rating 1-3),
but very small with pw>b close to 0.50. However, it should be emphasized that this final gap is calculated
using the relatively few Black students that enroll in these schools at all.
Figure 4 gives the analogous trends for the Hispanic-White gaps. These trends tell a different
story. Like Black students, Hispanic students saw a relative minimum in their enrollment-selectivity gaps
relative to white students in the early 1990s, but over the nearly 30 years covered by the figure, their
enrollment-selectivity gap with white students has remained broadly unchanged, no matter which subset
of students we examine. Unlike with the Black-White gaps, the largest gaps are among the populations
that include non-degree enrollment and enrollment at two-year colleges. This consistently large gap is an
indication that while Hispanic students are attending college at rates that are increasingly similar to white
students, they are attending less selective schools, including non-degree granting programs and two-year
schools, at much higher rates.
Enrollment-selectivity gaps between Hispanic and white students are smallest among four-year
college enrollees. These gaps are much smaller than Black-White gaps among four-year enrollees. This
RACE AND STRATIFICATION IN COLLEGE ENROLLMENT
22
indicates that Hispanic students that enroll in four-year colleges are distributed more like white students
across levels of selectivity than Black students are.
Conditional on attendance at the most selective colleges (Barron’s 1-3), Hispanic students enroll
at more selective colleges than white students, though this gap has shrunk over the past 30 years. This is
in contrast to Black students enrolled in the most selective colleges, who attend schools that are of
similar selectivity to white students. However, it should again be emphasized that this gap is calculated
using the relatively few Hispanic students that enroll in these schools at all.
College Enrollment-Selectivity Gaps and Concurrent Trends
To identify macro-level trends in gaps of pre-college measures that covary with enrollment-
selectivity gap trends, we compare the enrollment-selectivity gap trends to concurrent trends in gaps in
high school graduation, achievement, family income, and parental education using correlational analyses.
The graphical presentations of these overall gaps in selectivity of enrollment, gaps in selectivity of
enrollment conditional on four-year enrollment, and concurrent gaps (all presented as pw>b/h)are found in
line graphs in Figures 5 and 6 for Black-White and Hispanic-White gaps, respectively, and the bivariate
correlations are found in Table 1. Note in Figures 5 and 6 that nearly all the concurrent gaps (except
graduation) are larger than the enrollment-selectivity gaps. This pattern suggests that despite persistent
college enrollment selectivity gaps, these gaps are in fact narrower than at other points in students’ life
course.
One common pattern among these results is that estimated relationships (using both bivariate
correlations and the more sophisticated SVAR models), is that they tend to flip signs between overall gaps
and conditional gaps. This is expected, given that overall gaps in enrollment-selectivity are decreasing, but
that nearly every gap that conditions on a minimum level of enrollment is increasing.

RACE AND STRATIFICATION IN COLLEGE ENROLLMENT
23
In our bivariate correlation analysis, Black-White high school graduation gaps are significantly
correlated with overall enrollment-selectivity gaps (r = 0.449) and enrollment-selectivity gaps conditional
on enrollment in selective four-year colleges (r = -0.389). These correlations appear mostly driven by the
shrinking graduation gaps in the late 1990s and between 2005 and 2010 (Figure 5). The SVAR analysis
provides some support for the relationship between graduation gaps and enrollment-selectivity gaps. As
shown in Appendix Table C1, we find a significant, positive relationship between Black-White high school
graduation gaps and overall selectivity gaps and a significant negative relationship between graduation
gaps and enrollment-selectivity gaps conditional on enrollment in a four-year college. The estimate of this
relationship is larger for enrollment-selectivity gaps conditional on selective college enrollment, however
this relationship does not reach conventional levels of significance.
The correlational analysis also indicates a negative relationship between Black-White gaps in
whether students’ parents went to college and enrollment-selectivity gaps conditional on enrollment at a
selective college. The SVAR confirms this relationship between these two variables with respect to
enrollment-selectivity gaps conditional on enrollment at a four-year college, however it suggests a
positive relationship between parental education gaps and enrollment-selectivity gaps conditional on
enrollment at a selective college, indicating there may be a complicated relationship between gap trends
that is not captured in our correlational analysis.
Trends in Hispanic-White enrollment-selectivity gaps and concurrent gaps are shown in Figure 6
with the bivariate correlations between gaps in Table 1. Here we see two sets of statistically notable
correlations: (1) a negative correlation between high school graduation gaps and enrollment-selectivity
gaps conditional on attendance at least a four-year college and a positive relationship between high
school graduation gaps and overall Hispanic-White selectivity gaps, and (2) a negative correlation
between gaps in parental college enrollment and overall enrollment-selectivity gaps. The graduation gap
correlations are also present in both the overall and the conditional SVAR results. As with the Black-White

RACE AND STRATIFICATION IN COLLEGE ENROLLMENT
24
gaps, the SVAR results also indicate a relationship between parental college gaps and enrollment-
selectivity gaps, but the story is more consistent—larger Hispanic-White gaps in terms of the proportion
of students whose parents have a college education are associated with larger enrollment-selectivity gaps
both overall and conditional on enrollment in a selective college.
Estimates from the SVAR models also suggest a positive relationship between income gaps and
both overall enrollment gaps (for Black students) and gaps at selective college admissions (for Hispanic
students). Although not apparent in the correlation analysis, this relationship goes in expected direction
in that larger income gaps are associated with larger enrollment gaps.
Conclusion
A growing body of evidence supports the fact that a student’s likelihood of graduation as well as
her long term economic outcomes are determined not just by whether she enrolls in college, but where
she enrolls. Because of this connection between the level and selectivity of postsecondary enrollment
and issues of economic equity, we present a comprehensive way of measuring college enrollment-
selectivity gaps that is sensitive to these important distinctions in postsecondary destinations. This
approach improves on earlier methods of measuring enrollment gaps that could only look at one type of
enrollment at a time.
In short, we find that overall Black- and Hispanic-White gaps in college enrollment-selectivity
shrunk considerably between 1986 and 2014, but white students still attend, on average, more selective
post-secondary destinations than their Black and Hispanic peers. On their face, these narrowing gaps are
encouraging, particularly since it appears that shrinking enrollment-selectivity gaps are related to
shrinking high school graduation gaps; efforts to improve high school graduation rates may have longer-
term benefits in terms of opening access to postsecondary education.
However, this rosy view of closing enrollment-selectivity gaps is tempered by our finding that the

RACE AND STRATIFICATION IN COLLEGE ENROLLMENT
25
closing of gaps for both Black and Hispanic students appears to be driven entirely by more of these
students making the choice to enroll in non-degree granting postsecondary programs rather than not
enroll in college at all. Indeed, once we remove these marginal postsecondary enrollees from our analysis,
over the past three decades enrollment-selectivity gaps have been consistently growing for Black
students, and growing, albeit more gradually, for Hispanic students. Thus, although closing graduation
gaps may be associated with greater access to postsecondary education for Black and Hispanic students,
these gains only appear to be reflected in marginal enrollment choices and Black and Hispanic students
are still falling behind their white peers in the rate at which they are able to access more selective levels
of higher education.
Of the traditionally underrepresented students who successfully enroll at the most selective
colleges, Black students do so at selectivity levels similar to, and Hispanic students greater than, their
white peers. However, this finding obscures the fact that not many Black and Hispanic students enroll at
these levels at all (Posselt, et al., 2012; Reardon, Klasik & Baker, 2012). Indeed, in 2014, six, seven, and 18
percent of Black, Hispanic, and white students were enrolled in these colleges, respectively.
Often, successful graduation from high school is all that is needed to access the majority of
postsecondary options in the U.S.—those institutions that are essentially open access. Thus, it seems
intuitive that the closing black-white high school graduation gaps is associated with closing of overall
enrollment-selectivity gaps. However, the rest of our findings about the relationship between graduation
gaps and enrollment-selectivity gaps do not provide such easy explanations. Indeed, the relationship
between Black-White high school graduation gaps and enrollment-selectivity gaps conditional on various
levels of college attendance suggest that the closing of graduation gaps has been accompanied by an
increasing advantage of white students over black students in terms of their postsecondary destinations.
The same story is true for Hispanic-White students. Thus, we may be demonstrating evidence of
effectively maintained inequality (Lucas, 2001)—as the competition for seats at open-access institutions

RACE AND STRATIFICATION IN COLLEGE ENROLLMENT
26
has become more even, white students appear to be marshaling other resources to preserve their
enrollment-selectivity advantage.
This explanation may also result from another trend that we do not explicitly address in this
article: the early 1990s represented a low point in the size of the college-age population, but by 2010 the
college-age population reached a relative peak. This population growth means that, over the course of
most of our analysis, competition for seats in college was increasing. Although the supply of enrollment
options increased as well, most of this expansion happened at the two- rather than the four-year sector
(Kelly, 2016). Our enrollment-selectivity gaps are consistent with a story in which there has been an
absolute increase in access to postsecondary education for all groups but little relative change in access
to different levels of selectivity—privileged groups stay one step ahead.
We also want to highlight that Black and Hispanic do not appear to be following the same path in
terms to enrollment-selectivity gaps, either in terms of the relative magnitude of their gaps with white
students or in the rate at which the gaps are changing. Neither do the potential explanatory gaps appear
to be related to enrollment-selectivity gaps in the same way for these two race groups. For example,
while there is alignment in terms of the general findings about the relationship between graduation gaps
and enrollment-selectivity gaps, the Black and Hispanic stories diverge with respect to the relationship
between gaps in whether students have parents who attended college and enrollment-selectivity gaps.
Here, our evidence points to a minimal, and perhaps negative relationship between these two gaps for
Black students, while it leans positive for Hispanic students, particularly at more selective colleges when
we add the additional controls of the SVAR models. Thus, college attendance for Black parents does not
appear to convey the same field-leveling benefits in terms of their children’s higher education as it does
for Hispanic parents. This perspective on the differing intergenerational returns to higher education adds
more evidence to research that has described the value of parental educational attainment for Latino
RACE AND STRATIFICATION IN COLLEGE ENROLLMENT
27
families (Ovink & Kalogrides, 2015), and its weakness for Black families relative to White families (Long,
Kelly, & Gamoran, 2010).
Gaps in college enrollment selectivity have important implications for equity and career
outcomes. Measuring these gaps in a way that reflects the diversity of post-secondary options creates a
valuable metric that allows us to judge whether reform efforts are leading us toward greater educational
parity. Our efforts to document the relationships between academic and socio-economic gaps and
enrollment-selectivity gaps should support the development of new research on policies that are targeted
at increasing equity in educational outcomes.

RACE AND STRATIFICATION IN COLLEGE ENROLLMENT
28
Notes
1 For example, the NELS data is anomalous because it followed a cohort of students that was among the
smallest of any since the mid-60s (NCES, 2014). Given the relative rarity of universities deciding to shrink
their enrollment, this small cohort faced less competition for existing seats at selective colleges, making it
more likely that students with lower academic credentials could gain admission to these selective schools.
As a result, we may see increases in representation of racial and ethnic minorities in this cohort at more
selective schools separate from any underlying change in access to educational opportunity or changes in
university policies.
2 There is, of course, an important distinction between an institution’s listed tuition and fees, and the
average amount students actually pay to attend. Conditional on family income and after financial aid has
been accounted for, many of the most selective four-year schools actually have lower net tuition than
other selective four-year schools (Hoxby, 2009). However, many students are not aware that sticker price
can differ significantly from net price or have difficulty finding net price information (Hoxby & Turner,
2015), so the positive correlation between selectivity and price generally holds.
3 To the extent the college from which one graduates is more important than the school(s) at which one
took classes (an argument that signaling is more important than human capital development), and the
extent to which students from different racial groups exhibit significantly different patterns of transfer,
using first school of enrollment could produce biased results. If anything, we are likely understating
potential graduation gaps, as, conditional on attendance, white students are more likely to transfer from
2-year schools to 4-year schools than Black and Hispanic students (NCES, 2011 Community College
Student Outcomes (2012-253), Table S1-B).
4 Barron’s also assigns a ranking of 7, which indicates “specialty” schools—such as divinity schools or the
military academies. Because these schools use different admissions criteria and draw specialized
applicant pool, we exclude these schools from our analysis.
RACE AND STRATIFICATION IN COLLEGE ENROLLMENT
29
5 In the analyses we present in this paper, we use the 2008 Barron’s rankings for all years. In reality, in the
years of our analyses, the Barron’s selectivity increases for a small subset of institutions in our data, but
the relative selectivity of schools is largely stable. We conducted sensitivity analyses using time varying
(2004, 1992, and 1982, as opposed to constant 2008) measures of selectivity and find no appreciable
changes in results (these results are available upon request). We thus present only findings using 2008
Barron’s rankings, consistent with the decisions of past researchers (e.g. Bastedo & Jaquette, 2011).
6 Figures presented with V-statistics are available from the authors upon request.
7Although it is possible to calculate confidence intervals for our measures, we chose not to present them
for two reasons: (1) our data is not a sample, it captures the full population of interest, so the
interpretation of confidence intervals is not clear and (2) our large number of observations generates
confidence intervals that are quite small (and not visible when graphed). Indeed, if we were to consider
our population as a sample, these minute standard errors mean that even the very small changes that we
report are “statistically significant.” Though not presented, confidence intervals are available from the
authors upon request.
8 Examples of non-degree granting schools are Central Mass School of Massage & Therapy, Rob Roy
Academy, and Giumenta School of Real Estate.
RACE AND STRATIFICATION IN COLLEGE ENROLLMENT
30
References
Alon S., & Tienda, M. (2007). Diversity, opportunity, and the shifting meritocracy in higher education.
American Sociological Review, 72, 487.
Astin, A. W., & Oseguera, L. (2004). The declining “equity of American higher education. The Review of
Higher Education, 27(3), 321-341.
Bastedo, M. N. & Jaquette, O. (2011). Running in place: Low-income students and the dynamics of higher
education stratification. Educational Evaluation and Policy Analysis, 33, 318-339.
Berkner, L., & Chavez, L. (1997). Access to Postsecondary Education for the 1992 High School Graduates.
US Dept. of Education, Office of Educational Research and Improvement, National Center for
Education Statistics.
Black, D., & Smith, J. (2004). How robust is the evidence on the effects of college quality? Evidence from
matching. Journal of Econometrics, 121, 99.
Bowen, W. G., & Bok, D. C. (1998). The Shape of the River: Long-Term Consequences of Considering race in
College and University Admissions. Princeton, NJ: Princeton University Press.
Bozick, R. & Lauff, E. (2007). Education Longitudinal Study of 2002: A First Look at the Initial
Postsecondary Experiences of the High School Sophomore Class of 2002. NCES Working Paper
2008-308.
Carnevale, A. P., Strohl, J., & Melton, M. (2013). What’s It Worth? The Economic Value of College Majors.
Washington, DC: Georgetown University Center on Education and the Workforce.
Cellini, S. R. (2012). For-profit higher education: An assessment of costs and benefits. National Tax
Journal, 65(1), 153.
Cellini, S. R., & Chaudhary, L. (2014). The labor market returns to a for-profit college education.
Economics of Education Review, 43, 125-140.
Cellini, S. R., & Goldin, C. (2012). Does federal student aid raise tuition? New evidence on for-profit

RACE AND STRATIFICATION IN COLLEGE ENROLLMENT
31
colleges. National Bureau of Economic Research Working Paper w17827.
Cohodes, S., & Goodman, J. (2014). Merit aid, college quality, and college completion: Massachusetts’
Adams Scholarship as an in-kind subsidy. American Economic Journal: Applied Economics, 6(4),
251-285.
Dale, S., & Krueger, A. B. (2011). Estimating the return to college selectivity over the career using
administrative earnings data. National Bureau of Economic Research Working Paper w17159.
Dalton, B., Ingles, S.J., & Fritch, L. (2015). Highs School Longitudinal Study of 2009 (HSLS:09) 2013 Update
and High School Transcript Study: A First Look at Fall 2009 Ninth-Graders in 2013. Washington,
DC: National Center for Education Statistics.
Darolia, R., Koedel, C., Martorell, P., Wilson, K., & Perez-Arce, F. (2015). Do Employers Prefer Workers
Who Attend For-Profit Colleges? Evidence from a Field Experiment. Journal of Policy Analysis and
Management, 34(4), 881-903.
Deming, D., Goldin, C., & Katz, L. (2013). For-profit colleges. The Future of Children, 23(1), 137-163.
Dynarski, S. M. (2015). An Economist's Perspective on Student Loans in the United States. CESifo Working
Paper Series No 5579.
Eide, E. R., Hilmer, M. J., & Showalter, M. H. (2016). Is it where you go or what you study? The relative
influence of college selectivity and college major on earnings. Contemporary Economic Policy,
31(1), 37-46.
Ellwood, D. T., & Kane, T. J. (2000). Who is getting a college education? Family background and the
growing gaps in enrollment. In S. Danziger and J. Waldfogel (Eds.) Securing the Future: Investing in
Children from Birth to College (pp. 283-324). New York: Russell Sage Foundation.
Engberg, M. E. (2012). Pervasive inequality in the stratification of four-year college destinations. Equity &
Excellence in Education, 45(4), 575-595.
Flood, S., King, M., Ruggles, S., & Warren, J. R. (2016). Integrated Public Use Microdata Series, Current

RACE AND STRATIFICATION IN COLLEGE ENROLLMENT
32
Population Survey: Version 4.0. [dataset]. Minneapolis: University of Minnesota.
Fryer, R. G. (2011). Racial inequality in the 21st century: The declining significance of discrimination.
Handbook of Labor Economics, 4, 855-971
Fuller, C. (2011). The History and Origins of Survey Items for the Integrated Postsecondary Education Data
System. Washington, DC: U.S. Department of Education, National Postsecondary Education
Cooperative.
Goodman, J., Hurwitz, M., & Smith, J. (2017). Access to 4-year public colleges and degree completion.
Journal of Labor Economics, 35(3), 829-867.
Granger, C. W. J., & Newbold, P. (1974). Spurious regressions in econometrics. Journal of Econometrics, 2,
111-120.
Hearn, J. C. (1991). Academic and nonacademic influences on the college destinations of 1980 high school
graduates. Sociology of Education, 64, 158-171.
Ho, A., & Reardon, S. (2012). Estimating achievement gaps from test scores reported in ordinal
“proficiency” categories. Journal of Educational and Behavioral Statistics, 37(4), 489-517.
Hoekstra, M. (2009) The effect of attending the flagship state university on earnings: a discontinuity-
based approach. The Review of Economics and Statistics, 91(4), 717.
Hoxby, C. (2004). College Choices: The Economics of Where to Go, When to Go, and How to Pay for It.
Chicago: University of Chicago Press.
Hoxby, C. (2009). The changing selectivity of American colleges. Journal of Economic Perspectives, 23(4),
95-118.
Hoxby, C., & Avery, C. (2012). The missing “one-offs”: The hidden supply of high-achieving, low income
students. National Bureau of Economic Research Working Paper w18586.
Hoxby, C., & Turner, S. (2015). What high achieving low income students know about college. National
Bureau of Economic Research Working Paper w20861.
RACE AND STRATIFICATION IN COLLEGE ENROLLMENT
33
Hurwitz, M., & Kumar, A. (2015). Supply and Demand in the Higher Education Market: College Admission
and College Choice. Washington, DC: The College Board.
Jencks, C., & Phillips, M. (1998). The Black-White Test Score Gap. Washington, DC: Brookings Institution.
Kane, T. (1994). College entry by Blacks since 1970: The role of college costs, family background, and the
returns to education. Journal of Political Economy, 102(5), 878-911.
Kane, T. J. (2004). College-going and inequality. In K. Neckerman (Ed.) Social Inequality. New York: Russell
Sage Foundation.
Karen, D. (2002). Changes in access to higher education in the united states: 1980-1992. Sociology of
Education, 75(3), 191-210.
Kelly, A. P. (2016). The supply side of college match: Where are the seats? In A. P. Kelly, J. S. Howell, and
C. Sattin-Bajaj (Eds.) Matching Students to Opportunity: Expanding College Choice, Access, and
Quality (pp. 99-120). Cambridge, MA: Harvard Education Press.
Klasik, D., Proctor, K., & Baker, R. (2015). A Research Framework for U.S. Higher Education. In M. Stevens
and M. Kirst (Eds). Remaking College: The Changing Ecology of Higher Education (pp. 261-272).
Stanford, CA: Stanford University Press.
Kochhar, R., & Fry, R. (2014). Wealth inequality has widened along racial, ethnic lines since end of Great
Recession. Pew Research Center, Washington, DC.
Kurlaender, M., Carrell, S., & Jackson, J. (2016). The promises and pitfalls of measuring community college
quality. The Russell Sage Foundation Journal of the Social Sciences, 2(1), 174-190.
Labaree, D. F. (2017). A Perfect Mess: The Unlikely ascendancy of American Higher Education. Chicago:
University of Chicago Press
Lang, K., & Weinstein, R. (2013). The wage effects of not-for-profit and for-profit certifications: Better
data, somewhat different results. Labour Economics, 24, 230-243.
RACE AND STRATIFICATION IN COLLEGE ENROLLMENT
34
Long, M. C. (2008). College quality and early adult outcomes. Economics of Education Review, 27(5), 588-
602.
Long, D.A., Kelly, S., Gamoran, A., 2012.Whither the virtuous cycle? Past and future trends in black-white
inequality in educational attainment. Social Science Research, 41(1), 16-32.
Long B. T., & Kurlaender, M. (2009). Do community colleges provide a viable pathway to a Baccalaureate
degree? Educational Evaluation and Policy Analysis, 31, 30-53.
Lucas, S. R. (2001). Effectively maintained inequality: Education transitions, track mobility, and social
background effects. American Journal of Sociology, 6(6), 1642-1690.
Lynch, M., Engle, J., & Cruz, J. L. (2010). Subprime Opportunity: The Unfulfilled Promise of For-Profit
Colleges and Universities. Washington, DC: Education Trust.
McDonough, P. M. (1997). Choosing Colleges: How Social Class and Schools Structure Opportunity.
Albany, NY: State University of New York Press.
MacLeod, W. B., Riehl, E., Saavedra, J. E., & Urquiola, M. (2015). The big sort: College reputation and labor
market outcomes. National Bureau of Economic Research Working Paper w21230.
Melguizo, T. (2006). Quality matters: Assessing the impact of attending more selective institutions on
college completion rates of minorities. Research in Higher Education, 49, 214-236.
Murnane, R. J. (2015). U.S. High School Graduation Rates: Patterns and Explanations. Journal of Economic
Literature, 51(2), 370-422.
National Center for Education Statistics (2014). Table 201.20: Enrollment in grades 9 through 12 in public
and private schools compared with population 14 to 17 years of age: Selected years, 1889-90
through fall 2014.
National Student Clearinghouse Research Center (2015). Current Term Enrollment Estimates Fall 2015.
Herndon, VA: National Student Clearinghouse

RACE AND STRATIFICATION IN COLLEGE ENROLLMENT
35
Ovink, S.M., Kalogrides, D. (2015). No place like home? Familism and Latino/a-white differences in college
pathways. Social Science Research, 52, 219-235.
Patten, E. (2016). Racial, gender wage gaps persist in U.S. despite some progress. Pew Research Center,
Washington, DC. Retrieved from http://www.pewresearch.org/fact-tank/2016/07/01/racial-
gender-wage-gaps-persist-in-u-s-despite-some-progress/.
Perna, L. W. (2000). Differences in the decision to attend college among African Americans, Hispanics,
and Whites. The Journal of Higher Education, 71, 117-141.
Perna, L. W. (2006). Studying college choice: A proposed conceptual model. In J. C. Smart (Ed.), Higher
Education: Handbook of Theory and Research (Vol. 21, pp. 99-157). New York: Springer.
Perna, L. W., & Titus, M. A. (2005). The relationship between parental involvement as social capital and
college enrollment: An examination of racial/ethnic group differences. The Journal of Higher
Education, 76, 485-518.
Posselt, J. R., Jaquette, O., Bielby, R., & Bastedo, M. N. (2012). Access without equity longitudinal analyses
of institutional stratification by race and ethnicity, 1972–2004. American Educational Research
Journal, 49(6), 1074-1111.
Reardon, S. F., Baker, R., & Klasik, D. (2012). Race, income, and enrollment patterns in highly selective
colleges, 1982-2004. Center for Education Policy Analysis, Stanford University.
Reardon, S. F., & Ho, A. D. (2015). Practical issues in estimating achievement gaps from coarsened data.
Journal of Educational and Behavioral Statistics, 40(2), 158-189.
Reardon, S. F., Kalogrides, D., & Shores, K. (2016). The Geography of Racial/Ethnic Test Score Gaps. Center
for Education Policy Analysis Working Paper 16-10.
Reardon, S. F., Kasman, M., Klasik, D., & Baker, R. (2016). Agent-based simulation models of the college
sorting process. Journal of Artificial Societies and Social Simulation, 19, 1, 8.
Reardon, S. F., Robinson-Cimpian, J., & Weathers, E. (2015). Patterns and trends in racial/ethnic and
RACE AND STRATIFICATION IN COLLEGE ENROLLMENT
36
socioeconomic academic achievement gaps. In H. Ladd and M. Goertz (Eds.), Handbook of
Research in Education Finance and Policy. New York: Routledge.
Reardon, S. F., Townsend, J., & Fox, L. (2017). A continuous measure of the joint distribution of race and
income among neighborhoods. RSF: The Russell Sage Foundation Journal of the Social Sciences,
3(2), 34-62.
Roderick, M., Nagaoka, J., Coca, V., & Moeller, E. (2008). From High School to the Future: Potholes on the
Road to Success. Chicago: Consortium on Chicago School Research.
Ruggles, S., Genadek, K., Goeken, R., Grover, J., & Sobek, M (2016). Integrated Public Use Microdata
Series: Version 6.0 [dataset]. Minneapolis: University of Minnesota
Scott-Clayton, J. (2016). Early Labor Market and Debt Outcomes for Bachelor’s Degree Recipients:
Heterogeneity by Institution Type and Major, and Trends over Time. CAPSEE Working Paper.
Center for Analysis of Postsecondary Education and Employment, New York, NY.
Sims, C. A. (1980). Macroeconomics and Reality. Econometrica, 48(1), 1-48.
Smith, J., Pender, M., & Howell, J. (2013). The full extent of student-college academic undermatch.
Economics of Educaiton Review, 32, 247-261
Smith, J., & Stange, K. (2015). A new measure of college quality to study the effects of college sector and
peers on degree attainment. National Bureau of Economic Research Working Paper w21605.
Soland, J. (forthcoming). Are achievement gap estimates biased by differential student test effort? Putting
an important policy metric to the test. Teachers College Record.
Stock, J. H., & Watson, M. W. (2001). Vector autoregressions. The Journal of Economic Perspectives, 15(4),
101-115
Tierney, W. G., & Hentschke, G. C. (2007). New Players, Different Game: Understanding the Rise of For-
Profit Colleges and Universities. Baltimore: Johns Hopkins University Press.

RACE AND STRATIFICATION IN COLLEGE ENROLLMENT
37
Torche, F. (2011). Is a college degree still the great equalizer? Intergenerational mobility across levels of
schooling in the United States. American Journal of Sociology, 117(3), 763-807.

RACE AND STRATIFICATION IN COLLEGE ENROLLMENT
38
Table 1
Correlations between Postsecondary Enrollment-selectivity Gaps and Other Concurrent Gaps, by
Race/Ethnicity
Conditional Enrollment-selectivity Gap:
Overall Four-Year
Selective College
Concurrent Gap: Black-White
High School Graduation 0.449* -0.199 -0.389* Reading 0.290 0.105 -0.193 Math -0.379 0.320 -0.285 Family Income 0.242 -0.126 -0.076 Parental Education 0.203 -0.210 -0.336*
Hispanic-White
High School Graduation 0.730* -0.873* -0.847* Reading 0.067 0.132 -0.129 Math -0.041 0.593 0.168 Family Income -0.210 -0.131 0.046 Parental Education -0.355* 0.202 0.278
Note. * p < 0.1
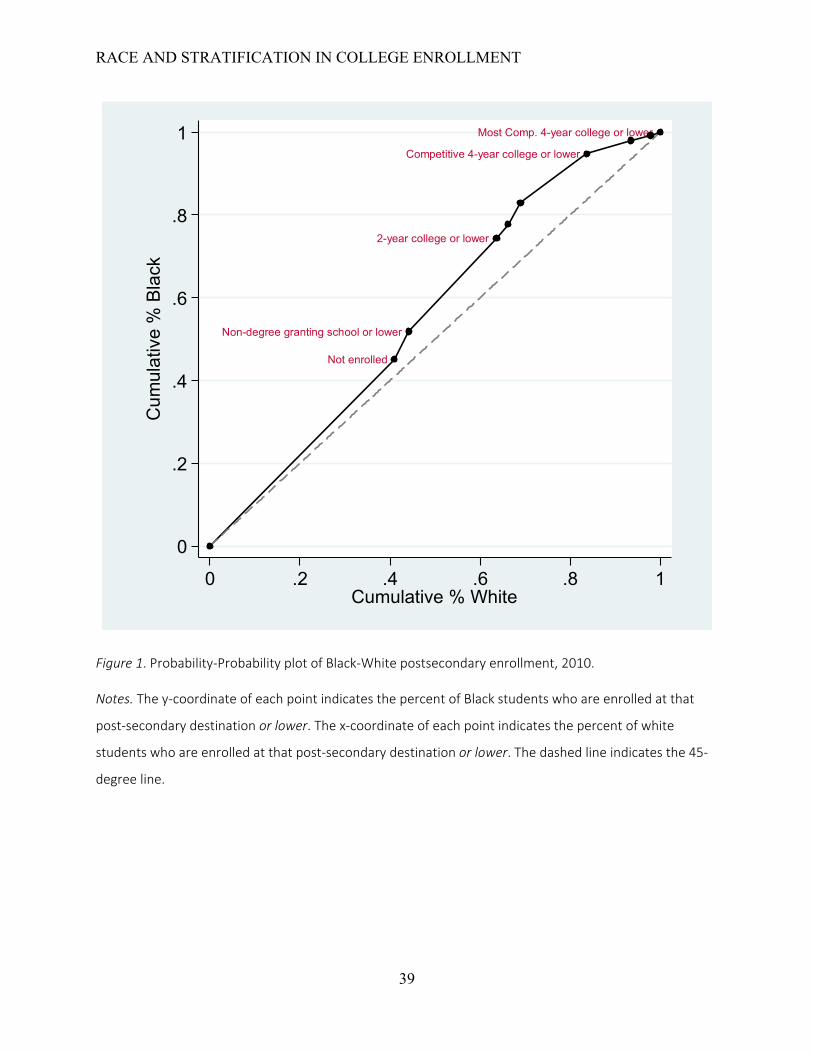
RACE AND STRATIFICATION IN COLLEGE ENROLLMENT
39
Figure 1. Probability-Probability plot of Black-White postsecondary enrollment, 2010.
Notes. The y-coordinate of each point indicates the percent of Black students who are enrolled at that
post-secondary destination or lower. The x-coordinate of each point indicates the percent of white
students who are enrolled at that post-secondary destination or lower. The dashed line indicates the 45-
degree line.
Most Comp. 4-year college or lower
Competitive 4-year college or lower
2-year college or lower
Non-degree granting school or lower
Not enrolled
0
.2
.4
.6
.8
1C
umul
ativ
e %
Bla
ck
0 .2 .4 .6 .8 1Cumulative % White

RACE AND STRATIFICATION IN COLLEGE ENROLLMENT
40
Figure 2. Black- and Hispanic-White postsecondary enrollment-selectivity gaps.
Notes. The level of each line indicates the probability that a randomly chosen white student is enrolled in
a more selective post-secondary destination than a randomly chosen Black/Hispanic student. IPEDS
enrollment reporting was not mandatory at all schools prior to 1993. Prior to 2008 all institutions
reported race in seven categories. After 2010, all institutions used a nine-category system. Between 2008
and 2010 institutions could report enrollment by race under either system and we use the total Black,
Hispanic, and white students regardless of reporting method.
.4
.5
.6
.7
.8pr
obab
ility
1990 2000 2010year
Hispanic-White Gap Black-White Gap
Pre Mandatory IPEDS Reporting IPEDS Race Reporting Transition
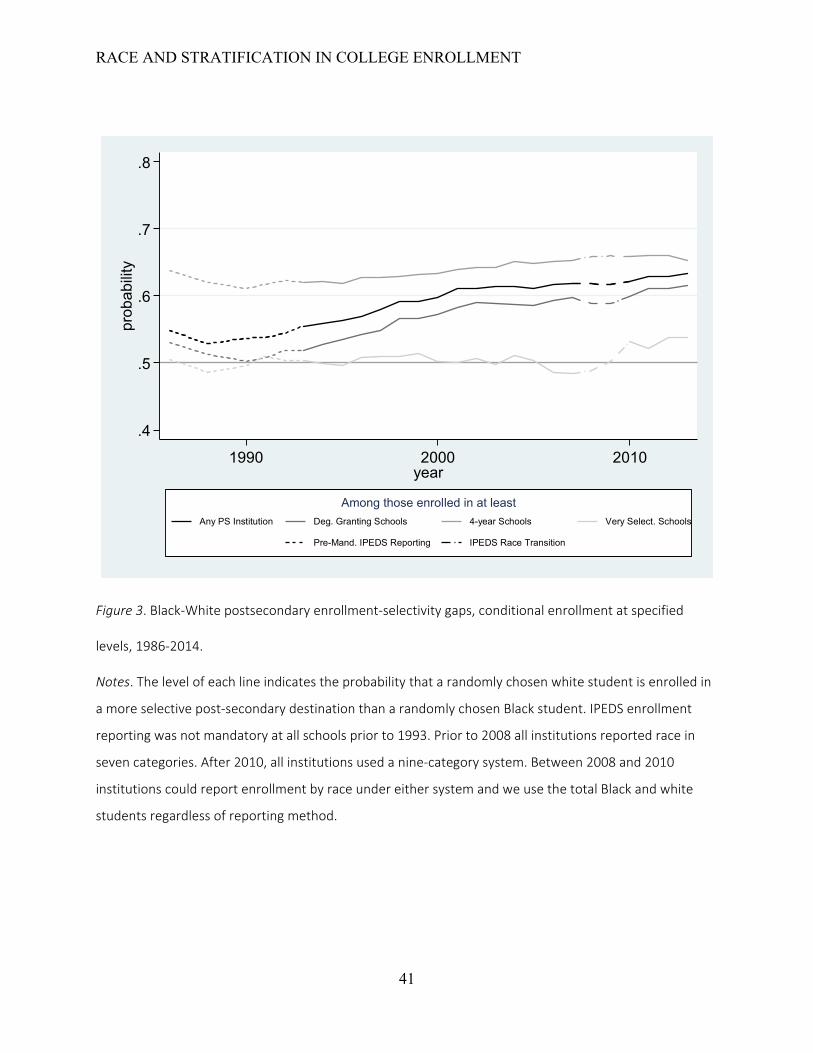
RACE AND STRATIFICATION IN COLLEGE ENROLLMENT
41
Figure 3. Black-White postsecondary enrollment-selectivity gaps, conditional enrollment at specified
levels, 1986-2014.
Notes. The level of each line indicates the probability that a randomly chosen white student is enrolled in
a more selective post-secondary destination than a randomly chosen Black student. IPEDS enrollment
reporting was not mandatory at all schools prior to 1993. Prior to 2008 all institutions reported race in
seven categories. After 2010, all institutions used a nine-category system. Between 2008 and 2010
institutions could report enrollment by race under either system and we use the total Black and white
students regardless of reporting method.
.4
.5
.6
.7
.8
prob
abilit
y
1990 2000 2010year
Any PS Institution Deg. Granting Schools 4-year Schools Very Select. Schools
Pre-Mand. IPEDS Reporting IPEDS Race Transition
Among those enrolled in at least
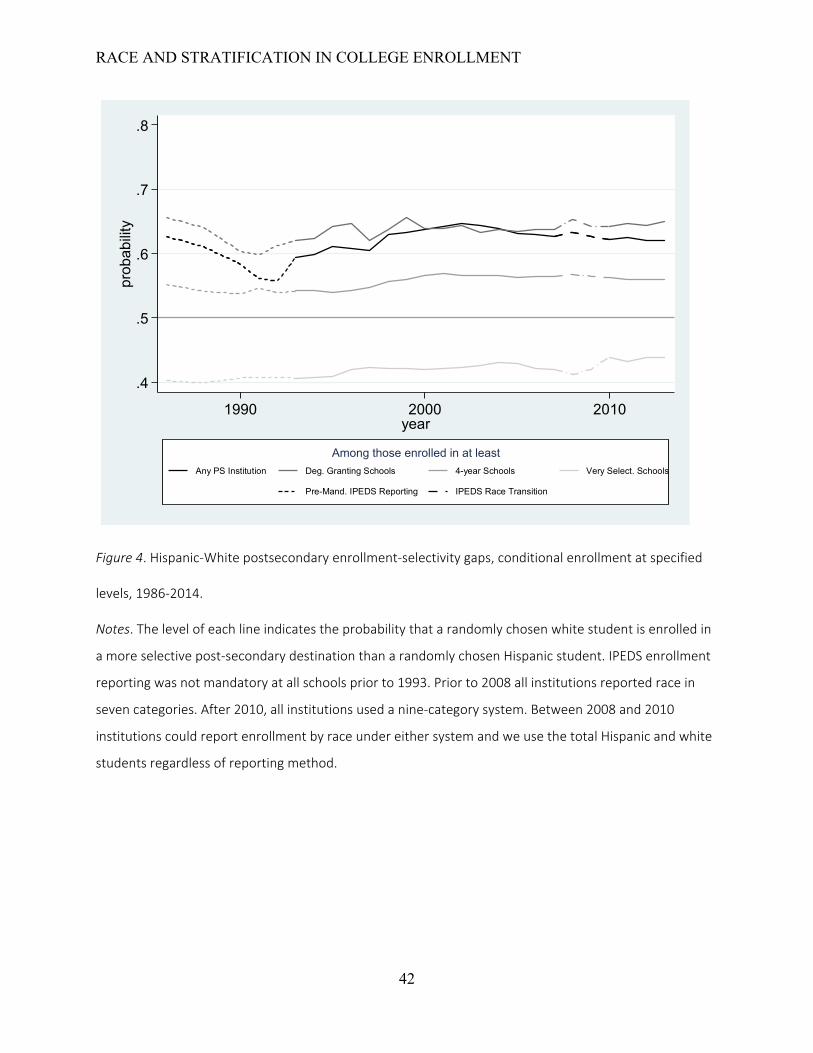
RACE AND STRATIFICATION IN COLLEGE ENROLLMENT
42
Figure 4. Hispanic-White postsecondary enrollment-selectivity gaps, conditional enrollment at specified
levels, 1986-2014.
Notes. The level of each line indicates the probability that a randomly chosen white student is enrolled in
a more selective post-secondary destination than a randomly chosen Hispanic student. IPEDS enrollment
reporting was not mandatory at all schools prior to 1993. Prior to 2008 all institutions reported race in
seven categories. After 2010, all institutions used a nine-category system. Between 2008 and 2010
institutions could report enrollment by race under either system and we use the total Hispanic and white
students regardless of reporting method.
.4
.5
.6
.7
.8pr
obab
ility
1990 2000 2010year
Any PS Institution Deg. Granting Schools 4-year Schools Very Select. Schools
Pre-Mand. IPEDS Reporting IPEDS Race Transition
Among those enrolled in at least

RACE AND STRATIFICATION IN COLLEGE ENROLLMENT
43
Figure 5. Black-White postsecondary enrollment-selectivity gap compared to other gaps, 1986-2014.
Notes: The level of each line indicates the probability that a randomly chosen white student has a
superior outcome (higher test score, higher family income, more selective post-secondary destination) to
a randomly chosen Black student.
.4
.5
.6
.7
.8Pr
obab
ility
1985 1995 2005 2015Year
Overall Selectivity Gap Select. Gap Cond. on 4-year Graduation Gap Math Ach. Gap
Read Ach. Gap Income Gap Par. Coll. Gap

RACE AND STRATIFICATION IN COLLEGE ENROLLMENT
44
Figure 6. Hispanic-White postsecondary enrollment-selectivity gap compared to other gaps, 1986-2014.
Notes: The level of each line indicates the probability that a randomly chosen white student has a
superior outcome (higher test score, higher family income, more selective post-secondary destination) to
a randomly chosen Hispanic student.
.4
.5
.6
.7
.8Pr
obab
ility
1985 1995 2005 2015Year
Overall Selectivity Gap Select. Gap Cond. on 4-year Graduation Gap Math Ach. Gap
Read Ach. Gap Income Gap Par. Coll. Gap

RACE AND STRATIFICATION IN COLLEGE ENROLLMENT
45
Appendix A
Other Representations of College Selectivity Gaps
The benefit of using the V-statistic (and related probability-of-superior-outcome measures)
method to illustrate changes in enrollment-selectivity gaps is that it effectively collapses a large amount
of information into a single number. In this appendix we present three other ways of displaying the same
information without using the V-statistic in order to illustrate how difficult the task is. Each of these
representations improves upon the last, but each still has significant limitations.
In Figures A1 and A2 we present stacked bars that show the percentage of Black and Hispanic
students, respectively, enrolled in each of the 9 different postsecondary destinations we consider in this
paper compared to the rate of enrollment in these destinations for white students. This is the simplest
way of looking at these data, and these figures illustrate the challenges in examining trends. For example,
while we can see that enrollment in 2-year schools has grown for all three race groups, it’s difficult to tell
for which group 2-year enrollment has grown the most, and how this compares to growth in other
sectors. And importantly, in these figures it is hard to assess how overall changes in enrollment have
evolved.
In Figures A3 – A5, we present the percent of students who are enrolled in at least each level of
selectivity for each race. By examining the area between each pair of lines, we can track growth in
particular sectors. For example, but looking at the area between the Non-Degree Granting and 2-year
School lines, we can see the growth in the Non-Degree Granting sector for all races. This representation is
helpful in that it clearly shows if growth trends in enrollment for a given race in a given sector. However,
there are two main limitations to this representation. First, like the previous representation, it is difficult
to assess trends in overall enrollment. Second, these graphs do not allow us to compare across races in
one figure.
RACE AND STRATIFICATION IN COLLEGE ENROLLMENT
46
Finally, in Figures A6 and A7 we reduce the data slightly and give lines that track the difference in
percentage of white students relative to Black and Hispanic students enrolled in each postsecondary
destination. Here we can see some of the trends we note in the paper—notably the closing margin of not
attending college at all. However, it is still difficult to weight the overall trends in enrollment, particularly
without additional information about the relative number of students enrolled at each level What you
lose in this approach is a sense of the proportion of students at each level. We may see trends at different
levels of selectivity running in opposite directions, but without knowing the proportion of total
enrollments at each level (and for each year), it is difficult to make claims about overall changes in gaps.
For example, while the closing of the gap in non-enrollment is striking in both figures, it is difficult to
know how important this is without knowing what percent of students fall into this category. This
representation again does not allow us to ascertain how changes in enrollment gaps in one particular
sector affect enrollment gaps overall.
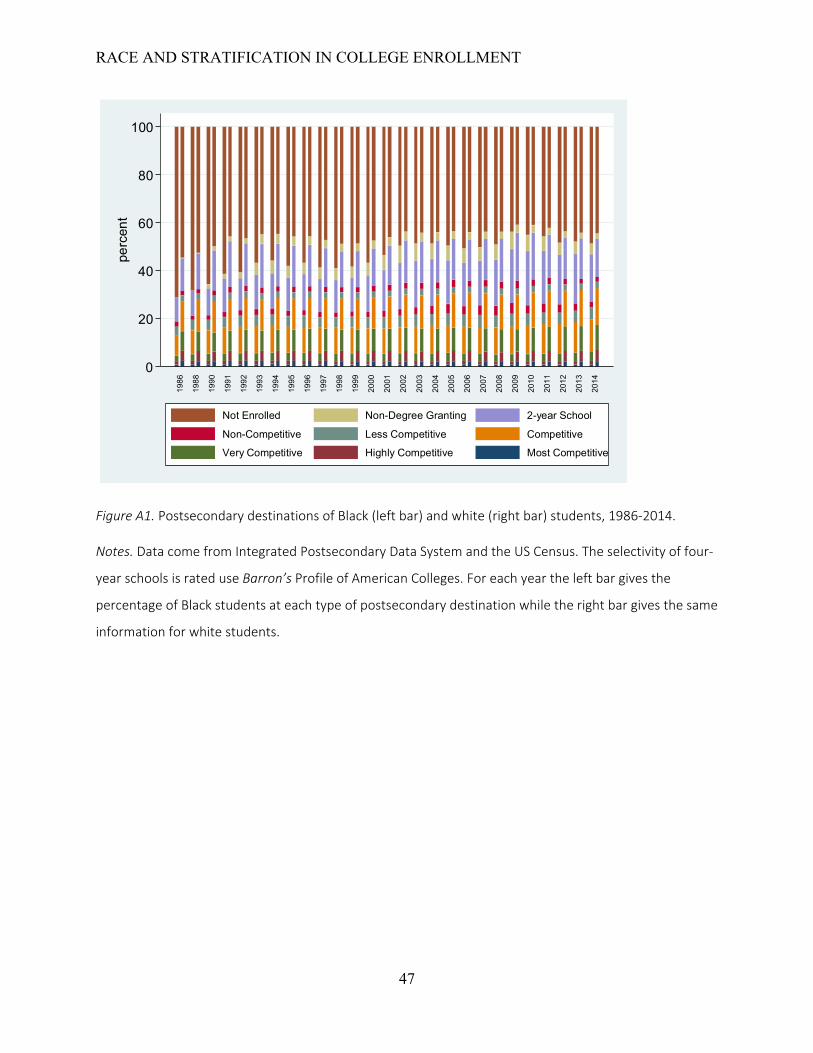
RACE AND STRATIFICATION IN COLLEGE ENROLLMENT
47
Figure A1. Postsecondary destinations of Black (left bar) and white (right bar) students, 1986-2014.
Notes. Data come from Integrated Postsecondary Data System and the US Census. The selectivity of four-
year schools is rated use Barron’s Profile of American Colleges. For each year the left bar gives the
percentage of Black students at each type of postsecondary destination while the right bar gives the same
information for white students.
0
20
40
60
80
100pe
rcen
t
1986
1988
1990
1991
1992
1993
1994
1995
1996
1997
1998
1999
2000
2001
2002
2003
2004
2005
2006
2007
2008
2009
2010
2011
2012
2013
2014
Not Enrolled Non-Degree Granting 2-year School
Non-Competitive Less Competitive Competitive
Very Competitive Highly Competitive Most Competitive
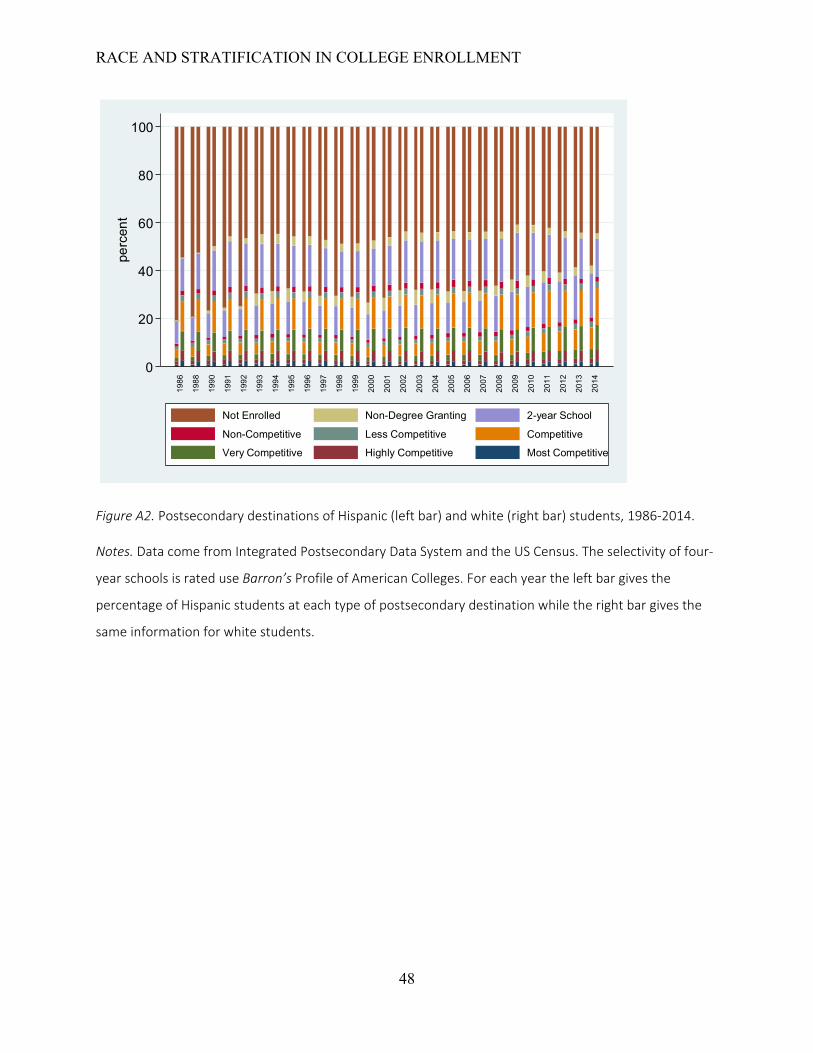
RACE AND STRATIFICATION IN COLLEGE ENROLLMENT
48
Figure A2. Postsecondary destinations of Hispanic (left bar) and white (right bar) students, 1986-2014.
Notes. Data come from Integrated Postsecondary Data System and the US Census. The selectivity of four-
year schools is rated use Barron’s Profile of American Colleges. For each year the left bar gives the
percentage of Hispanic students at each type of postsecondary destination while the right bar gives the
same information for white students.
0
20
40
60
80
100pe
rcen
t
1986
1988
1990
1991
1992
1993
1994
1995
1996
1997
1998
1999
2000
2001
2002
2003
2004
2005
2006
2007
2008
2009
2010
2011
2012
2013
2014
Not Enrolled Non-Degree Granting 2-year School
Non-Competitive Less Competitive Competitive
Very Competitive Highly Competitive Most Competitive

RACE AND STRATIFICATION IN COLLEGE ENROLLMENT
49
Figure A3. Percent of Hispanic students enrolled in each post-secondary destination or higher.
Notes. Data come from Integrated Postsecondary Data System and the US Census. The selectivity of four-
year schools is rated use Barron’s Profile of American Colleges. Each line indicates the percent of Hispanic
students enrolled in a post-secondary destination that is at least that selective. For example, the height of
the “Competitive” line indicates what percent of Hispanic students are enrolled in four-year colleges that
are ranked as Competitive, Very Competitive, Highly Competitive, or Most Competitive each year.
0.1
.2
.3
.4
.5
.6
.7
.8
.9
1pe
rcen
tage
1990 2000 2010year
Not Enrolled Non-Degree Granting 2-year School
Non-Competitive Less Competitive Competitive
Very Competitive Highly Competitive Most Competitive

RACE AND STRATIFICATION IN COLLEGE ENROLLMENT
50
Figure A4. Percent of Black students enrolled in each post-secondary destination or higher.
Notes. Data come from Integrated Postsecondary Data System and the US Census. The selectivity of four-
year schools is rated use Barron’s Profile of American Colleges. Each line indicates the percent of Black
students enrolled in a post-secondary destination that is at least that selective. For example, the height of
the “Competitive” line indicates what percent of Black students are enrolled in four-year colleges that are
ranked as Competitive, Very Competitive, Highly Competitive, or Most Competitive each year.
0.1
.2
.3
.4
.5
.6
.7
.8
.9
1pe
rcen
tage
1990 2000 2010year
Not Enrolled Non-Degree Granting 2-year School
Non-Competitive Less Competitive Competitive
Very Competitive Highly Competitive Most Competitive

RACE AND STRATIFICATION IN COLLEGE ENROLLMENT
51
Figure A5. Percent of White students enrolled in each post-secondary destination or higher.
Notes. Data come from Integrated Postsecondary Data System and the US Census. The selectivity of four-
year schools is rated use Barron’s Profile of American Colleges. Each line indicates the percent of white
students enrolled in a post-secondary destination that is at least that selective. For example, the height of
the “Competitive” line indicates what percent of white students are enrolled in four-year colleges that are
ranked as Competitive, Very Competitive, Highly Competitive, or Most Competitive each year.
0.1
.2
.3
.4
.5
.6
.7
.8
.9
1pe
rcen
tage
1990 2000 2010year
Not Enrolled Non-Degree Granting 2-year School
Non-Competitive Less Competitive Competitive
Very Competitive Highly Competitive Most Competitive
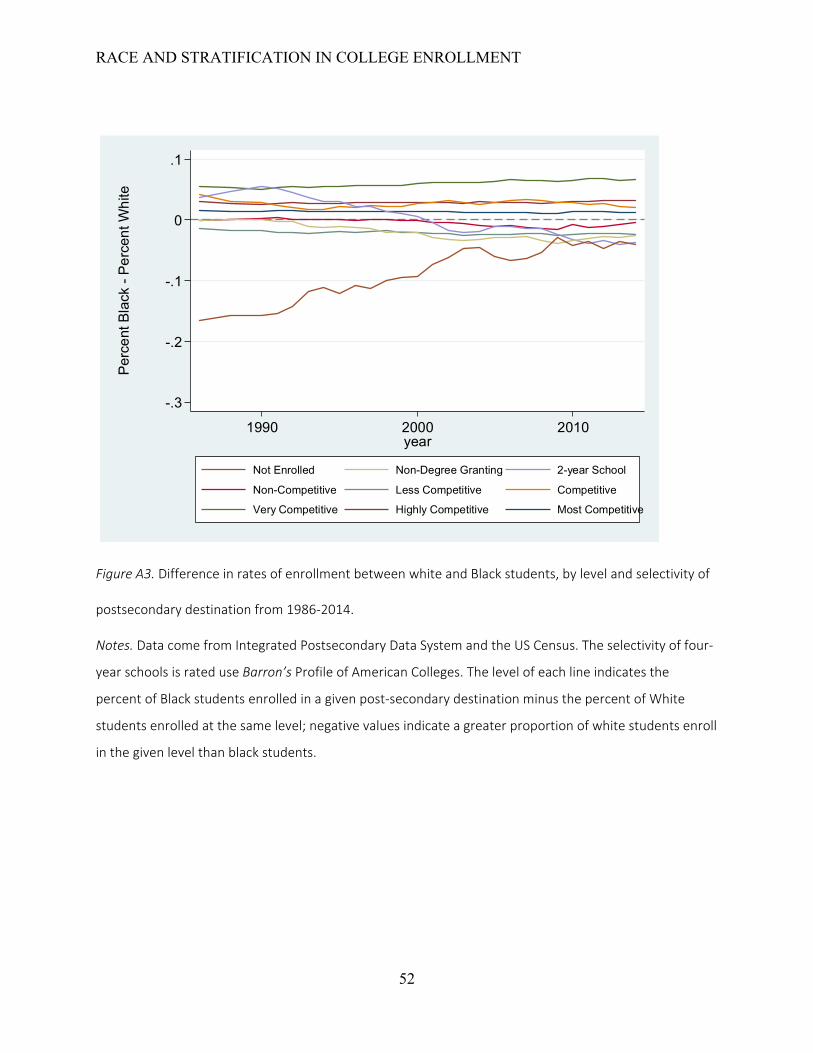
RACE AND STRATIFICATION IN COLLEGE ENROLLMENT
52
Figure A3. Difference in rates of enrollment between white and Black students, by level and selectivity of
postsecondary destination from 1986-2014.
Notes. Data come from Integrated Postsecondary Data System and the US Census. The selectivity of four-
year schools is rated use Barron’s Profile of American Colleges. The level of each line indicates the
percent of Black students enrolled in a given post-secondary destination minus the percent of White
students enrolled at the same level; negative values indicate a greater proportion of white students enroll
in the given level than black students.
-.3
-.2
-.1
0
.1
Perc
ent B
lack
- Pe
rcen
t Whi
te
1990 2000 2010year
Not Enrolled Non-Degree Granting 2-year School
Non-Competitive Less Competitive Competitive
Very Competitive Highly Competitive Most Competitive

RACE AND STRATIFICATION IN COLLEGE ENROLLMENT
53
Figure A4. Difference in rates of enrollment between white and Hispanic students, by level and selectivity
of postsecondary destination from 1986-2014.
Notes. Data come from Integrated Postsecondary Data System and the US Census. The selectivity of four-
year schools is rated use Barron’s Profile of American Colleges. The level of each line indicates the
percent of Hispanic students enrolled in a given post-secondary destination minus the percent of White
students enrolled at the same level; negative values indicate a greater proportion of white students enroll
in the given level than Hispanic students.
-.3
-.2
-.1
0
.1
Perc
ent H
ispa
nic
- Per
cent
Whi
te
1990 2000 2010year
Not Enrolled Non-Degree Granting 2-year School
Non-Competitive Less Competitive Competitive
Very Competitive Highly Competitive Most Competitive
RACE AND STRATIFICATION IN COLLEGE ENROLLMENT
54
Appendix B
Sensitivity Analyses
The following work demonstrates the robustness of our results to various data decisions and
limitations.
Full-Time Versus Part-Time Students
In our main analyses, we use the IPEDs counts of all first-time degree-/certificate-seeking
students enrolled at each post-secondary institution. Here we re-estimate selectivity gaps using only full-
time first-time degree-/certificate-seeking students, which should reduce the potential to double count
students who are enrolled at multiple institutions in their first term of attendance. Since relatively few
students enroll in more than one college—somewhat less than 2 percent of all students enrolled in any
postsecondary institution are enrolled in more than one institution (National Student Clearinghouse
Research Center, 2015), these results are not substantively different from the results presented in Figure
B1.
Fall Versus 12-Month Enrollment
Institutions report the number of first-time students to IPEDS only in the fall. Because of this
schedule, students who enroll for the first time in the spring semester are not counted in our primary
data. If race groups first enroll in fall vs. spring at different rates, this could affect our estimated gaps.
There is no available data source to satisfactorily address this concern, as IPEDS’ 12-month enrollment
counts include all enrolled students – freshman to seniors, first-time and otherwise. Thus, these 12-
month data conflate college enrollment with college persistence—differential persistence by race may
exaggerate or attenuate differential enrollment-selectivity gaps by race. For the sake of robustness, but
given this caveat, we compare gaps computed using first-time fall enrollment with gaps computed using
the 12-month data. In Figure B2 we compare Black- and Hispanic-White postsecondary enrollment-
selectivity gaps using both fall and 12-month enrollment data conditional on attending at least a
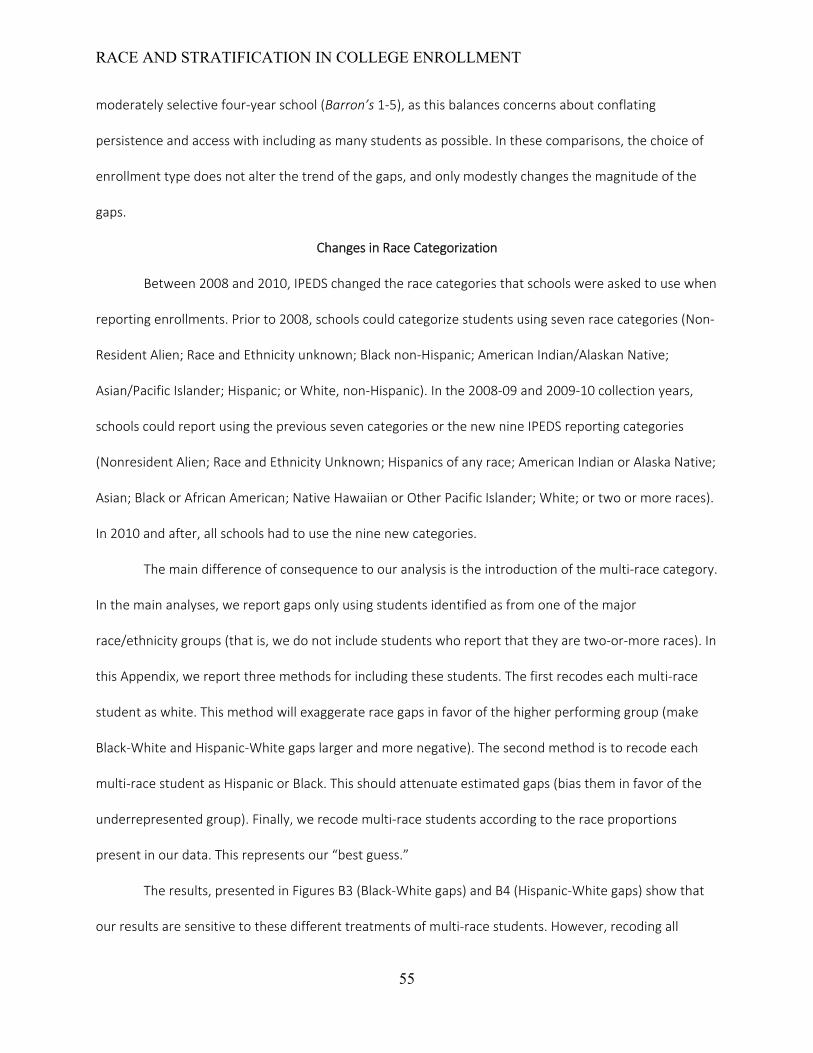
RACE AND STRATIFICATION IN COLLEGE ENROLLMENT
55
moderately selective four-year school (Barron’s 1-5), as this balances concerns about conflating
persistence and access with including as many students as possible. In these comparisons, the choice of
enrollment type does not alter the trend of the gaps, and only modestly changes the magnitude of the
gaps.
Changes in Race Categorization
Between 2008 and 2010, IPEDS changed the race categories that schools were asked to use when
reporting enrollments. Prior to 2008, schools could categorize students using seven race categories (Non-
Resident Alien; Race and Ethnicity unknown; Black non-Hispanic; American Indian/Alaskan Native;
Asian/Pacific Islander; Hispanic; or White, non-Hispanic). In the 2008-09 and 2009-10 collection years,
schools could report using the previous seven categories or the new nine IPEDS reporting categories
(Nonresident Alien; Race and Ethnicity Unknown; Hispanics of any race; American Indian or Alaska Native;
Asian; Black or African American; Native Hawaiian or Other Pacific Islander; White; or two or more races).
In 2010 and after, all schools had to use the nine new categories.
The main difference of consequence to our analysis is the introduction of the multi-race category.
In the main analyses, we report gaps only using students identified as from one of the major
race/ethnicity groups (that is, we do not include students who report that they are two-or-more races). In
this Appendix, we report three methods for including these students. The first recodes each multi-race
student as white. This method will exaggerate race gaps in favor of the higher performing group (make
Black-White and Hispanic-White gaps larger and more negative). The second method is to recode each
multi-race student as Hispanic or Black. This should attenuate estimated gaps (bias them in favor of the
underrepresented group). Finally, we recode multi-race students according to the race proportions
present in our data. This represents our “best guess.”
The results, presented in Figures B3 (Black-White gaps) and B4 (Hispanic-White gaps) show that
our results are sensitive to these different treatments of multi-race students. However, recoding all
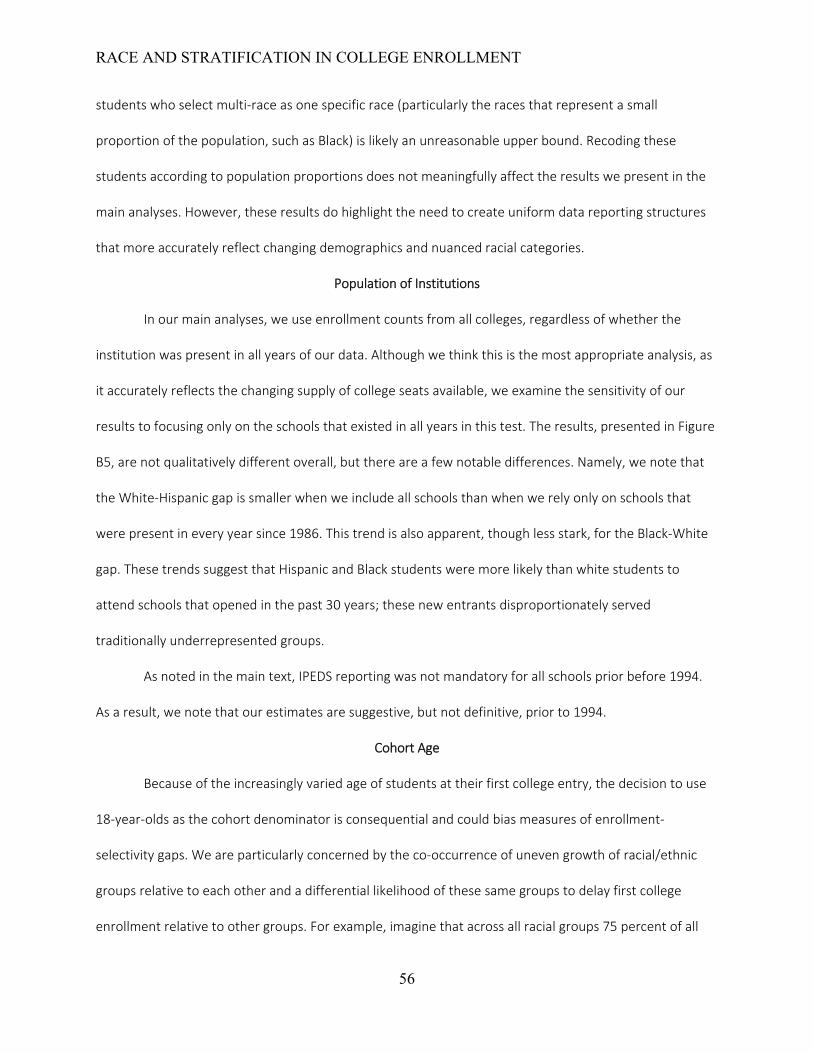
RACE AND STRATIFICATION IN COLLEGE ENROLLMENT
56
students who select multi-race as one specific race (particularly the races that represent a small
proportion of the population, such as Black) is likely an unreasonable upper bound. Recoding these
students according to population proportions does not meaningfully affect the results we present in the
main analyses. However, these results do highlight the need to create uniform data reporting structures
that more accurately reflect changing demographics and nuanced racial categories.
Population of Institutions
In our main analyses, we use enrollment counts from all colleges, regardless of whether the
institution was present in all years of our data. Although we think this is the most appropriate analysis, as
it accurately reflects the changing supply of college seats available, we examine the sensitivity of our
results to focusing only on the schools that existed in all years in this test. The results, presented in Figure
B5, are not qualitatively different overall, but there are a few notable differences. Namely, we note that
the White-Hispanic gap is smaller when we include all schools than when we rely only on schools that
were present in every year since 1986. This trend is also apparent, though less stark, for the Black-White
gap. These trends suggest that Hispanic and Black students were more likely than white students to
attend schools that opened in the past 30 years; these new entrants disproportionately served
traditionally underrepresented groups.
As noted in the main text, IPEDS reporting was not mandatory for all schools prior before 1994.
As a result, we note that our estimates are suggestive, but not definitive, prior to 1994.
Cohort Age
Because of the increasingly varied age of students at their first college entry, the decision to use
18-year-olds as the cohort denominator is consequential and could bias measures of enrollment-
selectivity gaps. We are particularly concerned by the co-occurrence of uneven growth of racial/ethnic
groups relative to each other and a differential likelihood of these same groups to delay first college
enrollment relative to other groups. For example, imagine that across all racial groups 75 percent of all

RACE AND STRATIFICATION IN COLLEGE ENROLLMENT
57
high school graduates eventually enroll in college. If the population of Asians in the United States is
growing significantly more quickly than other racial groups and Asians tend to delay college enrollment by
10 years, it will look like Asians enroll at much lower rates than other groups (75 percent of all 28-year-
olds will be less than the 75 percent of 18-year-olds). We investigate the potential upper bound of this
bias by using an average of 18-24 year-olds as the measure of the size of each cohort. The results of this
analysis are presented in Figure B6 and do not qualitatively change the size or trend of Black-White and
Hispanic-White selectivity gaps.
Missing Barron’s Ratings
Approximately 360 degree-granting four-year institutions are missing a Barron’s selectivity rating.
In these cases, we attempted to estimate the rating based on publicly available data (e.g. percent of
applicants admitted, average SAT scores, etc.) and Barron’s criteria for determining college selectivity. To
check the sensitivity of our results to this imputation, we repeat our analyses by dropping these schools
from the analysis. Our results, as presented in Figure B7, are not sensitive to this imputation of data.
Comparison to NCES Longitudinal Data
While the NCES longitudinal data sets are not ideal for our analyses for the reasons we outline in
the paper, they are not subject to some of the concerns we have with the IPEDS data and are helpful for
checking the robustness of our results. In this section we present the gaps for the national samples in
three datasets (NELS, ELS and HSLS). These longitudinal data sets are representative of the population of
students in late middle school or early high school (eighth grade for NELS, tenth grade for ELS, and ninth
grade for HSLS), so the types of students who would drop out before the base year collection are not
represented. Because of this, we calculate and present the results for gaps conditional on any
postsecondary enrollment. Additionally, because these data sets include a relatively small sample, they
often contain small numbers of URM students at particular levels of enrollment and sample weights
cannot account for whether these particular observations are outliers.

RACE AND STRATIFICATION IN COLLEGE ENROLLMENT
58
We find the results from the NCES longitudinal largely in line with our IPEDS estimates. The
trends are qualitatively similar (widening Black-White gaps and widening-then-leveling Hispanic-White
gaps), though the Hispanic-White gaps estimated using the NCES data are larger than those using IPEDS.
Exclusion of For-Profit Schools
The for-profit sector is an increasingly important player in higher education in the United States
and examining race gaps in selectivity of enrollment with and without for-profit schools can help us
understand the role these institutions might play in the sorting of students into colleges by race. Black
and Hispanic students are more likely to enroll in for-profit schools than their white peers (Deming,
Goldin & Katz, 2013). This trend, combined with the fact that most for-profit schools tend to be less
selective and the number of seats in for-profit institutions has grown rapidly during the years we study
(Tierney & Hentschke, 2007), may help explain the closing enrollment-selectivity gaps we observe. Thus,
to explore the extent to which the trends we describe can be explained in part or in full by the for-profit
sector, we recalculated our gaps excluding enrollments from for-profit institutions. Figure B9 shows that
both the Black-White and Hispanic-White gaps are bigger when we do not include for-profit schools. This
is especially true for the Black-White gap. Thus, for-profit schools are important actors in the overall
closing of gaps, but are not entirely responsible for this closing.
However, for-profit schools are more expensive than similar alternatives (Cellini, 2012), they tend
to have lower graduation rates than similar non-profit schools (Lynch, Engle & Cruz, 2010) and research
has found that the economic returns to attending a for-profit college are insignificant or lower than other
similar sectors (Darolia, Koedel, Martorell, Wilson & Perez-Arce, 2015; Cellini & Chaudhary, 2014; Lang &
Weinstein, 2013). Thus, the fact that for-profit schools seem to drive a nontrivial amount of the shrinking
race gap in college selectivity is not an entirely positive finding.

RACE AND STRATIFICATION IN COLLEGE ENROLLMENT
59
Figure B1. Black- and Hispanic-White postsecondary enrollment-selectivity gaps calculated using all
enrollment versus just full-time enrollment, 1986-2014.
Notes. The level of each line indicates the probability that a randomly chosen white student is enrolled in
a more selective post-secondary destination than a randomly chosen Black/Hispanic student. The solid
lines indicate gaps estimated using all enrolled students. The dashed lines indicate gaps estimated using
only students who are enrolled full time. IPEDS enrollment reporting was not mandatory at all schools
prior to 1993. Prior to 2008 all institutions reported race in seven categories. After 2010, all institutions
used a nine-category system. Between 2008 and 2010 institutions could report enrollment by race under
either system and we use the total Black, Hispanic, and white students regardless of reporting method.
.4
.5
.6
.7
.8pr
obab
ility
1990 2000 2010year
Hispanic-White Black-White
All Enrollment Full Time Enrollment Only

RACE AND STRATIFICATION IN COLLEGE ENROLLMENT
60
Figure B2. Black- and Hispanic-White postsecondary enrollment-selectivity gaps calculated using all fall
enrollment versus 12-month enrollment conditional on attending at least a Barron’s 5 institution, 1986-
2014.
Notes. The level of each line indicates the probability that a randomly chosen white student is enrolled in
a more selective post-secondary destination than a randomly chosen Black/Hispanic student. The solid
lines indicate gaps estimated using first-time fall enrollments reported to IPEDS. The dashed lines indicate
gaps estimated using 12-month enrollments (all students, not just freshmen) reported to IPEDS. IPEDS
enrollment reporting was not mandatory at all schools prior to 1993. Prior to 2008 all institutions
reported race in seven categories. After 2010, all institutions used a nine-category system. Between 2008
and 2010 institutions could report enrollment by race under either system and we use the total Black,
Hispanic, and white students regardless of reporting method.
.4
.5
.6
.7
.8pr
obab
ility
2002 2005 2008 2011year
Hispanic-White Black-White
12-month enrollment Fall Enrollment
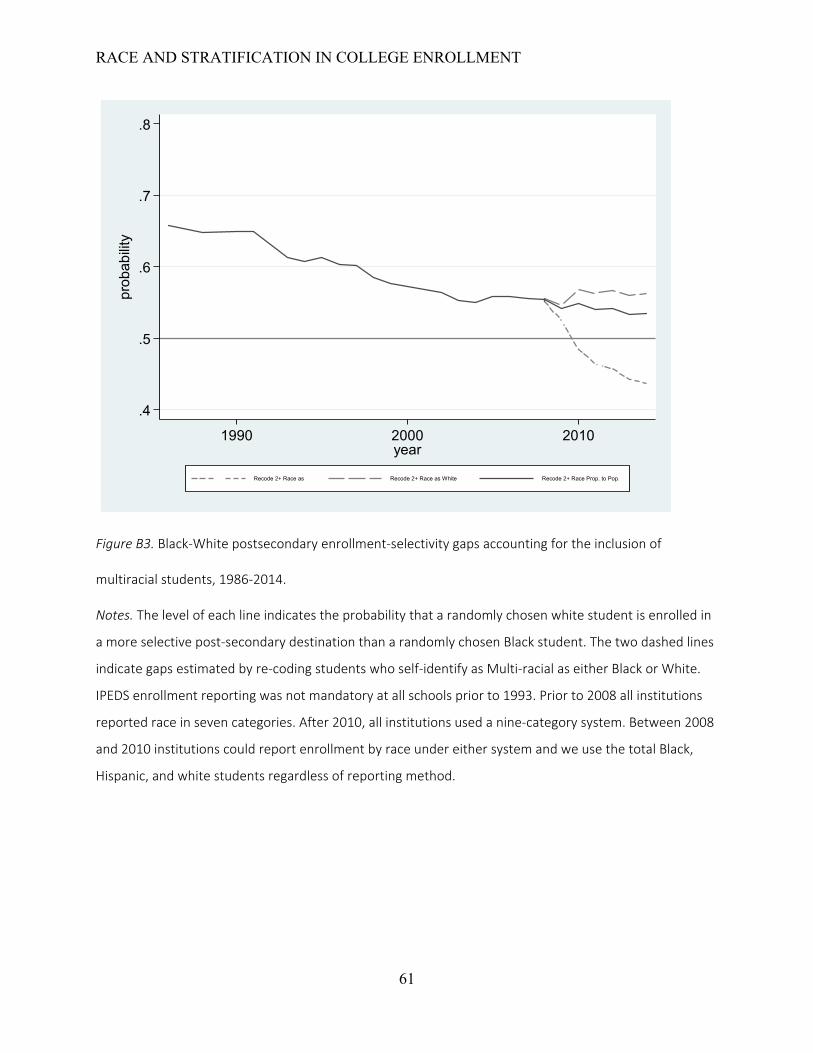
RACE AND STRATIFICATION IN COLLEGE ENROLLMENT
61
Figure B3. Black-White postsecondary enrollment-selectivity gaps accounting for the inclusion of
multiracial students, 1986-2014.
Notes. The level of each line indicates the probability that a randomly chosen white student is enrolled in
a more selective post-secondary destination than a randomly chosen Black student. The two dashed lines
indicate gaps estimated by re-coding students who self-identify as Multi-racial as either Black or White.
IPEDS enrollment reporting was not mandatory at all schools prior to 1993. Prior to 2008 all institutions
reported race in seven categories. After 2010, all institutions used a nine-category system. Between 2008
and 2010 institutions could report enrollment by race under either system and we use the total Black,
Hispanic, and white students regardless of reporting method.
.4
.5
.6
.7
.8pr
obab
ility
1990 2000 2010year
Recode 2+ Race as Recode 2+ Race as White Recode 2+ Race Prop. to Pop.

RACE AND STRATIFICATION IN COLLEGE ENROLLMENT
62
Figure B4. Hispanic-White postsecondary enrollment-selectivity gaps accounting for the inclusion of
multiracial students, 1986-2014.
Notes. The level of each line indicates the probability that a randomly chosen white student is enrolled in
a more selective post-secondary destination than a randomly chosen Hispanic student. The two dashed
lines indicate gaps estimated by re-coding students who self-identify as Multi-racial as either Hispanic or
White. IPEDS enrollment reporting was not mandatory at all schools prior to 1993. Prior to 2008 all
institutions reported race in seven categories. After 2010, all institutions used a nine-category system.
Between 2008 and 2010 institutions could report enrollment by race under either system and we use the
total Black, Hispanic, and white students regardless of reporting method.
.4
.5
.6
.7
.8pr
obab
ility
1990 2000 2010year
Recode 2+ Race as Recode 2+ Race as White Recode 2+ Race Prop. to Pop.

RACE AND STRATIFICATION IN COLLEGE ENROLLMENT
63
Figure B5. Black- and Hispanic-White postsecondary enrollment-selectivity gaps calculated using all
institutions versus only institutions present in every year of data, 1986-2014.
Notes. The level of each line indicates the probability that a randomly chosen white student is enrolled in
a more selective post-secondary destination than a randomly chosen Black/Hispanic student. The dashed
lines indicate gaps estimated by including only schools that were present in every year of analysis. The
solid lines indicate gaps that were estimated using all available schools. IPEDS enrollment reporting was
not mandatory at all schools prior to 1993. Prior to 2008 all institutions reported race in seven categories.
After 2010, all institutions used a nine-category system. Between 2008 and 2010 institutions could report
enrollment by race under either system and we use the total Black, Hispanic, and white students
regardless of reporting method.
.4
.5
.6
.7
.8
prob
abilit
y
1990 2000 2010year
Hispanic-White Gap Black-White Gap
All Schools Schools Present Every Yr.
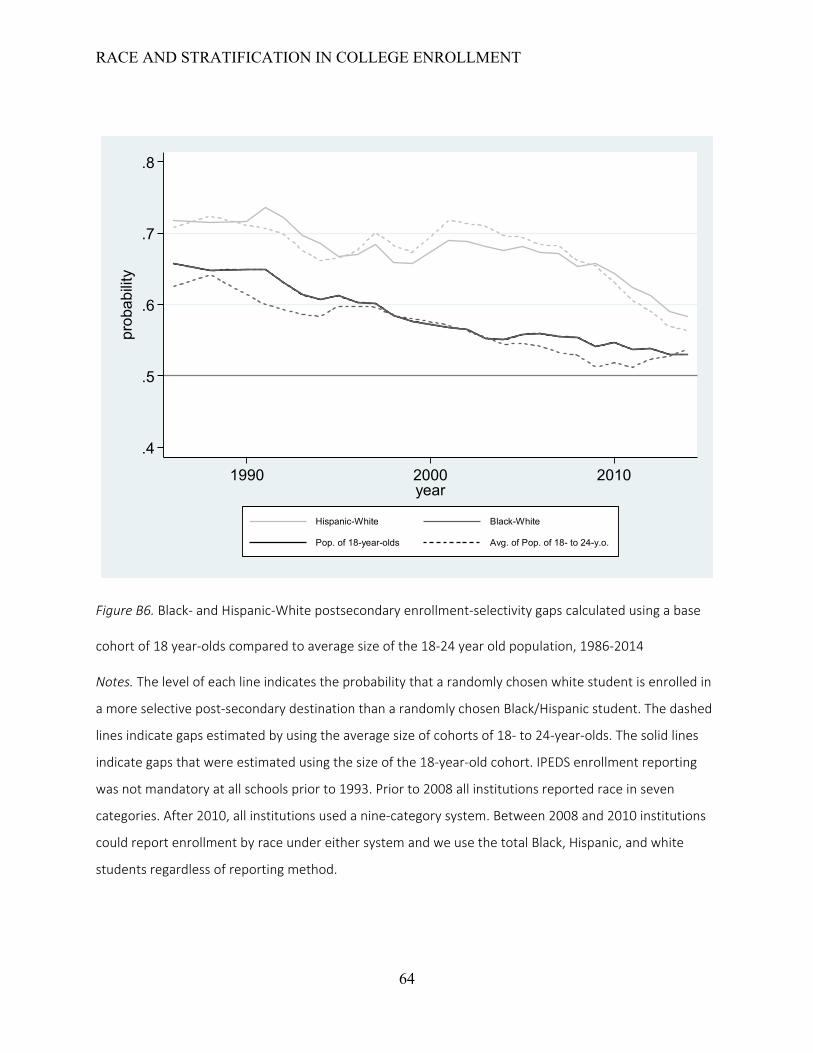
RACE AND STRATIFICATION IN COLLEGE ENROLLMENT
64
Figure B6. Black- and Hispanic-White postsecondary enrollment-selectivity gaps calculated using a base
cohort of 18 year-olds compared to average size of the 18-24 year old population, 1986-2014
Notes. The level of each line indicates the probability that a randomly chosen white student is enrolled in
a more selective post-secondary destination than a randomly chosen Black/Hispanic student. The dashed
lines indicate gaps estimated by using the average size of cohorts of 18- to 24-year-olds. The solid lines
indicate gaps that were estimated using the size of the 18-year-old cohort. IPEDS enrollment reporting
was not mandatory at all schools prior to 1993. Prior to 2008 all institutions reported race in seven
categories. After 2010, all institutions used a nine-category system. Between 2008 and 2010 institutions
could report enrollment by race under either system and we use the total Black, Hispanic, and white
students regardless of reporting method.
.4
.5
.6
.7
.8
prob
abilit
y
1990 2000 2010year
Hispanic-White Black-White
Pop. of 18-year-olds Avg. of Pop. of 18- to 24-y.o.
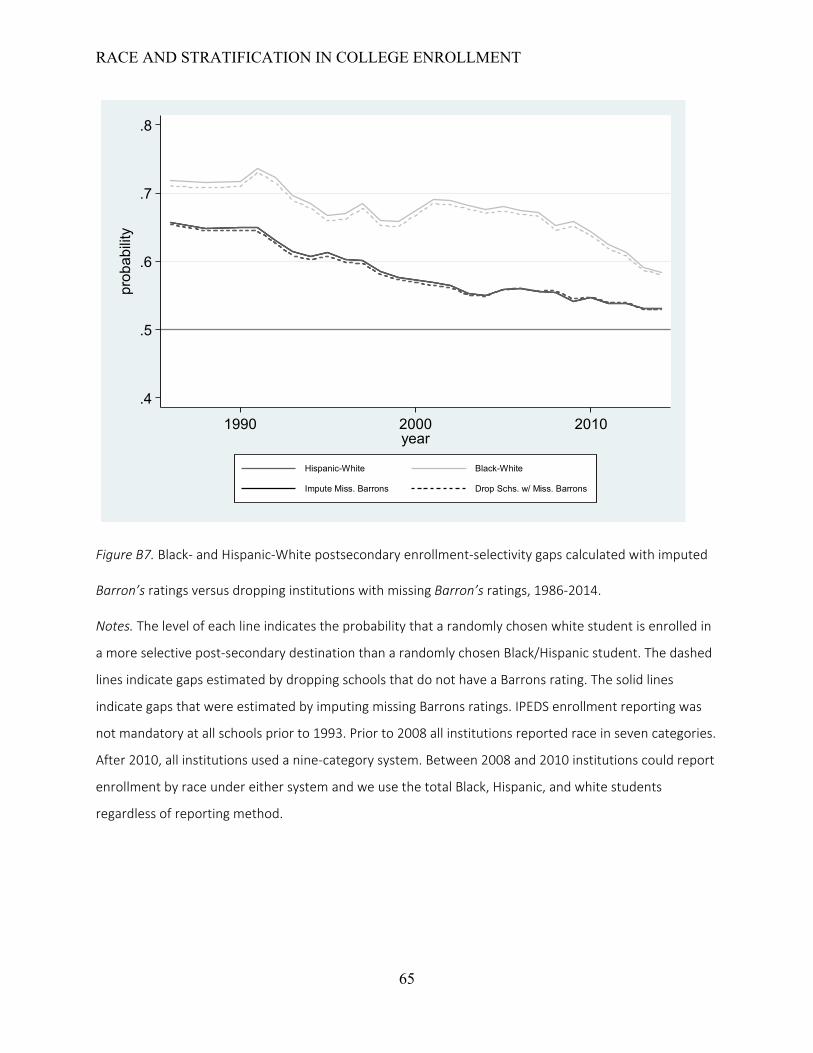
RACE AND STRATIFICATION IN COLLEGE ENROLLMENT
65
Figure B7. Black- and Hispanic-White postsecondary enrollment-selectivity gaps calculated with imputed
Barron’s ratings versus dropping institutions with missing Barron’s ratings, 1986-2014.
Notes. The level of each line indicates the probability that a randomly chosen white student is enrolled in
a more selective post-secondary destination than a randomly chosen Black/Hispanic student. The dashed
lines indicate gaps estimated by dropping schools that do not have a Barrons rating. The solid lines
indicate gaps that were estimated by imputing missing Barrons ratings. IPEDS enrollment reporting was
not mandatory at all schools prior to 1993. Prior to 2008 all institutions reported race in seven categories.
After 2010, all institutions used a nine-category system. Between 2008 and 2010 institutions could report
enrollment by race under either system and we use the total Black, Hispanic, and white students
regardless of reporting method.
.4
.5
.6
.7
.8pr
obab
ility
1990 2000 2010year
Hispanic-White Black-White
Impute Miss. Barrons Drop Schs. w/ Miss. Barrons

RACE AND STRATIFICATION IN COLLEGE ENROLLMENT
66
Figure B8. Black- and Hispanic-White postsecondary enrollment-selectivity gaps calculated with using
IPEDS and Census data compared to gaps estimated using data from NCES longitudinal data sets.
Notes. The level of each line and dot indicates the probability that a randomly chosen white student is
enrolled in a more selective post-secondary destination than a randomly chosen Black/Hispanic student.
The solid lines indicate gaps that were estimated using IPEDS and census data. The dots indicate gaps that
were estimated using NCES longitudinal data sets. IPEDS enrollment reporting was not mandatory at all
schools prior to 1993. Prior to 2008 all institutions reported race in seven categories. After 2010, all
institutions used a nine-category system. Between 2008 and 2010 institutions could report enrollment by
race under either system and we use the total Black, Hispanic, and white students regardless of reporting
method.
.4
.5
.6
.7
.8pr
obab
ility
1990 2000 2010year
Hispanic-White Gap Black-White Gap
Gap Estimates from IPEDS Gap Estimates from NCES data
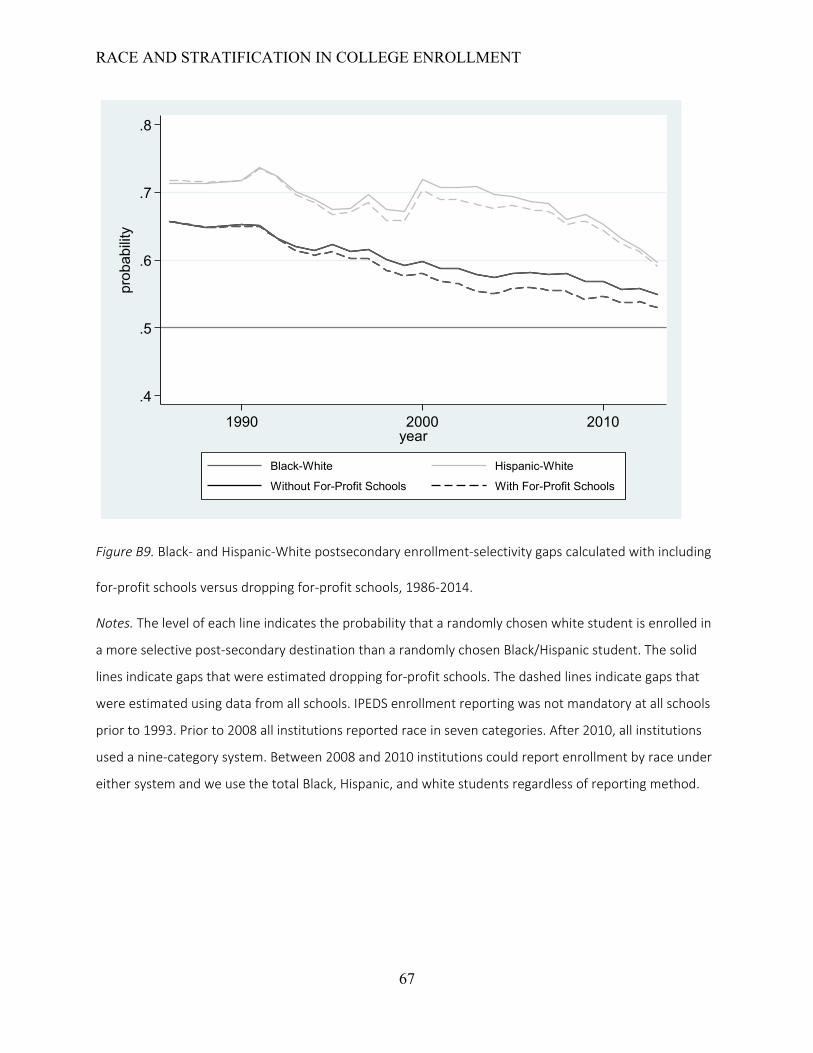
RACE AND STRATIFICATION IN COLLEGE ENROLLMENT
67
Figure B9. Black- and Hispanic-White postsecondary enrollment-selectivity gaps calculated with including
for-profit schools versus dropping for-profit schools, 1986-2014.
Notes. The level of each line indicates the probability that a randomly chosen white student is enrolled in
a more selective post-secondary destination than a randomly chosen Black/Hispanic student. The solid
lines indicate gaps that were estimated dropping for-profit schools. The dashed lines indicate gaps that
were estimated using data from all schools. IPEDS enrollment reporting was not mandatory at all schools
prior to 1993. Prior to 2008 all institutions reported race in seven categories. After 2010, all institutions
used a nine-category system. Between 2008 and 2010 institutions could report enrollment by race under
either system and we use the total Black, Hispanic, and white students regardless of reporting method.
.4
.5
.6
.7
.8pr
obab
ility
1990 2000 2010year
Black-White Hispanic-White
Without For-Profit Schools With For-Profit Schools

RACE AND STRATIFICATION IN COLLEGE ENROLLMENT
68
Appendix C Structural Vector Autoregression Results
We estimated structural vector autoregressions (SVAR) of the relationship between enrollment-
selectivity gaps and gaps in students’ achievement and socio-economic status in a way that is more
sensitive to complex interrelationships between the gaps than the bivariate correlations we present in
the main body of this article. SVAR models are a variant of vector autoregressions (VAR). VAR models
compute a set of regressions for each dependent and independent variable in the model using every
other variable in the system as well as each variable’s lagged values as well as a control. This approach
both accounts for underlying time trends and helps calculate standard errors to account for potential
autocorrelation (Stock & Watson, 2001). Structural VAR extend these models by allowing one to make
explicit assumptions about which time series trends influence each other. For example, while family
income gaps and high school graduation gaps might affect gaps in the selectivity of enrollment, we don’t
expect that high school graduation gaps will affect contemporaneous family income gaps. Structural VAR
models allow us to explicitly set some relationships to zero while estimating other relationships.
Although this approach provides the potential for a more defensible account of the relationship
between enrollment-selectivity gaps and other gaps, our data greatly limit our ability to make robust
inferences (and given the lack of exogenous variation, certainly not causal inferences) from these
analyses. Namely, test gaps were only measured for 11 of the 28 years we study, and only have math and
reading scores for eight of those years. In order to estimate these models, we thus make significant
assumptions. Specifically, we use only one test score gap (math), and impute the math gap using the
reading gap in years that NAEP was administered in reading but not math. As NAEP was administered
irregularly, we also imputed missing test scores using the nearest available year (using both forward and
backward imputation). Thus, the test scores we use to estimate these models are noisy measures of true
test score gaps and estimated coefficients should be interpreted with caution.

RACE AND STRATIFICATION IN COLLEGE ENROLLMENT
69
Because we are using data from multiple sources, we also had to make decisions about the timing
of gaps. We use measures of gaps from within a cohort. For example, we use the 2003 8th grade test
score and family income gaps (for parents of 14-17 year olds) from 2007 gaps to predict 2008 college
enrollment-selectivity gaps.
We set the following parameters when estimating the models. We allowed enrollment selectivity
gaps to be a function of each of the contemporaneous trends (graduation gaps, test score gaps, parental
income gaps, and parental college enrollment gaps), but did not allow the contemporaneous trends to be
a function of enrollment-selectivity gaps. We allow graduation gaps to be a function of income gaps,
parental college attendance gaps, and test score gaps; test score gaps to be a function of parental college
and income gaps; and income gaps to be a function parental college attendance gaps. All other terms are
set to zero. We include three years of lags (of the dependent variable and all independent variables) in
each model, which is the most we could include give the data that we have.
The results of our SVAR analyses of the relationship between enrollment-selectivity gaps and
potential explanatory gaps are presented in Table C1. One common trend among many of these findings
is that estimated relationships tend to flip signs between overall gaps and conditional gaps. This makes
sense, given that overall gaps in enrollment-selectivity are decreasing (trending toward zero), but that
nearly every gap that conditions on a minimum level of enrollment goes in the opposite direction.
There are some common relationships across the two race categories we examine. High school
graduation gaps are positively related to overall gaps and negatively (though not always significantly)
related to enrollment-selectivity gaps conditional on either four-year enrollment or on enrollment in a
selective college. Test score gaps are negatively related to overall enrollment-selectivity gaps for both
race gaps that we examine (though only significantly for Black-White gaps).
The most important difference that we see is that there is a positive relationship between
parental education gaps and overall selectivity gaps for the Hispanic-White gaps, but this relationship is

RACE AND STRATIFICATION IN COLLEGE ENROLLMENT
70
negative for Black-White gaps. For both race groups, this relationship is positive when we examine gaps
conditional on enrollment in a selective school.
While the SVAR models are a considerable improvement over the bivariate correlations we
present in the main text of the paper, and it is reassuring that the SVAR results echo some of our bivariate
conclusions, we hesitate to draw any strong conclusions from these models given the limitations we
described above.
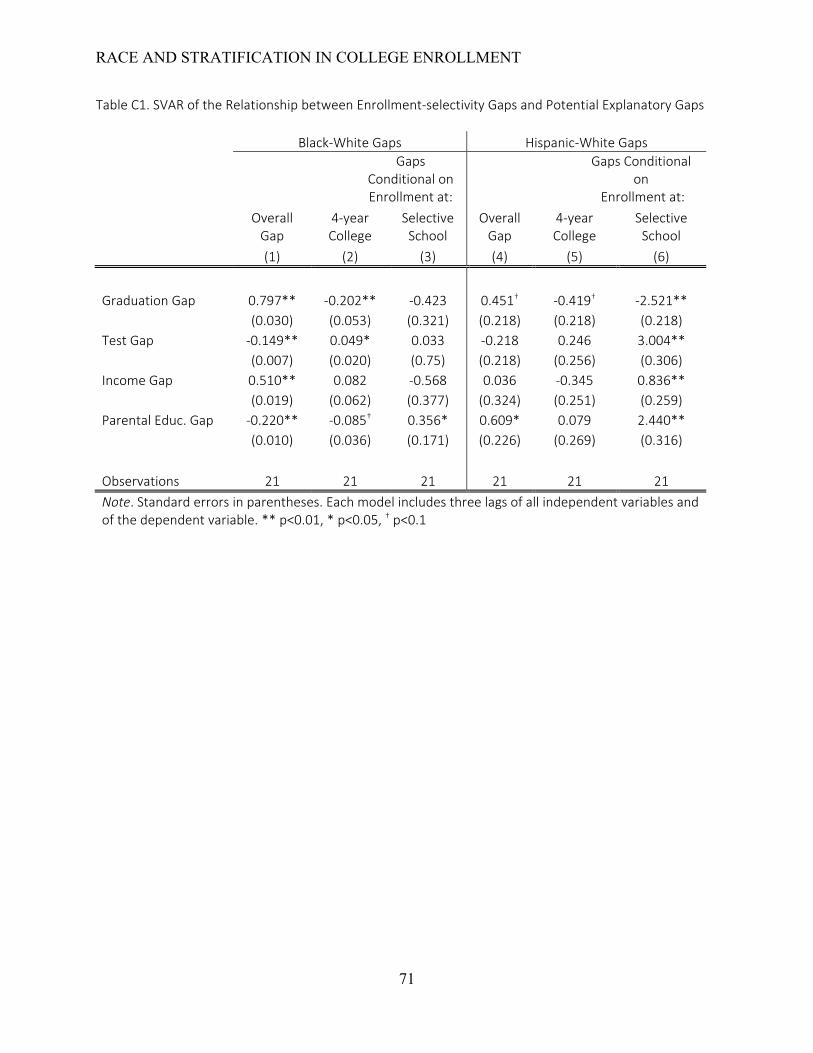
RACE AND STRATIFICATION IN COLLEGE ENROLLMENT
71
Table C1. SVAR of the Relationship between Enrollment-selectivity Gaps and Potential Explanatory Gaps
Black-White Gaps Hispanic-White Gaps Gaps
Conditional on Enrollment at:
Gaps Conditional on
Enrollment at: Overall
Gap 4-year College
Selective School
Overall Gap
4-year College
Selective School
(1) (2) (3) (4) (5) (6)
Graduation Gap 0.797** -0.202** -0.423 0.451† -0.419† -2.521**
(0.030) (0.053) (0.321) (0.218) (0.218) (0.218) Test Gap -0.149** 0.049* 0.033 -0.218 0.246 3.004**
(0.007) (0.020) (0.75) (0.218) (0.256) (0.306) Income Gap 0.510** 0.082 -0.568 0.036 -0.345 0.836**
(0.019) (0.062) (0.377) (0.324) (0.251) (0.259) Parental Educ. Gap -0.220** -0.085† 0.356* 0.609* 0.079 2.440**
(0.010) (0.036) (0.171) (0.226) (0.269) (0.316)
Observations 21 21 21 21 21 21 Note. Standard errors in parentheses. Each model includes three lags of all independent variables and of the dependent variable. ** p<0.01, * p<0.05, † p<0.1